- Analiza
- Novosti i instrumenti
- Vesti sa tržišta
- NZD/USD Price Analysis: Bulls back off, consolidation may be incoming
NZD/USD Price Analysis: Bulls back off, consolidation may be incoming
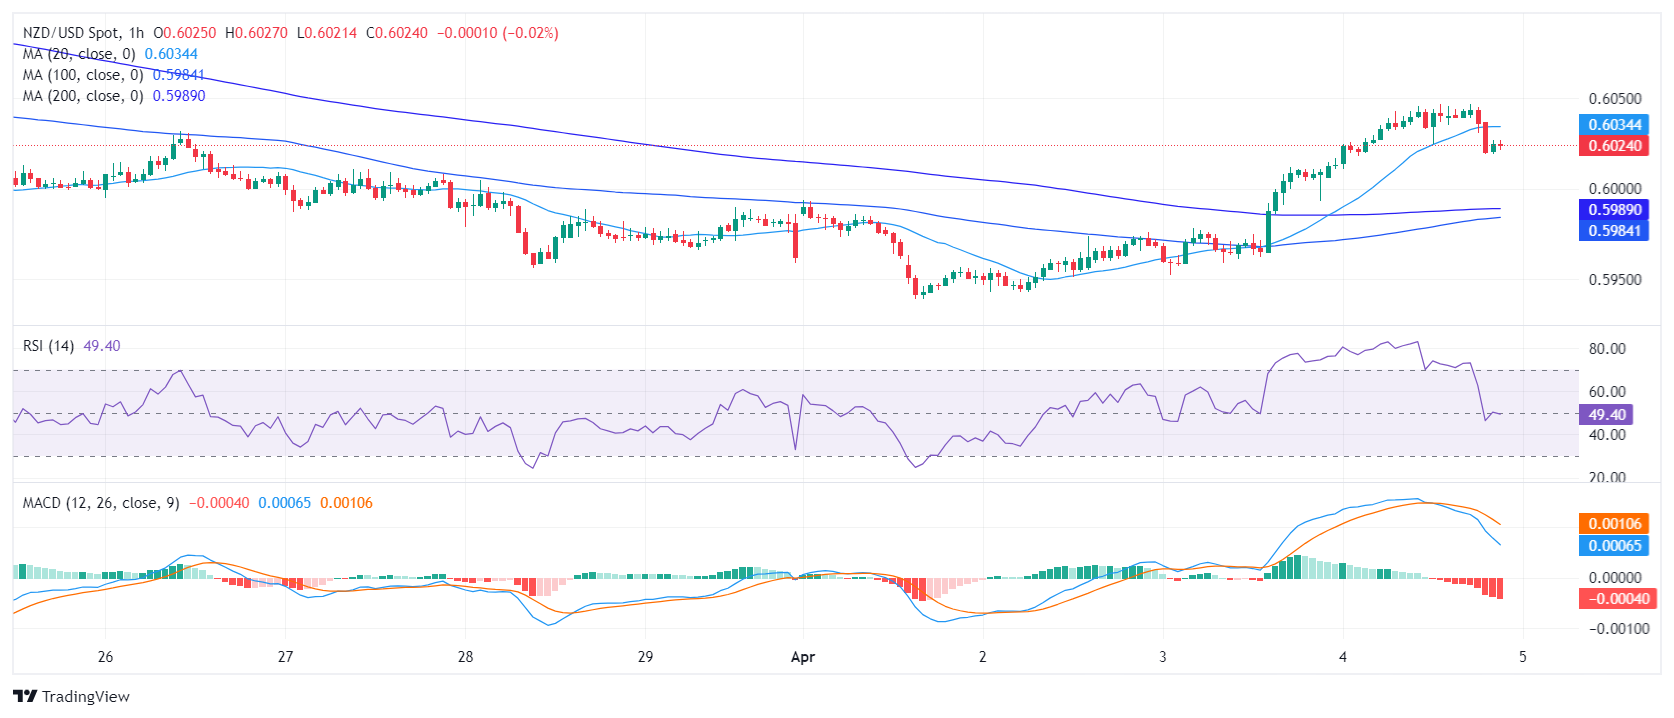
- The hourly chart signals a possible short-term rise in selling pressure with a shar decline in the RSI.
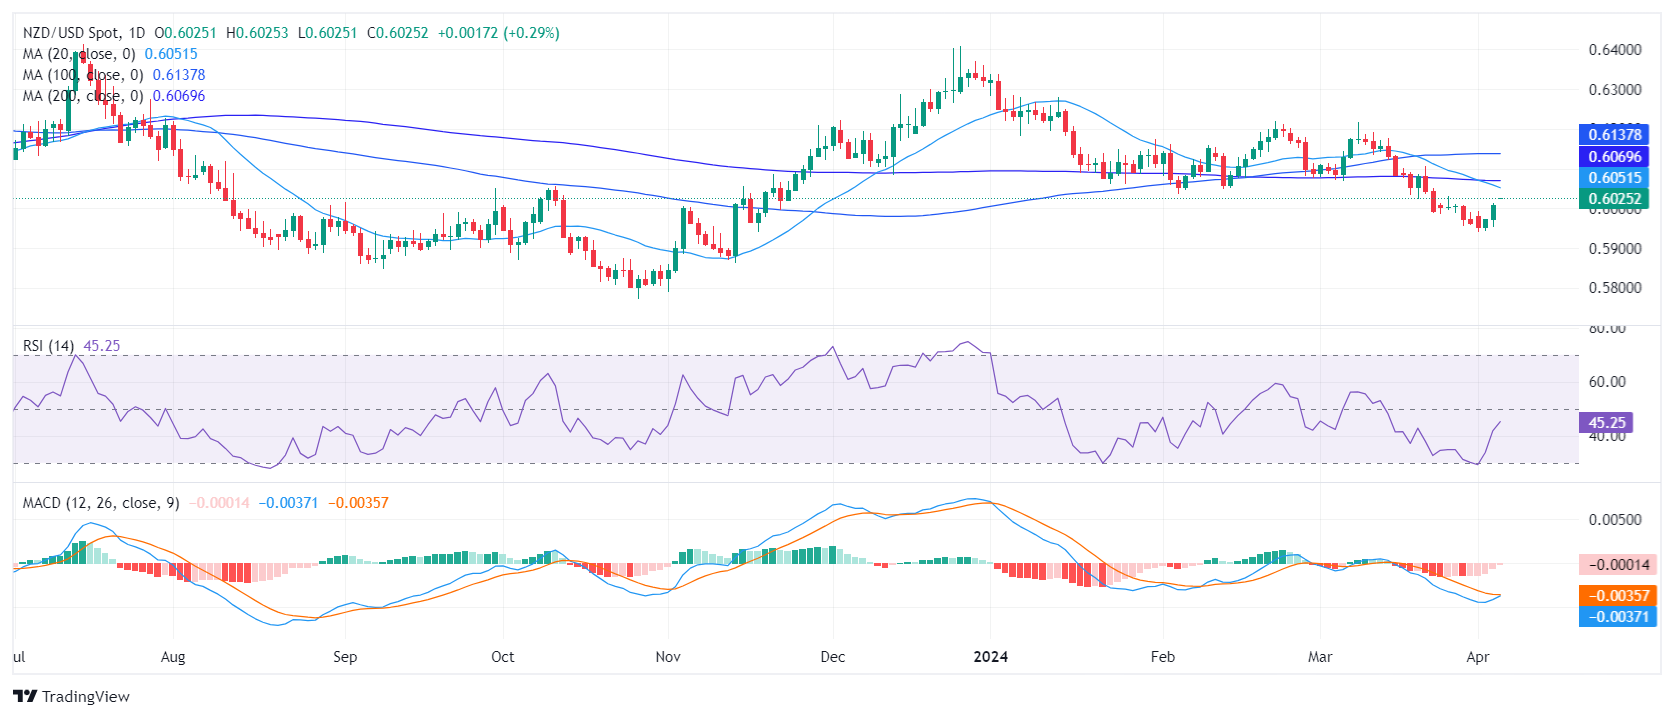
- The negative outlook remains on the daily chart.
- The bearish crossover between the 20 and 200-day SMAs implies a strong negative momentum.
The NZD/USD pair is trading at around 0.6025 and trimmed most of its daily gains on Thursday. After getting rejected by the 20-day Simple Moving Average (SMA) the latest upwards movements seem to have been short-lived and didn’t present a battle to the bearish overall trend.
On the daily chart, the Relative Strength Index (RSI) has shown slow movement from negative to positive territory over past sessions and now resides at around 47.15. However, the flat red bars of the Moving Average Convergence Divergence (MACD) indicate a steady negative momentum.
NZD/USD daily chart
On the hourly chart, the RSI proved more erratic, reaching a positive value of 70 earlier in the session and dropping to 50. This fluctuation suggests a possible short-term shift in momentum favoring the sellers. The MACD, continues to print red flat bars, indicating sustained negative momentum throughout recent hours.
NZD/USD hourly chart
Concerning its Simple Moving Averages (SMAs), the NZD/USD is below the 20,100 and 200-day SMAs. Thursday’s 20-day SMA rejection adds further arguments that the bullish momentum is weak. Moreover, the mentioned average completed a bearish crossover with the 200-day SMA which may eventually limit any upward momentum.


© 2000-2026. Sva prava zaštićena.
Sajt je vlasništvo kompanije Teletrade D.J. LLC 2351 LLC 2022 (Euro House, Richmond Hill Road, Kingstown, VC0100, St. Vincent and the Grenadines).
Svi podaci koji se nalaze na sajtu ne predstavljaju osnovu za donošenje investicionih odluka, već su informativnog karaktera.
The company does not serve or provide services to customers who are residents of the US, Canada, Iran, The Democratic People's Republic of Korea, Yemen and FATF blacklisted countries.
Izvršenje trgovinskih operacija sa finansijskim instrumentima upotrebom marginalne trgovine pruža velike mogućnosti i omogućava investitorima ostvarivanje visokih prihoda. Međutim, takav vid trgovine povezan je sa potencijalno visokim nivoom rizika od gubitka sredstava. Проведение торговых операций на финанcовых рынках c маржинальными финанcовыми инcтрументами открывает широкие возможноcти, и позволяет инвеcторам, готовым пойти на риcк, получать выcокую прибыль, но при этом неcет в cебе потенциально выcокий уровень риcка получения убытков. Iz tog razloga je pre započinjanja trgovine potrebno odlučiti o izboru odgovarajuće investicione strategije, uzimajući u obzir raspoložive resurse.
Upotreba informacija: U slučaju potpunog ili delimičnog preuzimanja i daljeg korišćenja materijala koji se nalazi na sajtu, potrebno je navesti link odgovarajuće stranice na sajtu kompanije TeleTrade-a kao izvora informacija. Upotreba materijala na internetu mora biti praćena hiper linkom do web stranice teletrade.org. Automatski uvoz materijala i informacija sa stranice je zabranjen.
Ako imate bilo kakvih pitanja, obratite nam se pr@teletrade.global.
транcфери