- Analiza
- Novosti i instrumenti
- Vesti sa tržišta
- NZD/JPY Price Analysis: Seller control the short term,overall trend remains bullist
NZD/JPY Price Analysis: Seller control the short term,overall trend remains bullist
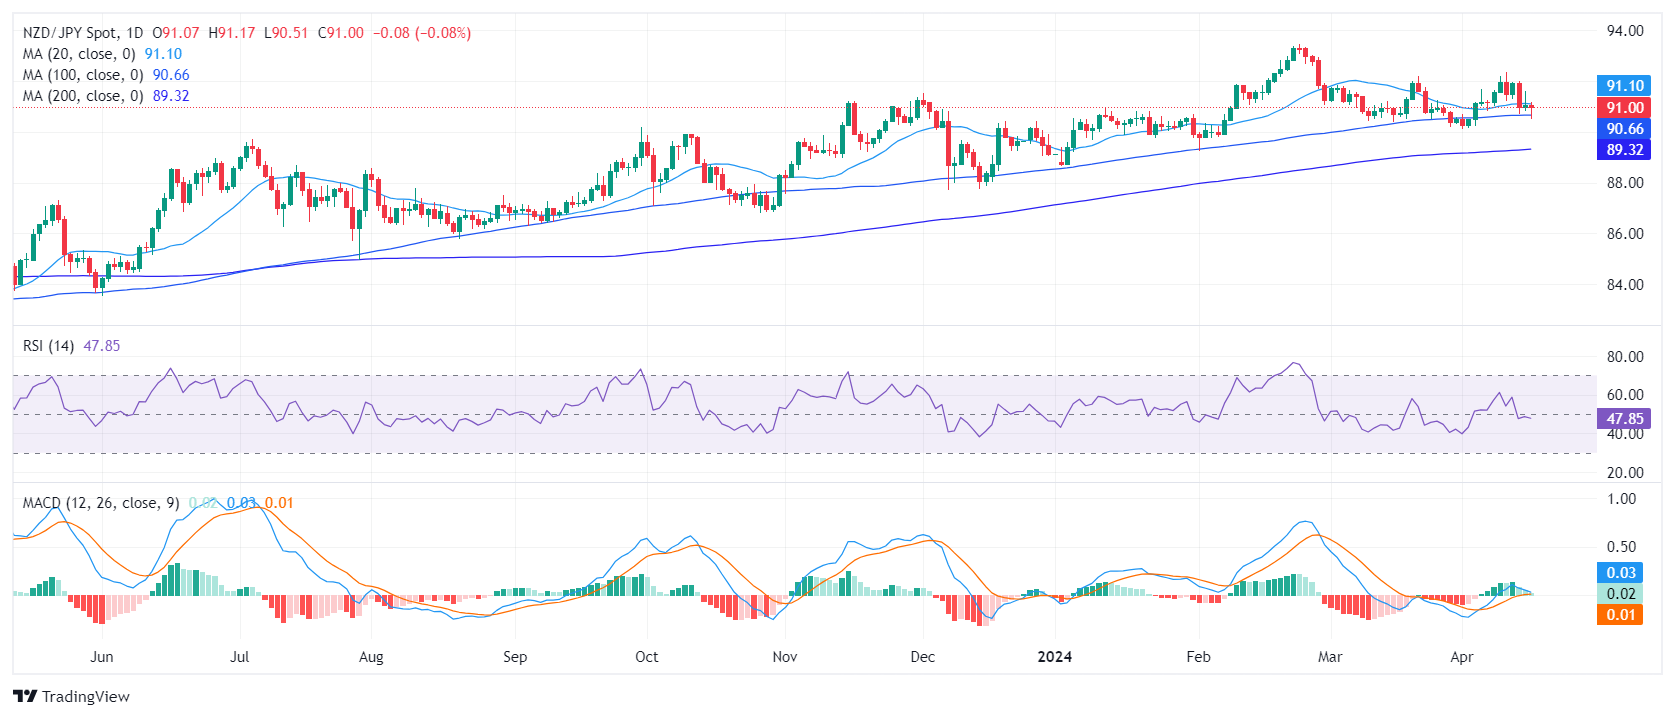
- The daily RSI reveals that market momentum is currently dominated by sellers.
- The daily MACD presents flat green bars, indicating a lack of buying traction.
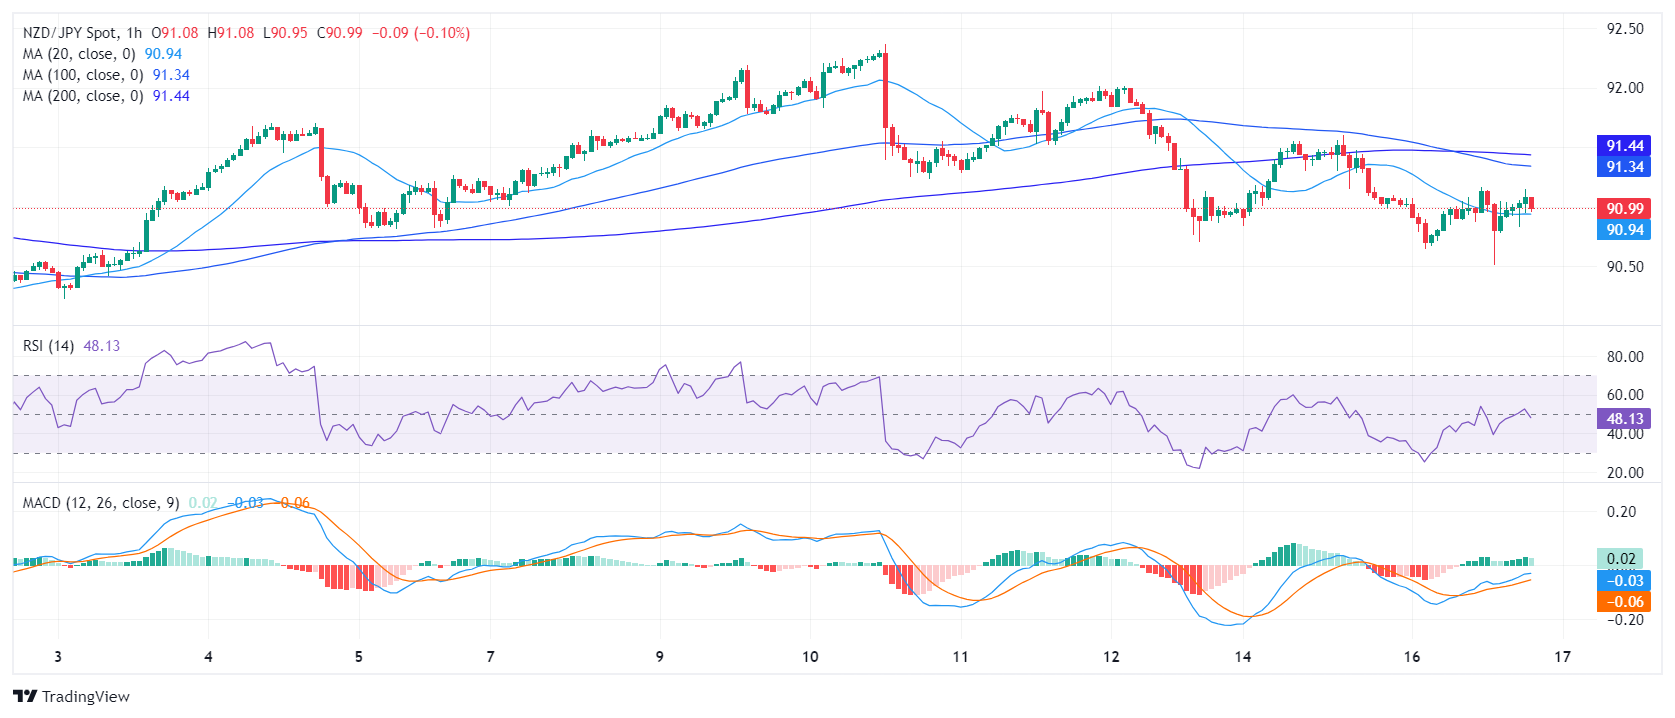
- In the hourly chart, the RSI shows slight improvement, suggesting sellers losing some ground.
The NZD/JPY stabilized at around 90.94 and managed to clear most of its daily losses. However, in the shorter time frames, there are signs of a bullish recovery.
The daily Relative Strength Index (RSI) hovers in the negative territory. The most recent reading fell to 48, reflecting a market momentum currently dominated by sellers. Furthermore, the Moving Average Convergence Divergence (MACD) histogram prints flat green bars, indicating a lack of positive momentum.
NZD/JPY daily chart
Transitioning to the hourly chart, the RSI seems to confirm the tepid sentiment observed on the daily chart. The most recent reading also lands in the 48 range. Nevertheless, signs of slight improvement towards the positive territory appear in the RSI and the latest session reading climbed from a preceding low of 41. Moreover, the MACD histogram on the hourly chart prints green bars, suggesting a possible pick-up in positive momentum.
NZD/JPY hourly chart
The broader outlook, on the other hand, suggests that the bulls control the overall trend, but as long as the buyers fail to reclaim the 20-day Simple Moving Average (SMA), the short-term outlook will remain tilted in favor of the buyers.


© 2000-2026. Sva prava zaštićena.
Sajt je vlasništvo kompanije Teletrade D.J. LLC 2351 LLC 2022 (Euro House, Richmond Hill Road, Kingstown, VC0100, St. Vincent and the Grenadines).
Svi podaci koji se nalaze na sajtu ne predstavljaju osnovu za donošenje investicionih odluka, već su informativnog karaktera.
The company does not serve or provide services to customers who are residents of the US, Canada, Iran, The Democratic People's Republic of Korea, Yemen and FATF blacklisted countries.
Izvršenje trgovinskih operacija sa finansijskim instrumentima upotrebom marginalne trgovine pruža velike mogućnosti i omogućava investitorima ostvarivanje visokih prihoda. Međutim, takav vid trgovine povezan je sa potencijalno visokim nivoom rizika od gubitka sredstava. Проведение торговых операций на финанcовых рынках c маржинальными финанcовыми инcтрументами открывает широкие возможноcти, и позволяет инвеcторам, готовым пойти на риcк, получать выcокую прибыль, но при этом неcет в cебе потенциально выcокий уровень риcка получения убытков. Iz tog razloga je pre započinjanja trgovine potrebno odlučiti o izboru odgovarajuće investicione strategije, uzimajući u obzir raspoložive resurse.
Upotreba informacija: U slučaju potpunog ili delimičnog preuzimanja i daljeg korišćenja materijala koji se nalazi na sajtu, potrebno je navesti link odgovarajuće stranice na sajtu kompanije TeleTrade-a kao izvora informacija. Upotreba materijala na internetu mora biti praćena hiper linkom do web stranice teletrade.org. Automatski uvoz materijala i informacija sa stranice je zabranjen.
Ako imate bilo kakvih pitanja, obratite nam se pr@teletrade.global.
транcфери