- Analiza
- Novosti i instrumenti
- Vesti sa tržišta
- NZD/USD Price Analysis: Bearish trend prevails, potential for further declines expected
NZD/USD Price Analysis: Bearish trend prevails, potential for further declines expected
- The daily RSI for the NZD/USD reveals growing selling pressure, nearing oversold conditions.
- The hourly indicators also remain weak.
- The pair will close a 0.80% losing week.
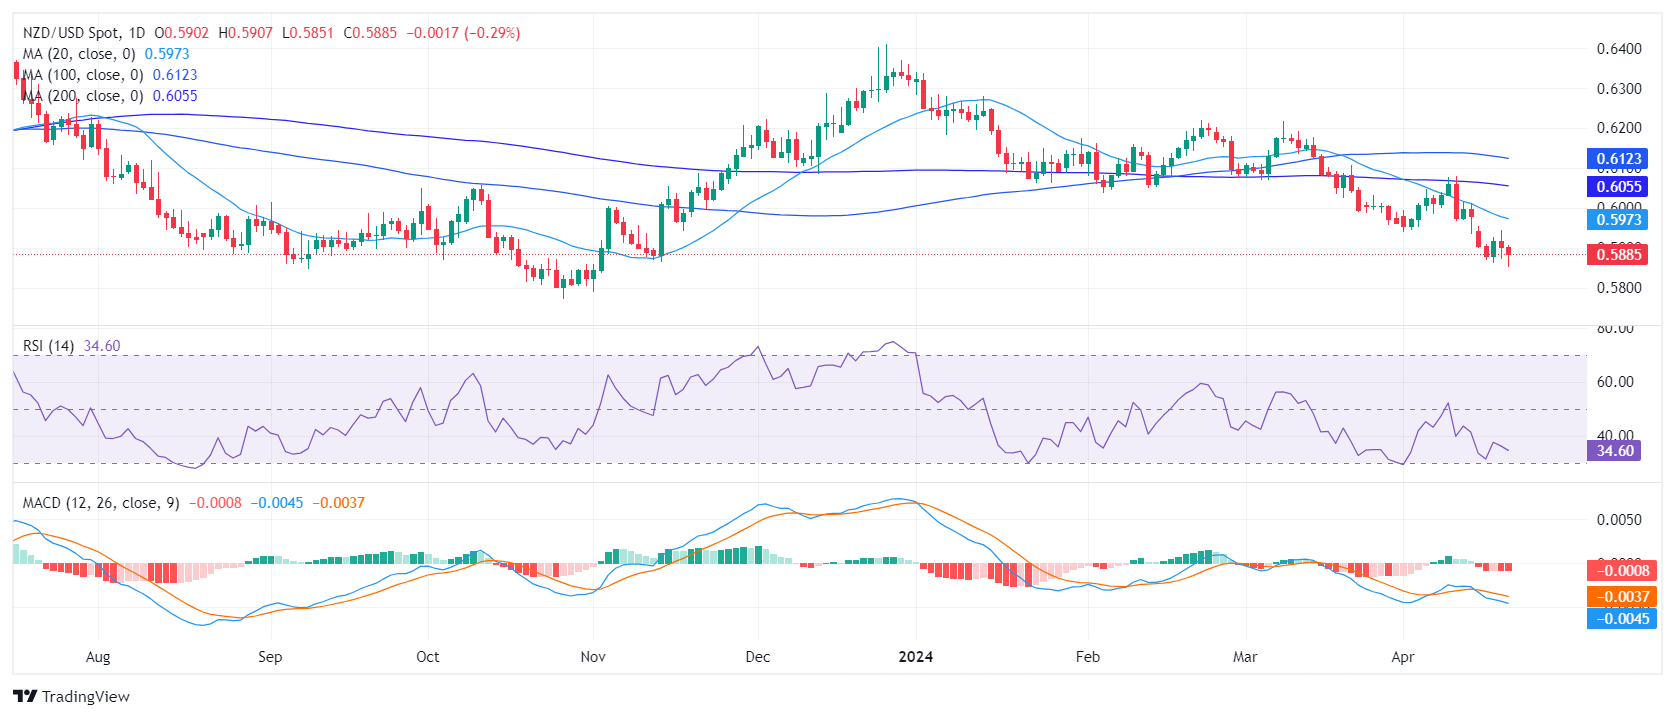
The NZD/USD pair saw a 0.25% loss on Friday’s sessing and continues exhibiting a significant bearish tendency. Both short-term and long-term outlooks suggest the prevalence of sellers, which may signal that the pair is bound for further downside.
On the daily chart, the Relative Strength Index (RSI) indicates a bearish trend. It lies deep in negative terrain and edged near oversold territory. The escalating red bars on the Moving Average Convergence Divergence (MACD) histogram align with this bearish stance, augmenting this downturn prediction.
NZD/USD daily chart
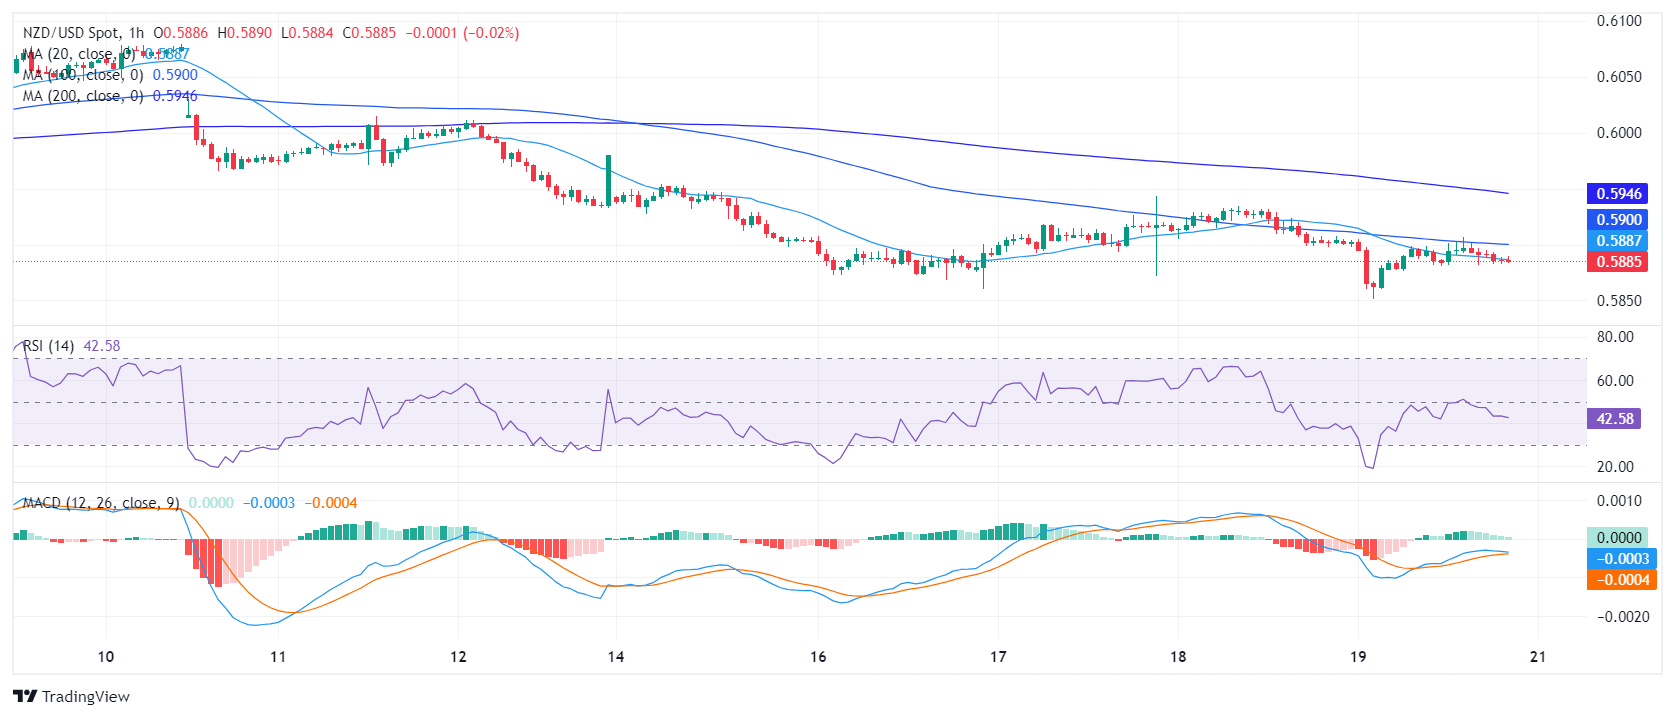
On the hourly chart, the RSI also points south standing below 50 while the MACD exhibits dwindling green bars, indicative of reduced buying momentum.
NZD/USD hourly chart
From a wider viewpoint, NZD/USD presently exhibits a clear bearish trend, given its position below the Simple Moving Average (SMA) for 20, 100, and 200-day periods. However, as indicators approach oversold conditions, the pair may stage a corrective rebound which could give the buyers a chance to reclaim the 20-day SMA. In the meantime, movements below these levels would leave the trend bearish.


© 2000-2026. Sva prava zaštićena.
Sajt je vlasništvo kompanije Teletrade D.J. LLC 2351 LLC 2022 (Euro House, Richmond Hill Road, Kingstown, VC0100, St. Vincent and the Grenadines).
Svi podaci koji se nalaze na sajtu ne predstavljaju osnovu za donošenje investicionih odluka, već su informativnog karaktera.
The company does not serve or provide services to customers who are residents of the US, Canada, Iran, The Democratic People's Republic of Korea, Yemen and FATF blacklisted countries.
Izvršenje trgovinskih operacija sa finansijskim instrumentima upotrebom marginalne trgovine pruža velike mogućnosti i omogućava investitorima ostvarivanje visokih prihoda. Međutim, takav vid trgovine povezan je sa potencijalno visokim nivoom rizika od gubitka sredstava. Проведение торговых операций на финанcовых рынках c маржинальными финанcовыми инcтрументами открывает широкие возможноcти, и позволяет инвеcторам, готовым пойти на риcк, получать выcокую прибыль, но при этом неcет в cебе потенциально выcокий уровень риcка получения убытков. Iz tog razloga je pre započinjanja trgovine potrebno odlučiti o izboru odgovarajuće investicione strategije, uzimajući u obzir raspoložive resurse.
Upotreba informacija: U slučaju potpunog ili delimičnog preuzimanja i daljeg korišćenja materijala koji se nalazi na sajtu, potrebno je navesti link odgovarajuće stranice na sajtu kompanije TeleTrade-a kao izvora informacija. Upotreba materijala na internetu mora biti praćena hiper linkom do web stranice teletrade.org. Automatski uvoz materijala i informacija sa stranice je zabranjen.
Ako imate bilo kakvih pitanja, obratite nam se pr@teletrade.global.
транcфери