- Analiza
- Novosti i instrumenti
- Vesti sa tržišta
- EUR/USD Price Analysis: Tests the major level of 1.0650; followed by the nine-day EMA
EUR/USD Price Analysis: Tests the major level of 1.0650; followed by the nine-day EMA
- EUR/USD remains tepid around the major level amid a bearish sentiment.
- A breach below the 1.0600 level may lead the pair toward November’s low at 1.0517.
- The nine-day EMA at 1.0675 appears as the immediate barrier.
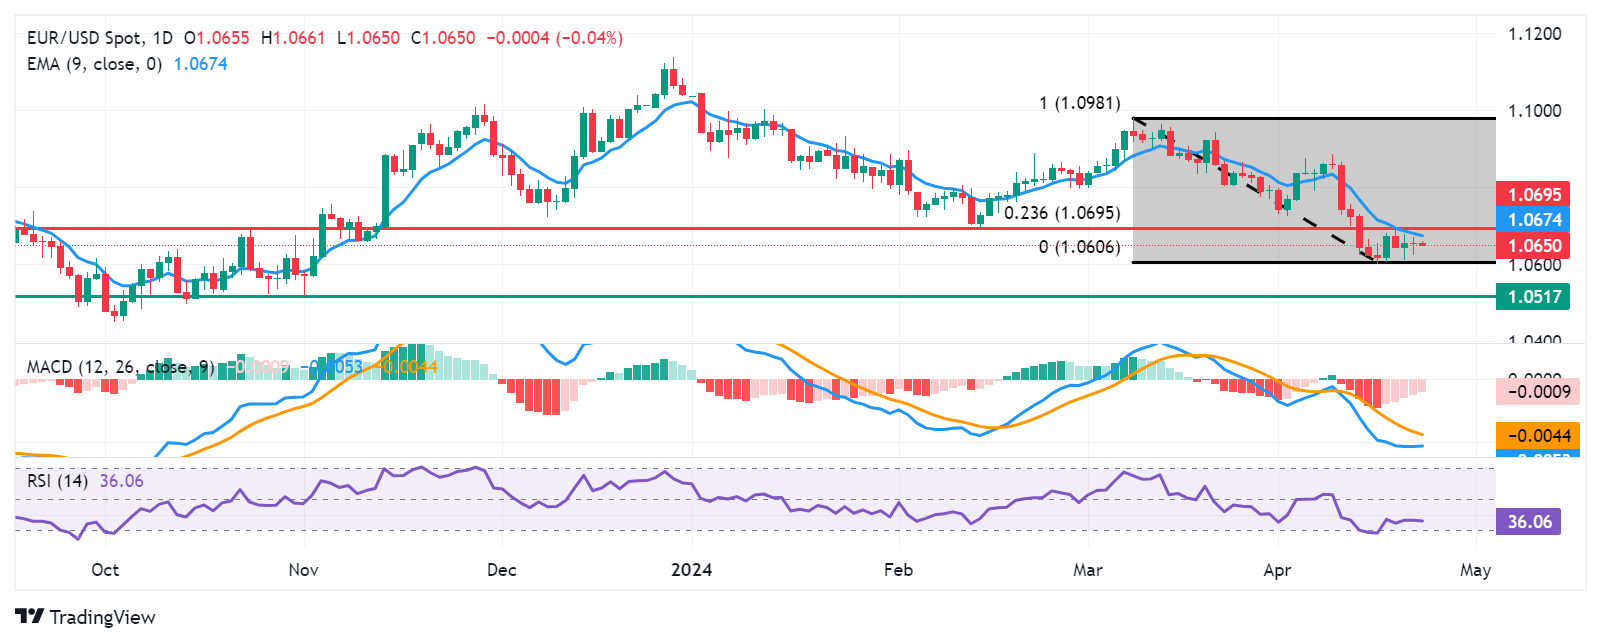
EUR/USD remains lackluster during the Asian trading hours on Tuesday, hovering near 1.0650. From a technical perspective, analysis suggests a bearish sentiment for the pair as it struggles below the pullback resistance at the 1.0695 level. The 14-day Relative Strength Index (RSI) also remains below the 50 mark.
Moreover, the lagging indicator, Moving Average Convergence Divergence (MACD), indicates weakness for the EUR/USD pair as it resides below the centerline and the signal line. Key support for the pair could be found around the psychological level of 1.0600.
A breach below this level may exert downward pressure on the pair, leading it towards the region around the major support level of 1.0550, followed by November’s low at 1.0517.
On the upside, the immediate barrier for the EUR/USD pair could be the nine-day Exponential Moving Average (EMA) at 1.0675. A breakthrough above this level could lead the pair to reach the 1.0695 level, aligning with the 23.6% Fibonacci retracement level drawn between 1.0981 and 1.0606.
Further resistance aligns with the psychological level of 1.0700. A breakthrough above this region could potentially strengthen the recovery sentiment for the pair.
EUR/USD: Daily Chart


© 2000-2026. Sva prava zaštićena.
Sajt je vlasništvo kompanije Teletrade D.J. LLC 2351 LLC 2022 (Euro House, Richmond Hill Road, Kingstown, VC0100, St. Vincent and the Grenadines).
Svi podaci koji se nalaze na sajtu ne predstavljaju osnovu za donošenje investicionih odluka, već su informativnog karaktera.
The company does not serve or provide services to customers who are residents of the US, Canada, Iran, The Democratic People's Republic of Korea, Yemen and FATF blacklisted countries.
Izvršenje trgovinskih operacija sa finansijskim instrumentima upotrebom marginalne trgovine pruža velike mogućnosti i omogućava investitorima ostvarivanje visokih prihoda. Međutim, takav vid trgovine povezan je sa potencijalno visokim nivoom rizika od gubitka sredstava. Проведение торговых операций на финанcовых рынках c маржинальными финанcовыми инcтрументами открывает широкие возможноcти, и позволяет инвеcторам, готовым пойти на риcк, получать выcокую прибыль, но при этом неcет в cебе потенциально выcокий уровень риcка получения убытков. Iz tog razloga je pre započinjanja trgovine potrebno odlučiti o izboru odgovarajuće investicione strategije, uzimajući u obzir raspoložive resurse.
Upotreba informacija: U slučaju potpunog ili delimičnog preuzimanja i daljeg korišćenja materijala koji se nalazi na sajtu, potrebno je navesti link odgovarajuće stranice na sajtu kompanije TeleTrade-a kao izvora informacija. Upotreba materijala na internetu mora biti praćena hiper linkom do web stranice teletrade.org. Automatski uvoz materijala i informacija sa stranice je zabranjen.
Ako imate bilo kakvih pitanja, obratite nam se pr@teletrade.global.
транcфери