- Analiza
- Novosti i instrumenti
- Vesti sa tržišta
- NZD/USD Price Analysis: Could break into the symmetrical triangle, rises to near 0.5950
NZD/USD Price Analysis: Could break into the symmetrical triangle, rises to near 0.5950
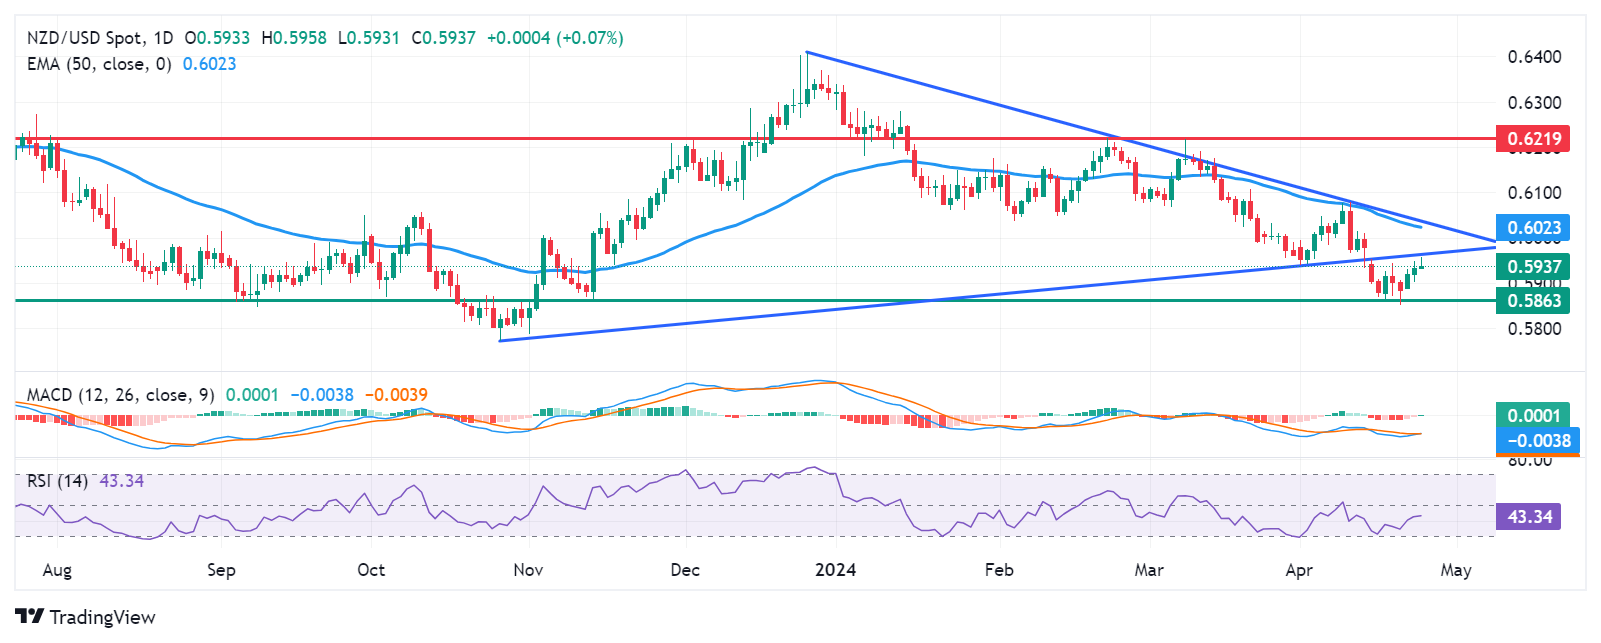
- NZD/USD extends gains despite the prevailing bearish sentiment for the pair.
- A break below 0.5900 could lead the pair to test the rebound support level of 0.5863.
- A break into the triangle around the level of 0.5963 has the potential to weaken the bearish sentiment.
NZD/USD advances for the third consecutive session on Wednesday, trading around 0.5940 during the European session. The pair is testing the lower boundary of the daily symmetrical triangle around the level of 0.5963. A breach into the triangle could potentially weaken the bearish sentiment.
However, analysis of the lagging indicator Moving Average Convergence Divergence (MACD) suggests a downward trend for the NZD/USD pair. This is indicated by the placement of the MACD line below the centerline and the signal line.
Additionally, the 14-day Relative Strength Index (RSI) remains below the 50 level, further confirming the bearish sentiment. This could prompt NZD/USD to approach the psychological level of 0.5900. A break below this level may lead the pair to test the rebound support region around the levels of 0.5863 and 0.5850.
Alternatively, If the NZD/USD pair breaks into the symmetrical triangle, it might target the psychological barrier of 0.6000. A breakthrough above this level could support the pair's momentum to test the 50-day Exponential Moving Average (EMA) at 0.6023, which aligns with the upper boundary of the triangle around 0.6030.
NZD/USD: Daily Chart


© 2000-2026. Sva prava zaštićena.
Sajt je vlasništvo kompanije Teletrade D.J. LLC 2351 LLC 2022 (Euro House, Richmond Hill Road, Kingstown, VC0100, St. Vincent and the Grenadines).
Svi podaci koji se nalaze na sajtu ne predstavljaju osnovu za donošenje investicionih odluka, već su informativnog karaktera.
The company does not serve or provide services to customers who are residents of the US, Canada, Iran, The Democratic People's Republic of Korea, Yemen and FATF blacklisted countries.
Izvršenje trgovinskih operacija sa finansijskim instrumentima upotrebom marginalne trgovine pruža velike mogućnosti i omogućava investitorima ostvarivanje visokih prihoda. Međutim, takav vid trgovine povezan je sa potencijalno visokim nivoom rizika od gubitka sredstava. Проведение торговых операций на финанcовых рынках c маржинальными финанcовыми инcтрументами открывает широкие возможноcти, и позволяет инвеcторам, готовым пойти на риcк, получать выcокую прибыль, но при этом неcет в cебе потенциально выcокий уровень риcка получения убытков. Iz tog razloga je pre započinjanja trgovine potrebno odlučiti o izboru odgovarajuće investicione strategije, uzimajući u obzir raspoložive resurse.
Upotreba informacija: U slučaju potpunog ili delimičnog preuzimanja i daljeg korišćenja materijala koji se nalazi na sajtu, potrebno je navesti link odgovarajuće stranice na sajtu kompanije TeleTrade-a kao izvora informacija. Upotreba materijala na internetu mora biti praćena hiper linkom do web stranice teletrade.org. Automatski uvoz materijala i informacija sa stranice je zabranjen.
Ako imate bilo kakvih pitanja, obratite nam se pr@teletrade.global.
транcфери