- Analiza
- Novosti i instrumenti
- Vesti sa tržišta
- AUD/JPY Price Analysis: Bullish momentum persists, downward correction likely
AUD/JPY Price Analysis: Bullish momentum persists, downward correction likely
- The daily RSI for AUD/JPY reveals that the bulls are in charge, approaching overbought conditions.
- Despite the hourly MACD indicating a short-term dip, the RSI highlights the buyers' dominance.
- As the cross jumped to multi-year highs, the buyers might eventually run out of gas.
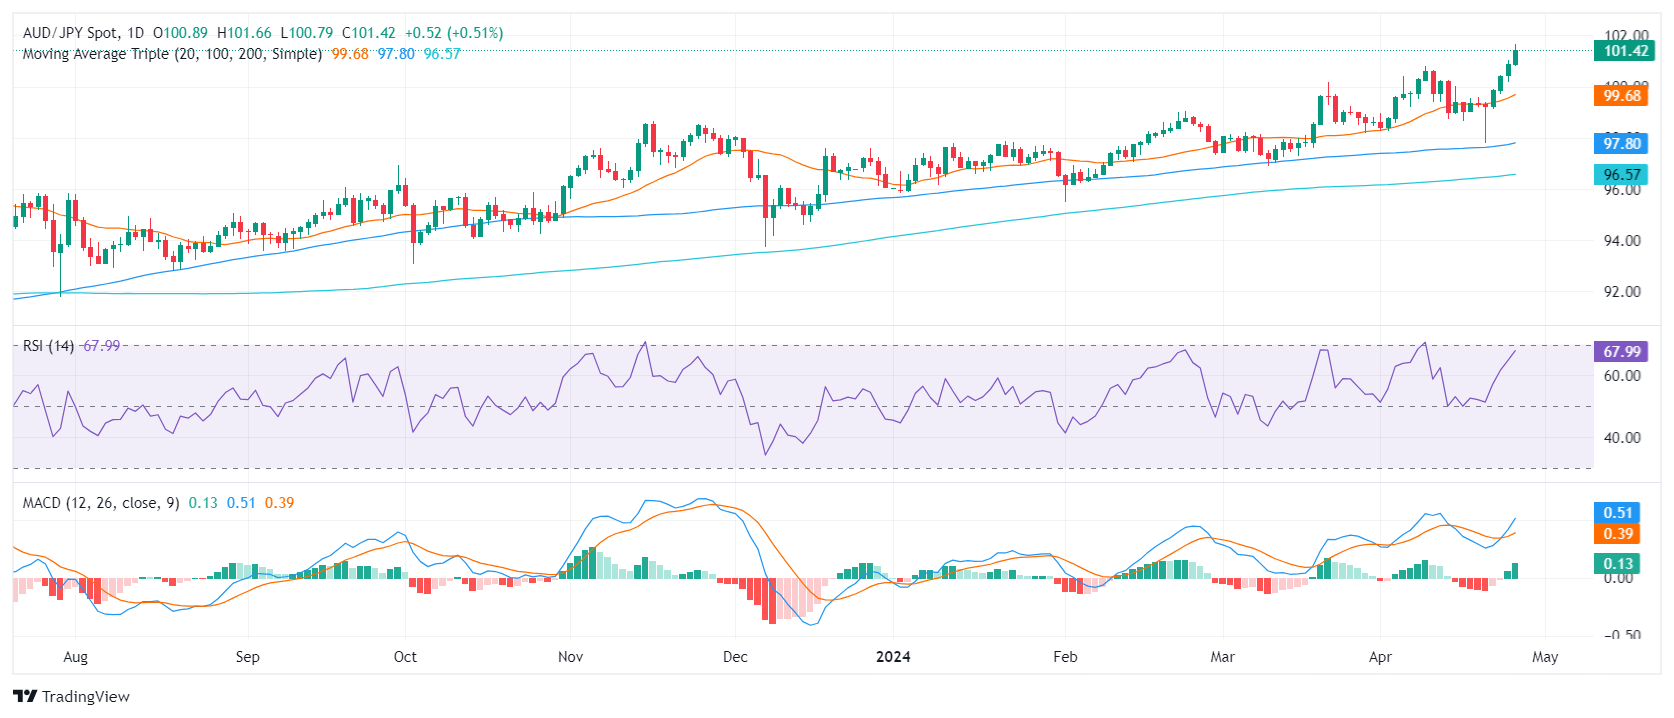
The AUD/JPY exhibits substantial bullish momentum, standing at the 101.39 level and showing an encouraging 0.54% rally. The dominance of bullish trends is evident but a healthy correction might be necessary for the buyers to conquer additional ground.
On the daily chart, the Relative Strength Index (RSI) reveals a positive momentum, with the latest reading nearing the overbought condition. The Moving Average Convergence Divergence (MACD) supports this, printing green bars.
AUD/JPY daily chart
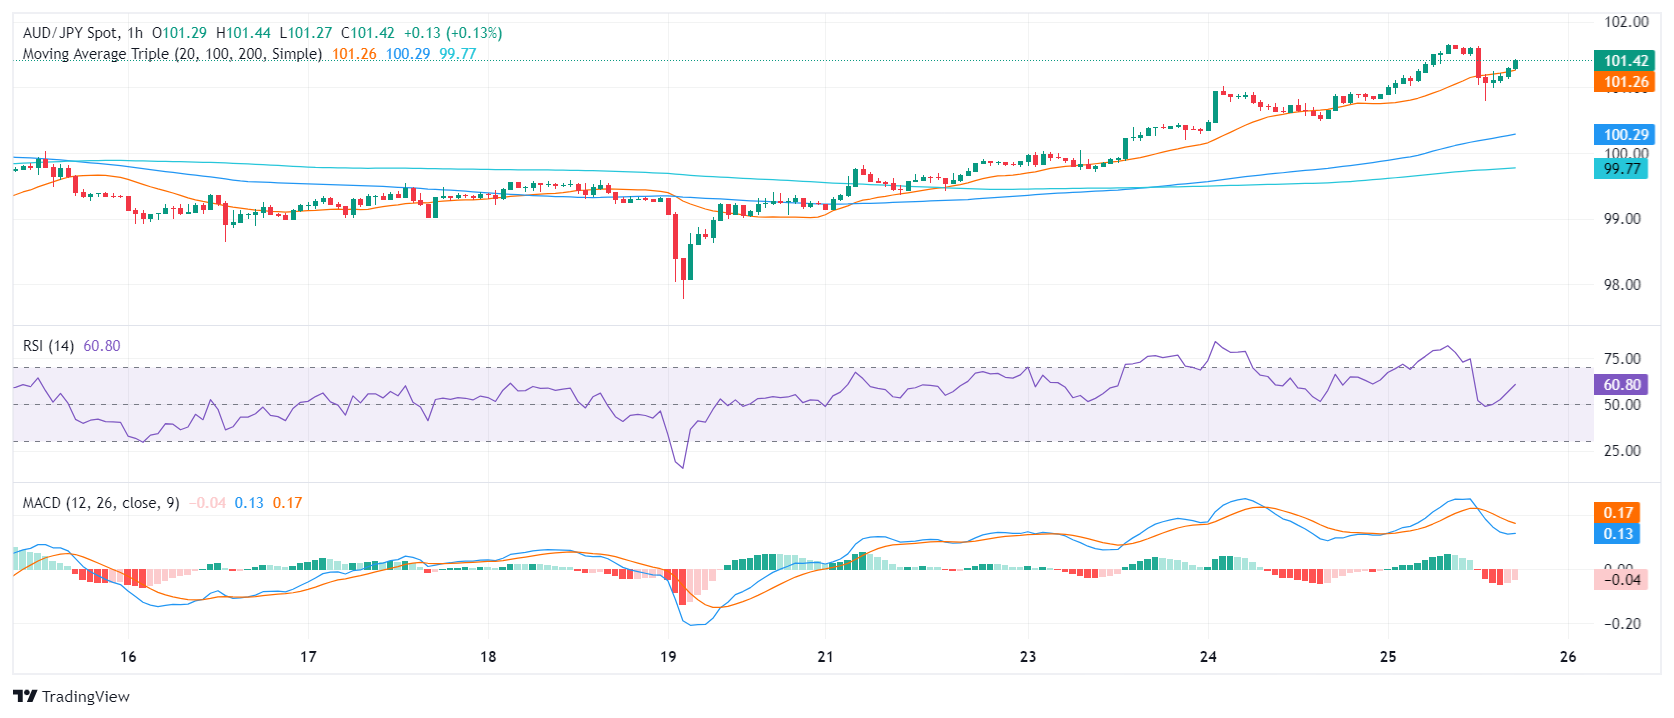
Shifting the attention to the hourly chart, the MACD paints a different picture with its red bars, signaling that in this timeframe, buyers might have already become exhausted. However, the RSI readings suggest steady, positive momentum with figures hovering above 50, apart from a brief dip to 48.
AUD/JPY hourly chart
The AUD/JPY also demonstrates a bullish stance in the broader picture as it positions itself above the 20, 100, and 200-day Simple Moving Averages (SMA). So all signals points to a clear bullish stance, but traders should be alert that if daily indicators reach overbought conditions, the pair may see some healthy downside to consolidate gains.


© 2000-2026. Sva prava zaštićena.
Sajt je vlasništvo kompanije Teletrade D.J. LLC 2351 LLC 2022 (Euro House, Richmond Hill Road, Kingstown, VC0100, St. Vincent and the Grenadines).
Svi podaci koji se nalaze na sajtu ne predstavljaju osnovu za donošenje investicionih odluka, već su informativnog karaktera.
The company does not serve or provide services to customers who are residents of the US, Canada, Iran, The Democratic People's Republic of Korea, Yemen and FATF blacklisted countries.
Izvršenje trgovinskih operacija sa finansijskim instrumentima upotrebom marginalne trgovine pruža velike mogućnosti i omogućava investitorima ostvarivanje visokih prihoda. Međutim, takav vid trgovine povezan je sa potencijalno visokim nivoom rizika od gubitka sredstava. Проведение торговых операций на финанcовых рынках c маржинальными финанcовыми инcтрументами открывает широкие возможноcти, и позволяет инвеcторам, готовым пойти на риcк, получать выcокую прибыль, но при этом неcет в cебе потенциально выcокий уровень риcка получения убытков. Iz tog razloga je pre započinjanja trgovine potrebno odlučiti o izboru odgovarajuće investicione strategije, uzimajući u obzir raspoložive resurse.
Upotreba informacija: U slučaju potpunog ili delimičnog preuzimanja i daljeg korišćenja materijala koji se nalazi na sajtu, potrebno je navesti link odgovarajuće stranice na sajtu kompanije TeleTrade-a kao izvora informacija. Upotreba materijala na internetu mora biti praćena hiper linkom do web stranice teletrade.org. Automatski uvoz materijala i informacija sa stranice je zabranjen.
Ako imate bilo kakvih pitanja, obratite nam se pr@teletrade.global.
транcфери