- Analiza
- Novosti i instrumenti
- Vesti sa tržišta
- USD/CHF Price Analysis: Bears moved in as ‘evening star’ pattern looms
USD/CHF Price Analysis: Bears moved in as ‘evening star’ pattern looms
- USD/CHF falls 0.16%, trading below 0.9100 due to broader US dollar weakness.
- Technicals show neutral to upward bias; recent bearish RSI indicates loss of upward momentum.
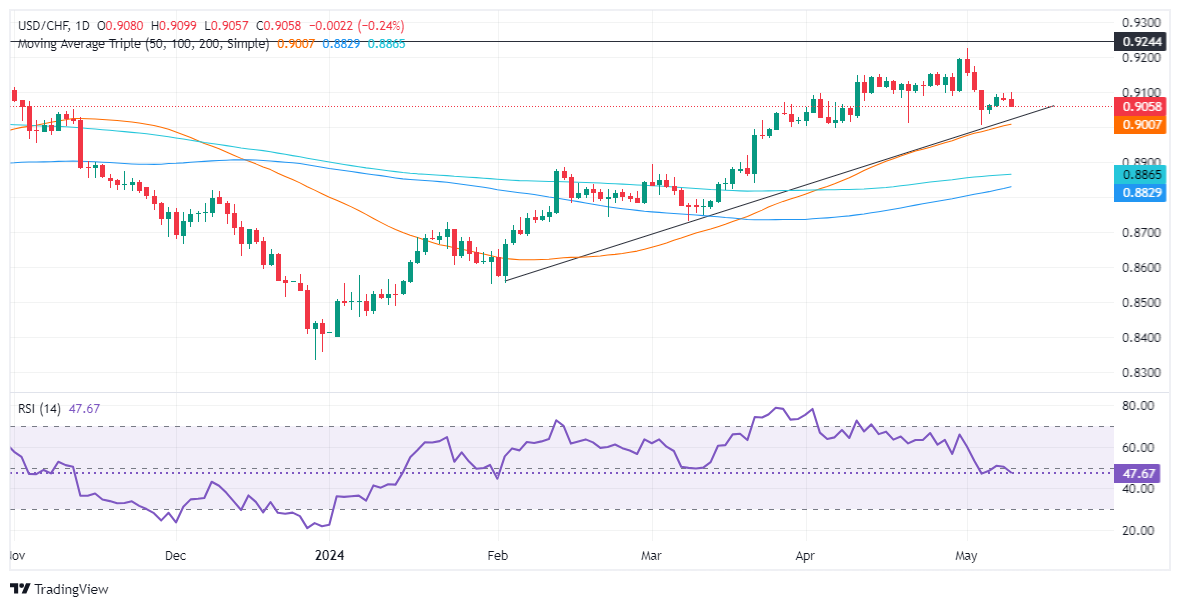
- Key support at 0.9006 (50-day MA and support trendline); resistance at 0.9100 and 0.9174.
The USD/CHF extended its losses for two straight days and is down some 0.16%, courtesy of broad US Dollar weakness, undermined by lower US Treasury yields. The major trades at 0.9064 after hitting a high shy of 0.9100.
USD/CHF Price Analysis: Technical outlook
The daily chart depicts the USD/CHF as neutral to upward biased, despite buyers losing momentum, as shown by the Relative Strength Index (RSI) shifting bearish. Although the pair has lost some 1.80% after hitting a year-to-date (YTD) high of 0.9224, solid support seen at the confluence of the 50-day moving average and a support trendline at around 0.9006/30 might cap the pair’s drop.
Looking at the potential for a bullish continuation, the USD/CHF could see a positive turn if it manages to climb above 0.9100. Once this level is breached, the next immediate resistance level to watch out for would be May 2 high at 0.9174, with a further test at 0.9200.
On the other hand, if bears push prices below 0.9000, that will confirm the ‘evening star’ chart pattern and exacerbate a drop toward the 200-DMA at 0.8887, ahead of the 100-DMA at 0.8829.
USD/CHF Price Action – Daily Chart


© 2000-2026. Sva prava zaštićena.
Sajt je vlasništvo kompanije Teletrade D.J. LLC 2351 LLC 2022 (Euro House, Richmond Hill Road, Kingstown, VC0100, St. Vincent and the Grenadines).
Svi podaci koji se nalaze na sajtu ne predstavljaju osnovu za donošenje investicionih odluka, već su informativnog karaktera.
The company does not serve or provide services to customers who are residents of the US, Canada, Iran, The Democratic People's Republic of Korea, Yemen and FATF blacklisted countries.
Izvršenje trgovinskih operacija sa finansijskim instrumentima upotrebom marginalne trgovine pruža velike mogućnosti i omogućava investitorima ostvarivanje visokih prihoda. Međutim, takav vid trgovine povezan je sa potencijalno visokim nivoom rizika od gubitka sredstava. Проведение торговых операций на финанcовых рынках c маржинальными финанcовыми инcтрументами открывает широкие возможноcти, и позволяет инвеcторам, готовым пойти на риcк, получать выcокую прибыль, но при этом неcет в cебе потенциально выcокий уровень риcка получения убытков. Iz tog razloga je pre započinjanja trgovine potrebno odlučiti o izboru odgovarajuće investicione strategije, uzimajući u obzir raspoložive resurse.
Upotreba informacija: U slučaju potpunog ili delimičnog preuzimanja i daljeg korišćenja materijala koji se nalazi na sajtu, potrebno je navesti link odgovarajuće stranice na sajtu kompanije TeleTrade-a kao izvora informacija. Upotreba materijala na internetu mora biti praćena hiper linkom do web stranice teletrade.org. Automatski uvoz materijala i informacija sa stranice je zabranjen.
Ako imate bilo kakvih pitanja, obratite nam se pr@teletrade.global.
транcфери