- Analiza
- Novosti i instrumenti
- Vesti sa tržišta
- Oil Price Analysis: Potential cracks showing in downtrend
Oil Price Analysis: Potential cracks showing in downtrend
- Oil is in a short-term downtrend but is showing signs that could be early evidence of a reversal.
- Oil has formed a bullish Doji candlestick reversal pattern at the day’s lows which could hail a stronger recovery.
- A break above the major trendline would be required for confirmation – as things stand the downtrend remains intact.
West Texas Intermediate (WTI) US Crude Oil is trading up over a percent at $78.01 on Thursday.
The commodity is in a short-term downtrend on the 4-hour chart (below) which given the old saying “the trend is your friend” would be expected to continue, favoring shorts over longs.
WTI Oil, however, is showing some early bullish reversal signs. It formed a Doji Japanese candle at Thursday’s 76.74 lows (shaded rectangle). This was followed by two bullish candles in a row. Although it is too early to say for sure, the candlestick formation could be an indication of a short-term change of trend.
Oil 4-hour Chart
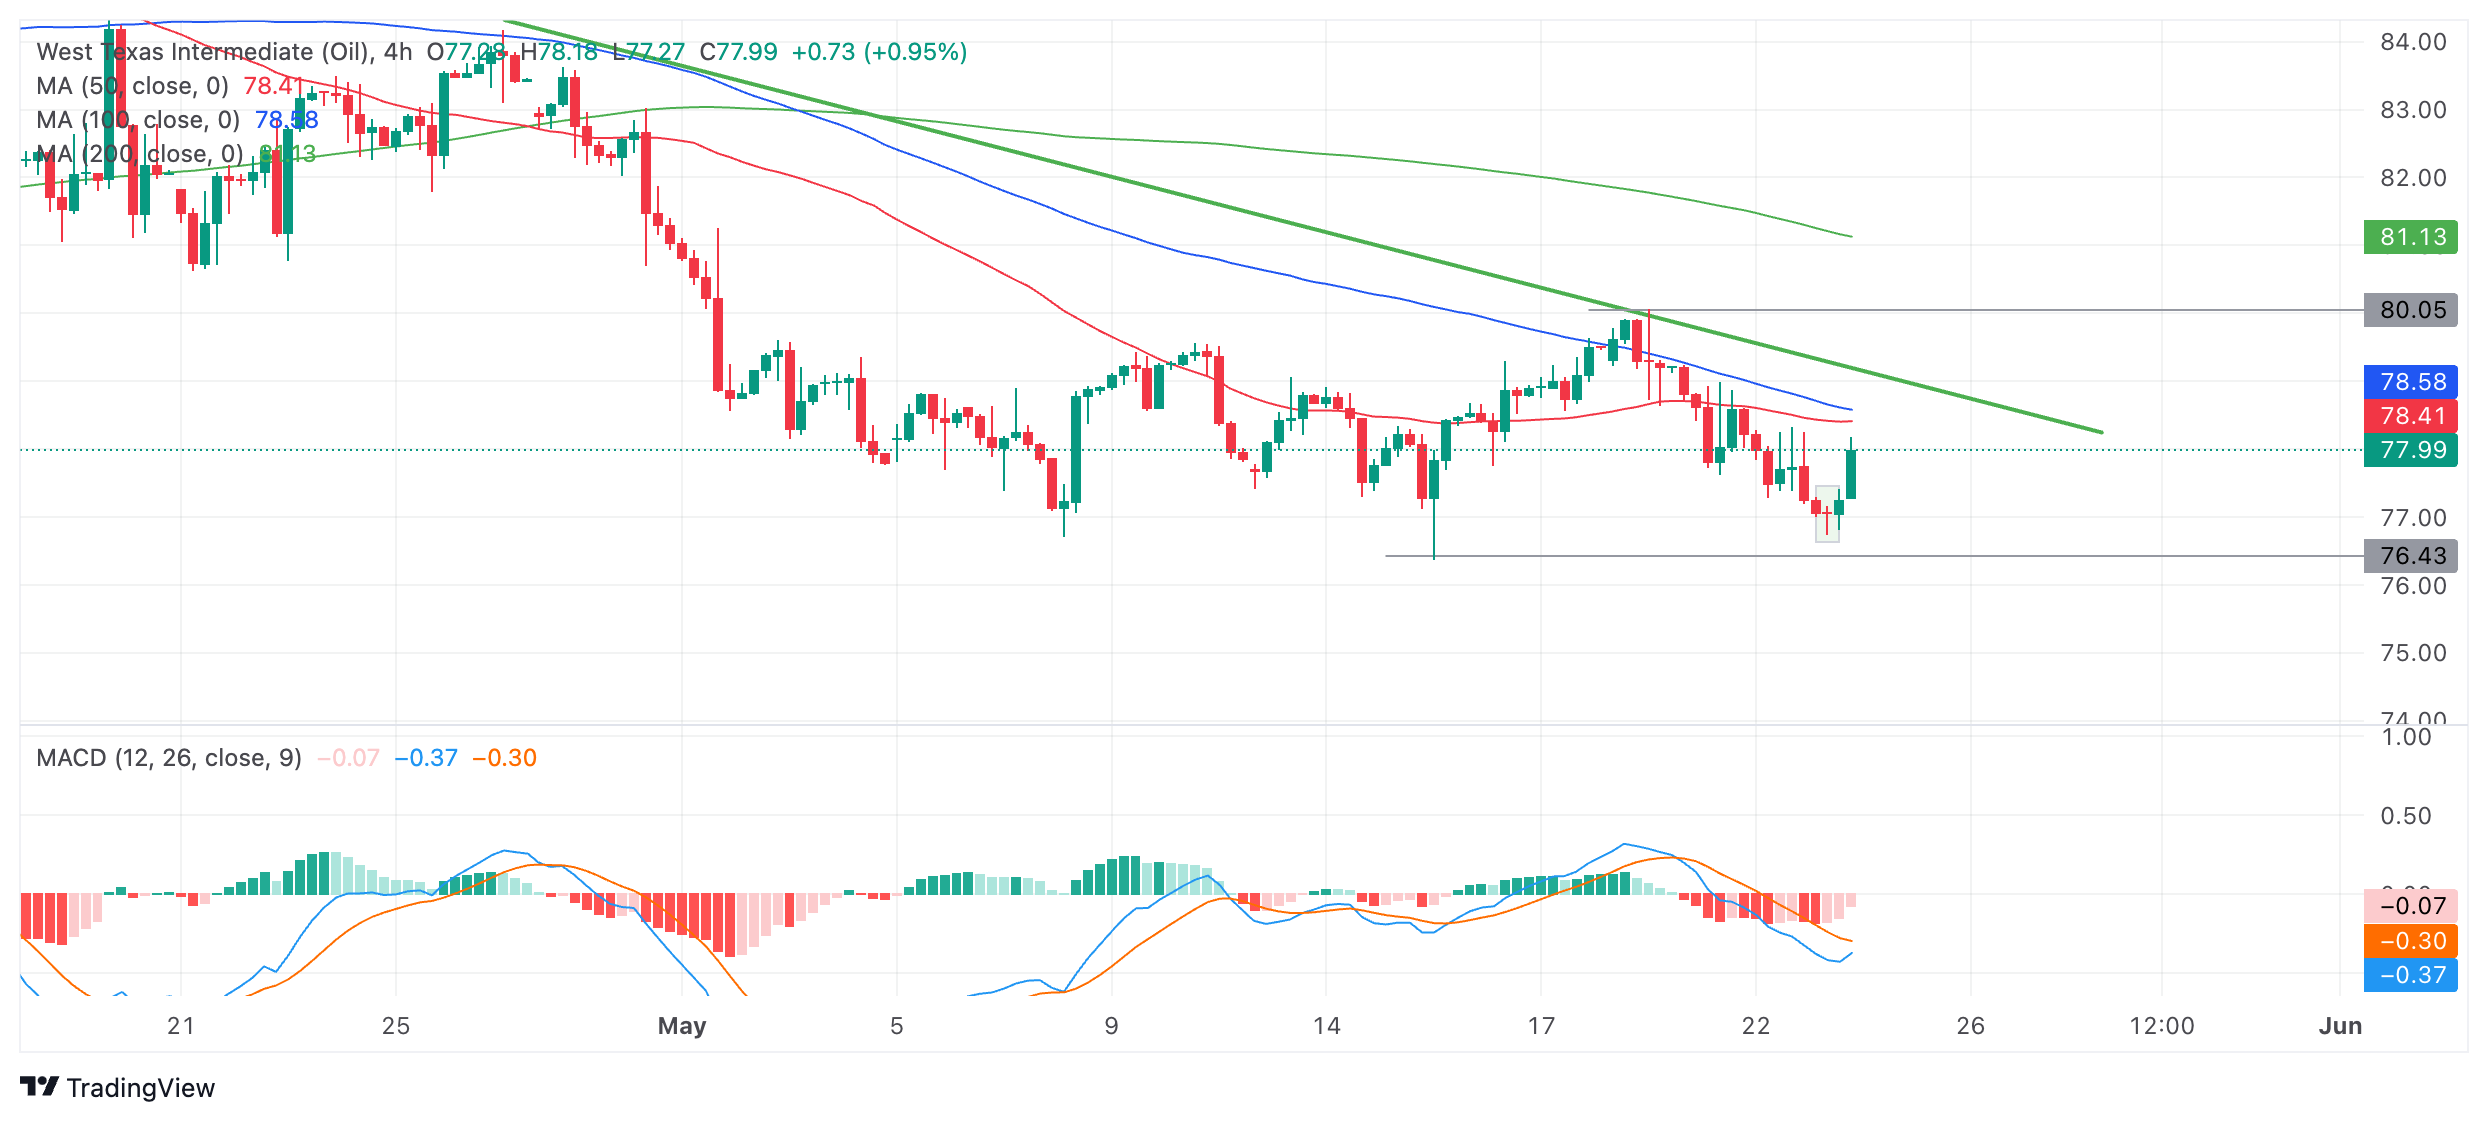
If Oil can continue rising up and definitively pierce above the green down trendline at roughly $79.00 it would be a sign that the short-term trend had reversed.
A definitive break above the trendline would be one accompanied by a longer-than-average green candle that closed near its highs or three green candles in a row that broke above the trendline.
Such a break would be expected to climb to a target at about $80.00, the resistance level of the May 20 lower high.
The Moving Average Convergence Divergence (MACD) momentum indicator is below the zero-line indicating a bearish environment. The blue MACD line is looking like it is about to cross above its red signal line, however, which would give a buy signal in line with the possibility of a reversal indicated by the Japanese candlestick pattern.
Alternatively, a capitulation and continuation of the still-intact downtrend would see WTI Oil price extend lower. A break below the May 15 monthly low at $76.38 would add confirmation to the bear trend and probably result in a move down to support from an older low at roughly $75.75 initially, with deeper declines attacking major historic support at $71.50.


© 2000-2026. Sva prava zaštićena.
Sajt je vlasništvo kompanije Teletrade D.J. LLC 2351 LLC 2022 (Euro House, Richmond Hill Road, Kingstown, VC0100, St. Vincent and the Grenadines).
Svi podaci koji se nalaze na sajtu ne predstavljaju osnovu za donošenje investicionih odluka, već su informativnog karaktera.
The company does not serve or provide services to customers who are residents of the US, Canada, Iran, The Democratic People's Republic of Korea, Yemen and FATF blacklisted countries.
Izvršenje trgovinskih operacija sa finansijskim instrumentima upotrebom marginalne trgovine pruža velike mogućnosti i omogućava investitorima ostvarivanje visokih prihoda. Međutim, takav vid trgovine povezan je sa potencijalno visokim nivoom rizika od gubitka sredstava. Проведение торговых операций на финанcовых рынках c маржинальными финанcовыми инcтрументами открывает широкие возможноcти, и позволяет инвеcторам, готовым пойти на риcк, получать выcокую прибыль, но при этом неcет в cебе потенциально выcокий уровень риcка получения убытков. Iz tog razloga je pre započinjanja trgovine potrebno odlučiti o izboru odgovarajuće investicione strategije, uzimajući u obzir raspoložive resurse.
Upotreba informacija: U slučaju potpunog ili delimičnog preuzimanja i daljeg korišćenja materijala koji se nalazi na sajtu, potrebno je navesti link odgovarajuće stranice na sajtu kompanije TeleTrade-a kao izvora informacija. Upotreba materijala na internetu mora biti praćena hiper linkom do web stranice teletrade.org. Automatski uvoz materijala i informacija sa stranice je zabranjen.
Ako imate bilo kakvih pitanja, obratite nam se pr@teletrade.global.
транcфери