- Analiza
- Novosti i instrumenti
- Vesti sa tržišta
- US Dollar Index Price Forecast: Holds gains around 107.00 despite increased bearish bias
US Dollar Index Price Forecast: Holds gains around 107.00 despite increased bearish bias
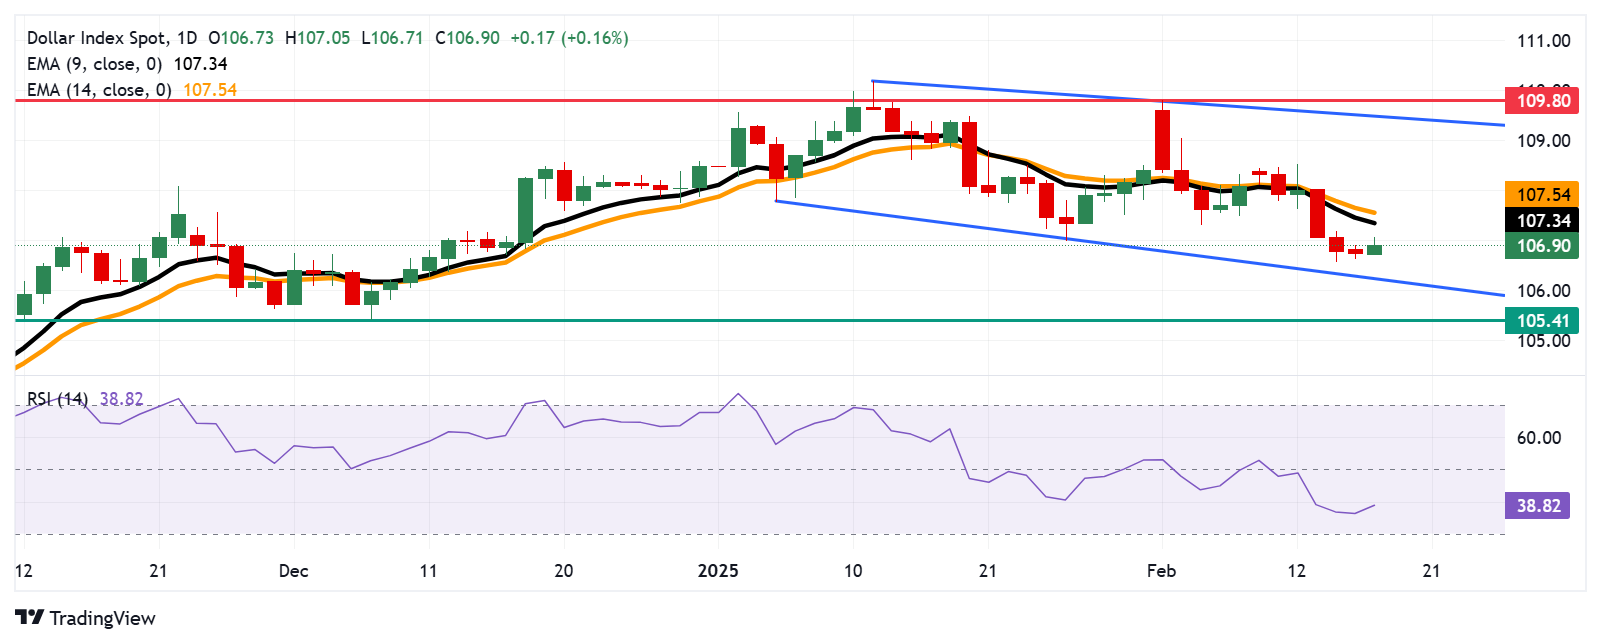
- The US Dollar Index may face challenges as the 14-day RSI remains below 50, signaling increased bearish bias.
- The primary key support appears around the descending channel’s lower boundary at 106.30.
- The DXY may target its primary resistance at the nine-day EMA of 107.34
The US Dollar Index (DXY) ticks higher on Tuesday, hovering around 107.00 during European trading hours after three consecutive sessions of losses. The daily chart indicates a prevailing bearish bias as the index remains confined within a descending channel.
The 14-day Relative Strength Index (RSI) sits below the 50 mark, signaling strengthening bearish momentum. Additionally, the DXY remains below the nine- and 14-day Exponential Moving Averages (EMAs), reinforcing weak short-term price momentum.
On the downside, the US Dollar Index may test the lower boundary of the descending channel at 106.30, followed by psychological support at 106.00. A break below this level could deepen the bearish trend, potentially pushing the index toward the three-month low of 105.41, recorded on December 6.
Conversely, immediate resistance lies at the nine-day EMA of 107.34, followed by the 14-day EMA at 107.54. A decisive break above these levels could improve short-term momentum, opening the door for a move toward the upper boundary of the descending channel at 109.50, with further upside potential toward the five-week high of 109.80, last tested on February 3.
US Dollar Index: Daily Chart
US Dollar PRICE Today
The table below shows the percentage change of US Dollar (USD) against listed major currencies today. US Dollar was the strongest against the New Zealand Dollar.
| USD | EUR | GBP | JPY | CAD | AUD | NZD | CHF | |
|---|---|---|---|---|---|---|---|---|
| USD | 0.17% | 0.06% | 0.35% | 0.04% | 0.07% | 0.48% | -0.04% | |
| EUR | -0.17% | -0.11% | 0.21% | -0.13% | -0.11% | 0.31% | -0.21% | |
| GBP | -0.06% | 0.11% | 0.31% | -0.02% | -0.00% | 0.41% | -0.11% | |
| JPY | -0.35% | -0.21% | -0.31% | -0.32% | -0.30% | 0.10% | -0.41% | |
| CAD | -0.04% | 0.13% | 0.02% | 0.32% | 0.02% | 0.44% | -0.09% | |
| AUD | -0.07% | 0.11% | 0.00% | 0.30% | -0.02% | 0.42% | -0.14% | |
| NZD | -0.48% | -0.31% | -0.41% | -0.10% | -0.44% | -0.42% | -0.52% | |
| CHF | 0.04% | 0.21% | 0.11% | 0.41% | 0.09% | 0.14% | 0.52% |
The heat map shows percentage changes of major currencies against each other. The base currency is picked from the left column, while the quote currency is picked from the top row. For example, if you pick the US Dollar from the left column and move along the horizontal line to the Japanese Yen, the percentage change displayed in the box will represent USD (base)/JPY (quote).


© 2000-2026. Sva prava zaštićena.
Sajt je vlasništvo kompanije Teletrade D.J. LLC 2351 LLC 2022 (Euro House, Richmond Hill Road, Kingstown, VC0100, St. Vincent and the Grenadines).
Svi podaci koji se nalaze na sajtu ne predstavljaju osnovu za donošenje investicionih odluka, već su informativnog karaktera.
The company does not serve or provide services to customers who are residents of the US, Canada, Iran, The Democratic People's Republic of Korea, Yemen and FATF blacklisted countries.
Izvršenje trgovinskih operacija sa finansijskim instrumentima upotrebom marginalne trgovine pruža velike mogućnosti i omogućava investitorima ostvarivanje visokih prihoda. Međutim, takav vid trgovine povezan je sa potencijalno visokim nivoom rizika od gubitka sredstava. Проведение торговых операций на финанcовых рынках c маржинальными финанcовыми инcтрументами открывает широкие возможноcти, и позволяет инвеcторам, готовым пойти на риcк, получать выcокую прибыль, но при этом неcет в cебе потенциально выcокий уровень риcка получения убытков. Iz tog razloga je pre započinjanja trgovine potrebno odlučiti o izboru odgovarajuće investicione strategije, uzimajući u obzir raspoložive resurse.
Upotreba informacija: U slučaju potpunog ili delimičnog preuzimanja i daljeg korišćenja materijala koji se nalazi na sajtu, potrebno je navesti link odgovarajuće stranice na sajtu kompanije TeleTrade-a kao izvora informacija. Upotreba materijala na internetu mora biti praćena hiper linkom do web stranice teletrade.org. Automatski uvoz materijala i informacija sa stranice je zabranjen.
Ako imate bilo kakvih pitanja, obratite nam se pr@teletrade.global.
транcфери