- Analiza
- Novosti i instrumenti
- Vesti sa tržišta
Forex-novosti i prognoze od 13-11-2018
| Time | Country | Event | Period | Previous value | Forecast |
|---|---|---|---|---|---|
| 00:30 | Australia | Wage Price Index, q/q | Quarter III | 0.6% | 0.6% |
| 00:30 | Australia | Wage Price Index, y/y | Quarter III | 2.1% | 2.3% |
| 02:00 | China | Retail Sales y/y | October | 9.2% | 9.1% |
| 02:00 | China | Industrial Production y/y | October | 5.8% | 5.7% |
| 02:00 | China | Fixed Asset Investment | October | 5.4% | 5.5% |
| 04:30 | Japan | Tertiary Industry Index | September | 0.5% | -0.4% |
| 04:30 | Japan | Industrial Production (YoY) | September | 0.2% | -2.9% |
| 04:30 | Japan | Industrial Production (MoM) | September | 0.2% | -1.1% |
| 07:00 | Germany | GDP (QoQ) | Quarter III | 0.5% | -0.1% |
| 07:00 | Germany | GDP (YoY) | Quarter III | 2% | 1.3% |
| 07:45 | France | CPI, m/m | October | -0.2% | 0.1% |
| 07:45 | France | CPI, y/y | October | 2.2% | 2.2% |
| 09:30 | United Kingdom | Producer Price Index - Output (MoM) | October | 0.4% | 0.2% |
| 09:30 | United Kingdom | Producer Price Index - Input (YoY) | October | 10.3% | 9.6% |
| 09:30 | United Kingdom | Producer Price Index - Input (MoM) | October | 1.3% | 0.6% |
| 09:30 | United Kingdom | Retail Price Index, m/m | October | 0% | 0.2% |
| 09:30 | United Kingdom | Producer Price Index - Output (YoY) | October | 3.1% | 3.1% |
| 09:30 | United Kingdom | Retail prices, Y/Y | October | 3.3% | 3.4% |
| 09:30 | United Kingdom | HICP ex EFAT, Y/Y | October | 1.9% | 2% |
| 09:30 | United Kingdom | HICP, m/m | October | 0.1% | 0.2% |
| 09:30 | United Kingdom | HICP, Y/Y | October | 2.4% | 2.5% |
| 10:00 | Eurozone | Industrial Production (YoY) | September | 0.9% | 0.3% |
| 10:00 | Eurozone | Industrial production, (MoM) | September | 1% | -0.4% |
| 10:00 | Eurozone | GDP (QoQ) | Quarter III | 0.4% | 0.2% |
| 10:00 | Eurozone | GDP (YoY) | Quarter III | 2.2% | 1.7% |
| 13:30 | U.S. | CPI, m/m | October | 0.1% | 0.3% |
| 13:30 | U.S. | CPI excluding food and energy, m/m | October | 0.1% | 0.2% |
| 13:30 | U.S. | CPI, Y/Y | October | 2.3% | 2.5% |
| 13:30 | U.S. | CPI excluding food and energy, Y/Y | October | 2.2% | 2.2% |
| 15:00 | U.S. | FOMC Member Quarles Speaks | |||
| 22:00 | U.S. | Fed Chair Powell Speaks |
Major US stock indices predominantly declined, as the collapse of the commodity sector leveled a positive from the growth of the technology sector and hopes for a deal between the US and China.
Oil prices fell by 8%, while WTI crude futures reached a minimum since mid-November 2017 due to lingering concerns about weakening global demand, oversupply and sales among other asset classes, including stocks.
Gradually, the focus of investors is shifting to inflation data for the US, which will be released tomorrow. Recall the CPI was soft in September. General inflation was constrained by falling energy prices, but a flat (close to negative) value of food prices also put pressure on the general price increase. With the exception of food and energy, core inflation was also soft. However, in this case, the weakness, apparently, was associated with the prices of goods, in particular for vehicles. According to forecasts, in October, the consumer price index rose by 0.3%.
Most of the components of DOW finished trading in the red (18 out of 30). The outsider was Exxon Mobil Corporation (XOM, -2.29%). The growth leader was the shares of Intel Corporation (INTC, + 1.59%).
Most of the S & P sectors have shown a boost. The financial sector grew the most (+ 0.5%). The largest decline was in the commodity sector (-2.1%).
At the time of closing:
Dow 25,286.49 -100.69 -0.40%
S&P 500 2,722.18 -4.04 -0.15%
Nasdaq 100 7,200.88 +0.01 +0.00%
| Time | Country | Event | Period | Previous value | Forecast |
|---|---|---|---|---|---|
| 00:30 | Australia | Wage Price Index, q/q | Quarter III | 0.6% | 0.6% |
| 00:30 | Australia | Wage Price Index, y/y | Quarter III | 2.1% | 2.3% |
| 02:00 | China | Retail Sales y/y | October | 9.2% | 9.1% |
| 02:00 | China | Industrial Production y/y | October | 5.8% | 5.7% |
| 02:00 | China | Fixed Asset Investment | October | 5.4% | 5.5% |
| 04:30 | Japan | Tertiary Industry Index | September | 0.5% | -0.4% |
| 04:30 | Japan | Industrial Production (YoY) | September | 0.2% | -2.9% |
| 04:30 | Japan | Industrial Production (MoM) | September | 0.2% | -1.1% |
| 07:00 | Germany | GDP (QoQ) | Quarter III | 0.5% | -0.1% |
| 07:00 | Germany | GDP (YoY) | Quarter III | 2% | 1.3% |
| 07:45 | France | CPI, m/m | October | -0.2% | 0.1% |
| 07:45 | France | CPI, y/y | October | 2.2% | 2.2% |
| 09:30 | United Kingdom | Producer Price Index - Output (MoM) | October | 0.4% | 0.2% |
| 09:30 | United Kingdom | Producer Price Index - Input (YoY) | October | 10.3% | 9.6% |
| 09:30 | United Kingdom | Producer Price Index - Input (MoM) | October | 1.3% | 0.6% |
| 09:30 | United Kingdom | Retail Price Index, m/m | October | 0% | 0.2% |
| 09:30 | United Kingdom | Producer Price Index - Output (YoY) | October | 3.1% | 3.1% |
| 09:30 | United Kingdom | Retail prices, Y/Y | October | 3.3% | 3.4% |
| 09:30 | United Kingdom | HICP ex EFAT, Y/Y | October | 1.9% | 2% |
| 09:30 | United Kingdom | HICP, m/m | October | 0.1% | 0.2% |
| 09:30 | United Kingdom | HICP, Y/Y | October | 2.4% | 2.5% |
| 10:00 | Eurozone | Industrial Production (YoY) | September | 0.9% | 0.3% |
| 10:00 | Eurozone | Industrial production, (MoM) | September | 1% | -0.4% |
| 10:00 | Eurozone | GDP (QoQ) | Quarter III | 0.4% | 0.2% |
| 10:00 | Eurozone | GDP (YoY) | Quarter III | 2.2% | 1.7% |
| 13:30 | U.S. | CPI, m/m | October | 0.1% | 0.3% |
| 13:30 | U.S. | CPI excluding food and energy, m/m | October | 0.1% | 0.2% |
| 13:30 | U.S. | CPI, Y/Y | October | 2.3% | 2.5% |
| 13:30 | U.S. | CPI excluding food and energy, Y/Y | October | 2.2% | 2.2% |
| 15:00 | U.S. | FOMC Member Quarles Speaks | |||
| 22:00 | U.S. | Fed Chair Powell Speaks |
Sanctions Come as U.S. Presses Europe to Blacklist All of Iran-Backed Hezbollah as a Terror Group
Hezbollah Sanctions Are Part of a Broader Maximum Pressure Campaign Against Iran
U.S. stock-index futures rose moderately on Tuesday, helped by strong quarterly results from Home Depot (HD) and reports of renewed trade talks between the U.S. and China.
Global Stocks:
Index/commodity | Last | Today's Change, points | Today's Change, % |
Nikkei | 21,810.52 | -459.36 | -2.06% |
Hang Seng | 25,792.87 | +159.69 | +0.62% |
Shanghai | 2,654.88 | +24.36 | +0.93% |
S&P/ASX | 5,834.20 | -107.10 | -1.80% |
FTSE | 7,051.37 | -1.71 | -0.02% |
CAC | 5,069.86 | +10.77 | +0.21% |
DAX | 11,384.22 | +58.78 | +0.52% |
Crude | $58.98 | -1.59% | |
Gold | $1,202.20 | -0.11% |
(company / ticker / price / change ($/%) / volume)
3M Co | MMM | 198.59 | 1.55(0.79%) | 654 |
ALCOA INC. | AA | 33.93 | 0.20(0.59%) | 4000 |
Amazon.com Inc., NASDAQ | AMZN | 1,646.00 | 9.15(0.56%) | 85478 |
Apple Inc. | AAPL | 191.95 | -2.22(-1.14%) | 559662 |
AT&T Inc | T | 30.87 | 0.09(0.29%) | 15597 |
Barrick Gold Corporation, NYSE | ABX | 12.67 | 0.09(0.72%) | 113000 |
Boeing Co | BA | 353.71 | -3.32(-0.93%) | 36778 |
Caterpillar Inc | CAT | 125.9 | 0.90(0.72%) | 11936 |
Cisco Systems Inc | CSCO | 45.9 | 0.28(0.61%) | 16772 |
Citigroup Inc., NYSE | C | 64.25 | 0.04(0.06%) | 34095 |
Exxon Mobil Corp | XOM | 80 | 0.17(0.21%) | 6369 |
Facebook, Inc. | FB | 141.99 | 0.44(0.31%) | 64196 |
Ford Motor Co. | F | 9.53 | 0.04(0.42%) | 57280 |
Freeport-McMoRan Copper & Gold Inc., NYSE | FCX | 11.28 | 0.12(1.08%) | 3000 |
General Electric Co | GE | 8.05 | 0.06(0.75%) | 641499 |
General Motors Company, NYSE | GM | 35.82 | 0.13(0.36%) | 975 |
Goldman Sachs | GS | 206 | -0.05(-0.02%) | 78168 |
Google Inc. | GOOG | 1,045.50 | 6.87(0.66%) | 7765 |
Hewlett-Packard Co. | HPQ | 24.2 | 0.21(0.88%) | 5560 |
Home Depot Inc | HD | 181.52 | 2.09(1.16%) | 244522 |
Intel Corp | INTC | 46.95 | 0.30(0.64%) | 33418 |
International Business Machines Co... | IBM | 121.25 | 0.35(0.29%) | 3646 |
JPMorgan Chase and Co | JPM | 109.35 | 0.40(0.37%) | 19970 |
McDonald's Corp | MCD | 184.6 | 0.23(0.12%) | 1016 |
Merck & Co Inc | MRK | 74.99 | 0.30(0.40%) | 300 |
Microsoft Corp | MSFT | 107.41 | 0.54(0.51%) | 46474 |
Nike | NKE | 75.11 | 0.01(0.01%) | 356 |
Pfizer Inc | PFE | 44.33 | 0.22(0.50%) | 464 |
Procter & Gamble Co | PG | 92.32 | -0.38(-0.41%) | 2565 |
Starbucks Corporation, NASDAQ | SBUX | 68.09 | 0.18(0.27%) | 3711 |
Tesla Motors, Inc., NASDAQ | TSLA | 333.6 | 2.32(0.70%) | 66505 |
The Coca-Cola Co | KO | 49.81 | -0.06(-0.12%) | 5594 |
Twitter, Inc., NYSE | TWTR | 32.16 | 0.15(0.47%) | 38968 |
United Technologies Corp | UTX | 128.9 | 0.60(0.47%) | 400 |
Verizon Communications Inc | VZ | 58.98 | 0.26(0.44%) | 2046 |
Visa | V | 140.35 | 0.63(0.45%) | 7529 |
Wal-Mart Stores Inc | WMT | 103.75 | -0.12(-0.12%) | 21274 |
Walt Disney Co | DIS | 117.03 | 0.33(0.28%) | 4829 |
Yandex N.V., NASDAQ | YNDX | 28.32 | 0.58(2.09%) | 10690 |
Apple (AAPL) target lowered to $209 from $222 at Goldman Sachs
Apple (AAPL) target lowered to $266 from $270 at JPMorgan
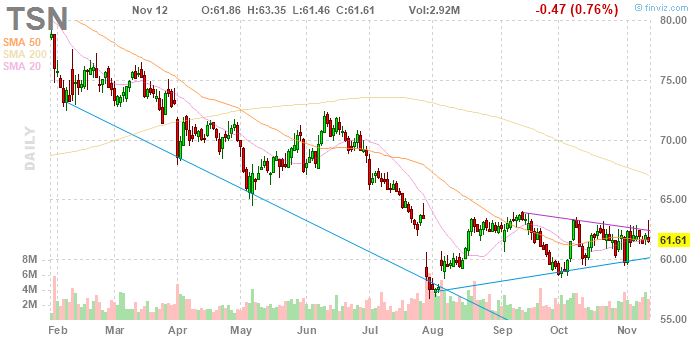
Tyson Foods Inc (TSN) reported Q4 FY 2018 earnings of $1.58 per share (versus $1.43 in Q4 FY 2017), beating analysts’ consensus estimate of $1.38.
The company’s quarterly revenues amounted to $9.999 bln (-1.4% y/y), missing analysts’ consensus estimate of $10.297 bln.
The company also issued in-line guidance for FY 2019, projecting EPS of $5.75-6.10 (versus analysts’ consensus estimate of $6.06) and revenues of $41 bln (versus analysts’ consensus estimate of $41.36 bln).
TSN fell to $59.25 (-3.83%) in pre-market trading.
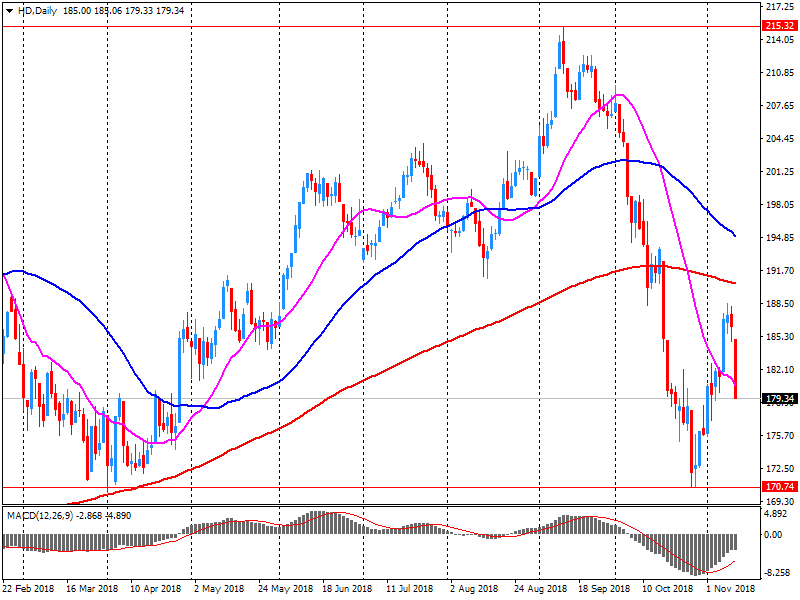
Home Depot Inc (HD) reported Q3 FY 2018 earnings of $2.51 per share (versus $1.84 in Q3 FY 2017), beating analysts’ consensus estimate of $2.27.
The company’s quarterly revenues amounted to $26.302 bln (+5.1% y/y), generally in line with analysts’ consensus estimate of $26.231 bln.
The company also issued raised guidance for FY 2018, projecting EPS of $9.75 (compared to its prior guidance of $9.42 and analysts’ consensus estimate of $9.58) and revenues growth rate of +7.2% y/y to $108 bln (compared to its prior guidance of +7.0% y/y and analysts’ consensus estimate of $108.28 bln).
HD rose to $182.47 (+1.69%) in pre-market trading.
Small Number Of Outstanding Issues Remain As UK Pushes For Best Text
The ZEW Indicator of Economic Sentiment for Germany recorded an increase of 0.6 points in November 2018 and now stands at minus 24.1 points. Although the indicator has improved slightly, it is still clearly in negative territory and remains well below the long-term average of 22.7 points. The assessment of the current economic situation in Germany decreased considerably in November, with the corresponding indicator falling by 11.9 points to a level of 58.2 points.
Latest estimates show that average weekly earnings for employees in Great Britain in nominal terms (that is, not adjusted for price inflation) increased by 3.2% excluding bonuses, and by 3.0% including bonuses, compared with a year earlier.
Latest estimates show that average weekly earnings increased by 0.9% excluding bonuses, and by 0.8% including bonuses, compared with a year earlier.
Estimates from the Labour Force Survey show that, between April to June 2018 and July to September 2018, the number of people in work and the number of unemployed people both increased but the number of people aged from 16 to 64 years not working and not seeking nor available to work (economically inactive) was little changed.
There were 32.41 million people in work, 23,000 more compared with April to June 2018 and 350,000 more than for a year earlier.
The unemployment rate (the number of unemployed people as a proportion of all employed and unemployed people) was 4.1%, slightly higher than for April to June 2018 but lower than for a year earlier (4.3%).
We Do Not Know When It Is Going To Be Possible To Conclude The Brexit Negotiations
The Producer and Import Price Index increased in October 2018 by 0.2% compared with the previous month, reaching 103.4 points (December 2015 = 100). The rise is due in particular to higher prices for petroleum products, petroleum and natural gas. Compared with October 2017, the price level of the whole range of domestic and imported products rose by 2.3%.
EUR/USD
Resistance levels (open interest**, contracts)
$1.1376 (400)
$1.1352 (595)
$1.1332 (93)
Price at time of writing this review: $1.1239
Support levels (open interest**, contracts):
$1.1195 (4028)
$1.1169 (3084)
$1.1139 (6471)
Comments:
- Overall open interest on the CALL options and PUT options with the expiration date December, 7 is 119248 contracts (according to data from November, 12) with the maximum number of contracts with strike price $1,1200 (6471);
GBP/USD
Resistance levels (open interest**, contracts)
$1.3037 (1760)
$1.3013 (1267)
$1.2974 (618)
Price at time of writing this review: $1.2891
Support levels (open interest**, contracts):
$1.2811 (1787)
$1.2779 (2342)
$1.2737 (3243)
Comments:
- Overall open interest on the CALL options with the expiration date December, 7 is 57520 contracts, with the maximum number of contracts with strike price $1,3100 (5201);
- Overall open interest on the PUT options with the expiration date December, 7 is 44822 contracts, with the maximum number of contracts with strike price $1,2500 (4369);
- The ratio of PUT/CALL was 0.78 versus 0.82 from the previous trading day according to data from November, 12
* - The Chicago Mercantile Exchange bulletin (CME) is used for the calculation.
** - Open interest takes into account the total number of option contracts that are open at the moment.
In Q3 2018, private payroll employment continued to grow at a moderate pace: +0.2% after +0.1% in Q2 (that is +30,200 net job creations after +22,400 jobs). Year on year, private payroll employment increased by +1.1% (that is +211,100 jobs). Excluding temporary employment, it increased by +0.2% over the quarter (that is +40,500 jobs) and by +1.0% over the year (+190,900 jobs).
Private payroll employment increased steadily again in construction (+0.5%, +6,800 jobs, after +0.4%). It stabilised in industry (that is +800 jobs, after −2,400 jobs). Year on year, private employment increased by 28,800 in construction and by 5,200 in industry.
In market services, private employment continued to increase at a moderate pace: +0.2% (that is +23,300 jobs), at the same rate as in the previous quarter (+22,000 jobs in Q2 2018). The rise amounts to 169,600 over a year. Excluding temporary employment, private payroll employment barely accelerated in market services: +0.3%, after +0.2%. Private employment in non-market services stabilised in Q3 2018 (after −0.1% in Q2), it was almost stable over a year (+0.1%).
A negative start to trading in the stock markets of Europe is expected, following basically similar tones in Asian funds markets.
Forward orders (the most reliable indicator of domestic demand) remain a touch above average but significantly below levels reported in H1 2018. Confidence has also deteriorated through 2018, hovering at or below average in recent months. Retail continued to report weak outcomes in the month and recreational & personal services have eased since around mid-2018. The eastern states currently report the best conditions but have a less positive outlook than SA and WA. Overall, the survey suggests price pressures remain weak across both inputs and outputs, which is in line with official data pointing to prices (and wages) continuing to grow at relatively weak rates.
Both the business conditions and confidence indexes declined 2pts to +12 and +4 index points respectively. At these levels, conditions remain well above average (even after declining from the highs seen earlier in 2018), while confidence is a little below average.
According to Alan Oster, NAB Group Chief Economist “Although conditions have eased since earlier in 2018, and have been a little volatile over recent months, business conditions remain well above average. This likely reflected a healthy business sector alongside the strength in economic growth through 2018”.
The challenge with financial stability is how to maintain a strong, resilient and efficient financial system in the face of changing and emerging risks said Deputy Governor and Head of Financial Stability Geoff Bascand in Sydney today.
"Ten years on from the pain and enormous costs of the Global Financial Crisis (GFC), it’s clear that prevention is better than cure. Reducing the risk of a crisis in New Zealand demands that we understand the domestic and global risks relevant to us. For example, snake bites are unpleasant but not pertinent to most New Zealanders. The challenge is assessing what is too risky, too safe, and just right?” Mr Bascand said.
New Zealand’s financial sector is sound and well regulated. It weathered the GFC better than most, but there was no room for complacency, Mr Bascand said.
New Zealand has two main vulnerabilities: our high levels of indebtedness (in the household and dairy sectors) and our reliance on foreign sources of funding.
Neutral Rate Policy May Be Around 2.7% Funds Rate
Hard to Say Exactly Where Neutral Rate Policy Resides
Premature to Say Ideal Level for Fed Balance Sheet
Appropriate to Raise Fed Target to Neutral Level
Open to IOER Technical Tweak If Justified
Food prices fell 0.6 percent in October 2018. After seasonal adjustment, they rose 0.3 percent.
In October 2018 compared with September 2018:
fruit and vegetable prices fell 5.4 percent (up 0.2 percent after seasonal adjustment)
meat, poultry, and fish prices rose 2.4 percent
grocery food prices fell 0.4 percent (down 0.3 percent after seasonal adjustment)
non-alcoholic beverage prices fell 0.3 percent
restaurant meals and ready-to-eat food prices rose 0.1 percent.
Food prices increased 0.6 percent in the year ended October 2018.
In October 2018 compared with October 2017:
fruit and vegetable prices decreased 5.6 percent
meat, poultry, and fish prices increased 2.6 percent
grocery food prices increased 0.6 percent
non-alcoholic beverage prices increased 1.0 percent
restaurant meals and ready-to-eat food prices increased 2.9 percent.
The inflation rate – measured by the consumer price index – thus increased again. A higher inflation rate was last recorded just over ten years ago (September 2008: +2.8%). Compared with September 2018, the consumer price index rose by 0.2% in October 2018. The Federal Statistical Office (Destatis) thus confirms its provisional overall results of 30 October 2018.
As in the preceding months, the increase of energy product prices had a considerable effect on the inflation rate. Energy prices rose 8.9% in October 2018 on October 2017. The increase in energy prices thus accelerated again; in September 2018, the relevant rate of price increase had been +7.7%. From October 2017 to October 2018, price rises were recorded especially for heating oil (+39.9%) and motor fuels (+14.8%). The price changes for the other energy products were much smaller (for example, charges for central and district heating: +2.9%; electricity: +1.0%; gas: -1.4%). Excluding energy prices, the inflation rate would have been +1.7% in October 2018; excluding the prices of mineral oil products, it would also have been +1.7%.


© 2000-2026. Sva prava zaštićena.
Sajt je vlasništvo kompanije Teletrade D.J. LLC 2351 LLC 2022 (Euro House, Richmond Hill Road, Kingstown, VC0100, St. Vincent and the Grenadines).
Svi podaci koji se nalaze na sajtu ne predstavljaju osnovu za donošenje investicionih odluka, već su informativnog karaktera.
The company does not serve or provide services to customers who are residents of the US, Canada, Iran, The Democratic People's Republic of Korea, Yemen and FATF blacklisted countries.
Izvršenje trgovinskih operacija sa finansijskim instrumentima upotrebom marginalne trgovine pruža velike mogućnosti i omogućava investitorima ostvarivanje visokih prihoda. Međutim, takav vid trgovine povezan je sa potencijalno visokim nivoom rizika od gubitka sredstava. Проведение торговых операций на финанcовых рынках c маржинальными финанcовыми инcтрументами открывает широкие возможноcти, и позволяет инвеcторам, готовым пойти на риcк, получать выcокую прибыль, но при этом неcет в cебе потенциально выcокий уровень риcка получения убытков. Iz tog razloga je pre započinjanja trgovine potrebno odlučiti o izboru odgovarajuće investicione strategije, uzimajući u obzir raspoložive resurse.
Upotreba informacija: U slučaju potpunog ili delimičnog preuzimanja i daljeg korišćenja materijala koji se nalazi na sajtu, potrebno je navesti link odgovarajuće stranice na sajtu kompanije TeleTrade-a kao izvora informacija. Upotreba materijala na internetu mora biti praćena hiper linkom do web stranice teletrade.org. Automatski uvoz materijala i informacija sa stranice je zabranjen.
Ako imate bilo kakvih pitanja, obratite nam se pr@teletrade.global.
транcфери