- Analiza
- Novosti i instrumenti
- Vesti sa tržišta
Forex-novosti i prognoze od 29-07-2021
| Time | Country | Event | Period | Previous value | Forecast |
|---|---|---|---|---|---|
| 01:30 (GMT) | Australia | Producer price index, y/y | Quarter II | 0.2% | |
| 01:30 (GMT) | Australia | Private Sector Credit, m/m | June | 0.4% | |
| 01:30 (GMT) | Australia | Producer price index, q / q | Quarter II | 0.4% | |
| 01:30 (GMT) | Australia | Private Sector Credit, y/y | June | 1.9% | |
| 05:00 (GMT) | Japan | Construction Orders, y/y | June | 7.4% | |
| 05:00 (GMT) | Japan | Housing Starts, y/y | June | 9.9% | 7.2% |
| 05:30 (GMT) | France | Consumer spending | June | 10.4% | 1.4% |
| 05:30 (GMT) | France | GDP, q/q | Quarter II | -0.1% | 0.8% |
| 06:45 (GMT) | France | CPI, y/y | July | 1.5% | 1% |
| 06:45 (GMT) | France | CPI, m/m | July | 0.1% | -0.1% |
| 07:00 (GMT) | Switzerland | KOF Leading Indicator | July | 133.4 | 130 |
| 08:00 (GMT) | Germany | GDP (QoQ) | Quarter II | -1.8% | 2% |
| 08:00 (GMT) | Germany | GDP (YoY) | Quarter II | -3.1% | 9.6% |
| 09:00 (GMT) | Eurozone | Unemployment Rate | June | 7.9% | 7.9% |
| 09:00 (GMT) | Eurozone | Harmonized CPI ex EFAT, Y/Y | July | 0.9% | 0.8% |
| 09:00 (GMT) | Eurozone | Harmonized CPI, Y/Y | July | 1.9% | 2% |
| 09:00 (GMT) | Eurozone | Harmonized CPI | July | 0.3% | |
| 09:00 (GMT) | Eurozone | GDP (YoY) | Quarter II | -1.3% | 13.2% |
| 09:00 (GMT) | Eurozone | GDP (QoQ) | Quarter II | -0.3% | 1.5% |
| 12:30 (GMT) | Canada | Industrial Product Price Index, y/y | June | 16.9% | |
| 12:30 (GMT) | Canada | Industrial Product Price Index, m/m | June | 3.1% | |
| 12:30 (GMT) | U.S. | Personal spending | June | 0.0% | 0.7% |
| 12:30 (GMT) | U.S. | Employment Cost Index | Quarter II | 0.9% | 0.9% |
| 12:30 (GMT) | Canada | GDP (m/m) | May | -0.3% | -0.3% |
| 12:30 (GMT) | U.S. | PCE price index ex food, energy, Y/Y | June | 3.4% | 3.7% |
| 12:30 (GMT) | U.S. | PCE price index ex food, energy, m/m | June | 0.5% | 0.6% |
| 12:30 (GMT) | U.S. | Personal Income, m/m | June | -2% | -0.3% |
| 13:45 (GMT) | U.S. | Chicago Purchasing Managers' Index | July | 66.1 | 64.6 |
| 14:00 (GMT) | U.S. | Reuters/Michigan Consumer Sentiment Index | July | 85.5 | 80.8 |
| 17:00 (GMT) | U.S. | Baker Hughes Oil Rig Count | July | 387 |
ActionForex reports that analysts at TD Bank Financial Group discuss the Q2 U.S. GDP data.
"The U.S. economy expanded at a 6.5% annualized pace in the second quarter, below the median consensus estimate for 8.4%."
"Consumers were the key driver of domestic demand strength. Spending rallied 11.8%, following a 11.4% pace in Q1."
"Government spending, by contrast, pulled back in the second quarter, falling 1.5%. The outturn was heavily influenced by a decrease in federal government activity (-5.0%) while the state and local level flipped to expansion (+0.8%) after contracting in the first quarter."
"Nonresidential investment was up (+8.0%)... Residential investment pulled back in the second quarter falling 9.8% and subtracting 0.5 percentage points (ppts) from growth."
"Exports rose less than expected (6.0%) while imports were a bit stronger than anticipated, up 7.8% in Q2, so net exports still subtracted from growth (-0.4%-pts) compounding the drag from Q1."
"Finally, largely as expected, price pressures accelerated in the second quarter, with the core PCE deflator up 6.1% on an annualized quarter-over-quarter basis.'
"The American economy expanded at a brisk pace in the second quarter, though somewhat below lofty expectations. Growth was powered by the consumer while federal government expenditures, residential real estate investment and a drawdown in inventories acted as headwinds. Total economic activity is now slightly above (+0.8%) its pre-pandemic level as economic reopening and a receding virus has helped bring back a semblance of normalcy."
"The picture here is of an economy where healthy domestic demand is setting the tone for the expansion. However, as noted yesterday by the FOMC, the course of the recovery will be guided by the virus."
eFXdata reports that analysts at ANZ Research summarize their tactical bias on EUR, GBP, AUD, and NZD.
"In the near term, some consolidation in the EUR is possible as the dovishness of the ECB and its low rates structure hamstring its recovery. The path of the GBP will depend on how COVID-19 affects the ‘free’ economy."
"The AUD will be supported by the global outlook, but the lockdowns are posing domestic risk. For the NZD, we expect consolidation ahead of the RBNZ’s first hike."
The
National Association of Realtors (NAR) announced on Thursday its seasonally
adjusted pending home sales index (PHSI) fell 1.9 percent m-o-m to 112.8 in June,
after a revised 8.3 percent m-o-m climb in May (originally an 8.0 percent m-o-m
surge).
Economists
had expected pending home sales to increase 0.3 percent m-o-m in June.
On y-o-y basis, the index also dropped 1.9 percent after a revised 13.1 percent jump in May (originally a 13.4 percent surge).
According to the report, two of the four regional indices recorded m-o-m declines in June. Pending home sales transactions in the South decreased 3.0 percent m-o-m to an index of 132.4 in June, down 4.7 percent from June 2020. The PHSI in the West went down 3.8 percent m-o-m in June to 98.1, down 2.6 percent from a year prior. At the same time, the Northeast PHSI rose 0.5 percent m-o-m to 98.5 in June, an 8.7 percent advance from a year ago. The index in the Midwest grew 0.6 percent m-o-m to 108.3 last month, down 2.4 percent from June 2020.
"Pending
sales have seesawed since January, indicating a turning point for the
market," noted Lawrence Yun, NAR's chief economist. "Buyers are still
interested and want to own a home, but record-high home prices are causing some
to retreat."
U.S. stock-index futures traded mixed on Thursday, as investors digest a fresh raft of corporate earnings, preliminary GDP data and positive infrastructure news, a day after the Fed reaffirmed its dovish policy stance.
Global Stocks:
Index/commodity | Last | Today's Change, points | Today's Change, % |
Nikkei | 27,782.42 | +200.76 | +0.73% |
Hang Seng | 26,315.32 | +841.44 | +3.30% |
Shanghai | 3,411.72 | +50.13 | +1.49% |
S&P/ASX | 7,417.40 | +38.10 | +0.52% |
FTSE | 7,082.21 | +65.58 | +0.93% |
CAC | 6,657.65 | +48.34 | +0.73% |
DAX | 15,635.58 | +65.22 | +0.42% |
Crude oil | $72.74 | +0.48% | |
Gold | $1,825.40 | +1.43% |
(company / ticker / price / change ($/%) / volume)
ALCOA INC. | AA | 38.83 | 0.60(1.57%) | 48007 |
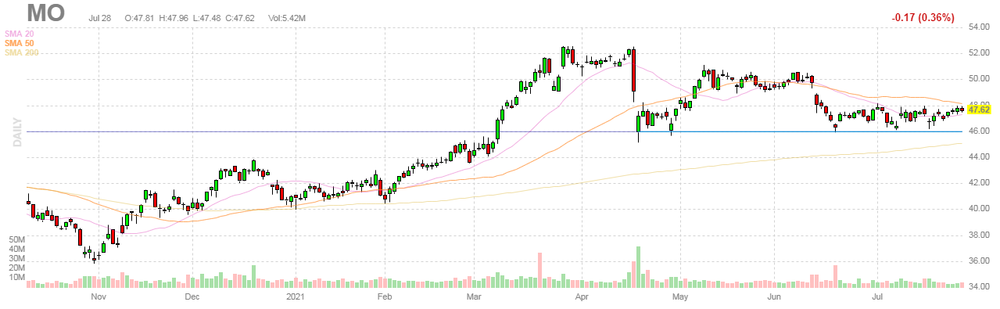
ALTRIA GROUP INC. | MO | 47.99 | 0.37(0.78%) | 24793 |
Amazon.com Inc., NASDAQ | AMZN | 3,632.00 | 1.68(0.05%) | 34557 |
American Express Co | AXP | 171.2 | 1.18(0.69%) | 8425 |
Apple Inc. | AAPL | 144.8 | -0.18(-0.12%) | 651013 |
AT&T Inc | T | 28.04 | 0.03(0.11%) | 48494 |
Boeing Co | BA | 233.21 | 1.64(0.71%) | 83416 |
Caterpillar Inc | CAT | 213.93 | 2.49(1.18%) | 19144 |
Chevron Corp | CVX | 102.3 | 1.12(1.11%) | 22688 |
Cisco Systems Inc | CSCO | 54.86 | 0.09(0.16%) | 6811 |
Citigroup Inc., NYSE | C | 68.78 | 0.68(1.00%) | 43834 |
Deere & Company, NYSE | DE | 357.04 | 3.48(0.98%) | 2978 |
Exxon Mobil Corp | XOM | 58.97 | 0.75(1.29%) | 130354 |
Facebook, Inc. | FB | 361.02 | -12.26(-3.28%) | 710806 |
FedEx Corporation, NYSE | FDX | 283.34 | 1.51(0.54%) | 2581 |
Ford Motor Co. | F | 14.52 | 0.66(4.76%) | 2379980 |
Freeport-McMoRan Copper & Gold Inc., NYSE | FCX | 37.34 | 0.66(1.80%) | 190630 |
General Electric Co | GE | 13.25 | 0.12(0.91%) | 373915 |
General Motors Company, NYSE | GM | 56.77 | 1.28(2.31%) | 244751 |
Goldman Sachs | GS | 376.16 | 1.93(0.52%) | 6025 |
Google Inc. | GOOG | 2,728.00 | 0.37(0.01%) | 4953 |
Home Depot Inc | HD | 326.5 | 0.98(0.30%) | 1072 |
HONEYWELL INTERNATIONAL INC. | HON | 231.88 | 1.39(0.60%) | 683 |
Intel Corp | INTC | 53.23 | 0.16(0.30%) | 71285 |
International Business Machines Co... | IBM | 142.05 | 0.28(0.20%) | 992 |
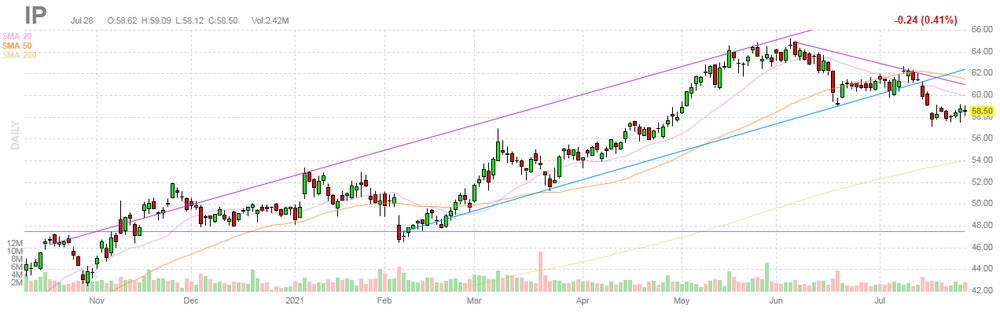
International Paper Company | IP | 58.18 | -0.32(-0.55%) | 1384 |
Johnson & Johnson | JNJ | 172.38 | 0.20(0.12%) | 33200 |
JPMorgan Chase and Co | JPM | 152.83 | 1.13(0.74%) | 17003 |
McDonald's Corp | MCD | 242.45 | 0.67(0.28%) | 2957 |
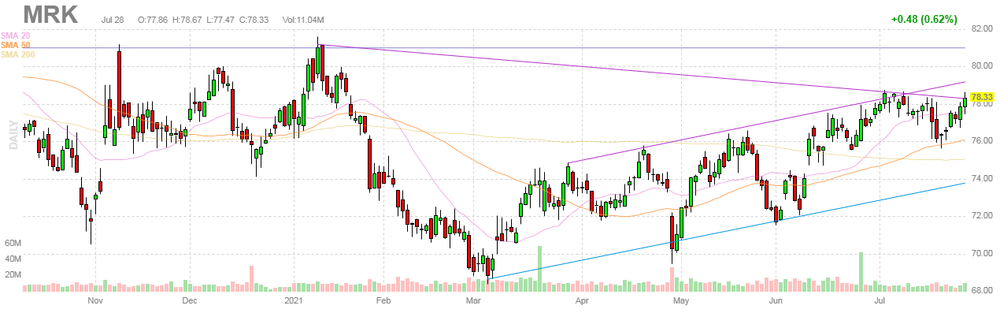
Merck & Co Inc | MRK | 77.4 | -0.93(-1.19%) | 74632 |
Microsoft Corp | MSFT | 285.74 | -0.48(-0.17%) | 67294 |
Nike | NKE | 164.59 | -0.87(-0.53%) | 2686 |
Pfizer Inc | PFE | 43.14 | 0.08(0.19%) | 249965 |
Procter & Gamble Co | PG | 139.24 | 0.48(0.35%) | 1937 |
Starbucks Corporation, NASDAQ | SBUX | 122.81 | 0.40(0.33%) | 10903 |
Tesla Motors, Inc., NASDAQ | TSLA | 649.63 | 2.65(0.41%) | 118080 |
The Coca-Cola Co | KO | 56.91 | 0.17(0.30%) | 12143 |
Travelers Companies Inc | TRV | 147.38 | 0.56(0.38%) | 162 |
Twitter, Inc., NYSE | TWTR | 69.8 | -0.16(-0.23%) | 43922 |
UnitedHealth Group Inc | UNH | 412.36 | 3.19(0.78%) | 738 |
Verizon Communications Inc | VZ | 55.8 | 0.08(0.14%) | 27995 |
Visa | V | 248 | 1.06(0.43%) | 14150 |
Wal-Mart Stores Inc | WMT | 142.2 | 0.14(0.10%) | 25131 |
Walt Disney Co | DIS | 179.92 | 0.82(0.46%) | 11325 |
Yandex N.V., NASDAQ | YNDX | 69.29 | 0.33(0.48%) | 603 |
Tesla (TSLA) upgraded to Buy from Sell at DZ Bank; target $750
Raytheon Technologies (RTX) upgraded to Buy from Hold at Argus; target $100
The
Commerce Department released on Thursday its advance estimate for the U.S.
gross domestic product (GDP) for the second quarter of 2021, which revealed the
U.S. economy grew less than expected in the reviewed period.
According
to the estimate, the U.S. real GDP expanded at an annual rate of 6.5 percent
q-o-q last quarter, following a revised 6.3 percent q-o-q growth in the first
quarter (originally a 6.4 percent q-o-q advance), reflecting the continued
economic recovery, reopening of establishments and continued government
response related to the COVID-19 pandemic.
Economists
had expected GDP to increase 8.5 percent q-o-q.
According
to the report, the advance in real GDP in the second quarter reflected gains in
personal consumption expenditures (PCE), nonresidential fixed investment,
exports, and state and local government spending that were partly offset by declines
in private inventory investment, residential fixed investment, and federal
government spending. Meanwhile, imports, which are a subtraction in the
calculation of GDP, went up.
The
data from the Labor Department showed on Thursday the number of applications
for unemployment decreased less than expected last week.
According to the report, the initial claims for unemployment benefits fell by 24,000 to 400,000 for the week ended July 24.
Economists
had expected 380,000 new claims last week.
Claims for the prior week
were revised upwardly to 424,000 from the initial estimate of 419,000.
Meanwhile,
the four-week moving average of jobless claims rose to 394,500 from an upwardly
unrevised 386,500 in the previous week.
As for continuing claims, they increased to 3,269,000
from an upwardly revised 3,262,000 in the previous week.
Altria (MO) reported Q2 FY 2021 earnings of $1.23 per share (versus $1.09 per share in Q2 FY 2020), beating analysts’ consensus estimate of $1.17 per share.
The company’s quarterly revenues amounted to $5.614 bln (+10.9% y/y), beating analysts’ consensus estimate of $5.362 bln.
MO rose to $49.70 (+0.59%) in pre-market trading.
Germany's
Federal Statistical Office (Destatis) reported on Thursday the country’s
consumer price index (CPI) is expected to increase 0.9 percent m-o-m in July after
rising 0.4 percent m-o-m in the previous month.
On
the y-o-y basis, Germany’s CPI is seen to surge 3.8 in July, following a 2.3
percent climb in June. This represents the largest advance since December 1993,
caused, in particular, by the value-added tax effect, as the German government cut the tax rates temporarily in July 2020 as a part of its support to
the pandemic-hurt economy.
Economists
had predicted inflation would rise 0.5 percent m-o-m and 3.3 percent y-o-y in July.
According
to the report, food prices surged 4.3 percent y-o-y in July after a 1.2 percent
y-o-y gain in June. Energy prices jumped 11.6 percent y-o-y after a 9.4 percent
y-o-y climb in the previous month. Services costs rose 2.2 percent y-o-y, accelerating
from 1.6 percent y-o-y in June.
Meanwhile,
the harmonized index of consumer prices for Germany (HICP), which is calculated
for European purposes, is expected to advance 0.5 percent m-o-m and 3.1 percent
y-o-y.
| Time | Country | Event | Period | Previous value | Forecast | Actual |
|---|---|---|---|---|---|---|
| 07:55 | Germany | Unemployment Change | July | -39 | -28 | -91 |
| 07:55 | Germany | Unemployment Rate s.a. | July | 5.9% | 5.8% | 5.7% |
| 08:30 | United Kingdom | Net Lending to Individuals, bln | June | 7.2 | 18.2 | |
| 08:30 | United Kingdom | Consumer credit, mln | June | 0.43 | 0.6 | 0.3 |
| 08:30 | United Kingdom | Mortgage Approvals | June | 86.9 | 86.1 | 81.3 |
| 09:00 | Eurozone | Industrial confidence | July | 12.8 | 13 | 14.6 |
| 09:00 | Eurozone | Consumer Confidence | July | -3.3 | -4.4 | -4.4 |
| 09:00 | Eurozone | Economic sentiment index | July | 117.9 | 118.5 | 119 |
| 12:00 | Germany | CPI, m/m | July | 0.4% | 0.5% | 0.9% |
| 12:00 | Germany | CPI, y/y | July | 2.3% | 3.3% | 3.8% |
USD depreciated against other major currencies in the European session on Thursday, as investors continued to digest the U.S. Federal Reserve’s latest policy statement.
The U.S. Dollar Index (DXY), measuring the U.S. currency's value relative to a basket of foreign currencies, fell 0.33% to 92.02.
At the latest meeting, the Fed’s officials did not make any changes to the central bank’s policy stance, as widely expected, leaving the target range for the fed funds rate near zero and the pace of asset purchases at $120 billion per month.
In their policy statement, the policymakers acknowledged that the U.S. “economy has made progress” towards the Fed’s maximum employment and price stability goals, indicating that changes to the central bank’s stimulus could be coming. But the Fed’s Chair Jerome Powell said there's still some time until “substantial further progress” has been made towards the Fed's employment goal. He also added that the timing of any change in the pace of our asset purchases will depend on the incoming data and the Fed will provide advance notice before any change. Market participants interpreted these remarks as a signal that the Federal Reserve is to remain accommodative and to continue to monitor the incoming data, presumably at least a few more jobs reports, until it decides to begin tapering asset purchases.
FXStreet reports that FX Strategists at UOB Group note that prospects for a test of the 6.5500 area in USD/CNH seem to have lost traction.
24-hour view: “We expected USD to ‘trade between 6.5000 and 6.5330’ yesterday. We did not anticipate a sharp drop to 6.4843. The rapid decline appears to be overdone and USD is unlikely to weaken much further. For today, USD is more likely to trade between 6.4820 and 6.5100.”
Next 1-3 weeks: “We did not anticipate the rapid manner by which USD gave up most of its gains as it plummeted to an overnight low of 6.4843. Upward momentum has been dented and the prospect for USD to move to 6.5500 has diminished. In order to rejuvenate the flagging momentum, USD has to move and stay above 6.5100 within these few days or a break of 6.4820 (no change in ‘strong support’ level) would indicate that USD is not ready to head higher just yet.”
Bert Colijn, a senior economist at ING, notes that the July reading for the economic sentiment for the Eurozone indicates that the region's economic rebound is in full swing, but warns that increasing price expectations confirms the view of significant price pressures and elevated inflation for the rest of the year.
"The increase in sentiment from 117.9 to 119 in July was better than expected and confirms the view of a strong rebound in economic activity. The reopening of economies is boosting service sector activity, and manufacturing continues to perform strongly. The two main risks to the outlook are the increasing impact from supply chain problems in manufacturing and the surge of the Delta variant for services."
"Order books continue to fill rapidly for industry, while the stock of finished products is falling rapidly. Production expectations are falling slightly, which indicates that worries among businesses about whether production can keep up with demand are increasing a little. The outlook remains bright for manufacturing given the order inflow, but production is set to be more spread out as shortages are causing production hiccups."
"The Delta variant caused consumer confidence to tick down in July and we also see this uncertainty among service sector businesses. While improvements occurred in recent service sector activity, expectations about the months ahead declined somewhat again, no doubt as concerns over the delayed easing of measures surfaced with new cases of the virus on the rise."
"The price outlook also continues to show significant pressures with higher consumer expectations of inflation and selling price expectations increasing in services. For manufacturers, selling price expectations ticked down slightly in July, but remain elevated. This suggests that goods and services inflation are set to rise further over the months ahead, keeping inflation elevated despite lower energy inflation contributions."
Int'l Paper (IP) reported Q2 FY 2021 earnings of $1.06 per share (versus $0.77 per share in Q2 FY 2020), beating analysts’ consensus estimate of $1.05 per share.
The company’s quarterly revenues amounted to $5.616 bln (+15.4% y/y), roughly in line with analysts’ consensus estimate of $5.616 bln.
IP closed Wednesday's trading session at $58.50 (-0.41%).
FXStreet reports that FX Strategists at UOB Group note that USD/JPY could likely trade within the 109.20/110.60 range in the next weeks.
24-hour view: “We expected USD to ‘consolidate and trade between 109.50 and 110.10’ yesterday. However, it popped up to 110.28 before dropping back down. The underlying tone appears to have weakened somewhat and USD could edge lower but any decline is not expected to break the support at 109.50.”
Next 1-3 weeks: “Our update from yesterday (28 Jul, spot at 109.85) still stands. As highlighted, the recent choppy price actions have resulted in a mixed outlook and USD could trade within a 109.20/110.60 range for now.”
Merck (MRK) reported Q2 FY 2021 earnings of $1.31 per share (versus $1.02 per share in Q2 FY 2020), missing analysts’ consensus estimate of $1.35 per share.
The company’s quarterly revenues amounted to $11.402 bln (+21.9% y/y), beating analysts’ consensus estimate of $11.203 bln.
MRK fell to $78.07 (-0.33%) in pre-market trading.
FXStreet reports that Karen Jones, Team Head FICC Technical Analysis Research, suggests that a move to the 200-day SMA in the 0.7230-region in AUD/USD still remains on the cards.
“AUD/USD has seen only a tepid correction higher, which has remained contained by the 20-day ma at .7423 and the resistance line at .7423, leaving the market on the defensive.”
“While capped here, we target initially the 200 week ma at .7232. Longer-term there is scope for .7054/.6991.”
Qualcomm (QCOM) reported Q3 FY 2021 earnings of $1.92 per share (versus $0.86 per share in Q3 FY 2020), beating analysts’ consensus estimate of $1.68 per share.
The company’s quarterly revenues amounted to $7.995 bln (+63.5% y/y), beating analysts’ consensus estimate of $7.563 bln.
QCOM rose to $146.01 (+2.51%) in pre-market trading.

FXStreet reports that in the opinion of UOB Group’s FX Strategists, NZD/USD is forecast to keep trading within the 0.6900-0.7010 range in the next weeks.
24-hour view: “While we expected NZD to weaken yesterday, we were of the view that ‘a break of the major support at 0.6920 is unlikely’. However, NZD dropped briefly to 0.6900 before snapping back up. The sharp rebound appears to be running ahead of itself and is unlikely to extend much further. Overall, NZD is more likely to trade between 0.6930 and 0.6975.”
Next 1-3 weeks: “While NZD dropped below the bottom of our expected range at 0.6920 during NY hours yesterday (low of 0.6900), the decline was short-lived as NZD rebounded strongly. The price actions suggest that NZD is not ready to embark on a sustained directional move just yet. In other words, NZD could continue to range trade, albeit likely within a lower range of 0.6900/0.7010.”
Ford Motor (F) reported Q2 FY 2021 earnings of $0.13 per share (versus -$0.35 per share in Q2 FY 2020), beating analysts’ consensus estimate of $0.04 per share.
The company’s quarterly revenues amounted to $24.128 bln (+45.1% y/y), beating analysts’ consensus estimate of $22.826 bln.
F rose to $14.50 (+4.62 %) in pre-market trading.

Facebook (FB) reported Q2 FY 2021 earnings of $3.61 per share (versus $1.80 per share in Q2 FY 2020), beating analysts’ consensus estimate of $3.02 per share.
The company’s quarterly revenues amounted to $29.077 bln (+55.6% y/y), beating analysts’ consensus estimate of $27.890 bln.
FB fell to $358.00 (-4.09%) in pre-market trading.

FXStreet reports that Karen Jones, Team Head FICC Technical Analysis Research, assess the performance of the US 10Y yields.
“The US 10Y yield dropped to the February 10 low at 1.12 before bouncing off it last week. Since this fall was accompanied by positive divergence on the daily RSI we expect further consolidation around the 200 day moving average at 1.28 to unfold over the coming days.”
“While resistance at 1.43/46 (the May low and mid-July high) caps, however, overall downside pressure should retain the upper hand.”
“Below the recent low at 1.12 lies major psychological support, the 61.8% Fibonacci retracement and the late January low at 1.00/0.99.”
Reuters reports that China’s state media said yuan-denominated assets remain attractive and that short-term market panic does not represent long-term value, the latest official effort to shore up investor confidence.
“In general, investment institutions generally believe that the current market correction is still a short-term event shock, rather than a reversal caused by changes in fundamentals,” the China Securities Journal said in a front-page commentary.
“The broad investment trend in favor of yuan-denominated assets will not be reversed.”
It added “speaking from fundamental perspective, China’s economy remained steadily improving and on a positive trend, while earnings expectations of listed companies have improved substantially.”
Regulatory moves aimed at the education, property and technology sectors sparked heavy selling earlier this week in Chinese markets, and have left global investors bruised and uncertain over the outlook for investment in Chinese firms.
According to the report from European Commission, in July 2021, the Economic Sentiment Indicator (ESI) increased for the sixth time in a row in both the EU (+0.9 points) and the euro area (+1.1 points). The current level (118.0 in the EU, 119.0 in the euro area) is the highest on record (i.e. since 1985). Compared to the last months, the latest improvement was much weaker, suggesting that the indicator is approaching its peak. The Employment Expectations Indicator (EEI) stayed flat, at 111.6 points (EU) / 111.7 points (euro area), well above its pre-pandemic level.
In the EU, the ESI’s increase in July was driven by improving confidence in industry and services, while confidence weakened in construction and among consumers and remained virtually unchanged in retail trade.
Amongst the largest EU economies, the ESI rose sharply in France (+4.0) and, to a lesser extent, in Italy (+1.7) and Spain (+1.7). Sentiment in Germany (+0.3) and the Netherlands (-0.3) stayed virtually unchanged, while it deteriorated mildly in Poland (-0.7).
The Employment Expectations Indicator stayed flat (+0.0), as more optimistic employment plans in industry (approaching an all-time high) and retail trade coincided with more cautious reassessments of plans in services and construction. Consumers’ unemployment expectations, which are not included in the headline EEI, edged up, after they had reached their lowest level in two years in June.
According to the report from Bank of England, the net mortgage borrowing reached a record high of £17.9 billion in June, just before the lower stamp duty rates began to taper off from July. Mortgage approvals for house purchase were 81,300 in June, down from 86,900 in April.
Consumers borrowed £0.3 billion as consumer credit, on net. The effective rate on new personal loans remained low at 5.67%, compared to 7.03% in January 2020.
Households’ net flow in to deposit accounts increased in June, to £9.8 billion. Deposit interest rates continued to fall slightly to new historically low levels.
Large businesses borrowed £0.8 billion from banks in June, whilst small and medium sized businesses repaid £0.3 billion. Private non-financial companies redeemed £0.8 billion of finance from capital markets in June, compared to a monthly average net issuance of £3.3 billion since March 2020.
Reuters reports that according to the report from the Labour Office, German unemployment fell in July as companies hired more staff in light of a recovery in Europe’s largest economy.
The number of people out of work fell by 91,000 in seasonally adjusted terms to 2.598 million. Economists had forecast a fall of 28,000. The seasonally adjusted jobless rate fell to 5.7% from 5.9% in June.
“Unemployment and underemployment have continued to fall sharply since the start of the summer break,” Labour Office head Detlef Scheele said in a statement. “Companies are increasingly looking to hire new staff.”
The release of the jobless figures followed the publication on Monday of a survey showing German business morale fell unexpectedly in July on continuing supply chain worries and amid rising coronavirus infections.
FXStreet reports that FX Strategists at UOB Group said that cable’s upside momentum carries the potential to re-test the mid-1.3900s in the short-term horizon.
24-hour view: Our expectation for GBP to move above 1.3915 yesterday did not materialize as it dropped to 1.3845 before snapping back up to 1.3912. The underlying tone still appears to be a tad firm and we continue to see chance for GBP to move above 1.3915. Barring a strong surge in momentum, the next resistance at 1.3955 is likely out of reach. On the downside, a breach of 1.3850 (minor support is at 1.3875) would indicate that the current mild upward pressure has eased.”
| Time | Country | Event | Period | Previous value | Forecast | Actual |
|---|---|---|---|---|---|---|
| 01:00 | New Zealand | ANZ Business Confidence | July | -0.6 | -3.8 | |
| 01:30 | Australia | Export Price Index, q/q | Quarter II | 11.2% | 13.2% | |
| 01:30 | Australia | Import Price Index, q/q | Quarter II | 0.2% | 1.9% |
During today's Asian trading, the US dollar declined against the euro, the pound and the australian dollar, and was almost unchanged against the yen after the Federal Reserve System (Fed) meeting.
The Federal Reserve said that the US economy continues to recover, despite the renewed increase in the incidence of COVID-19, and the Central Bank does not intend to rush to curtail stimulus measures. The Fed kept the base rate in the range of 0-0. 25% per annum and promised to continue to buy back assets totaling $120 billion every month, "until significant progress is made in moving towards the goals of maximum employment and price stability". The leaders of the Federal Reserve made it clear that they have made progress in discussing the issue of reducing the volume of asset repurchases, but still have not decided when to start reducing them.
Fed Chairman Jerome Powell admitted that this year consumer prices in the United States are growing much faster than he and other representatives of the Federal Reserve predicted. Inflation "may turn out to be higher and more stable than we expected," Powell said. At the same time, he noted that the increase in inflation in the United States is temporary, and as soon as the economy returns to normal, consumer prices are likely to decline.
The ICE index, which tracks the dynamics of the dollar against six currencies (euro, swiss franc, yen, canadian dollar, pound sterling and swedish krona), fell by 0.16%.
According to the report from Insee, in June 2021, the industrial producer prices accelerated over a month (+1.0% after +0.4%), both on the home market (+1.1% after +0.4%) and the foreign markets (+1.0% after +0.3%). Year on year, they kept rising strongly (+7.1% after +6.7%), as a consequence of the low prices observed in the spring of 2020 in connection with the health crisis, but also as a result of the recent surges in some raw material prices due to the economic recovery.
The industrial producer prices for the home market rose by 1.1% in June 2021 (after +0.4%), driven up equally by those of manufactured products (+0.8% after +0.7%) and those of mining and quarrying products, energy and water. Year on year, they rose by 7.5% in June 2021 (after +7.2%).
In June 2021, the prices of mining and quarrying products, energy and water rose by 2.3% over a month (after –0.6%). Electricity production and trade prices bounced back (+2.2% after –3.5%), while those of trade services of gas through mains kept rising sharply (+6.8% after +6.9%), following the upward adjustment of regulated tariffs. Year on year, the prices of mining and quarrying products, energy and water rose by 12.8% (after +10.7%).
In the wake of crude oil prices, the prices of refined petroleum products sped up (+7.7% over a month in June 2021, after +3.3%). Over a year, they slowed down but continued to rise sharply (+62.8% after +92.3%).
According to the report from the Society of Motor Manufacturers and Traders (SMMT), UK car factories turned out 69,097 units in June. While this was a rise compared with the Covid-depressed June 2020, it still represents the worst June total since 1953 as the global chip shortage, caused by the pandemic, and other factors continued to take a toll on production.
The performance rounded off a turbulent first six months for UK car production, with the pandemic, new trading rules with Europe and supply issues causing ongoing challenges. 498,923 units rolled off production lines, down -38.4% on the five-year, first-half average representing a loss of 311,160 cars worth more than £8.5billion. This reflects how far the sector must go before it can talk about recovery.
Exports continued to sustain British car manufacturing with more than eight in ten (83.4%) models made here so far this year shipped overseas. More than half of these (51.7%) headed into the EU, with the US the UK’s next most important global market (taking 18.8% of exports) followed by China (7.8%), Japan (1.9%) and Australia (1.8%).
Mike Hawes, SMMT Chief Executive, said: "While the UK automotive industry continues to suffer the effects of the global pandemic, with first half year production down significantly and a tough few months looming, the sector has the capability to recover. The latest investments into new models and battery production show a bright future is within reach, yet the industry still faces headwinds most notably from global semiconductor shortages and staff absenteeism as a result of staff being ‘pinged’.Operating conditions are still challenging, highlighting the need for specific actions to help competitiveness, such as creating a Build Back Better Fund and the alleviation of high energy costs, to get the sector back on track and towards the volumes that make UK facilities viable".
EUR/USD
Resistance levels (open interest**, contracts)
$1.1923 (2025)
$1.1893 (1744)
$1.1873 (1104)
Price at time of writing this review: $1.1861
Support levels (open interest**, contracts):
$1.1826 (681)
$1.1806 (2435)
$1.1776 (2210)
Comments:
- Overall open interest on the CALL options and PUT options with the expiration date August, 6 is 65995 contracts (according to data from July, 28) with the maximum number of contracts with strike price $1,1700 (10562);
GBP/USD
$1.4110 (1141)
$1.4030 (1752)
$1.3971 (1194)
Price at time of writing this review: $1.3937
Support levels (open interest**, contracts):
$1.3861 (979)
$1.3808 (293)
$1.3774 (687)

Comments:
- Overall open interest on the CALL options with the expiration date August, 6 is 15507 contracts, with the maximum number of contracts with strike price $1,4000 (1752);
- Overall open interest on the PUT options with the expiration date August, 6 is 18718 contracts, with the maximum number of contracts with strike price $1,3400 (1683);
- The ratio of PUT/CALL was 1.21 versus 1.18 from the previous trading day according to data from July, 28
* - The Chicago Mercantile Exchange bulletin (CME) is used for the calculation.
** - Open interest takes into account the total number of option contracts that are open at the moment.
FXStreet reports that FX Strategists at UOB Group noted the upside momentum in EUR/USD is expected to meet solid resistance in the vicinity of 1.1900.
Next 1-3 weeks: “Two days ago, we noted that downward pressure has dissipated and we expected EUR to trade within a 1.1750/1.1860 range for a period of time. Since then, upward momentum has improved slightly and EUR could move above 1.1860 but at this stage, any advance is expected to face solid resistance at 1.1895. On the downside, a break of 1.1770 (‘strong support’ level) would indicate that the current mild upward pressure has eased.”
RTTNews reports that the Federal Open Market Committee left the target range for its federal funds rate unchanged at 0 to 0.25 percent, and said it will continue with its $120 billion-a-month bond-buying program.
The bank, which said the economy is strengthening despite concerns over the spread of the coronavirus, stressed that progress on vaccinations will likely continue to reduce the effects of the public health crisis on the economy. However, it added that risks to the economic outlook remain.
"The sectors most adversely affected by the pandemic have shown improvement but have not fully recovered" noted the central bank's post-meeting statement. "Inflation has risen, largely reflecting transitory factors. Overall financial conditions remain accommodative, in part reflecting policy measures to support the economy and the flow of credit to U.S. households and businesses."
Noting that there has been progress towards the central bank's goals on employment and inflation, the bank's statement says changes to policy with regard to monthly bond purchases could be on the way.
| Raw materials | Closed | Change, % |
|---|---|---|
| Brent | 74.26 | -0.03 |
| Silver | 24.939 | 1.01 |
| Gold | 1806.927 | 0.36 |
| Palladium | 2620.9 | 1.13 |
| Time | Country | Event | Period | Previous value | Forecast |
|---|---|---|---|---|---|
| 01:00 (GMT) | New Zealand | ANZ Business Confidence | July | -0.6 | |
| 01:30 (GMT) | Australia | Export Price Index, q/q | Quarter II | 11.2% | |
| 01:30 (GMT) | Australia | Import Price Index, q/q | Quarter II | 0.2% | |
| 07:55 (GMT) | Germany | Unemployment Change | July | -38 | -28 |
| 07:55 (GMT) | Germany | Unemployment Rate s.a. | July | 5.9% | 5.8% |
| 08:30 (GMT) | United Kingdom | Net Lending to Individuals, bln | June | 6.9 | |
| 08:30 (GMT) | United Kingdom | Consumer credit, mln | June | 0.28 | 0.6 |
| 08:30 (GMT) | United Kingdom | Mortgage Approvals | June | 87.5 | 86.1 |
| 09:00 (GMT) | Eurozone | Industrial confidence | July | 12.7 | 13 |
| 09:00 (GMT) | Eurozone | Consumer Confidence | July | -3.3 | -4.4 |
| 09:00 (GMT) | Eurozone | Economic sentiment index | July | 117.9 | 118.5 |
| 12:00 (GMT) | Germany | CPI, m/m | July | 0.4% | 0.5% |
| 12:00 (GMT) | Germany | CPI, y/y | July | 2.3% | 3.3% |
| 12:30 (GMT) | U.S. | Continuing Jobless Claims | July | 3236 | 3196 |
| 12:30 (GMT) | U.S. | Initial Jobless Claims | July | 419 | 380 |
| 12:30 (GMT) | U.S. | PCE price index, q/q | Quarter II | 3.7% | |
| 12:30 (GMT) | U.S. | GDP, q/q | Quarter II | 6.4% | 8.5% |
| 14:00 (GMT) | U.S. | Pending Home Sales (MoM) | June | 8% | |
| 22:45 (GMT) | New Zealand | Building Permits, m/m | June | -2.8% | |
| 23:30 (GMT) | Japan | Unemployment Rate | June | 3% | 3% |
| 23:50 (GMT) | Japan | Retail sales, y/y | June | 8.2% | 0.2% |
| 23:50 (GMT) | Japan | Industrial Production (MoM) | June | -5.9% | 5% |
| 23:50 (GMT) | Japan | Industrial Production (YoY) | June | 21.1% |
| Pare | Closed | Change, % |
|---|---|---|
| AUDUSD | 0.73734 | 0.25 |
| EURJPY | 130.157 | 0.37 |
| EURUSD | 1.18421 | 0.23 |
| GBPJPY | 152.806 | 0.31 |
| GBPUSD | 1.39035 | 0.17 |
| NZDUSD | 0.69565 | 0.03 |
| USDCAD | 1.25219 | -0.61 |
| USDCHF | 0.90987 | -0.41 |
| USDJPY | 109.91 | 0.14 |


© 2000-2026. Sva prava zaštićena.
Sajt je vlasništvo kompanije Teletrade D.J. LLC 2351 LLC 2022 (Euro House, Richmond Hill Road, Kingstown, VC0100, St. Vincent and the Grenadines).
Svi podaci koji se nalaze na sajtu ne predstavljaju osnovu za donošenje investicionih odluka, već su informativnog karaktera.
The company does not serve or provide services to customers who are residents of the US, Canada, Iran, The Democratic People's Republic of Korea, Yemen and FATF blacklisted countries.
Izvršenje trgovinskih operacija sa finansijskim instrumentima upotrebom marginalne trgovine pruža velike mogućnosti i omogućava investitorima ostvarivanje visokih prihoda. Međutim, takav vid trgovine povezan je sa potencijalno visokim nivoom rizika od gubitka sredstava. Проведение торговых операций на финанcовых рынках c маржинальными финанcовыми инcтрументами открывает широкие возможноcти, и позволяет инвеcторам, готовым пойти на риcк, получать выcокую прибыль, но при этом неcет в cебе потенциально выcокий уровень риcка получения убытков. Iz tog razloga je pre započinjanja trgovine potrebno odlučiti o izboru odgovarajuće investicione strategije, uzimajući u obzir raspoložive resurse.
Upotreba informacija: U slučaju potpunog ili delimičnog preuzimanja i daljeg korišćenja materijala koji se nalazi na sajtu, potrebno je navesti link odgovarajuće stranice na sajtu kompanije TeleTrade-a kao izvora informacija. Upotreba materijala na internetu mora biti praćena hiper linkom do web stranice teletrade.org. Automatski uvoz materijala i informacija sa stranice je zabranjen.
Ako imate bilo kakvih pitanja, obratite nam se pr@teletrade.global.
транcфери