- Analytics
- News and Tools
- Market News
Analytics, News, and Forecasts for CFD Markets: currency news — 20-03-2024.
- AUD up 0.83% vs. USD after Fed holds policy steady.
- Wall Street up, praises US economy, labor strength post-Fed.
- US 10-year yield dips, Dollar Index down, hints AUD/USD rise.
- Mixed Australia PMI, strong job outlook may sway RBA policy.
The Australian Dollar soared 0.83% against the US Dollar on Wednesday as the Federal Reserve held rates steady while maintaining their monetary policy outlook from last year, with 75 basis points (bps) of rate cuts in 2024. As the Asian session begins, the pair trades at 0.6595, up 0.14%.
Aussie Dolar gains momentum amid the beginning of Asia session
Wall Street ended the session on a higher note following the Fed’s decision. The US central bank kept the Federal Funds rate (FFR) at 5.25%- 5.50% and stated that the economy and the jobs market are robust. The disinflation process had evolved, but the last two readings of the CPI and PPI justified the Fed’s rhetoric of being patient. Despite that, Fed officials stick to their three rate cuts in 2024.
Following the data, the US 10-year Treasury note yield fell one and a half basis points to 4.277%, while the Greenback got battered. The US Dollar Index (DXY), a gauge of the buck’s value against other currencies, tumbles 0.42% and sits at 103.38, aiming below the 200-day moving average (DMA), a key dynamic support level, that depicts a financial markets asset as bullish or bearish.
On the Aussies' front, the schedule featured the release of Judo Bank Flash PMI figures for March. The manufacturing PMI dipped from 47.8 to 46.8, while the Services PMI rose from 53.1 to 53.5. The Composite Index came at 52.4, up from 52.1.
AUD/USD traders’ eye further data from Australia, with the jobs market expected to add 40,000 people to the workforce. That would lower the unemployment rate, from 4.1% to 4%. A strong reading could suggest the Reserve Bank of Australia (RBA) should stick to its current stance and shrug off speculations of the first-rate cut in August.
AUD/USD Price Analysis: Technical outlook
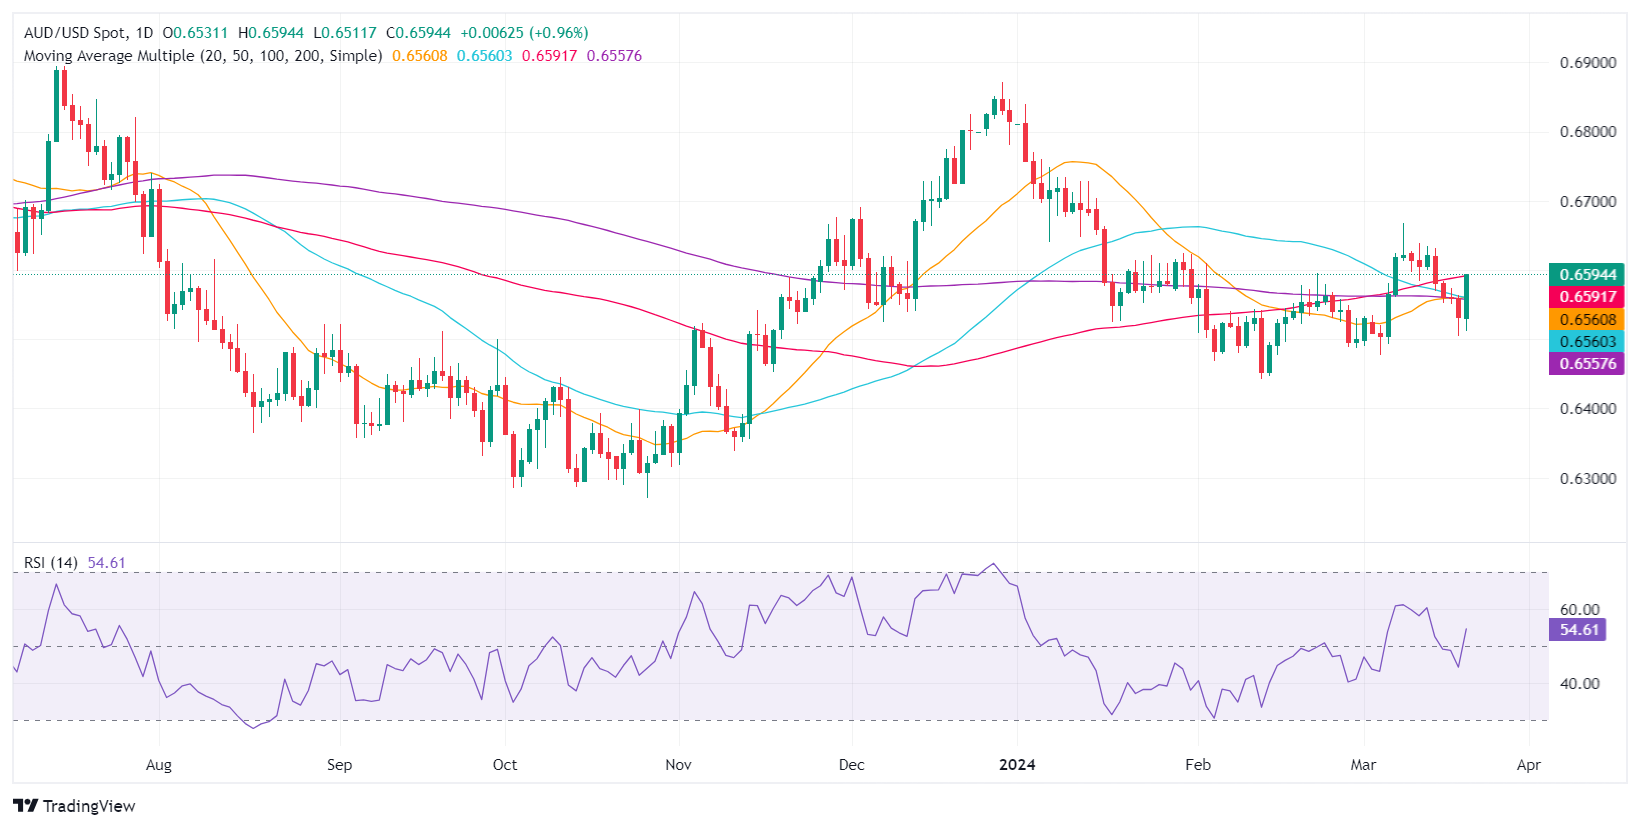
From a technical perspective, the AUD/USD printed a leg-up, clearing key resistance levels and poised to breach the 0.6600 figure. The Relative Strength Index (RSI) confirms that statement, as it aims higher in bullish territory, with the pair closing at weekly highs, snapping four days of losses. The next supply zone would be the psychological 0.6650 mark, followed by the March 8 high at 0.6667. Once cleared, that would expose 0.6700.
Australia's Judo Bank Purchasing Managers Index (PMI) came in mixed in the early Thursday market session, with a lift in the Services component mixing with an easing in the Manufacturing PMI.
Judo Bank's March Manufacturing PMI ticked down to 46.8 after the previous month's 47.8, while the Services component rose to 53.5 from the previous 53.1. The Composite March Judo Bank PMI rose to 52.4 from 52.1.
According to Warren Hogan, Chief Economic Advisor at Judo Bank: "Over the survey's nine-year history, this is the largest four-month increase in the Composite Output index outside of the two recovery periods when the economy was locked down during the pandemic."
Warren added, "The underlying details of the survey highlight that the improvement in business performance in 2024 is not even across the economy. Manufacturing activity remains soft in early 2024, with the Australian Manufacturing PMI down to a new cyclical low point well below 50.0".
Warren also noted that underlying details about Australia's manufacturing sector may be irrelevant to the country's overall economic outlook, as manufacturing accounts for less than 10% of Australia's economy.
Market reaction
AUD/USD stepped into a fresh near-term high as markets head into the Thursday market session, with the pair approaching 0.6600 following a Fed-fueled rally from Wednesday's early lows near 0.6510.
AUD/USD 5-minute chart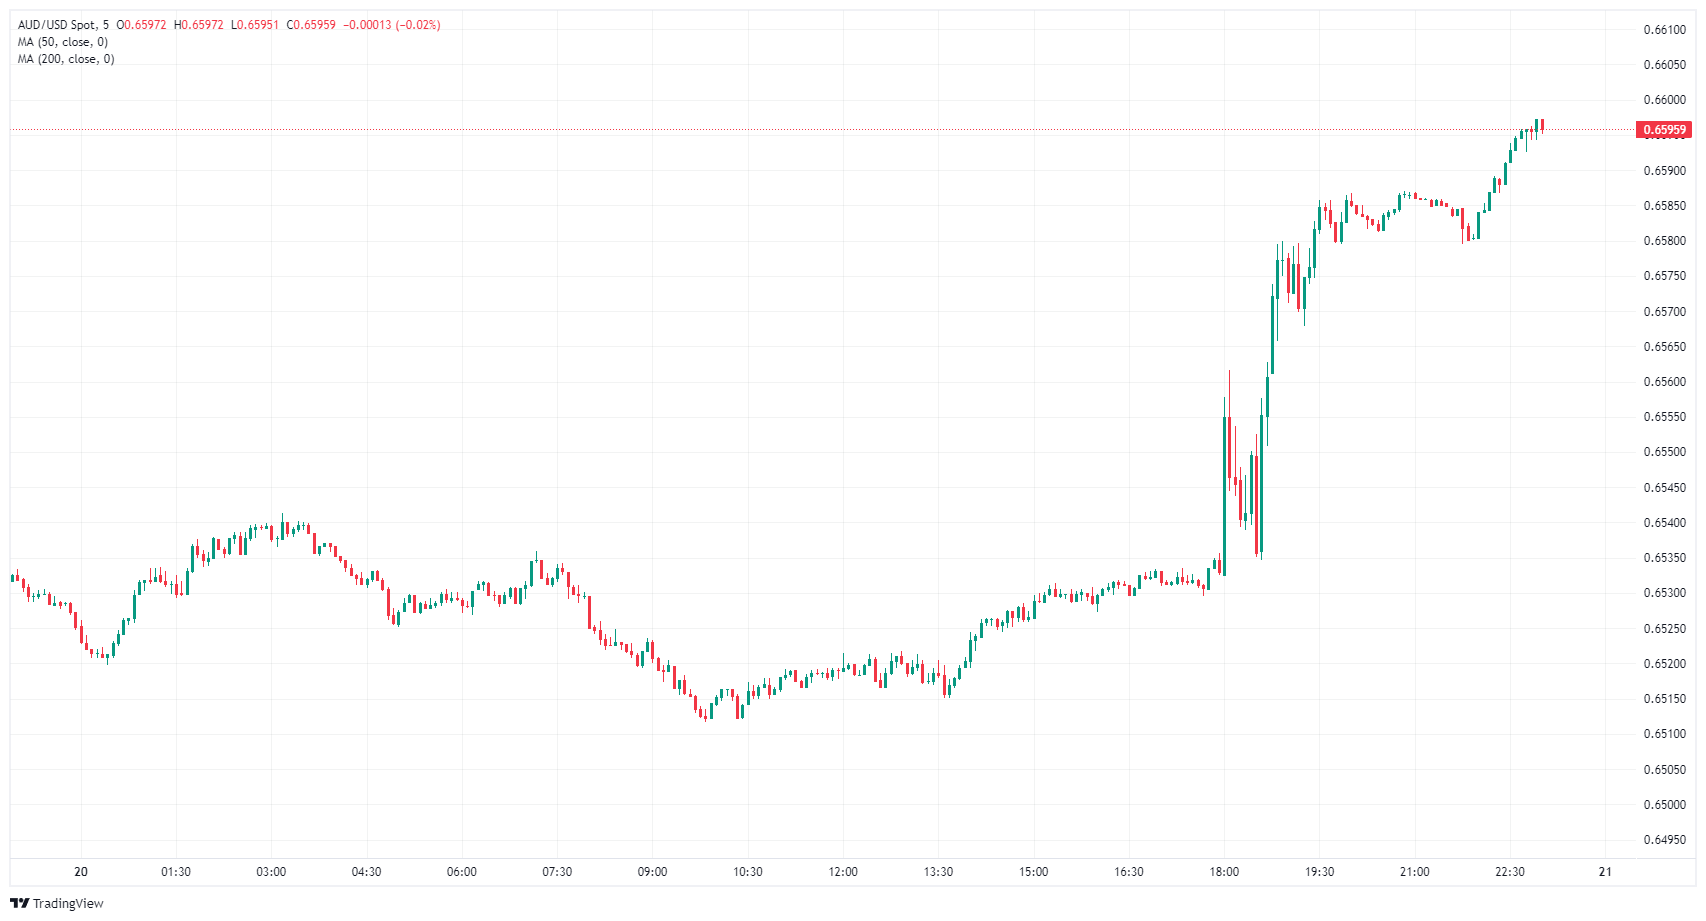
About Australia's Judo Bank Composite PMI
The Composite Purchasing Managers Index (PMI), released on a monthly basis by Judo Bank and S&P Global, is a leading indicator gauging private-business activity in Australia for both the manufacturing and services sectors. The data is derived from surveys to senior executives. Each response is weighted according to the size of the company and its contribution to total manufacturing or services output accounted for by the sub-sector to which that company belongs. Survey responses reflect the change, if any, in the current month compared to the previous month and can anticipate changing trends in official data series such as Gross Domestic Product (GDP), industrial production, employment and inflation. The index varies between 0 and 100, with levels of 50.0 signaling no change over the previous month. A reading above 50 indicates that the Australian private economy is generally expanding, a bullish sign for the Australian Dollar (AUD). Meanwhile, a reading below 50 signals that activity is generally declining, which is seen as bearish for AUD.
- NZD/USD gains ground around 0.6090 on the weaker USD.
- New Zealand's GDP for Q4 came in at -0.1% QoQ vs. -0.3% prior, weaker than expected.
- The Fed held interest rates steady at its March meeting on Wednesday, as widely expected.
- The US S&P Global PMI for March will be due on Thursday.
The NZD/USD pair trades on a stronger note below the 0.6100 mark during the early Asian session on Thursday. The decline of the US Dollar (USD) after the Federal Reserve (Fed) left its interest rates unchanged and Fed Chair Jerome Powell delivered a dovish message to provide some support to the pair. NZD/USD currently trades around 0.6090, gaining 0.15% on the day.
The latest data from Statistics New Zealand on Thursday showed that the nation’s GDP growth number contracted 0.1% QoQ in the fourth quarter from the previous reading of 0.3% contraction. The Annualized GDP for Q4 shrank 0.3% YoY from the 0.6% contraction in the previous reading. Both figures came in worse than market expectations, which might cap the upside of the New Zealand Dollar (NZD).
On the other hand, the Fed held the rate steady at 5.25–5.50% at its March meeting on Wednesday, with the median dot plot for 2024 unchanged from the 75 basis points (bps) of cuts shown in the December projections. During the press conference, Fed Chair Jerome Powell stated that a strong labour market Data wouldn’t deter the central bank from cutting rates. Powell emphasized that the central bank will wait for more data that inflation is sustainably moderating toward its 2% target.
Furthermore, Fed’s Powell reiterated that policymakers still intend to cut rates before the end of this year, given economic growth continues. The dovish comments from Powell exert some selling pressure on the Greenback and create a tailwind for NZD/USD.
Looking ahead, traders will keep an eye on the preliminary US S&P Global Purchasing Managers Index (PMI) for March, the weekly Initial Jobless Claims and Existing Home Sales. On Friday, New Zealand’s Trade Balance will be released.
New Zealand's Gross Domestic Product (GDP) contracted another -0.1% in the fourth quarter, recovering from the previous quarter's -0.3% but missing the median market forecast of an increase of 0.1%.
Annualized YoY GDP in Q4 also missed the mark, coming in at -0.3%. Annualized quarterly GDP bounced from the previous print of -0.6%, but failed to hit the market's forecast 0.1%.
According to national accounts industry and production senior manager Ruvani Ratnayake, "Wholesale trade was the largest downwards driver this quarter, led by falls in grocery and liquor wholesaling; and machinery and equipment wholesaling."
Ruvani Ratnayake continued, "Increased activity associated with the NZ General Election contributed to growth in public administration, safety, and defence."
Market reaction
The NZD/USD pair saw a quick drop when the GDP print missed the mark, declining into 0.6055 in early Thursday trading. The pair initially rallied on Wednesday after the Fed held rates but tilted its head at future rate cuts, driving Kiwi to an intraday high of 0.6085.
About New Zealand's quarterly GDP
The Gross Domestic Product (GDP), released by Statistics New Zealand, highlights the overall economic performance on a quarterly basis. The gauge has a significant influence on the Reserve Bank of New Zealand’s (RBNZ) monetary policy decision, in turn affecting the New Zealand dollar. A rise in the GDP rate signifies improvement in the economic conditions, which calls for tighter monetary policy, while a drop suggests deterioration in the activity. An above-forecast GDP reading is seen as NZD bullish.
- The daily chart analysis reveals consistent bullish sentiment with RSI nearing overbought conditions, indicating possible pullbacks.
- The AUD/JPY hourly chart paints a similar picture, with the RSI deep in overbought terrain.
- Even with a potential short-term bearish correction, the AUD/JPY standing above SMA shows an overall bullish trend.
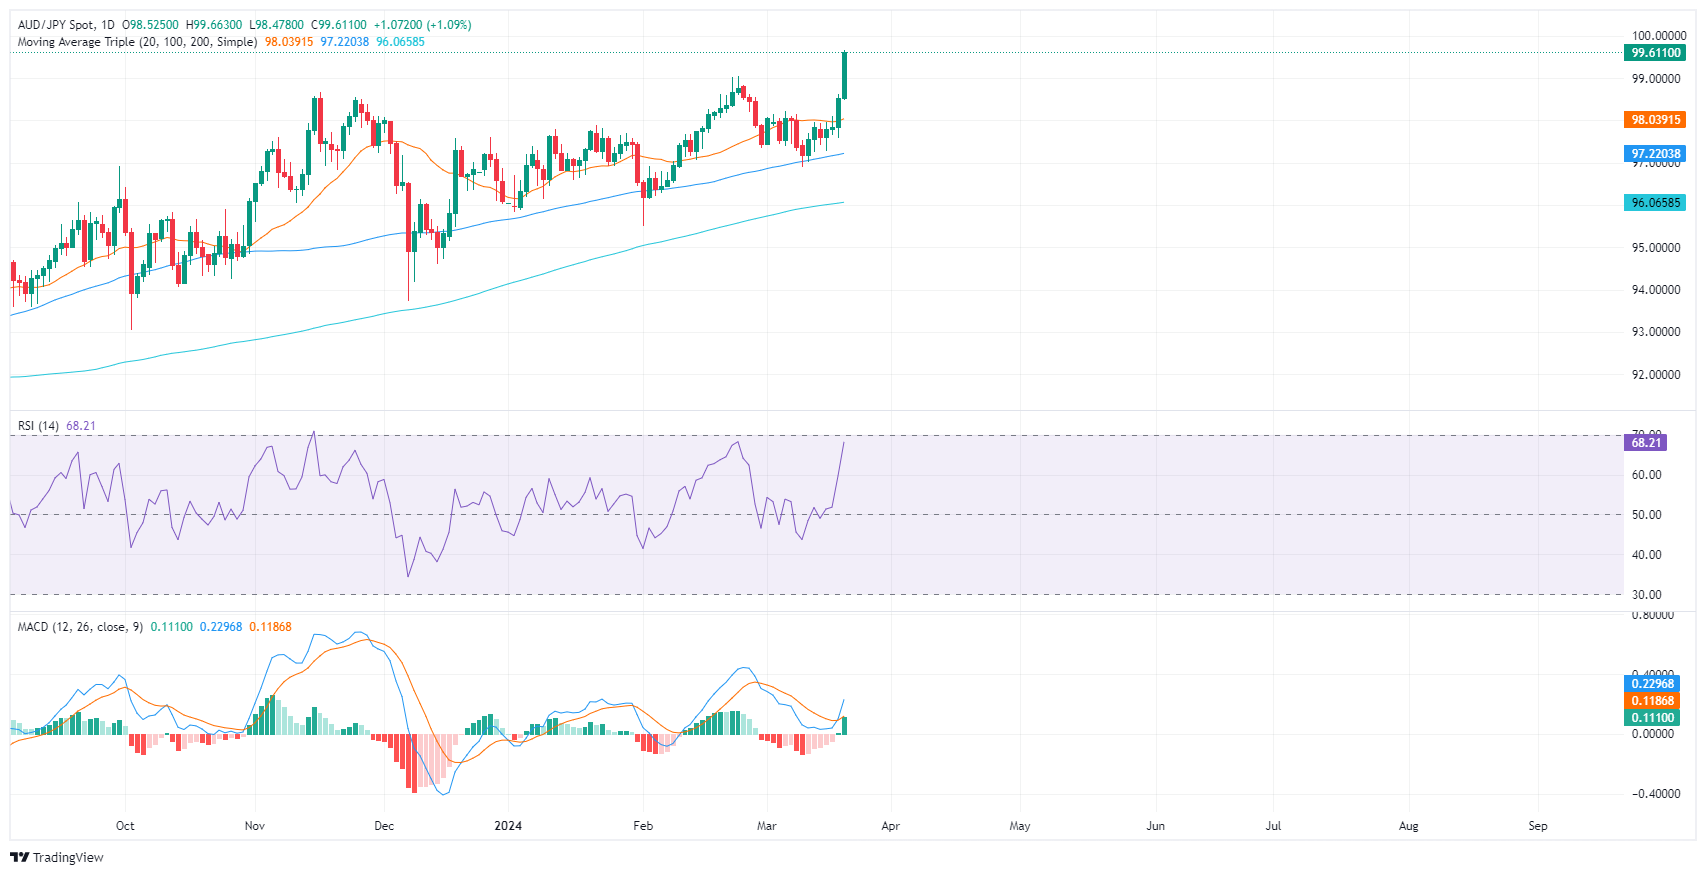
In Wednesday's session, AUD/JPY is experiencing an uptake, trading at 99.62, its highest level since 2014, and showing a gain of 1.15%. Although there are hints of a short-term consolidation incoming, any downward movements could be considered as a mere technical correction.
Based on the indicators of the daily chart for the AUD/JPY pair, a positive trend is seen, as indicated by the positive territory of the Relative Strength Index (RSI). The RSI is nearing the overbought territory, signaling that while the trend is bullish, an increasing risk of a pullback due to overbought conditions is also present. In agreement with this, the Moving Average Convergence Divergence (MACD) histogram also reveals a rising trend, indicated by green bars, corroborating the positive momentum.
AUD/JPY daily chart
Contrarily, on the hourly chart, the AUD/JPY pair shows a sharp move into the overbought territory, as indicated by the RSI of 78. This demonstrates that the pair might face a corrective pullback in the short term given these extreme over-extended conditions. The MACD histogram also confirms this, as it continues to print green bars.
AUD/JPY hourly chart
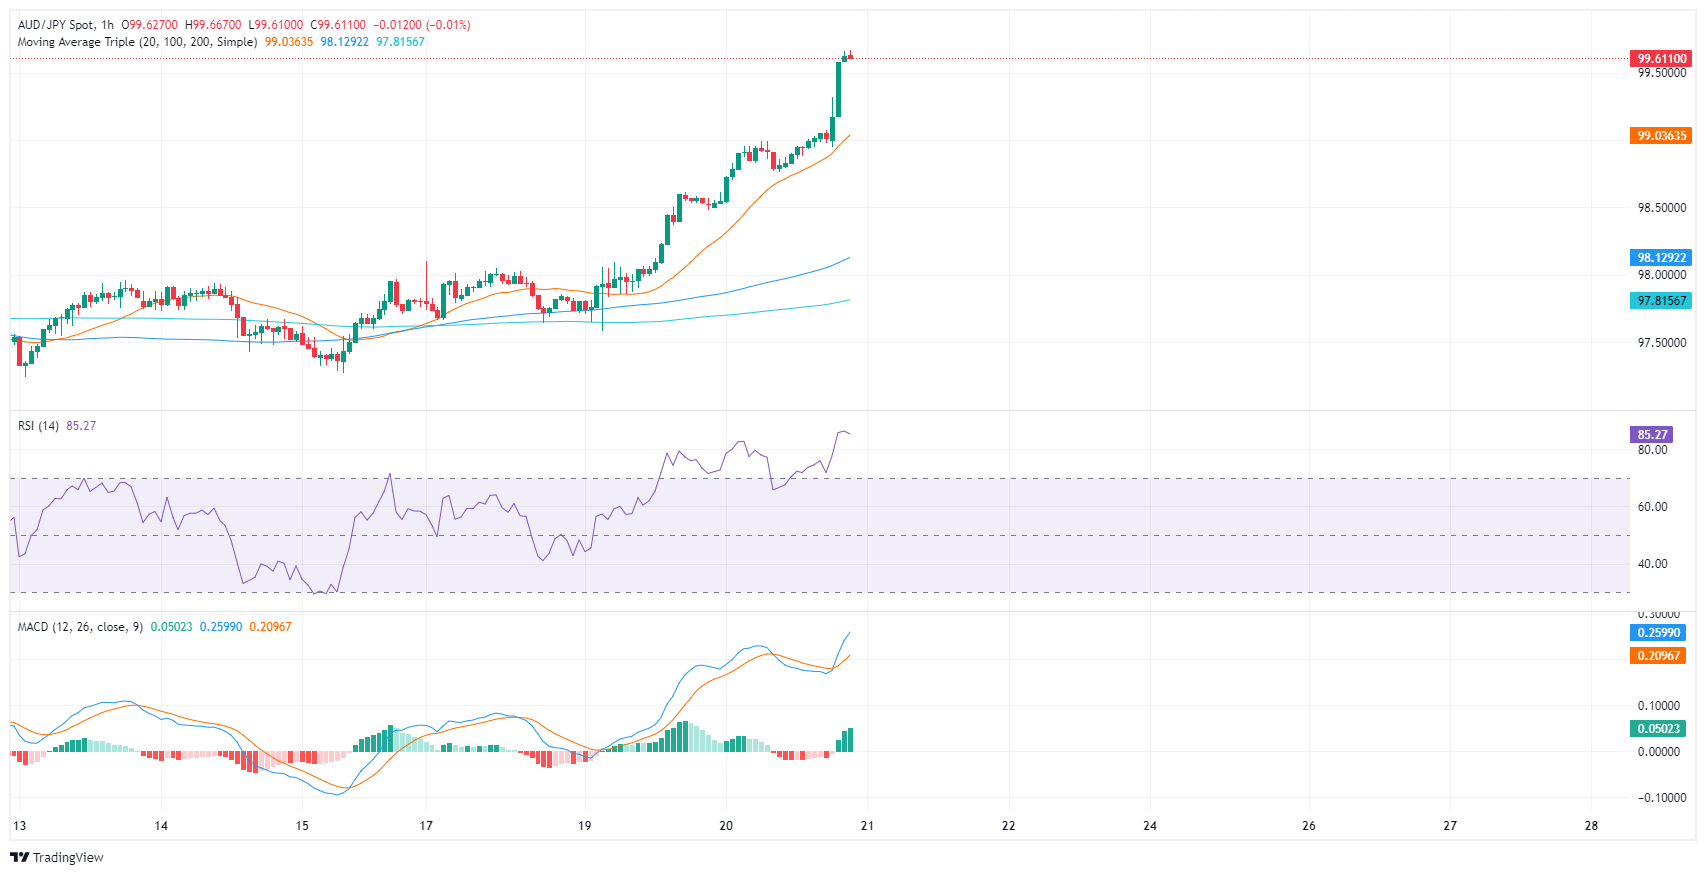
These observations generally point towards bullish conditions for the AUD/JPY pair in the short term but buyers might consider taking profits in the next sessions. On a broader perspective, buyers are also in command as the pair trades above the 20,100 and 200-day Simple Moving Averages (SMAs).
- The Australian Unemployment Rate is expected to have eased to 4% in February.
- Employment Change is foreseen to bounce after January's disappointing 0.5K increase.
- AUD/USD turned marginally bullish near-term following the Federal Reserve’s decision.
Australia is scheduled to release the February monthly employment report on Thursday, following the Reserve Bank of Australia (RBA) monetary policy decision on Tuesday. The Australian Bureau of Statistics (ABS) is expected to announce that the economy added 40K new job positions in February, while the seasonally adjusted Unemployment Rate is foreseen at 4%, easing from 4.1% in January. The Australian Dollar (AUD) heads into the event with a weak tone, trading against the US Dollar at around 0.6570.
Australian Employment Change is divided into full-time and part-time positions. Full-time jobs imply working 38 hours per week or more and usually include additional benefits, but they mostly represent consistent income. On the other hand, part-time employment generally means higher hourly rates but lacks consistency and benefits. That’s why the economy prefers full-time jobs.
In January, the economy shed 10,600 part-time roles and added 11,100 full-time, leaving a measly headline net gain of around 500 jobs for the month.
Meanwhile, the Reserve Bank of Australia (RBA) announced its monetary policy decision on Tuesday. As widely anticipated, the RBA kept the Cash Rate at 4.75% for the third consecutive meeting. Policymakers acknowledged inflation is moderating but added the economic outlook remains uncertain. The decision fell short of impressive and came out alongside the Bank of Japan's (BoJ) decision to drop its ultra-loose monetary policy, hiking rates for the first time in seventeen years. As a result, the US Dollar soared across the board, pushing AUD/USD to a two-week low of 0.6503.
Australian unemployment rate likely to have declined in February
As said, the Unemployment Rate is foreseen at 4% in February, easing from the previous 4.1%, although still higher than the 2023 low of 3.5%. RBA Governor Michele Bullock noted in the press conference following the monetary policy announcement that “The judgement at the moment is the labour market still is slightly on the tight side,” based on the fact that the Unemployment Rate is still lower than it was before the Coronovirus pandemic. Back then, the Unemployment Rate averaged 5% for nearly a decade.
It is worth remembering that the RBA mandate is “to contribute to the stability of the currency, full employment, and the economic prosperity and welfare of the Australian people,” according to the central bank’s own definition. Hence, a bounce in employment stands in the way of rate cuts.
The Australian economy has cooled more than enough with recent interest-rate hikes, and a recession is not out of the picture. In fact, economists believe the November hike accelerated the slowdown and may have been excessive. If unemployment continues to rise, the RBA would be forced into early rate cuts.
That said, a lower-than-anticipated Unemployment Rate will allow Australian policymakers to maintain rates higher for longer, which, conversely, will mean higher risks for an economic setback.
Wage growth in the country is reported separately. The Australian ABS releases the Wage Price Index quarterly, which “measures changes in the price of labour, unaffected by compositional shifts in the labour force, hours worked or employee characteristics.”
The latest report shows that the Wage Price Index rose 0.9% for the three months to December and 4.2% over the year. That was the first time in three years that wage growth outstripped inflation and the highest annual increase since early 2009. Wage increases pose a risk to inflation.
The RBA is on a narrow path, as former Governor Philip Lowe used to say, and may be forced into quick, unexpected monetary decisions in the months to come. A higher-than-anticipated Unemployment Rate may not bother Australian policymakers, but it could indeed take its toll on the Aussie.
When will the Australian employment report be released and how could it affect AUD/USD?
The ABS will publish the February employment report on Thursday at 00:30 GMT. As previously stated, Australia is expected to have created 40K new jobs in the month, while the Unemployment Rate is foreseen at 4%. The Participation Rate is foreseen unchanged at 66.8%.
Ahead of the release of Australian employment figures, the United States (US) Federal Reserve (Fed) announced that it left the benchmark rate unchanged at 5.25%-5.5%, as widely anticipated. As a result, the US Dollar entered a selling spiral that pushed AUD/USD higher.
The Fed also unveiled the Summary of Economic Projections (SEP) or dot plot, which showed that policymakers still aim to cut rates three times this year, more than the suspected two. Additionally, the central bank upwardly revised its growth and inflation forecast, while unemployment is foreseen to ease. Chairman Jerome Powell held a press conference and hinted that the central bank is in no rush to cut rates. The economy is growing, inflation is still high, and the labour market is tight.
From a technical perspective, Valeria Bednarik, Chief Analyst at FXStreet, notes: “The AUD/USD pair trimmed its weekly losses and moved further away from the 2024 low at 0.6442. Still, as seen in the weekly chart, the wider perspective indicates that the pair has room to break lower and test buyers’ determination at around 0.6400, particularly if the Aussie pair turns south with employment figures.”
Bednarik adds: “On a daily basis, AUD/USD is turning bullish. The pair develops between directionless moving averages, while the Relative Strength Index (RSI) indicator turns marginally higher but remains at negative levels. The Momentum indicator lacks directional strength, advancing modestly just above the 100 level, in line with recent price action, but still not enough to confirm a bullish continuation.”
Finally, she notes: “The pair has retreated sharply after reaching the 50% Fibonacci retracement of the 0.6871-0.6442 slide at 0.6656 but has recovered above the 23.6% retracement of the aforementioned slide at 0.6543. The pair can now extend its advance towards the 0.6600-0.6610 area, while once above the latter, the pair could reach the mentioned Fibonacci retracement at 0.6656.”
Australian Dollar FAQs
One of the most significant factors for the Australian Dollar (AUD) is the level of interest rates set by the Reserve Bank of Australia (RBA). Because Australia is a resource-rich country another key driver is the price of its biggest export, Iron Ore. The health of the Chinese economy, its largest trading partner, is a factor, as well as inflation in Australia, its growth rate and Trade Balance. Market sentiment – whether investors are taking on more risky assets (risk-on) or seeking safe-havens (risk-off) – is also a factor, with risk-on positive for AUD.
The Reserve Bank of Australia (RBA) influences the Australian Dollar (AUD) by setting the level of interest rates that Australian banks can lend to each other. This influences the level of interest rates in the economy as a whole. The main goal of the RBA is to maintain a stable inflation rate of 2-3% by adjusting interest rates up or down. Relatively high interest rates compared to other major central banks support the AUD, and the opposite for relatively low. The RBA can also use quantitative easing and tightening to influence credit conditions, with the former AUD-negative and the latter AUD-positive.
China is Australia’s largest trading partner so the health of the Chinese economy is a major influence on the value of the Australian Dollar (AUD). When the Chinese economy is doing well it purchases more raw materials, goods and services from Australia, lifting demand for the AUD, and pushing up its value. The opposite is the case when the Chinese economy is not growing as fast as expected. Positive or negative surprises in Chinese growth data, therefore, often have a direct impact on the Australian Dollar and its pairs.
Iron Ore is Australia’s largest export, accounting for $118 billion a year according to data from 2021, with China as its primary destination. The price of Iron Ore, therefore, can be a driver of the Australian Dollar. Generally, if the price of Iron Ore rises, AUD also goes up, as aggregate demand for the currency increases. The opposite is the case if the price of Iron Ore falls. Higher Iron Ore prices also tend to result in a greater likelihood of a positive Trade Balance for Australia, which is also positive of the AUD.
The Trade Balance, which is the difference between what a country earns from its exports versus what it pays for its imports, is another factor that can influence the value of the Australian Dollar. If Australia produces highly sought after exports, then its currency will gain in value purely from the surplus demand created from foreign buyers seeking to purchase its exports versus what it spends to purchase imports. Therefore, a positive net Trade Balance strengthens the AUD, with the opposite effect if the Trade Balance is negative.
Economic Indicator
Australia Unemployment Rate s.a.
The Unemployment Rate, released by the Australian Bureau of Statistics, is the number of unemployed workers divided by the total civilian labor force, expressed as a percentage. If the rate increases, it indicates a lack of expansion within the Australian labor market and a weakness within the Australian economy. A decrease in the figure is seen as bullish for the Australian Dollar (AUD), while an increase is seen as bearish.
Read more.Why it matters to traders
The Australian Bureau of Statistics (ABS) publishes an overview of trends in the Australian labour market, with unemployment rate a closely watched indicator. It is released about 15 days after the month end and throws light on the overall economic conditions, as it is highly correlated to consumer spending and inflation. Despite the lagging nature of the indicator, it affects the Reserve Bank of Australia’s (RBA) interest rate decisions, in turn, moving the Australian dollar. Upbeat figure tends to be AUD positive.
The Greenback halted its ongoing recovery and retreated markedly after the Fed left its interest rates unchanged and Powell delivered a dovish message, all morphing into extra oxygen for the risk-linked galaxy.
Here is what you need to know on Thursday, March 21:
The USD Index (DXY) plummeted to the low-103.00s after advancing well north of the 104.00 barrier earlier in the session. A busy US calendar on March 21 shows the usual weekly Initial Jobless Claims along with the Philly Fed Manufacturing Index and advanced S&P Global Manufacturing and Services PMIs. In addition, the CB Leading Index is also due followed by Existing Home Sales and the speech by FOMC M. Barr.
EUR/USD managed to advance to multi-day peaks past 1.0900 the figure in response to the Dollar’s pullback. On March 21, flash HCOB Manufacturing and Services PMIs are due.
GBP/USD advanced further and traded at shouting distance from the key 1.2800 milestone, underpinned by the weaker Greenback. In the UK, the BoE meets along with the release of preliminary S&P Global Manufacturing and Services PMIs.
USD/JPY rose to levels last seen in mid-November around 151.80 as investors continued to assess the latest BoJ gathering. Data-wise, In Japan, the Reuters Tankan Index and Balance of Trade results are due on March 21.
AUD/USD picked up renewed traction and reversed four consecutive daily declines ahead of key releases on Thursday. In the Australian calendar, the advanced Judo Bank Manufacturing and Services PMIs are scheduled for March 21 along with the labour market report and the RBA’s Consumer Inflation Expectations.
WTI prices retreated from recent tops and broke below the $81.00 mark per barrel despite persevering supply concerns and the sell-off in the greenback.
Gold prices rose sharply and revisited the $2,180 region per troy ounce following lower US yields and the collapse in the Dollar. Silver advanced strongly and tested an area last seen in early December around $25.60 per ounce.
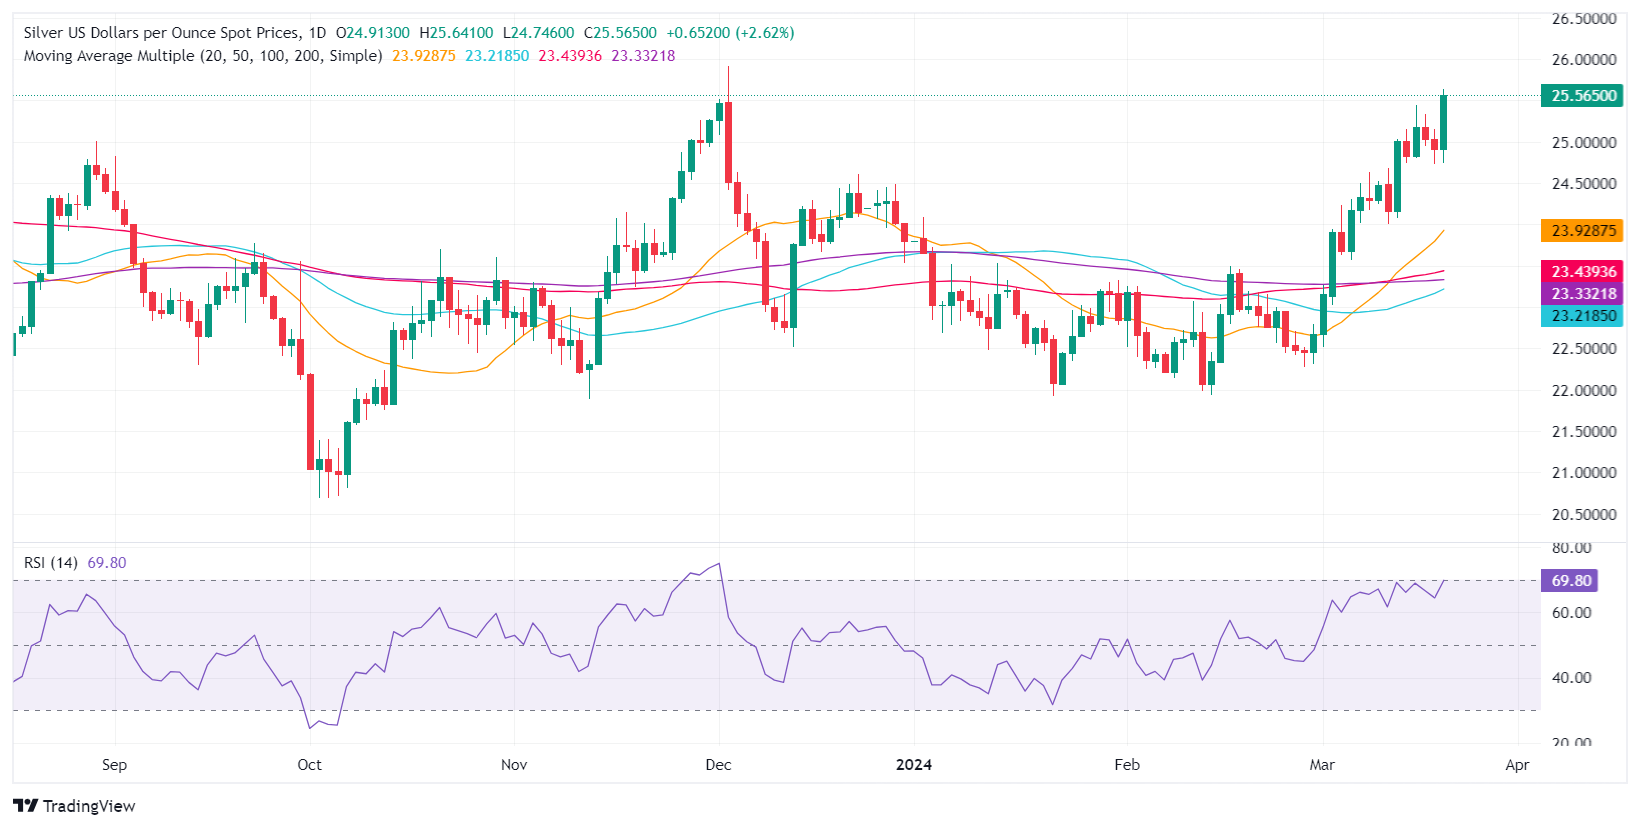
- Silver prices surge nearly 3%, buoyed by the Federal Reserve's decision to maintain current interest rates.
- US Dollar Index declines, supporting silver's upward momentum as investors digest the Fed's dovish stance.
- Technical indicators suggest potential for further gains, with XAG/USD traders targeting the $26.00 resistance level.
- Downside risks include a retracement towards the $25.00 support, and below.
Silver prices climbed on Wednesday after the US central bank, the Federal Reserve, held rates unchanged, delivering a “dovish” hold. Consequently, US Treasury yields edged down, and the Greenback remained pressured, as shown by the US Dollar Index (DXY), down 0.37% at 103.44. Therefore, XAG/USD trades at $25.61, up close to 3%.
XAG/USD Price Analysis: Technical outlook
Silver rallied sharply above the $25.50 rea, hitting a daily high at $25.63. A further upside is seen above that area, with grey metal traders eyeing $26.00 a troy ounce as the next key resistance level. Once those two levels are taken out, the next supply zone would be the April 18, 2022, high at $26.21, followed by the March 8, 2022, high at $26.94.
If sellers move in and drag prices below March 15’s high of $25.43, look for a drop toward $25.00. Once cleared, the next stop would be the December 22 high turned support at $24.60, followed by the $24.00 mark.
XAG/USD Price Action – Daily Chart
Federal Reserve Chairman Jerome Powell explains the decision to leave the policy rate, federal funds rate, unchanged at the range of 5.25-5.5% and responds to questions in the post-meeting press conference.
Key quotes
"We are looking at incoming inflation data most importantly."
"That's where we are looking for more confidence."
"We will also be looking at other data in the economy but most important thing will be the inflation data."
"Wage increases are gradually coming down to levels more sustainable over time."
"High inflation was not caused mostly by wages; that said we need to see more gradual movement downwards on wage inflation."
"We need to be careful on when we start to cut rates."
About Jerome Powell (via Federalreserve.gov)
"Jerome H. Powell first took office as Chair of the Board of Governors of the Federal Reserve System on February 5, 2018, for a four-year term. He was reappointed to the office and sworn in for a second four-year term on May 23, 2022. Mr. Powell also serves as Chairman of the Federal Open Market Committee, the System's principal monetary policymaking body. Mr. Powell has served as a member of the Board of Governors since taking office on May 25, 2012, to fill an unexpired term. He was reappointed to the Board and sworn in on June 16, 2014, for a term ending January 31, 2028."
Federal Reserve Chairman Jerome Powell explains the decision to leave the policy rate, federal funds rate, unchanged at the range of 5.25-5.5% and responds to questions in the post-meeting press conference.
Key quotes
"We are seeing a strong labor market, extreme imbalances mostly resolved."
"Wage growth is gradually moderating."
"Things are returning more to the pre-pandemic state."
"Labor market is in good shape."
"We are closely watching layoffs."
"Initial claims are very very low."
"Fed is discussing slowing pace of runoff."
"In terms of timing, no more specific than fairly soon."
"Liquidity is not evenly distributed."
"We might be able to get to a lower level of reserves this time."
"We are looking at what would be best pace and best structure."
"Our longer run goal is to return to balance sheet that is mostly treasuries."
"It is not urgent to make changes to that right now, though; that is an issue further down the line."
"We are going to pay a lot of attention to past mistakes on balance sheet runoff."
"we have a better sense now on indicators we need to look at."
"By going slower on balance sheet, we think we can get further."
"It will mean we run much less risk on liquidity issues."
"We will be monitoring money market conditions carefully to know when to stop on balance sheet runoff."
"There isn't a dollar of % of GDP amount that we have in mind; we will look at indicators to tell us when we are close."
"We want to have a buffer on reserves. We don't want to find ourselves in the 2019 situation again."
About Jerome Powell (via Federalreserve.gov)
"Jerome H. Powell first took office as Chair of the Board of Governors of the Federal Reserve System on February 5, 2018, for a four-year term. He was reappointed to the office and sworn in for a second four-year term on May 23, 2022. Mr. Powell also serves as Chairman of the Federal Open Market Committee, the System's principal monetary policymaking body. Mr. Powell has served as a member of the Board of Governors since taking office on May 25, 2012, to fill an unexpired term. He was reappointed to the Board and sworn in on June 16, 2014, for a term ending January 31, 2028."
Federal Reserve Chairman Jerome Powell explains the decision to leave the policy rate, federal funds rate, unchanged at the range of 5.25-5.5% and responds to questions in the post-meeting press conference.
Key quotes
"We tend to see a little bit stronger inflation in first half of the year."
"We don't know if this is a bump on inflation road or something more."
"Latest inflation data certainly hasn't improved anyone's confidence."
"Recent inflation data hasn't altered story of inflation coming down to 2% on a sometimes bumpy path."
"We need to take time to assess if recent inflation represents more than bumps in the road."
"It is very important that we do get inflation sustainably down."
"I don't see cracks in the labor market."
About Jerome Powell (via Federalreserve.gov)
"Jerome H. Powell first took office as Chair of the Board of Governors of the Federal Reserve System on February 5, 2018, for a four-year term. He was reappointed to the office and sworn in for a second four-year term on May 23, 2022. Mr. Powell also serves as Chairman of the Federal Open Market Committee, the System's principal monetary policymaking body. Mr. Powell has served as a member of the Board of Governors since taking office on May 25, 2012, to fill an unexpired term. He was reappointed to the Board and sworn in on June 16, 2014, for a term ending January 31, 2028."
Federal Reserve Chairman Jerome Powell explains the decision to leave the policy rate, federal funds rate, unchanged at the range of 5.25-5.5% and responds to questions in the post-meeting press conference.
Key quotes
"If we are getting a lot of supply and demand, you could potentially have a bigger economy where inflation pressures are not increasing."
"Strong hiring all by itself would not be a reason to hold off on rate cuts."
"Strong job growth is not a reason for us to be concerned about inflation."
"Ultimately, we do think financial conditions are weighing on economic activity."
About Jerome Powell (via Federalreserve.gov)
"Jerome H. Powell first took office as Chair of the Board of Governors of the Federal Reserve System on February 5, 2018, for a four-year term. He was reappointed to the office and sworn in for a second four-year term on May 23, 2022. Mr. Powell also serves as Chairman of the Federal Open Market Committee, the System's principal monetary policymaking body. Mr. Powell has served as a member of the Board of Governors since taking office on May 25, 2012, to fill an unexpired term. He was reappointed to the Board and sworn in on June 16, 2014, for a term ending January 31, 2028."
Federal Reserve Chairman Jerome Powell explains the decision to leave the policy rate, federal funds rate, unchanged at the range of 5.25-5.5% and responds to questions in the post-meeting press conference.
Key quotes
"We made no decisions about future meetings today; will depend on data."
"We want to see more data that gives us higher confidence on inflation moving down sustainably."
"If there were a significant weakening in labor market, that would be a reason to start rate cuts."
"I don't think we know if rates are going to be higher in the longer run."
"My instinct is rates won't go back down to very low levels we saw before."
"But there is tremendous uncertainty around that."
"It is still likely in most people's view that we will have rate cuts this year, but depends on data
About Jerome Powell (via Federalreserve.gov)
"Jerome H. Powell first took office as Chair of the Board of Governors of the Federal Reserve System on February 5, 2018, for a four-year term. He was reappointed to the office and sworn in for a second four-year term on May 23, 2022. Mr. Powell also serves as Chairman of the Federal Open Market Committee, the System's principal monetary policymaking body. Mr. Powell has served as a member of the Board of Governors since taking office on May 25, 2012, to fill an unexpired term. He was reappointed to the Board and sworn in on June 16, 2014, for a term ending January 31, 2028."
Federal Reserve Chairman Jerome Powell explains the decision to leave the policy rate, federal funds rate, unchanged at the range of 5.25-5.5% and responds to questions in the post-meeting press conference.
Key quotes
"Discussed balance sheet at this meeting."
"We discussed issues related to slowing pace of decline in holdings."
"Our general sense is we will start run off fairly soon."
"Slowing pace of runoff will ensure smooth transition, mitigating chance of money market stress."
"Will limit risk to money market volatility."
"Economy is performing well."
"Projections do not mean higher tolerance for inflation."
"Inflation data came in a little bit higher than expected. Nevertheless, we continue to make good progress on bringing inflation down."
"There's some confidence that lower market rent increases in housing will show up over time."
"I assume we will continue to see goods prices continue into a new equilibrium."
"The risks are really two-sided now."
"First rate cut is therefore consequential."
"We can approach that question carefully and let the data speak."
"January CPI and PCE numbers were quite high but could have been due to seasonal adjustments."
"January inflation numbers were quite high but reason to think there were seasonal affects there."
"February was also high, but not terribly."
"Taking January and February together have not changed the overall story."
"It will be a bumpy path."
"Those January and February inflation numbers did not add to our confidence."
"We are not going to overreact to these two months of data; nor ignore them."
About Jerome Powell (via Federalreserve.gov)
"Jerome H. Powell first took office as Chair of the Board of Governors of the Federal Reserve System on February 5, 2018, for a four-year term. He was reappointed to the office and sworn in for a second four-year term on May 23, 2022. Mr. Powell also serves as Chairman of the Federal Open Market Committee, the System's principal monetary policymaking body. Mr. Powell has served as a member of the Board of Governors since taking office on May 25, 2012, to fill an unexpired term. He was reappointed to the Board and sworn in on June 16, 2014, for a term ending January 31, 2028."
Federal Reserve Chairman Jerome Powell explains the decision to leave the policy rate, federal funds rate, unchanged at the range of 5.25-5.5% and responds to questions in the post-meeting press conference.
Key quotes
"Risks to goals coming into better balance."
"Our policy rate is likely at its peak."
Likely to cut rates at some point this year but outlook is uncertain and we remain attentive to risks."
"Prepared to keep rates high longer if needed."
"We will carefully assess incoming data to decide policy."
"Committed to both sides of dual mandate."
"We need greater confidence of inflation moving sustainably down before we cut rates."
"We will make decisions meeting by meeting."
"Unexpected weakness in labor market could warrant a response too."
"Our projections are not a plan, we will adjust based on conditions."
About Jerome Powell (via Federalreserve.gov)
"Jerome H. Powell first took office as Chair of the Board of Governors of the Federal Reserve System on February 5, 2018, for a four-year term. He was reappointed to the office and sworn in for a second four-year term on May 23, 2022. Mr. Powell also serves as Chairman of the Federal Open Market Committee, the System's principal monetary policymaking body. Mr. Powell has served as a member of the Board of Governors since taking office on May 25, 2012, to fill an unexpired term. He was reappointed to the Board and sworn in on June 16, 2014, for a term ending January 31, 2028."
Federal Reserve Chairman Jerome Powell explains the decision to leave the policy rate, federal funds rate, unchanged at the range of 5.25-5.5% and responds to questions in the post-meeting press conference.
Key quotes
"The economy has made considerable progress."
"Inflation has eased substantially."
"Ongoing progress is not assured, though."
"The path forward is uncertain."
"GDP has been bolstered by strong consumer demand as well as healing supply chains."
"High interest rates have weighed on business fixed income investment."
"Participants revised up GDP estimates."
"Labor market remains relatively tight but supply and demand coming into better balance."
"Nominal wage growth has been easing."
"Labor demand still exceeds labor supply."
"FOMC participants expect rebalancing in labor market to continue."
"Inflation remains above our goal."
"Longer-term inflation expectations remain well-anchored."
About Jerome Powell (via Federalreserve.gov)
"Jerome H. Powell first took office as Chair of the Board of Governors of the Federal Reserve System on February 5, 2018, for a four-year term. He was reappointed to the office and sworn in for a second four-year term on May 23, 2022. Mr. Powell also serves as Chairman of the Federal Open Market Committee, the System's principal monetary policymaking body. Mr. Powell has served as a member of the Board of Governors since taking office on May 25, 2012, to fill an unexpired term. He was reappointed to the Board and sworn in on June 16, 2014, for a term ending January 31, 2028."
- GBP/USD sees a significant uptick, navigating the 1.2700/1.2750 range following the Federal Reserve's rate decision.
- Fed holds interest rates steady, with an emphasis on the ongoing strength of the US economy and labor market.
- Despite high recent inflation, Fed's projections for 2024 remain stable; slight adjustment made for 2025 FFR outlook.
The GBP/USD climbed sharply after the Federal Reserve’s (Fed) decision to hold rates but kept their interest rate cut projections unchanged for 2024. Consequently, the Greenback tumbled, while US Treasury bond yields climbed. At the time of writing, the GBP/USD trades volatile in the 1.2700/1.2750 area ahead of Fed Chair Jerome Powell's press conference.
Summary of the Fed’s monetary policy statement
The US Federal Reserve has decided to keep interest rates steady at 5.25%-5.50% and continue reducing its balance sheet at an ongoing pace since May 2023. In their announcement, Federal Reserve officials highlighted the strength of the US economy and the robustness of the labor market. While progress on inflation has been acknowledged, they cautioned that the effort to stabilize prices is not yet finished. They noted an improved balance in the risks associated with achieving the Fed's dual mandate of maximum employment and stable prices, affirming their commitment to data-driven decision-making.
Following two consecutive months of unexpectedly high inflation data, the Federal Reserve adjusted its monetary policy outlook for 2025. Although the median forecast for 2024 remains unchanged at 4.6% from December's projection, the forecast for the Federal Funds Rate (FFR) for 2025 was revised upwards from 3.6% to 3.9%. Other economic indicators were also updated in their statement.
- The Gross Domestic Product (GDP) for 2024 was revised to 2.1%, up from 1.4% in December.
- The Unemployment Rate was revised downward, expected to fall to 4.0%, from 4.1%.
- The Personal Consumption Expenditure (PCE) Price Index target wasn’t changed, remaining at 2.4%, while core PCE is estimated to end 2024 at 2.6%, up from 2.4%.
Following the release of the data, the yield on the US 10-year Treasury note decreased by two basis points to 4.275%. Concurrently, the US Dollar is experiencing downward pressure.
GBP/USD Price Action – Hourly Chart
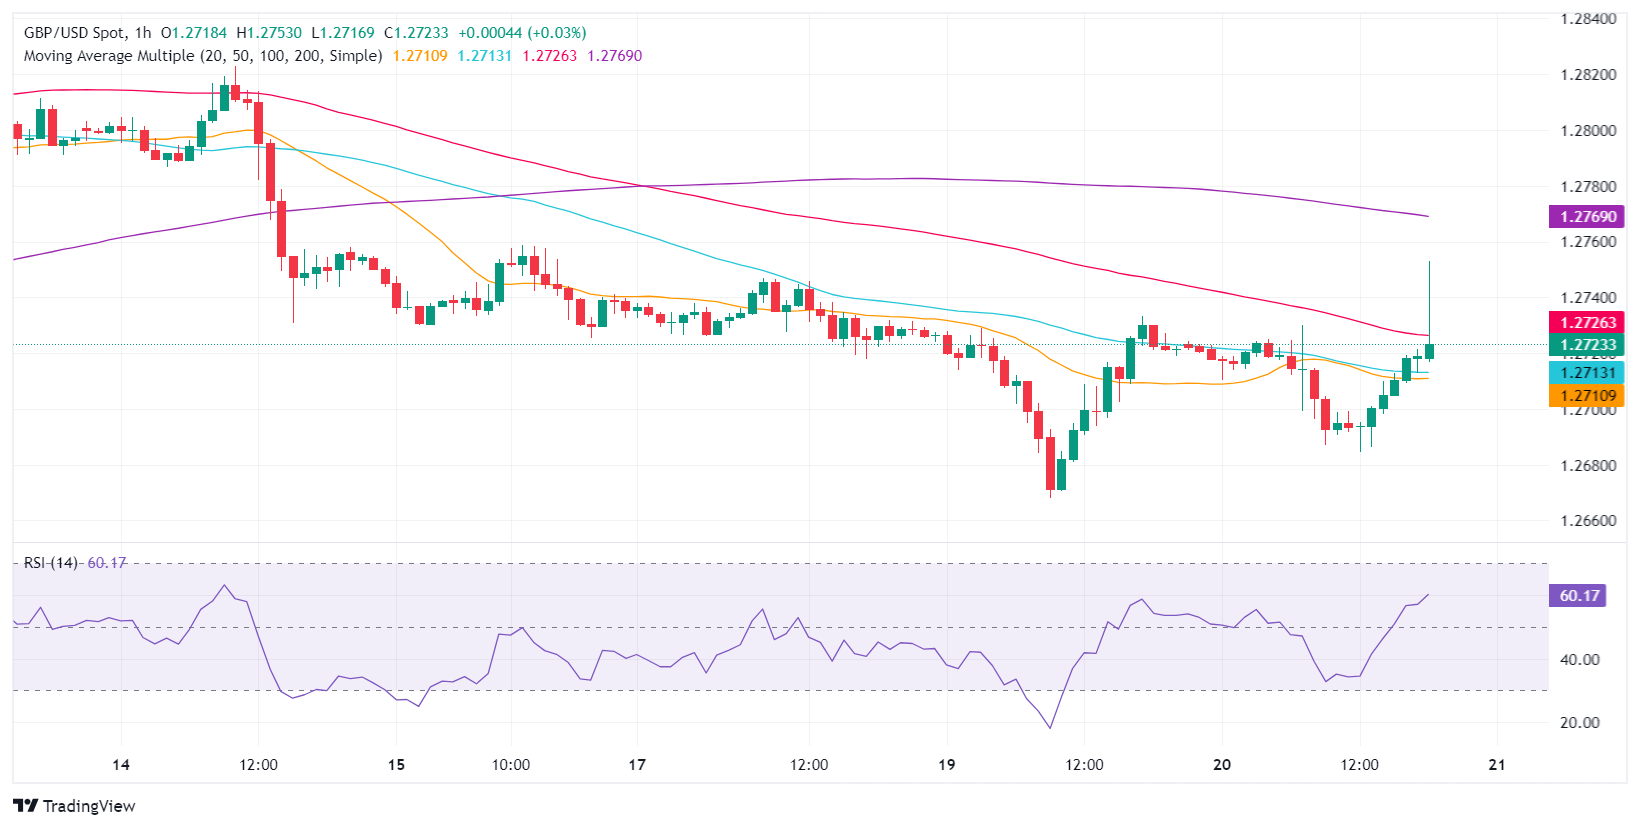
The GBP/USD surged towards a daily high of 1.2752, but since then, the pair has retreated towards the 100-moving average (SMA) at around 1.2725. As the Fed Chair Jerome Powell press conference looms, the major could re-test daily highs on dovish remarks, and that could expose the 1.2800 mark. A breach of the latter will expose the March 14 high of 1.2823, followed by the March 8 high at 1.2894. on the flip side, the pair could edge towards the 50-SMA at 1.2713, ahead of the 1.2700 mark. Further downside is seen at the March 19 low of 1.2667.
- USD/JPY took a quick plunge into 151.25 after Fed held rates.
- FOMC sees slightly higher rates in the future than previously expected.
- Markets shrug off higher growth forecast, price in additional easing.
USD/JPY took a quick dive into 151.25 after the Federal Reserve (Fed) held its main reference rate at 5.5% as markets had broadly predicted. Risk-hungry investors are shrugging off higher-than-previous growth expectations and interest rate forecasts from the Federal Open Market Committee (FOMC). According to the FOMC, US Gross Domestic Product (GDP) growth through 2024 is going to be slightly higher than forecast, and year-end interest rates are likely to be higher than previously expected.
Despite upside shifts to the Dot Plot, the Fed still expects three rate cuts through 2024 for around 75 basis points, and markets are keeping hopes of near-term rate trimming to begin closer to the middle of the year. Fed Chairman Jerome Powell is due at the bottom of the hour at 18:30 GMT.
Read more: Fed leaves interest rate unchanged at 5.25%-5.5% as forecast
USD/JPY 5-minute chart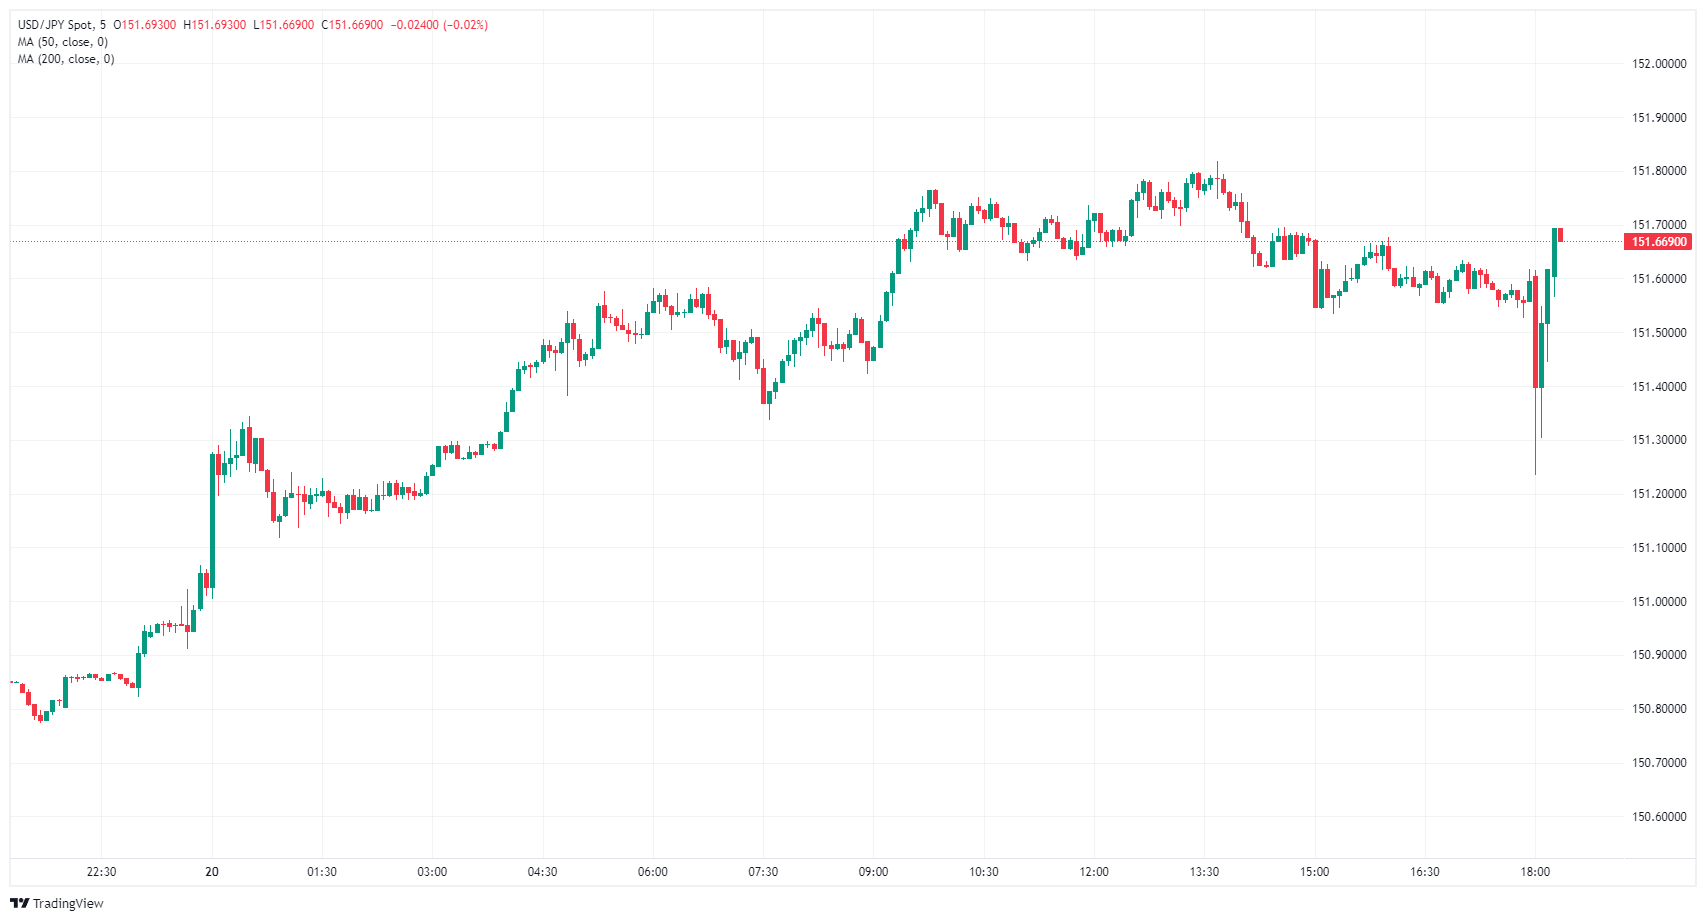
- EUR/USD bumped towards 1.0900 after Fed held steady.
- Fed Dot Plot still sees 75 bps in 2024.
- Fed expects rates to be held higher by end of 2026.
EUR/USD jumped on reaction to the Federal Reserve’s (Fed) latest rate call, which held rates at 5.5% as markets had broadly predicted. Investor expectations are pricing in additional easing in 2024, despite the Federal Open Market Committee seeing stronger growth through 2024 and 2025 than initially expected. The FOMC’s Dot Plot of interest rate expectations also saw a rise in the long tail end of the curve, with end-2026 rates now forecast to land somewhere around 3.1% versus the previous 2.9%.
The Fed is now projecting a higher long-term policy rate through December, ticking up to 2.6% from 2.5%, but markets are shrugging off the Fed’s growth expectations to push down the US Dollar (USD), sending the Euro (EUR) higher. EUR/USD crossed 1.0890 following the market’s pre-baked reaction to the Fed’s rate call. Investors will now buckle down for the short wait to Fed Chairman Jerome Powell’s press conference slated for the bottom of the hour at 18:30 GMT.
Read more: Fed leaves interest rate unchanged at 5.25%-5.5% as forecast
EUR/USD 5-minute chart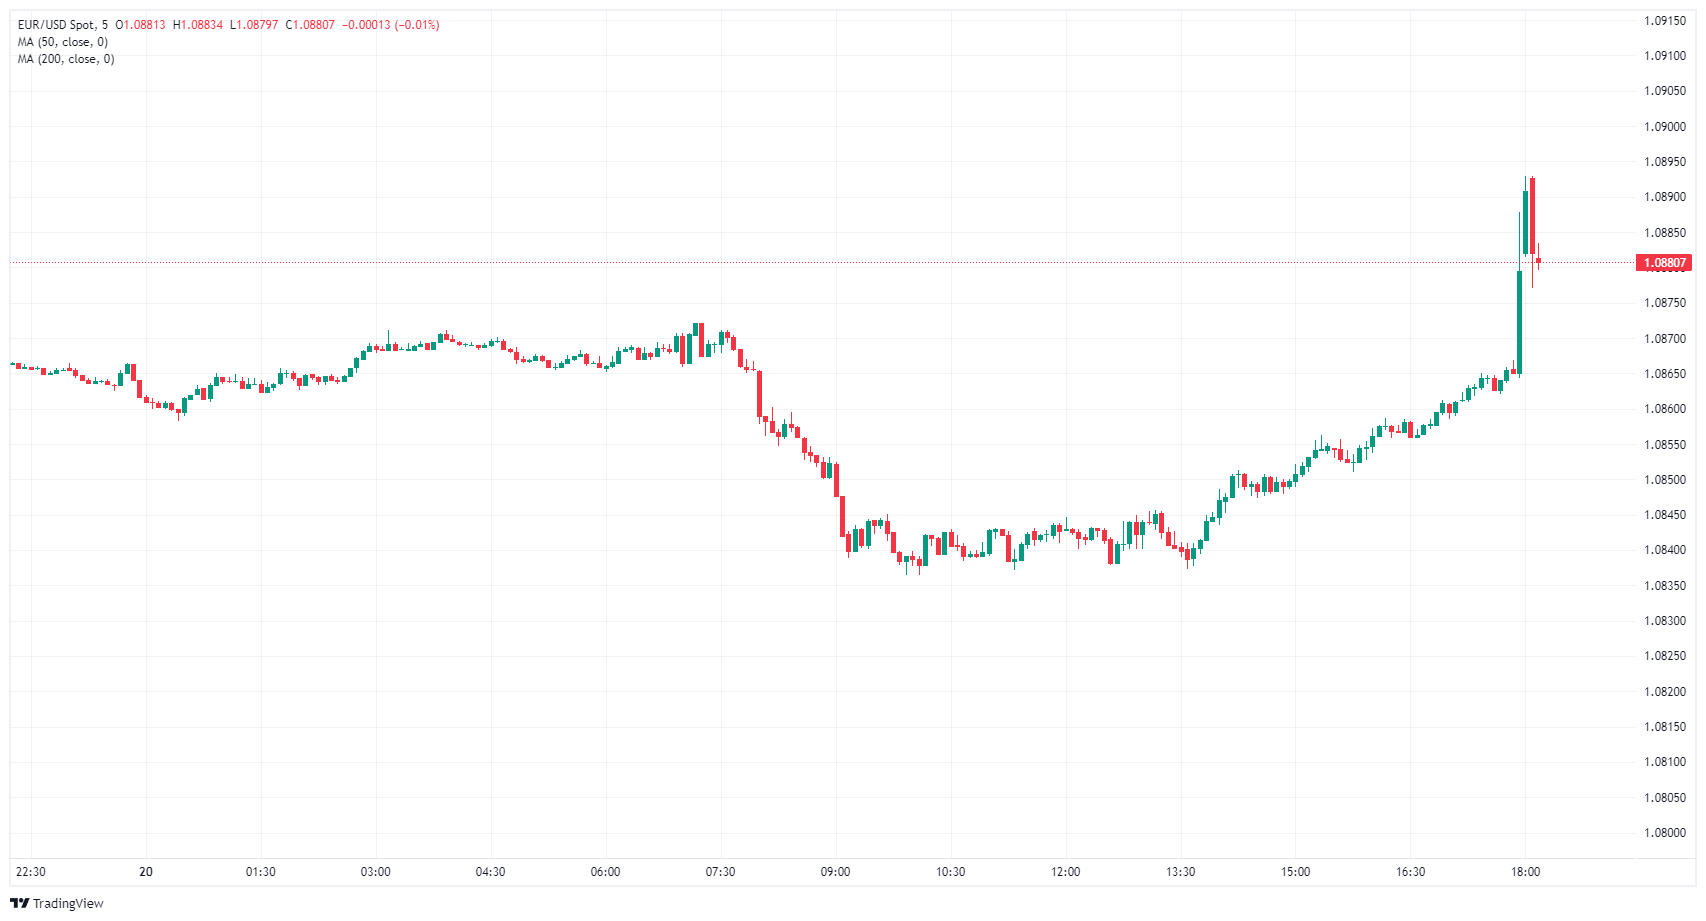
- Gold is flatlined as investors await Federal Reserve's monetary policy announcement.
- US 10-year Treasury yield dip reflects market caution before Fed's interest rate decision and economic outlook.
- A potential upward adjustment in Fed's Dot Plot may hint at hawkish shift, a headwind for Gold’s price.
Gold price is virtually unchanged ahead of the US Federal Reserve’s monetary policy decision as traders remain on the sidelines. In addition to delivering the statement, Fed officials will update their economic projections, with investors eyeing a tweak to the Dot Plot, which could pave the way for a US Dollar comeback. The XAU/USD trades near $2,150.00, almost flat.
An hour before the Fed’s meeting, the US 10-year Treasury note yields 4.281%, down one basis point, as market participants remained uncertain. The US Dollar Index (DXY), a gauge of the buck’s value against a basket of six other currencies, rose 0.12% to 103.94, putting a lid on Bullion’s advance.
Financial market chatter suggests that if two Fed Dot Plot projections adjust to the upside in 2024, it would be perceived as a “hawkish tilt;” therefore, further XAU/USD downside is expected. On the other hand, there’s some speculation that policymakers could adjust their monetary policy expectations for 2025, suggesting the Federal Funds Rate (FFR) would be higher than December’s 3.6% estimate.
Daily digest market movers: Gold stays firm amid strong US Dollar
- The Federal Reserve’s Summary of Economic Projections in December showed that policymakers expected GDP in 2024 to be at 1.4% and the Unemployment Rate to be at 4.1%.
- Regarding inflation figures, the Core Personal Consumption Expenditure (PCE) Price Index, favored by Fed Chair Jerome Powell for tracking inflation, is predicted to fall to 2.4% in 2024, aligning with the general PCE forecast.
- December’s Dot Plot suggested that Fed officials were expecting the FFR to end at 4.6%, down from 5.1%. However, if the median moves to 4.8%, that would imply Powell and company are expecting two rate cuts for 2024.
- The latest US economic data witnessed mixed business activity readings, making it challenging to predict the pace of economic deceleration in the US. The labor market has shown signs of cooling, though the economy added more people to the workforce than expected, while fewer people applied for unemployment benefits.
- Recent inflation data in the US showed that inflation on the consumer and producer side surprised to the upside, suggesting that inflation is stickier than expected.
- Given the backdrop, Fed Chair Jerome Powell’s testimony at the US Congress earlier this month, suggesting the Fed would begin to cut borrowing costs, were justified. However, last week’s inflation figures and Retail Sales data triggered a repricing of Fed rate cut bets, aligning with the US central bank's view of 75 basis points of easing toward the end of 2024.
- According to the CME FedWatch Tool, expectations for a June rate cut stand at 64%, down from 72% a week ago.
Technical analysis: Gold traders remain on the sidelines as XAU/USD stays around $2,150
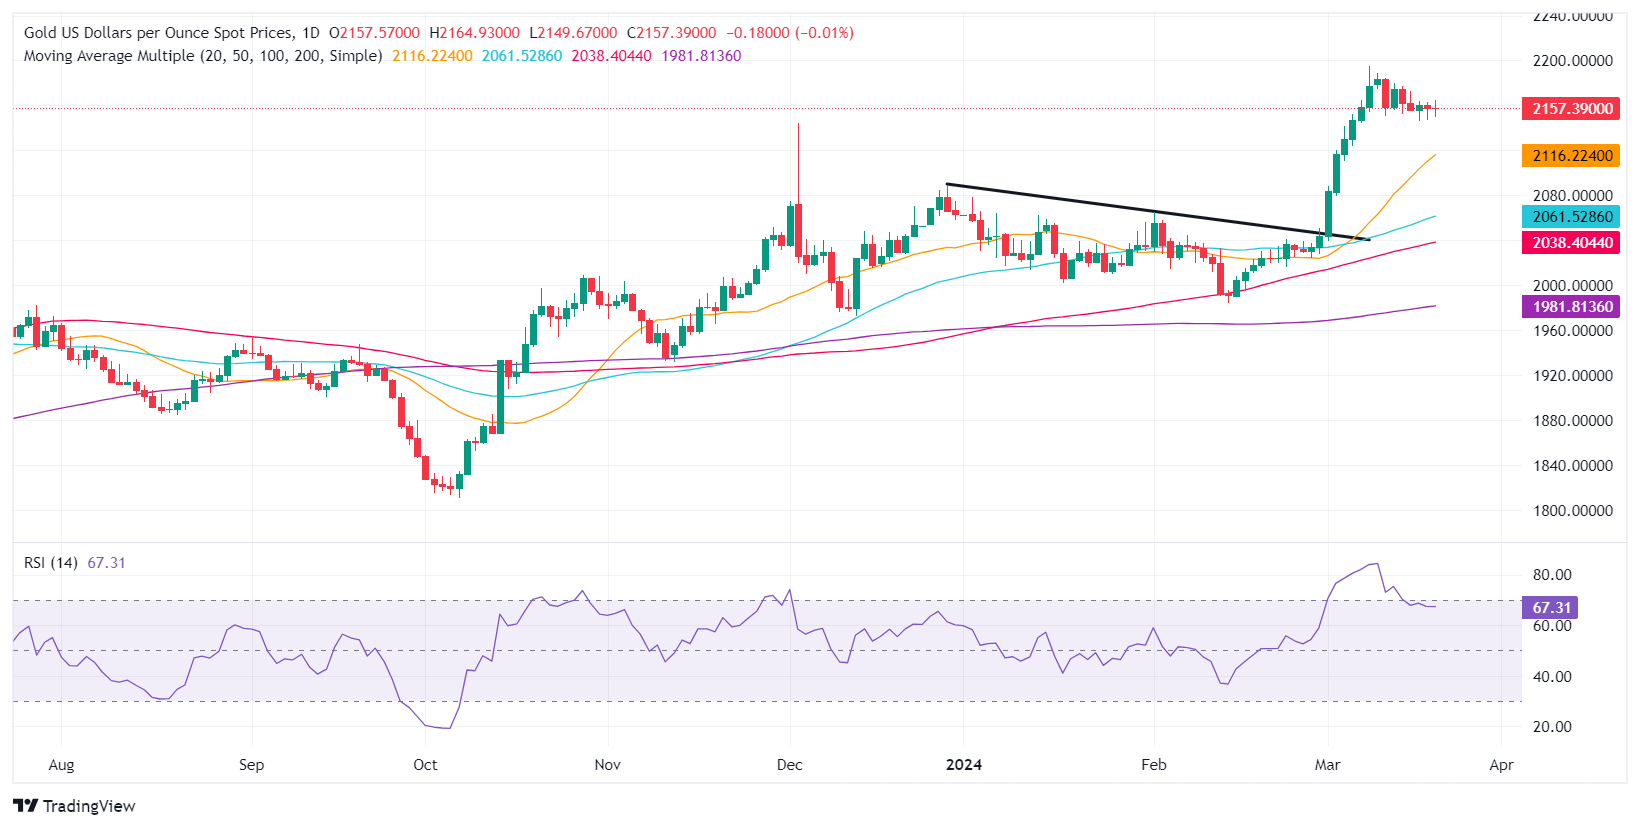
XAU/USD price hovers around $2,150 unmoved ahead of the FOMC decision. A dovish tilt could open the door for a rally that prompts a jump in Gold prices, opening the door to challenge the all-time high (ATH) at $2,195.15. A retest there would expose $2,200 next.
On the other hand, if Gold spot price tumbles below $2,150, look for a breach below December’s 3 high, exposing the March 6 low of $2,123.80, followed by $2,100.
Gold FAQs
Gold has played a key role in human’s history as it has been widely used as a store of value and medium of exchange. Currently, apart from its shine and usage for jewelry, the precious metal is widely seen as a safe-haven asset, meaning that it is considered a good investment during turbulent times. Gold is also widely seen as a hedge against inflation and against depreciating currencies as it doesn’t rely on any specific issuer or government.
Central banks are the biggest Gold holders. In their aim to support their currencies in turbulent times, central banks tend to diversify their reserves and buy Gold to improve the perceived strength of the economy and the currency. High Gold reserves can be a source of trust for a country’s solvency. Central banks added 1,136 tonnes of Gold worth around $70 billion to their reserves in 2022, according to data from the World Gold Council. This is the highest yearly purchase since records began. Central banks from emerging economies such as China, India and Turkey are quickly increasing their Gold reserves.
Gold has an inverse correlation with the US Dollar and US Treasuries, which are both major reserve and safe-haven assets. When the Dollar depreciates, Gold tends to rise, enabling investors and central banks to diversify their assets in turbulent times. Gold is also inversely correlated with risk assets. A rally in the stock market tends to weaken Gold price, while sell-offs in riskier markets tend to favor the precious metal.
The price can move due to a wide range of factors. Geopolitical instability or fears of a deep recession can quickly make Gold price escalate due to its safe-haven status. As a yield-less asset, Gold tends to rise with lower interest rates, while higher cost of money usually weighs down on the yellow metal. Still, most moves depend on how the US Dollar (USD) behaves as the asset is priced in dollars (XAU/USD). A strong Dollar tends to keep the price of Gold controlled, whereas a weaker Dollar is likely to push Gold prices up.
- Dow Jones goes flat as investors draw into the middle pre-Fed rate call.
- FOMC Interest Rate Projections also dropping on markets.
- Press conference from Fed Chairman Jerome Powell due after FOMC release.
The Dow Jones Industrial Average (DJIA) is churning at the day’s opening prices as investors brace for the latest Federal Reserve (Fed) rate call as well as a much-anticipated update to the Federal Open Market Committee’s (FOMC) Interest Rate Outlook. The FOMC’s rate call and rate forecast are due at the top of the hour at 18:00 GMT, with Fed Chairman Jerome Powell tabling a press conference 30 minutes later at 18:30 GMT.
Dow Jones news
The Dow Jones is mixed on Wednesday, with about half of the 30 listed securities trading into the low side. Boeing Co. (BA) is seeing a brief recovery from recent selling pressure, climbing around 2.3% to trade into $185.00 per share. On the bottom end, Chevron Corp. (CVX) is down nearly 1.5% in midweek trading, testing into $154.00 per share.
The Materials and Industrials Sectors are Wednesday’s early climbers, rising around 0.4% in midday pre-Fed trading. The Health and Energy Sectors are falling into the low side, falling 0.7% and 0.6%, respectively.
Dow Jones Industrial Average technical outlook
The Dow Jones drifted into an early low near 39,000.00 on Wednesday before recovering into 39,160.00. Bids have pulled back into the day’s opening prices near 39,100.00 as investors buckle down for a spark from the Fed.
The DJIA is trading into the top end of near-term consolidation as the index struggles to gain further ground above the 39,200.00 level. Swing lows have been etching in a higher lows pattern, and an intraday demand zone in priced in near 38,700.00.
Dow Jones Industrial Average 5-minute chart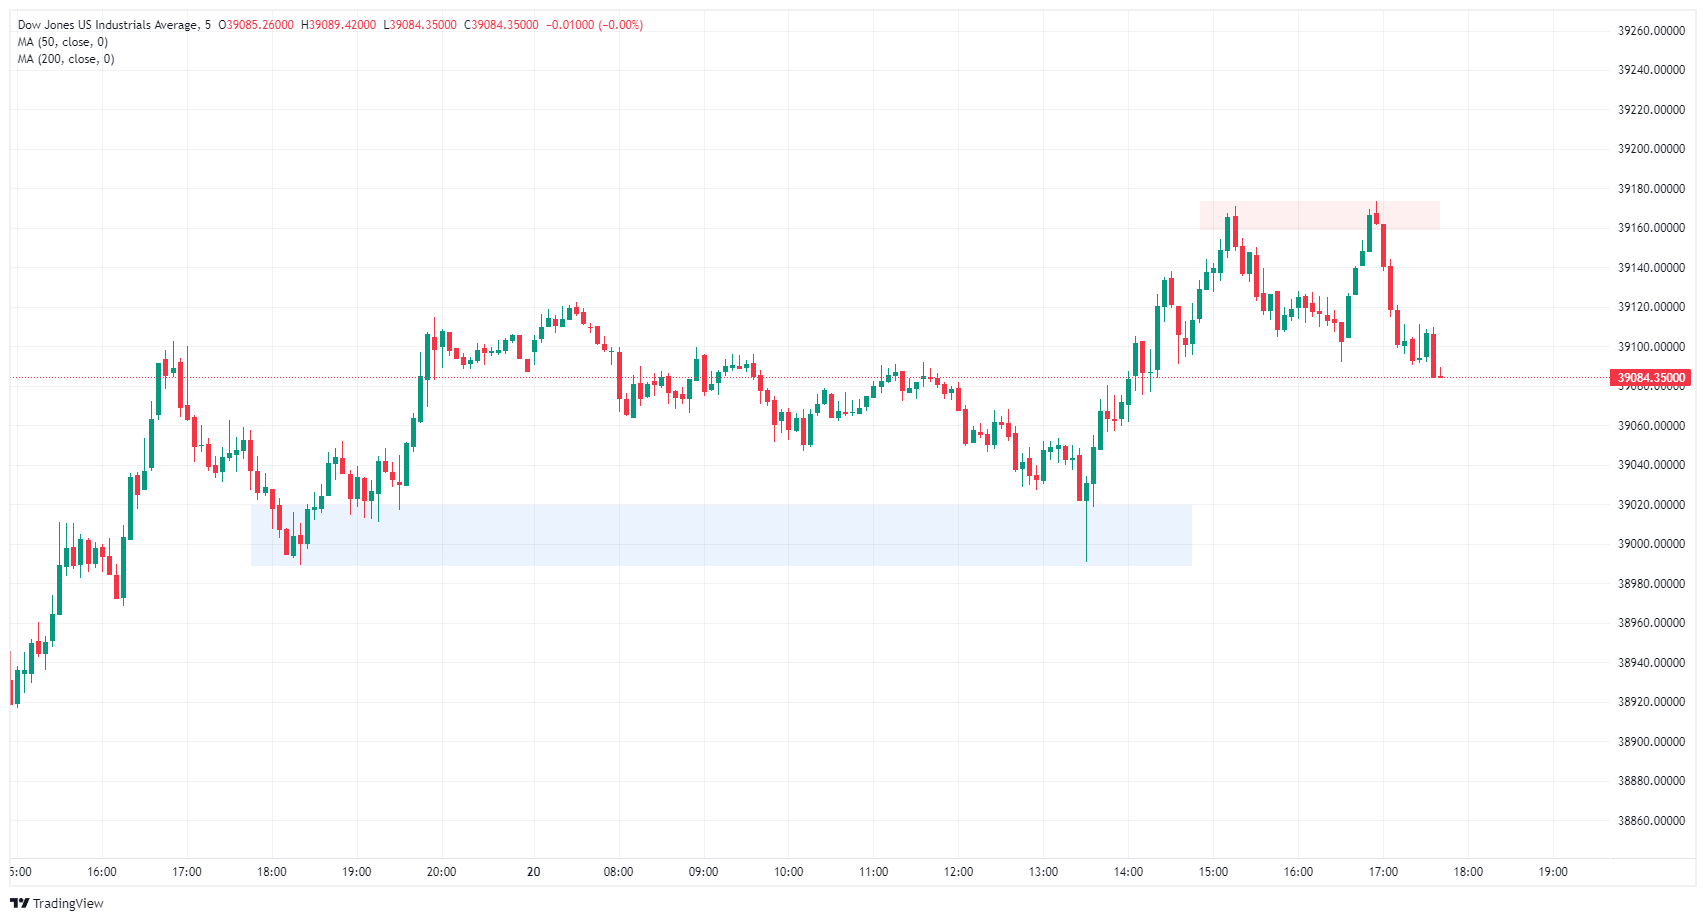
Fed FAQs
Monetary policy in the US is shaped by the Federal Reserve (Fed). The Fed has two mandates: to achieve price stability and foster full employment. Its primary tool to achieve these goals is by adjusting interest rates. When prices are rising too quickly and inflation is above the Fed’s 2% target, it raises interest rates, increasing borrowing costs throughout the economy. This results in a stronger US Dollar (USD) as it makes the US a more attractive place for international investors to park their money. When inflation falls below 2% or the Unemployment Rate is too high, the Fed may lower interest rates to encourage borrowing, which weighs on the Greenback.
The Federal Reserve (Fed) holds eight policy meetings a year, where the Federal Open Market Committee (FOMC) assesses economic conditions and makes monetary policy decisions. The FOMC is attended by twelve Fed officials – the seven members of the Board of Governors, the president of the Federal Reserve Bank of New York, and four of the remaining eleven regional Reserve Bank presidents, who serve one-year terms on a rotating basis.
In extreme situations, the Federal Reserve may resort to a policy named Quantitative Easing (QE). QE is the process by which the Fed substantially increases the flow of credit in a stuck financial system. It is a non-standard policy measure used during crises or when inflation is extremely low. It was the Fed’s weapon of choice during the Great Financial Crisis in 2008. It involves the Fed printing more Dollars and using them to buy high grade bonds from financial institutions. QE usually weakens the US Dollar.
Quantitative tightening (QT) is the reverse process of QE, whereby the Federal Reserve stops buying bonds from financial institutions and does not reinvest the principal from the bonds it holds maturing, to purchase new bonds. It is usually positive for the value of the US Dollar.
- The USD Dollar extended its gains on Wednesday.
- All eyes are set on the updated Dot Plot and Chair Powell’s tone.
- Any hawkish or dovish surprise from the Fed may trigger volatility in the USD.
The US Dollar Index (DXY) is currently trading near 104, demonstrating a gain not witnessed since March 1. The Greenback has been steadily ascending for the fifth day in a row, backed up by strong economic data and rising US Treasury yields in the last few sessions. However, the short-term trajectory will be dictated by the Federal Reserve’s (Fed) stance and projections.
The US economy remains resilient, with little evidence of inflation coming down and the labor market showing mixed signals. Investors will closely evaluate Chair Jerome Powell’s stance and how confident he is regarding cutting rates.
Daily digest market movers: DXY's rally persists as investors await FOMC decision and projections
- Markets are still expecting three rate cuts in 2024, starting in June, which matches the last projection from Fed officials.
- The focus will be on the Summary of Economic Projections (SEP) and how confident the bank is on the inflation progress.
- Any shifts seen in the Dot Plot may trigger a reaction in the Greenback.
DXY technical analysis: DXY's bullish momentum is under control, yet volatility is on the horizon
The technical indicators on the daily chart reflect strong buying momentum. The Relative Strength Index (RSI) registers a positive slope in bullish territory, underlining the dominating force of buyers. Simultaneously, the Moving Average Convergence Divergence (MACD) confirms this bullish sentiment by showing rising green bars, suggesting a sustained upward momentum for DXY.
The Simple Moving Averages (SMAs) provide further substantiation of this bullish market control. The index maintains a position above the critical 20, 100, and 200-day SMAs, highlighting a broader positive perspective.
US Dollar FAQs
The US Dollar (USD) is the official currency of the United States of America, and the ‘de facto’ currency of a significant number of other countries where it is found in circulation alongside local notes. It is the most heavily traded currency in the world, accounting for over 88% of all global foreign exchange turnover, or an average of $6.6 trillion in transactions per day, according to data from 2022. Following the second world war, the USD took over from the British Pound as the world’s reserve currency. For most of its history, the US Dollar was backed by Gold, until the Bretton Woods Agreement in 1971 when the Gold Standard went away.
The most important single factor impacting on the value of the US Dollar is monetary policy, which is shaped by the Federal Reserve (Fed). The Fed has two mandates: to achieve price stability (control inflation) and foster full employment. Its primary tool to achieve these two goals is by adjusting interest rates. When prices are rising too quickly and inflation is above the Fed’s 2% target, the Fed will raise rates, which helps the USD value. When inflation falls below 2% or the Unemployment Rate is too high, the Fed may lower interest rates, which weighs on the Greenback.
In extreme situations, the Federal Reserve can also print more Dollars and enact quantitative easing (QE). QE is the process by which the Fed substantially increases the flow of credit in a stuck financial system. It is a non-standard policy measure used when credit has dried up because banks will not lend to each other (out of the fear of counterparty default). It is a last resort when simply lowering interest rates is unlikely to achieve the necessary result. It was the Fed’s weapon of choice to combat the credit crunch that occurred during the Great Financial Crisis in 2008. It involves the Fed printing more Dollars and using them to buy US government bonds predominantly from financial institutions. QE usually leads to a weaker US Dollar.
Quantitative tightening (QT) is the reverse process whereby the Federal Reserve stops buying bonds from financial institutions and does not reinvest the principal from the bonds it holds maturing in new purchases. It is usually positive for the US Dollar.
- The Canadian Dollar is bound in the midrange as investors await FOMC.
- Bank of Canada to get drowned out by market’s Fed rate cut expectations.
- Fed expected to hold, investors hope for a June rate cut.
The Canadian Dollar (CAD) is mostly flat on the day as markets brace for the latest interest rate forecast and rate call from the Federal Reserve (Fed) at 18:00 GMT today, and the Bank of Canada (BoC) is unlikely to make waves as investors look for signs of a near-term Fed rate cut. Expectations of early and frequent rate trims from the Fed have been pushed down by reality for months, with the median forecast for a first rate slash currently set in June.
The Bank of Canada will release its latest Summary of Deliberations at 17:30 GMT, just ahead of the Fed’s latest Economic Projections. Canadian Consumer Price Index (CPI) inflation cooled this week, with February’s YoY CPI easing to 2.8% from the previous 2.9%, surprising markets that expected an increase to 3.1%. Canadian CPI inflation is easing enough that further rate hikes are unlikely, but not fast or hard enough to spark an immediate rate cut schedule.
Daily digest market movers: Canadian Dollar hung in midrange ahead of Fed
- The US Fed’s latest rate call and monetary policy statement will be released at 18:00 GMT today, alongside the Federal Open Market Committee’s (FOMC) Economic and Interest Rate Projections.
- Federal Reserve Chairman Jerome Powell will launch a press conference shortly after at 18:30 GMT.
- With the Fed broadly expected to hold rates steady at this week’s meeting, market focus will be pinned on the odds of a June rate call.
- According to the CME’s FedWatch Tool, money markets are pricing in a 65% chance of at least a 25 basis point rate trim at the June FOMC meeting.
- The Fed’s updated Dot Plot of interest rate projections will be closely watched today. The last iteration of the Fed’s internal rate outlook saw three rate cuts of 25 basis points each through the end of the year.
Canadian Dollar price today
The table below shows the percentage change of Canadian Dollar (CAD) against listed major currencies today. Canadian Dollar was the weakest against the Australian Dollar.
| USD | EUR | GBP | CAD | AUD | JPY | NZD | CHF | |
| USD | 0.06% | 0.04% | -0.09% | -0.08% | 0.36% | 0.18% | 0.25% | |
| EUR | -0.06% | -0.01% | -0.15% | -0.12% | 0.32% | 0.13% | 0.20% | |
| GBP | -0.02% | 0.01% | -0.14% | -0.10% | 0.32% | 0.16% | 0.20% | |
| CAD | 0.09% | 0.15% | 0.16% | 0.03% | 0.46% | 0.27% | 0.34% | |
| AUD | 0.06% | 0.12% | 0.11% | -0.02% | 0.43% | 0.24% | 0.32% | |
| JPY | -0.37% | -0.30% | -0.36% | -0.46% | -0.43% | -0.19% | -0.11% | |
| NZD | -0.19% | -0.13% | -0.14% | -0.28% | -0.26% | 0.18% | 0.06% | |
| CHF | -0.26% | -0.19% | -0.20% | -0.35% | -0.31% | 0.12% | -0.07% |
The heat map shows percentage changes of major currencies against each other. The base currency is picked from the left column, while the quote currency is picked from the top row. For example, if you pick the Euro from the left column and move along the horizontal line to the Japanese Yen, the percentage change displayed in the box will represent EUR (base)/JPY (quote).
Technical analysis: Canadian Dollar churns against Greenback after backsliding to 1.3600
The Canadian Dollar (CAD) kicked off Wednesday by stumbling back against the US Dollar (USD), pushing the USD/CAD pair into the 1.3600 handle. The CAD recovered into the day’s opening range, sticking close to 1.3560. Intraday action has a technical floor priced in at the 200-day Simple Moving Average (SMA) at 1.3515, and 1.3600 remains a key technical ceiling.
USD/CAD continues to churn in the same neighborhood as the 200-day SMA at 1.3480, and a rising higher lows pattern remains firmly printed into the charts, but momentum remains low. The pair is broadly stuck in a medium-term range, with bids cycling the midpoint between late December’s swing low into 1.3200 and last November’s peak bids near 1.3900.
USD/CAD hourly chart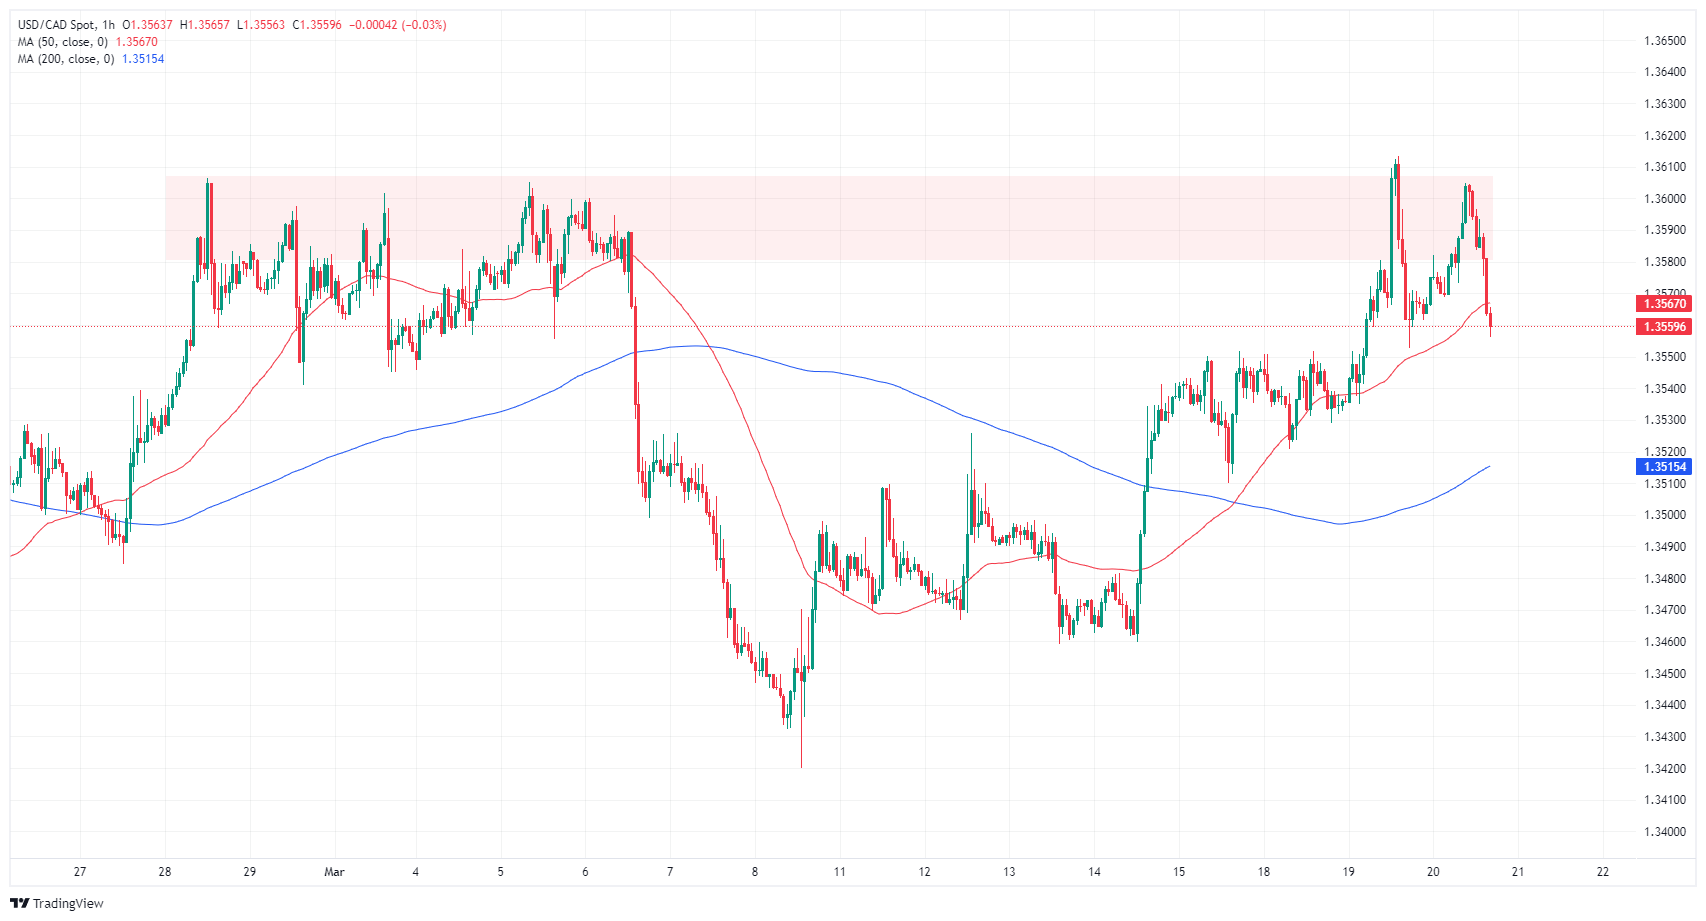
USD/CAD daily chart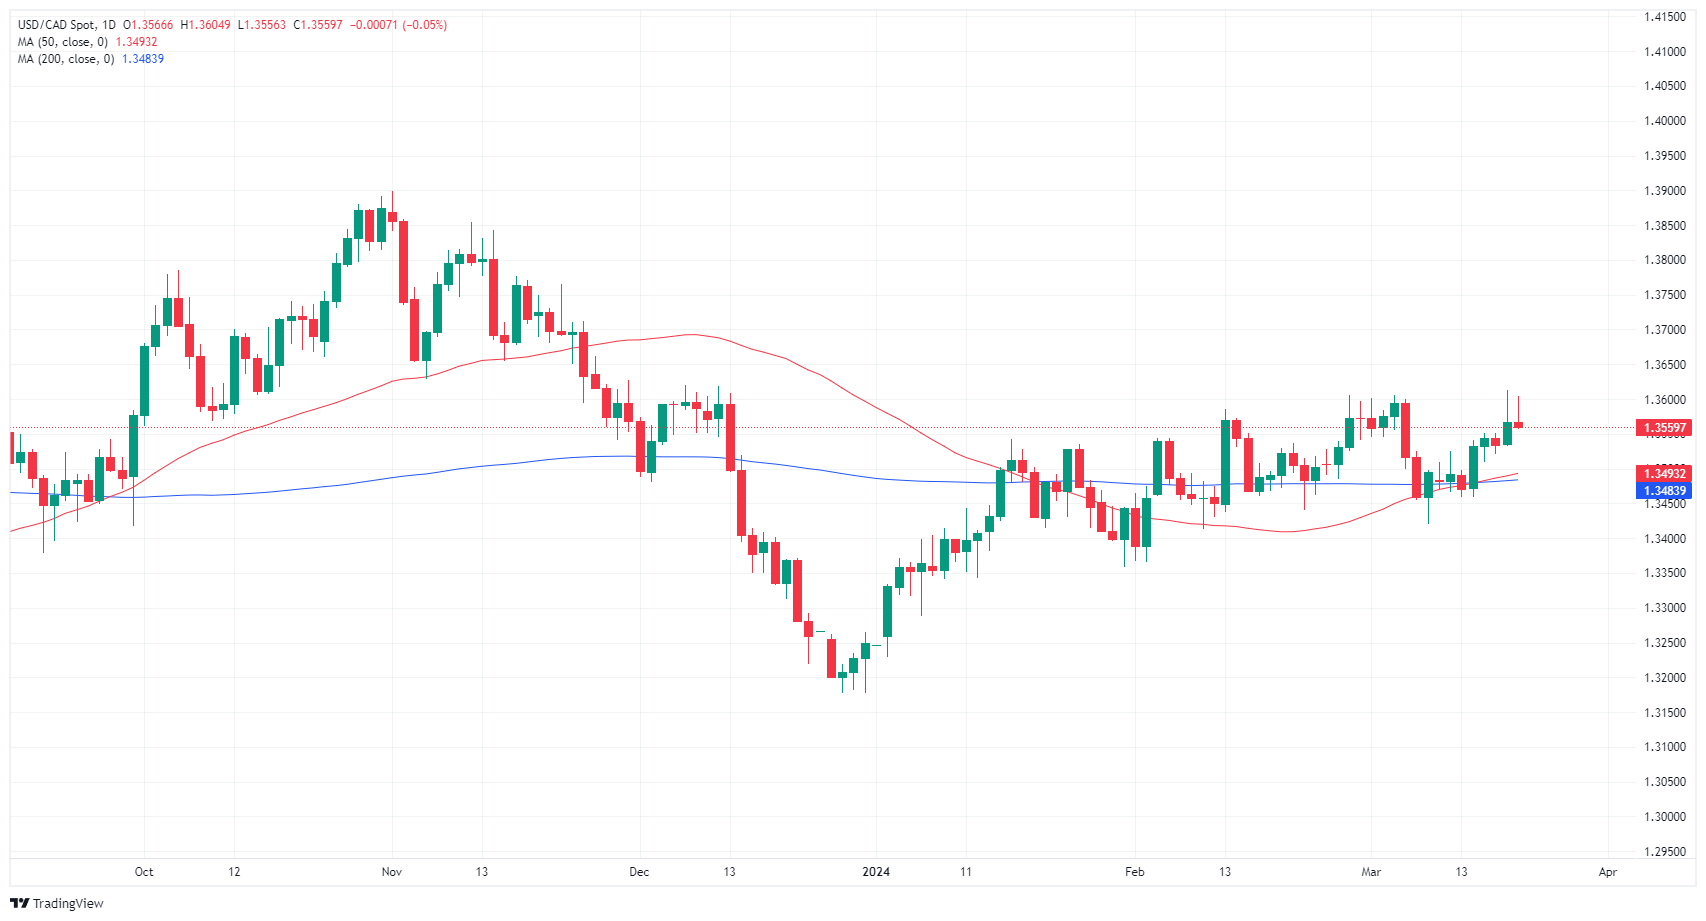
Canadian Dollar FAQs
The key factors driving the Canadian Dollar (CAD) are the level of interest rates set by the Bank of Canada (BoC), the price of Oil, Canada’s largest export, the health of its economy, inflation and the Trade Balance, which is the difference between the value of Canada’s exports versus its imports. Other factors include market sentiment – whether investors are taking on more risky assets (risk-on) or seeking safe-havens (risk-off) – with risk-on being CAD-positive. As its largest trading partner, the health of the US economy is also a key factor influencing the Canadian Dollar.
The Bank of Canada (BoC) has a significant influence on the Canadian Dollar by setting the level of interest rates that banks can lend to one another. This influences the level of interest rates for everyone. The main goal of the BoC is to maintain inflation at 1-3% by adjusting interest rates up or down. Relatively higher interest rates tend to be positive for the CAD. The Bank of Canada can also use quantitative easing and tightening to influence credit conditions, with the former CAD-negative and the latter CAD-positive.
The price of Oil is a key factor impacting the value of the Canadian Dollar. Petroleum is Canada’s biggest export, so Oil price tends to have an immediate impact on the CAD value. Generally, if Oil price rises CAD also goes up, as aggregate demand for the currency increases. The opposite is the case if the price of Oil falls. Higher Oil prices also tend to result in a greater likelihood of a positive Trade Balance, which is also supportive of the CAD.
While inflation had always traditionally been thought of as a negative factor for a currency since it lowers the value of money, the opposite has actually been the case in modern times with the relaxation of cross-border capital controls. Higher inflation tends to lead central banks to put up interest rates which attracts more capital inflows from global investors seeking a lucrative place to keep their money. This increases demand for the local currency, which in Canada’s case is the Canadian Dollar.
Macroeconomic data releases gauge the health of the economy and can have an impact on the Canadian Dollar. Indicators such as GDP, Manufacturing and Services PMIs, employment, and consumer sentiment surveys can all influence the direction of the CAD. A strong economy is good for the Canadian Dollar. Not only does it attract more foreign investment but it may encourage the Bank of Canada to put up interest rates, leading to a stronger currency. If economic data is weak, however, the CAD is likely to fall.
- Mexican Peso up vs. US Dollar, eyes on Fed and Banxico meetings.
- Banxico may ease policy, affecting USD/MXN as rates diverge in favor of Greenback.
- Mexico's inflation data on Thursday to hint at Peso's path.
- Fed's rate stance and hawkish cues might underpin USD/MXN with resistance levels the focus.
The Mexican Peso (MXN) recovers some territory on Wednesday against the US Dollar (USD) ahead of the US Federal Reserve’s (Fed) monetary policy decision at 18:00 GMT. During the first half of the week, the Mexican currency has been on the defensive amid speculation that on Thursday the Bank of Mexico – also known as Banxico – might begin its easing cycle. Consequently, the reduction of the interest rate spread between the US and Mexico could underpin the Greenback. At the time of writing, the USD/MXN trades at 16.78, down 0.14%.
Mexico’s economic calendar remains absent on Wednesday, but it will gather pace on Thursday. Besides Banxico’s decision, economic growth data and mid-month inflation figures in March, which are expected to remain virtually unchanged compared to previous readings, could impact the USD/MXN exchange rate.
The market anticipates the Fed maintaining interest rates at their current levels, but there is speculation of a hawkish tilt. This could potentially impact the USD/MXN exchange rate. Policymakers will update their economic and monetary policy projections – the so-called Dot Plot. If just two of the dots move up, that would indicate the Fed is considering two interest rate cuts instead of the three initially projected in the December meeting.
That could drive the USD/MXN higher toward the 17.00 figure, and buyers could threaten to break key resistance levels.
Daily digest market movers: Mexican Peso shrugs off Banxico’s imminent cut and rises
- Estimates that Banxico will lower the interest rate from 11.25% to 11% put “some” pressure on the Mexican currency, which could lift the USD/MXN toward the 17.00 mark.
- Mexico’s economic data released in the week:
- Aggregate Demand rose by 0.3% QoQ in Q4, up from 0%. On an annual basis, it decelerated from 2.7% to 2.6%.
- Private Spending on a quarterly basis slowed from 1.2% to 0.9%. On a yearly basis, it improved from 4.3% to 5.1%.
- On March 21, Banxico is expected to decrease interest rates, even though it could feature a 3-2 vote split. Recent speeches and media appearances show that Banxico’s Governing Council is divided, with Governor Victoria Rodriguez Ceja, Omar Mejia Castelazo and Galia Borja Gomez leaning dovish. On the hawkish front lie Jonathan Heath and Irene Espinosa Cantellano.
- The slowdown in Mexico’s economy is one of the main reasons that Banxico is eyeing the first cut. Mexico’s central bank expects the economy to grow 2.8% YoY in 2024, down from 3%, but maintained at 1.5% for 2025.
- The latest inflation figures in the United States prompted investors to price in a less dovish stance. Money market futures have adjusted their rate cut expectations to be more in line with the Fed's as they foresee the Federal Funds Rate (FFR) at 4.71% toward the end of the year. Analysts estimate the Fed will not change its Federal Funds Rates (FFR) level until June or later.
- US Treasury bond yields drop, but the US Dollar Index (DXY) advances 0.13%, up at 103.95, capping the USD/MXN fall.
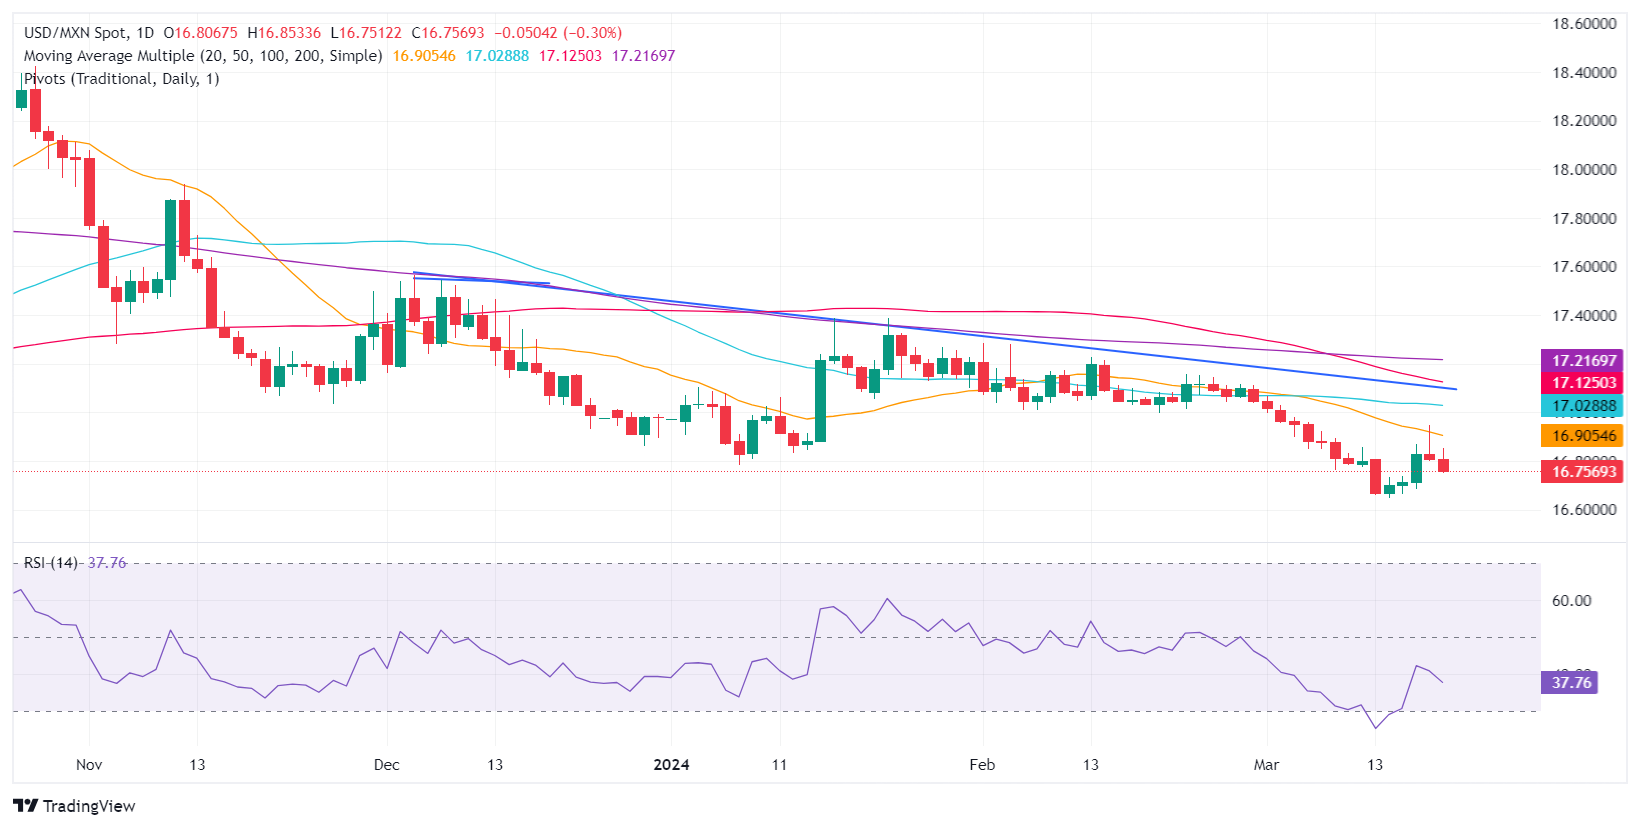
Technical analysis: Mexican Peso counterattacks as USD/MXN slumps below 16.80
The USD/MXN is neutral to downwardly biased after buyers lifted the exchange rate to a weekly high of 16.94 before retreating beneath 16.80. If the pair extends its losses below 16.78, the January 8 swing low, that could exacerbate a test of last year’s low of 16.62 before diving to 16.32, the October 2015 low.
On the other hand, if buyers lift the pair above the current week’s high of 16.94, that would pave the way for testing 17.00. The next key resistance levels would be the 50-day Simple Moving Average (SMA) at 17.02, the 100-day SMA at 17.16, and the 200-day SMA at 17.21.
USD/MXN Price Action – Daily Chart
Mexican Peso FAQs
The Mexican Peso (MXN) is the most traded currency among its Latin American peers. Its value is broadly determined by the performance of the Mexican economy, the country’s central bank’s policy, the amount of foreign investment in the country and even the levels of remittances sent by Mexicans who live abroad, particularly in the United States. Geopolitical trends can also move MXN: for example, the process of nearshoring – or the decision by some firms to relocate manufacturing capacity and supply chains closer to their home countries – is also seen as a catalyst for the Mexican currency as the country is considered a key manufacturing hub in the American continent. Another catalyst for MXN is Oil prices as Mexico is a key exporter of the commodity.
The main objective of Mexico’s central bank, also known as Banxico, is to maintain inflation at low and stable levels (at or close to its target of 3%, the midpoint in a tolerance band of between 2% and 4%). To this end, the bank sets an appropriate level of interest rates. When inflation is too high, Banxico will attempt to tame it by raising interest rates, making it more expensive for households and businesses to borrow money, thus cooling demand and the overall economy. Higher interest rates are generally positive for the Mexican Peso (MXN) as they lead to higher yields, making the country a more attractive place for investors. On the contrary, lower interest rates tend to weaken MXN.
Macroeconomic data releases are key to assess the state of the economy and can have an impact on the Mexican Peso (MXN) valuation. A strong Mexican economy, based on high economic growth, low unemployment and high confidence is good for MXN. Not only does it attract more foreign investment but it may encourage the Bank of Mexico (Banxico) to increase interest rates, particularly if this strength comes together with elevated inflation. However, if economic data is weak, MXN is likely to depreciate.
As an emerging-market currency, the Mexican Peso (MXN) tends to strive during risk-on periods, or when investors perceive that broader market risks are low and thus are eager to engage with investments that carry a higher risk. Conversely, MXN tends to weaken at times of market turbulence or economic uncertainty as investors tend to sell higher-risk assets and flee to the more-stable safe havens.
- The daily chart reveals bullish sentiment, with RSI on an upward trajectory out of the negative zone and MACD depicting decreasing red bars.
- Indicators are consolidating overbought conditions on the hourly chart.
- Bulls must recover the 20-day SMA to confirm a recovery.
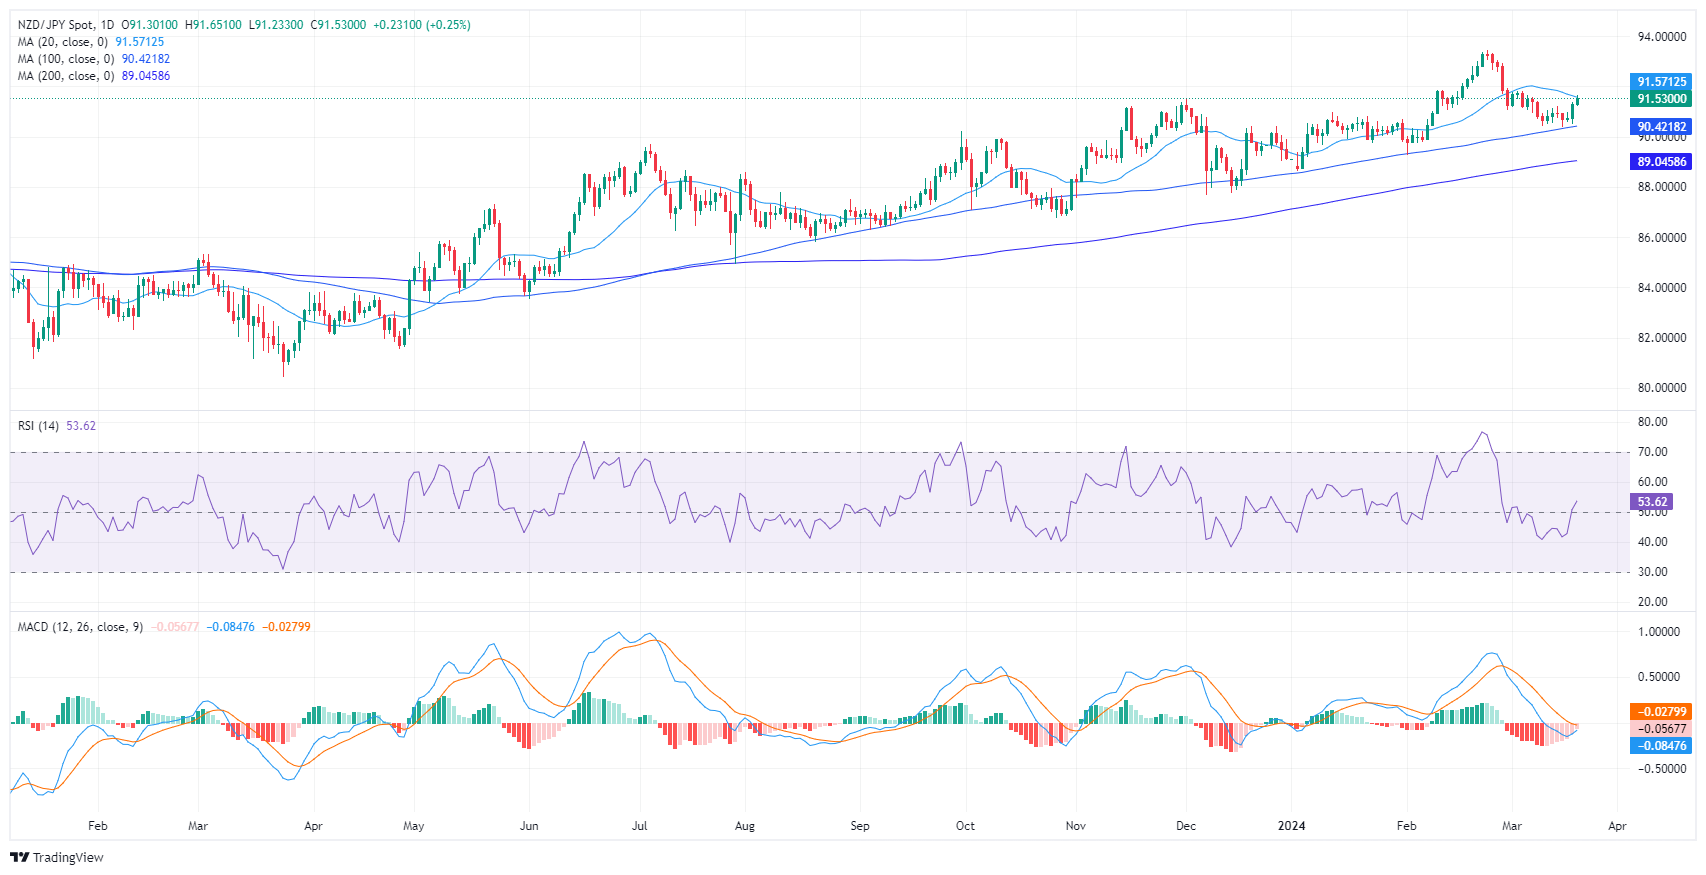
The NZD/JPY currency pair is trading at 91.54, showing gains in Wednesday's session. The broader technical landscape suggests the buyers. Despite recent bearish activity pushing the pair below the 20-day Simple Moving Averages (SMAs), the pair remains aloft of the 100 and 200-day SMAs, indicating an enduring bullish control.
On the daily chart, the NZD/JPY pair exhibits relatively bullish momentum. The Relative Strength Index (RSI) indicates a positive trend with an upward slope, moving above the negative territory. This, combined with the decreasing red bars from the Moving Average Convergence Divergence (MACD) which indicates declining negative momentum, suggests the buyers are gaining the upper hand over sellers.
NZD/JPY Daily Chart
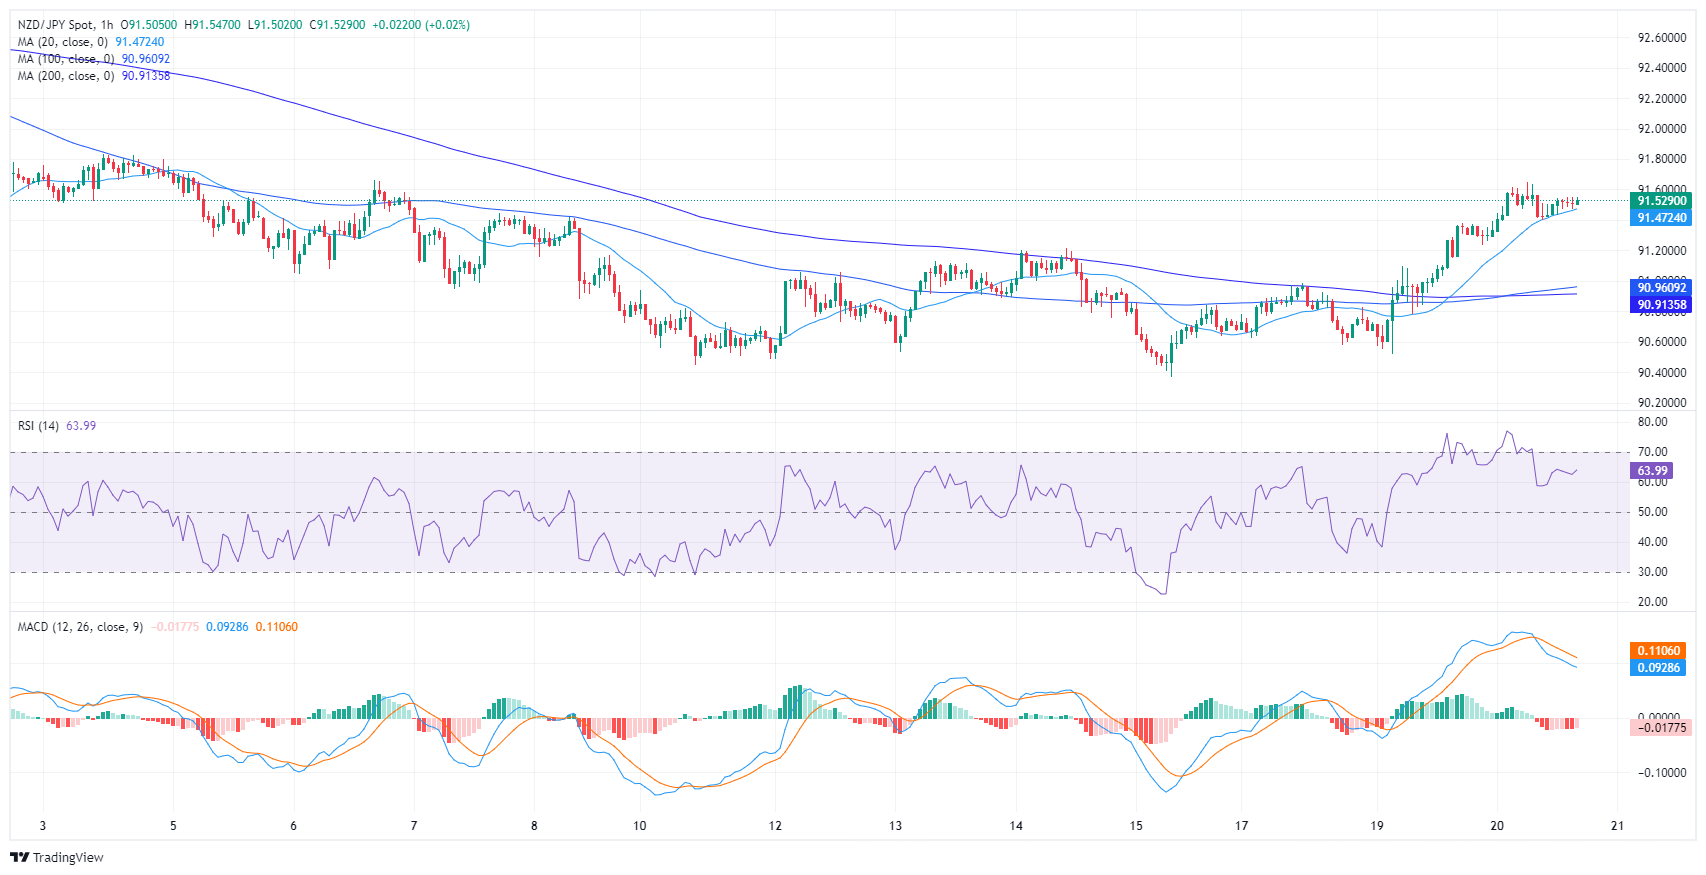
Transitioning to the hourly chart for the NZD/JPY presents a slightly different scenario. Here, the RSI consistently indicates positive with minor fluctuations, hinting at strong buying momentum but consolidating after entering in the overbought area during the European session. Meanwhile, the MACD reveals flat red bars, signifying stagnant negative momentum suggesting that the buyers are gearing up for the next upward leg.
NZD/JPY Hourly Chart
After jumping out of the blocks at the start of the year, the US Dollar (USD) has run out of steam and is almost back to where it started 2024 against a basket of 26 currencies.
Monetary easing in the US to be less aggressive than in the rest of the world
The recent USD weakness probably reflects a sanguine view of a soft landing for the US economy, with very limited collateral damage to corporate earnings and limited job losses.
As we remain skeptical of this view and expect monetary easing in the US to be less aggressive than in the rest of the world, where negative growth is widespread, we expect the Dollar to rebound in the coming months.
- NZD/USD breaks to fresh lows after breaking out of the bottom of a multi-month range.
- The pair is now oversold and could correct back in the near-term.
- Eventually NZD/USD is likely to continue its descent towards bearish price targets.
NZD/USD has broken out of the bottom of a long-term range and despite reaching oversold extremes is tipped to go even lower.
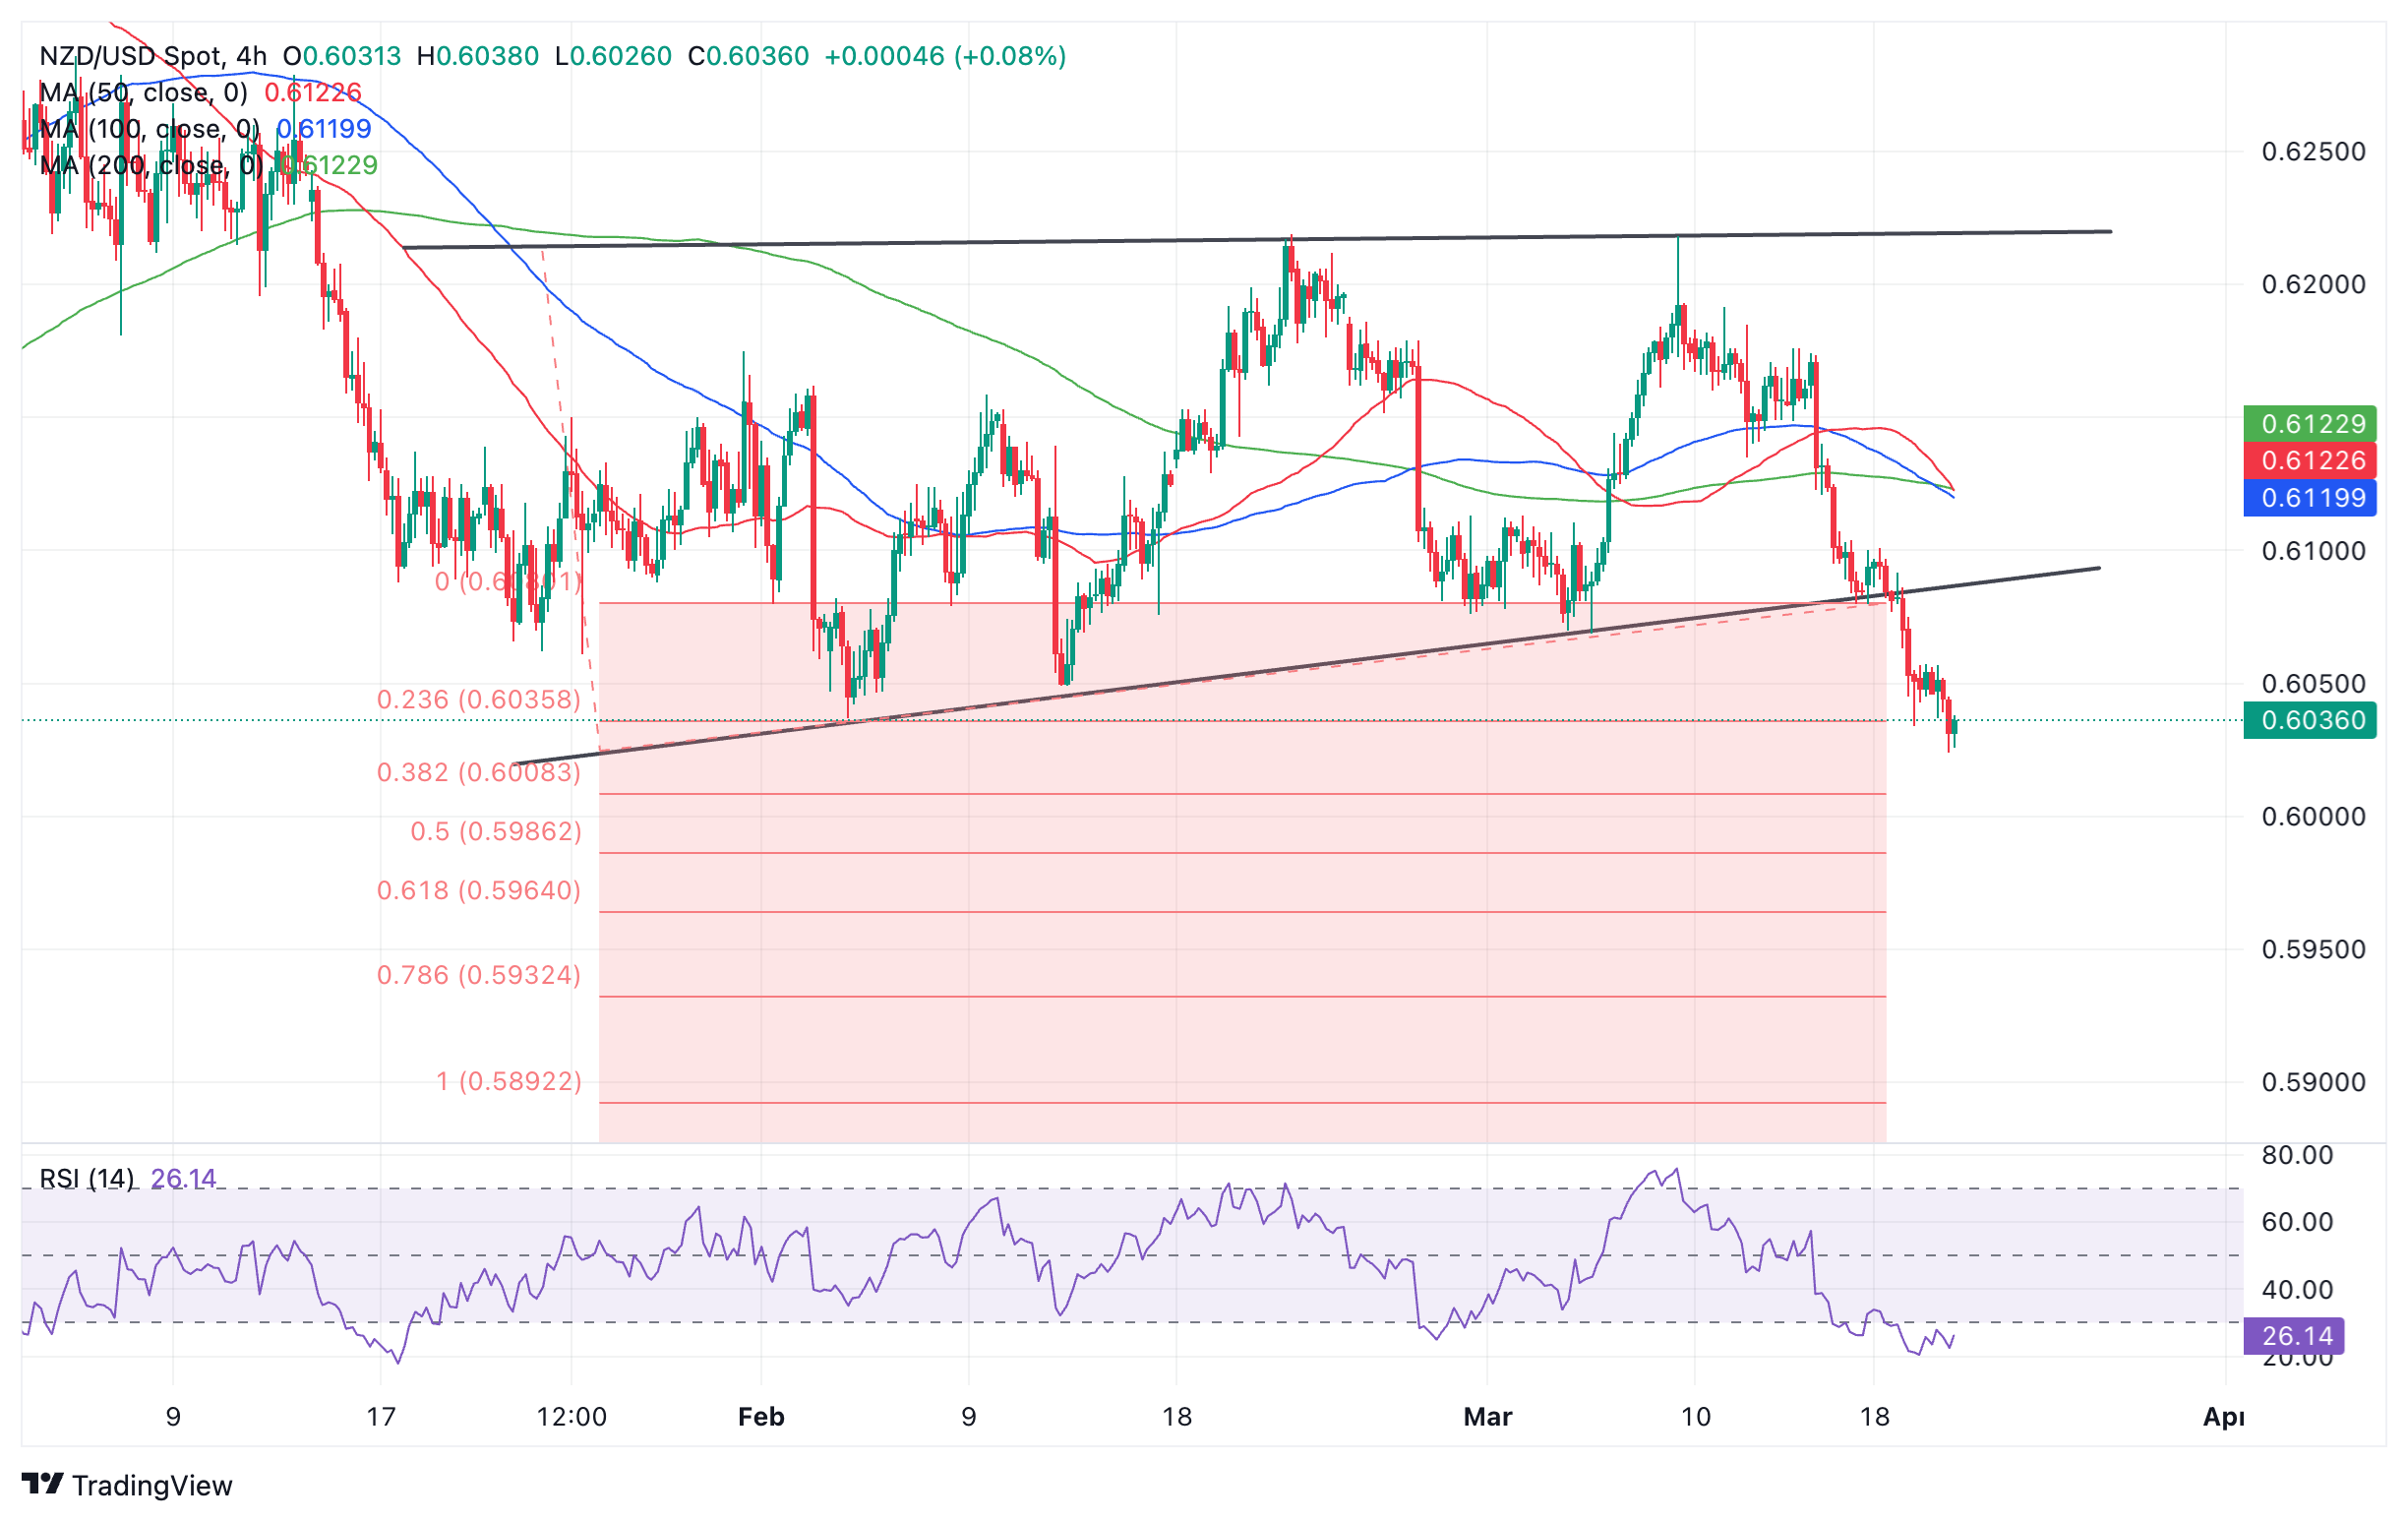
The NZD/USD had been oscillating within a multi-month range stretching from a floor at about 0.6080 to a ceiling at roughly 0.6210. On Tuesday it decisively broke below the floor and took a step lower – a bearish sign for price.
New Zealand Dollar versus US Dollar: 4-hour chart
NZD/USD is currently trading at around 0.6035 and at oversold extremes according to the Relative Strength Index (RSI) momentum indicator. This indicates that there is a possibility the pair could pullback higher. The signal for a would come from the RSI existing oversold and rising again.Traders are advised not to add any more short-orders to their positions whilst the RSI is oversold and to close shorts when the indicator rises out of oversold.
Despite warning signs of a correction the longer-term outlook remains bearish. The pair is in an established short-term downtrend, with progressively lower peaks and troughs in the price action, and given the old adage that “the trend being your friend,” this suggests more downside as probable.
Further, NZD/USD has broken out of a long-term range and according to technical analysis theory the height of the range can be used as a guide to how much lower the pair could go. In the case of NZD/USD it suggests more downside is on the horizon.
The 0.618 Fibonacci ratio of the height of the range extrapolated from the breakout point lower provides an initial target at 0.5964. The 1.000 ratio provides a further target at 0.5892.
Economists at ING expect the EUR/USD pair to trend higher throughout the second half of 2024.
The Fed is the single most important driver of EUR/USD
The Fed is, and should remain, the single most important driver of EUR/USD: our call is they will cut more than markets expect and crucially around 50 bps more than the ECB.
Given that we also see both central banks starting to ease in June, we expect a bigger rally in EUR/USD in the second half of the year, when USD:EUR short-term rate convergence should accelerate. We target 1.1400 in 4Q24.
Rising geopolitical tensions, upward pressure on energy prices and a potential re-election of Donald Trump could all lead to a stronger Dollar.
- Core and headline inflation figures were softer than expected for February.
- Monetary policy divergences between the BoE and ECB continue favoring the GBP.
- The BoE meets on Thursday, a hold is priced in and the first cut is seen in August.
- The first cut from the ECB was seen in June.
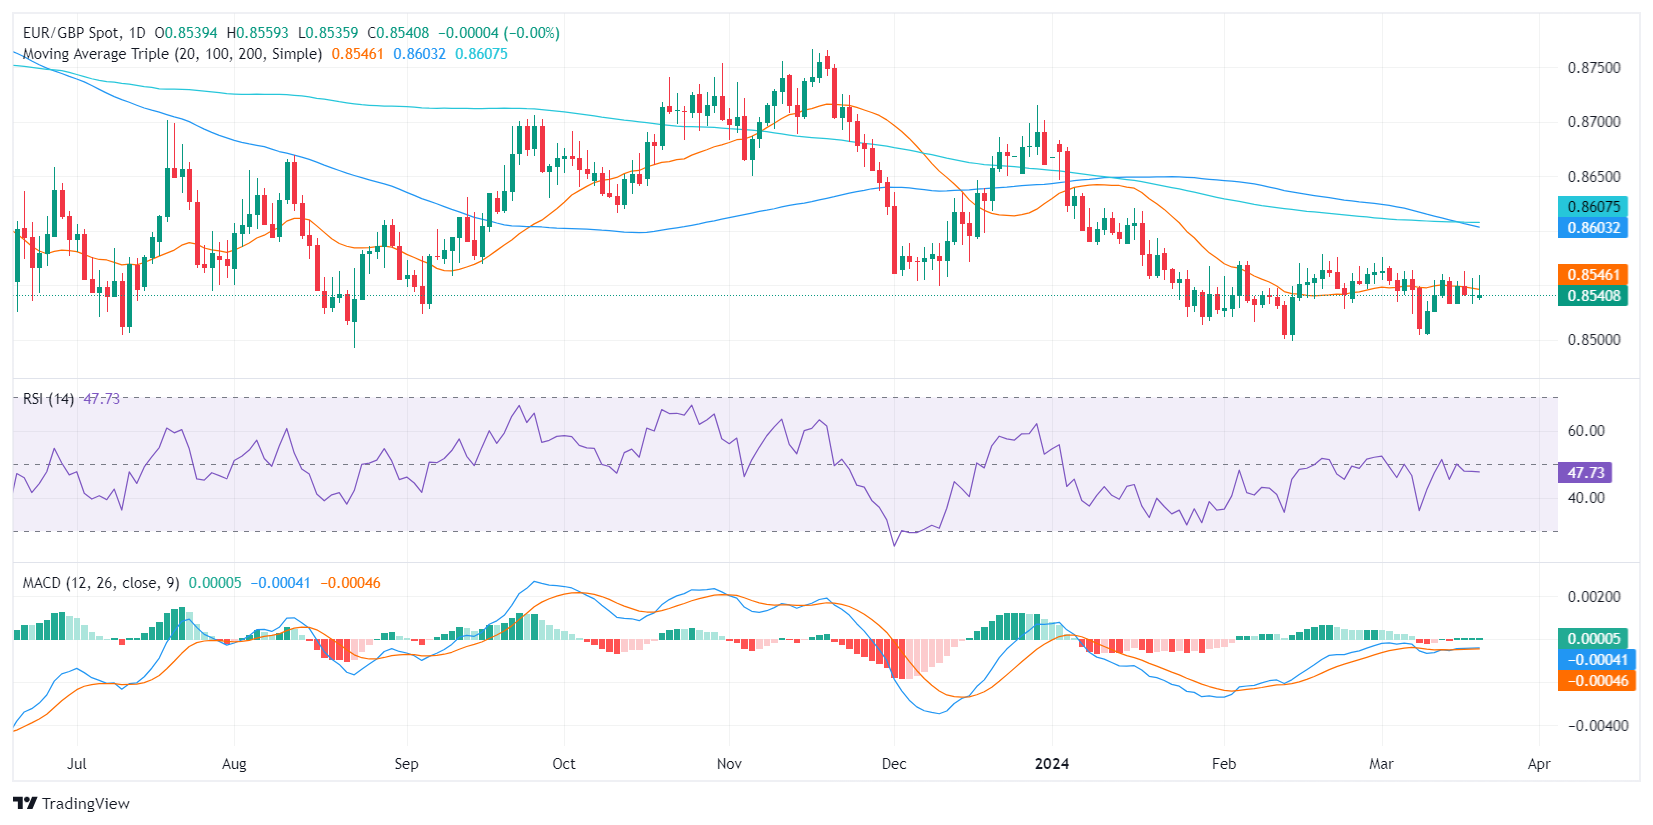
The EUR/GBP is currently experiencing mild gains, trading at 0.8541 after peaking at a high of 0.8560. Markets are digesting British inflation data from February and gearing up for the Bank of England’s (BoE) decision on Thursday. In the meantime, monetary policy divergences between the BoE and the European Central Bank (ECB) give the GBP an advantage over the EUR/p>
The UK saw a softening in February CPI figures, with headline inflation at 3.4% YoY compared to January's 4.0%, and core inflation at 4.5% YoY down from 5.1%. Despite expectations, these numbers were slightly lower, marking the lowest since September 2021 but still above the 2% target. With the Bank of England's decision imminent, a policy hold is anticipated. However, given persistently high services inflation at 6.1% YoY, the BOE may take time to loosen policy. Market expectations of a 25 bp rate cut in August followed by two more by year-end are fully priced in. On the other hand, the ECB easing cycle is seen starting in June, followed by cuts in September and October. Investors see some chances of an additional cut in December as well.
EUR/GBP technical analysis
On the daily chart, the Relative Strength Index (RSI) for the EUR/GBP pair resides in negative territory, suggesting a slight bearish momentum. Despite brief transitions into positive territory, the RSI has reverted to negative levels in recent sessions, revealing that sellers maintain dominance. The green bars on the Moving Average Convergence Divergence (MACD) histogram reflect positive momentum, albeit flat, potentially indicating a weak presence of the bulls.
Regarding the overall trend, the pair is trading below its 20, 100, and 200-hour Simple Moving Averages, which gives arguments for a bearish outlook
EUR/GBP daily chart
The US Dollar (USD) is consolidating Tuesday’s gains. Economists at BBH analyze how the US Dollar (USD) could react to the Fed’s decision.
The risk is the Fed’s new funds rate projections imply less easing over 2024 and 2025
The two key points to scrutinize are: (i) The press release. A dovish risk is the press release is tweaked to signal greater confidence that inflation is moving sustainably towards 2%, in line with recent comments by Chair Powell. (ii) Summary of Economic Projections. Sticky underlying US inflation and an encouraging economic growth outlook suggest the risk is the Fed’s new funds rate projections (the so-called Dot Plot) imply less easing over 2024 and 2025.
If the Fed turns less dovish, the USD rally will get turbocharged as Fed funds rate expectations adjust higher. In contrast, if the Fed dismisses the latest high US inflation readings as noise and powers forward with a dovish outlook, USD will come under renewed downside pressure.
EUR/USD held steady below 1.0900. Economists at Commerzbank analyze how the Fed decision could impact the pair.
‘Dot plot’ is where the greatest potential for a decent Dollar movement lies
The new inflation and growth forecasts will be published, but above all the interest rate expectations of the FOMC members, the so-called ‘dot plots’. I think this is where the greatest potential for a decent Dollar movement lies, although the topic of balance sheet normalization (quantitative tightening) will certainly also take up quite some space.
The front end of the dots alone has to actually drift upwards to take into account the current, actual circumstances (that the Fed has become more cautious with regard to interest rate cuts since December). This alone could be interpreted by the market as a confirmation of its expectations and therefore positive for the Dollar, although it is only an overdue adjustment to reality.
If there are signs that the FOMC members are becoming more cautious about the timing and extent of future rate cuts, the Dollar may well gain further and EUR/USD may slip towards the 1.0800 mark.
- USD/JPY rallies up to multi-year highs in the 151.000s – a historical BoJ intervention zone.
- The move is backed by USD strength as interest rates are seen remaining high in the US.
- The BoJ raised interest rates but this did not defend the Yen as expected, since Japanese rates remain extremely low.
The USD/JPY rallies to multi-year highs in the 151.000s on Wednesday on the back of broad-based US Dollar (USD) strength ahead of the Federal Reserve policy meeting and a “one and done” trade weakening the Japanese Yen (JPY).
The USD/JPY is reaching an intervention zone where the Bank of Japan (BoJ) has historically been known to intervene in FX markets to prop up the Yen, and this could provide an obstacle to more upside for the pair.
USD/JPY enters intervention zone
The USD/JPY has rallied back up to the level of previous multi-year highs in the 151.000s. Both in October 2022 and 2023 the pair rose to the 151.000s amid JPY weakness and USD strength, however, both times it was pushed back down.
The reason for the reversal at this level has been put down to the fact it is an intervention zone for the BoJ. Above 150.000 the Yen becomes uncomfortably weak for the BoJ and it tends to intervene to prop it up using its FX reserves to buy Yen, according to analysts at MUFG.
“A break of that high (2023 high) could well be accepted in Tokyo but we would still assume intervention would happen quite soon after that, especially with the BoJ’s action this week at least now consistent with Yen buying intervention.”
This suggests USD/JPY could be close to a peak.
Yen weakens after BoJ meeting, in counter-intuitive move
The Yen has sold-off after the Bank of Japan (BoJ) ended eight years of negative interest rates and made its first interest rate hike since 2007. On Tuesday, the BoJ raised interest rates from minus 0.1% to a range between 0.0% and 0.1%.
Normally such a move would be expected to strengthen a currency, since higher interest rates attract greater inflows of foreign capital, however, in the case of the Yen the opposite happened.
One reason given for the Yen’s counter-intuitive response is that despite the hike, interest rates in Japan are still so low relative to other countries that JPY remains a favored “funding currency” by international investors. This means they borrow in the Yen (because of the low interest repayments) in order to buy other currencies which pay higher interest rate returns.
“The broad-based view is that the gulf in interest rates between Japan and many other central banks in the G10 space means that the Yen will still be used as a funding currency in a low-volatility world.” Say analysts at ING.
A further reason for the Yen weakness following the BoJ decision is the view that the interest rate hike was just a “one off” rather than the start of the hiking cycle.
“While the BoJ may be able to hike rates again this year, this prospect currently remains highly uncertain.” Say analysts at Rabobank.
Much depends on whether wage gains negotiated by Japanese workers’ unions percolate out to the wider working population, since only 30% of workers belong to unions.
“Assuming the strong pay deals awarded to unionised workers spread out to the 70% of employees who are not in a union, Japan’s real wage growth could soon be turning higher. Policymakers will be hoping that this boosts consumption which in turn supports corporate profitability. This would indicate that the BoJ’s virtuous cycle is complete.” Says Rabobank.
USD/JPY rally put down to USD strength
The US Dollar is gaining ground across the board on the back of expectations the Federal Reserve (Fed) will keep interest rates higher for longer in the US, due to stubbornly high inflation. This too is a factor in the USD/JPY’s gains.
There is even speculation that the Fed will reduce the number of rate cuts it expects to make in its Summary of Economic Projections (SEP), a set of forecasts which it publishes at the same time as it announces its monetary policy decision.
In the December SEP the Fed forecast three 0.25% rate hikes in 2024, but analysts at Nordea Bank and Macquarie, to name two, are expecting that to be reduced to two cuts in the March SEP.
Such a move would be even more bullish for USD and USD/JPY.
- The Pound falls versus Dollar, awaiting Fed policy news.
- GBP/USD nears 50-day MA; further drops possible as bears target 1.2600.
- Break below 1.2700 may seek weekly lows, with rebound eyeing March highs.
The Pound Sterling drops some 0.12% against the US Dollar in early trading during the North American session as traders brace for the Federal Reserve’s monetary policy. A softer inflation report in the United Kingdom (UK) didn’t move the needle in the session, as the GBP/USD trades at 1.2706, with sellers hoping to push prices below the 1.2700 mark.
GBP/USD Price Analysis: Technical outlook
The daily chart portrays the pair as neutral biased; GBP/USD buyers leaned into the 50-day moving average (DMA) at 1.2685, the day’s low, but edged above the 1.2700 handles and hovered around that area. The Relative Strength Index (RSI) points downward below the 50-midline, indicating that selling pressure remains.
If the GBP/USD extends its losses below 1.2700, it will challenge the 50-DMA, followed by the current week’s low of 1.2667. A further downside is seen at the 100-DMA at 1.2619, ahead of the 1.2600 figure.
On the flip side, if buyers reclaim the March 18 high of 1.2746 and break a resistance trendline at around the 1.2745/55 area, expect a recovery toward the 1.2800 mark.
GBP/USD Price Action – Daily Chart
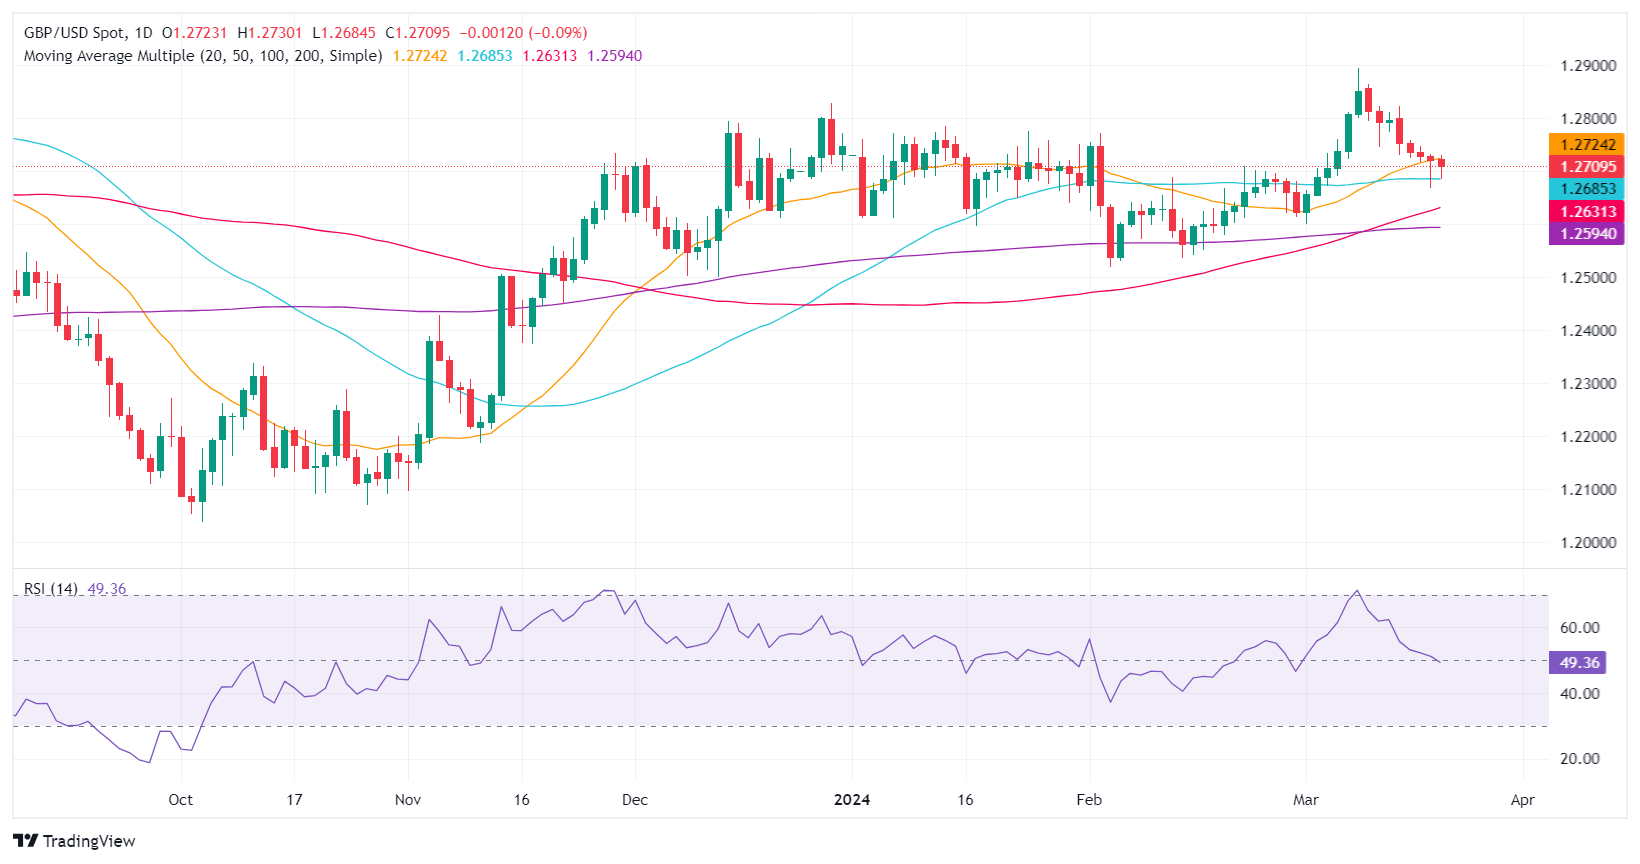
Gold is making new highs. Economists at Société Générale analyze the yellow metal’s outlook.
Objectives at $2,250/$2,360 after vaulting upper limit of multi-year range
Gold has established itself above the upper part of its multi-year range ($2,075) in the form of a rectangle; this denotes the uptrend has resumed. It has also overcome the peak achieved in December. The break from multi-year consolidation points towards the possibility of larger upside.
The up move is likely to extend towards the next objectives located at projections of $2,250 and $2,360. The target for the rectangle is located at $2,460.
The upper limit of the rectangle at $2,075 is near-term support.
- EUR/JPY jumps to 164.50 amid uncertainty over BoJ’s holding the exit to negative interest rates.
- BoJ Ueda pledges to keep monetary policy accommodative for some time.
- ECB Lagarde is confident of gaining evidence that inflation will return to the 2% target.
The EUR/JPY rises to 164.50 in Wednesday’s early American session. The cross strengthens amid broad selling in the Japanese Yen after Bank of Japan (BoJ) Governor Kazuo Ueda didn’t provide guidance on future policy steps or the pace of policy normalization.
Apart from that, the BoJ pledges to keep its policy stance accommodative for the time being. The BoJ’s decision to exit its negative interest rate policy, along with the maintenance of an accommodative stance, indicates that the central bank is unsure that the wage growth cycle is strong enough to keep inflation sustainably above 2%.
Meanwhile, the Euro holds strength against the Japanese Yen despite European Central Bank (ECB) President Christine Lagarde delivering a slight dovish guidance on interest rates. ECB Lagarde said “The latest wage data points in an encouraging direction.” This indicates that the wage growth is getting consistent with the pace required to bring down inflation to the 2% target. Slowing wage growth would deepen expectations for the ECB to begin reducing interest rates from the June policy meeting.
Apart from that, Lagarde’s confidence that the central bank will get evidence of inflation easing to 2% has increased speculation for interest rates reducing from June. ECB Lagarde said, “In the coming months, we expect to have two important pieces of evidence that could raise our confidence level sufficiently for a first policy move.”
USD gains extend as investors look ahead to the FOMC meeting outcome. Economists at Scotiabank analyze Greenback’s outlook.
Markets will be sensitive to the refreshed dot plot and economic projections
No change in Fed policy is expected. The target rate will remain at 5.50% and the policy statement may not alter that much from January. Markets will be sensitive to the refreshed dot plot and economic projections, however, and will pay close attention to Chairman Powell’s press conference for guidance on the rate outlook.
Despite sticky inflation data, policymakers may not have enough information at hand to revise their outlook significantly; there may be some marginal changes to the dot plot but it may still reflect a median decline of 75 bps in the target rate this year.
Any modest revisions to the inflation outlook (higher) could be offset by revisions to growth and jobs (weaker).
Markets are wary of the Fed sounding hawkish in some form so positioning/sentiment will be vulnerable to an outcome that leans neutral and sounds a bit dovish relative to expectations.
- The XAG/USD stands firm near $24.90 in Wednesday's session.
- US Treasury yields are mixed with some rising and others declining.
- Jerome Powell's presser and the updated Dot Plots may fuel volatility in the bond market.
In Wednesday's session, the XAG/USD traded at $24.90, marking a 0.20% increase. While investors await the Federal Reserve (Fed) decision, the US Treasury bond yields, often seen as the cost of holding non-yielding metals, remain calm but could face aggressive movements if the bank delivers a dovish or hawkish surprise.
Markets will closely look at the updated Dot Plots and see if the Fed officials still see 100 bps of easing in 2024. As for now, Jerome Powell was seen somewhat dovish in his testimony before Congress while the Fed officials remained cautious. Meanwhile, the odds of a cut in May remain low while the doves continue to bet on the easing cycle to kick off in June.
XAG/USD technical analysis
Based on the indicators of the daily chart, the Relative Strength Index (RSI) for the XAG/USD pair leans positive, predominantly displaying values in the 60s range. This reveals a dominance of buyers in the market, deepening the positive terrain. Combined with the decreasing green bars of the Moving Average Convergence Divergence (MACD) histogram, momentum seems to shift towards a slight downturn. Still, the bullish phase with moderate volatility is maintained.
From a Simple Moving Average (SMA) analysis perspective, the pair is above the 20, 100, and 200-day SMAs, suggesting that the bulls have firm control in the overall trend.
XAG/USD daily chart
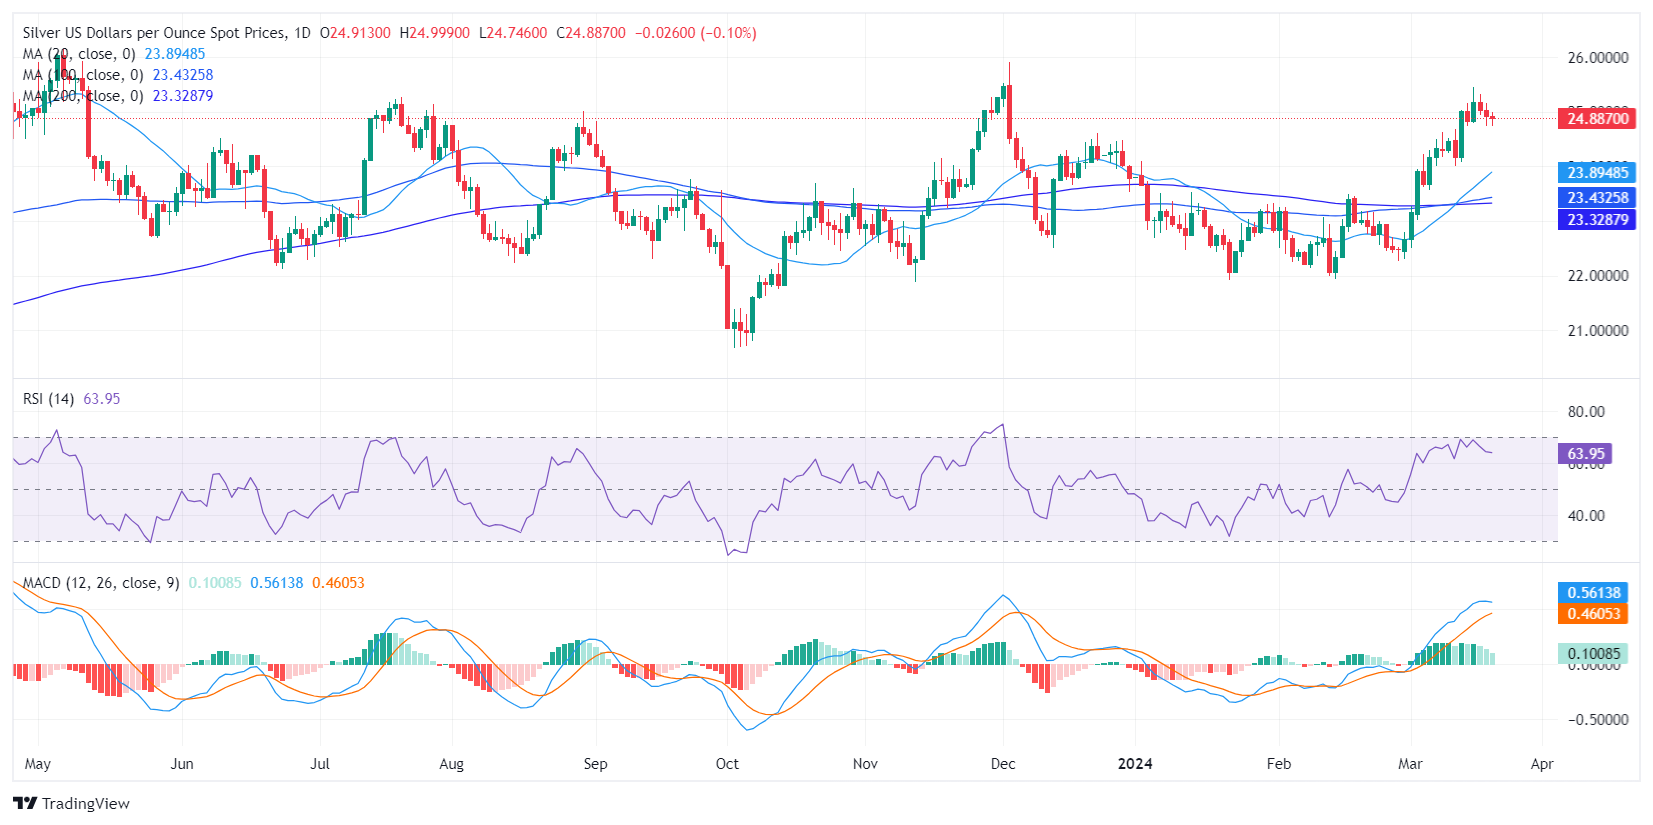
Short covering lent some support to the US treasury market on Tuesday and yields are maintaining a slightly lower profile ahead of today’s FOMC meeting. Economists at Rabobank discuss the upcoming Fed decision.
EUR/USD at risk of dipping back to 1.0700 in the weeks ahead
While we recognise the risk that the Fed may be swayed into delaying the start of its rate cutting cycle, we adhere to our long-held central view that the first move is likely to come in June. This forecast references the fact that the Fed may see risks as being balanced between too high inflation on one hand, and the prospect of a hard landing if rates are held at current levels for too long.
Tuesday’s short covering in the Treasury market indicates speculation that the market may have last week overplayed expectations of a hawkish tone from the Fed today. If that is the case, some post meeting profit-taking in long USD positions would be likely. That said, we expect a firm USD to prevail for some months and see risk of EUR/USD dipping back to 1.0700 in the weeks ahead.
The Japanese Yen (JPY) clearly underperformed on the back of the BoJ announcement. Economists at MUFG Bank analyze USD/JPY outlook ahead of the FOMC meeting.
FOMC communication will be key for JPY
The primary risk as we see it is that the FOMC drops a dot from its median dot profile of moves in the fed funds this year from three rate cuts to just two. That action alone would most likely lift yields and help support the Dollar. Still, the OIS market is not hugely out of kilter with that scenario at 20 bps of more cuts. So a bigger move for yields and the Dollar would likely come from not the change in the dots profile from three cuts to two but the communications from Fed Chair Powell that accompanies such a change.
We expect a reasonably balanced Fed communication, no matter what the median dots profile indicates for this year and that should help curtail further USD buying and weaken the current positive momentum (certainly the case of course if the dots profile is unchanged).
If we are incorrect on that, then FX could get interesting as a hawkish communication could see Tokyo’s resolve over limiting Yen depreciation being tested. A Tokyo holiday could exacerbate a move higher and a breach of the 2023 high is certainly feasible. A break of that high could well be accepted in Tokyo but we would still assume intervention would happen quite soon after that, especially with the BoJ’s action this week at least now consistent with Yen buying intervention.
- AUD/USD faces pressure amid cautious market sentiment ahead of Fed policy.
- Investors await the Fed’s dot plot and economic projections for fresh guidance.
- RBA Bullock delivers a neutral interest rate outlook.
The AUD/USD pair faces selling pressure but continues to hold the psychological support of 0.6500 in Wednesday’s late European session ahead of the Federal Reserve’s (Fed) monetary policy decision, which will be announced at 18:00 GMT. The Aussie asset remains on the backfoot as the Australian Dollar weakens as the Reserve Bank of Australia (RBA) Governor Michele Bullock delivers neutral guidance on the Official Cash rate (OCR) after keeping it unchanged at 4.35%.
S&P 500 futures are slightly down in the late London session, portraying caution among market participants ahead of the Fed’s monetary policy announcement. The US Dollar Index (DXY) jumps to 104.10 after continuing its winning spell for the fifth trading session. 10-year US Treasury yields have dropped slightly to 4.28%, remains broadly strong ahead of Fed’s meeting.
The CME Fedwatch tool shows interest rates will remain unchanged in the range of 5.25%-5.50% for the fifth time in a row. The Fed is expected to avoid signalling any timeframe for rate cuts as inflation remains stubbornly higher than the 2% target. Consumer price inflation in February was hotter than expected due to higher food and gasoline prices. The rate cuts are appropriate only if the Fed finds inflation declining to 2% as certain.
Apart from that, Fed’s dot plot and United States economic projections will be keenly watched. The Fed’s dot plot is updated every quarter, shows interest rates projections for different timeframes. December’s dot plot indicated that policymakers see three rate cuts in 2024. The appeal for safe-haven assets would strengthen If the Fed projects fewer rate cuts this time.
The firm USD/CAD undertone persists. Economists at Scotiabank analyze the pair’s outlook.
Seasonal trends turn more constructive for the Loonie in Q2 typically
Seasonal trends turn more constructive for the CAD in Q2 typically. Over the past 25 years, April has delivered the largest, average monthly gain for the CAD versus the USD of the calendar year (+1.1%, according to Blomberg data).
A clear push through 1.3620/1.3625 would sustain the uptrend in USD/CAD and put a retest of the low 1.3700 area on the radar.
Key short-term support remains at 1.3550.
- USD/CAD rallies up to higher 1.3500s following lower-than-expected Canadian CPI.
- The data suggests the Bank of Canada will not need to keep interest rates as elevated – a negative for CAD.
- Traders gear up for the Fed meeting later on Wednesday.
The USD/CAD pair continues its rally, reaching the upper 1.3500s on Wednesday, after the release of softer-than-expected inflation data for February gives the Bank of Canada scope to ease policy in the future.
Easier monetary policy usually means lower interest rates which are negative for a currency as they reduce foreign capital inflows.
The headline Consumer Price Index (CPI) in Canada rose 2.8% YoY in February, which was below economists’ expectations of 3.1% and the previous month’s 2.9%, according to Statistics Canada.
Monthly headline CPI rose 0.3% which was below economists’ estimates of 0.6% but above the 0.0% of January.
Canadian Core CPI rose 2.1% in February compared to 2.4% in January. On a monthly basis, Core CPI increased 0.1%, the same as in January.
The data indicates that the Bank of Canada could tweak its language at the the next meeting in April to sound more dovish, with negative implications for the Canadian Dollar (CAD), but positive for the USD/CAD pair.
“The 3 mma measures of inflation have softened considerably over the last two months. While an encouraging development that could lead to incrementally more dovish language from the BoC at its upcoming 10-April meeting, we still see hopes for an imminent rate cut as premature.” Says David Doyle, head of economics at Macquarie.
Fed meeting ahead
USD/CAD is expected to undergo volatility later in the day when the Federal Reserve wraps up its March policy meeting and announces its decisions at 18:00 GMT.
The Federal Reserve (Fed) is not expected to alter interest rates but there is a chance it could revise its quarterly forecasts and accompanying statement. This could change the outlook for interest rates and therefore the US Dollar (USD) valuation.
There is increasing speculation that the Fed will revise its economic forecasts in the Summary of Economic Projections (SEP) and the “dot plot”, a chart which reflects the Board of Governors’ consensus expectations of the future path of interest rates.
In the December SEP, officials forecast three 25 basis points (0.25%) rate cuts in 2024 but some analysts now think there is a risk that this could be revised down to two 25 bps cuts to reflect inflationary pressures remaining elevated.
Nordea Bank, for example, said in a recent note that, “the Fed will likely need to revise its growth and inflation projections higher for 2024. This could lead to a median FOMC dot plot that shows only two rate cuts this year compared to the latest projection for three rate cuts, made in December 2023.”
Such a move would be positive for USD and USD/CAD, leading to further upside for the pair.
- The US Dollar advances relentlessly for a fifth consecutive day.
- Traders brace for the Fed decision, with Powell and new economic projections on the docket.
- The US Dollar Index snaps above 104.00, continuing its bullish narrative.
The US Dollar (USD) is tearing down the 104.00 level on Wednesday after it briefly failed to do so on Tuesday in the Bank of Japan aftermath. All eyes are on the US, with the US Federal Reserve (Fed) set to issue its monetary policy statement followed by a speech and comments from Fed’s Chairman Jerome Powell. the crucial element will be the so-called dot plot (or Philip’s Curve), which should give markets more insights on whether three or only two cuts are expected for this year.
In the dot plot, each voting member of the Fed’s Federal Open Market Committee (FOMC) will pencil in his or her view on where rates will be in the current year, one year ahead, and in the longer term. Markets have been pushing for a stronger US Dollar these past few days amid increasing speculation that the Fed might signal fewer than three rate cuts for this year. The Dot Plot release this evening will give markets confirmation on this, and could see some US Dollar weakness in case forecasts of three cuts are still on the table.
Daily digest market movers: Ahead of Fed
- The US is mulling to impose sanctions on chips and technology companies from China, Bloomberg reports.
- Ahead of the Fed, the Mortgage Bankers Association has released the weekly Applications Index at -1.6% . The previous number was an increase of 7.1%.
- The Fed Rate Decision release is taking place at 18:00 GMT, which includes:
- The Monetary Policy Statement
- The FOMC Economic Projections
- Near 18:30 GMT, US Fed Chairman Jerome Powell will speak to markets and deliver his statement followed by a Q&A with the press.
- Equities are in the red again despite the US closing bell saw all major indices closing off in the green after the eventful Tuesday.
- According to the CME Group’s FedWatch Tool, expectations for a Fed pause in today’s meeting are at 99%, while chances of a rate cut stand at 1%. For the next meeting on May 1, 92.4% see the rate unchanged, with 7.5% opting for a rate cut..
- The benchmark 10-year US Treasury Note trades around 4.28%, a touch softer than Tuesday.
US Dollar Index Technical Analysis: Does it really matter?
The US Dollar Index (DXY) is heading back above 104.00 on Wednesday ahead of the US Fed rate decision. The strong US Dollar comes as markets start to pare back their euphoria from earlier this year, when three swift rate cuts were expected. Expectations have been tuned down to only two cuts and done. In this context,the dot plot release could see the DXY paring back some earlier gains to look for a balanced middle ground.
On the upside,104.96 remains the first level in sight. Once above there, the peak at 104.97 from February comes into play, ahead of the 105.00 region with 105.12 as the first resistance.
Some support should come in from the 200-day Simple Moving Average (SMA) at 103.70, the 100-day SMA at 103.58, and the 55-day SMA at 103.52. The 103-area, thus, looks well equipped and covered with support levels to catch any retreats in the DXY.
US Dollar FAQs
The US Dollar (USD) is the official currency of the United States of America, and the ‘de facto’ currency of a significant number of other countries where it is found in circulation alongside local notes. It is the most heavily traded currency in the world, accounting for over 88% of all global foreign exchange turnover, or an average of $6.6 trillion in transactions per day, according to data from 2022. Following the second world war, the USD took over from the British Pound as the world’s reserve currency. For most of its history, the US Dollar was backed by Gold, until the Bretton Woods Agreement in 1971 when the Gold Standard went away.
The most important single factor impacting on the value of the US Dollar is monetary policy, which is shaped by the Federal Reserve (Fed). The Fed has two mandates: to achieve price stability (control inflation) and foster full employment. Its primary tool to achieve these two goals is by adjusting interest rates. When prices are rising too quickly and inflation is above the Fed’s 2% target, the Fed will raise rates, which helps the USD value. When inflation falls below 2% or the Unemployment Rate is too high, the Fed may lower interest rates, which weighs on the Greenback.
In extreme situations, the Federal Reserve can also print more Dollars and enact quantitative easing (QE). QE is the process by which the Fed substantially increases the flow of credit in a stuck financial system. It is a non-standard policy measure used when credit has dried up because banks will not lend to each other (out of the fear of counterparty default). It is a last resort when simply lowering interest rates is unlikely to achieve the necessary result. It was the Fed’s weapon of choice to combat the credit crunch that occurred during the Great Financial Crisis in 2008. It involves the Fed printing more Dollars and using them to buy US government bonds predominantly from financial institutions. QE usually leads to a weaker US Dollar.
Quantitative tightening (QT) is the reverse process whereby the Federal Reserve stops buying bonds from financial institutions and does not reinvest the principal from the bonds it holds maturing in new purchases. It is usually positive for the US Dollar.
GBP/USD slips but losses are limited despite weaker-than-expected UK CPI. Economists at Scotiabank analyze the pair’s outlook.
Cable needs to extend through 1.2725/1.2735 resistance to strengthen
UK inflation data came in below expectations. February CPI rose 0.6% MoM (versus 0.7% expected) while inflation slipped to 3.4% in the year (versus 3.5% forecast and 4.0% in January). Core inflation slowed to 4.5% YoY – marginally better than forecast – but services CPI at 6.1% was a tenth above expectations. Despite the positive news, swaps still suggest rate cuts are unlikely to start before August.
Support at or near Tuesday’s 1.2668 low should be firm. An extension lower to 1.2625/1.2635 is a risk below there. But Sterling needs to extend through 1.2725/1.2735 resistance – which has held advances over the past 24 hours – to strengthen.
- WTI Oil eases a touch on Wednesday after its five-day winning streak.
- Oil traders are seeing earlier bullish bets play out with several supply issues at hand.
- The US Dollar Index trades firmly higher ahead of the Fed rate decision.
Oil prices eased slightly on Wednesday, keeping above the $80 level and returning more than 5% gains in five trading days. The recent upside move comes amid increasing supply issues in Russia and the need to refill the US crude stockpile, swirling up demand. The most recent decline, meanwhile, can be attributed to a stronger US Dollar.
The US Dollar, meanwhile, has performed a similar five-day winning streak after it got an accelerator on Tuesday during Asian trading hours with the Bank of Japan rate decision. Looking ahead to this Wednesday, the US Dollar is facing the US Federal Reserve monetary policy decision. Besides the speech from Fed Chairman Jerome Powell, the economic projections – which include the dot plot – will be the most important piece of information to look at.
Crude Oil (WTI) trades at $82.10 per barrel, and Brent Oil trades at $86.25 per barrel at the time of writing.
Oil news and market movers: Russia faces weather issues
- Chinese Customs figures show that China has imported Oil from Venezuela in February for the first time since 2019, Bloomberg reports.
- Russian crude exports have dropped because of maintenance work at the Baltic port of Primorsk and severe weather conditions (strong winds) around Kozmino on the Pacific Coast have hit shipments from the two most important oil ports. This translates into a three-day delay in loading and shipping.
- China secured another lot of 2 million barrels from Abu Dhabi, bought by Cnooc.
- Overnight, the American Petroleum Institute released that the US Crude stockpile is facing more drawdowns. Last week it saw a drawdown of 5.521 million barrels, against 1.519 million for this week.
- This Wednesday at 14:30 GMT, the Energy Information Administration will release its US stockpile numbers. Expectations are for a small build of 13,000 barrels against the draw last week of 1.536 million barrels.
Oil Technical Analysis: $90 still far off though possible
Oil prices are setting the stage for more upside with a mixture of supply issues and bigger drawdowns in the US. This is the plan OPEC+ was hoping for to soon play out, with the US unable to keep up the pace of its constant Oil production for filling up the gap of the OPEC+ Oil cuts. With the US production falling back now and even Russia supply facing some delay, a squeeze to the upside is taking place. Last week FXStreet reported several bullish positions being taken in the options markets, which are now playing out.
Oil bulls will see $86 appearing as the next cap. Further up, $86.90 follows suit before targeting $89.64 and $93.98 as top levels.
On the downside, both $80.00 and $80.60 should be acting as support now with the 200-day Simple Moving Average (SMA) as the level to catch any falling knives near $78.33. The 100-day and the 55-day SMA’s are near $75.56 and $76.35, respectively. Add the pivotal level near $75.27, and it looks like the downside is very limited and well-equipped to resist the selling pressure.

US WTI Crude Oil: Daily Chart
WTI Oil FAQs
WTI Oil is a type of Crude Oil sold on international markets. The WTI stands for West Texas Intermediate, one of three major types including Brent and Dubai Crude. WTI is also referred to as “light” and “sweet” because of its relatively low gravity and sulfur content respectively. It is considered a high quality Oil that is easily refined. It is sourced in the United States and distributed via the Cushing hub, which is considered “The Pipeline Crossroads of the World”. It is a benchmark for the Oil market and WTI price is frequently quoted in the media.
Like all assets, supply and demand are the key drivers of WTI Oil price. As such, global growth can be a driver of increased demand and vice versa for weak global growth. Political instability, wars, and sanctions can disrupt supply and impact prices. The decisions of OPEC, a group of major Oil-producing countries, is another key driver of price. The value of the US Dollar influences the price of WTI Crude Oil, since Oil is predominantly traded in US Dollars, thus a weaker US Dollar can make Oil more affordable and vice versa.
The weekly Oil inventory reports published by the American Petroleum Institute (API) and the Energy Information Agency (EIA) impact the price of WTI Oil. Changes in inventories reflect fluctuating supply and demand. If the data shows a drop in inventories it can indicate increased demand, pushing up Oil price. Higher inventories can reflect increased supply, pushing down prices. API’s report is published every Tuesday and EIA’s the day after. Their results are usually similar, falling within 1% of each other 75% of the time. The EIA data is considered more reliable, since it is a government agency.
OPEC (Organization of the Petroleum Exporting Countries) is a group of 13 Oil-producing nations who collectively decide production quotas for member countries at twice-yearly meetings. Their decisions often impact WTI Oil prices. When OPEC decides to lower quotas, it can tighten supply, pushing up Oil prices. When OPEC increases production, it has the opposite effect. OPEC+ refers to an expanded group that includes ten extra non-OPEC members, the most notable of which is Russia.
EUR/USD dips back to the lows 1.0800s. Economists at Scotiabank analyze the pair’s outlook.
The short-term downtrend is gathering momentum
ECB President Lagarde reiterated that policymakers need more evidence that inflation is receding but, if data outcomes are in line with current expectations, the central bank can start dialing back rate hikes in June. The ECB would remain data-dependent thereafter and will not pre-commit to policy moves.
The short-term downtrend is gathering momentum but the daily DMI study remains neutral for now.
A break under 1.0840 puts a test of 1.0775/1.0800 (easily) on the radar.
Resistance is 1.0875.
USD/JPY rallied on what in the end was a widely expected BoJ rate hike. Economists at ING analyze the pair’s outlook.
More of a Dollar story
The broad-based view is that the gulf in interest rates between Japan and many other central banks in the G10 space means that the Yen will still be used as a funding currency in a low-volatility world.
Our baseline view now sees USD/JPY perhaps trading around the 150.00-152.00 area as long as short-term US rates stay firm. When they turn lower over the coming months, USD/JPY should head down to the 145.00 area and probably close to 140.00 later this year when the Fed easing cycle is in full swing (we look for 125 bps of Fed cuts this year).
- Gold price falls further as US Dollar rises ahead of Fed’s monetary policy announcement.
- The Fed’s dot plot will be the key trigger in the monetary policy meeting.
- US Treasury yields fall modestly but broadly remain firm.
Gold price (XAU/USD) remains under pressure as investors await the Federal Reserve’s (Fed) monetary policy decision, which will be announced at 18:00 GMT. The Fed is expected to maintain interest rates unchanged as the victory against stubborn United States inflation is still out of sight. Investors will keenly focus on the Fed’s dot plot and economic forecasts, which will indicate interest rate projections and the outlook on the US economic performance, respectively.
Market participants will also pay attention to Fed Chair Jerome Powell’s press conference to get cues about the timing of rate-cuts. Currently, expectations for the Fed lowering interest rates in the June meeting have eased somewhat. Fed policymakers said they want to see inflation easing for months as evidence to confirm that price growth will return to the 2% target. However, inflation data for the first two months of 2024 signaled that price pressures remain sticky.
Meanwhile, 10-year US Treasury yields have come down gradually to 4.28% from their three-month high of 4.35%. A hawkish Fed guidance would increase yields on Treasury bonds. Ahead of the Fed, the US Dollar Index (DXY) continues its winning spell for the fifth trading session as stubborn inflation pressures have cast doubts over the Fed’s prior three rate-cut projections for this year.
Daily digest market movers: Gold price drops as US Dollar strengthens
- Gold price falls slightly to $2,150 amid uncertainty ahead of the Federal Reserve’s interest rate decision. The Fed is widely anticipated to keep interest rates unchanged in the range of 5.25%-5.50% for the fifth time in a row. Therefore, market participants will majorly focus on the Fed’s dot plot and economic projections.
- The Fed’s dot plot, which is updated quarterly, shows policymakers’ projections for interest rates over different time frames. December’s dot plot indicated that policymakers saw back then three rate cuts for 2024 and believed that the rate-tightening campaign had peaked.
- Fed policymakers have been reiterating that rate cuts are appropriate only if they get evidence that inflation is declining towards 2% in a sustainable manner. For interest rate decisions, Fed policymakers generally consider the core Consumer Price Index (CPI) data as it remains free from the impact of volatile food and energy prices. Core inflation has remained broadly sticky in the first two months of 2024, adding to speculation that the Fed will project fewer than three rate cuts for this year. If this happens, it would increase the opportunity cost of investment in non-yielding assets such as Gold, weighing on its price.
- The CME FedWatch Tool shows that there is a 60% chance that at least three rate cuts will be announced by 2024. The chances for at least three rate cuts were slightly below 80% prior to the release of the February hot consumer and producer inflation data. Higher-than-expected US producer and consumer inflation has also dented market expectations for the Fed to begin rate cuts in the June policy meeting.
- Later this week, investors will focus on the preliminary S&P Global Manufacturing and Services PMI for March. The Manufacturing PMI is anticipated to fall to 51.7 from 52.2 in February.
Technical Analysis: Gold price faces selling pressure near $2,160
Gold price falls after facing stiff pressure near the crucial resistance of $2,160. The precious metal trades inside Tuesday’s trading range. it is likely to break the consolidating trend after the Fed’s policy meeting.
The precious metal may continue its downside towards the 20-day Exponential Moving Average (EMA) at $2,097. After a wide divergence, the asset tends to face a mean-reversion move, which results in a price or a time correction.
On the downside, December 4 high near $2,145 and December 28 high at $2,088 will act as major support levels.
The 14-Relative Strength Index (RSI) retraces from its peak near 84.50, although the upside momentum is still active.
Gold FAQs
Gold has played a key role in human’s history as it has been widely used as a store of value and medium of exchange. Currently, apart from its shine and usage for jewelry, the precious metal is widely seen as a safe-haven asset, meaning that it is considered a good investment during turbulent times. Gold is also widely seen as a hedge against inflation and against depreciating currencies as it doesn’t rely on any specific issuer or government.
Central banks are the biggest Gold holders. In their aim to support their currencies in turbulent times, central banks tend to diversify their reserves and buy Gold to improve the perceived strength of the economy and the currency. High Gold reserves can be a source of trust for a country’s solvency. Central banks added 1,136 tonnes of Gold worth around $70 billion to their reserves in 2022, according to data from the World Gold Council. This is the highest yearly purchase since records began. Central banks from emerging economies such as China, India and Turkey are quickly increasing their Gold reserves.
Gold has an inverse correlation with the US Dollar and US Treasuries, which are both major reserve and safe-haven assets. When the Dollar depreciates, Gold tends to rise, enabling investors and central banks to diversify their assets in turbulent times. Gold is also inversely correlated with risk assets. A rally in the stock market tends to weaken Gold price, while sell-offs in riskier markets tend to favor the precious metal.
The price can move due to a wide range of factors. Geopolitical instability or fears of a deep recession can quickly make Gold price escalate due to its safe-haven status. As a yield-less asset, Gold tends to rise with lower interest rates, while higher cost of money usually weighs down on the yellow metal. Still, most moves depend on how the US Dollar (USD) behaves as the asset is priced in dollars (XAU/USD). A strong Dollar tends to keep the price of Gold controlled, whereas a weaker Dollar is likely to push Gold prices up.
- Swiss Franc is depreciating ahead of the key Swiss National Bank policy meeting on Thursday.
- Lower inflation and growth point to the risk of a dovish policy tweak at the meeting.
- USD/CHF is piercing above the top of a box range and threatening to break out substantially higher.
The Swiss Franc (CHF) is trending lower on Wednesday in its most heavily traded pairs ahead of the week’s key event for the currency, the Swiss National Bank (SNB) policy meeting on Thursday.
The decline may be due to traders seeing a heightened risk the SNB will change its messaging or even reduce interest rates at the meeting due to substantial declines in both inflation and growth over the last year.
Swiss Franc at risk as growth and inflation decline
Inflation has fallen markedly in Switzerland in 2023.
“Inflation decreased significantly, from 3.2% in the first quarter to 1.6% in the fourth. The average for the year decreased from 2.8% in 2022 to 2.1% in the year under review,” said the SNB in its Annual Report for 2023.
The latest inflation data for 2024 shows a further fall in inflation, with the Consumer Price Index (CPI) rising by 1.2% YoY in February from the 1.3% registered in the previous month, according to the Federal Statistical Office.
Overall this is lower than what the SNB expected back at its December meeting, when it said inflation, which was then at 1.4%, was likely to “increase somewhat in the coming months due to higher electricity prices and rents, as well as the rise in VAT.”
The SNB estimates inflation will average 1.9% in 2024. However, the rate of inflation is currently considerably below that figure at 1.2%. That said, on a monthly basis it accelerated, with CPI up 0.6% in February from 0.2% previously.
Inflation is also well below the SNB’s first-quarter forecast of 1.8%.
"Consumer price inflation is running 0.6 ppts below the bank's 1.8% first-quarter forecast, while core inflation of 1.1% is the lowest since January 2022," Reuters reports.
Swiss GDP in 2023 almost cut in half
Economic growth in Switzerland has also been considerably slower in 2023 than in 2022.
“Swiss economic growth was modest in 2023. According to the initial estimate by the State Secretariat for Economic Affairs (SECO), growth in GDP adjusted for seasonal effects and sporting events was 1.3%. This was significantly slower than the 2.5% recorded the year before,” says the bank in its 2023 Annual Report.
The decline in both inflation and growth raises the question of whether the SNB will need to ease policy and trim its 1.75% policy rate. The probabilities of the SNB cutting interest rates on Thursday stand at 29%, according to a Reuters’ report published on Monday. If it were to cut rates the Swiss Franc would weaken, as lower interest rates attract less foreign capital inflows.
Technical Analysis: Swiss Franc to USD exchange rate penetrates top of range
The USD/CHF, which measures the buying power of a single US Dollar in Swiss Francs, is penetrating the top of a range it has been oscillating within, between roughly 0.8900 and 0.8740, since the middle of February.
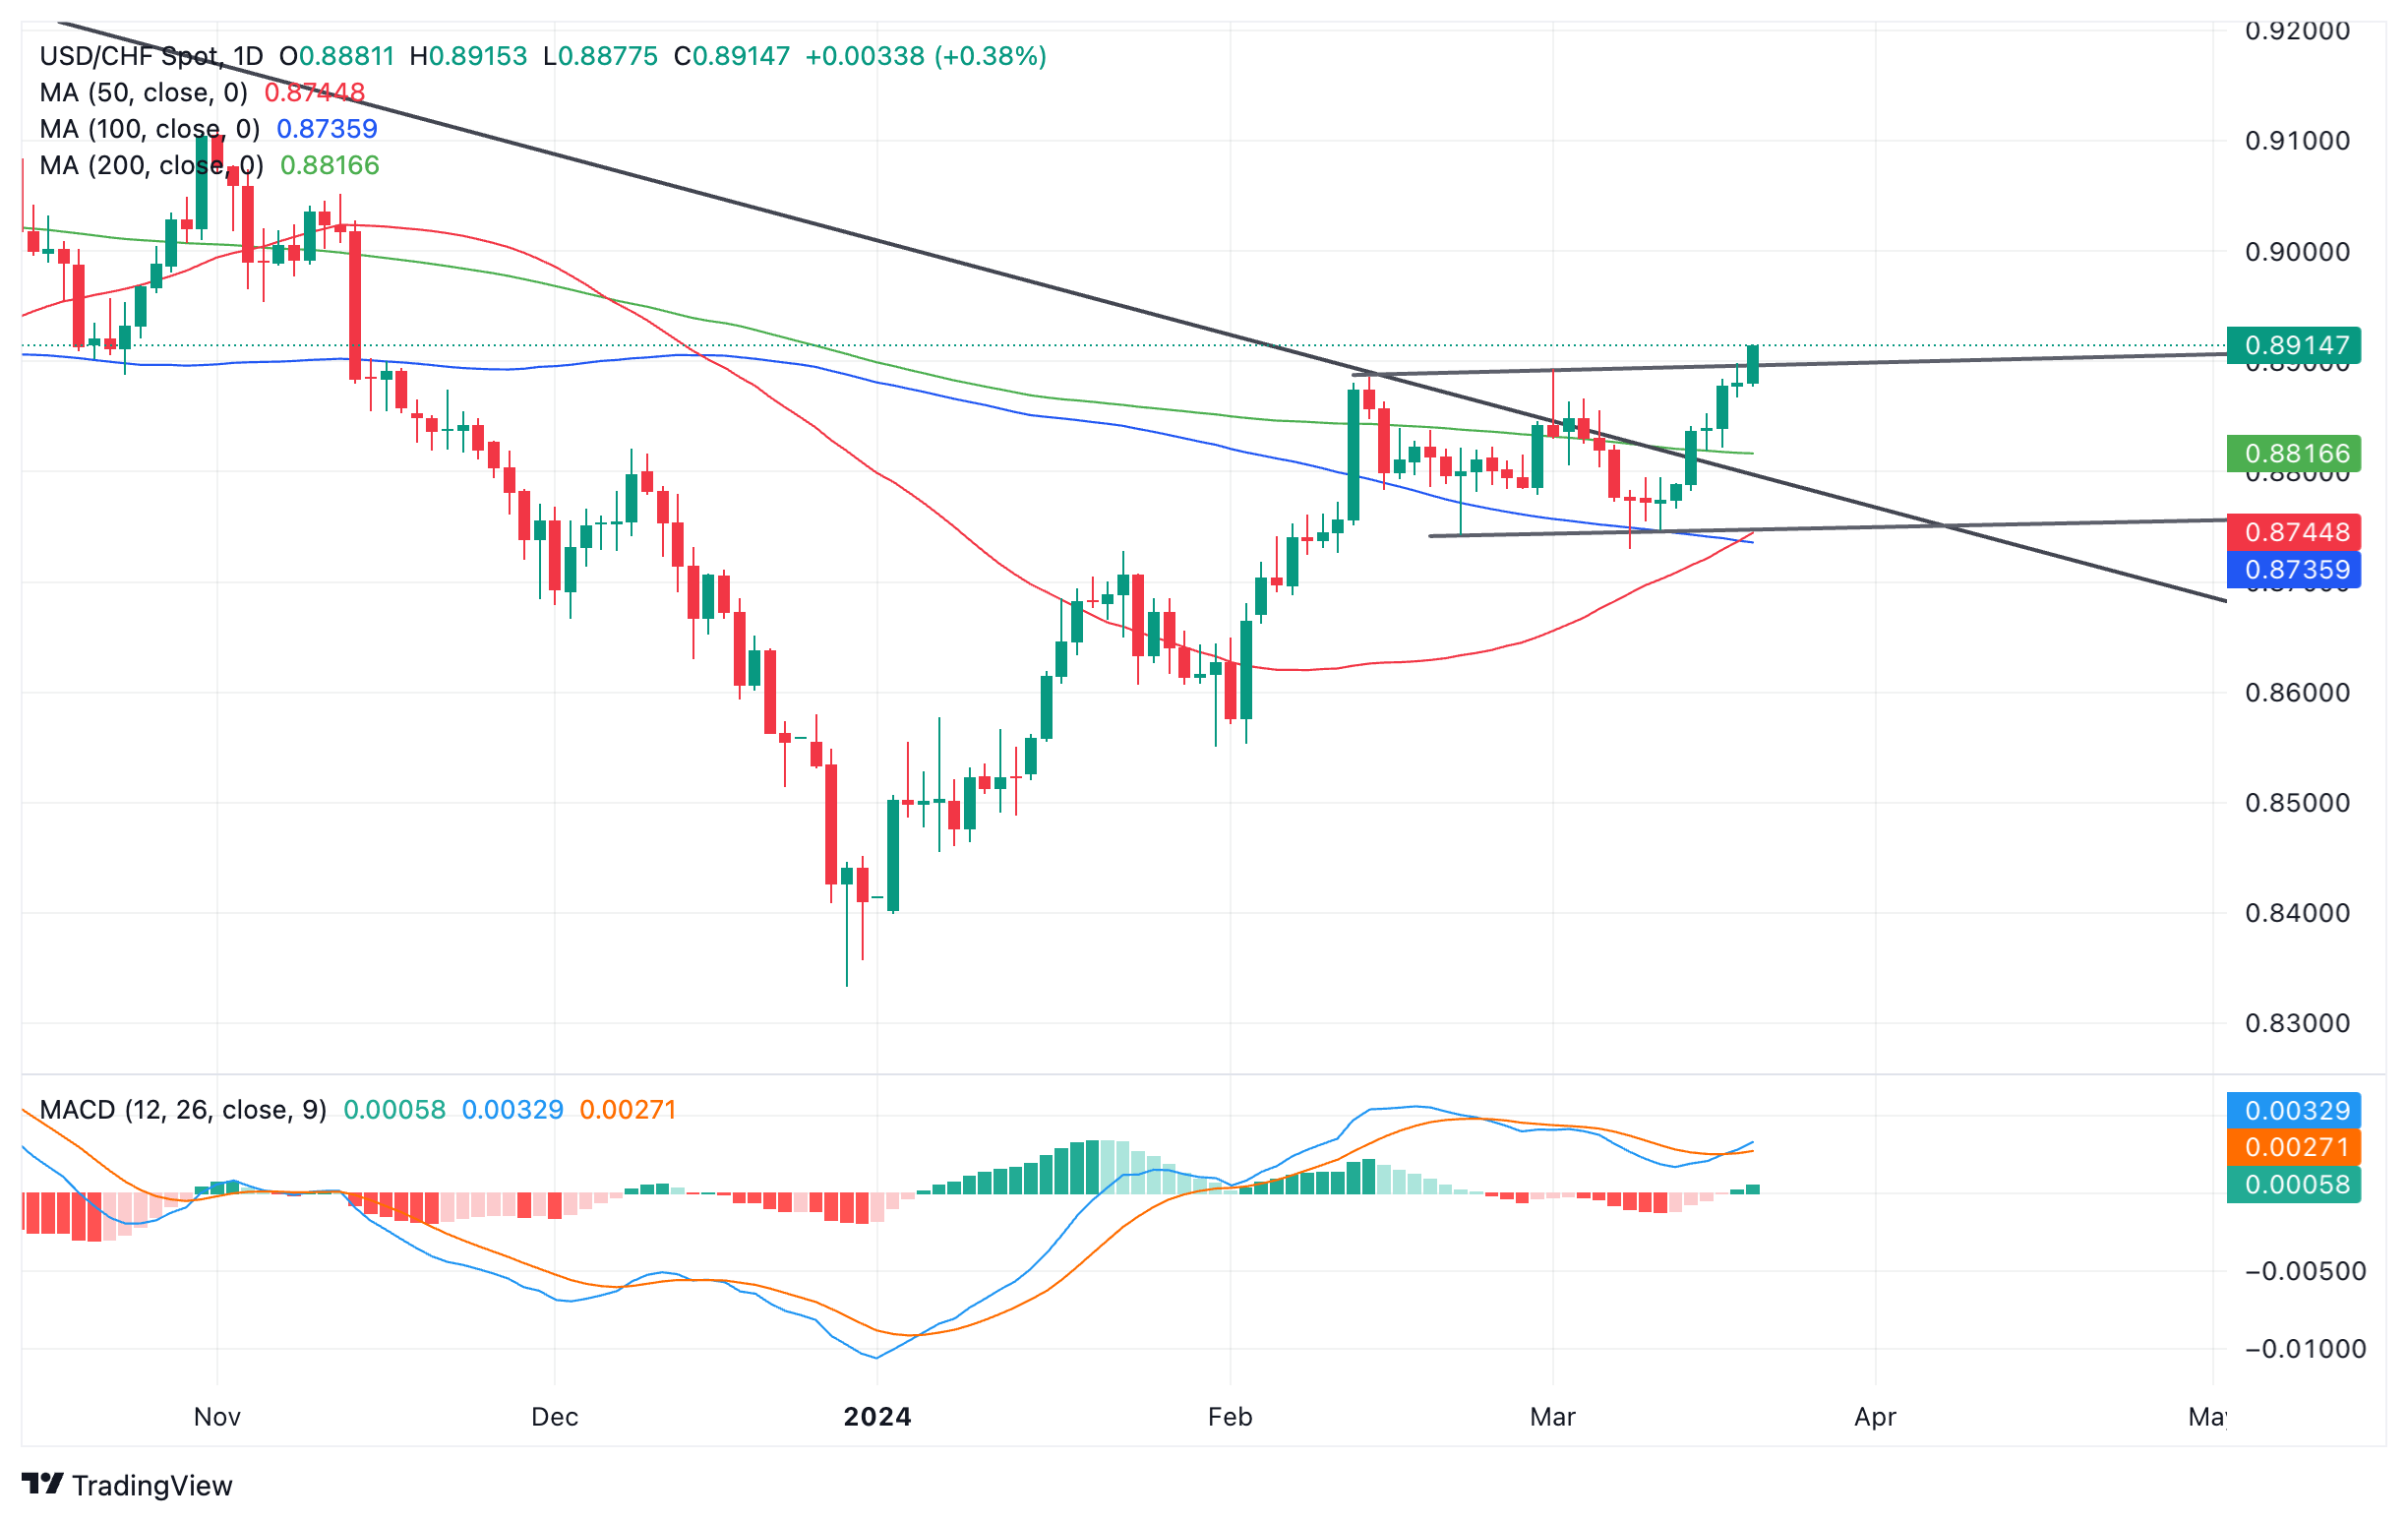
US Dollar versus Swiss Franc: 4-hour chart
A decisive break above the range highs at 0.8900 is underway but yet to be confirmed. A strong close on Wednesday would be required to indicate a decisive breakout.
Should that be the case, the initial target for the breakout is at 0.8992, the 0.618 Fibonacci (Fib) ratio of the height of the range extrapolated higher, followed by 0.9052, the full height extrapolated higher.
The pair is overall in a short-term uptrend, supporting more upside. However, resistance from a long-term trendline and the 50-week Simple Moving Average (SMA) present considerable obstacles.
Alternatively, a decisive break below the range low at 0.8729 could indicate a short-term trend reversal and the start of a deeper slide.
The first target for such a move would be the 0.618 Fib. extrapolation of the height of the range at 0.8632, followed by the full extrapolation at 0.8577, which is also close to the 0.8551 January 31 lows, another key support level to the downside.
SNB FAQs
The Swiss National Bank (SNB) is the country’s central bank. As an independent central bank, its mandate is to ensure price stability in the medium and long term. To ensure price stability, the SNB aims to maintain appropriate monetary conditions, which are determined by the interest rate level and exchange rates. For the SNB, price stability means a rise in the Swiss Consumer Price Index (CPI) of less than 2% per year.
The Swiss National Bank (SNB) Governing Board decides the appropriate level of its policy rate according to its price stability objective. When inflation is above target or forecasted to be above target in the foreseeable future, the bank will attempt to tame excessive price growth by raising its policy rate. Higher interest rates are generally positive for the Swiss Franc (CHF) as they lead to higher yields, making the country a more attractive place for investors. On the contrary, lower interest rates tend to weaken CHF.
Yes. The Swiss National Bank (SNB) has regularly intervened in the foreign exchange market in order to avoid the Swiss Franc (CHF) appreciating too much against other currencies. A strong CHF hurts the competitiveness of the country’s powerful export sector. Between 2011 and 2015, the SNB implemented a peg to the Euro to limit the CHF advance against it. The bank intervenes in the market using its hefty foreign exchange reserves, usually by buying foreign currencies such as the US Dollar or the Euro. During episodes of high inflation, particularly due to energy, the SNB refrains from intervening markets as a strong CHF makes energy imports cheaper, cushioning the price shock for Swiss households and businesses.
The SNB meets once a quarter – in March, June, September and December – to conduct its monetary policy assessment. Each of these assessments results in a monetary policy decision and the publication of a medium-term inflation forecast.
Last year, the Swiss Franc (CHF) was the best performing G10 currency. Its fortunes have turned this year. Economists at Rabobank analyze CHF outlook ahead of the SNB meeting on Thursday.
SNB would welcome a softer CHF
A rate cut this week would further undermine the outlook for the CHF, particularly given the ‘higher for longer theme’ associated with the Fed.
In view of the decades of disinflationary/deflationary pressures suffered by Switzerland and an overvalued exchange rate, we expect that the SNB would welcome a softer CHF.
The Pound Sterling (GBP) has not moved much in response to the February UK CPI data released by the Office for National Statistics (ONS). Economists at MUFG Bank analyze GBP outlook.
Weaker than expected CPI but services a little stronger
The data revealed overall and core measures falling 0.1ppt more than expected to 3.4% and 4.5% respectively. Services CPI, a big focus for the BoE, also fell from 6.5% to 6.1%, but by 0.1ppt less than expected.
The MPC meeting on Thursday may see a change in the vote composition. In February the vote was 6-2-1 with Dingra the voter for a cut. Mann and Haskel voted to hike and we could see one or both drop their votes for a hike and join the majority but overall we expect pricing for the first cut in August to be largely maintained, limiting moves for the pound. Overall, the required caution on monetary easing will continue to support the Pound.
- The Federal Reserve is widely anticipated to keep interest rates unchanged.
- The revised dot plot and Fed Chairman Powell’s remarks could provide important clues about the policy outlook.
- The US Dollar could find extra legs in case of a hawkish outcome.
The Federal Reserve (Fed) will announce monetary policy decisions following the March meeting and release the revised Summary of Economic Projections (SEP), the so-called dot plot, on Wednesday. Market participants widely anticipate that the US central bank will leave the policy rate unchanged at 5.25%-5.5% for the fifth consecutive meeting.
The CME FedWatch Tool shows that markets see little to no chance of a rate cut in May. Hence, investors will scrutinize the SEP and comments from Fed Chairman Jerome Powell to try to confirm or deny a policy pivot in June. According to the FedWatch Tool, there is a 43% probability that the Fed will leave rates unchanged in June.
The dot plot published in December showed that policymakers were forecasting a total of 75 basis points (bps) reduction in the policy rate in 2024. The publication further pointed out that Fed officials saw inflation averaging 2.4% in 2024 before returning to the 2% target in 2026.
Macroeconomic data releases since the December policy meeting showed that consumer inflation and producer inflation started to edge higher in the first couple of months of the year. Additionally, the labor market remained relatively healthy while activity-related data, such as the forward-looking PMI surveys, suggested that the US is very likely to avoid a recession.
Previewing the Fed event, “the FOMC is widely expected to keep the Fed funds target range unchanged at 5.25%-5.50% next week, with Chair Powell likely continuing to argue for patience regarding the Committee's next policy steps amid the recent firming of inflation,” said TD Securities analysts in a weekly report and added: “We also look for the Fed to maintain its median projection for 3 cuts this year, and for the release of preliminary details about QT plans.”
When will the Fed announce policy decisions and how could they affect EUR/USD?
The Federal Reserve is scheduled to announce its rate decision and publish the monetary policy statement alongside the SEP at 18:00 GMT. This will be followed by Chairman Powell's press conference at 18:30 GMT.
In case the new dot plot reaffirms that officials are still favoring 75 bps cuts, this could result in markets leaning toward a pivot in June. In this scenario, the initial market reaction is likely to trigger a decline in the US Treasury bond yields and weigh heavily on the US Dollar (USD). On the other hand, policymakers could favor a 50 bps reduction in the interest rate this year, citing a relatively healthy labor market and stronger-than-forecast consumer and producer inflation figures since the beginning of the year. This could be seen as a hawkish surprise and provide a boost to the USD. A 75 bps rate cut projection with an upward revision to the 2024 inflation forecast could help the USD limit its losses.
In the post-meeting press conference, Chairman Powell could refrain from commenting on the timing of the policy pivot and reiterate the data-dependent approach. In this case, changes in the dot plot could continue to drive the USD’s valuation. If Powell adopts an optimistic tone about the inflation outlook and leaves the door open for a rate cut in June, the USD’s gains could remain limited even if the SEP points to 75 bps cuts in 2024.
FXStreet Analyst Yohay Elam shares his thoughts on the potential market reaction: “I want to stress that the reaction to the Fed decisions is multi-layered. Investors usually react to the dot plot before reversing the initial move. They then respond to Powell's words but may have a rethink once the dust settles and analysis of the bank's message surfaces.”
“The long-term reflection of the decision would be seen in the odds for a rate cut in June, which currently stands at roughly 50-50,” he said.
To summarize, it will not be easy to navigate through the policy statement, the dot plot and Powell’s remarks. The USD volatility is likely to heighten during the event and it could be less risky to wait until the excitement fades away to determine a direction for the currency. The action in bond and stock futures markets the next day could provide a clue on whether markets saw the Fed announcements as dovish or hawkish.
Eren Sengezer, European Session Lead Analyst at FXStreet, provides a short-term technical outlook for EUR/USD:
“Following the latest decline, EUR/USD stays near the 20, 50, 100 and 200-day Simple Moving Averages (SMA) and the Relative Strength Index (RSI) indicator on the daily chart struggles to hold above 50, reflecting buyers’ hesitancy.”
“If EUR/USD stays below the 1.0870-1.0840 area (20-day SMA, 50-day SMA, 100-day SMA, 200-day SMA) and confirms the lower limit of this range as resistance, technical sellers could take action. In this case, 1.0785 (Fibonacci 50% retracement of the October-December uptrend) and 1.0700 (Fibonacci 61.8% retracement) could be seen as the next bearish targets. On the upside, 1.0950 (Fibonacci 23.6% retracement) aligns as strong resistance before 1.1000 (psychological level) and 1.1100 (end-point of the long-term uptrend).”
Interest rates FAQs
Interest rates are charged by financial institutions on loans to borrowers and are paid as interest to savers and depositors. They are influenced by base lending rates, which are set by central banks in response to changes in the economy. Central banks normally have a mandate to ensure price stability, which in most cases means targeting a core inflation rate of around 2%. If inflation falls below target the central bank may cut base lending rates, with a view to stimulating lending and boosting the economy. If inflation rises substantially above 2% it normally results in the central bank raising base lending rates in an attempt to lower inflation.
Higher interest rates generally help strengthen a country’s currency as they make it a more attractive place for global investors to park their money.
Higher interest rates overall weigh on the price of Gold because they increase the opportunity cost of holding Gold instead of investing in an interest-bearing asset or placing cash in the bank. If interest rates are high that usually pushes up the price of the US Dollar (USD), and since Gold is priced in Dollars, this has the effect of lowering the price of Gold.
The Fed funds rate is the overnight rate at which US banks lend to each other. It is the oft-quoted headline rate set by the Federal Reserve at its FOMC meetings. It is set as a range, for example 4.75%-5.00%, though the upper limit (in that case 5.00%) is the quoted figure. Market expectations for future Fed funds rate are tracked by the CME FedWatch tool, which shapes how many financial markets behave in anticipation of future Federal Reserve monetary policy decisions.
The Swiss Franc (CHF) has been the weakest performer in G10 year-to-date. Economists at Standard Chartered analyze CHF outlook.
It would take a very hawkish SNB to strengthen the CHF further
The CHF has been the weakest performer YTD in G10 and we expect this subpar performance to continue.
It would take a very hawkish SNB to strengthen the CHF further and we don’t see much reason for them to go in that direction, even if they hold steady in March and do not commit to a cut in June.
By most measures, the CHF real effective exchange rate is well above historical averages, and we doubt that the SNB would object to modest depreciation.
Barring a geopolitical shock, we expect it to be a funding currency for both G10 and EM trades.
The US Dollar (USD) is doing a little better as investors prepare for the FOMC meeting. Economists at ING analyze
Greenback’s outlook.
The USD still seems to be lagging the recent pick-up in US rates
Consensus is not looking for any significant changes in the statement or the Fed's economic projections. If there is a risk, it lies in a less dovish/mildly Dollar positive outcome.
The Dollar still seems to be lagging the recent pick-up in US rates and even if the Fed did stick with three expected cuts this year, we doubt the Dollar would sell off for long. We really need to see the data turn lower for a noticeable Dollar bear trend to now emerge.
DXY to stay bid in a 103.50-104.00 range heading into the FOMC meeting.
- USD/MXN recovers its recent losses recorded in the previous session.
- US Dollar appreciates despite weaker US Treasury yields.
- Banxico is expected to reduce the interest rate by 25 bps at Thursday’s meeting.
USD/MXN retraces its recent losses and moves higher to near 16.80 during Wednesday's European trading hours. The US Dollar (USD) gains ground, despite weaker US Treasury yields, which in turn, bolsters the USD/MXN pair.
The US Dollar Index (DXY) rises to near 104.00, with 2-year and 10-year yields on US Treasury bonds standing lower at 4.67% and 4.27%, at the time of writing. Investors are eagerly awaiting the interest rate decision from the US Federal Reserve (Fed) scheduled for Wednesday.
The Federal Open Market Committee (FOMC) is widely expected to maintain its key federal funds interest rate within a range of 5.25% to 5.50%. According to the CME FedWatch Tool, the probability of a rate cut in May stands at 6.3%, while the likelihood of rate cuts in June and July has increased to 59.2% and 76.0%, respectively.
In February, US Building Permits (Month-on-Month) surged to 1.518 million, surpassing both the anticipated 1.495 million and the previous 1.489 million. Additionally, US Housing Starts (Month-on-Month) climbed to 1.521 million, exceeding market forecasts of 1.425 million and marking a notable increase from the preceding 1.374 million.
In the fourth quarter of 2023, Private Spending (Year-over-Year) on the Mexican side witnessed a 5.1% increase, up from the previous 4.3% rise. However, the quarter-over-quarter report indicated a 0.9% increase, slightly below the previous 1.2% uptick. Market focus will shift to Retail Sales figures from Mexico, scheduled for Wednesday.
In Banxico's quarterly report, officials acknowledged strides in inflation control and emphasized the importance of avoiding premature interest rate cuts. The spotlight now turns to the Bank of Mexico's (Banxico) interest rate decision on Thursday, with expectations leaning towards a 25 basis points reduction.
"We expect that a pick-up in demand, if accommodated by fully utilizing hoarded labor, will lead to rising productivity growth," European Central Bank (ECB) President Christine Lagarde said while speaking at the ECB and Its Watchers XXIV conference in Frankfurt on Wednesday, per Reuters.
Key quotes
" We need to move further along the disinflationary path."
"The compression of profit margins has allowed wages to catch up without further accelerating inflation."
"Average wage growth in 2024 for all existing wage contracts fell from 4.4% at the time of our January Governing Council meeting to 4.2% at the time of our meeting in March."
"Given the delays with which data become available, we cannot wait until we have all the relevant information."
"In the coming months, we expect to have two important pieces of evidence that could raise our confidence level sufficiently for a first policy move."
"Latest data point in direction that wages are indeed growing in a way that is compatible with inflation reaching."
"The coming months will help us form an even clearer picture."
"It is difficult to assess whether these price pressures simply reflect the lag in wages and services prices and the procyclical nature of productivity, or whether they signal persistent inflationary pressures."
"Unlike in the earlier phases of our policy cycle, there are reasons to believe that the expected disinflationary path will continue."
"If these data reveal a sufficient degree of alignment between the path of underlying inflation and our projections, we will be able to move into the dialing back phase of our policy cycle."
Market reaction
EUR/USD showed no immediate reaction to these comments and was last seen losing 0.15% on the day at 1.0850.
Pound Sterling (GBP) weakens on UK’s soft inflation. Economists at BBH analyze GBP outlook.
The UK February CPI print reinforces the case for a BoE rate cut in August
Headline CPI rose slightly less than expected by 0.6% MoM (consensus: 0.7%) in February. Meanwhile, annual headline and core CPI inflation slowed in February to 3.4% (lowest since September 2021) and 4.5% (lowest since January 2022), respectively. This was 0.1pts lower than anticipated by market participants.
Nonetheless, we doubt the BoE will be in a rush to loosen policy because UK services inflation remains high. In line with the BoE’s forecast, annual services CPI inflation eased to 6.1% in February (consensus: 6.0%) from 6.5% in January. A first 25 bps BoE rate cut remains more than fully priced-in by money markets for August.
GBP has scope to edge higher versus EUR.
- EUR/USD recovers and oscillates in a range in the upper 1.0800s ahead of Wednesday’s Fed meeting.
- Speculation is mounting that the Fed could alter how many interest rate cuts it expects to make in 2024.
- Several ECB rate-setters are scheduled to take the stand at a conference on monetary policy.
EUR/USD seesaws between tepid gains and losses on Wednesday, forming a range in the upper 1.0800s after rebounding from Tuesday’s 1.0830 lows on increased probabilities the Federal Reserve (Fed) will cut interest rates by June.
Interest rates, set by central banks, are a key driver of foreign exchange markets. Lower interest rates tend to depreciate a currency by attracting less foreign capital inflows and vice versa for higher interest rates.
EUR/USD rebounds as June bets pick up
EUR/USD has recovered marginally ahead of the Federal Reserve’s March Federal Open Market Committee (FOMC) meeting on Wednesday, the outcomes of which will be announced at 18:00 GMT. Bets that the Fed will start cutting interest rates – currently at 5.25%-5-50% for the Fed Funds Rate – by June are increasing.
According to the CME FedWatch Tool, which uses Fed Fund Futures to calculate the probability of future changes in the Fed Funds Rate, the probability of the Fed cutting rates by June is 64.0%, and 78.9% by July.
This marks an increase from the 55.1% and 73.7%, respectively, seen on Tuesday. This change in expectations could be responsible for the recovery in EUR/USD, which measures the value of a Euro in US Dollars.
Fed could change forecasts
The Fed is not expected to alter interest rates at its meeting but there is a chance it could revise its quarterly forecasts and accompanying statement. This could change the outlook for interest rates and therefore the US Dollar (USD) valuation.
EUR/USD could see volatility after the Fed meeting. Speculation is mounting that the Federal Reserve will revise its economic forecasts in the Summary of Economic Projections (SEP), and the “dot plot”, which reflects the Board of Governors of the Fed’s consensus of the future path of rates.
In the previous SEP, officials forecast three 25 basis points (0.25%) rate cuts in 2024 but some analysts now think there is a material risk that this could be revised down to two 25 bps cuts to reflect inflationary pressures remaining elevated.
“The summary of economic projections will be updated and contains hawkish risks in our assessment with the committee potentially projecting fewer cuts in 2024,” says David Doyle, head of economics at Macquarie, in a note about the Fed meeting.
ECB speakers set to take the stand
In Europe, a similar debate is going on about when to begin cutting interest rates, with two camps emerging – those who favor waiting until the European Central Bank’s June meeting to decide (the official camp) and a smaller mutineering group who want to keep alive the possibility of an early spring rate cut.
On Tuesday, Vice-President of the European Central Bank (ECB), Luis de Guindos, maintained allegiance with the June camp after he said “we have to wait,” because “services inflation” remains too high.
Wednesday will see a host of ECB talking heads appear in public who could provide further intelligence on which way the ECB is swinging. This may also impact EUR/USD volatility.
The ECB President Christine Lagarde, ECB Chief Economist Philip Lane and ECB Executive Board member Isabel Schnabel are all set to speak at an "ECB and its Watchers" conference today, with Lagarde kicking off at 8.45 GMT, Lane at 9.30 and Schnabel at 13:45.
Later, the President of the Bundesbank, Joachim Nagel, is scheduled to take the podium at a “Future of European Finance" conference at the ASKO Europa-Stiftung Foundation.
Technical Analysis: EUR/USD falls below key level
EUR/USD has penetrated below the level of the 1.0867 swing lows and in doing so probably reversed the direction of the short-term uptrend. Now the odds slightly favor more losses.
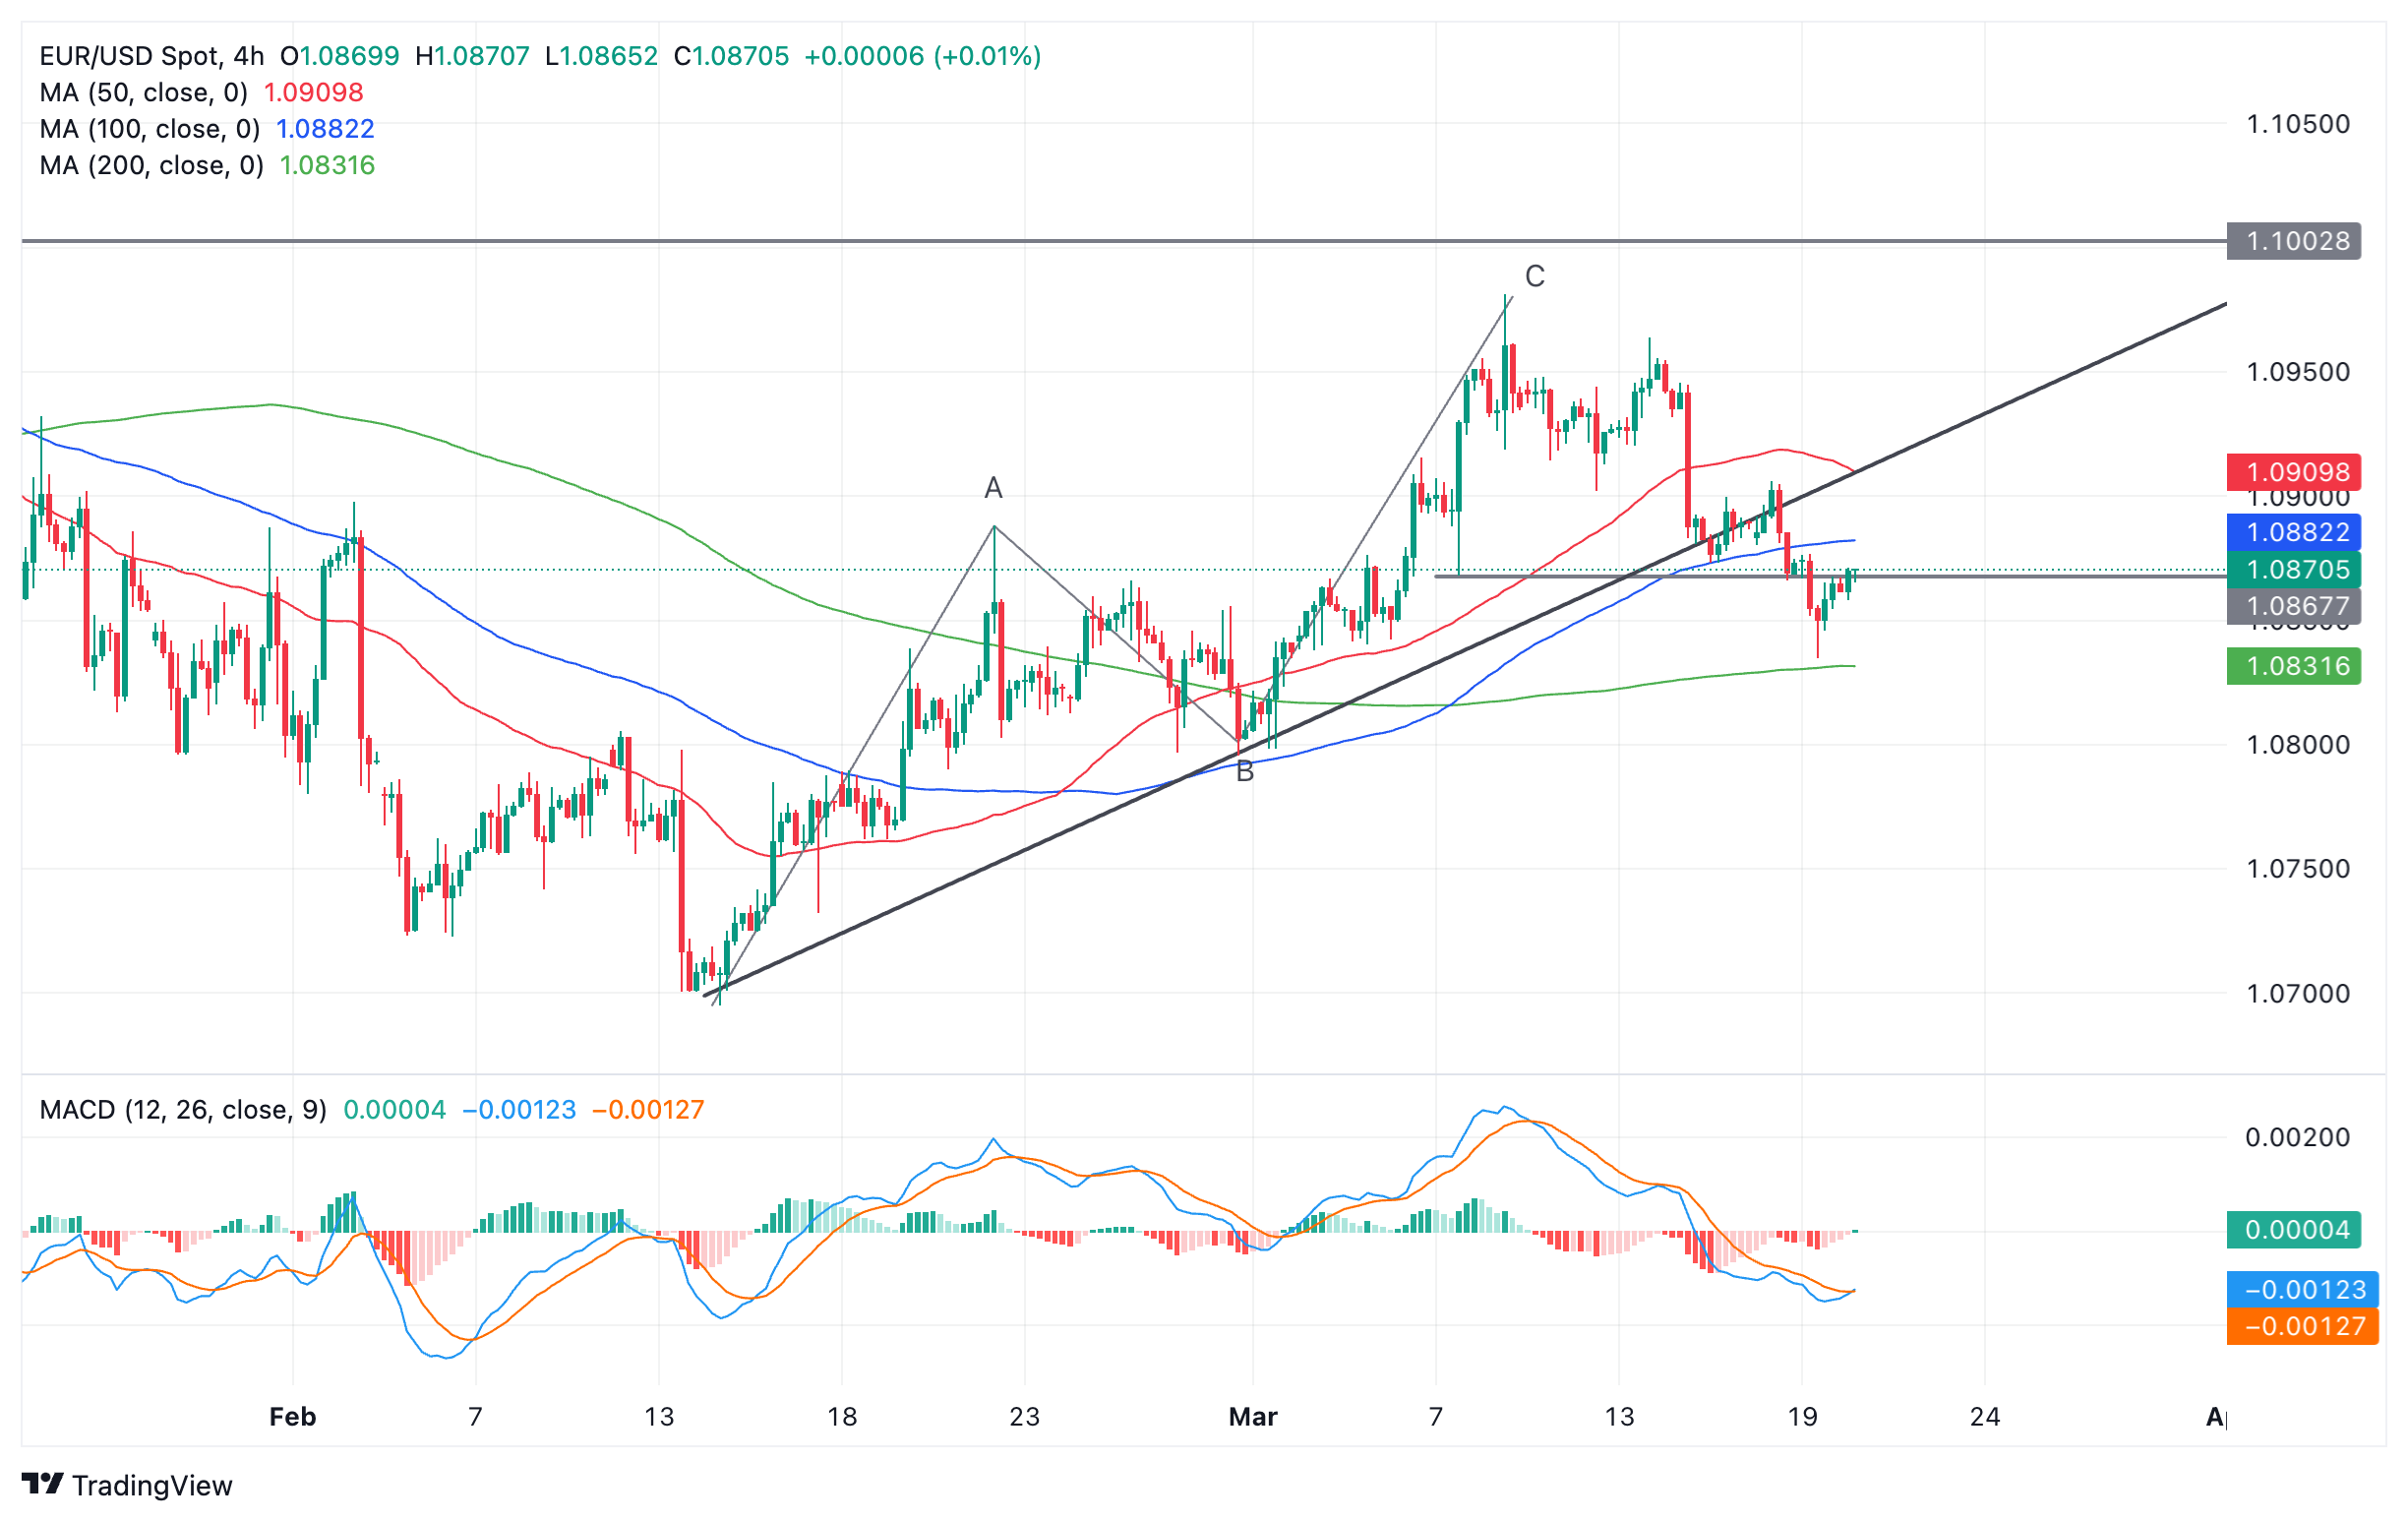
Euro versus US Dollar: 4-hour chart
Subject to fundamentals, the price will probably continue to fall to the next key support level at roughly 1.0800 – the lows of wave B of the Measured Move that unfolded in February and early March.
Thursday’s sell-off fell to a low of 1.0835 before recovering and thereby forming a bullish Japanese hammer reversal candlestick pattern on the 4-hour chart. This was followed by a little move higher. Since candlesticks are only short-term patterns, this upside could be at risk of petering out.
The daily chart below is showing the Moving Average Convergence/ Divergence (MACD) momentum indicator crossing over the signal line, giving a bearish sell signal, and adding further evidence to a change of trend.
However, it is also flagging up some key barriers to progress lower in the form of dynamic support from the red 50-day and then the green 200-day Simple Moving Averages (SMA).
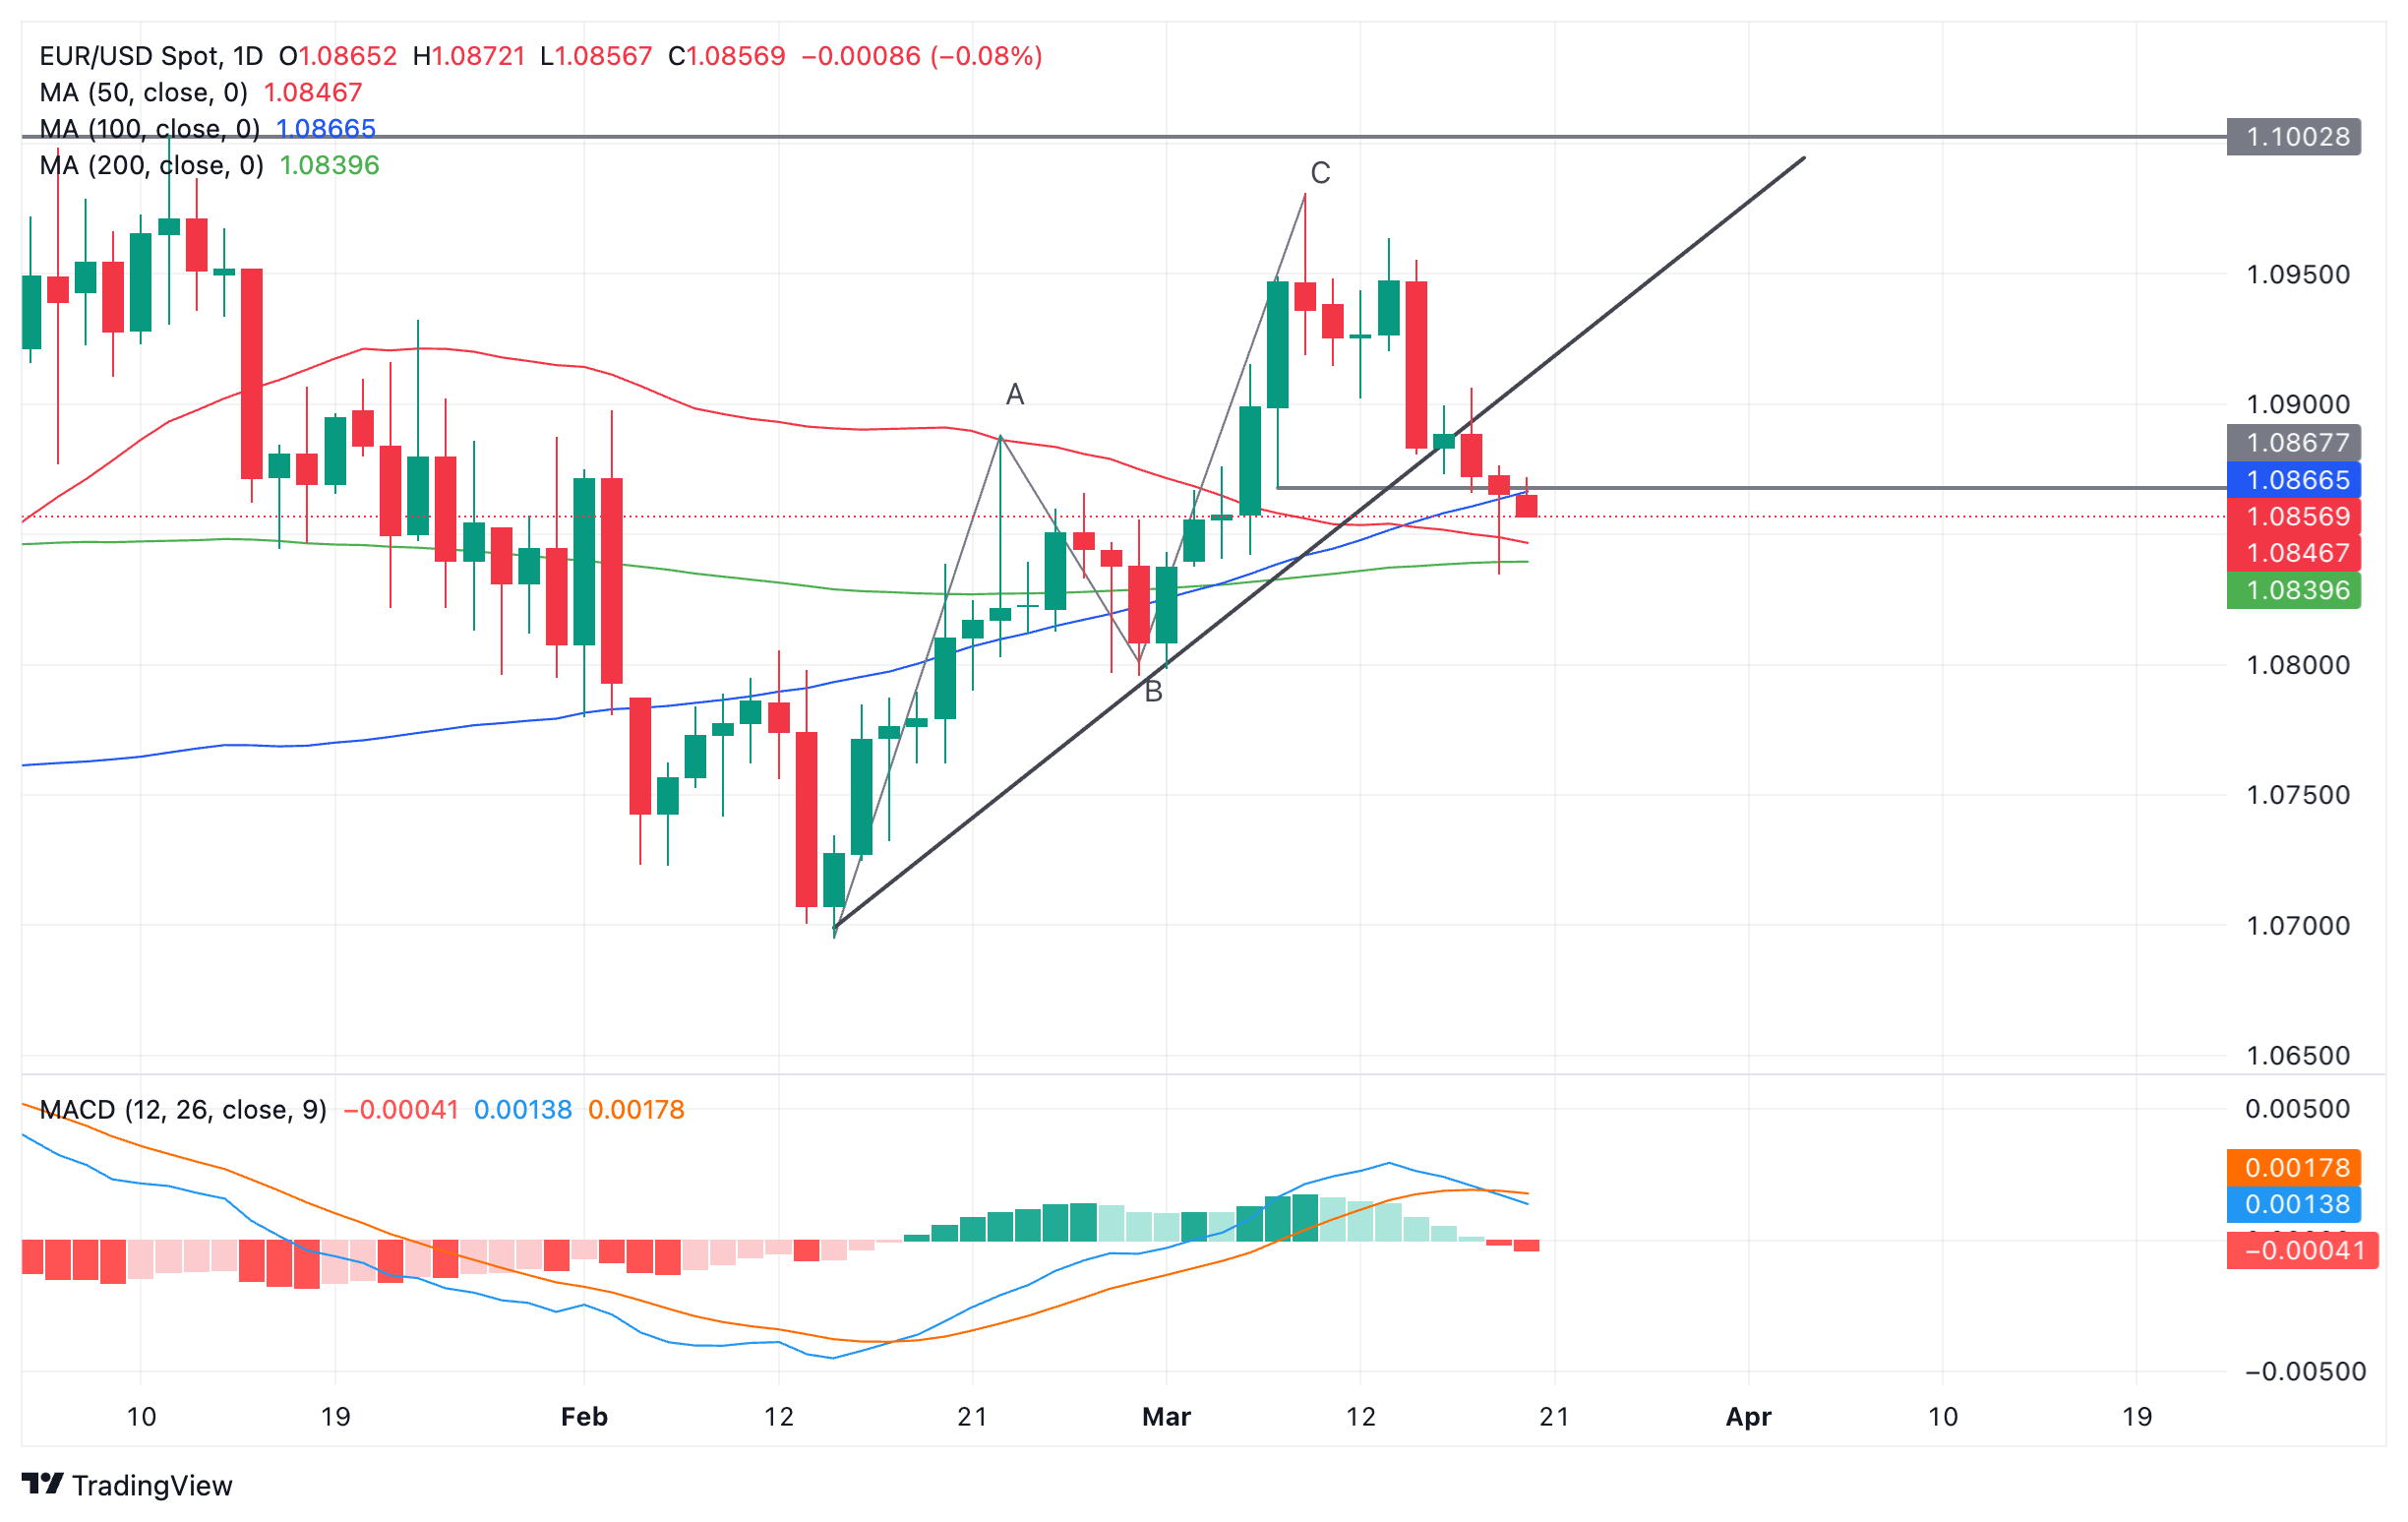
Euro versus US Dollar: Daily chart
On Tuesday price penetrated the 50-day SMA situated at 1.0848 but was repulsed by the 200-day SMA at 1.0839. As on the 4-hour chart, the price recovered and formed a hammer candlestick on the daily chart as well.
For confirmation of the hammer’s bullish reversal potential, Wednesday needs to end on a bullish note as a green candlestick. If that is the case, EUR/USD is likely to continue its recovery higher.
Euro FAQs
The Euro is the currency for the 20 European Union countries that belong to the Eurozone. It is the second most heavily traded currency in the world behind the US Dollar. In 2022, it accounted for 31% of all foreign exchange transactions, with an average daily turnover of over $2.2 trillion a day. EUR/USD is the most heavily traded currency pair in the world, accounting for an estimated 30% off all transactions, followed by EUR/JPY (4%), EUR/GBP (3%) and EUR/AUD (2%).
The European Central Bank (ECB) in Frankfurt, Germany, is the reserve bank for the Eurozone. The ECB sets interest rates and manages monetary policy. The ECB’s primary mandate is to maintain price stability, which means either controlling inflation or stimulating growth. Its primary tool is the raising or lowering of interest rates. Relatively high interest rates – or the expectation of higher rates – will usually benefit the Euro and vice versa. The ECB Governing Council makes monetary policy decisions at meetings held eight times a year. Decisions are made by heads of the Eurozone national banks and six permanent members, including the President of the ECB, Christine Lagarde.
Eurozone inflation data, measured by the Harmonized Index of Consumer Prices (HICP), is an important econometric for the Euro. If inflation rises more than expected, especially if above the ECB’s 2% target, it obliges the ECB to raise interest rates to bring it back under control. Relatively high interest rates compared to its counterparts will usually benefit the Euro, as it makes the region more attractive as a place for global investors to park their money.
Data releases gauge the health of the economy and can impact on the Euro. Indicators such as GDP, Manufacturing and Services PMIs, employment, and consumer sentiment surveys can all influence the direction of the single currency. A strong economy is good for the Euro. Not only does it attract more foreign investment but it may encourage the ECB to put up interest rates, which will directly strengthen the Euro. Otherwise, if economic data is weak, the Euro is likely to fall. Economic data for the four largest economies in the euro area (Germany, France, Italy and Spain) are especially significant, as they account for 75% of the Eurozone’s economy.
Another significant data release for the Euro is the Trade Balance. This indicator measures the difference between what a country earns from its exports and what it spends on imports over a given period. If a country produces highly sought after exports then its currency will gain in value purely from the extra demand created from foreign buyers seeking to purchase these goods. Therefore, a positive net Trade Balance strengthens a currency and vice versa for a negative balance.
EUR/USD ended lower on Tuesday despite a bounce in the German ZEW investor survey back to levels last seen in early 2022. Economists at ING analyze the pair’s outlook ahead of the FOMC meeting.
ECB big hitters on the wire today
Most likely positioning ahead of the FOMC meeting is dominating and the Dollar is playing a little catch-up with last week's rise in higher short-term rates.
Out of the Eurozone today we have five European Central Bank speakers. Amongst those five are the big hitters Christine Lagarde, Isabel Schnabel and Philip Lane. Expect a repeat of the central message that more data is required before the ECB can seriously consider a rate cut at the June meeting.
EUR/USD probably risks a drift to the 1.0800 area pre-FOMC.
- Silver price extends losses amid a market caution on Wednesday.
- Fed is widely expected to maintain its current interest rates at March’s meeting.
- The prolonging of higher interest rates dampens metal prices including Silver.
Silver price loses ground for the third consecutive session, trading lower near $24.90 per troy ounce during early European trading hours on Wednesday. Silver price encounters challenges as the market adopts a cautious stance ahead of the Federal Reserve (Fed) interest rate decision.
The Fed is widely expected to maintain its current interest rates at March’s policy meeting. However, the potential for a hawkish tone from the Fed could exert pressure on metal prices, including Silver. Investors are closely monitoring the Fed's decision for any signals that may impact the future trajectory of interest rate cuts in 2024 and, consequently, metal prices.
Fed Chair Jerome Powell's press conference was a critical focal point. A hawkish stance from the Fed, suggesting prolonged high rates, could dampen demand for gold and its counterparts, reversing recent gains driven by rate cut expectations.
While other major central banks are expected to leave their current interest rates unchanged, market attention will focus on signals regarding the potential initiation of monetary easing. Inflationary pressures from the United States (US) prompted a readjustment of the probability of interest rate cuts in the June and July meetings by the Fed to around 59.2% and 76.0%, respectively. The prospect of higher interest rates has diminished the appeal of non-yielding assets like Silver.
Nevertheless, Silver could have received support from rising geopolitical tensions and an improved industrial outlook from China, the top metals consumer. China's industrial production, fixed asset investment, and retail sales have exceeded forecasts. The People's Bank of China (PBoC) has decided to keep policy rates unchanged at 3.45%.
- The Pound Sterling is expected to remain under pressure on lower-than-anticipated UK CPI data for February.
- Soft UK inflation reinforces market expectations for the BoE to begin reducing interest rates in August.
- The next move in the US Dollar will be guided by the Fed’s monetary policy meeting.
The Pound Sterling (GBP) turns volatile in Wednesday’s London session as the United Kingdom Office for National Statistics (ONS) reported softer-than-expected Consumer Price Index (CPI) data for February. Annual headline and core inflation decelerated to 3.4% and 4.5%, respectively. Lower inflation is expected to allow Bank of England (BoE) policymakers to consider cutting interest rates early than what market participants had anticipated.
Investors should brace for high volatility for the Pound Sterling as the BoE is set to announce its second monetary policy decision of 2024 on Thursday. Investors are expecting the BoE to hold interest rates steady at 5.25%, but soft inflation data might allow policymakers to deliver a slight dovish guidance on interest rates.
Meanwhile, investors remain risk-averse ahead of the Federal Reserve’s (Fed) policy meeting, which will be announced at 18:00 GMT. Investors will keenly focus on the quarterly updated dot plot and economic projections as the Fed is expected to keep interest rates unchanged in the range of 5.25%-5.50%. The dot plot shows interest rate projections from Fed officials for various time frames.
Daily digest market movers: Pound Sterling eyes downside amid multiple headwinds
The Pound Sterling is expected to face pressure as the United Kingdom ONS has reported softer-than-expected consumer price inflation data for February. The annual headline inflation significantly decelerated to 3.4% from expectations of 3.6% and the prior reading of 4.0%. The monthly headline CPI grew by 0.6%, rebounding from a similar decline seen in January. Investors anticipated the monthly headline inflation to grow at a higher pace of 0.7%.
The annual core CPI, which strips off volatile food and energy prices, softened to 4.5% from estimates of 4.6% and the former reading of 5.1%. BoE policymakers generally consider the core inflation data as a preferred measure for decision-making on interest rates. Soft figures might increase their confidence that inflation will sustainably return to the desired rate of 2%. BoE policymakers have been reiterating that rate cuts would be appropriate only if they get the conviction that the inflation target will be achieved.
The Pound Sterling is expected to remain volatile as investors will shift focus to the Bank of England’s interest rate decision, which will be announced on Thursday. The BoE is expected to keep interest rates unchanged at 5.25% for the fifth time in a row. Investors will look for cues about when the BoE will start reducing interest rates. Currently, investors hope that the BoE will start reducing interest rates from the August meeting. The soft inflation data released on Wednesday is likely to reinforce these expectations.
Meanwhile, the market sentiment remains cautious ahead of the Federal Reserve’s monetary policy decision. The CME FedWatch tool shows that the central bank is set to keep interest rates unchanged in the range of 5.25%-5.50%. With the no-change in interest rates almost fully priced in, the monetary policy statement, Fed Chair Jerome Powell’s press conference, and the dot plot and economic projections will be in focus.
Technical Analysis: Pound Sterling struggles to hold above 20-EMA
The Pound Sterling finds interim support near the breakout region of the Descending Triangle formed around 1.2700. The near-term demand for the GBP/USD pair remains uncertain as it struggles to sustain above the 20-day Exponential Moving Average (EMA), which trades around 1.2730.
On the downside, the downward-sloping border of the Descending Triangle chart pattern will act as a support of the Pound Sterling. On the upside, a seven-month high at around 1.2900 will be a major barricade for the Cable.
The 14-period Relative Strength Index (RSI) returns to the 40.00-60.00 range, indicating a sharp volatility contraction.
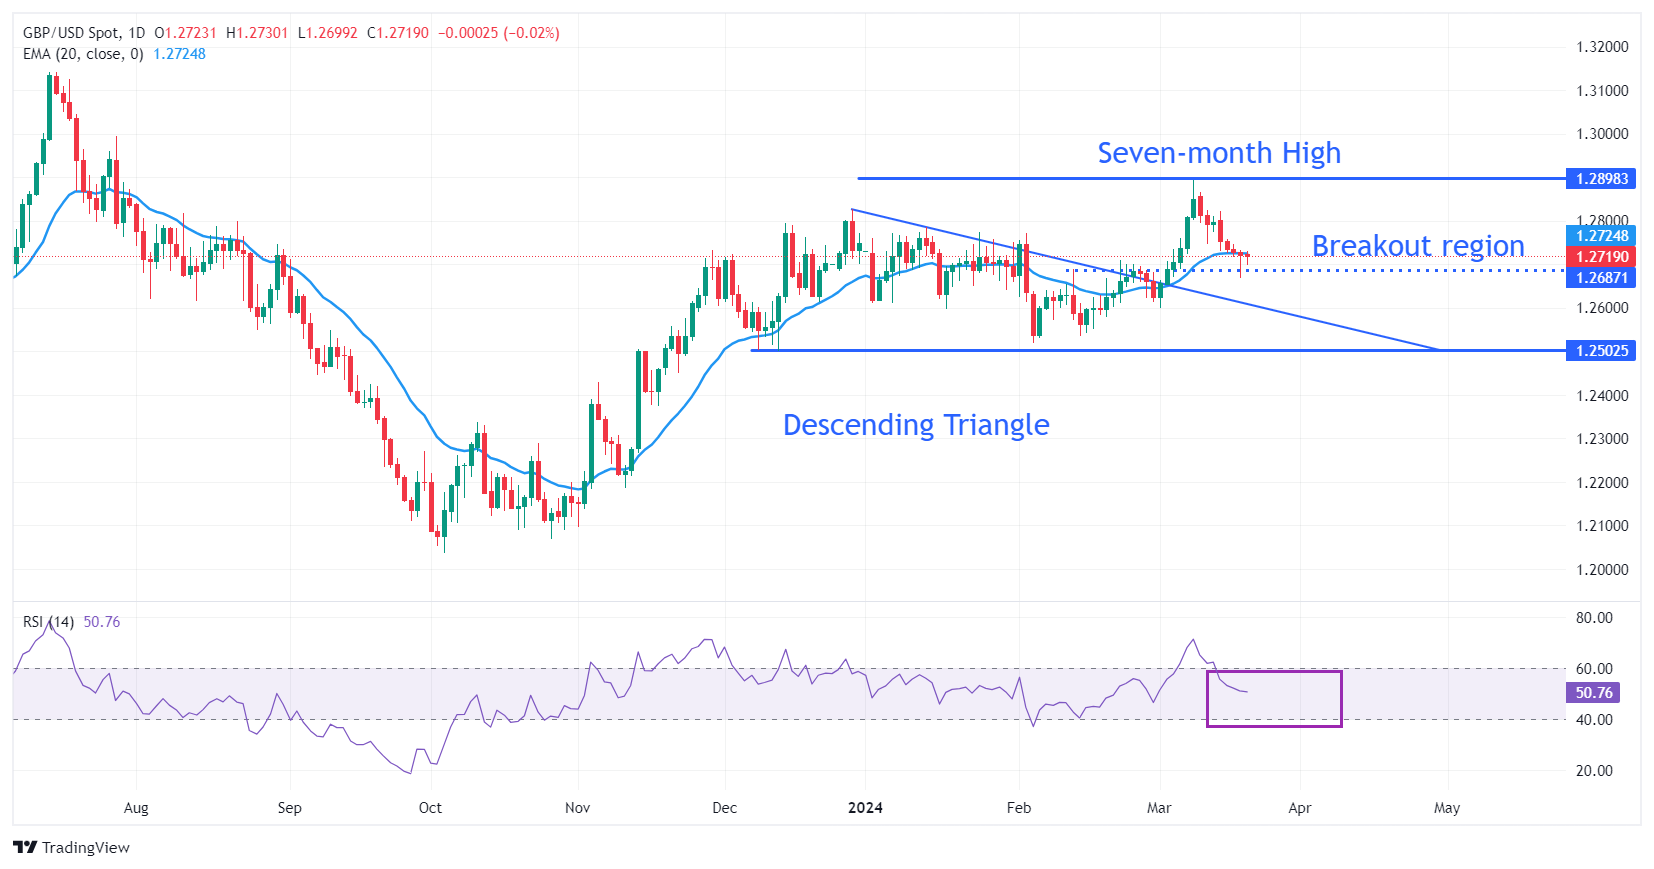
Pound Sterling FAQs
The Pound Sterling (GBP) is the oldest currency in the world (886 AD) and the official currency of the United Kingdom. It is the fourth most traded unit for foreign exchange (FX) in the world, accounting for 12% of all transactions, averaging $630 billion a day, according to 2022 data. Its key trading pairs are GBP/USD, aka ‘Cable’, which accounts for 11% of FX, GBP/JPY, or the ‘Dragon’ as it is known by traders (3%), and EUR/GBP (2%). The Pound Sterling is issued by the Bank of England (BoE).
The single most important factor influencing the value of the Pound Sterling is monetary policy decided by the Bank of England. The BoE bases its decisions on whether it has achieved its primary goal of “price stability” – a steady inflation rate of around 2%. Its primary tool for achieving this is the adjustment of interest rates. When inflation is too high, the BoE will try to rein it in by raising interest rates, making it more expensive for people and businesses to access credit. This is generally positive for GBP, as higher interest rates make the UK a more attractive place for global investors to park their money. When inflation falls too low it is a sign economic growth is slowing. In this scenario, the BoE will consider lowering interest rates to cheapen credit so businesses will borrow more to invest in growth-generating projects.
Data releases gauge the health of the economy and can impact the value of the Pound Sterling. Indicators such as GDP, Manufacturing and Services PMIs, and employment can all influence the direction of the GBP. A strong economy is good for Sterling. Not only does it attract more foreign investment but it may encourage the BoE to put up interest rates, which will directly strengthen GBP. Otherwise, if economic data is weak, the Pound Sterling is likely to fall.
Another significant data release for the Pound Sterling is the Trade Balance. This indicator measures the difference between what a country earns from its exports and what it spends on imports over a given period. If a country produces highly sought-after exports, its currency will benefit purely from the extra demand created from foreign buyers seeking to purchase these goods. Therefore, a positive net Trade Balance strengthens a currency and vice versa for a negative balance.
Today is of course the highlight of the week: the FOMC meeting. Antje Praefcke, FX Analyst at Commerzbank, analyzes the US Dollar (USD) outlook ahead of the policy announcement.
There will be no major scope for USD losses
I think the risk of the Dollar falling after the FOMC meeting is quite low. I cannot imagine a dovish surprise, meaning that the dots will be pulled down after the stronger-than-expected inflation readings in January and February and that Fed Chairman Jerome Powell will signal more willingness to cut interest rates at the press conference. I can rather imagine that the Fed will underline its caution and at least confirm market expectations, i.e. there will be no major scope for Dollar losses.
In this respect, I think the question today is rather how much further the Dollar can gain. I think it will depend on the extent to which the dots meet or even exceed market expectations and how cautious or open Powell will be at the press conference about interest rate cuts. In my opinion, something can be expected, the only decisive question is how much.
Economists at TD Securities discuss the Federal Reserve Interest Rate Decision and its implications for the Bloomberg Dollar Spot Index.
Hawkish (35%)
Fed delivers a pause but maintains policy guidance that retains an option to stay higher for longer, if necessary, as the economy has failed to show clear signs of normalization. 2024 dots move higher and Fed raises long-run dot. Chair Powell mentions that policy likely needs to stay restrictive for longer until there are clearer signs that inflation will stay at the 2% target. BDXY +0.35%.
Base Case (60%)
Fed decides to keep rates on hold, with the Committee keeping policy guidance largely unchanged in the statement. 2024-2026 dots unchanged, but long-run dot moves higher. Fed outlines plan on tapering QT and suggests tapering will begin soon. We expect Chair Powell to keep a cautious stance as he tries to avoid sending any strong signals ahead of the May meeting. BDXY -0.20%.
Dovish (5%)
Fed pauses but also clearly acknowledges in the statement that ‘risks to achieving its employment and inflation goals have moved into a better balance.’ Policy guidance is tweaked to signal that the Committee is close to gaining full confidence that inflation is ‘moving sustainably’ toward the 2% target. All dots remain unchanged. Given policy remains in highly restrictive territory, the chairman anticipates that the Fed might entertain the idea of gradual, preemptive rate cuts in the near future. BDXY -0.50%.
- GBP/JPY holds positive ground near 192.80 after the downbeat UK February inflation data.
- The UK CPI rose 3.4% YoY in February vs. 3.6% estimated.
- The dovish hike from the BoJ weighs on the JPY against the GBP.
- The BoE interest rate decision on Thursday will be a closely watched events
The GBP/JPY cross remains firm below the 193.00 barrier during the early European trading hours on Wednesday. The downbeat UK Consumer Price Index (CPI) inflation data for February did not impact the Pound Sterling (GBP) against the Japanese Yen (JPY). Investors will closely monitor the Bank of England's (BoE) monetary policy meeting on Thursday for fresh catalysts, with no change in rate expected. At the press time, GBP/JPY is trading at 192.80, gaining 0.47% on the day.
The latest data from the UK Office for National Statistics on Wednesday reported that the nation’s Consumer Price Index (CPI) for February rose 0.6% MoM from a 0.6% fall in the previous month, below the market consensus of a 0.7% increase. On an annual basis, the CPI figure increased 3.4% YoY, easing from a 4.0% rise in January and worse than the market expectation of a 3.6% increase.
This report will influence the BoE on whether the central bank will signal its first interest rate cut or retain its “higher rate for longer” stance. Meanwhile, the BoE is anticipated to keep interest rates unchanged at 5.25% for the fifth successive meeting on Thursday as inflation is cooling down.
The BoE governor Andrew Bailey said after the February meeting that the UK central bank saw good news on inflation over the past few months, but policymakers need to see more evidence that inflation is on the course to the 2 % target before BoE can lower interest rates.
On Tuesday, the Bank of Japan (BoJ) decided to raise the interest rate by 10 basis points (bps) from -0.1% to 0% for the first time since 2007, as widely anticipated. However, the Japanese policymakers did not provide any guidance about future policy trajectory and stated that financial conditions would remain accommodative for the time being. The uncertainty of the pace of the BoJ's policy normalization exerts some selling pressure on the JPY and acts as a tailwind for the GBP/JPY cross.
Looking ahead, the Japanese Merchandise Trade Balance Total for February and Jibun Bank Manufacturing PMI for March will be due on Thursday. Market players will shift their attention to the BoE interest rate decision later on Thursday. These events could give a clear direction to the GBP/JPY cross.
- EUR/GBP gains some positive traction on Wednesday, albeit lacks follow-through.
- The immediate market reaction to the softer UK inflation figures fade rather quickly.
- Traders keenly await the BoE meeting on Thursday before placing directional bets.
The EUR/GBP cross attracts some buyers on Wednesday and jumps to a fresh daily peak, around the 0.8555-0.8560 region after the release of the UK consumer inflation figures. Spot prices, however, lack follow-through and remain confined in a familiar trading band held since the beginning of the current month.
The UK Office for National Statistics (ONS) reported that the headline CPI rose 0.6% in February vs. a 0.6% fall recorded in the previous month and consensus estimates. Meanwhile, the yearly rate decelerated more than expected, from 4.0% in January to 3.4% during the reported month – marking its lowest level since September 2021.
Adding to this, the Core CPI fall from the 5.1% YoY rate to 4.5% in February, also missing expectations. This comes on top of a technical recession in the UK during the fourth quarter and raises bets for an early rate cut by the Bank of England (BoE), which, in turn, undermines the British Pound (GBP) and provides a modest lift to the EUR/GBP cross.
The UK inflation, however, is still much above the BoE’s 2.0% target, which, in turn, helps limit losses for the GBP. The shared currency, on the other hand, remains depressed in the wake of expectations that the European Central Bank (ECB) may start cutting interest rates in June. This further contributes to capping gains for the EUR/GBP cross.
Moreover, traders seem reluctant to place aggressive directional bets and prefer to wait on the sidelines ahead of the BoE policy meeting on Thursday. Hence, it will be prudent to wait for a sustained breakout through the short-term trading range before positioning for an extension of the recent goodish rebound from the 0.8500 psychological mark.
Here is what you need to know on Wednesday, March 20:
The US Dollar (USD) holds steady against its major rivals early Wednesday, with the USD Index (DXY) fluctuating in a tight channel below 104.00 after closing the previous four trading days in positive territory. The Federal Reserve (Fed) will announce monetary policy decisions and release the revised Summary of Economic Projections, the so-called dot plot, at 18:00 GMT. Fed Chairman Jerome Powell speak on the policy and economic outlook and respond to questions in a press conference starting at 18:30 GMT.
US Dollar price this week
The table below shows the percentage change of US Dollar (USD) against listed major currencies this week. US Dollar was the strongest against the Japanese Yen.
| USD | EUR | GBP | CAD | AUD | JPY | NZD | CHF | |
| USD | 0.14% | 0.13% | 0.25% | 0.39% | 1.67% | 0.71% | 0.66% | |
| EUR | -0.15% | -0.05% | 0.10% | 0.26% | 1.52% | 0.55% | 0.50% | |
| GBP | -0.10% | 0.05% | 0.15% | 0.29% | 1.57% | 0.61% | 0.55% | |
| CAD | -0.25% | -0.09% | -0.15% | 0.18% | 1.42% | 0.44% | 0.40% | |
| AUD | -0.41% | -0.26% | -0.28% | -0.15% | 1.26% | 0.30% | 0.24% | |
| JPY | -1.69% | -1.55% | -1.50% | -1.46% | -1.29% | -0.97% | -1.04% | |
| NZD | -0.71% | -0.55% | -0.58% | -0.46% | -0.30% | 0.98% | -0.05% | |
| CHF | -0.65% | -0.51% | -0.55% | -0.40% | -0.24% | 1.03% | 0.05% |
The heat map shows percentage changes of major currencies against each other. The base currency is picked from the left column, while the quote currency is picked from the top row. For example, if you pick the Euro from the left column and move along the horizontal line to the Japanese Yen, the percentage change displayed in the box will represent EUR (base)/JPY (quote).
Wall Street's main indexes registered marginal gains and the benchmark 10-year US Treasury bond retreated slightly below 4.3% on Tuesday. In the European morning, US stock index futures modestly lower and the 10-year yield moves sideways near 4.29%. The Fed is widely expected to leave the policy rate unchanged following the March meeting. Investors will scrutinize the dot plot for hints at the timing of the policy pivot and the total amount of rate reduction policymakers are forecasting for this year.
Fed Preview: Forecasts from 15 major banks, risk of a hawkish shift in the dot plot.
The UK's Office for National Statistics reported early Wednesday that inflation, as measured by the change in the Consumer Price Index (CPI), declined to 3.4% on a yearly basis in February from 4% in January. Other details of the report showed that the annual Retail Price Index increased 4.5% as forecast, while the Producer Price Index - Input decreased 2.7%. GBP/USD holds steady slightly above 1.2700 after these data.
Breaking: UK CPI inflation softens to 3.4% in February vs. 3.6% expected.
USD/JPY rose sharply and gained more than 1% on Tuesday following the Bank of Japan's (BoJ) monetary policy announcements. The pair preserves its bullish momentum early Wednesday and was last seen trading at its highest level since November above 151.50.
Japanese Yen adds to post-BoJ losses, approaches multi-decade low ahead of Fed.
NZD/USD lost more than 0.5% on Tuesday and touched its lowest level in nearly four months near 0.6030. The pair struggles to stage a rebound and was last seen trading modestly lower on the day at around 0.6050. Statistics New Zealand will publish fourth-quarter Gross Domestic Product (GDP) data in the early trading hours of the Asian session.
EUR/USD erased its daily losses after dropping below 1.0850 and closed the day virtually unchanged on Tuesday. The European economic docket will feature Construction Output data for January. During the European trading hours, European Central Bank (ECB) President Christine Lagarde will deliver a speech at the ECB and Its Watchers conference in Frankfurt.
Gold extended its sideways grind and posted small losses on Tuesday. XAU/USD continues to move up and down in a relatively tight range between $2,150 and $2,160 midweek.
Gold price extends the range play above $2,150 level ahead of the key FOMC decision.
Fed FAQs
Monetary policy in the US is shaped by the Federal Reserve (Fed). The Fed has two mandates: to achieve price stability and foster full employment. Its primary tool to achieve these goals is by adjusting interest rates. When prices are rising too quickly and inflation is above the Fed’s 2% target, it raises interest rates, increasing borrowing costs throughout the economy. This results in a stronger US Dollar (USD) as it makes the US a more attractive place for international investors to park their money. When inflation falls below 2% or the Unemployment Rate is too high, the Fed may lower interest rates to encourage borrowing, which weighs on the Greenback.
The Federal Reserve (Fed) holds eight policy meetings a year, where the Federal Open Market Committee (FOMC) assesses economic conditions and makes monetary policy decisions. The FOMC is attended by twelve Fed officials – the seven members of the Board of Governors, the president of the Federal Reserve Bank of New York, and four of the remaining eleven regional Reserve Bank presidents, who serve one-year terms on a rotating basis.
In extreme situations, the Federal Reserve may resort to a policy named Quantitative Easing (QE). QE is the process by which the Fed substantially increases the flow of credit in a stuck financial system. It is a non-standard policy measure used during crises or when inflation is extremely low. It was the Fed’s weapon of choice during the Great Financial Crisis in 2008. It involves the Fed printing more Dollars and using them to buy high grade bonds from financial institutions. QE usually weakens the US Dollar.
Quantitative tightening (QT) is the reverse process of QE, whereby the Federal Reserve stops buying bonds from financial institutions and does not reinvest the principal from the bonds it holds maturing, to purchase new bonds. It is usually positive for the value of the US Dollar.
FX option expiries for Mar 20 NY cut at 10:00 Eastern Time, via DTCC, can be found below.
- EUR/USD: EUR amounts
- 1.0800 1.1b
- 1.0825 2.1b
- 1.0875 1.1b
- 1.0900 3.2b
- 1.0940 524m
- 1.1000 1.2b
- GBP/USD: GBP amounts
- 1.2670 541m
- 1.2700 530m
- USD/JPY: USD amounts
- 147.20 1.3b
- 149.00 915m
- 150.00 1.3b
- 150.50 1.2b
- 151.10 500m
- AUD/USD: AUD amounts
- 0.6500 1.1b
- 0.6700 1.2b
- NZD/USD falls to 0.6040 as dismal market sentiment dampens the appeal of risky assets.
- The US Dollar consolidates ahead of the Fed’s policy meeting.
- The NZ GDP is forecasted to have grown by 0.1% in the last quarter of 2023.
The NZD/USD pair continues to face a sell-off and drops to 0.6040 in the late Asian session on Wednesday. The Kiwi asset is under pressure as investors have turned cautious ahead of the Federal Reserve’s (Fed) interest rate decision, which will be announced at 18:00 GMT.
S&P 500 futures have posted some losses in the Asian session, portraying a decline in investors’ risk appetite. The US Dollar Index (DXY) consolidates around 103.85 as investors stay on the sidelines ahead of Fed policy.
The Fed is widely anticipated to keep interest rates unchanged in the range of 5.25%-5.50% for the fifth time in a row. While uncertainty over rate-cut projections will keep the upside in risk-sensitive assets limited. Investors hope that the Fed could support keeping interest rates higher for longer as inflation remained stubborn in February.
Investors will keenly focus on the dot plot, which gets updated quarterly and shows projections for interest rates for different timeframes.
Meanwhile, the next move in the New Zealand Dollar will be guided by domestic Gross Domestic Product (GDP) numbers for the final quarter of 2023. The economy is anticipated to have expanded slightly by 0.1% after contracting by 0.3% in the third quarter of 2023.
An upbeat GDP data would allow the Reserve Bank of New Zealand (RBNZ) to maintain interest rates higher for longer. However, a decline in GDP figures would suggest that the New Zealand economy is in a technical recession. The RBNZ would be in trouble as it will be needed to make a balancing act between high inflation and vulnerable economic prospects.
New Zealand Dollar FAQs
The New Zealand Dollar (NZD), also known as the Kiwi, is a well-known traded currency among investors. Its value is broadly determined by the health of the New Zealand economy and the country’s central bank policy. Still, there are some unique particularities that also can make NZD move. The performance of the Chinese economy tends to move the Kiwi because China is New Zealand’s biggest trading partner. Bad news for the Chinese economy likely means less New Zealand exports to the country, hitting the economy and thus its currency. Another factor moving NZD is dairy prices as the dairy industry is New Zealand’s main export. High dairy prices boost export income, contributing positively to the economy and thus to the NZD.
The Reserve Bank of New Zealand (RBNZ) aims to achieve and maintain an inflation rate between 1% and 3% over the medium term, with a focus to keep it near the 2% mid-point. To this end, the bank sets an appropriate level of interest rates. When inflation is too high, the RBNZ will increase interest rates to cool the economy, but the move will also make bond yields higher, increasing investors’ appeal to invest in the country and thus boosting NZD. On the contrary, lower interest rates tend to weaken NZD. The so-called rate differential, or how rates in New Zealand are or are expected to be compared to the ones set by the US Federal Reserve, can also play a key role in moving the NZD/USD pair.
Macroeconomic data releases in New Zealand are key to assess the state of the economy and can impact the New Zealand Dollar’s (NZD) valuation. A strong economy, based on high economic growth, low unemployment and high confidence is good for NZD. High economic growth attracts foreign investment and may encourage the Reserve Bank of New Zealand to increase interest rates, if this economic strength comes together with elevated inflation. Conversely, if economic data is weak, NZD is likely to depreciate.
The New Zealand Dollar (NZD) tends to strengthen during risk-on periods, or when investors perceive that broader market risks are low and are optimistic about growth. This tends to lead to a more favorable outlook for commodities and so-called ‘commodity currencies’ such as the Kiwi. Conversely, NZD tends to weaken at times of market turbulence or economic uncertainty as investors tend to sell higher-risk assets and flee to the more-stable safe havens.
- AUD/JPY attracts some buyers around 98.95 in Wednesday’s early European session.
- The cross resumes its bullish outlook with the overbought RSI condition.
- The first upside barrier is located in the 99.00–99.05 region; 98.10 acts as an initial support level.
The AUD/JPY cross gains traction below the 99.00 psychological barrier during the early European trading hours on Wednesday. The decline of the Japanese Yen (JPY) to a multi-month low following the Bank of Japan’s (BoJ) dovish hike on Tuesday creates a tailwind for the cross. At the press time, the cross is trading at 98.95, up 0.43% on the day.
Technically, AUD/JPY keeps the bullish vibe unchanged as the cross is above the key 100-period Exponential Moving Averages (EMAs) on the four-hour chart. The Relative Strength Index (RSI) holds in bullish territory above the 50 midline. However, the overbought RSI condition indicates that further consolidation cannot be ruled out before positioning for any near-term AUD/JPY appreciation.
The first upside barrier for the cross will emerge at the 99.00–99.05 zone, representing a high of February 23 and a round figure. The key hurdle is seen at the psychological round mark of 100.00. Further north, the next upstate target is located near a weekly low of May 10, 2013 at 100.40.
On the other hand, a high of March 17 at 98.10 acts as an initial support level for AUD/JPY. The next contention level to watch is the 100-period EMA at 97.85. Any follow-through selling below the latter will resume the downside and drag the cross lower to a low of March 18 at 97.65, followed by the lower limit of the Bollinger Band at 97.24.
AUD/JPY four-hour chart
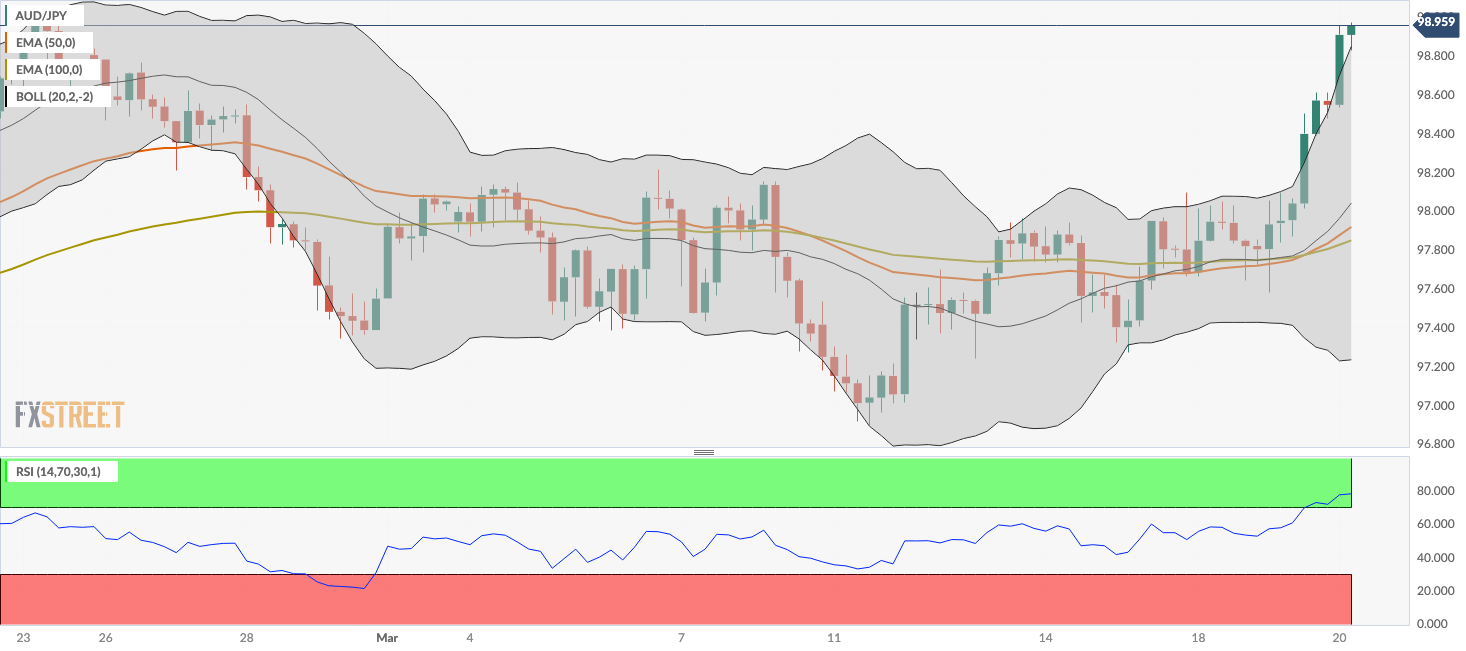
- GBP/USD pair could target immediate support around the 50.0% retracement level of 1.2706.
- MACD, the lagging indicator, suggests a tepid momentum for the pair.
- The key barrier could be found at the 14-day EMA of 1.2735 level and major resistance of 1.2750 level.
GBP/USD trims intraday losses and attempts to snap its losing streak on Wednesday. The GBP/USD pair hovers near 1.2720 during the Asian trading hours. The market adopts cautious sentiment ahead of the Federal Reserve’s (Fed) interest rate decision later in the North American session.
The GBP/USD pair finds immediate support at the 50.0% retracement level of 1.2706, in conjunction with the psychological level of 1.2700. A break below this level could put downward pressure on the pair to navigate the region around the 61.8% Fibonacci retracement level of 1.2661, followed by the major support of 1.2650 level.
The technical analysis of the GBP/USD pair shows that the 14-day Relative Strength Index (RSI) is positioned above 50. This indicates a bullish momentum for the pair. However, the Moving Average Convergence Divergence (MACD), a lagging indicator, suggests a tepid momentum for the pair. the MACD line is situated above the centerline but shows divergence below the signal line.
On the upside, the GBP/USD pair could meet the key barrier at the 14-day Exponential Moving Average (EMA) of 1.2735 level followed by the major resistance of 1.2750 level. A break above the latter could exert upward support for the pair to explore the area around the psychological level at 1.2800.
GBP/USD: Daily Chart
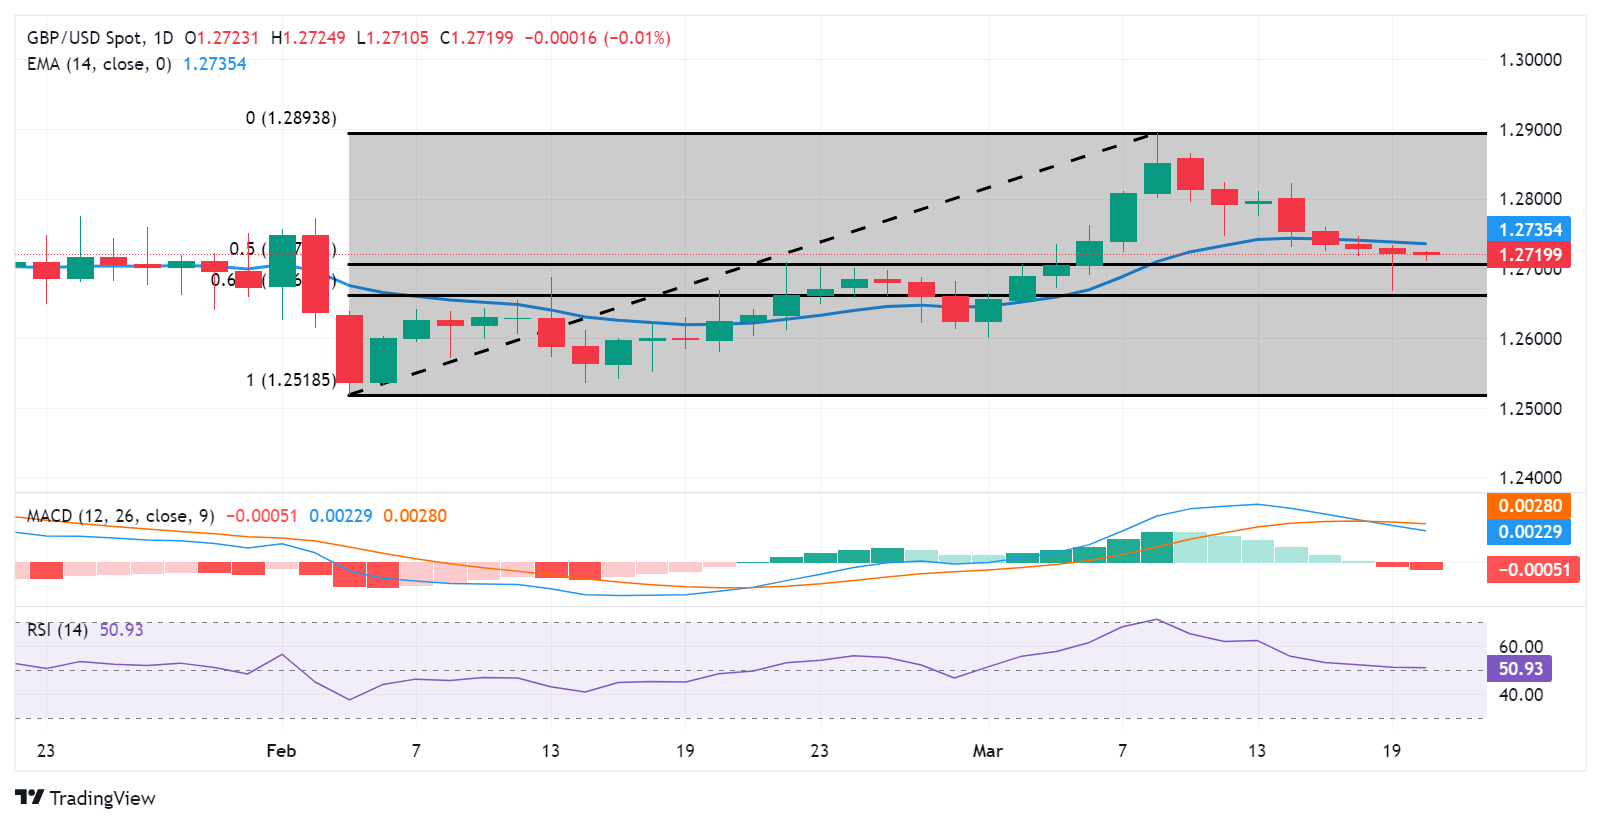
- The US Dollar Index (DXY) gathers strength around 103.88 in Wednesday’s early European session.
- The US Fed is likely to leave the interest rate unchanged for a fifth straight time at its March meeting on Wednesday.
- The sticky inflation and strong labor market data in the US indicated the US might delay the rate cut cycle.
- Traders await the Fed interest rate decision and the press conference on Wednesday.
The US Dollar Index (DXY) trades on a positive note for the fifth straight day near multi-week highs during the early European session on Wednesday. The upside of the US Dollar is supported by the growing speculation that the Federal Reserve (Fed) will maintain its high-for-longer interest rate narrative as inflation in the US remains elevated. Investors await the Fed monetary policy meeting and press conference on Wednesday for fresh catalysts. At the press time, the DXY is trading at 103.88, gaining 0.06% on the day.
The US Fed is expected to leave the interest rate unchanged in a range of 5.25% to 5.5% at its March meeting on Wednesday. The financial markets believe the first rate cut will most likely be in June, but it could be as late as July. After the meeting, traders will closely watch Fed Chair Powell’s press conference, which might provide insight into the timing and the number of rate cuts to expect in 2024. The hawkish remarks from the Fed might provide some support for the US Dollar in the near term.
The US economic data in recent weeks suggested that inflation in the US is easing from its peak levels, but still above the 2% target. Additionally, the strong labor market data indicated the US would not need to cut rates to prevent a recession. Fed Chairman Jerome Powell stated that lowering the interest rate too early might trigger an upsurge in inflation and cause more pain for consumers. The Fed is expected to stick to its forward guidance, emphasizing that it needs more evidence that inflation is on a sustainable path towards its 2% objective before cutting rates.
Looking ahead, market participants will closely monitor the Fed interest rate decision later on Wednesday, along with the press conference and a Summary of Economic Projections, or ‘dot-plot’. On Thursday, the preliminary US S&P Global PMI data for March will be due. Traders will take cues from these events and find trading opportunities around the US Dollar Index.
- EUR/USD attracts some buyers and moves away from a two-week low set on Tuesday.
- The technical setup warrants some caution for bullish trades ahead of the Fed decision.
- A sustained break below the 1.0835 confluence should pave the way for deeper losses.
The EUR/USD pair edges higher during the Asian session on Wednesday and for now, seems to have snapped a two-day losing streak to a nearly two-week low, around the 1.0835 region touched the previous day. Spot prices, however, lack follow-through buying as traders seem reluctant to place aggressive bets and prefer to wait on the sidelines ahead of the outcome of the highly anticipated two-day FOMC policy meeting later today.
The Federal Reserve (Fed) is widely expected to keep rates at their historic highs, though might lower its projection for rate cuts in 2024 to two from three previously in the wake of still-sticky inflation. Hence, the focus will remain glued to the so-called "dot plot", which, along with Fed Chair Jerome Powell's remarks, will be scrutinized for cues about the future rate-cut path. This, in turn, will play a key role in influencing the US Dollar (USD) price dynamics and provide a fresh directional impetus to the EUR/USD pair.
From a technical perspective, the recent pullback from the 1.0980 region, or the highest level since January 12 touched earlier this month, stalled near the 1.0835 confluence support. The said area comprises the very important 200-day Simple Moving Average (SMA) and the 50% Fibonacci retracement level of the February-March positive move, which might continue to protect the immediate downside and act as a key pivotal point. A convincing break below will be seen as a fresh trigger for bears and drag the EUR/USD pair lower.
Given that oscillators on the daily chart have just started gaining negative traction, spot prices might then accelerate the fall to the 1.0800 mark, or the 61.8% Fibo. level, en route to the 1.0760-1.0755 region. Some follow-through selling could make the EUR/USD pair vulnerable to retesting sub-1.0700 levels, or the YTD low touched on February 14.
On the flip side, any subsequent move up is likely to confront stiff resistance near the 1.0900 round-figure mark, nearing the 23.6% Fibo. support breakpoint. A sustained strength beyond will suggest that the corrective pullback has run its course and lift the EUR/USD pair back to the monthly peak, around the 1.0980 region. The momentum could get extended further beyond the 1.1000 psychological mark, towards the next relevant hurdle near the 1.1040 zone.
EUR/USD daily chart
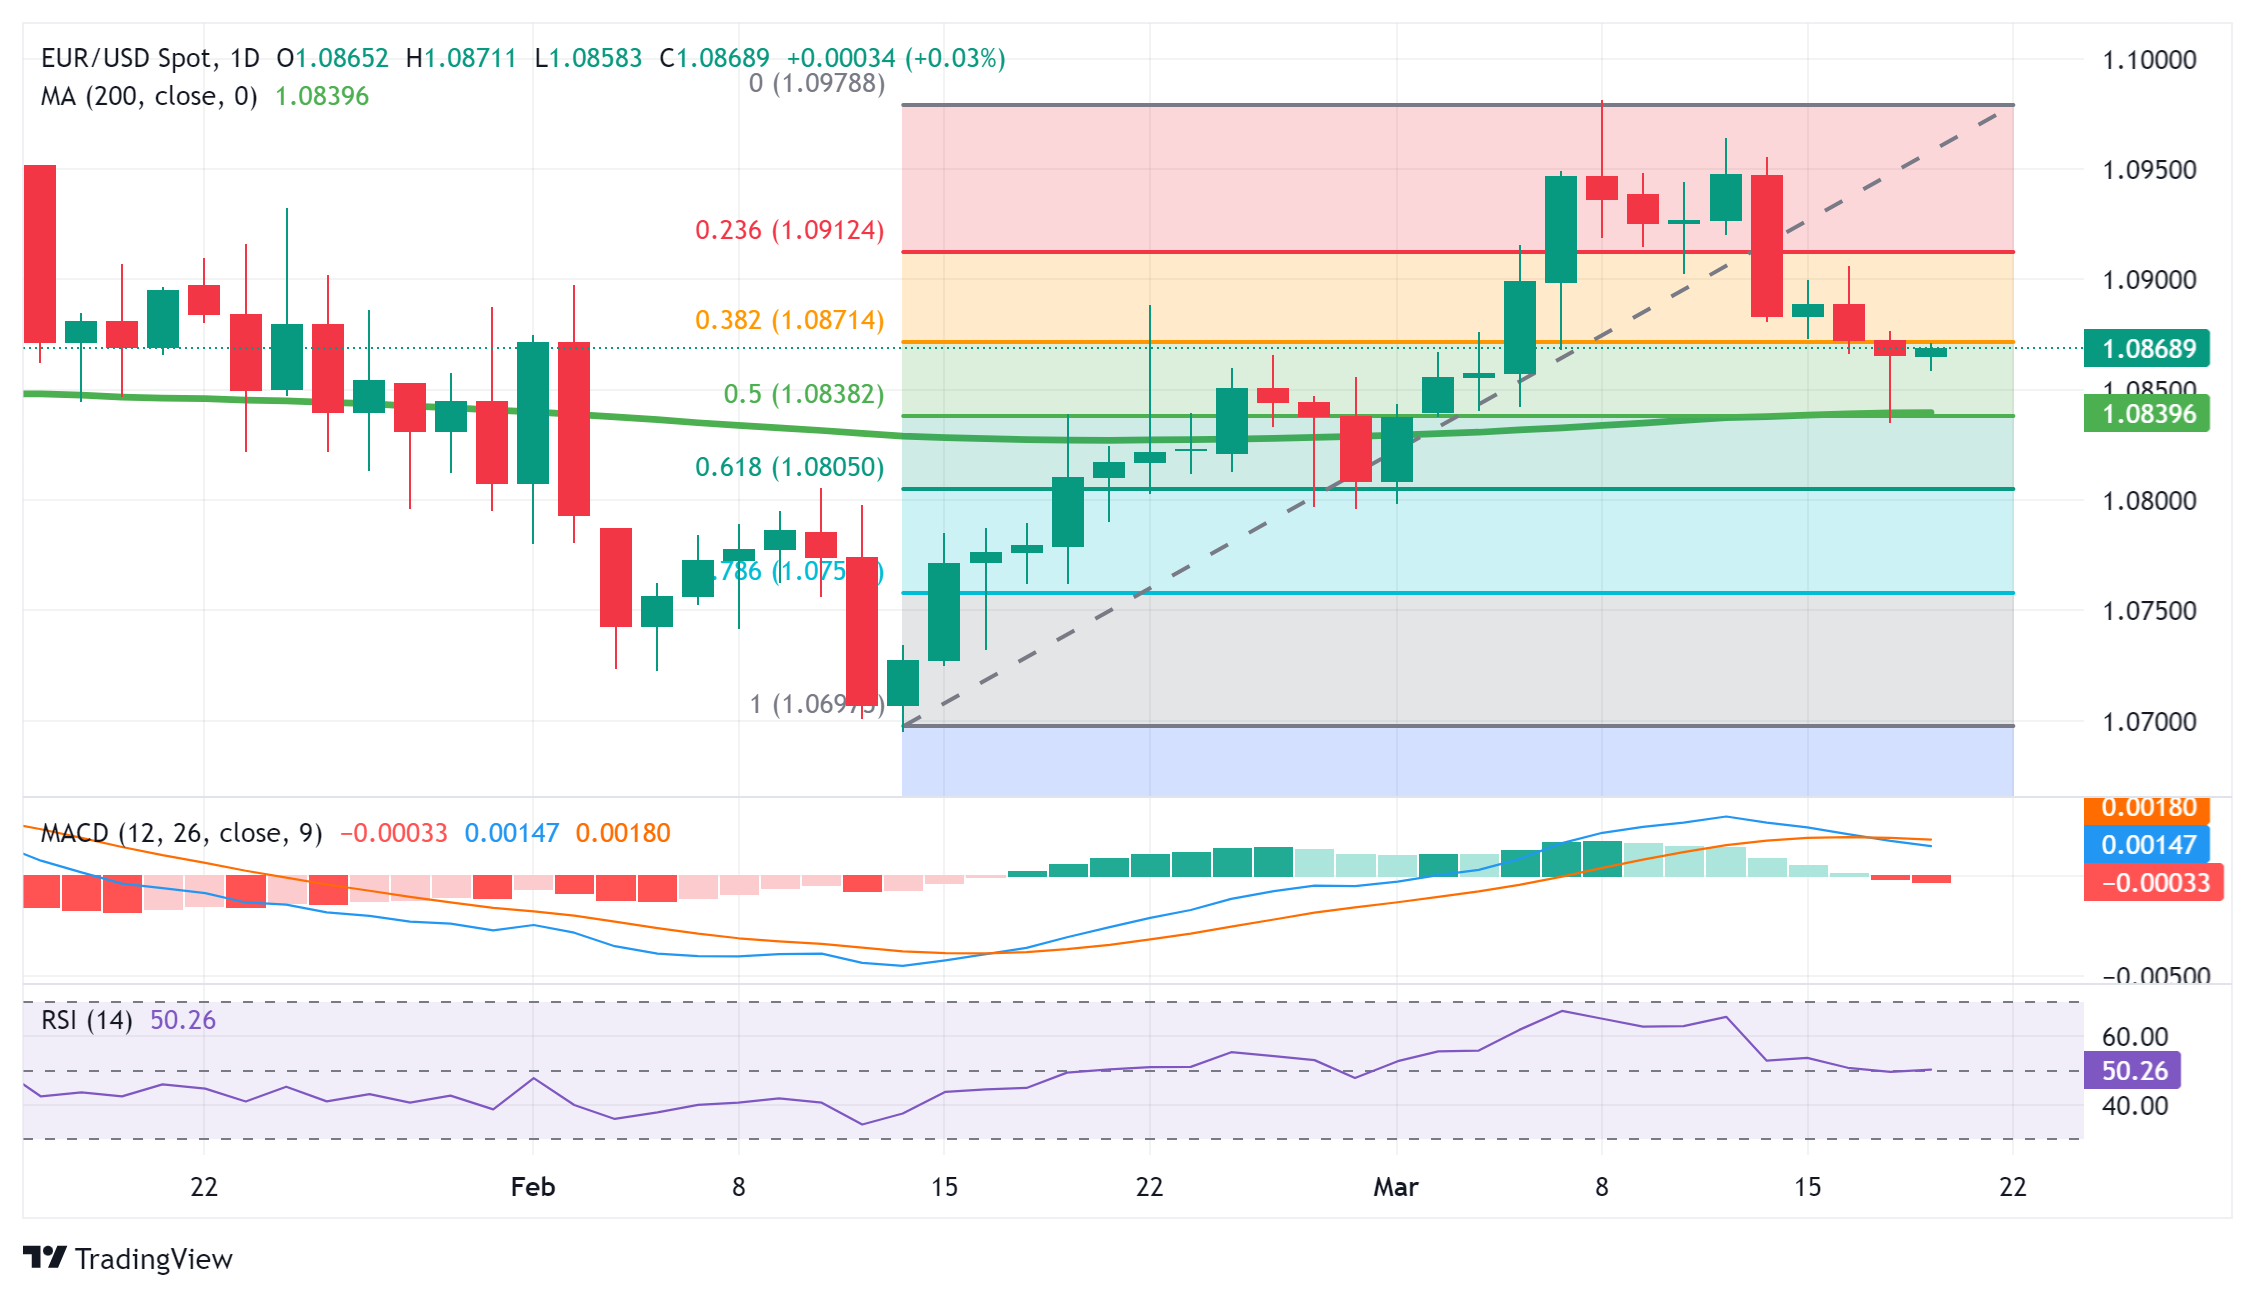
- WTI price inches lower on market caution ahead of Fed decision.
- The higher US Dollar dampens Crude oil demand.
- API Weekly Crude Oil Stock declined by 1.519 million barrels, contrasting with the previous decrease of 5.521 million barrels.
West Texas Intermediate (WTI) oil price edges lower to near $82.40 per barrel during the Asian trading hours on Wednesday, as Crude oil prices corrected from recent highs, with investors booking profits. Additionally, the market has adopted a cautious stance ahead of the US Federal Reserve’s interest rate decision. The higher US Dollar (USD) is also making oil more expensive for countries with different currencies, thereby impacting oil demand.
Market analysts have highlighted Ukraine's drone strikes on Russian oil refineries, which account for at least 10% of Russia’s total oil processing capacity. Although Crude oil prices reached near five-month highs on Tuesday due to supply concerns. However, the drop in Russian refining capacity has led to an increase in Crude oil exports from Russia, according to Reuters.
However, the American Petroleum Institute reported the Weekly Crude Oil Stock for the week ending on March 15, fell by 1.519 million barrels compared to the expected increase of 0.077 million barrels and the previous decrease of 5.521 million barrels.
Energy pipeline company Enbridge is considering expanding the capacity of its Gray Oak oil pipeline by 80,000 barrels per day (bpd) in 2024, with the possibility of adding another 40,000 bpd in 2025, according to Reuters. Originally, the company had planned to increase capacity by 200,000 bpd for the Texas pipeline, but in February, it revised its target to between 100,000 bpd and 200,000 bpd.
Meanwhile, Iraq has announced intentions to reduce its crude exports to 3.3 million bpd in the coming months to comply with its OPEC+ quota. Additionally, Saudi Arabia has experienced a second consecutive monthly decline in Crude exports.
- Gold price struggles to gain any meaningful traction and hangs near one-week low.
- Hawkish Fed expectations underpin the USD and act as a headwind for the metal.
- Traders seem reluctant to place aggressive bets ahead of the crucial FOMC decision.
Gold price (XAU/USD) extends its sideways consolidative price move during the Asian session on Wednesday as traders opt to wait for the outcome of the highly anticipated FOMC monetary policy meeting. Heading into the key central bank event risk, growing acceptance that the Federal Reserve (Fed) will stick to its higher-for-longer interest rates narrative amid sticky inflation lifts the US Dollar (USD) to a two-week high. This, along with the prevalent risk-on environment, turns out to be another factor acting as a headwind for the safe-haven precious metal.
The downside for the Gold price, however, remains cushioned in the wake of geopolitical risks stemming from the protracted Russia-Ukraine war and conflicts in the Middle East. Investors also seem reluctant and await more cues about the Fed's rate-cut path before placing fresh directional bets. Hence, the focus will remain on updated economic projections, which, along with Fed Chair Jerome Powell's comments at the post-meeting press conference, will play a key role in determining the next leg of a directional move for the non-yielding yellow metal.
Daily Digest Market Movers: Gold price remains confined in a range as traders await Fed rate-cut cues
- The stronger US inflation figures released last week forced investors to trim their bets for an interest rate cut in June and remain supportive of elevated US Treasury bond yields, underpinning the US Dollar and capping the Gold price.
- The current market pricing indicates a less than 50% likelihood that the Fed will deliver its first interest-rate cut in June, and the central bank's 2024 median interest-rate projection could shift to two cuts from three cuts previously.
- The yield on the benchmark 10-year US government bond climbed to its highest level since November 30, pushing the USD to a two-week high and contributing to keeping a lid on any meaningful upside for the non-yielding yellow metal.
- Wall Street closed Tuesday's trading session on a high note Tuesday, with the S&P 500 rising to a fresh record high and holding back bulls from placing bets around the safe-haven commodity despite the ongoing geopolitical tensions.
- Traders, however, opt to wait for the outcome of the highly anticipated two-day FOMC monetary policy meeting for cues about the future rate-cut path before positioning for the next leg of a directional move for the XAU/USD.
- The US central bank is widely expected to keep rates at their historic highs, though the market focus will be on the "dot plot" for clues about the number and timing of rate cuts this year, which will influence the precious metal.
- Adding to this, Fed Chair Jerome Powell's comments during the post-meeting press conference might infuse some volatility in the financial markets and provide some meaningful impetus to the Gold price.
Technical Analysis: Gold price bulls need to wait for a breakout through a descending channel
Against the backdrop of the recent blowout rally to the record peak, the pullback witnessed over the past week or so along a downward-sloping channel, constitutes the formation of a bullish flag pattern. Furthermore, technical indicators on the daily chart have eased from the overbought territory and are still holding comfortably in the positive zone. This, in turn, validates the constructive setup and suggests that the path of least resistance for the Gold price is to the upside.
That said, it will be prudent to wait for a sustained breakout through the descending channel before positioning for any further appreciating move. The Gold price might then accelerate the positive move to the $2,175-2,176 intermediate hurdle en route to the record peak, around the $2,195 area touched last week. Some follow-through buying beyond the $2,200 mark will set the stage for the resumption of the uptrend witnessed since the beginning of this month.
On the flip side, the $2,145-2,144 now seems to have emerged as an immediate strong support, which should act as a pivotal point for the Gold price. A convincing break below will expose the next relevant support near the $2,128-2,127 zone before the XAU/USD extends the corrective decline further towards the $2,100 round figure.
Gold FAQs
Gold has played a key role in human’s history as it has been widely used as a store of value and medium of exchange. Currently, apart from its shine and usage for jewelry, the precious metal is widely seen as a safe-haven asset, meaning that it is considered a good investment during turbulent times. Gold is also widely seen as a hedge against inflation and against depreciating currencies as it doesn’t rely on any specific issuer or government.
Central banks are the biggest Gold holders. In their aim to support their currencies in turbulent times, central banks tend to diversify their reserves and buy Gold to improve the perceived strength of the economy and the currency. High Gold reserves can be a source of trust for a country’s solvency. Central banks added 1,136 tonnes of Gold worth around $70 billion to their reserves in 2022, according to data from the World Gold Council. This is the highest yearly purchase since records began. Central banks from emerging economies such as China, India and Turkey are quickly increasing their Gold reserves.
Gold has an inverse correlation with the US Dollar and US Treasuries, which are both major reserve and safe-haven assets. When the Dollar depreciates, Gold tends to rise, enabling investors and central banks to diversify their assets in turbulent times. Gold is also inversely correlated with risk assets. A rally in the stock market tends to weaken Gold price, while sell-offs in riskier markets tend to favor the precious metal.
The price can move due to a wide range of factors. Geopolitical instability or fears of a deep recession can quickly make Gold price escalate due to its safe-haven status. As a yield-less asset, Gold tends to rise with lower interest rates, while higher cost of money usually weighs down on the yellow metal. Still, most moves depend on how the US Dollar (USD) behaves as the asset is priced in dollars (XAU/USD). A strong Dollar tends to keep the price of Gold controlled, whereas a weaker Dollar is likely to push Gold prices up.
- Indian Rupee trades on a weaker note on Wednesday amid the firmer USD and rising crude oil prices.
- Indian economy is expected to grow by 8% this year due to a strong macroeconomic environment, RBI monthly bulletin reported.
- The Fed monetary policy meeting will take center stage on Wednesday.
Indian Rupee (INR) loses momentum near its lowest in a month on Wednesday. The downtick of the pair is backed by the stronger US Dollar (USD), rising crude oil prices, and tracking weakness in other Asian peers. However, the positive outlook of the Indian economy might lift the INR and cap the upside of the pair. The Indian economy is expected to grow by 8% this year, owing to a strong macroeconomic environment that can further India’s growth trajectory, according to the Reserve Bank of India’s (RBI) monthly bulletin on Tuesday.
The US Federal Reserve (Fed) interest rate decision will be in the spotlight on Wednesday, with no change in rate expected. Traders will closely watch Chairman Jerome Powell’s press conference and economic projections after the meeting. On Thursday, India’s S&P Global Manufacturing and Services PMI will be due.
Daily Digest Market Movers: Indian Rupee remains weak amid the global headwinds
- The Foreign Direct Investment (FDI) in India was $25.53 billion, and outflows were $10.11 billion in April 2023-January 2024.
- The net FDI declined 38.4% YoY to $15.41 billion in the first 10 months of this financial year, according to the Reserve Bank of India’s (RBI) March 2024 bulletin.
- The Federal Open Market Committee (FOMC) is widely expected to keep its key federal funds interest rate unchanged in a range of 5.25% to 5.5% and maintain macroeconomic projections at its March meeting on Wednesday.
- Analysts anticipate FOMC’s Powell to reiterate that the central bank wants to see evidence of inflation data in its battle against inflation before cutting rates.
- The US New Home Sales climbed to 10.7% MoM in February from a 12.3% fall in January. Meanwhile, Building Permits rose to 1.9% from a 0.3% decline in the previous reading.
- According to the CME FedWatch Tool, markets have priced in a 63% odds that the Fed will begin the first rate cut in June, with a total of three quarter-point rate cuts this year.
Technical Analysis: Indian Rupee to continue trading in the longer-term range of 82.60–83.10
Indian Rupee trades softer on the day. USD/INR extends the range-bound theme within a multi-month-old descending trend channel around 82.60–83.10 since December 8, 2023.
Technically, USD/INR resumes its bullish bias as the pair bounces above the key 100-day Exponential Moving Average (EMA) on the daily timeframe. The upside momentum is supported by the 14-day Relative Strength Index (RSI) which lies in the bullish territory above 50.0 midline, supporting the buyers for the time being.
If the pair sustains its climb past the strong resistance level near the 100-day EMA and a psychological mark at 83.00, the next upside barrier will emerge near the upper boundary of the descending trend channel at 83.10. Further north, the additional upside filter to watch is 83.35 (high of January 2), en route to the 84.00 round mark.
On the downside, a low of March 14 at 82.80 acts as an initial support level for USD/INR. The potential contention level is located at the lower limit of the descending trend channel at 82.60. A breach of this level could extend the pair’s downtrend to 82.45 (low of August 23) and then 82.25 (low of June 1).
US Dollar price today
The table below shows the percentage change of US Dollar (USD) against listed major currencies today. US Dollar was the strongest against the Japanese Yen.
| USD | EUR | GBP | CAD | AUD | JPY | NZD | CHF | |
| USD | -0.04% | -0.01% | -0.02% | -0.21% | 0.12% | -0.11% | 0.02% | |
| EUR | 0.04% | 0.04% | 0.02% | -0.15% | 0.17% | -0.07% | 0.08% | |
| GBP | 0.02% | -0.04% | -0.01% | -0.19% | 0.13% | -0.11% | 0.03% | |
| CAD | 0.02% | -0.02% | 0.05% | -0.17% | 0.15% | -0.09% | 0.05% | |
| AUD | 0.20% | 0.15% | 0.20% | 0.18% | 0.33% | 0.09% | 0.23% | |
| JPY | -0.12% | -0.16% | -0.13% | -0.16% | -0.33% | -0.23% | -0.10% | |
| NZD | 0.11% | 0.06% | 0.07% | 0.09% | -0.09% | 0.24% | 0.12% | |
| CHF | -0.03% | -0.08% | -0.04% | -0.06% | -0.23% | 0.11% | -0.14% |
The heat map shows percentage changes of major currencies against each other. The base currency is picked from the left column, while the quote currency is picked from the top row. For example, if you pick the Euro from the left column and move along the horizontal line to the Japanese Yen, the percentage change displayed in the box will represent EUR (base)/JPY (quote).
Indian Rupee FAQs
The Indian Rupee (INR) is one of the most sensitive currencies to external factors. The price of Crude Oil (the country is highly dependent on imported Oil), the value of the US Dollar – most trade is conducted in USD – and the level of foreign investment, are all influential. Direct intervention by the Reserve Bank of India (RBI) in FX markets to keep the exchange rate stable, as well as the level of interest rates set by the RBI, are further major influencing factors on the Rupee.
The Reserve Bank of India (RBI) actively intervenes in forex markets to maintain a stable exchange rate, to help facilitate trade. In addition, the RBI tries to maintain the inflation rate at its 4% target by adjusting interest rates. Higher interest rates usually strengthen the Rupee. This is due to the role of the ‘carry trade’ in which investors borrow in countries with lower interest rates so as to place their money in countries’ offering relatively higher interest rates and profit from the difference.
Macroeconomic factors that influence the value of the Rupee include inflation, interest rates, the economic growth rate (GDP), the balance of trade, and inflows from foreign investment. A higher growth rate can lead to more overseas investment, pushing up demand for the Rupee. A less negative balance of trade will eventually lead to a stronger Rupee. Higher interest rates, especially real rates (interest rates less inflation) are also positive for the Rupee. A risk-on environment can lead to greater inflows of Foreign Direct and Indirect Investment (FDI and FII), which also benefit the Rupee.
Higher inflation, particularly, if it is comparatively higher than India’s peers, is generally negative for the currency as it reflects devaluation through oversupply. Inflation also increases the cost of exports, leading to more Rupees being sold to purchase foreign imports, which is Rupee-negative. At the same time, higher inflation usually leads to the Reserve Bank of India (RBI) raising interest rates and this can be positive for the Rupee, due to increased demand from international investors. The opposite effect is true of lower inflation.
- Australian Dollar gains ground on higher ASX 200 index on Wednesday.
- RBA’s Bullock emphasized that the fight against inflation is still ongoing.
- PBoC has kept the interest rate unchanged at 3.45%.
- FOMC could maintain its key cash rates within a range of 5.25% to 5.50%.
The Australian Dollar (AUD) has rebounded from intraday losses and is striving to shift into positive territory on Wednesday. The higher ASX 200 may have lent support to the AUD, thereby bolstering the AUD/USD pair. However, the robust US Dollar could be exerting downward pressure on the pair.
The Reserve Bank of Australia (RBA) has chosen to maintain interest rates at a 12-year high of 4.35% on Tuesday, consistent with its stance for the third consecutive meeting. RBA Governor Michele Bullock emphasized that the battle against inflation is ongoing. While acknowledging persistently high inflation, she refrained from providing specific details regarding the timing or likelihood of rate adjustments, indicating that the bank remains open to various possibilities.
The US Dollar Index (DXY) continues its recent uptrend, which was initiated on Thursday. The strength of the US Dollar is attributed to improved US Treasury yields. Investors eagerly await the interest rate decision from the US Federal Reserve (Fed) scheduled for Wednesday. The Federal Open Market Committee (FOMC) is widely anticipated to maintain its key federal funds interest rate within a range of 5.25% to 5.5%.
Daily Digest Market Movers: Australian Dollar recovers losses amid higher equity market
- The ANZ-Roy Morgan Australian Consumer Confidence index, which is published weekly, stands at 81.7, compared to the previous week's reading of 82.2.
- People’s Bank of China (PBoC) has kept its interest rate unchanged at 3.45%.
- Chinese Foreign Minister Wang Yi met Australia's Foreign Affairs Minister Penny Wong. The Chinese side emphasized their substantial potential. They stressed that China-Australia relations are progressing positively and urged against any hesitation, deviation, or reversal in this forward momentum.
- According to the CME FedWatch Tool, the probability of a rate cut in May stands at 6.3%. The likelihood of a rate cut in June and July is increased, at 59.2% and 76.0%, respectively.
- US Building Permits (MoM) increased to 1.518 million in February, against the expected 1.495 million and 1.489 million prior.
- US Housing Starts (MoM) rose to 1.521M from the previous figure of 1.374M, exceeding the market expectation of 1.425M in February.
- The preliminary US Michigan Consumer Sentiment Index for March decreased to 76.5, from the previous reading of 76.9. This decline comes in contrast to expectations of it remaining unchanged.
- The Board of Governors of the Federal Reserve released Industrial Production (MoM), which increased by 0.1% in February, against the expected reading of flat 0.0% and from the previous decline of 0.5%.
- The US Core Producer Price Index (PPI) remained consistent with the rise of 2.0% year-over-year in February, maintaining its position above the 1.9% expected. The monthly report showed an increase of 0.3% against 0.5% prior, exceeding the expected 0.2% reading.
- US PPI (YoY) increased by 1.6% in February, surpassing the expected 1.1% and 1.0% prior. PPI (MoM) rose by 0.6% above the market expectation and the previous increase of 0.3%.
Technical Analysis: Australian Dollar hovers below the major barrier of 0.6550
The Australian Dollar trades near 0.6540 on Wednesday. Immediate resistance is noted at the major level of 0.6550, followed by the nine-day Exponential Moving Average (EMA) at 0.6561. A breakthrough above this level could potentially propel the AUD/USD pair towards the psychological level of 0.6600. On the downside, the 61.8% Fibonacci retracement level of 0.6528 acts as an immediate support before the psychological level of 0.6500. A breach below this support zone might exert pressure on the AUD/USD pair, potentially leading to a retest of March’s low at the 0.6477 level.
AUD/USD: Daily Chart
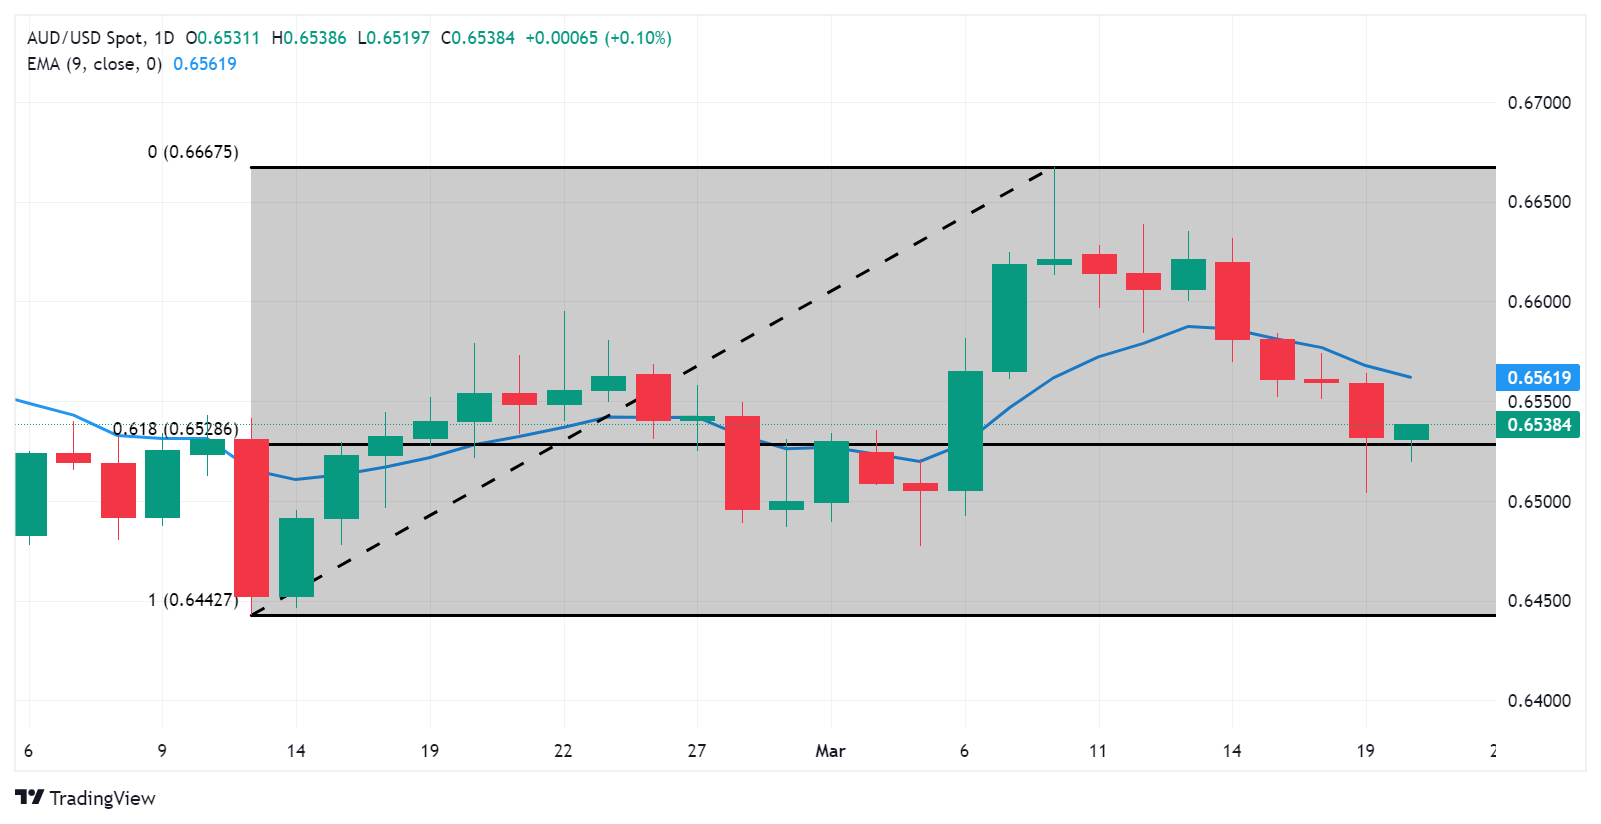
Australian Dollar price today
The table below shows the percentage change of Australian Dollar (AUD) against listed major currencies today. Australian Dollar was the strongest against the Japanese Yen.
| USD | EUR | GBP | CAD | AUD | JPY | NZD | CHF | |
| USD | 0.00% | 0.03% | 0.02% | -0.15% | 0.11% | 0.00% | 0.05% | |
| EUR | 0.00% | 0.03% | 0.02% | -0.14% | 0.12% | 0.00% | 0.05% | |
| GBP | -0.02% | -0.03% | -0.01% | -0.17% | 0.08% | -0.03% | 0.02% | |
| CAD | -0.02% | -0.02% | 0.04% | -0.15% | 0.10% | -0.01% | 0.04% | |
| AUD | 0.14% | 0.14% | 0.18% | 0.16% | 0.26% | 0.15% | 0.19% | |
| JPY | -0.11% | -0.10% | -0.09% | -0.10% | -0.25% | -0.11% | -0.05% | |
| NZD | -0.01% | -0.01% | 0.02% | 0.01% | -0.15% | 0.11% | 0.04% | |
| CHF | -0.05% | -0.06% | -0.01% | -0.04% | -0.19% | 0.07% | -0.05% |
The heat map shows percentage changes of major currencies against each other. The base currency is picked from the left column, while the quote currency is picked from the top row. For example, if you pick the Euro from the left column and move along the horizontal line to the Japanese Yen, the percentage change displayed in the box will represent EUR (base)/JPY (quote).
Australian Dollar FAQs
One of the most significant factors for the Australian Dollar (AUD) is the level of interest rates set by the Reserve Bank of Australia (RBA). Because Australia is a resource-rich country another key driver is the price of its biggest export, Iron Ore. The health of the Chinese economy, its largest trading partner, is a factor, as well as inflation in Australia, its growth rate, and Trade Balance. Market sentiment – whether investors are taking on more risky assets (risk-on) or seeking safe-havens (risk-off) – is also a factor, with risk-on positive for AUD.
The Reserve Bank of Australia (RBA) influences the Australian Dollar (AUD) by setting the level of interest rates that Australian banks can lend to each other. This influences the level of interest rates in the economy as a whole. The main goal of the RBA is to maintain a stable inflation rate of 2-3% by adjusting interest rates up or down. Relatively high interest rates compared to other major central banks support the AUD, and the opposite for relatively low. The RBA can also use quantitative easing and tightening to influence credit conditions, with the former AUD-negative and the latter AUD-positive.
China is Australia’s largest trading partner so the health of the Chinese economy is a major influence on the value of the Australian Dollar (AUD). When the Chinese economy is doing well it purchases more raw materials, goods, and services from Australia, lifting demand for the AUD, and pushing up its value. The opposite is the case when the Chinese economy is not growing as fast as expected. Positive or negative surprises in Chinese growth data, therefore, often have a direct impact on the Australian Dollar and its pairs.
Iron Ore is Australia’s largest export, accounting for $118 billion a year according to data from 2021, with China as its primary destination. The price of Iron Ore, therefore, can be a driver of the Australian Dollar. Generally, if the price of Iron Ore rises, AUD also goes up, as aggregate demand for the currency increases. The opposite is the case if the price of Iron Ore falls. Higher Iron Ore prices also tend to result in a greater likelihood of a positive Trade Balance for Australia, which is also positive for the AUD.
The Trade Balance, which is the difference between what a country earns from its exports versus what it pays for its imports, is another factor that can influence the value of the Australian Dollar. If Australia produces highly sought-after exports, then its currency will gain in value purely from the surplus demand created by foreign buyers seeking to purchase its exports versus what it spends to purchase imports. Therefore, a positive net Trade Balance strengthens the AUD, with the opposite effect if the Trade Balance is negative.
- The Japanese Yen dives to a multi-month low in the wake of the BoJ’s dovish hike on Tuesday.
- Hawkish Fed expectations underpin the USD and lend additional support to the USD/JPY pair.
- Intervention fears might cap the major ahead of the crucial FOMC monetary policy decision.
The Japanese Yen (JPY) prolongs its downtrend against its American counterpart for the seventh straight day and drops to over a four-month low during the Asian session on Wednesday. The Bank of Japan (BoJ) raised the short-term interest rates for the first time since 2007 and scrapped its complex Yield Curve Control (YCC) policy at the end of the March meeting on Tuesday. Despite the historic move, the central bank indicated that financial conditions would remain accommodative and stopped short of offering any guidance about future policy steps, or the pace of policy normalization. This, along with the prevalent risk-on mood, continues to undermine the safe-haven JPY.
The US Dollar (USD), on the other hand, stands tall near a two-week high touched on Tuesday in the wake of expectations that the Federal Reserve (Fed) will reiterate its higher-for-longer interest rates narrative on the back of sticky inflation. The hawkish outlook remains supportive of elevated US Treasury bond yields, which results in the widening of the US-Japan rate differential and exerts additional downward pressure on the JPY. This, in turn, pushes the USD/JPY pair beyond the 151.00 round figure and supports prospects for a further appreciating move. Bulls, however, might wait for the FOMC policy decision for cues about the rate-cut path and before placing fresh bets.
Daily Digest Market Movers: Japanese Yen adds to the post-BoJ losses as traders look to FOMC
- The lack of forward guidance for further tightening disappointed hawkish Bank of Japan traders and continues to weigh heavily on the Japanese Yen, dragging it to the lowest level since November 2023 on Wednesday.
- The BoJ, in a historic move on Tuesday, decided to end its negative interest rate policy and announced its first rate increase since 2007, though pledged to keep monetary conditions accommodative for the time being.
- The BoJ indicated that it will reduce purchases of commercial paper and corporate bonds, though will continue to purchase Japanese government bonds, and step in when necessary, if yields run too high and too fast.
- The robust US consumer and consumer inflation figures fuelled speculations that the Federal Reserve could modify its forward guidance to two 25 basis points rate cuts in 2024 instead of the three projected previously.
- Hence, the focus will remain glued to the outcome of the highly-anticipated two-day FOMC meeting and the updated economic projections, including the so-called "dot plot" for fresh cues about the future rate-cut path.
- In the meantime, hawkish Fed expectations remain supportive of elevated US Treasury bond yields and favour the USD bulls, though intervention fears could limit losses for the JPY and cap the upside for the currency pair.
Technical Analysis: USD/JPY could aim to retest a multi-decade top, around the 152.00 mark
From a technical perspective, the recent solid bounce from the vicinity of the very important 200-day Simple Moving Average (SMA) and a subsequent move beyond the 151.00 mark could be seen as a fresh trigger for bullish traders. Adding to this, oscillators on the daily chart have been gaining positive traction and are still far from being in the overbought territory, validating the near-term constructive setup for the USD/JPY pair. Hence, some follow-through strength back towards the 152.00 neighbourhood, or a multi-decade peak touched in October 2022, looks like a distinct possibility.
On the flip side, any corrective decline now seems to attract fresh buyers and is more likely to remain limited near the 150.80 strong horizontal resistance breakpoint. A sustained break below, however, might prompt some technical selling and drag the USD/JPY pair back towards the 150.00 psychological mark. The next relevant support is pegged near the 149.50 area, which if broken decisively might shift the bias in favour of bearish traders and pave the way for deeper losses.
Japanese Yen FAQs
The Japanese Yen (JPY) is one of the world’s most traded currencies. Its value is broadly determined by the performance of the Japanese economy, but more specifically by the Bank of Japan’s policy, the differential between Japanese and US bond yields, or risk sentiment among traders, among other factors.
One of the Bank of Japan’s mandates is currency control, so its moves are key for the Yen. The BoJ has directly intervened in currency markets sometimes, generally to lower the value of the Yen, although it refrains from doing it often due to political concerns of its main trading partners. The current BoJ ultra-loose monetary policy, based on massive stimulus to the economy, has caused the Yen to depreciate against its main currency peers. This process has exacerbated more recently due to an increasing policy divergence between the Bank of Japan and other main central banks, which have opted to increase interest rates sharply to fight decades-high levels of inflation.
The BoJ’s stance of sticking to ultra-loose monetary policy has led to a widening policy divergence with other central banks, particularly with the US Federal Reserve. This supports a widening of the differential between the 10-year US and Japanese bonds, which favors the US Dollar against the Japanese Yen.
The Japanese Yen is often seen as a safe-haven investment. This means that in times of market stress, investors are more likely to put their money in the Japanese currency due to its supposed reliability and stability. Turbulent times are likely to strengthen the Yen’s value against other currencies seen as more risky to invest in.
The People's Bank of China announced on Wednesday that it maintained the Loan Prime Rate (LPR) unchanged across the time curve.
The Chinese central bank left the one-year and five-year LPR steady at 3.45% and 3.95%, respectively. The 5-year LPR was last cut in February by 25 basis points (bps) from 4.20% to 3.95%.
Market reaction
At the time of writing, AUD/USD is holding higher ground near 0.6532, adding 0.01% on the day.
About the People’s Bank of China Interest Rate Decision
The People’s Bank of China’s (PBoC) Monetary Policy Committee (MPC) holds scheduled meetings on a quarterly basis. However, China’s benchmark interest rate – the loan prime rate (LPR), a pricing reference for bank lending – is fixed every month. If the PBoC forecasts high inflation (hawkish) it raises interest rates, which is bullish for the Renminbi (CNY). Likewise, if the PBoC sees inflation in the Chinese economy falling (dovish) and cuts or keeps interest rates unchanged, it is bearish for CNY. Still, China’s currency doesn’t have a floating exchange rate determined by markets and its value against the US Dollar is fixed mainly by the PBoC on a daily basis.
Australian Dollar FAQs
One of the most significant factors for the Australian Dollar (AUD) is the level of interest rates set by the Reserve Bank of Australia (RBA). Because Australia is a resource-rich country another key driver is the price of its biggest export, Iron Ore. The health of the Chinese economy, its largest trading partner, is a factor, as well as inflation in Australia, its growth rate and Trade Balance. Market sentiment – whether investors are taking on more risky assets (risk-on) or seeking safe-havens (risk-off) – is also a factor, with risk-on positive for AUD.
The Reserve Bank of Australia (RBA) influences the Australian Dollar (AUD) by setting the level of interest rates that Australian banks can lend to each other. This influences the level of interest rates in the economy as a whole. The main goal of the RBA is to maintain a stable inflation rate of 2-3% by adjusting interest rates up or down. Relatively high interest rates compared to other major central banks support the AUD, and the opposite for relatively low. The RBA can also use quantitative easing and tightening to influence credit conditions, with the former AUD-negative and the latter AUD-positive.
China is Australia’s largest trading partner so the health of the Chinese economy is a major influence on the value of the Australian Dollar (AUD). When the Chinese economy is doing well it purchases more raw materials, goods and services from Australia, lifting demand for the AUD, and pushing up its value. The opposite is the case when the Chinese economy is not growing as fast as expected. Positive or negative surprises in Chinese growth data, therefore, often have a direct impact on the Australian Dollar and its pairs.
Iron Ore is Australia’s largest export, accounting for $118 billion a year according to data from 2021, with China as its primary destination. The price of Iron Ore, therefore, can be a driver of the Australian Dollar. Generally, if the price of Iron Ore rises, AUD also goes up, as aggregate demand for the currency increases. The opposite is the case if the price of Iron Ore falls. Higher Iron Ore prices also tend to result in a greater likelihood of a positive Trade Balance for Australia, which is also positive of the AUD.
The Trade Balance, which is the difference between what a country earns from its exports versus what it pays for its imports, is another factor that can influence the value of the Australian Dollar. If Australia produces highly sought after exports, then its currency will gain in value purely from the surplus demand created from foreign buyers seeking to purchase its exports versus what it spends to purchase imports. Therefore, a positive net Trade Balance strengthens the AUD, with the opposite effect if the Trade Balance is negative.
The People’s Bank of China (PBoC) set the USD/CNY central rate for the trading session ahead on Wednesday at 7.0968 as compared to the previous day's fix of 7.0985 and 7.1967 Reuters estimates.
- ASX 200 loses ground ahead of Fed policy decision.
- RBA’s Bullock underscored that the battle against inflation is not yet won.
- Chinese Foreign delegation stressed that China-Australia relations are on the right track.
The ASX 200 Index snaps its three-day winning streak, edging down to near 7710 on Wednesday. The Reserve Bank of Australia (RBA) has opted to keep interest rates unchanged at a 12-year high of 4.35%, maintaining its stance for the third consecutive meeting.
Reserve Bank of Australia issued a cautiously worded statement that refrained from providing struggling buyers with hope for an imminent rate cut. RBA Governor Michele Bullock emphasized that "the war is not yet won" against inflation. In her monetary statement, she acknowledged that inflation remained high but did not disclose any specifics regarding the timing or possibility of rate cuts, merely stating that the bank was not "ruling anything in or out."
Australian equity market followed commodity-linked stocks in early hours, driving movements, with notable gains from Fortescue Metals, up by 1.90%, and Woodside Energy, up by 1.16% at the time of reporting. Core Lithium, Telix Pharmaceuticals, and Paladin Energy lead the top gainers in the ASX 200 Index, while Amcor, Perseus Mining, and South32 are among the top losers.
Mineral Resources, a leading diversified resources company, has entered into a farm-in agreement with Lord Resources for the Horse Rocks lithium project. Earlier this week, the company also finalized a binding head of agreement with Poseidon Nickel to acquire the Lake Johnston nickel concentrator plant.
According to a recent report commissioned by the Chamber of Minerals and Energy of WA (CME), the Western Australian resources sector saw a significant increase in spending by 32% last year, reaching a record $132 billion. Data from the CME's annual economic contribution factsheets reveal that the direct economic contribution in the state also experienced a notable rise, exceeding $77 billion, equivalent to almost $27,000 per Western Australian.
During the meeting between Chinese Foreign Minister Wang Yi and Australia's Foreign Affairs Minister Penny Wong, the Chinese side emphasized the highly complementary nature of the economies of China and Australia, noting their significant potential. Stressing that China-Australia relations are on the right track, it was emphasized that there should be no hesitation, deviation, or reversal in the progress made.
RBA FAQs
The Reserve Bank of Australia (RBA) sets interest rates and manages monetary policy for Australia. Decisions are made by a board of governors at 11 meetings a year and ad hoc emergency meetings as required. The RBA’s primary mandate is to maintain price stability, which means an inflation rate of 2-3%, but also “..to contribute to the stability of the currency, full employment, and the economic prosperity and welfare of the Australian people.” Its main tool for achieving this is by raising or lowering interest rates. Relatively high interest rates will strengthen the Australian Dollar (AUD) and vice versa. Other RBA tools include quantitative easing and tightening.
While inflation had always traditionally been thought of as a negative factor for currencies since it lowers the value of money in general, the opposite has actually been the case in modern times with the relaxation of cross-border capital controls. Moderately higher inflation now tends to lead central banks to put up their interest rates, which in turn has the effect of attracting more capital inflows from global investors seeking a lucrative place to keep their money. This increases demand for the local currency, which in the case of Australia is the Aussie Dollar.
Macroeconomic data gauges the health of an economy and can have an impact on the value of its currency. Investors prefer to invest their capital in economies that are safe and growing rather than precarious and shrinking. Greater capital inflows increase the aggregate demand and value of the domestic currency. Classic indicators, such as GDP, Manufacturing and Services PMIs, employment, and consumer sentiment surveys can influence AUD. A strong economy may encourage the Reserve Bank of Australia to put up interest rates, also supporting AUD.
Quantitative Easing (QE) is a tool used in extreme situations when lowering interest rates is not enough to restore the flow of credit in the economy. QE is the process by which the Reserve Bank of Australia (RBA) prints Australian Dollars (AUD) for the purpose of buying assets – usually government or corporate bonds – from financial institutions, thereby providing them with much-needed liquidity. QE usually results in a weaker AUD.
Quantitative tightening (QT) is the reverse of QE. It is undertaken after QE when an economic recovery is underway and inflation starts rising. Whilst in QE the Reserve Bank of Australia (RBA) purchases government and corporate bonds from financial institutions to provide them with liquidity, in QT the RBA stops buying more assets, and stops reinvesting the principal maturing on the bonds it already holds. It would be positive (or bullish) for the Australian Dollar.
- USD/CAD holds positive ground near 1.3578 in Wednesday's Asian session.
- Fed is anticipated to keep rates steady in a range of 5.25% to 5.5% at its policy meeting on Wednesday.
- The downbeat Canada’s CPI inflation data boosted expectations for a June rate cut from the BoC.
The USD/CAD pair gains momentum above the mid-1.3500s during the early Asian trading hours on Wednesday. The uptick of the pair is bolstered by the firmer US Dollar (USD) and cooler-than-expected Canadian Consumer Price Index (CPI) inflation data. Investors will closely monitor the Federal Reserve interest rate decision on Wednesday, with no change in rate expected. At the press time, the pair is trading at 1.3578, up 0.09% on the day.
The Fed is likely to keep rates at a two-decade high in a range of 5.25% to 5.5% at its two-day policy meeting on Wednesday and stay focused on sticky inflation. According to the CME FedWatch Tool, markets have priced in three quarter-point rate cuts this year, with 63% odds that they will begin in June
About the data, the US Census Bureau revealed on Tuesday that New Home Sales improved to 10.7% MoM in February from a 12.3% fall in January. Meanwhile, Building Permits rose to 1.9% from the previous reading of a 0.3% decline.
On the other hand, weaker-than-expected Canada’s CPI inflation data boosted expectations for a June rate cut from the Bank of Canada (BoC), which exerts some selling pressure on the Canadian Dollar (CAD). Following the data, money markets have priced in a 75% chance that the BoC will start cutting rates in June, up from 50% before the release.
On Tuesday, the headline Canadian CPI figure rose 2.8% YoY in February, while the Core CPI figure eased to 2.1% in February from 2.4% in January. On a monthly basis, the CPI figure climbed 0.3% MoM compared to expectations for a 0.6% increase.
Looking ahead, the Fed's monetary policy on Wednesday will take center stage. Fed Chair Jerome Powell will hold a press conference 30 minutes later, which might provide information on the central bank's outlook. On Thursday, the BoC Summary of Deliberations and Canada’s housing data will be released.
Chinese foreign minister Wang Yi met Australia's foreign affairs minister Penny Wong on Tuesday. During the meetings, Wong said Australia looks forward to a frank exchange of views on our shared interests, points of difference, and our respective roles in upholding a region that is peaceful, stable, and secure.
Key quotes
“The economies of China and Australia are highly complementary and have great potential.”
“Stressed that since China-Australia relations are on the right track, we must not hesitate, deviate or turn back.”
“Regarding China's sovereignty, dignity and legitimate concerns, we hope that Australian side will continue to abide by commitments it has made, respect and properly handle them.”
“The most important thing is to persist in seeking common ground while reserving differences.”
“Every time we meet, the mutual trust between two sides increases by one point, and China-Australia relations take a step forward.”
“Hope that the momentum of this good interaction will continue.”
Market reaction
At the time of writing, the AUD/USD pair is trading near 0.6521, holding lower while losing 0.16% on the day.
Australian Dollar FAQs
One of the most significant factors for the Australian Dollar (AUD) is the level of interest rates set by the Reserve Bank of Australia (RBA). Because Australia is a resource-rich country another key driver is the price of its biggest export, Iron Ore. The health of the Chinese economy, its largest trading partner, is a factor, as well as inflation in Australia, its growth rate and Trade Balance. Market sentiment – whether investors are taking on more risky assets (risk-on) or seeking safe-havens (risk-off) – is also a factor, with risk-on positive for AUD.
The Reserve Bank of Australia (RBA) influences the Australian Dollar (AUD) by setting the level of interest rates that Australian banks can lend to each other. This influences the level of interest rates in the economy as a whole. The main goal of the RBA is to maintain a stable inflation rate of 2-3% by adjusting interest rates up or down. Relatively high interest rates compared to other major central banks support the AUD, and the opposite for relatively low. The RBA can also use quantitative easing and tightening to influence credit conditions, with the former AUD-negative and the latter AUD-positive.
China is Australia’s largest trading partner so the health of the Chinese economy is a major influence on the value of the Australian Dollar (AUD). When the Chinese economy is doing well it purchases more raw materials, goods and services from Australia, lifting demand for the AUD, and pushing up its value. The opposite is the case when the Chinese economy is not growing as fast as expected. Positive or negative surprises in Chinese growth data, therefore, often have a direct impact on the Australian Dollar and its pairs.
Iron Ore is Australia’s largest export, accounting for $118 billion a year according to data from 2021, with China as its primary destination. The price of Iron Ore, therefore, can be a driver of the Australian Dollar. Generally, if the price of Iron Ore rises, AUD also goes up, as aggregate demand for the currency increases. The opposite is the case if the price of Iron Ore falls. Higher Iron Ore prices also tend to result in a greater likelihood of a positive Trade Balance for Australia, which is also positive of the AUD.
The Trade Balance, which is the difference between what a country earns from its exports versus what it pays for its imports, is another factor that can influence the value of the Australian Dollar. If Australia produces highly sought after exports, then its currency will gain in value purely from the surplus demand created from foreign buyers seeking to purchase its exports versus what it spends to purchase imports. Therefore, a positive net Trade Balance strengthens the AUD, with the opposite effect if the Trade Balance is negative.
| Pare | Closed | Change, % |
|---|---|---|
| AUDUSD | 0.65312 | -0.42 |
| EURJPY | 163.849 | 1.07 |
| EURUSD | 1.08652 | -0.07 |
| GBPJPY | 191.832 | 1.08 |
| GBPUSD | 1.27201 | -0.06 |
| NZDUSD | 0.60515 | -0.55 |
| USDCAD | 1.35611 | 0.21 |
| USDCHF | 0.88776 | 0.02 |
| USDJPY | 150.803 | 1.14 |
- GBP/USD trades on a weaker note near 1.2719 on the stronger USD.
- The Fed is likely to keep its benchmark rate steady on Wednesday.
- UK CPI inflation report might offer some hints on whether the BoE will signal the timeline of its first interest rate cut.
- The UK February CPI inflation and Fed interest rate decisions will be the highlights on Wednesday.
The GBP/USD pair trades in negative territory for the fifth consecutive day during the early Asian session on Wednesday. Investors await the UK February Consumer Price Index (CPI) inflation data and the Federal Reserve (Fed) interest rate decision on Wednesday. The Fed is anticipated to hold rates steady for a fifth straight time at its March meeting. GBP/USD currently trades around 1.2719, down 0.01% on the day.
Markets expect the Fed will keep its benchmark rate steady in a range of 5.25% to 5.5% on Wednesday as inflation remains elevated. Fed Chairman Jerome Powell noted that cutting rates too early could spark a resurgence of inflation and cause more pain for consumers. The Fed is likely to maintain its forward guidance and stress that it needs more evidence that inflation is on a sustainable path toward its 2% target before lowering interest rates. The lower bets on the rate cut expectation might lift the US Dollar (USD) in the near term and cap the upside of the GBP/USD pair.
On the other hand, the UK CPI inflation report due later in the day might offer some hints on whether the Bank of England (BoE) will signal the timeline of its first interest rate cut or retain its higher rate for a longer stance. The headline UK CPI is expected to rise 3.6% MoM in February from a 4.0% rise in January, while the Core CPI figure is projected to fall to 4.6% YoY in February from a 5.1% rise in January. The stronger-than-expected data might convince the BoE to hold the higher rates for a longer rate narrative and boost the Pound Sterling (GBP) against the Greenback.
Traders will keep an eye on the UK CPI inflation for February on Wednesday ahead of the Fed interest rate decision. After the meeting, the focus will turn to Chairman Jerome Powell’s press conference and economic projections. On Thursday, the BoE interest rate decision will be a closely watched event. These events could give a clear direction to the GBP/USD pair.


© 2000-2026. All rights reserved.
This site is managed by Teletrade D.J. LLC 2351 LLC 2022 (Euro House, Richmond Hill Road, Kingstown, VC0100, St. Vincent and the Grenadines).
The information on this website is for informational purposes only and does not constitute any investment advice.
The company does not serve or provide services to customers who are residents of the US, Canada, Iran, The Democratic People's Republic of Korea, Yemen and FATF blacklisted countries.
Making transactions on financial markets with marginal financial instruments opens up wide possibilities and allows investors who are willing to take risks to earn high profits, carrying a potentially high risk of losses at the same time. Therefore you should responsibly approach the issue of choosing the appropriate investment strategy, taking the available resources into account, before starting trading.
Use of the information: full or partial use of materials from this website must always be referenced to TeleTrade as the source of information. Use of the materials on the Internet must be accompanied by a hyperlink to teletrade.org. Automatic import of materials and information from this website is prohibited.
Please contact our PR department if you have any questions or need assistance at pr@teletrade.global.
transfers