- Analytics
- News and Tools
- Market News
Analytics, News, and Forecasts for CFD Markets: currency news — 26-03-2024.
- NZD/USD trades on a softer note near 0.6000 after retracing from a weekly top of nearly 0.6030 on Wednesday.
- The rate-cutting expectation and dovish comments from Fed officials exert some pressure on the US Dollar.
- The technical recession in New Zealand’s economy in Q4 2024 will leave ample space for RBNZ to cut the rate sooner than expected.
- Investors await the RBNZ’s Orr speech for fresh impetus.
The NZD/USD pair remains on the defensive around 0.6000 despite the weaker US Dollar (USD) during Wednesday’s early Asian session. The ANZ Business Confidence will be due from the New Zealand docket, and Reserve Bank of New Zealand (RBNZ) Governor Orr is set to speak later in the day. Nonetheless, the market is likely to be mute in light trading ahead of the Good Friday holiday.
The US Federal Reserve (Fed) decided to hold interest rates between 5.25% and 5.5% at its March meeting last week. The Fed Chair Jerome Powell did not specify the timing for cutting rates but hinted that the first rate cut will be determined by what inflation measures and other key economic data show. Several Fed officials agreed to wait and see more evidence of inflation that ensures it heads back down to the 2% target before it cuts rates. Fed Governor Christopher Waller and Chicago Fed President Austan Goolsbee anticipate three cuts this year. Dovish comments from Fed officials weigh on the Greenback against its rivals.
On the Kiwi front, the technical recession in New Zealand’s economy in the final quarter of 2024 leaves ample space for the Reserve Bank of New Zealand (RBNZ) to cut the official cash rate (OCR) sooner than expected. An aggressive RBNZ rate-cutting cycle would in turn likely weigh on the NZD and create a headwind for the NZD/USD pair.
The US Personal Consumption Expenditures Price Index (PCE) data for February are due on Friday. The Fed's Powell is also scheduled to speak on the same day. In the case of slowing inflation data, this could prevent any rate cuts from the Fed and exert some selling pressure on the USD.
- AUD/USD hovers at 0.6533, with US economic strength and upcoming PCE Price Index release setting the tone.
- Recent US durable goods orders exceed expectations, but consumer confidence dips slightly in the face of inflation concerns.
- As Fed officials express divergent views on rate cuts, market eyes turn to Australian CPI data for further direction.
The Aussie Dollar remains flatlines against the US Dollar as Wednesday’s Asian session begins. On Tuesday, the AUD/USD pair, reached a daily high of 0.6559 before retreating 0.11%. At the time of writing, the pair trades at 0.6533 virtually unchanged.
Aussie Dollar steadies as traders digest US durable goods data and brace for key inflation indicators
Wall Street ended the session with losses as a late risk-off impulse sent US equities lower. Traders are bracing for the release of the US Federal Reserve's preferred gauge for inflation, the Core Personal Consumption Expenditure (PCE) Price Index, which is expected to slow from 0.4% to 0.3% MoM and increase from 2.4% to 2.5% in the twelve months to February.
Meanwhile, AUD/USD traders were entertained by the release of the US Durable Goods Orders for February. Readings came at 1.4% Month over Month, exceeding forecasts of 1.1% and January’s -0.9% plunge. The core Durable Goods Orders stood at 0.4% Month over Month, up from -0.3% and above the consensus of 0.4%.
Other data revealed by the Conference Board (CB) showed that Consumer Confidence was steady in March, yet it ticked down to 104.7 from 104.8, a downward revision from the previous month. The survey showed Americans blaming higher prices and soaring borrowing costs.t
The Greenback was underpinned throughout the session, weighing on most G8 Forex currencies, including the Aussie Dollar (AUD). The US Dollar Index (DXY), which tracks the performance of a basket of currencies against the buck, rose 0.07% to 104.29.
Fed speakers divided
The lack of Federal Reserve officials crossing the wires on Tuesday, left traders adrifr to Monday-s speeches. Atlanta’s Fed Raphael Bostic stated the foresees just one cut, instead of 2 for 2024. Meanwhile, Lisa D. Cook added that easing policy too soon increases the risk of inflation becoming entrenched.
Chicago Fed President Austan Goolsbee expects three cuts on the dovish spectrum, though he says he needs more evidence of inflation “coming down.”
Australia’s inflation in focus
AS the Asian session commences, traders are eyeing the release of Australia’s inflation. The consensus is for February’s monthly CPI to be 3.4%.
Australian Dollar FAQs
One of the most significant factors for the Australian Dollar (AUD) is the level of interest rates set by the Reserve Bank of Australia (RBA). Because Australia is a resource-rich country another key driver is the price of its biggest export, Iron Ore. The health of the Chinese economy, its largest trading partner, is a factor, as well as inflation in Australia, its growth rate and Trade Balance. Market sentiment – whether investors are taking on more risky assets (risk-on) or seeking safe-havens (risk-off) – is also a factor, with risk-on positive for AUD.
The Reserve Bank of Australia (RBA) influences the Australian Dollar (AUD) by setting the level of interest rates that Australian banks can lend to each other. This influences the level of interest rates in the economy as a whole. The main goal of the RBA is to maintain a stable inflation rate of 2-3% by adjusting interest rates up or down. Relatively high interest rates compared to other major central banks support the AUD, and the opposite for relatively low. The RBA can also use quantitative easing and tightening to influence credit conditions, with the former AUD-negative and the latter AUD-positive.
China is Australia’s largest trading partner so the health of the Chinese economy is a major influence on the value of the Australian Dollar (AUD). When the Chinese economy is doing well it purchases more raw materials, goods and services from Australia, lifting demand for the AUD, and pushing up its value. The opposite is the case when the Chinese economy is not growing as fast as expected. Positive or negative surprises in Chinese growth data, therefore, often have a direct impact on the Australian Dollar and its pairs.
Iron Ore is Australia’s largest export, accounting for $118 billion a year according to data from 2021, with China as its primary destination. The price of Iron Ore, therefore, can be a driver of the Australian Dollar. Generally, if the price of Iron Ore rises, AUD also goes up, as aggregate demand for the currency increases. The opposite is the case if the price of Iron Ore falls. Higher Iron Ore prices also tend to result in a greater likelihood of a positive Trade Balance for Australia, which is also positive of the AUD.
The Trade Balance, which is the difference between what a country earns from its exports versus what it pays for its imports, is another factor that can influence the value of the Australian Dollar. If Australia produces highly sought after exports, then its currency will gain in value purely from the surplus demand created from foreign buyers seeking to purchase its exports versus what it spends to purchase imports. Therefore, a positive net Trade Balance strengthens the AUD, with the opposite effect if the Trade Balance is negative.
- The daily chart shows a mild bullish momentum as indicated by the RSI, whereas the MACD signals a balanced market environment.
- On the hourly chart, growing selling pressure is evident.
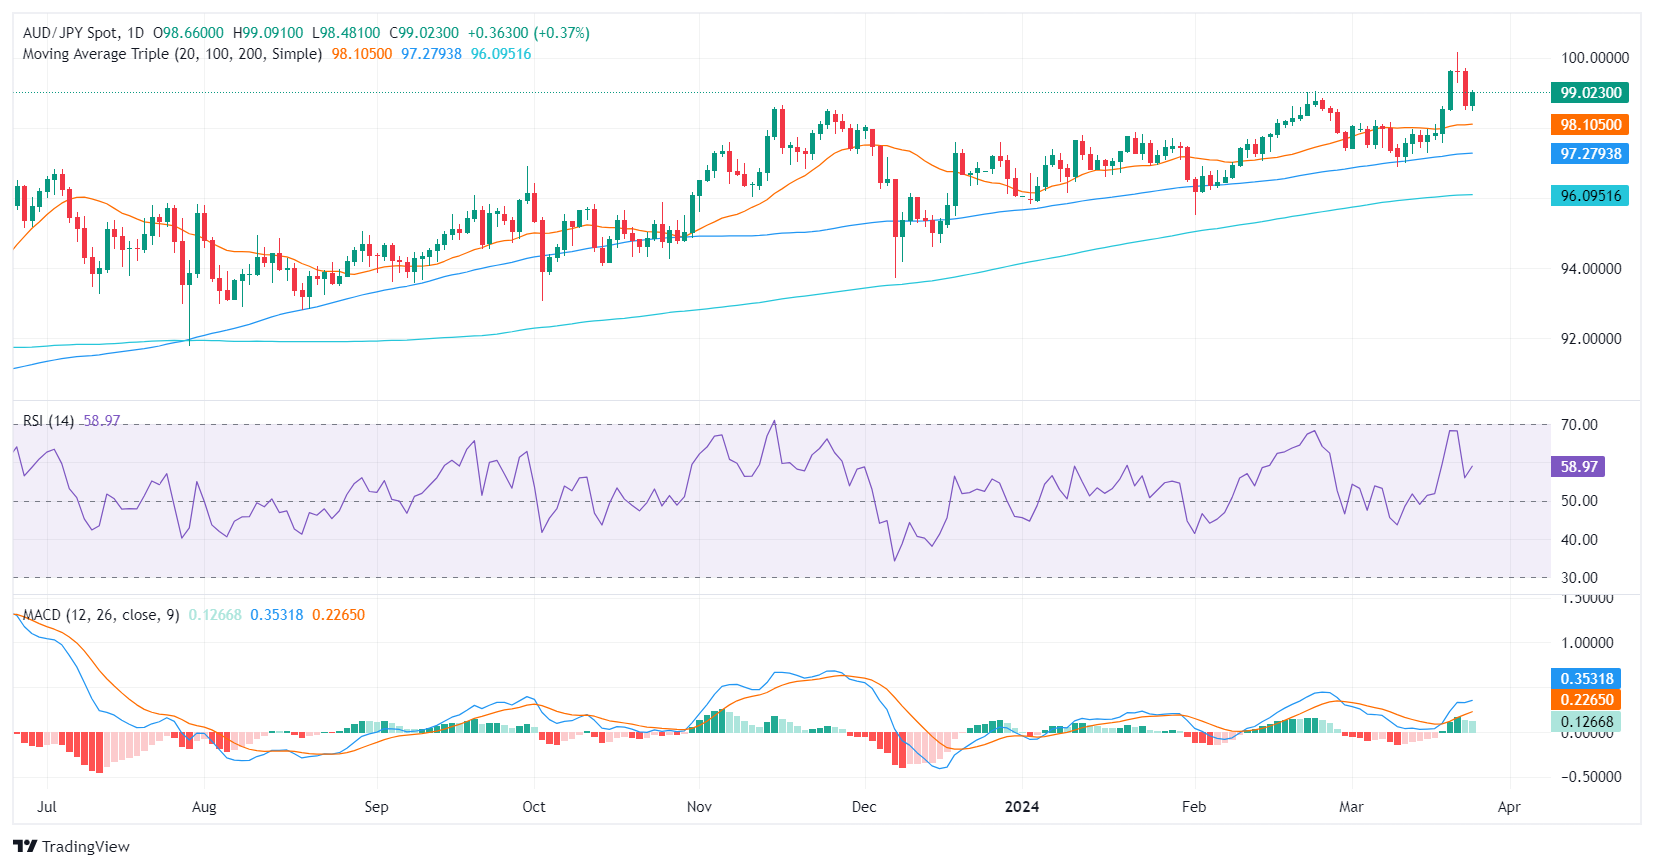
In Tuesday's session, AUD/JPY was seen declining to 98.95, marking mild losses. Despite the insignificant setback, neither buyers nor sellers have gained a distinct advantage, indicating potential market stability or a possible shift in direction. While signs of selling pressure are evident, the pair exhibits a strong stand over the 20,100 and 200-day Simple Moving Averages (SMAs), signifying long-term bullish sentiment. That being said, there are signals that the sellers are present after pushing the pair down by nearly 1% last Friday.
On the daily chart, the Relative Strength Index (RSI) stands with a neutral slope. The flattening trend and the green bars of the Moving Average Convergence Divergence (MACD) hint that the market remains largely balanced, with neither buyers nor sellers having a distinct edge on Tuesday.
AUD/JPY daily chart
Moving onto the hourly chart, the RSI trajectory appears slightly bearish, with recent readings below 50, suggesting mounting selling pressure. The rising red MACD histogram bars further confirm the existing negative momentum.
AUD/JPY hourly chart
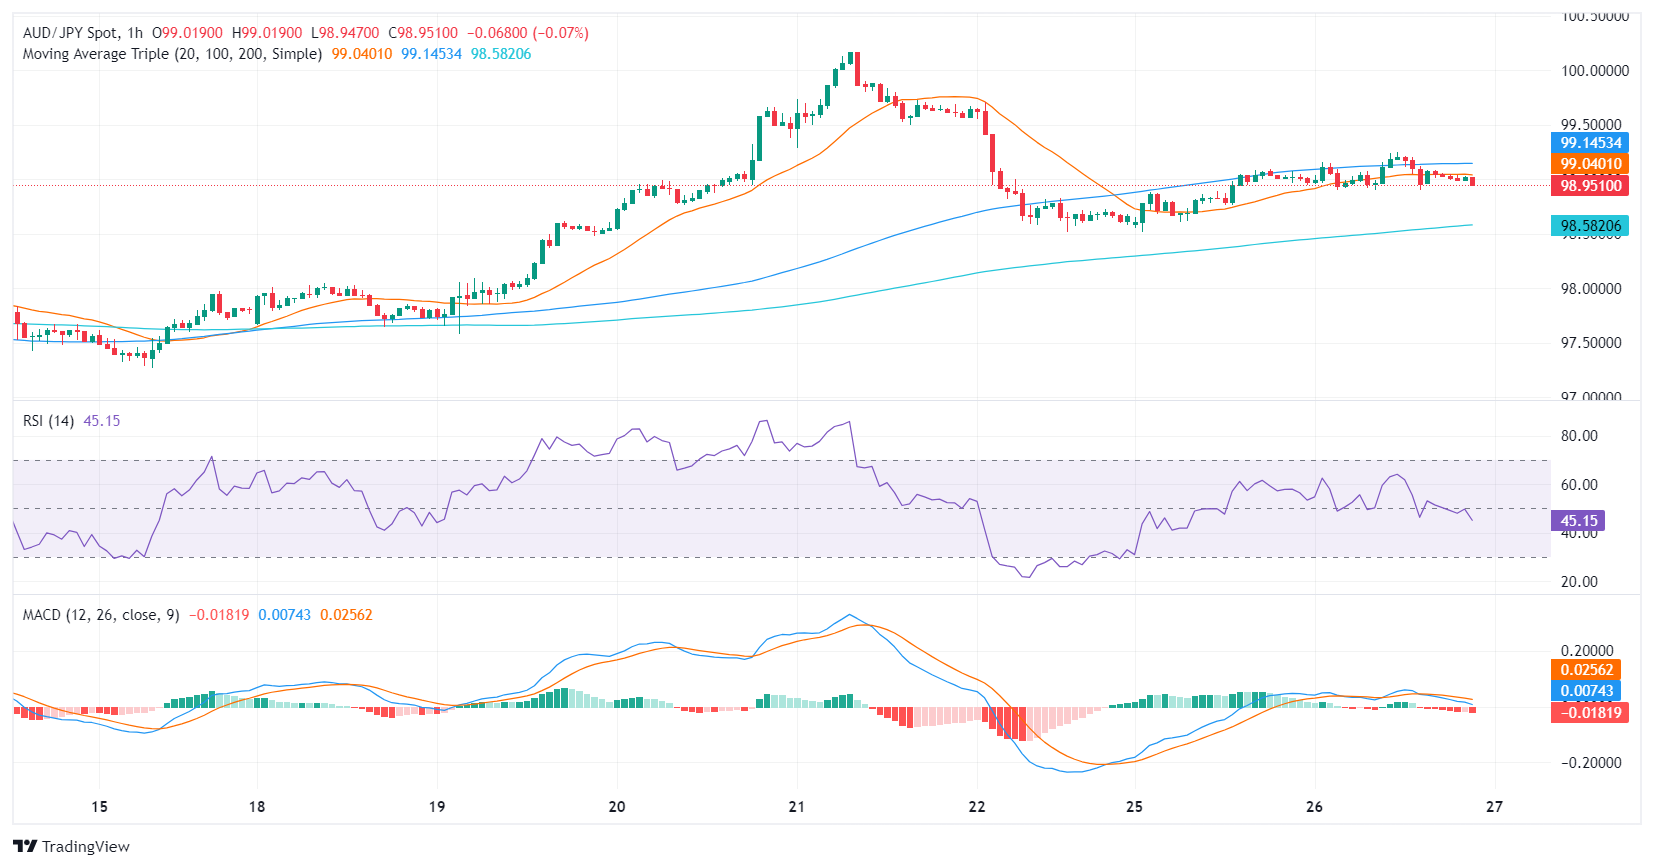
When assessing both charts, the short-term outlook seems to contrast with the daily chart's indications, which appear less bearish. It is evident that the bears are taking a breather following last week’s strong downward movements, but are still around the corner. However, the 1% dip seen on Friday, hasn’t affected yet the overall bullish trend.
- EUR/USD drops below 1.0840 due to USD strength, buoyed by durable goods data and stable consumer confidence.
- ECB rate cut hints fuel speculation amid divided Fed views on easing.
- Market eyes Eurozone indicators, US inflation data for future EUR/USD direction.
The Euro retraces against the US Dollar from weekly highs hit at 1.0864 and tumbles toward the 1.0820 region on Tuesday amidst a buoyant Greenback. At the time of writing, the EUR/USD trades at 1.0828 down 0.08%.
EUR/USD adjusts amid strong US economic data and mixed ECB and Fed signals
Economic data from the United States (US) bolstered the Greenback, which trimmed its earlier losses as depicted by the US Dollar Index (DXY). The DXY which measures a basket of the American currency against six others, climbs 0.10% at 104.32.
The US Census Bureau revealed that Durable Goods Orders for February rose 1.4% Month over Month, exceeding forecasts of 1.1% and January’s -0.9% plunge. The core Durable Goods Orders stood at 0.4% Month over Month, up from -0.3% and above the consensus of 0.4%. Elsewhere, the Conference Board (CB) revealed that Consumer Confidence was steady in March, yet it ticked down to 104.7 from 104.8, a downward revision from the previous month. The survey showed Americans blaming higher prices and soaring borrowing costs.
Following the data, the fundamentals surrounding the EUR/USD pair remained unchanged. Money market traders speculate that the Federal Reserve (Fed) and the European Central Bank (ECB) could cut interest rates in June. Meanwhile, traders are seeking cues from central banks' speeches across both sides of the Atlantic.
On Tuesday, ECB official Yannis Stoumaras commented that there is a consensus for a June rate cut. Madis Muller echoed some of his comments, indicating that the ECB is nearing the stage where it can lower rates.
On the US front, Fed officials continued to lay the groundwork for easing policy, but there’s division among the Federal Open Market Committee (FOMC) board. Atlanta Fed President Raphael Bostic noted that he expects one rate cut instead of two in 2024. Meanwhile, Fed Governor Lisa Cook said that easing policy too soon increases the risk of inflation becoming entrenched.
On the dovish spectrum, Chicago Fed President Austan Goolsbee expects three cuts, though he says he needs more evidence of inflation “coming down.”
Traders eye Eurozone data, ahead of US PCE
The Eurozone (EU) docket will feature the release of inflation data in Spain, Consumer Confidence in France, and Economic Sentiment in the whole bloc. On the US front, investors will eye the release of Gross Domestic Product (GDP) figures for the last quarter of 2023, unemployment claims,, and the Fed’s preferred gauge for inflation, the core PCE.
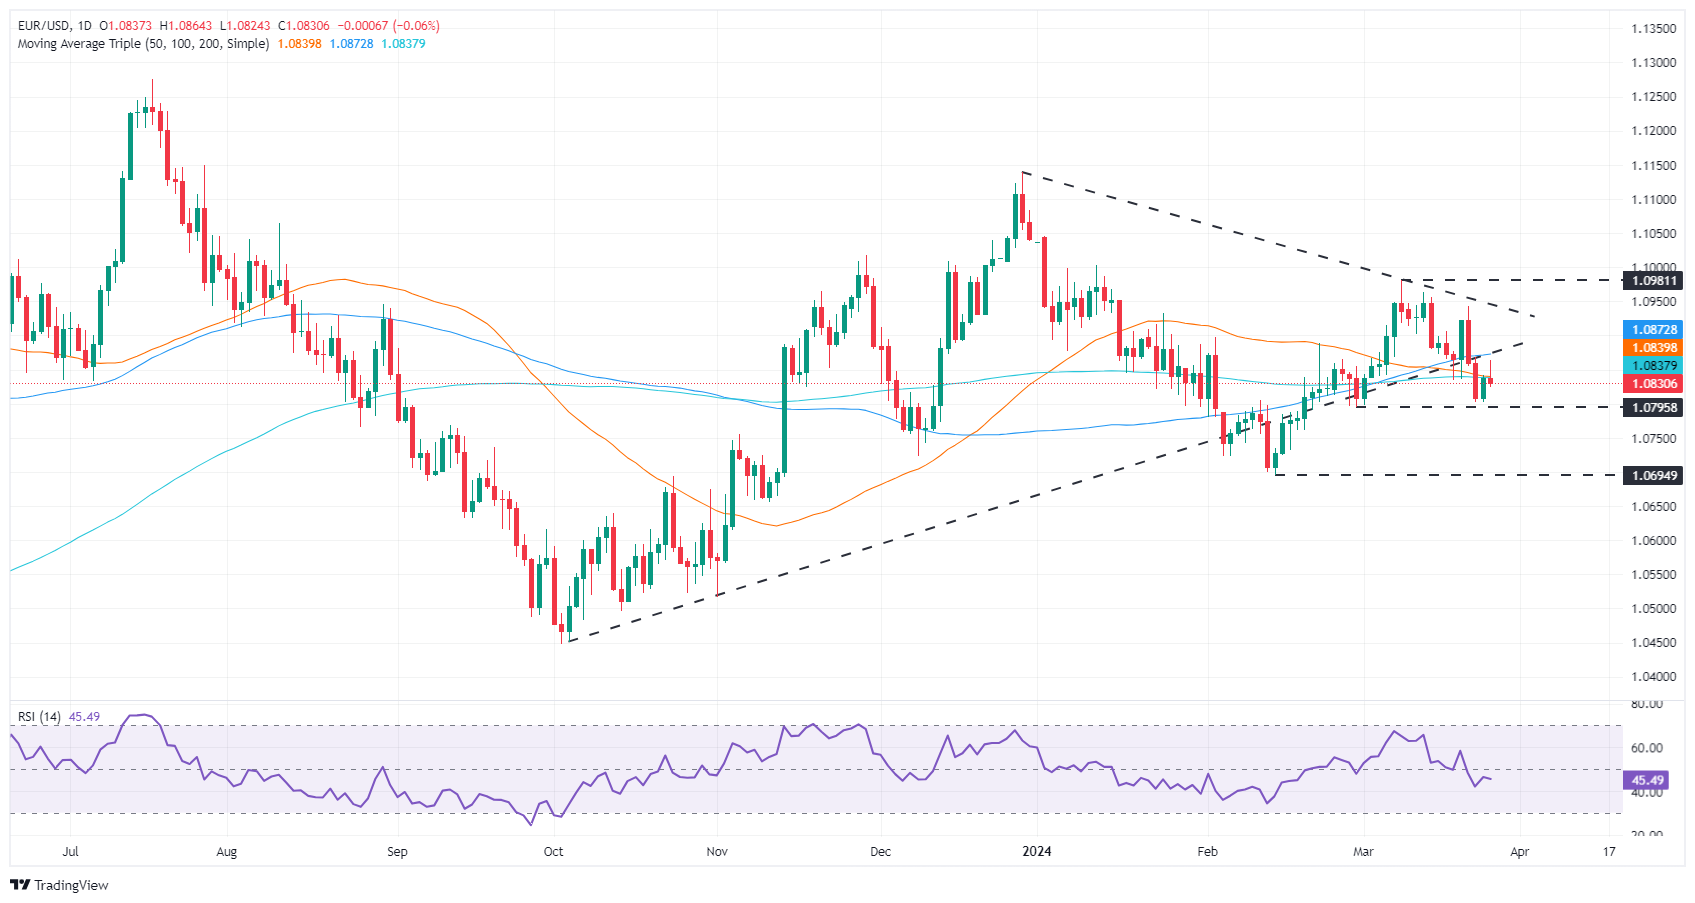
EUR/USD Price Analysis: Technical outlook
The EUR/USD was unable to achieve a decisive break of the 200-day moving average (DMA), opening the door to challenging the 1.0800 mark. With sellers regaining control, a breach of the latter will pave the way to test the February 20 low of 1.0761, followed by the February 14 swing low of 1.0694. On the other hand, if buyers reclaim the 200-DMA at 1.0837, the next resistance level would be 1.0864, ahead of 1.0900.
- The daily RSI reveals a potential increase in bearish momentum if the index remains below 50.
- Under key SMAs on the daily chart, the pair signals rising selling traction, requiring buyers to recover these significant levels.
- After the intense losses on Friday, indicators are consolidating in negative territory.
In Tuesday's session, the AUD/USD observed slight bearish momentum, declining towards 0.6535. The broader outlook reveals that the bears exhibit a somewhat stronger presence, which could maintain a certain level of pressure on the pair. Bears seem to have taken a breather after declining by nearly 0.84% last Friday, but the outlook is still tilted to the short-term downside.
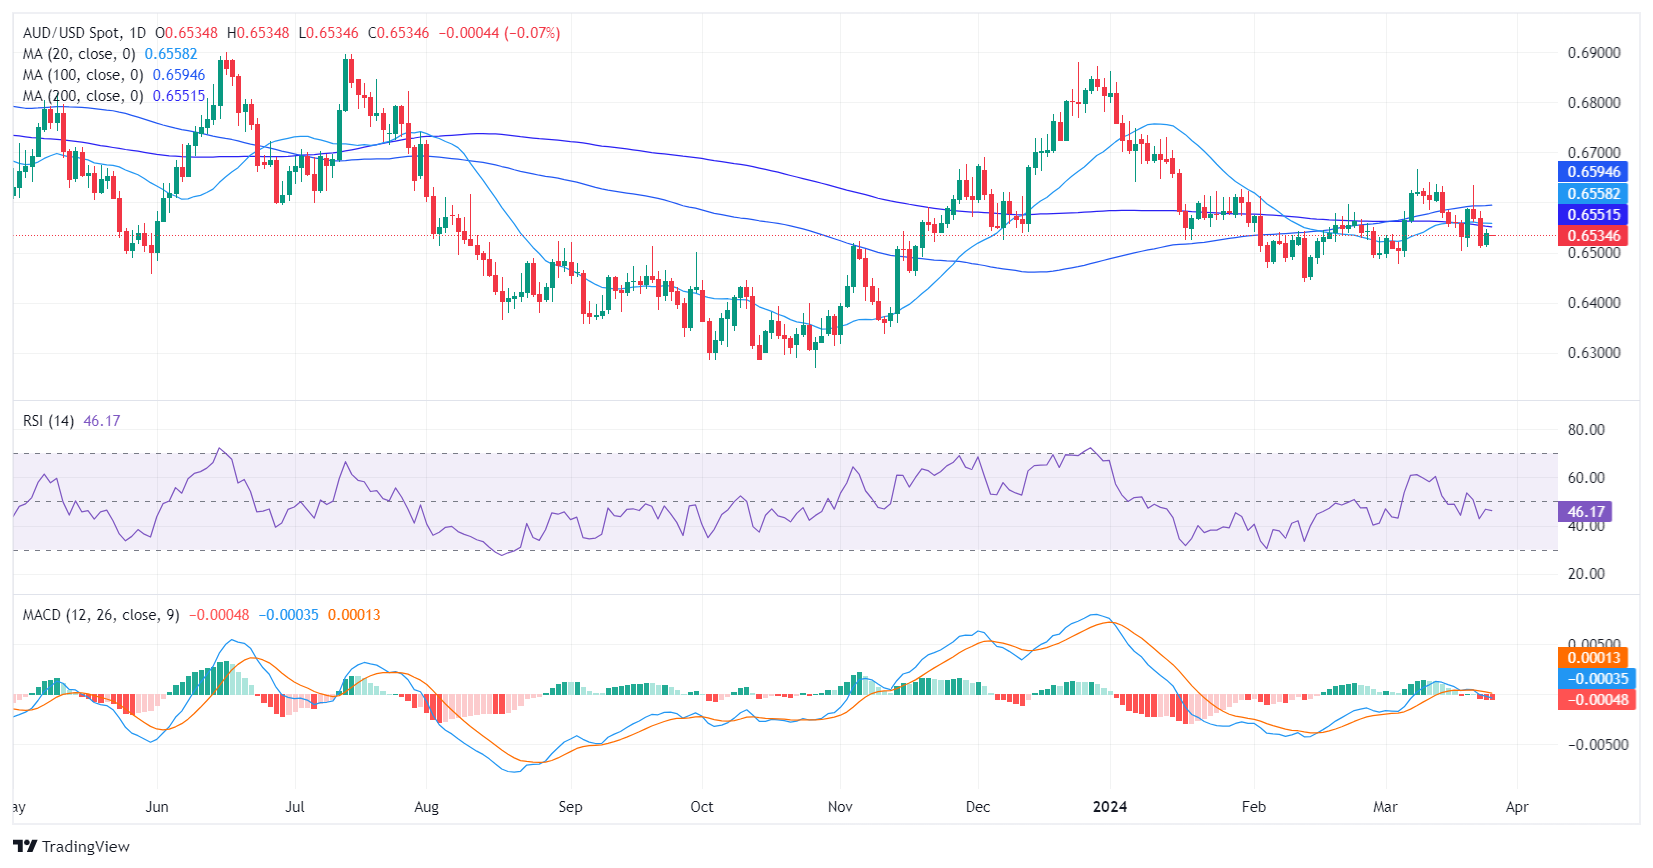
The Relative Strength Index (RSI) presents a negative landscape on the daily chart. The indicator resides in the negative territory with the latest reading just shy of 47. Although currently avoiding oversold conditions, the slight decline in the index is noticeable indicating a continuation of the bearish momentum if the RSI persists below 50. The Moving Average Convergence Divergence (MACD) lays out rising red bars which tends to suggest a mounting selling pressure.
AUD/USD daily chart
Turning the attention to an intraday perspective, the hourly chart reveals a similar trajectory but on a tighter scale. The hourly RSI has just dipped below 45, reinforcing a stronger bearish undertone into the most recent session. The MACD histogram further supports this outlook, with its red bars indicating the presence of negative momentum.
AUD/USD hourly chart
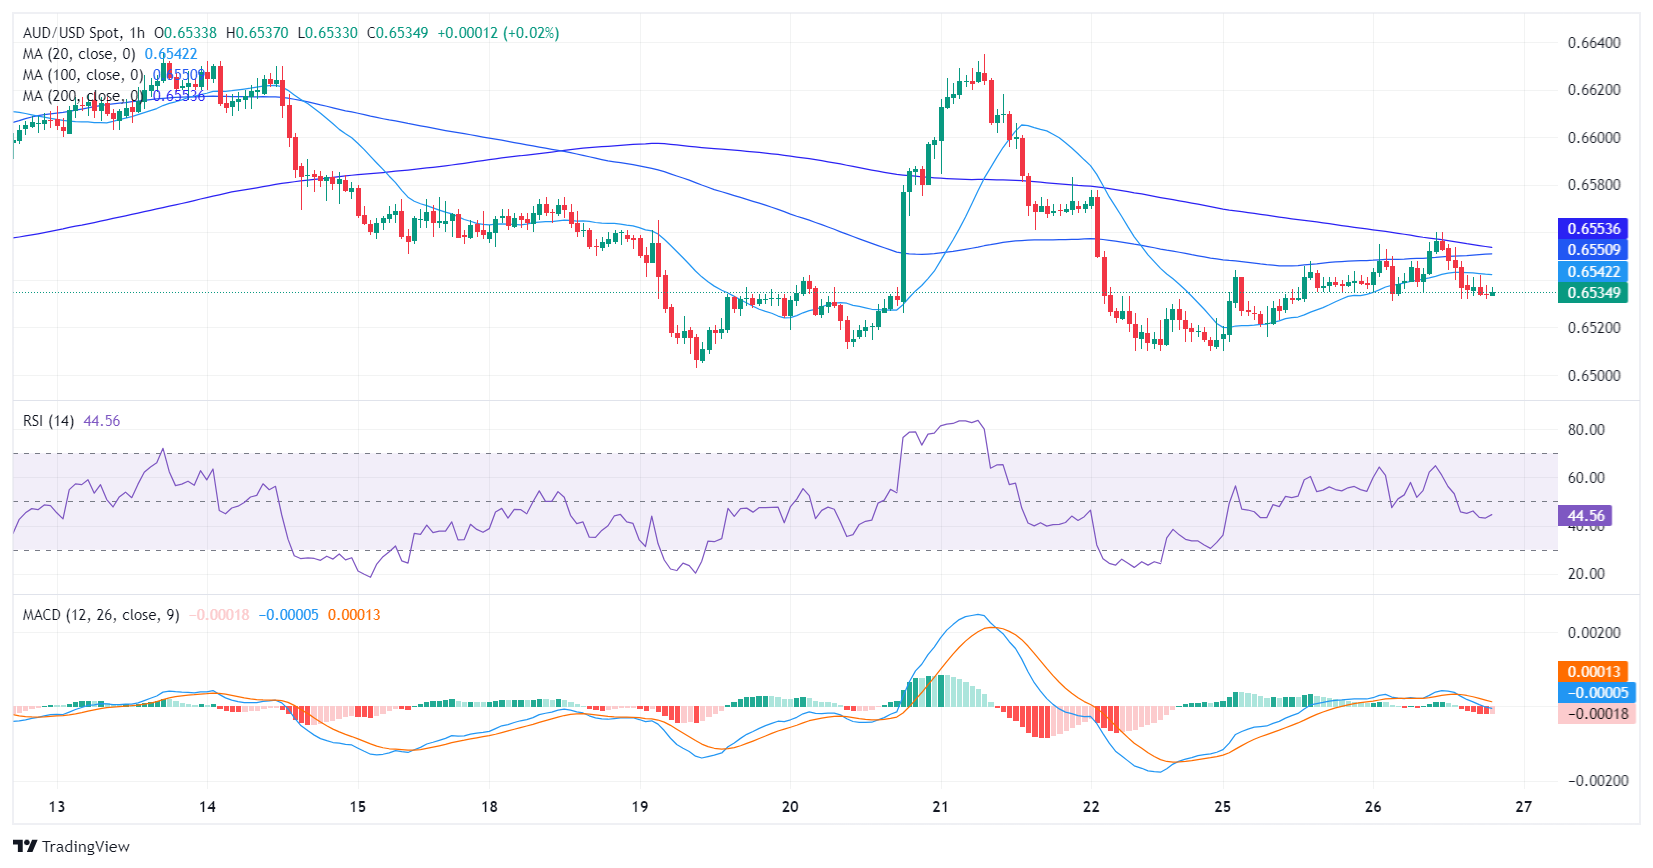
Surveying the larger context, the pair is below the 20, 100, and 200-day Simple Moving Averages (SMAs) which is a typical signal that the sellers are in control following last Friday’s losses. Overall, indicators seem to have consolidated in negative territory and might continue sideways trading while markets await fresh drivers. In the meantime, bears hold in command.
The FX galaxy traded amidst a generalized lack of conviction and direction, leaving the Greenback slightly bid and the risk-related assets mildly on the defensive as investors gradually shifted their focus to the upcoming US PCE release as well as the Easter holidays.
Here is what you need to know on Wednesday, March 27:
The US Dollar partially reversed Monday’s negative session and reclaimed the 104.30 region when measured by the USD Index (DXY). On March 27, MBA will release its usual Mortgage Applications report, while FOMC C. Waller is also due to speak.
EUR/USD navigated a tight range and ended the session barely changing around 1.0830. The final Consumer Sentiment in the broader euro bloc by the European Commission, along with the Economic Sentiment and Industrial Sentiment, are all expected on March 27.
In line with its risky peers, GBP/USD hovered around Monday’s closing levels near 1.2630 in response to the generalized absence of volatility. Next of note in the UK docket will be the GDP figures on March 28.
USD/JPY extended its so-far multi-session consolidative range, always below the key 152.00 barrier, amidst rising concerns over potential FX intervention. The BoJ Summary of Opinions and the weekly Foreign Bond Investment figures are due on March 28.
The lack of a clear direction left AUD/USD hovering around the 0.6540 zone and near the key 200-day SMA. On March 27, the Westpac Leading Index is due.
Prices of WTI gave away part of Monday’s advance as traders kept assessing the geopolitical landscape as well as the upcoming OPEC+ online meeting.
The small gains in the greenback did not prevent Gold prices from adding to Monday’s advance and approaching their all-time high around the $2,200 zone per troy ounce. Silver prices, on the other hand, extended their corrective leg lower and flirted with multi-day lows near $24.50 per ounce.
- Gold rises amid US Dollar fluctuations and lower US Treasury yields.
- DXY's slight increase contests Gold's ascent, but bond rates boost it.
- Mixed US data: High Durable Goods Orders, lower Consumer Confidence sway sentiment.
Gold price trades in the green but is off the day's highs of $2,200 reached during the overnight session for North American traders amid a weaker US Dollar. At the opening of Wall Street, the Greenback extended its recovery while a fall in US Treasury yields maintained the yellow metal in the green. At the time of writing, XAU/USD trades at $2,177, up 0.31%.
The US Dollar Index (DXY), which measures the Greenback’s performance against the other six currencies, trades flat at 104.30, a headwind for the non-yielding metal. Nevertheless, the US 10-year benchmark note rate edged down one basis point to 4.243%, boosting the precious metal.
The US economic docket showed that Durable Goods Orders rose to their highest level since 2022. In the meantime, the Conference Board suggested that Consumer Confidence declined further in March, reaching its lowest level in four months.
Daily digest market movers: Gold advances amidst strong Durable Goods Orders
- US Durable Goods Orders for February rose by 1.4% MoM, exceeding estimates of 1.1% and January’s -0.9% plunge. The core Durable Goods Orders stood at 0.4% MoM, up from -0.3% and above the consensus of 0.4%.
- The Conference Board (CB) revealed Americans' confidence was steady in March, yet it ticked down to 104.7 from 104.8, a downward revision from the previous month. This was blamed on higher prices and soaring borrowing costs.
- Federal Reserve officials remain set to cut rates, but there’s division among the Federal Open Market Committee (FOMC) board. Atlanta Fed President Raphael Bostic noted that he expects one rate cut instead of two in 2024. Meanwhile, Fed Governor Lisa Cook echoed Bostic’s comments and added that easing policy too soon increases the risk of inflation becoming entrenched.
- Chicago Fed President Austan Goolsbee remains dovish, expecting three cuts, though he said he needs more evidence of inflation “coming down.”
- Money market traders predict a 70% chance that the Federal Reserve would slash rates by a quarter of a percentage point, setting the federal funds rate (FFR) at 5.00% - 5.25%.
- Gold traders are awaiting the release of the Federal Reserve’s preferred gauge for inflation, the Core Personal Consumption Expenditure (PCE) Price Index. The index is estimated to grow 2.8% YoY in February, with monthly figures expected to slow from 0.4% to 0.3% MoM.
Technical analysis: Gold price stays above $2,170 amid strong US Dollar
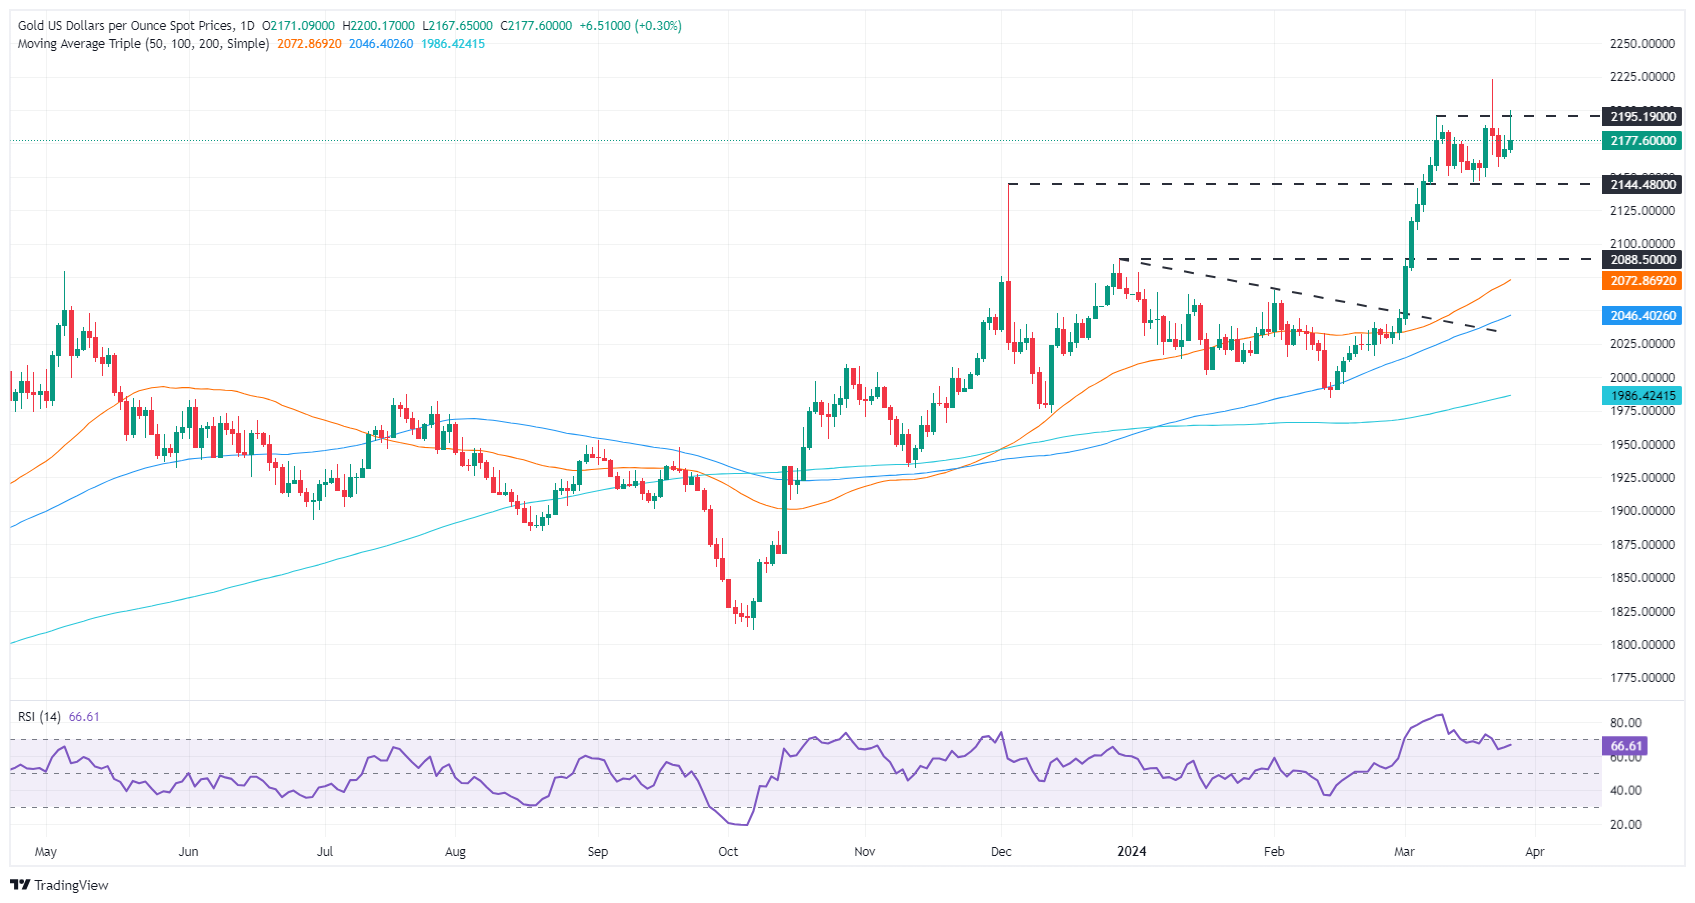
Gold price dips toward $2,167, spurring a leg up toward the $2,170 area at around the same time the Relative Strength Index (RSI) made a U-turn and aimed upwards. Nevertheless, buyers must reclaim the $2,200 figure to keep the uptrend unchanged. That will pave the way for re-testing the all-time high of $2,223.
On the flip side, if sellers push prices below the December 4 high, which turned support at $2,146, that could exacerbate a sell-off and send XAU/USD prices diving toward $2,100. The next support would be the December 28 high, which is $2,088.
Gold FAQs
Gold has played a key role in human’s history as it has been widely used as a store of value and medium of exchange. Currently, apart from its shine and usage for jewelry, the precious metal is widely seen as a safe-haven asset, meaning that it is considered a good investment during turbulent times. Gold is also widely seen as a hedge against inflation and against depreciating currencies as it doesn’t rely on any specific issuer or government.
Central banks are the biggest Gold holders. In their aim to support their currencies in turbulent times, central banks tend to diversify their reserves and buy Gold to improve the perceived strength of the economy and the currency. High Gold reserves can be a source of trust for a country’s solvency. Central banks added 1,136 tonnes of Gold worth around $70 billion to their reserves in 2022, according to data from the World Gold Council. This is the highest yearly purchase since records began. Central banks from emerging economies such as China, India and Turkey are quickly increasing their Gold reserves.
Gold has an inverse correlation with the US Dollar and US Treasuries, which are both major reserve and safe-haven assets. When the Dollar depreciates, Gold tends to rise, enabling investors and central banks to diversify their assets in turbulent times. Gold is also inversely correlated with risk assets. A rally in the stock market tends to weaken Gold price, while sell-offs in riskier markets tend to favor the precious metal.
The price can move due to a wide range of factors. Geopolitical instability or fears of a deep recession can quickly make Gold price escalate due to its safe-haven status. As a yield-less asset, Gold tends to rise with lower interest rates, while higher cost of money usually weighs down on the yellow metal. Still, most moves depend on how the US Dollar (USD) behaves as the asset is priced in dollars (XAU/USD). A strong Dollar tends to keep the price of Gold controlled, whereas a weaker Dollar is likely to push Gold prices up.
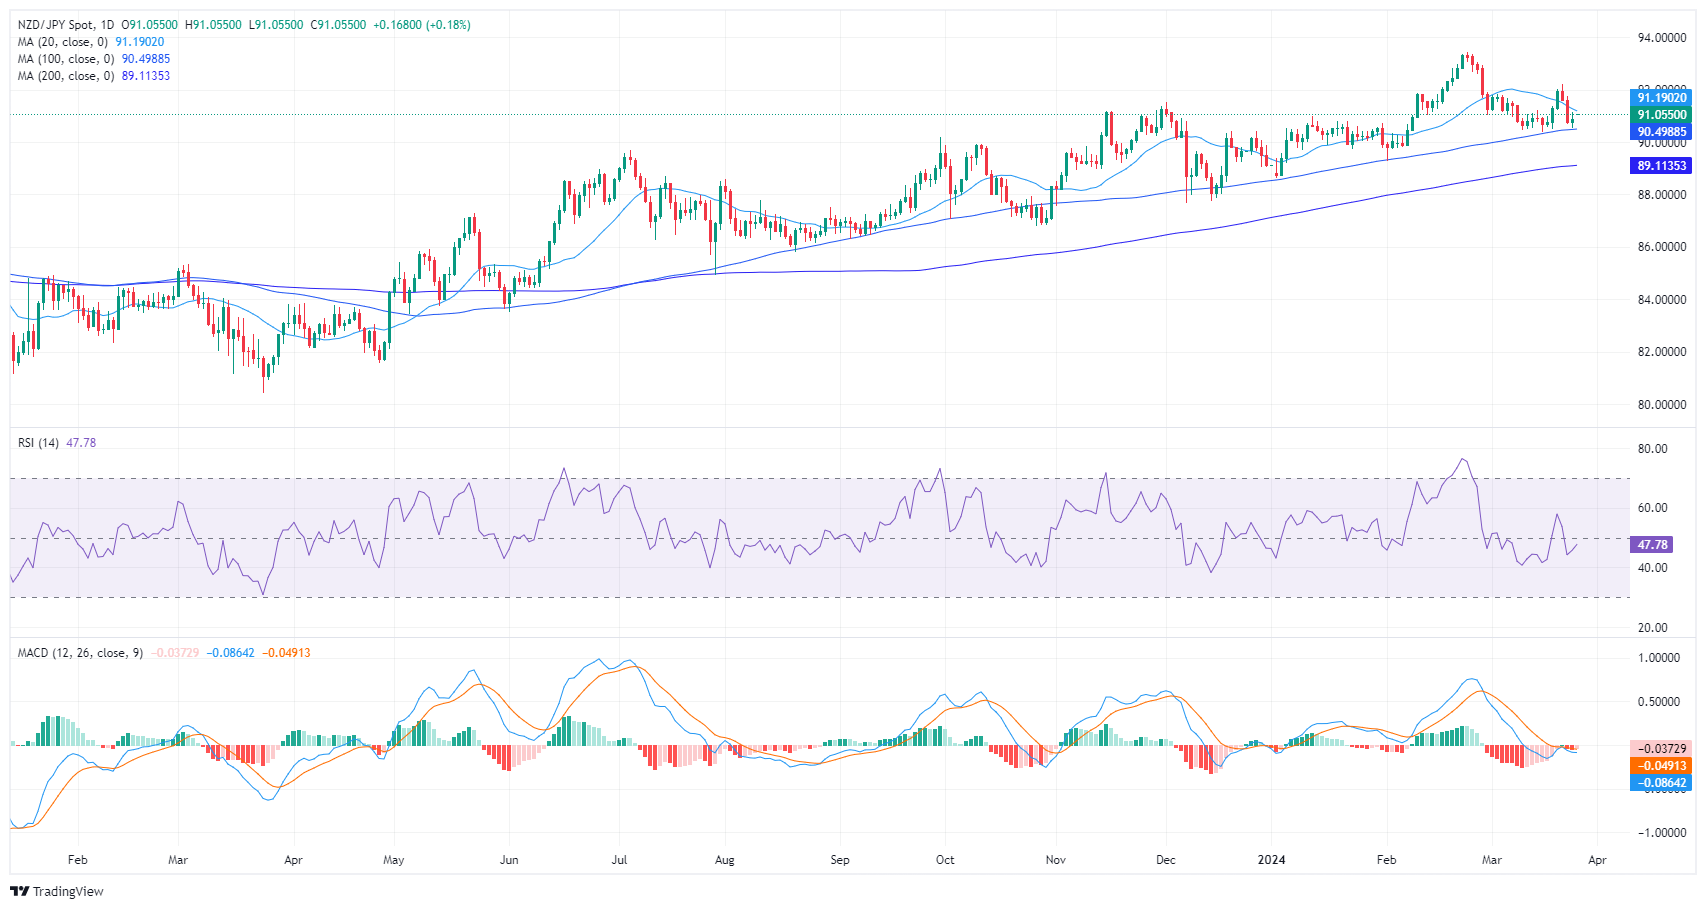
- The daily technical analysis reveals a steady bearish momentum but with indicators recovering.
- The hourly chart hints at initial signs of bullish momentum with the RSI in the positive territory.
- Despite the bearish short-term indicators, the pair is trading above the main SMAs, indicating a persisting bullish sentiment in the larger trend.
During Tuesday's session, the NZD/JPY pair rose to the 91.05 level, showing a slight gain of 0.15%. Currently, the market is primarily under the seller's control, resulting in a short-term bearish outlook. Nonetheless, the broader outlook remains bullish, signifying the potential for buyers to regain control in the next sessions.
On the daily chart, the NZD/JPY pair has been demonstrating a bearish momentum, as suggested by the Relative Strength Index (RSI) readings. The RSI, which was in the positive territory last week, plunged into the negative zone, marking a progressive decline with an upswing printed in Tuesday's session.
NZD/JPY daily chart
Moving on to the hourly chart, the RSI paints a slightly different picture with the pair showing early signs of bullish momentum. The RSI oscillates between negative and positive territories, with more recent readings soaring into the positive area. This suggests that in the short term, buyers might be gaining control. However, the presence of rising red bars on the Moving Average Convergence Divergence (MACD) histogram suggests that the bears are still present and that the bears are around the corner.
NZD/JPY hourly chart
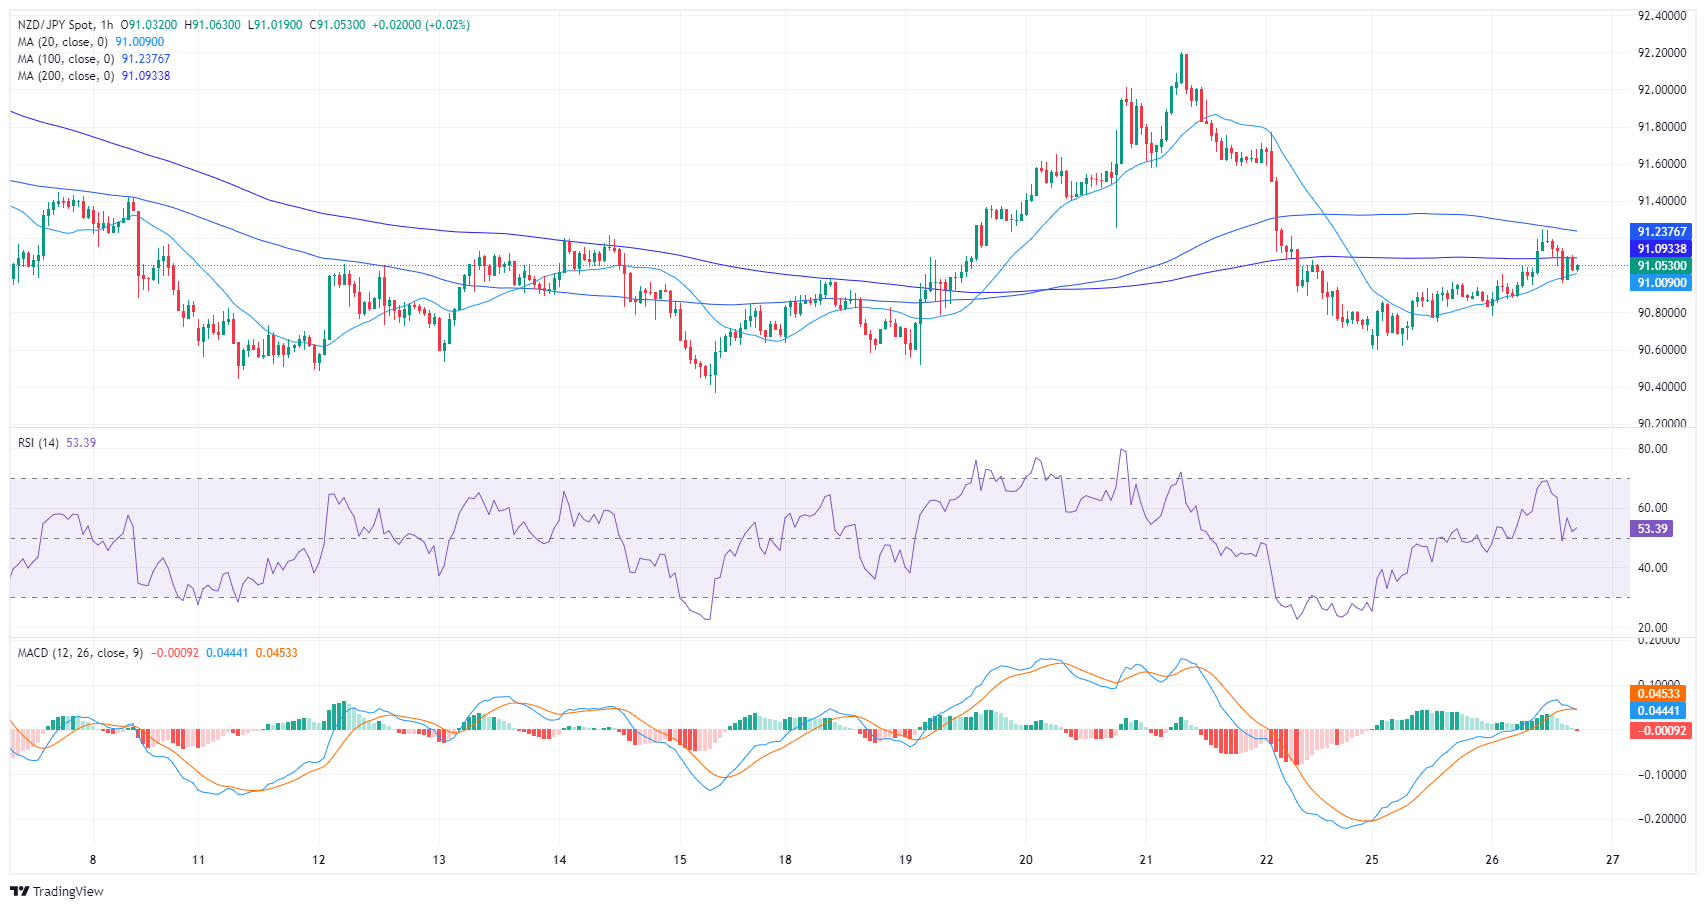
Despite bears currently holding ground as evidenced by the pair trading below the 20-day Simple Moving Average (SMA), the overall trend remains with bulls. This is proven by the fact that the pair is trading above the 100- and 200-day SMAs indicating a strong bullish momentum in broader timelines. That being said, the buyers shouldn't relax and continue targeting the 20-day SMA to continue climbing higher.
- Dow Jones ticks up Tuesday in a calm pre-Easter trading session.
- Market sentiment is moderately positive, buoyed by hopes that the Fed will start cutting rates in June.
- Trading volume remains at low levels with investors awaiting Friday’s PCE Prices Index data.
The Dow Jones Industrial Average (DJIA) shows a mild advance on Tuesday’s early trading. Wall Street has opened the session in green, with mega-cap growth stocks leading gains.
The index, however, remains far from the historic highs reached on Thursday. The dovishly-tilted monetary policy statement by the Federal Reserve boosted investors’ confidence that the Fed will start rolling back its restrictive policy in June, pushing global equity markets higher.
The US calendar is light this week, and investors are focusing on Friday’s US Personal Consumption Expenditures Prices Index data for further clues about the Fed’s monetary policy outlook.
Dow Jones news
The Dow Jones Industrial Average is 0.2% higher on Tuesday’s morning trading. Wall Street has opened the session with marginal gains, retracing Monday’s losses in an Easter-shortened week.
Down to sectors, Consumer Discretionary and Communication Services are leading gains, while Energy and Utilities are the worst performers.
United Health Group (UNH) is leading gains on Tuesday with a 1.3% advance, followed by Honeywell International (HON), up 1.1%, and Goldman Sachs (GS) with a 1.0% advance. On the downside, 3M (MMM) is the worst performer, losing 1.5%, followed by Boeing (BA), 1.2% down, on the back of news that CEO Jeremy Calhoun is leaving the company.
Dow Jones technical outlook
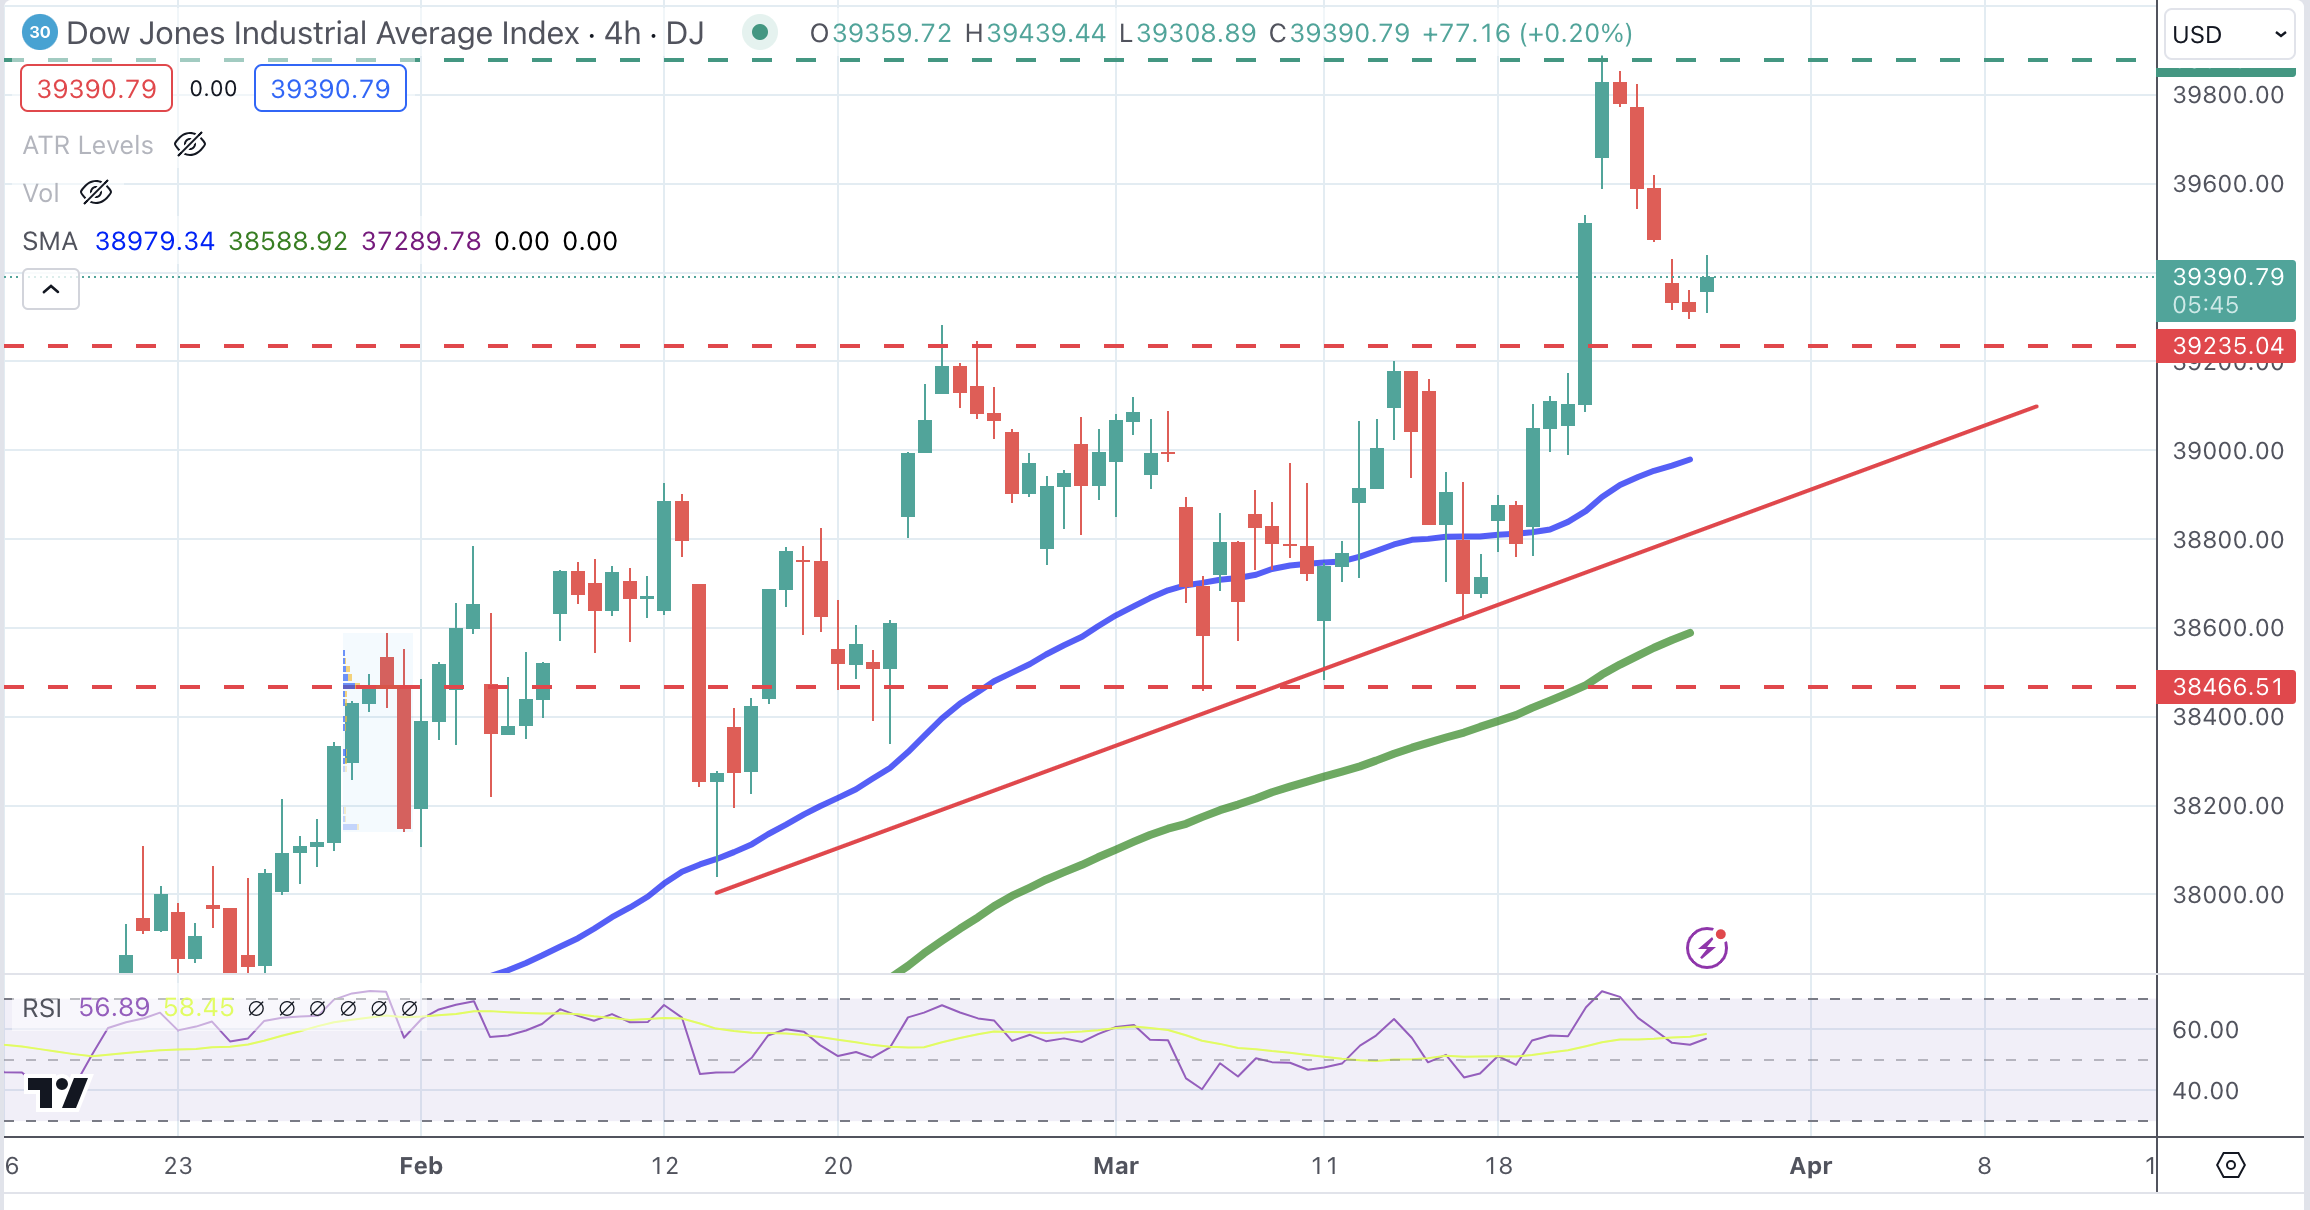
The broader bias for the Dow Jones Index remains bullish despite the recent reversal from all-time highs. Bears have been contained above previous highs, at the 39,260 area, which leaves the trend of higher highs and higher lows intact so far.
Sellers should breach that level to increase bearish momentum and open the path toward 39,000 and 38,650. On the upside, resistances are at the 39,900 previous high and the 40,000 psychological level.
Dow Jones Industrial Average 4-Hour Chart
Dow Jones FAQs
The Dow Jones Industrial Average, one of the oldest stock market indices in the world, is compiled of the 30 most traded stocks in the US. The index is price-weighted rather than weighted by capitalization. It is calculated by summing the prices of the constituent stocks and dividing them by a factor, currently 0.152. The index was founded by Charles Dow, who also founded the Wall Street Journal. In later years it has been criticized for not being broadly representative enough because it only tracks 30 conglomerates, unlike broader indices such as the S&P 500.
Many different factors drive the Dow Jones Industrial Average (DJIA). The aggregate performance of the component companies revealed in quarterly company earnings reports is the main one. US and global macroeconomic data also contributes as it impacts on investor sentiment. The level of interest rates, set by the Federal Reserve (Fed), also influences the DJIA as it affects the cost of credit, on which many corporations are heavily reliant. Therefore, inflation can be a major driver as well as other metrics which impact the Fed decisions.
Dow Theory is a method for identifying the primary trend of the stock market developed by Charles Dow. A key step is to compare the direction of the Dow Jones Industrial Average (DJIA) and the Dow Jones Transportation Average (DJTA) and only follow trends where both are moving in the same direction. Volume is a confirmatory criteria. The theory uses elements of peak and trough analysis. Dow’s theory posits three trend phases: accumulation, when smart money starts buying or selling; public participation, when the wider public joins in; and distribution, when the smart money exits.
There are a number of ways to trade the DJIA. One is to use ETFs which allow investors to trade the DJIA as a single security, rather than having to buy shares in all 30 constituent companies. A leading example is the SPDR Dow Jones Industrial Average ETF (DIA). DJIA futures contracts enable traders to speculate on the future value of the index and Options provide the right, but not the obligation, to buy or sell the index at a predetermined price in the future. Mutual funds enable investors to buy a share of a diversified portfolio of DJIA stocks thus providing exposure to the overall index.
- EUR/JPY near 164.00, undecided post-Tenkan-sen rebound.
- Buyers claiming 164.82 and the pair may aim for 165.00.
- Falling below 164.00 could lead to 163.21, then 162.78 Kijun-Sen.
The EUR/JPY is virtually unchanged during the North American session, after hitting a two day high of 164.40, though sellers dragged the exchange rate near the Tuesday open. Hence, the cross pair trades at 164.09, almost flat.
EUR/JPY Price Analysis: Technical outlook
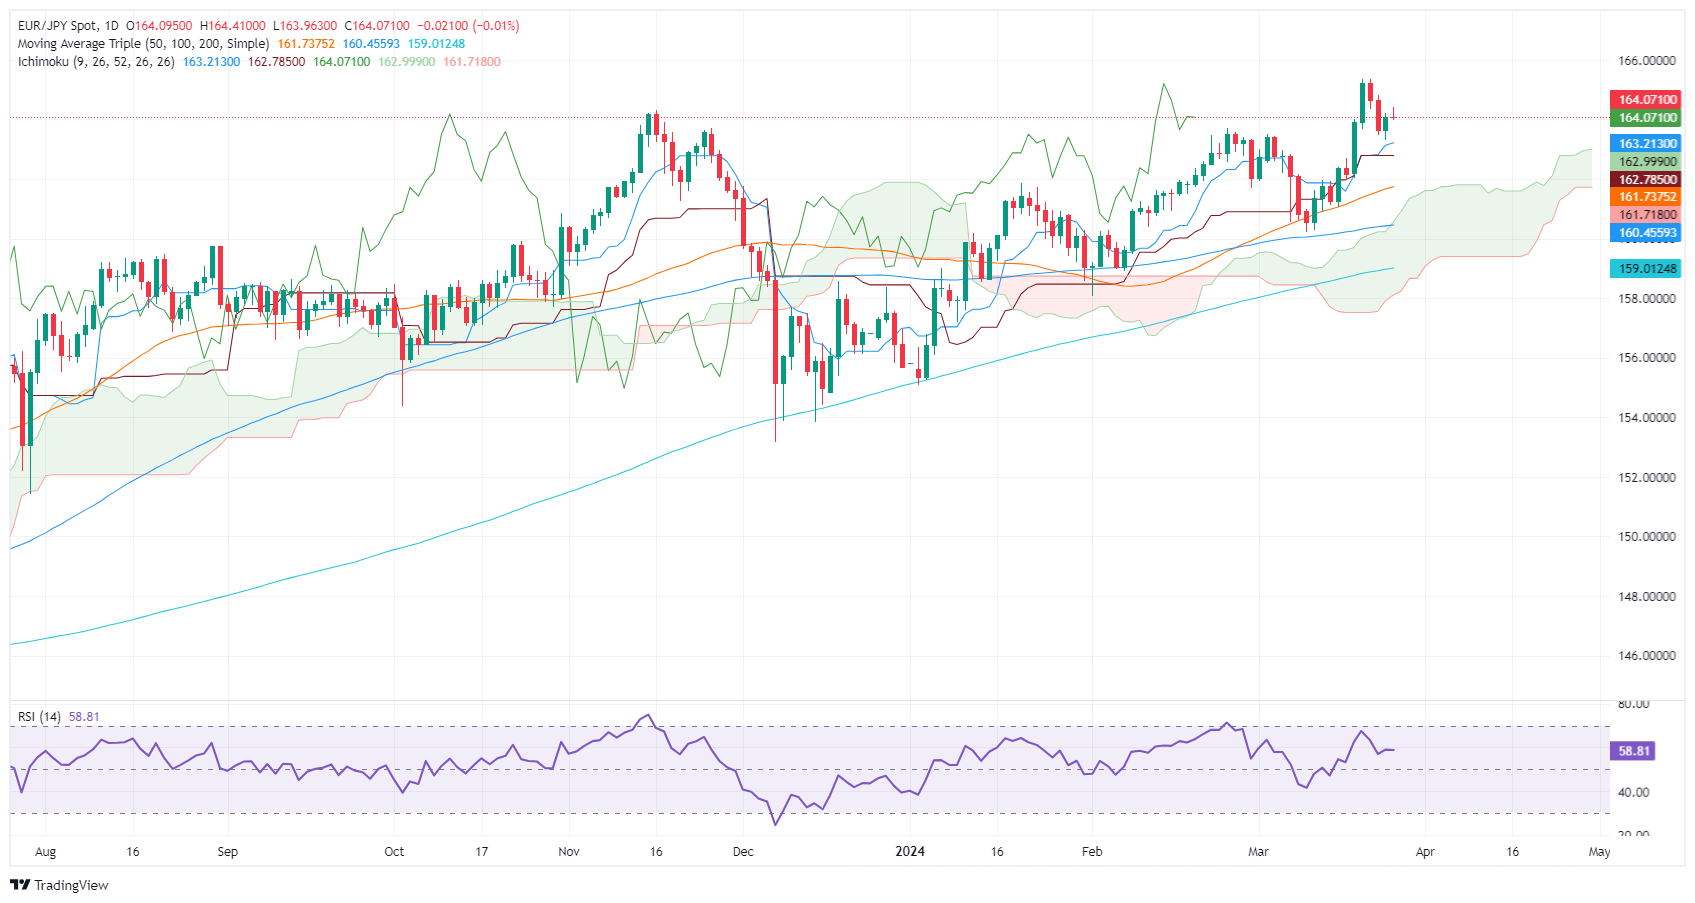
After falling from the year-to-date (YTD) high of 165.33, the EUR/JPY found support at around the Tenkan-sen level at 163.12 on Monday, sponsoring a leg-up toward the 164.00 area. Further upside is seen if traders clear the March 22 high of 164.82, ahead of the 165.00 figure.
On the flip side, if the pair extends its losses below 16400, look for a fall to the Tenkan-Sen at 163.21, followed by the 163.00 mark. A breach of the latter will exacerbate a dip to the Kijun-Sen at 162.78.
EUR/JPY Price Action – Daily Chart
- Durable Goods orders from February came in better than expected.
- Housing data showed some signs of weakness.
- PCE figures from February to be released on Friday will be the week’s highlight.
The US Dollar Index (DXY) is hovering around 104.20, trading with mild gains against its rivals on Tuesday. After Durable Goods and Housing market data, the USD remains stable as markets await fresh drivers to continue placing their bets on the next Federal Reserve (Fed) decisions.
The US economy is on a delicate path with inflation remaining sticky and economic activity showing some weakness. Jerome Powell confirmed the bank's persistence in not overreacting to hot inflation figures from the start of the year while the bank didn't change its interest rate projections from 2024. The start of easing is still seen starting in June, but incoming data will continue dictating the timing.
Daily digest market movers: DXY mildly up ahead of PCE figures, markets digest mid-tier reports
- The economic report by S&P Dow Jones Indices showed that the S&P/Case-Shiller Home Price fell by 6.6% on a yearly basis in January, slightly lower than expected.
- The House Price Index reported by the Federal Housing Finance Agency (FHFA) in January saw a slight dip of 0.1% in the same month.
- The US Census Bureau reported that Durable Goods Orders increased by 1.4% MoM in February, outperforming the consensus of 1.1% and showing a significant improvement from the previous drop of 6.9%.
- The headline Personal Consumption Expenditures (PCE) is expected to have risen by 2.5% YoY, while the core measure is seen coming in at 2.8%. The outcome of the Fed’s preferred gauge of inflation will dictate the pace of the USD for the short term.
DXY technical analysis: DXY bullish momentum softens, outlook still bright
On the daily chart, the Relative Strength Index (RSI) paints a picture of flat momentum, suggesting a tie between buying and selling pressure. Simultaneously, the Moving Average Convergence Divergence (MACD) offers a flat trajectory with green bars, indicating a stagnation in buying power, which might be a sign of bulls taking a breather.
Despite the short-term sluggishness, the scene over a wider time horizon appears encouraging. The DXY is well-positioned above the 20, 100, and 200-day Simple Moving Averages (SMAs), a strong sign of the bulls' sizable control and an overall bullish tendency.
To add more context, the market is coming off a successful 1% winning week, which could explain the current pause in upward momentum. Traders could use this breather to re-assess the market and potentially find new entries for a continued bull trend.
US Dollar FAQs
What is the US Dollar?
The US Dollar (USD) is the official currency of the United States of America, and the ‘de facto’ currency of a significant number of other countries where it is found in circulation alongside local notes. It is the most heavily traded currency in the world, accounting for over 88% of all global foreign exchange turnover, or an average of $6.6 trillion in transactions per day, according to data from 2022.
Following the second world war, the USD took over from the British Pound as the world’s reserve currency. For most of its history, the US Dollar was backed by Gold, until the Bretton Woods Agreement in 1971 when the Gold Standard went away.
How do the decisions of the Federal Reserve impact the US Dollar?
The most important single factor impacting on the value of the US Dollar is monetary policy, which is shaped by the Federal Reserve (Fed). The Fed has two mandates: to achieve price stability (control inflation) and foster full employment. Its primary tool to achieve these two goals is by adjusting interest rates.
When prices are rising too quickly and inflation is above the Fed’s 2% target, the Fed will raise rates, which helps the USD value. When inflation falls below 2% or the Unemployment Rate is too high, the Fed may lower interest rates, which weighs on the Greenback.
What is Quantitative Easing and how does it influence the US Dollar?
In extreme situations, the Federal Reserve can also print more Dollars and enact quantitative easing (QE). QE is the process by which the Fed substantially increases the flow of credit in a stuck financial system.
It is a non-standard policy measure used when credit has dried up because banks will not lend to each other (out of the fear of counterparty default). It is a last resort when simply lowering interest rates is unlikely to achieve the necessary result. It was the Fed’s weapon of choice to combat the credit crunch that occurred during the Great Financial Crisis in 2008. It involves the Fed printing more Dollars and using them to buy US government bonds predominantly from financial institutions. QE usually leads to a weaker US Dollar.
What is Quantitative Tightening and how does it influence the US Dollar?
Quantitative tightening (QT) is the reverse process whereby the Federal Reserve stops buying bonds from financial institutions and does not reinvest the principal from the bonds it holds maturing in new purchases. It is usually positive for the US Dollar.
- Canadian Dollar is going through a moderate recovery with investors confident that the Fed will start easing in June.
- The mixed US macroeconomic data seen on Tuesday has failed to provide a significant boost to the US Dollar.
- The broader USD/CAD trend remains positive while above the 1.3460 support area.
The Canadian Dollar (CAD) is showing a moderately positive tone on Tuesday, as the US Dollar keeps paring last week’s gains. A mild appetite for risk is dominating the market in a calm pre-Easter week. The echoes of the dovish monetary policy statement by the Federal Reserve last week are keeping US Dollar bulls in check with all eyes on Friday’s US Personal Consumption Expenditures (PCE) Prices Index data.
The US calendar has shown mixed readings on Tuesday. US Durable Goods orders increased beyond expectations in February, while the unexpected contraction of the Conference Board’s Consumer Confidence Index has offset investors’ optimism.
These figures come after Fed speakers revealed the whole range of opinions regarding the bank’s monetary policy outlook. Chicago Fed President Goldsbee signaled three rate cuts, with a more hawkish Raphael Bostic hinting toward only one cut in 2024 and Fed Governor Lisa Cook defending a cautious approach.
Daily digest market movers: CAD extends recovery with US Dollar on defensive
- The Canadian Dollar keeps trading higher on Tuesday, while the US Dollar loses ground.US Durable Goods orders increased at a 1.4% pace, beating expectations of a 1% increment.
- Non-defense capital goods orders, a gauge for future business spending, increased 0.7% after a 0.4% decline in January.
- The CB Consumer Confidence Index has dropped to 104.7 from 106.7 in February, against market expectations of an improvement to 107.00.
- Futures markets keep betting on a nearly 65% chance that the Federal Reserve will start cutting rates in June, which is keeping the USD on its back foot.
- The highlight of the week will be the US PCE Prices Index, the Fed’s inflation gauge of choice, which is expected to have accelerated at a 2.5% yearly pace in February, from 2.4% in the previous month.
- The Core PCE Prices Index is expected to have risen at a 2.8% yearly pace and 0.4% on the monthly rate in February, from 2.8% and 0.3%, respectively, in January.
US Dollar price today
The table below shows the percentage change of US Dollar (USD) against listed major currencies today.
US Dollar price this week
The table below shows the percentage change of US Dollar (USD) against listed major currencies this week. US Dollar was the strongest against the Swiss Franc.
| USD | EUR | GBP | CAD | AUD | JPY | NZD | CHF | |
| USD | -0.16% | -0.20% | -0.27% | -0.30% | 0.15% | -0.32% | 0.67% | |
| EUR | 0.18% | -0.03% | -0.09% | -0.11% | 0.31% | -0.10% | 0.84% | |
| GBP | 0.22% | 0.05% | -0.04% | -0.06% | 0.36% | -0.05% | 0.88% | |
| CAD | 0.26% | 0.11% | 0.07% | -0.02% | 0.41% | 0.00% | 0.93% | |
| AUD | 0.31% | 0.13% | 0.11% | 0.04% | 0.43% | -0.02% | 0.97% | |
| JPY | -0.13% | -0.30% | -0.23% | -0.38% | -0.41% | -0.43% | 0.55% | |
| NZD | 0.27% | 0.16% | 0.11% | 0.06% | 0.03% | 0.45% | 0.98% | |
| CHF | -0.65% | -0.82% | -0.88% | -0.93% | -0.95% | -0.53% | -0.94% |
The heat map shows percentage changes of major currencies against each other. The base currency is picked from the left column, while the quote currency is picked from the top row. For example, if you pick the Euro from the left column and move along the horizontal line to the Japanese Yen, the percentage change displayed in the box will represent EUR (base)/JPY (quote).
Technical analysis: US Dollar maintains its bullish trend intact
From a technical perspective, the USD/CAD’s broader bias remains positive, with the current Canadian Dollar recovery seen as a corrective reaction.
The pair remains trading within a rising channel after a rejection from the trendline resistance at 1.3615, which so far remains contained above the 38.2% Fibonacci retracement of the previous up leg at 1.3575.
USD/CAD 4-Hour Chart
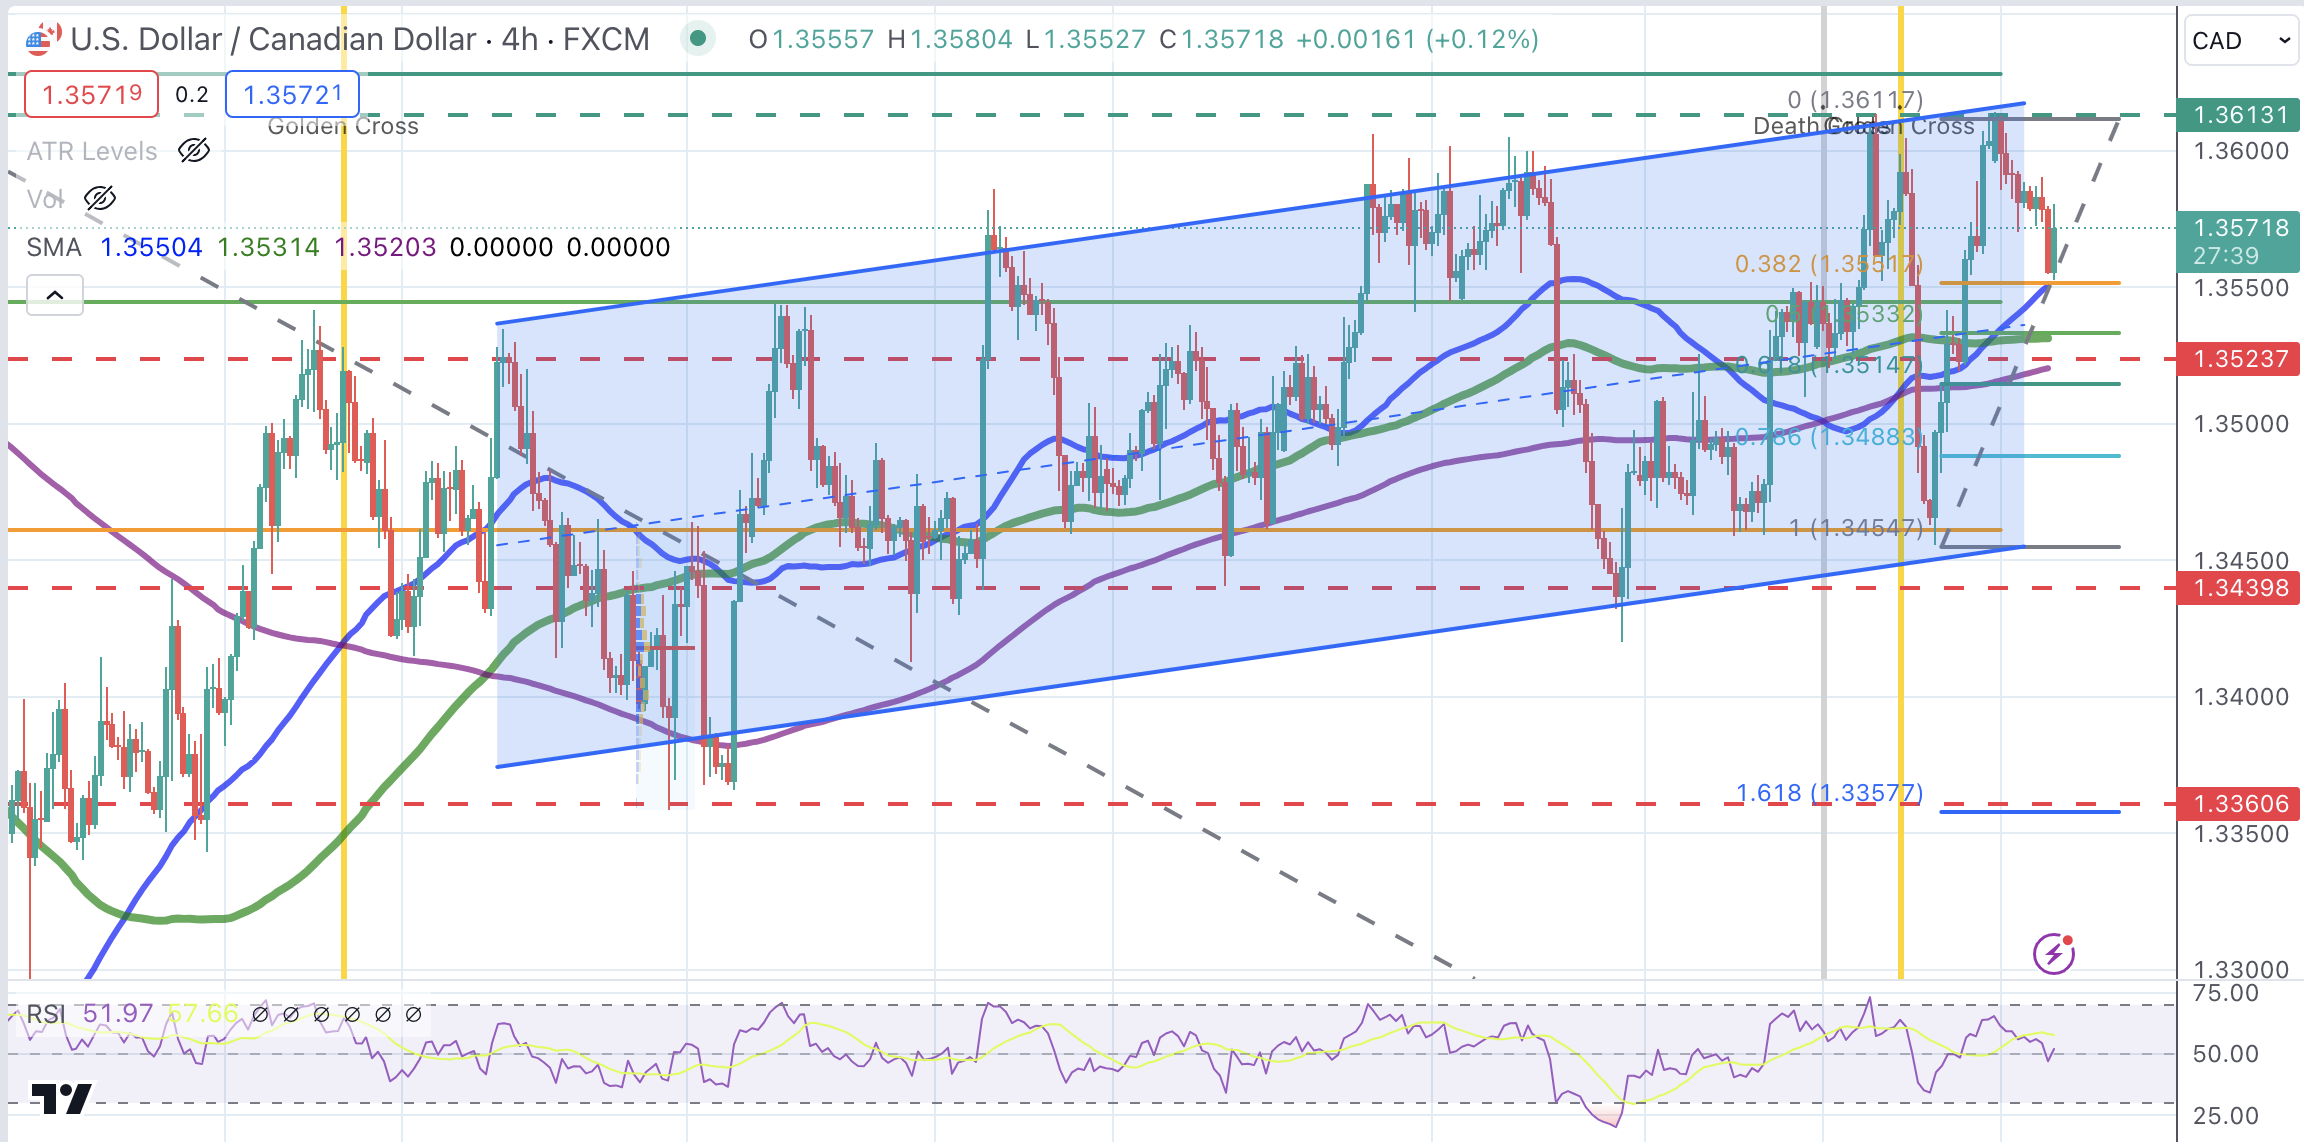
The US Dollar has scope for further decline with investors awaiting Friday’s inflation data. Support levels at 1.3555 and the 1.3440-1.3460 area are likely to challenge bears. On the upside, resistance remains at 1.3610 and the 1.3700 level.
Canadian Dollar FAQs
The key factors driving the Canadian Dollar (CAD) are the level of interest rates set by the Bank of Canada (BoC), the price of Oil, Canada’s largest export, the health of its economy, inflation and the Trade Balance, which is the difference between the value of Canada’s exports versus its imports. Other factors include market sentiment – whether investors are taking on more risky assets (risk-on) or seeking safe-havens (risk-off) – with risk-on being CAD-positive. As its largest trading partner, the health of the US economy is also a key factor influencing the Canadian Dollar.
The Bank of Canada (BoC) has a significant influence on the Canadian Dollar by setting the level of interest rates that banks can lend to one another. This influences the level of interest rates for everyone. The main goal of the BoC is to maintain inflation at 1-3% by adjusting interest rates up or down. Relatively higher interest rates tend to be positive for the CAD. The Bank of Canada can also use quantitative easing and tightening to influence credit conditions, with the former CAD-negative and the latter CAD-positive.
The price of Oil is a key factor impacting the value of the Canadian Dollar. Petroleum is Canada’s biggest export, so Oil price tends to have an immediate impact on the CAD value. Generally, if Oil price rises CAD also goes up, as aggregate demand for the currency increases. The opposite is the case if the price of Oil falls. Higher Oil prices also tend to result in a greater likelihood of a positive Trade Balance, which is also supportive of the CAD.
While inflation had always traditionally been thought of as a negative factor for a currency since it lowers the value of money, the opposite has actually been the case in modern times with the relaxation of cross-border capital controls. Higher inflation tends to lead central banks to put up interest rates which attracts more capital inflows from global investors seeking a lucrative place to keep their money. This increases demand for the local currency, which in Canada’s case is the Canadian Dollar.
Macroeconomic data releases gauge the health of the economy and can have an impact on the Canadian Dollar. Indicators such as GDP, Manufacturing and Services PMIs, employment, and consumer sentiment surveys can all influence the direction of the CAD. A strong economy is good for the Canadian Dollar. Not only does it attract more foreign investment but it may encourage the Bank of Canada to put up interest rates, leading to a stronger currency. If economic data is weak, however, the CAD is likely to fall.
- Mexican Peso ticks down as US Durable Goods Orders jump and Consumer Confidence steadies.
- Banxico’s dovish stance remains with Governor Rodriguez hinting at possible future rate cuts amidst inflation concerns.
- USD/MXN tests key support levels with potential for further movement on Banxico actions and US data insights.
The Mexican Peso is losing momentum and falling against the US Dollar on Tuesday as the North American session begins. The Greenback pares earlier losses amid a slightly busy economic docket in the United States (US). A risk-off impulse prompted traders to seek some safety after consumer confidence remained steady, while Durable Goods Orders increased the most since 2022. The USD/MXN trades at 16.68, up 0.06%.
Mexico’s economic schedule is scarce, but it will gather pace on Wednesday. According to the consensus, the Balance of Trade is expected to show a narrower deficit in February, from $-4.31 billion to $-0.2 billion. The Unemployment Rate is foreseen dipping from 2.9% to 2.8% for the same period.
Banxico Governor Victoria Rodriguez Ceja remained dovish via an interview with El Financiero. Rodriguez commented that the battle against inflation hasn’t been concluded, though adding that in upcoming meetings, they would discuss further rate cuts to the main reference rate.
Daily digest market movers: Mexican Peso retreats as US Dollar recovers
- Banxico Governor Victoria Rodriguez Ceja said, “When macroeconomic conditions and the inflationary outlook allow us to make additional adjustments to the reference rate to the one we already have, I consider that they would be gradual.”
- Mexico’s economy contracted for the fourth time in January. The Indicator of General Economic Activity plunged -0.6% MoM, below estimates of a 0.3% expansion, and slowed compared to December, missing estimates of 2.6% to print at 2%. Inflation in Mexico exceeded estimates of 4.45%, increasing by 4.48%, while core figures jumped above the consensus of 4.62% YoY to 4.69%.
- The outlook in Mexico suggests the economy is stagnating. A weak retail sales report, private spending falling sharply, and a contraction in economic activity justified Banxico’s rate cut. Nevertheless, they face stubbornly stickier inflation, keeping policymakers on their toes.
- Federal Reserve policymakers had been crossing the wires. Atlanta Fed President Raphael Bostic remains hawkish by supporting just one rate cut in 2024. Fed Governor Lisa Cook echoed Bostic’s comments and added that cutting too soon increases the risk of inflation becoming entrenched.
- Chicago Fed President Austan Goolsbee remains dovish, expecting three cuts, though he said he needs more evidence of inflation “coming down.”
- US Durable Goods Orders rose for the first time in three months from -0.3% MoM to 0.6% in February, an indication that companies are slightly optimistic about the economy.
- The Conference Board (CB) showed that Consumer Confidence in March deteriorated from 104.8 to 104, below estimates.
Technical analysis: Mexican Peso is subdued as USD/MXN oscillates around 16.60/70
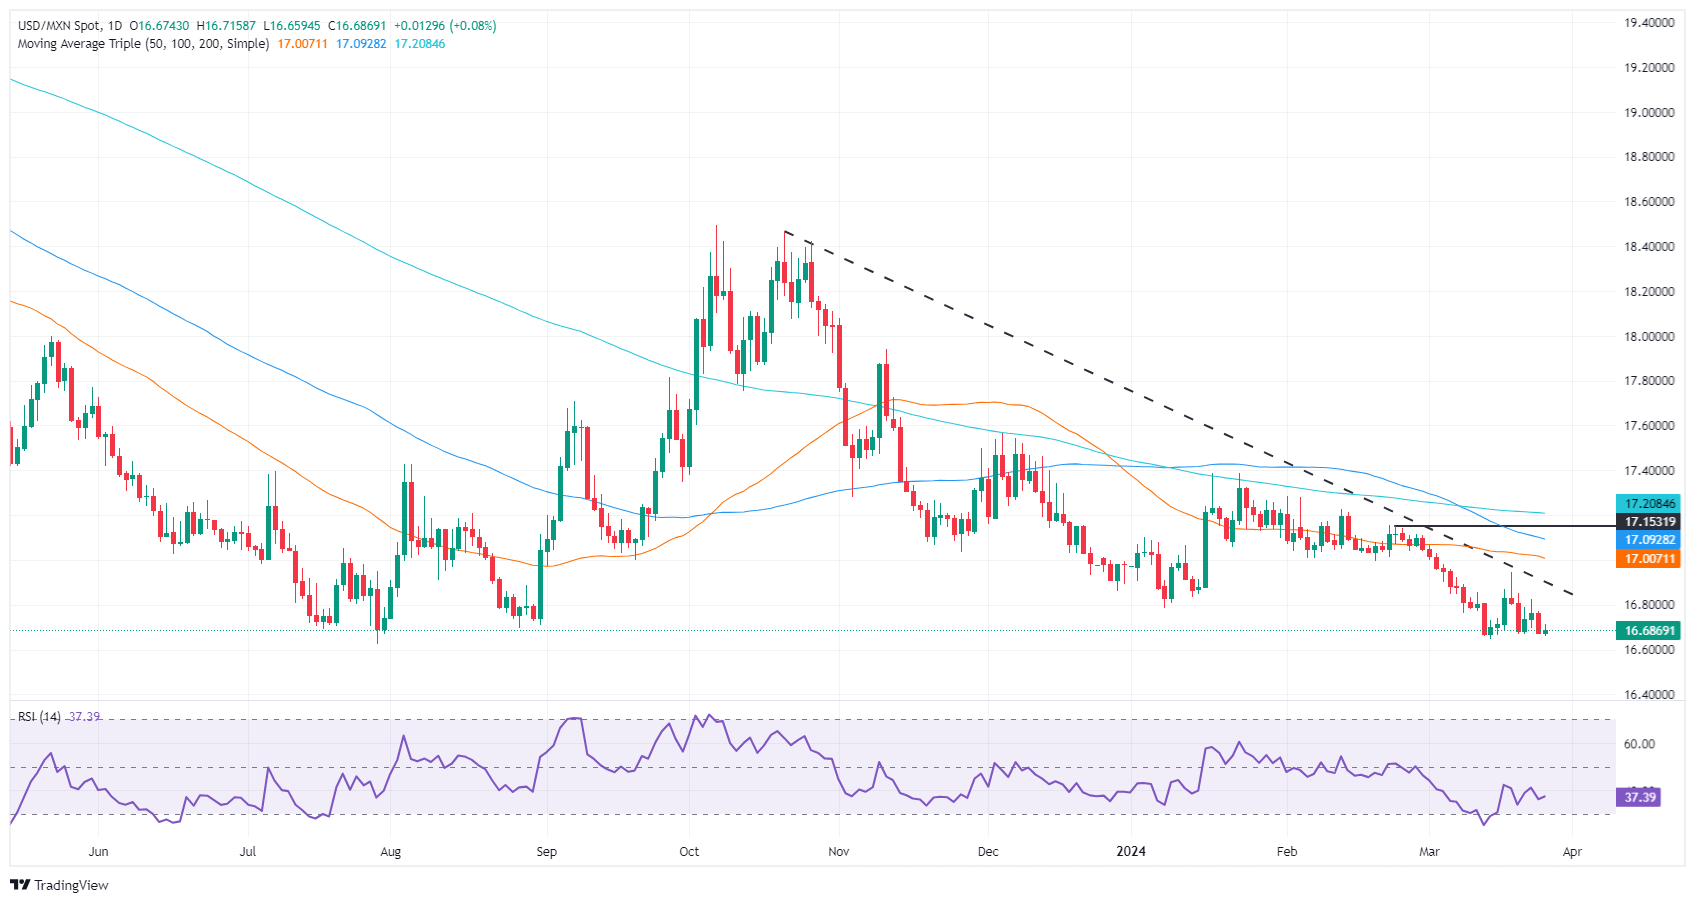
The USD/MXN downtrend remains intact, though it seems the exotic pair is consolidating within the 16.60/16.70 area. If sellers push prices below last year’s 16.62, that could exacerbate a drop to challenge October’s 2015 low of 16.32. Further support lies in the psychological 16.00 figure.
For a bullish scenario, traders must reclaim the last week’s high of 16.94, ahead of the 17.00 figure. Up next would be the 50-day Simple Moving Average (SMA) at 17.00, the 100-day SMA at 17.09, and the 200-day SMA at 17.20.
USD/MXN Price Action – Daily Chart
Mexican Peso FAQs
The Mexican Peso (MXN) is the most traded currency among its Latin American peers. Its value is broadly determined by the performance of the Mexican economy, the country’s central bank’s policy, the amount of foreign investment in the country and even the levels of remittances sent by Mexicans who live abroad, particularly in the United States. Geopolitical trends can also move MXN: for example, the process of nearshoring – or the decision by some firms to relocate manufacturing capacity and supply chains closer to their home countries – is also seen as a catalyst for the Mexican currency as the country is considered a key manufacturing hub in the American continent. Another catalyst for MXN is Oil prices as Mexico is a key exporter of the commodity.
The main objective of Mexico’s central bank, also known as Banxico, is to maintain inflation at low and stable levels (at or close to its target of 3%, the midpoint in a tolerance band of between 2% and 4%). To this end, the bank sets an appropriate level of interest rates. When inflation is too high, Banxico will attempt to tame it by raising interest rates, making it more expensive for households and businesses to borrow money, thus cooling demand and the overall economy. Higher interest rates are generally positive for the Mexican Peso (MXN) as they lead to higher yields, making the country a more attractive place for investors. On the contrary, lower interest rates tend to weaken MXN.
Macroeconomic data releases are key to assess the state of the economy and can have an impact on the Mexican Peso (MXN) valuation. A strong Mexican economy, based on high economic growth, low unemployment and high confidence is good for MXN. Not only does it attract more foreign investment but it may encourage the Bank of Mexico (Banxico) to increase interest rates, particularly if this strength comes together with elevated inflation. However, if economic data is weak, MXN is likely to depreciate.
As an emerging-market currency, the Mexican Peso (MXN) tends to strive during risk-on periods, or when investors perceive that broader market risks are low and thus are eager to engage with investments that carry a higher risk. Conversely, MXN tends to weaken at times of market turbulence or economic uncertainty as investors tend to sell higher-risk assets and flee to the more-stable safe havens.
The Australian Bureau of Statistics (ABS) will release the Monthly Consumer Price Index (CPI) Indicator for February on Wednesday, March 27 at 00:30 GMT and as we get closer to the release time, here are forecasts from economists and researchers of six major banks regarding the upcoming inflation data.
Monthly CPI is expected to grow at a higher pace of 3.5% against 3.4% in January. If so, it would be the first acceleration since September and would move further above the 2%-3% target range.
ANZ
We expect annual inflation in the monthly CPI indicator to rise slightly to 3.5% YoY in February from 3.4% YoY in January. This would be equivalent to a 0.2% MoM rise. All groups excluding volatile items and holiday travel are forecast to slow to 3.9% YoY from 4.1% YoY. A 0.2% MoM result would be in line with our Q1 headline CPI forecast of 0.5% QoQ, with March tending to be the most inflationary month in Q1.
Westpac
Westpac has pencilled in a 0.6% MoM rise in February, which should see the ABS publish a headline pace of 3.8% YoY, up from 3.4% in January. With February being the mid-month of the quarter we get an update on many services including the annual update on education prices. There is uncertainty around electricity where we expect a bounce as Government Energy Rebates come to an end.
TDS
We expect Feb monthly CPI inflation to edge lower to 3.4% YoY holding steady around this rate since Dec. Rents have been sticky but lower tradeables prices have proven to be a powerful disinflationary force. We doubt markets will overreact to a downside miss as the bigger picture still hangs around a very resilient labour market which may keep services inflation risks entrenched. We expect the RBA to echo a high-for-longer message and expect them to only cut in Nov.
SocGen
Monthly headline CPI inflation (year-on-year) for February will probably increase a bit from January. The rebound in oil prices (i.e., automotive fuel prices) is the most likely main driver for the rise in headline inflation, and the transport sector which includes automotive fuel will probably climb from 3.0% to c. 4%. Other major sectors are likely to decline modestly due to base effects (food and non-alcoholic beverages, clothing and footwear, education) or to remain at the previous month’s level (housing, furnishings and household equipment/services, health, recreation and culture). We especially expect that housing inflation will stay at around 4.6%; utility prices and new dwelling purchase prices are likely to be relatively stable and housing rents inflation is unlikely to accelerate from the current pace of 7.4%. Both trimmed mean inflation and inflation excluding ‘volatile items’ and holiday travel are likely to extend the recent decline. In conclusion, we don’t think that a modest rebound in headline inflation based on a single driver (oil) will affect the RBA’s policy stance.
ING
Australian CPI inflation for February may push slightly higher after remaining at 3.4% YoY in December. The February 2023 index rose only 0.2% month-on-month, making this month difficult to undershoot and bring inflation lower, unless we see a continuation of January’s price declines. We think it's more likely that there is a slight correction upward. We forecast inflation to come in at 3.5% YoY, following a 0.3% MoM increase.
Citi
The second month of the quarter of the monthly inflation gauge has a larger weighting towards service items. Overall, inflation has come down more sharply than anticipated by the RBA in Q1, and we see downside risks to their Q1 inflation print of 3.5%.
April seasonality is typically bullish Sterling (GBP), economists at Société Générale say.
Seasonality in April is typically bearish EUR/GBP
Sterling retraced against the Dollar and the Euro after two of the nine-member MPC committee threw in the towel on rate hikes and voted with the majority for no change. The shift could prove a watershed and opens the door to a rate cut in the coming months.
The pullback in GBP/USD attracted buyers right on the 200-DMA (1.2591). This could be the prelude to a rally back over 1.2800 towards 1.3000 if seasonality is a guide. April ranks among the best months of the year for the Pound thanks to the repatriation by corporates of overseas FX for dividend payments. The average percentage monthly gain of the last ten years in April is 0.8%. The standard deviation is 2.2%.
Seasonality in April is also typically bearish EUR/GBP.
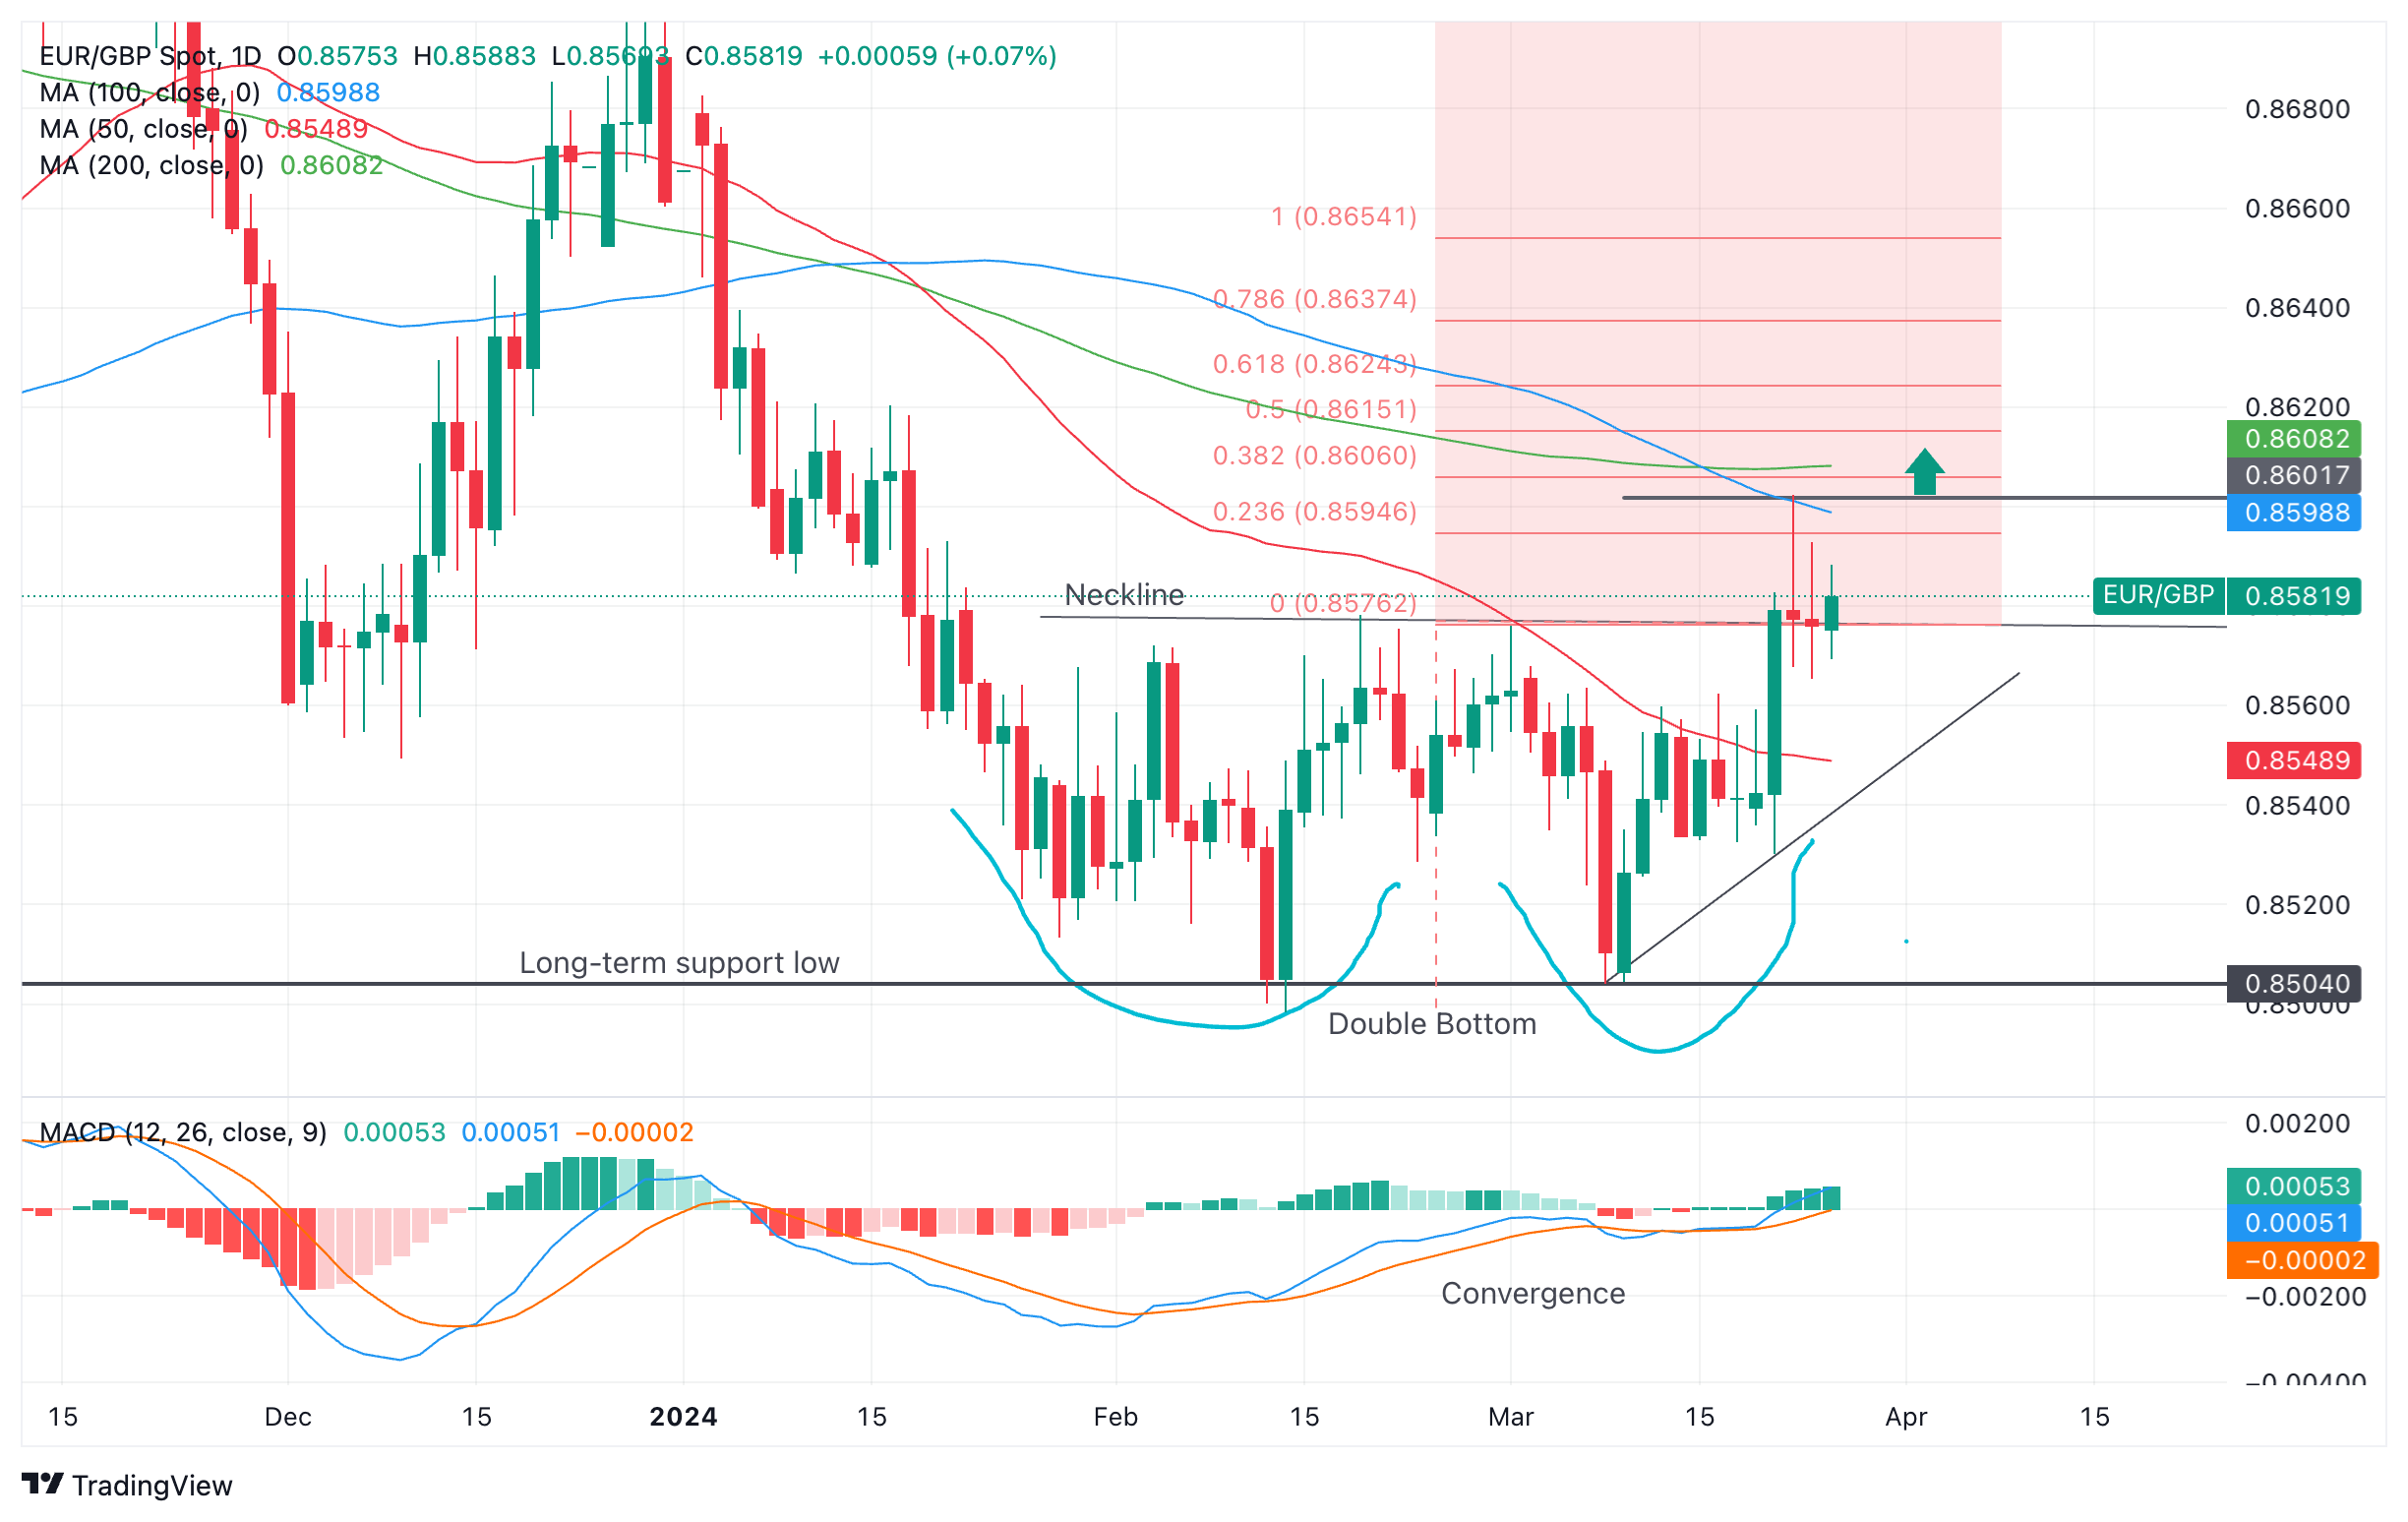
- EUR/GBP may have completed a bullish Double Bottom reversal pattern.
- A rebreak of the March 22 highs would provide confirmation of further substantial upside.
- MACD is converging bearishly – a break below to 50-day SMA would invalidate.
EUR/GBP has formed a possible Double Bottom reversal pattern at key support lows for the pair during the month of March. If the pattern plays out as expected it would lead to substantial gains for EUR/GBP.
Euro to Pound Sterling: Daily chart
According to the chart above, the Double Bottom completed on March 21, when the exchange rate nudged above the Neckline – a level that joins the peaks of the Double Bottom and provides a confirmation level. According to tech lore, once the neckline is broken it usually means price will go higher.
Although EUR/GBP price did go higher, upside after March 21 was limited. The pair rallied up to a high of 0.8602 on the following day, stuttered and then fell back down. It has since found support at the level of the neckline.
This may potentially just be a retest prior to more upside, however, to be sure a break above the March 22 high of 0.8602 would provide better confirmation.
A move higher would meet its first, more conservative target at the 0.618 Fibonacci extension of the height of the Double Bottom extended higher from the Neckline. This gives an initial price objective of 0.8624. This would be followed by the more ambitious target of the full height of the pattern extrapolated higher (1.000 Fib. ratio) at 0.8654.
The Moving Average Convergence/ Divergence (MACD) is converging bullishly with price at the two troughs of the Double Bottom. This provides further supporting evidence the pattern could lead to more upside.
A break below the 50-day Simple Moving Average (SMA) at 0.8549 prior to completion of the conservative target would indicate the pattern was no longer valid.
This would also be a bearish sign suggesting a move down to retest the long-term support lows at 0.8504. These lows have been touched on multiple occasions and present a significant level, which if broken would lead to a volatile move down, potentially to around the 0.8440s.
Economists at Nordea analyze how the focus on cuts from central banks could impact the FX market.
When the Fed starts to embark on lower rates, the risk sensitive FX should start to do better against the USD
For FX, the relative rate changes on the way down will start to come into play.
When the Fed starts to embark on lower rates, the risk sensitive FX should start to do better against the USD. But we still think it will be a sideways bumpy road for the USD in the coming months with largely synchronised rate cuts for major currencies such as the USD, EUR and GBP.
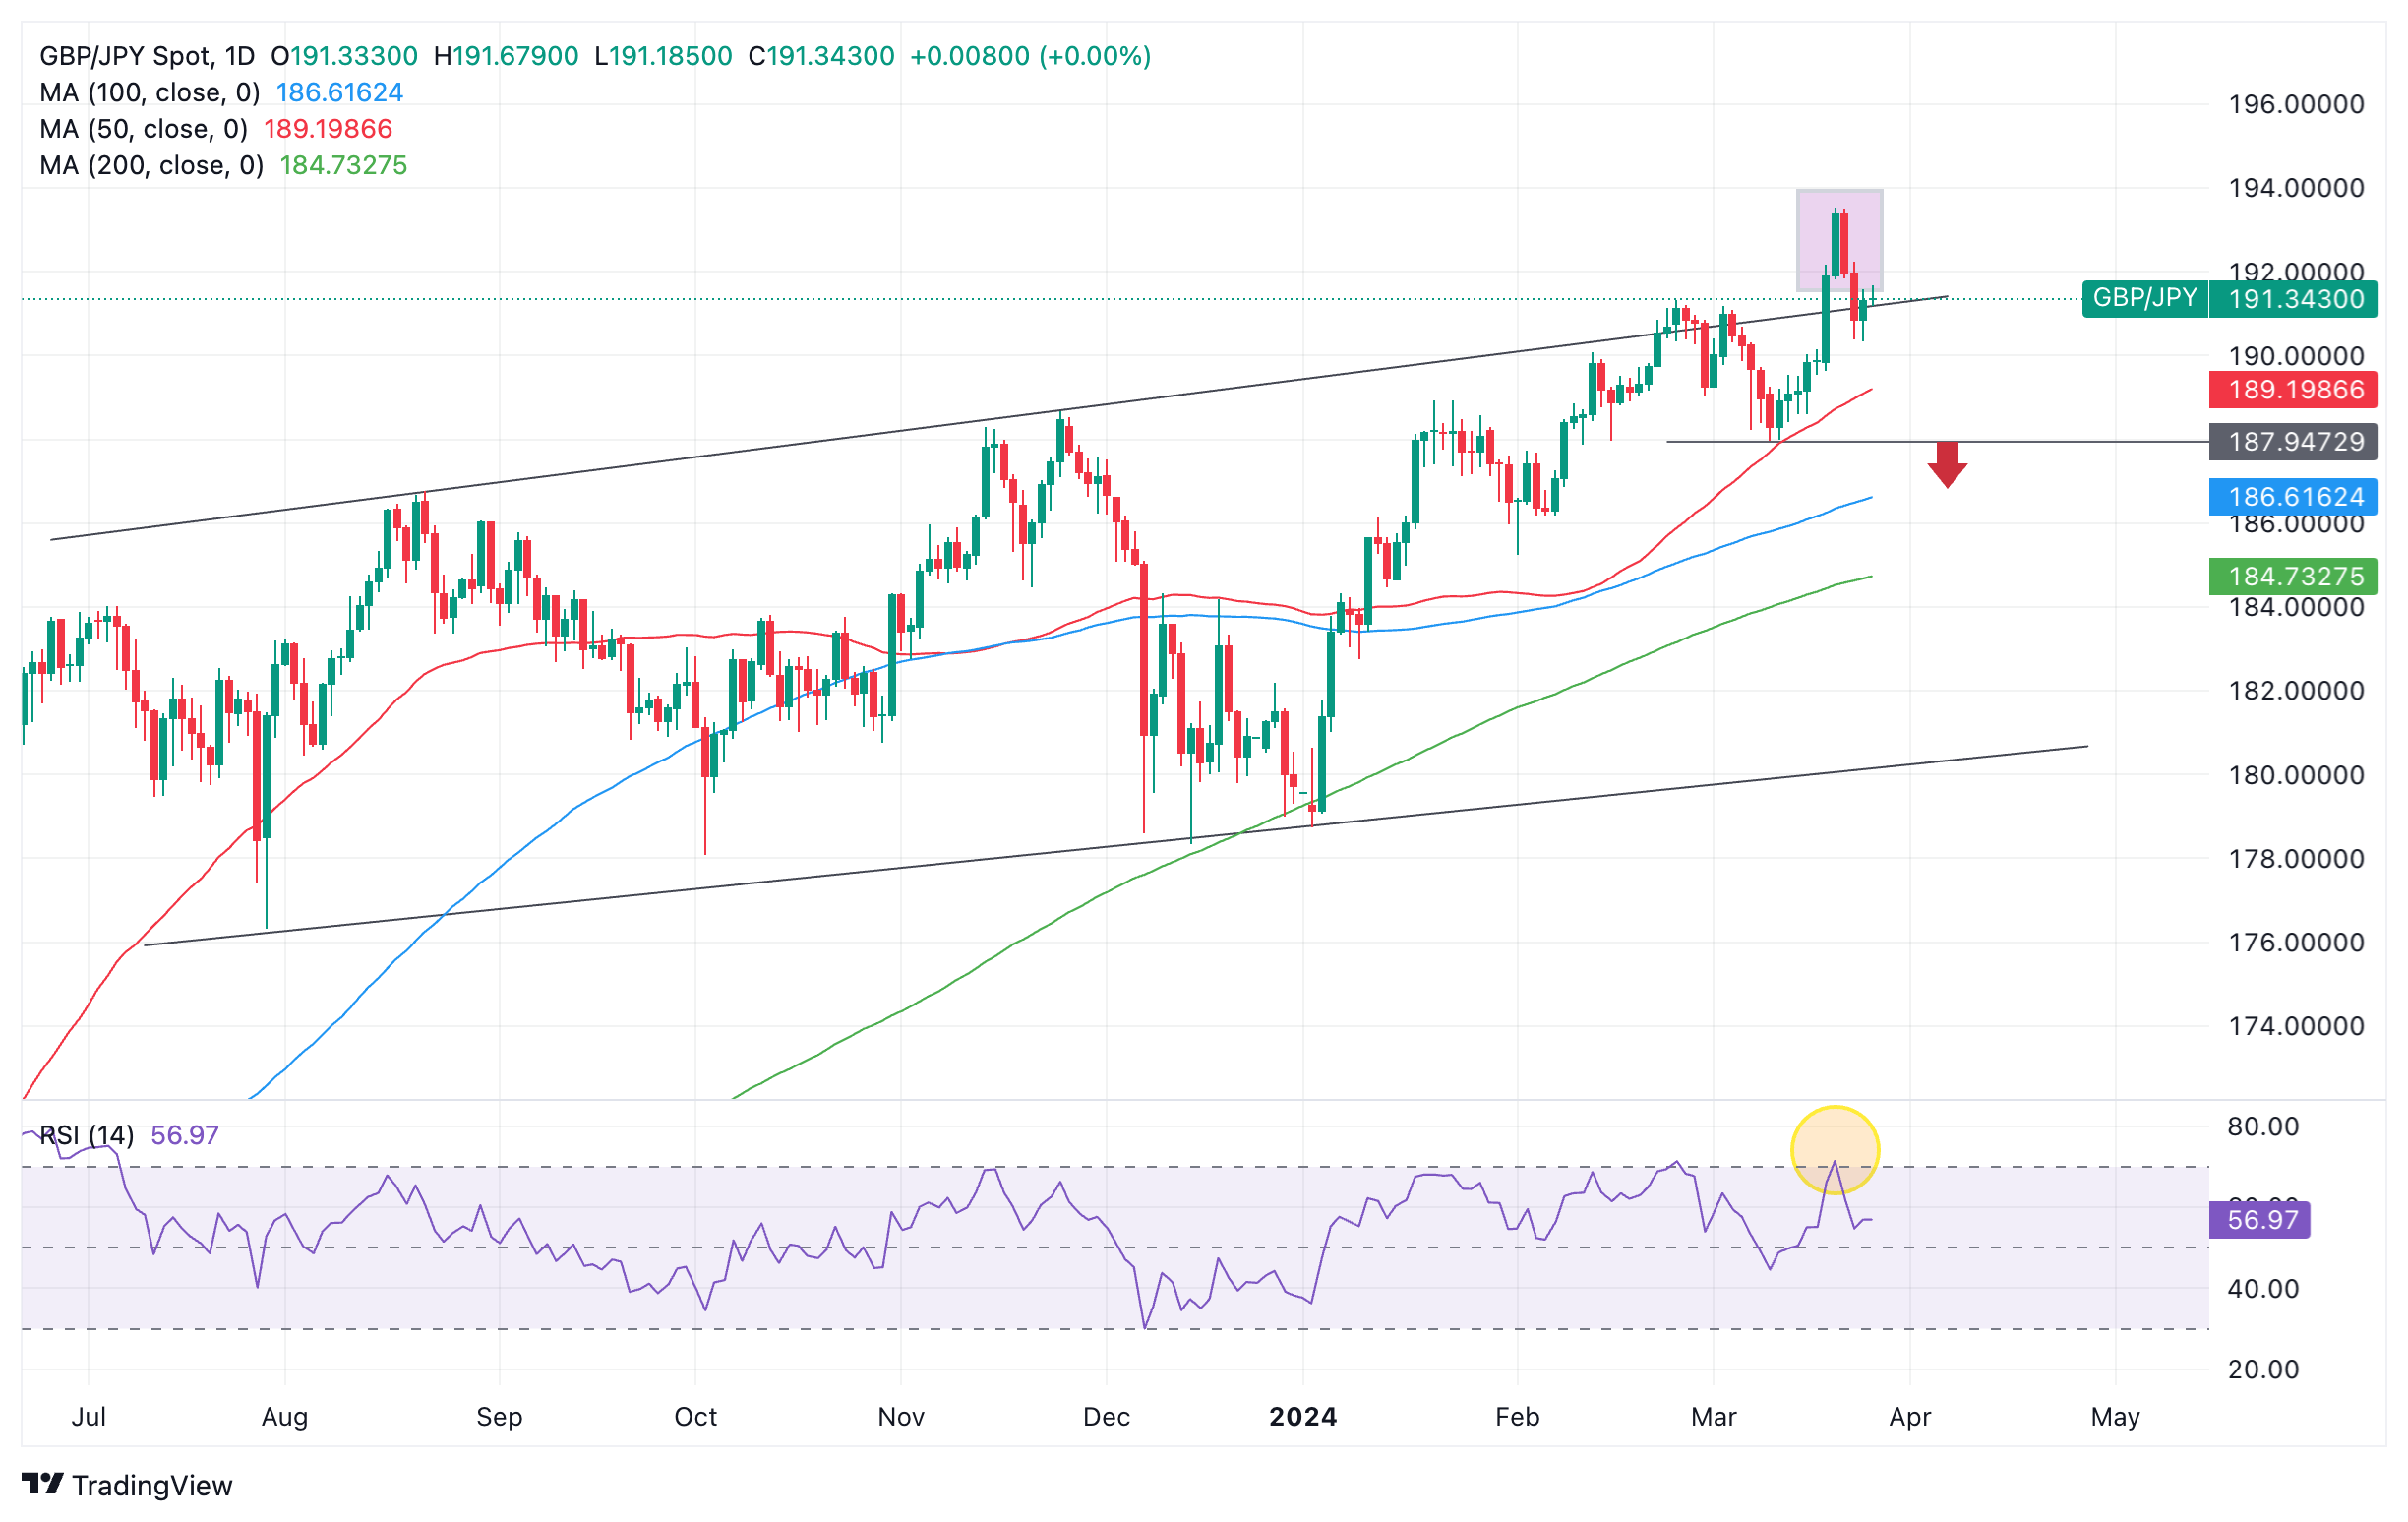
- GBP/JPY finds support at the upper borderline of a Wedge it recently broke out from.
- Bearish technical indicators suggest more downside is possible after the overextension.
GBP/JPY has been rising in a bearish Wedge pattern. Recently the pair broke above the upper boundary line and then reversed lower. It has since found temporary support at the Wedge’s upper edge. A cursory glance at the tea leaves suggest a risk of further weakness despite the uptrend remaining intact.
GBP/JPY formed a Two Bar reversal pattern on the daily chart (rectangled) at the March 20 and 21 highs. Such patterns are fairly reliable indicators of short-to-medium term reversals.
Pound Sterling versus Japanese Yen: Daily chart
At the same time as price rolled over, the Relative Strength Index (RSI) exited its overbought zone, giving a sell signal (circled).
In addition, when prices reach bullish extremes and overshoot trendlines the reversal that follows is often significant, suggesting GBP/JPY could be reversing a longer-term trend.
A break below the last swing low of the up move, the 187.964 March 11 low, would provide stronger confirmation that the trend was turning bearish.
Such a break would probably be followed by a move down inside the Wedge to a target at the lower boundary of the pattern, at roughly 180.400.
Along the way fairly stubborn support is likely to be provided by the 100-day and 200-day SMAs at 186.610 and 184.730 respectively.
A decisive break below the lower borderline of the Wedge would be very bearish and likely see a much deeper slide to the 170.000s, based on an extrapolation of the height of the wedge lower.
A break above the 193.50 highs, however, would provide confirmation the dominant bull trend was still intact and continuing higher.
Although it looks overstretched, such a move could meet an next upside target at the 195.88 highs of 2015.
- USD/CAD drops to 1.3550 as the Fed’s belief that the underlying story of inflation easing is intact weighs on the US Dollar.
- The US Durable Goods Orders remained stronger than expected in February.
- BoC Rogers worries about Canada’s low productivity.
The USD/CAD pair falls to 1.3550 in the early American session on Tuesday. The Loonie asset faces pressure as the US Dollar drops on firm expectations that the Federal Reserve (Fed) will start reducing interest rates from the June meeting.
The Fed’s confidence in the fundamental story of inflation—that it will return to the 2% target despite hot readings in January and February—has boosted expectations for rate cuts in June. This has improved market sentiment, which has strengthened demand for risk-sensitive assets.
The S&P 500 opens on a positive note, portraying an increase in market participants' risk appetite. The US Dollar Index (DXY) falls to 104.15 from its monthly high of 104.50 despite upbeat US Durable Goods Orders for February. The US Census Bureau reported that orders for Durable Goods rose by 1.4% against expectations of 1.3%.
The Census Bureau said an increase in primary metals, transportation equipment, and machinery drove higher fresh durable goods orders. Higher spending in factories indicates a revival of the manufacturing sector, which has remained a main laggard due to the Federal Reserve's hefty rate hikes in more than two years.
This week, investors will keenly focus on the US core Personal Consumption Expenditure price index (PCE) data for February, which will be published on Friday. Fed’s preferred inflation measure will provide fresh cues about when the central bank will start reducing interest rates.
Meanwhile, the Canadian Dollar could face selling pressure as Bank of Canada (BoC) Senior Deputy Governor Carolyn Rogers has depicted vulnerable economic prospects. BoC Rogers warned about Canada’s low productivity due to a lack of investment, competition, and the inability of new Canadians to use their skills.
Carolyn Rogers also warned that the current inflation situation could be a bigger threat than it has been over the past few decades.
Gold is making some headway again after initially running out of steam following its rise to a new record level of $2,222 in the middle of last week. Economists at Commerzbank analyze the yellow metal’s outlook.
Next stress test for Gold: US PCE deflator
The market is focusing on the new US inflation data for February, which will be published on Friday. The PCE deflator is the Fed's preferred measure of inflation. According to our economists, the figures are more likely to show that inflationary pressure remains stubbornly high. If this is the case, the Gold price could give up its latest gains.
ETF investors are at least more sceptical again: outflows have been recorded again since the middle of last week, following several days of significant inflows.
- US CB Consumer Confidence Index eases to 104.7 in March.
- The USD Index trades slightly on the defensive.
Consumer sentiment in the US retreated to three-month lows at 104.7 for the month of March according to the Conference Board. Following three consecutive months of improvements, the index came in short of expectations and receded to three-month lows in March.
From the press release, “The Present Situation Index—based on consumers’ assessment of current business and labour market conditions—increased to 151.0 in March from 147.6 in February. Meanwhile, the Expectations Index—based on consumers’ short-term outlook for income, business, and labour market conditions—fell to 73.8, down from 76.3 last month. An Expectations Index reading below 80 often signals a forthcoming recession.
Market reaction
The Greenback, in the meantime, keeps its bearish performance in the low-104.00s when gauged by the USD Index (DXY).
Economists at ING are fearful the Mexican Peso (MXN) is starting to become a little too strong.
Peso to hold gains despite start of Banxico easing
Banxico has just started its easing cycle with a 25 bps rate cut to 11.00%. It has not provided much forward guidance – probably because it requires flexibility around Fed policy too. Banxico has not said much about the very strong, inflation-adjusted Peso. However, it is up 16% YoY and at the highest levels since 2008 and could start to become a problem.
The above is our preference in that the rates market will probably take the strain (i.e. steady cuts from Banxico this year) and USD/MXN continues in a 16.50/17.00 range rather than dropping below 16.00 when the Fed cuts.
Donald Trump remains the wild card – most recently threatening 100% tariffs on Chinese cars made in Mexico.
- AUD/USD moves higher to 0.6550 as the US Dollar falls on the Fed’s confidence in inflation, declining to the 2% target.
- The Fed remains stuck with projections of three rate cuts in 2024.
- Investors await the Australian monthly CPI data for fresh guidance.
The AUD/USD pair rises to 0.6550 in Tuesday’s early New York session. The Aussie asset saw buying interest near the psychological support of 0.6500 as the US Dollar eased.
Federal Reserve policymakers believe that inflation is cooling despite remaining hot in the first two months of this year. This has built downward pressure on the US Dollar. The US Dollar Index (DXY) has corrected modestly from a monthly high of 104.50 to 104.10.
On Monday, Chicago Fed Bank President Austan Goolsbee said in an interview with Yahoo Finance that the inflation situation is uncertain due to higher housing inflation. However, he is confident that the fundamental story of inflation returning to the 2% target has not changed.
Going forward, the US Dollar will dance to the tunes of the market expectations for Fed rate cuts. Fed’s ‘three rate cuts’ view in 2024 has boosted the expectations for the Fed to reduce interest rates from the June policy meeting. The CME FedWatch tool shows that the likelihood of rate cut decision in June has increased to 70% against 60%, recorded before the Fed’s monetary policy.
Meanwhile, upbeat market sentiment has improved the appeal for risk-sensitive assets. Later, the Australian Dollar will be influenced by the Consumer Price Index (CPI) data for February, which will be published on Wednesday. Economists have forecasted that monthly CPI grew at a higher pace of 3.5% against 3.4% in January. This would allow the Reserve Bank of Australia (RBA) to lean towards keeping interest rates higher for a longer period.
- USD/JPY is trapped in a range with neither bulls or bears willing to commit.
- Fear of intervention prevents upside and the potential for US Dollar strength downside.
- Most institutional investors sees USD/JPY falling eventually once rates narrow.
USD/JPY is trading in the 151.300s on Tuesday, little changed from the previous session as it enters a stalemate zone below multi-year highs.
The pair is trapped in a narrow consolidation as both sides of the trade suffer from paralysis.
Bulls are paralyzed by the fear of intervention from the Japanese authorities and bears by the potential for the US Dollar (USD) to excel given the above-average performance of the US economy, as well as fading hopes of an early interest-rate cut by the Federal Reserve (Fed).
USD/JPY to weaken in the long-term
Institutional analysts are generally bearish about USD/JPY in the medium-to-long run. They mostly view interest-rate cuts by the Fed as inevitable – a question of when not whether. There is also an increasing consensus that there will be more interest-rate hikes from the Bank of Japan (BoJ).
According to a Bloomberg survey of economists, the majority believe the BoJ will raise interest rates again in October, if not before.
In contrast the Fed is expected to cut as soon as June, with a probability of 69.9% rates will come down in that month, according to the CME FedWatch tool.
“We think the US-Japan yield differential is set to narrow, this, among other factors, should provide support for the JPY,” say economists at HSBC.
The Yen is destined to rise across the board, in fact, as global inflation comes down and central bank easing gains momentum, according to analysts at MUFG.
"When global yields do start to move lower, the stance of the BoJ will certainly reinforce the scale of yen appreciation,” they say in a recent note.
The yen could fall to the 140.000 level once the reversal gets underway and the yield spread between the US and Japan narrows.
“We still see scope for USD/JPY to drop to at least 140.00 by year-end with risks of a move to the mid-130.00’s,” adds MUFG.
ING are not as convinced USD/JPY will go lower arguing such a move would be dependent on the US Federal Reserve cutting interest rates, something still not guaranteed.
“A recovery in JPY remains even more strictly tied to US rates breaking lower."
Yenccentric move
Many were taken off guard by the Yen’s counter-intuitive move following the BoJ’s March meeting. For the first time since 2007 the bank decided to raise interest rates. Normally this would be expected to strengthen a currency substantially, especially after such a long delay. Yet in the case of the Yen, the opposite was true.
Some put it down to the move being too widely telegraphed prior to the meeting, causing a “buy the rumor sell the fact” trade, whilst others suggested the Yen fell because the rate hike was a case of a “one and done”.
Japan’s FX chief Masato Kanda put the Yen’s eccentric devaluation down to speculators playing a contrarian trade to make a quick killing. Indeed, data from the Commodity Futures Trading Commision (CFTC) shows large speculators such as hedge funds loading up their short bets on the Yen in the week of the BoJ decision.
Eventually, the explanation that seems the most reasonable is that despite the rise in Japanese interest rates from negative 0.1% to a range between 0.0% and plus 0.1%, they remain extremely low in comparison to other countries. This means the Yen still “remains the most popular funding currency for carry trades,” according to FX strategists at ING.
The carry trade is an operation by which traders borrow in a “funding currency” such as the Yen, to buy a currency with a higher interest rate, such as the New Zealand Dollar (5.5%) or US Dollar (5.5%).The profit lies in the difference between the cost of the interest repayments and the interest earned at the higher rate – assuming a constant exchange rate.
USD/CAD drifts a little lower. Economists at Scotiabank analyze the pair’s outlook.
Resistance is seen at 1.3600/1.3610
The USD/CAD pair is drifting lower but momentum is weak and losses may slow in the low/mid 1.3500s absent a stronger sense of (downward) direction developing in this market.
Broadly flat range trading in funds in the past few weeks leaves longer run momentum studies look weak and neutral.
Resistance is 1.3600/1.3610.
See – EUR/USD: Move above 1.0872 liable to spur additional gains to 1.0900+ – Scotiabank
- Durable Goods Orders rose by 1.4% MoM last month.
- The Greenback remains on the defensive so far.
On Tuesday, Durable Goods Orders in the United States expanded by 1.4%, or $3.7 billion, to $277.9 billion in February according to the Census Bureau. This reading followed the 6.9% decrease recorded in the first month of the year and came in above market expectation for an expansion of 1.1%.
From the press release: "Excluding transportation, new orders decreased 0.3%," the publication read. "Excluding transportation, new orders increased 0.5 percent. Excluding defense, new orders increased 2.2 percent. Transportation equipment, also up following two consecutive monthly decreases, led the increase, $2.9 billion or 3.3 percent to $90.4 billion."
Market reaction
There was no visible reaction from the USD Index (DXY) in the wake of the release, which remained around the 104.15 zone, down marginally for the day.
"Canada urgently needs to boost productivity to help hedge against the risk of higher inflation," Bank of Canada (BoC) Senior Deputy Governor Carolyn Rogers said on Tuesday.
Key takeaways
"Low Canadian productivity is an emergency."
"Inflation has come a long way down, we need to finish the job."
In the future, inflation may be more of a threat than it has been over the past few decades."
"Productivity is a way to inoculate the economy against inflation; an economy with low productivity can only grow so quickly before inflation sets in."
"In the wake of the pandemic, we thought productivity in Canada would improve; it hasn't happened yet."
"Productivity in Canada is hampered by lack of investment, lack of competition, inability of new Canadians to use the skills they have."
"Level of productivity in Canada's business sector is more or less unchanged from where it was seven years ago."
"More recently, we've heard from firms that say current interest rate environment is making financing more difficult."
"That said, investment levels were also weak in pre-pandemic years, when rates were much lower than today."
Market reaction
USD/CAD edged slightly higher from session lows following these comments. At the time of press, the pair was down 0.15% on the day at 1.3565.
EUR/USD recovers to mid/upper 1.0800s. Economists at Scotiabank analyze the pair’s outlook.
Technicals are supportive
Spot traded positively in response to another test of the 1.0800 area on Monday, confirming a bullish ‘piercing line’ candle on the chart through the close.
Gains are nearing the 50% retracement of last week’s see-off (1.0872), with a move above here liable to spur additional gains to 1.0900+.
Daily and weekly trend momentum remains bullish for the EUR, which has helped to bolster support for the EUR on dips and should help drive spot gains higher in the near term.
Support is 1.0835.
- The US Dollar retreats mildly on Tuesday for a second day in a row.
- Traders are looking forward to the Durable Goods release on Tuesday.
- The US Dollar Index steadies above 104.00 as some downward pressure builds up.
The US Dollar (USD) weakens for a second consecutive day on Tuesday ahead of the first big batch of economic data releases this week, with Durable Goods orders as the main event. Markets will welcome clear data after US Federal Reserve members have contradicted each other, with calls for three and only one interest-rate cut. This dispersion could make the Fed less credible at a moment when markets seem to be challenging the broader stance of the US central bank, a scenario that could lead to erratic moves for the USD.
Durable Goods orders will take away the bulk part of attention from traders. Still, Consumer Confidence and the Richmond Fed Manufacturing Survey deserve as well a fair bit of attention. Traders will want to see confirmation if the Fed is right or wrong about interest-rate cuts and the health of the US economy and trade that adjustment.
Daily digest market movers: PBoC at it again
- The People’s Bank of China (PBoC) fixed the Chinese Renminbi substantially stronger for a second day in a row against the US Dollar, triggering a lower USD/CNH.
- Durable Goods orders data for February are set to be released at 12:30 GMT:
- The headline Durable Goods Orders are set to increase 1.3%, rebounding from the 6.2% decline seen in January.
- Durable Goods orders without Transportation should expand by 0.4%, recovering from the 0.4% decrease a month earlier.
- As always, the revisions from January could weigh as well on the market reaction.
- At 12:55 GMT, the US Redbook will come out, with the previous number at 3.4%.
- The Housing Price Index for January will be released at 13:00 GMT. In December, house prices increased 0.1% on month.
- US Consumer Confidence for March will be released at 14:00 GMT.
- Together with the US Consumer Confidence, the Richmond Fed Manufacturing Index for March will be released. The previous number was at -5, signaling contraction.
- Equities are rather flat across the board, with minor gains and losses across regions. US equity futures are mildly in the green.
- According to the CME Group’s FedWatch Tool, expectations for the Fed’s May 1 meeting are at 92% for keeping the fed funds rate unchanged, while chances of a rate cut are at 8%.
- The benchmark 10-year US Treasury Note trades around 4.24%, around the high for this week.
US Dollar Index Technical Analysis: Setting sail back to 104
The US Dollar Index (DXY), which gauges the value of the Greenback against a basket of foreign currencies, trades a touch softer nearing 104.00. The projected easing in the Greenback is taking place as investors look for an equilibrium between the dovish Fed and the rather challenging markets on that possible outcome. The truth will probably be somewhere in the middle, which means the DXY could retreat a few points to challenge 104.00 and snap below this barrier by the end of the week.
The DXY is still eyeballing a pivotal level near 104.60, where last week’s rally peaked. Further up, 104.96 remains the first level in sight. Once above there, the peak at 104.97 from February comes into play ahead of the 105.00 region, with 105.12 as the first resistance.
Support from the 200-day Simple Moving Average (SMA) at 103.73, the 100-day SMA at 103.49, and the 55-day SMA at 103.64 are getting a fresh chance to show their importance. The 103.00 big figure looks to remain unchallenged for now after the decline after the Fed meeting last week got turned around way before reaching it.
US Dollar FAQs
The US Dollar (USD) is the official currency of the United States of America, and the ‘de facto’ currency of a significant number of other countries where it is found in circulation alongside local notes. It is the most heavily traded currency in the world, accounting for over 88% of all global foreign exchange turnover, or an average of $6.6 trillion in transactions per day, according to data from 2022. Following the second world war, the USD took over from the British Pound as the world’s reserve currency. For most of its history, the US Dollar was backed by Gold, until the Bretton Woods Agreement in 1971 when the Gold Standard went away.
The most important single factor impacting on the value of the US Dollar is monetary policy, which is shaped by the Federal Reserve (Fed). The Fed has two mandates: to achieve price stability (control inflation) and foster full employment. Its primary tool to achieve these two goals is by adjusting interest rates. When prices are rising too quickly and inflation is above the Fed’s 2% target, the Fed will raise rates, which helps the USD value. When inflation falls below 2% or the Unemployment Rate is too high, the Fed may lower interest rates, which weighs on the Greenback.
In extreme situations, the Federal Reserve can also print more Dollars and enact quantitative easing (QE). QE is the process by which the Fed substantially increases the flow of credit in a stuck financial system. It is a non-standard policy measure used when credit has dried up because banks will not lend to each other (out of the fear of counterparty default). It is a last resort when simply lowering interest rates is unlikely to achieve the necessary result. It was the Fed’s weapon of choice to combat the credit crunch that occurred during the Great Financial Crisis in 2008. It involves the Fed printing more Dollars and using them to buy US government bonds predominantly from financial institutions. QE usually leads to a weaker US Dollar.
Quantitative tightening (QT) is the reverse process whereby the Federal Reserve stops buying bonds from financial institutions and does not reinvest the principal from the bonds it holds maturing in new purchases. It is usually positive for the US Dollar.
- EUR/GBP trades sideways below 0.8600 as investors reassess BoE’s rate cut expectations.
- BoE Mann warned that investors are expecting too many rate cuts.
- ECB Muller said the central bank is at a point where it can start reducing interest rates.
The EUR/GBP pair is struck in a tight range around 0.8580 after a slight correction from the crucial resistance of 0.8600. The cross is expected to move high as the United Kingdom’s softer-than-expected inflation data for February has revamped market expectations for the Bank of England (BoE) reducing interest rates from the June meeting.
Prior to February’s inflation data, investors were anticipating that the BoE would start cutting key borrowing rates from August. Meanwhile, the BoE’s slight dovish guidance on interest rates has also reinforced expectations for rate cuts in June. The BoE said in its monetary policy statement that the market’s view of two or three rate cuts this year is not ‘unreasonable.’ The central bank also said that inflation is moving in the right direction.
Last week, BoE Governor Andrew Bailey said in an interview with the Financial Times that rate cuts are "in play" this year. In addition, BoE policymaker Catherine Mann, who remained a hawk among the nine-member-led Monetary Policy Committee (MPC) team, surprisingly voted for a steady interest rate decision.
In Tuesday’s European session, Catherine Mann clarified that she “Changed her vote on rates due to consumers disciplining firms pricing, changing dynamic in labor markets and financial market curve.” However, Mann warned that markets are pricing in too many rate cuts.
On the Eurozone front, investors hope that the European Central Bank (ECB) will start reducing interest rates sooner. ECB policymaker Madis Muller said on Tuesday that “we're closer to a point where ECB can start cutting rates.” Easing wage growth has fuelled the ECB’s rate-cut expectations for the June meeting.
With so many exciting decisions last week, it was easy to overlook the fact that the Aussie held up quite well in the face of renewed US Dollar strength. Economists at Commerzbank analyze AUD outlook.
Exciting days for the Aussie
The new monthly inflation figures will kick things off on Wednesday. The Bloomberg consensus is looking for a slight increase to 3.5% YoY. In my opinion, it is less important whether the final number is 3.4%, 3.5% or 3.3%. The monthly numbers are difficult to interpret anyway, as only part of the overall indicator is updated each month.
In the short term, a downward surprise could put pressure on the Aussie. In the medium term, however, two pieces of information are likely to be more relevant: 1) The quarterly indicator is likely to take another dive in Q1 and settle in the 3.5% range or even slightly below. And 2) the latest data suggest that disinflation has slowed for the time being. This is only logical, as we have seen a similar development in the other G10 countries, and most of the base effects in Australia should now be waning.
This should be an argument for the RBA to maintain its cautious stance. Therefore, even after today's inflation figures, we would be cautious about betting against the Aussie in the medium term. Unless, of course, the figures surprise to the downside. That would change the recent trend, even if it is not our base case.
- Natural Gas prices are soaring by 2% on Tuesday.
- Traders are sending gas prices higher after both Russia and Ukraine attacked gas storage facilities on both sides.
- The US Dollar Index eases further and could soon test 104.00.
Natural Gas (XNG/USD) trades higher on Tuesday after attacks between Ukraine and Russia, targeting both Gas and Oil storage facilities, intensified over the weekend. Meanwhile, in the Middle-East, the understanding between the US and Israel is falling back to a low level after the US abstained from vetoing the ceasefire deal in the UN Security Council. This heightens tensions in both the Middle East and Ukraine, with investors pricing in the possibility of increasing supply disruptions.
Meanwhile, the DXY US Dollar Index is descending for the second day in a row this week. Traders are sending the Greenback lower with some help from the People’s Bank of China (PBoC), which set a stronger Yuan fixing for a second day in a row. Adding to this, markets are doubting that the US Federal Reserve will cut interest rates three times this year after recent inflation numbers pointed to an uptick. The Greenback is also seeing some profit taking after its stellar performance last week.
Natural Gas is trading at $1.87 per MMBtu at the time of writing.
Natural Gas news and market movers: Ukraine attacks intensify
- Missile attacks between Russia and Ukraine are intensifying with Russia targeting energy and Gas storage facilities in the country.
- Petroleum Minister Musadik Malik said, Bloomberg reports, that Pakistan's Prime Minister Shehbaz Sharif is planning to ask the US administration for a sanction waiver for “political and technical” reasons to secure the waivers. Pakistan signed a 25-year deal for a Gas pipeline with Iran.
- Shipbuilder Hanwha Ocean Co. told Bloomberg it might face serious losses after it is unable to find new buyers for specialized vessels built to serve a Russian liquefied natural gas facility that it is now subject to sanctions. The ships are so specific they would only be bought by third parties that will still want to work with the Russian Gas facility.
- Gazprom PJSC reported that it has begun constructing natural Gas lines to integrate the Power of Siberia pipeline with the Far East’s local gas distribution network. This way Siberian gas would soon flow towards China and the broader region.
Natural Gas Technical Analysis: Consolidation breakout
Natural Gas prices are no longer consolidating with a breakout at hand on Tuesday. From a technical perspective, a runup higher should follow suit. With Russia building up further pressure on Ukraine and Israel feeling left behind by the US, supply risk increases, with a quick rally to $2.00 possible.
On the upside, the key $2.00 level needs to be regained first, with the 55-day Simple Moving Average (SMA) coming in as well. The next key mark is the historic pivotal point at $2.13. Should Gas prices pop up in that region, a broad area opens up with the first cap at the red descending trend line near $2.21.
On the downside, multi-year lows are still nearby with $1.65 as the first line in the sand. This year’s low at $1.60 needs to be kept an eye on as well. Once a new low for the year is printed, traders should look at $1.53 as the next supportive area.
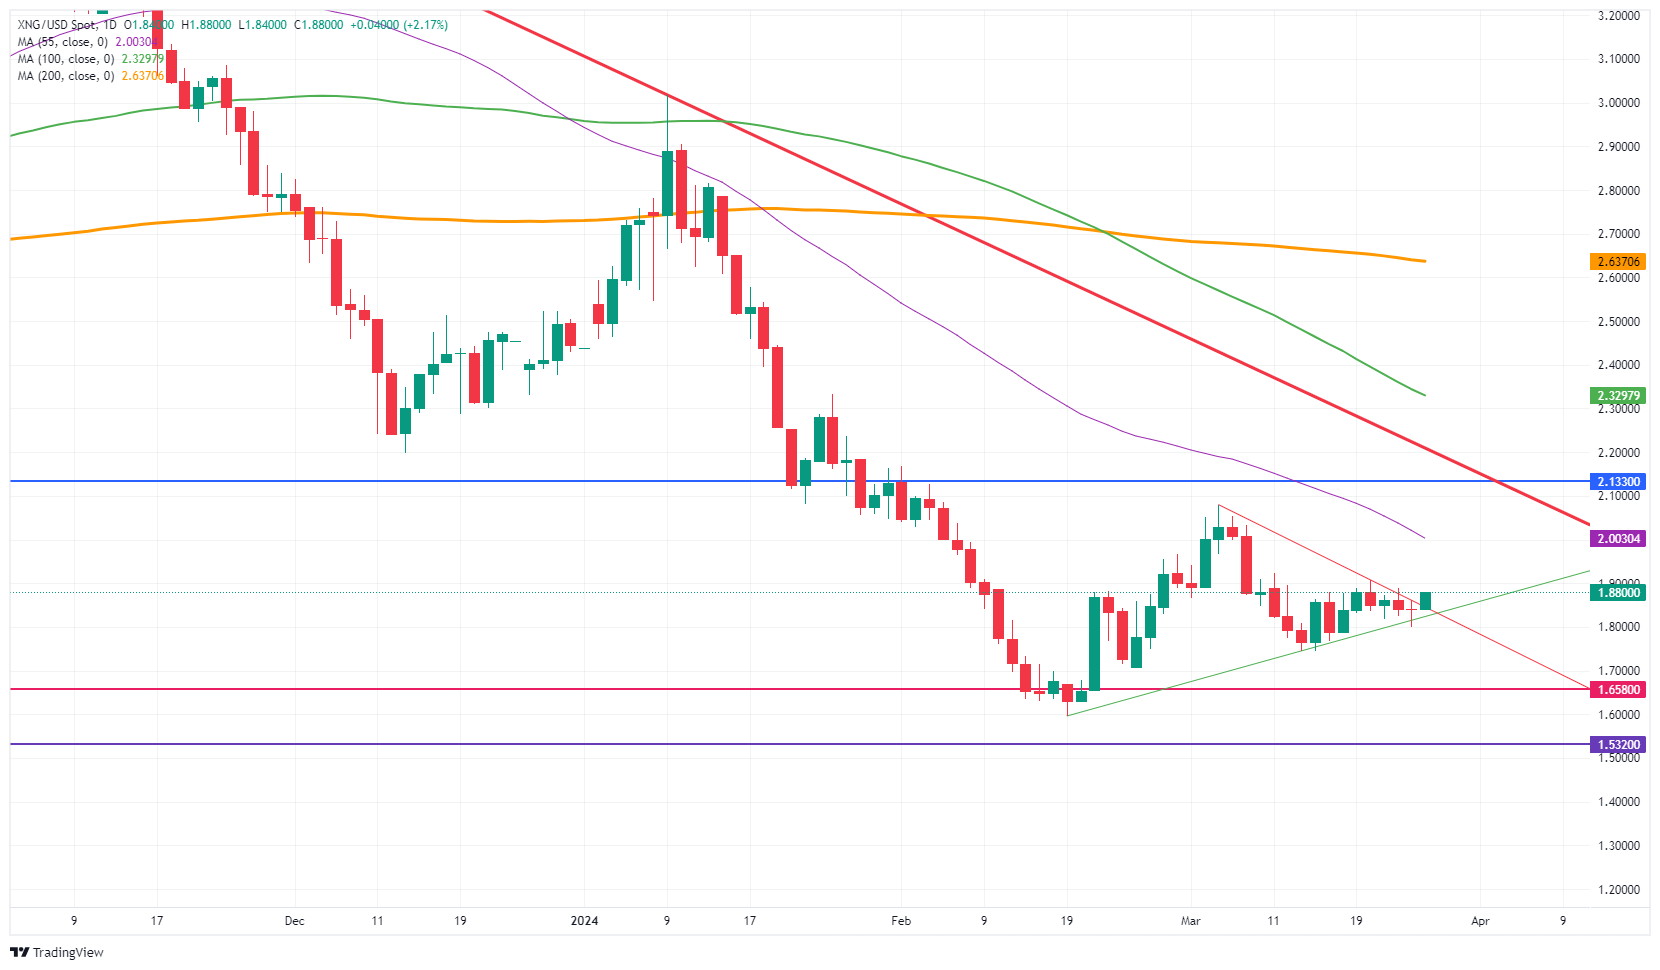
Natural Gas: Daily Chart
Natural Gas FAQs
Supply and demand dynamics are a key factor influencing Natural Gas prices, and are themselves influenced by global economic growth, industrial activity, population growth, production levels, and inventories. The weather impacts Natural Gas prices because more Gas is used during cold winters and hot summers for heating and cooling. Competition from other energy sources impacts prices as consumers may switch to cheaper sources. Geopolitical events are factors as exemplified by the war in Ukraine. Government policies relating to extraction, transportation, and environmental issues also impact prices.
The main economic release influencing Natural Gas prices is the weekly inventory bulletin from the Energy Information Administration (EIA), a US government agency that produces US gas market data. The EIA Gas bulletin usually comes out on Thursday at 14:30 GMT, a day after the EIA publishes its weekly Oil bulletin. Economic data from large consumers of Natural Gas can impact supply and demand, the largest of which include China, Germany and Japan. Natural Gas is primarily priced and traded in US Dollars, thus economic releases impacting the US Dollar are also factors.
The US Dollar is the world’s reserve currency and most commodities, including Natural Gas are priced and traded on international markets in US Dollars. As such, the value of the US Dollar is a factor in the price of Natural Gas, because if the Dollar strengthens it means less Dollars are required to buy the same volume of Gas (the price falls), and vice versa if USD strengthens.
- Gold price climbs to $2,190 as the US Dollar drops with eyes on US core PCE inflation data.
- The Fed remains confident that inflation is broadly easing despite recent hot readings.
- The US yields fall as expectations for the Fed lowering interest rates from June rebound.
Gold price (XAU/USD) jumps above a two-day high near $2,190 in Tuesday’s European session as the US Dollar corrects. The US Dollar faces downward pressure as Federal Reserve (Fed) policymakers seem to be growing confident about easing price pressures, foreseeing three interest-rate cuts this year despite hot inflation readings in January and February.
Investors look for fresh cues about the inflation outlook to know when the Federal Reserve will start reducing interest rates. The market participants will keenly focus on the United States core Personal Consumption Expenditure price index (PCE) data for February, which will be published on Friday.
Evidence of easing price pressures could strengthen Gold prices as it will diminish hopes for the Fed to keep interest rates higher for a longer period. However, stubborn inflation data will negatively impact the Gold price as it will increase the opportunity cost of investing in it. Instead, investors could opt for interest-bearing assets such as bonds, whose appeal would increase due to higher yields. At the press time, 10-year US Treasury yields drop to 4.24% on firm expectations that the Fed will start reducing interest rates from June.
Daily digest market movers: Gold price advances as US Dollar corrects
- Gold price rises to $2,190, capitalizing on a modest correction in the US Dollar. The precious metal jumps higher as Federal Reserve policymakers look set to lower interest rates in June amid increasing evidence that inflation is moving in the right direction. The US Dollar Index (DXY), which measures the US Dollar’s value against six major currencies, falls from a one-month high of 104.50 to 104.10.
- The Fed is confident about easing inflationary pressures even though price pressures turned out hotter than expected in the first two months of 2024. Fed Governor Lisa Cook said in an event hosted by Harvard University on Monday, "Although housing-services inflation remains quite high, the current low rate of increase on new rental leases suggests that it will continue to fall." Cook endorsed a cautious approach when asked about monetary policy easing.
- Separately, Chicago Fed Bank President Austan Goolsbee said in an interview with Yahoo Finance on Monday that the inflation situation is uncertain due to higher housing inflation. However, he is confident that the fundamental story of inflation returning to the 2% target has not changed.
- Last week, the Fed stuck with projections of reducing interest rates three times this year. This has reinforced market expectations for the Fed to cut interest rates from the June policy meeting. According to the CME FedWatch tool, there is an almost 70% chance that a rate cut will be announced in June. The chances were at 60% last week before the Fed’s policy announcement. Increased Fed rate cut expectations have kept the downside in the Gold price limited.
- This week, investors will shift focus to the core PCE price index data for February to know more about Fed rate-cut timing. The annual core PCE reading is anticipated to have grown steadily by 2.8%. The monthly inflation data is expected to have risen by 0.3%, slower than the 0.4% increase seen in January.
Technical Analysis: Gold price finds support near $2,160
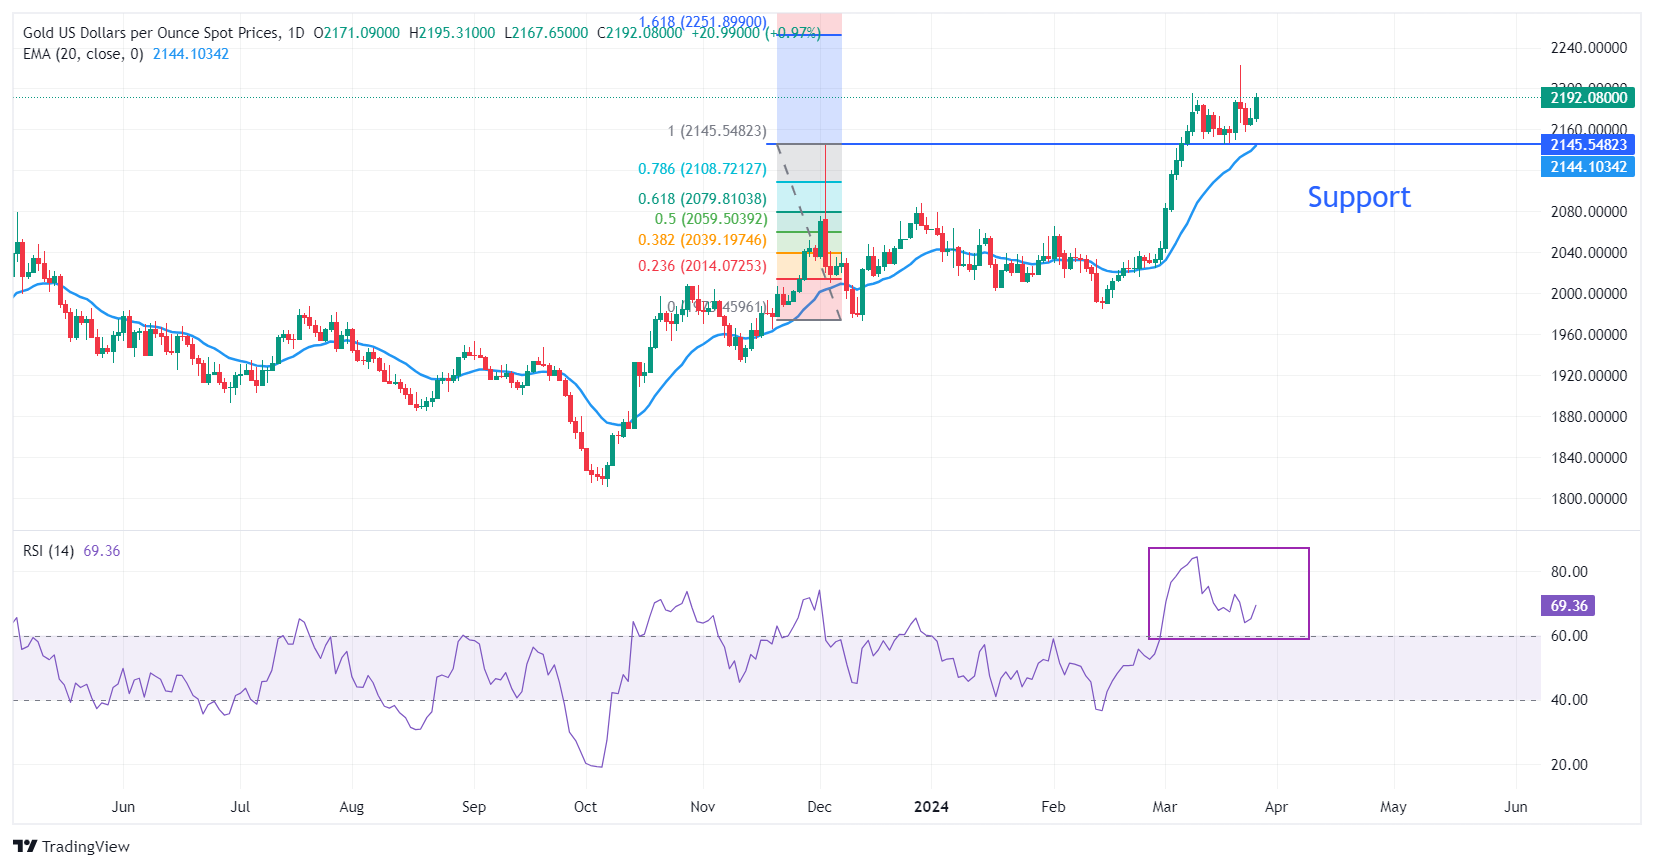
Gold price recovers to $2,190 as momentum oscillators rebound. The 14-period Relative Strength Index (RSI) edges up after dropping to 64.00. Last week, the Gold price corrected sharply from all-time highs of $2,223 as oscillators showed extremely overbought signals.
The near-term demand for the Gold price is bullish as the 20-day Exponential Moving Average (EMA) at $2,145 is sloping higher.
On the upside, the Gold price could face resistance near the 161.8% Fibonacci extension level at $2,250. The Fibonacci tool is plotted from December 4 high at $2,144.48 to December 13 low at $1,973.13. On the downside, December 4 high at $2,144.48 will likely support the Gold price bulls.
Gold FAQs
Gold has played a key role in human’s history as it has been widely used as a store of value and medium of exchange. Currently, apart from its shine and usage for jewelry, the precious metal is widely seen as a safe-haven asset, meaning that it is considered a good investment during turbulent times. Gold is also widely seen as a hedge against inflation and against depreciating currencies as it doesn’t rely on any specific issuer or government.
Central banks are the biggest Gold holders. In their aim to support their currencies in turbulent times, central banks tend to diversify their reserves and buy Gold to improve the perceived strength of the economy and the currency. High Gold reserves can be a source of trust for a country’s solvency. Central banks added 1,136 tonnes of Gold worth around $70 billion to their reserves in 2022, according to data from the World Gold Council. This is the highest yearly purchase since records began. Central banks from emerging economies such as China, India and Turkey are quickly increasing their Gold reserves.
Gold has an inverse correlation with the US Dollar and US Treasuries, which are both major reserve and safe-haven assets. When the Dollar depreciates, Gold tends to rise, enabling investors and central banks to diversify their assets in turbulent times. Gold is also inversely correlated with risk assets. A rally in the stock market tends to weaken Gold price, while sell-offs in riskier markets tend to favor the precious metal.
The price can move due to a wide range of factors. Geopolitical instability or fears of a deep recession can quickly make Gold price escalate due to its safe-haven status. As a yield-less asset, Gold tends to rise with lower interest rates, while higher cost of money usually weighs down on the yellow metal. Still, most moves depend on how the US Dollar (USD) behaves as the asset is priced in dollars (XAU/USD). A strong Dollar tends to keep the price of Gold controlled, whereas a weaker Dollar is likely to push Gold prices up.
The Japanese Yen (JPY) is likely to recover in 2024 while the Swiss Franc (CHF) is likely to extend its year-to-date weakness, economists at HSBC say.
SNB surprisingly cut its rate
Looking beyond the near-term reaction, we think the US-Japan yield differential is set to narrow, this, among other factors, should provide support for the JPY.
The Swiss National Bank (SNB) delivered a dovish surprise on 21 March with a 25 bps rate cut. After the announcement, the CHF extended its year-to-date weakness. Being the first G10 central bank to cut is likely to undermine the currency, as markets may fund carry trades out of CHF in a world of low FX volatility.
- USD/CAD is moving lower within an ascending channel after almost touching the highs.
- The MACD has crossed its signal line, giving a sell signal.
- Heavy support lies at 1.3500 from a confluence of major moving averages.
USD/CAD is in a steady short-term uptrend, with the exchange rate rising within an ascending channel.
The pair recently reached the vicinity of the upper borderline of the channel before rolling over and beginning a decline. Its descent continues.
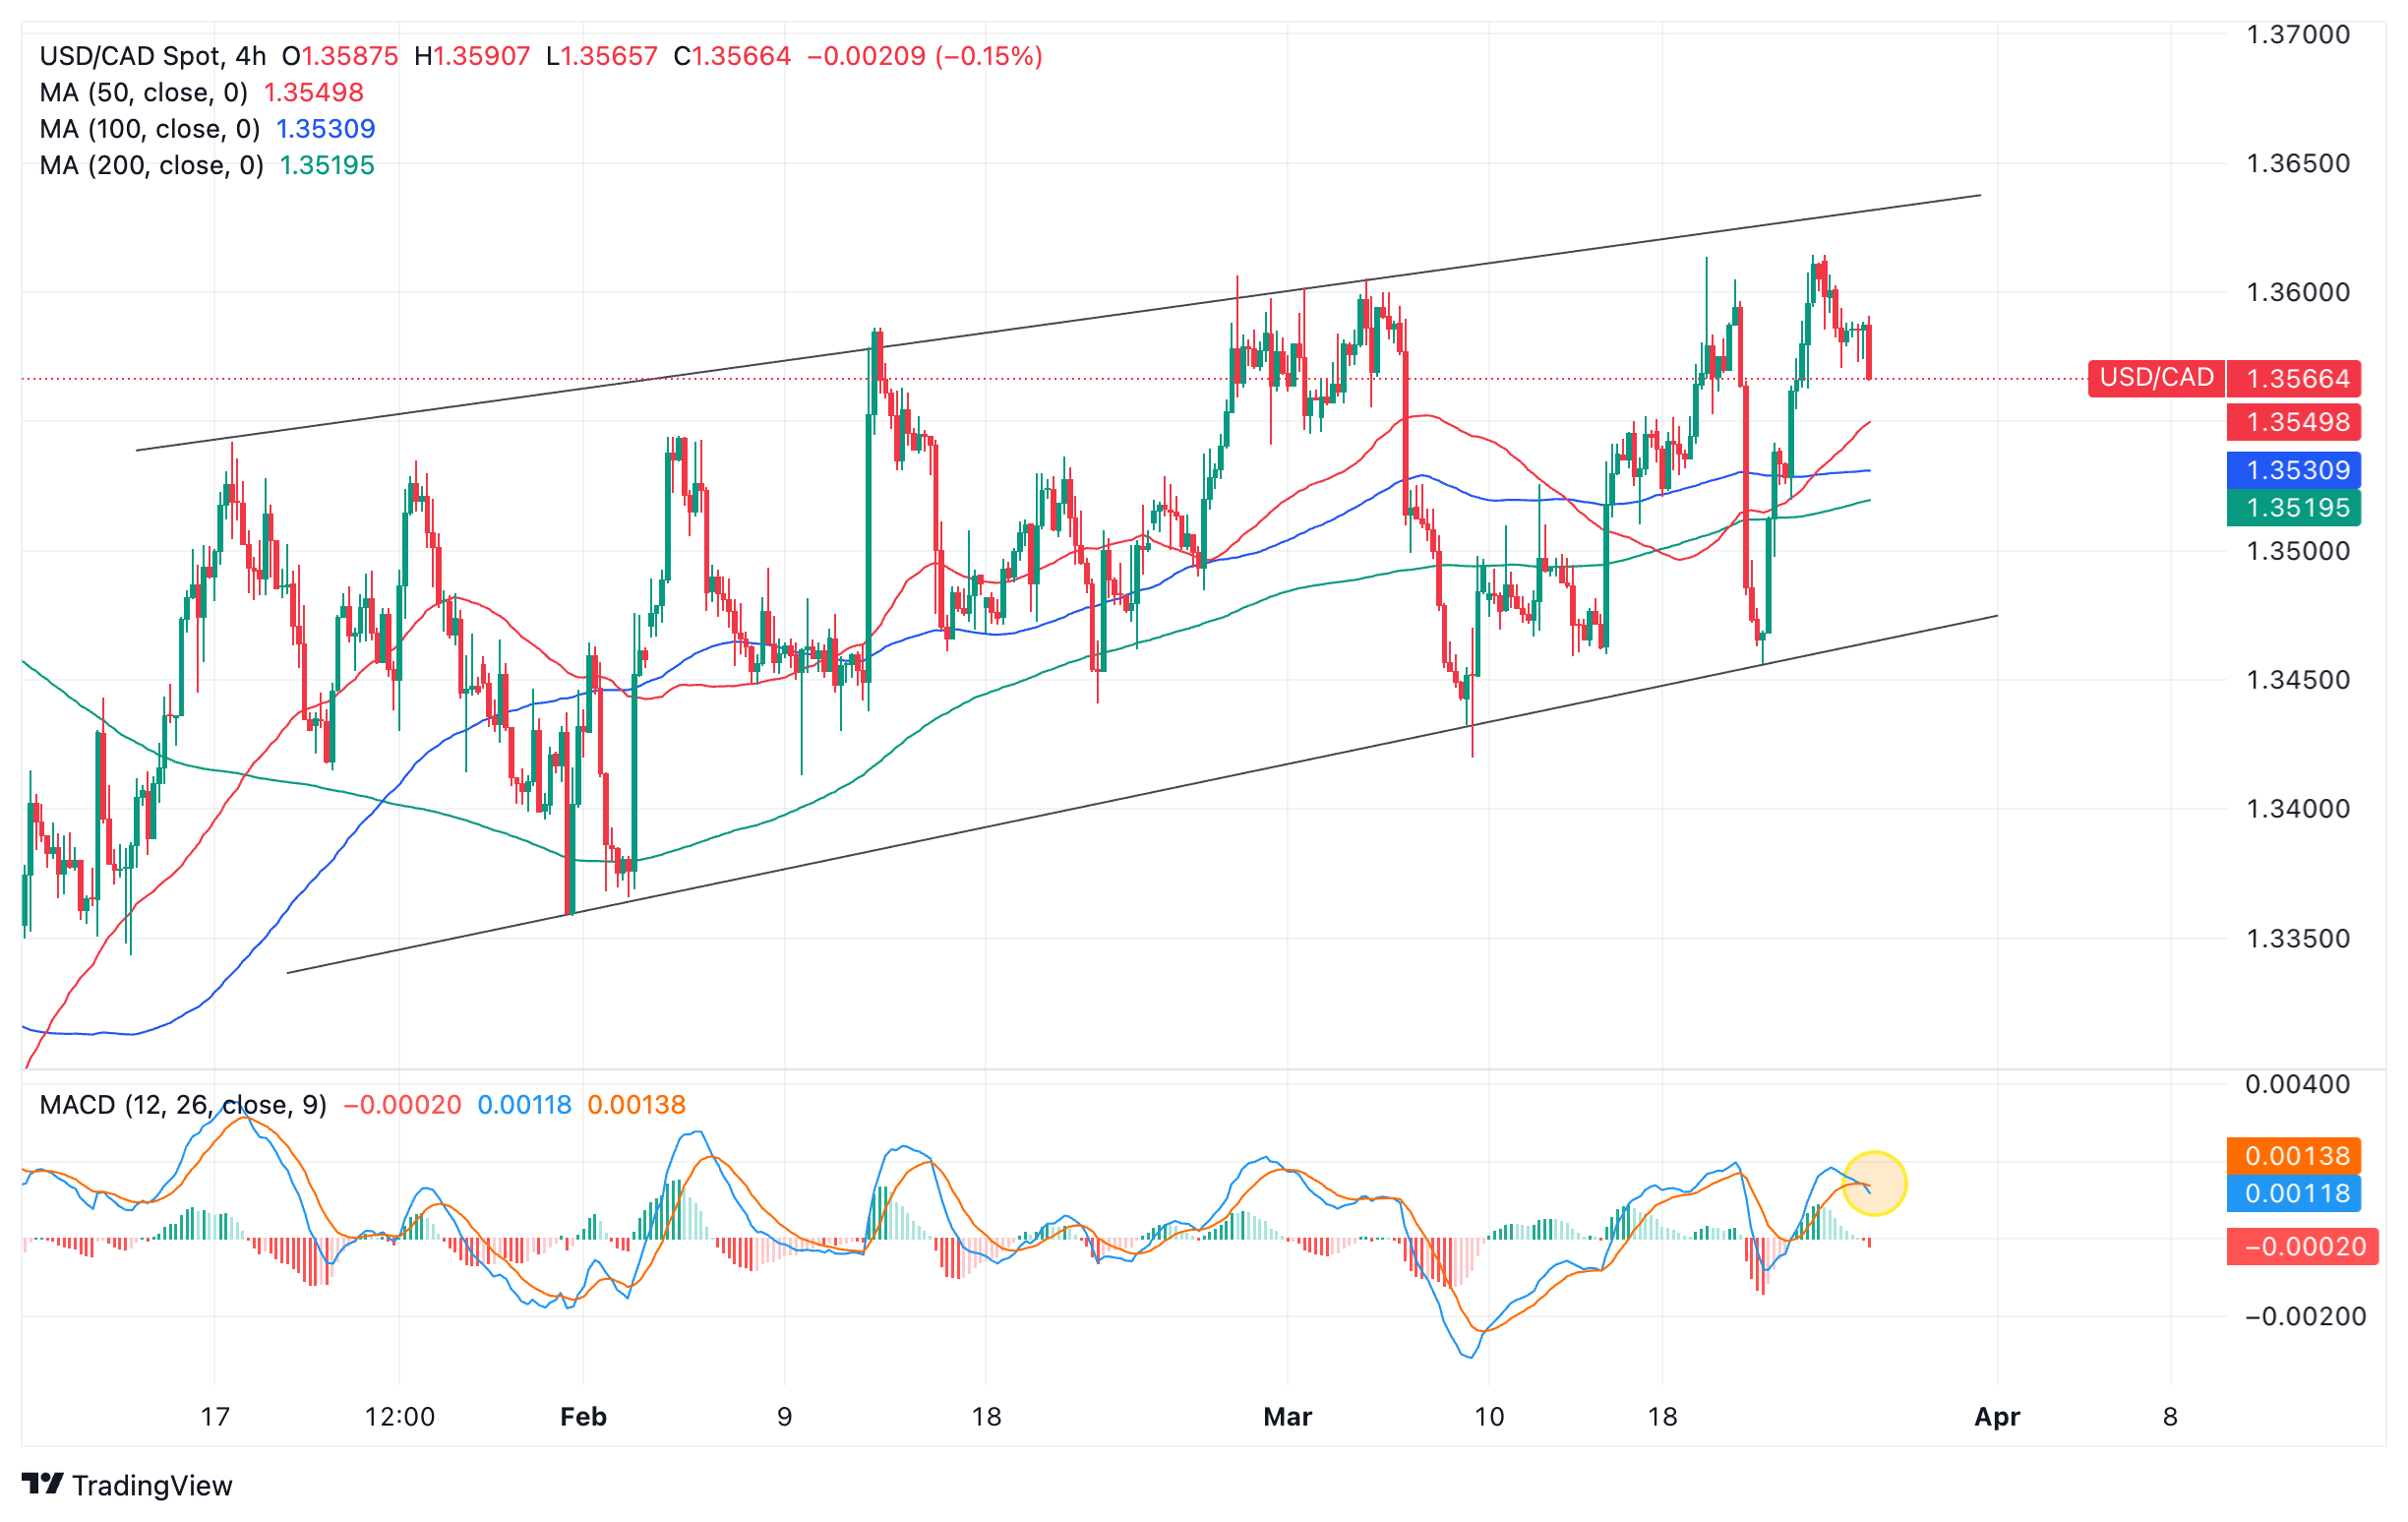
US Dollar to Canadian Dollar: 4-hour chart
The reversal lower is supported by a bearish crossover of the Moving Average Convergence/ Divergence (MACD) indicator, providing a corresponding sell signal (circled). The MACD is especially reliable at marking turns within a range or channeling market environment.
Despite the strength of the latest up leg and the overall bullish bias, price is moving lower as bears take over.
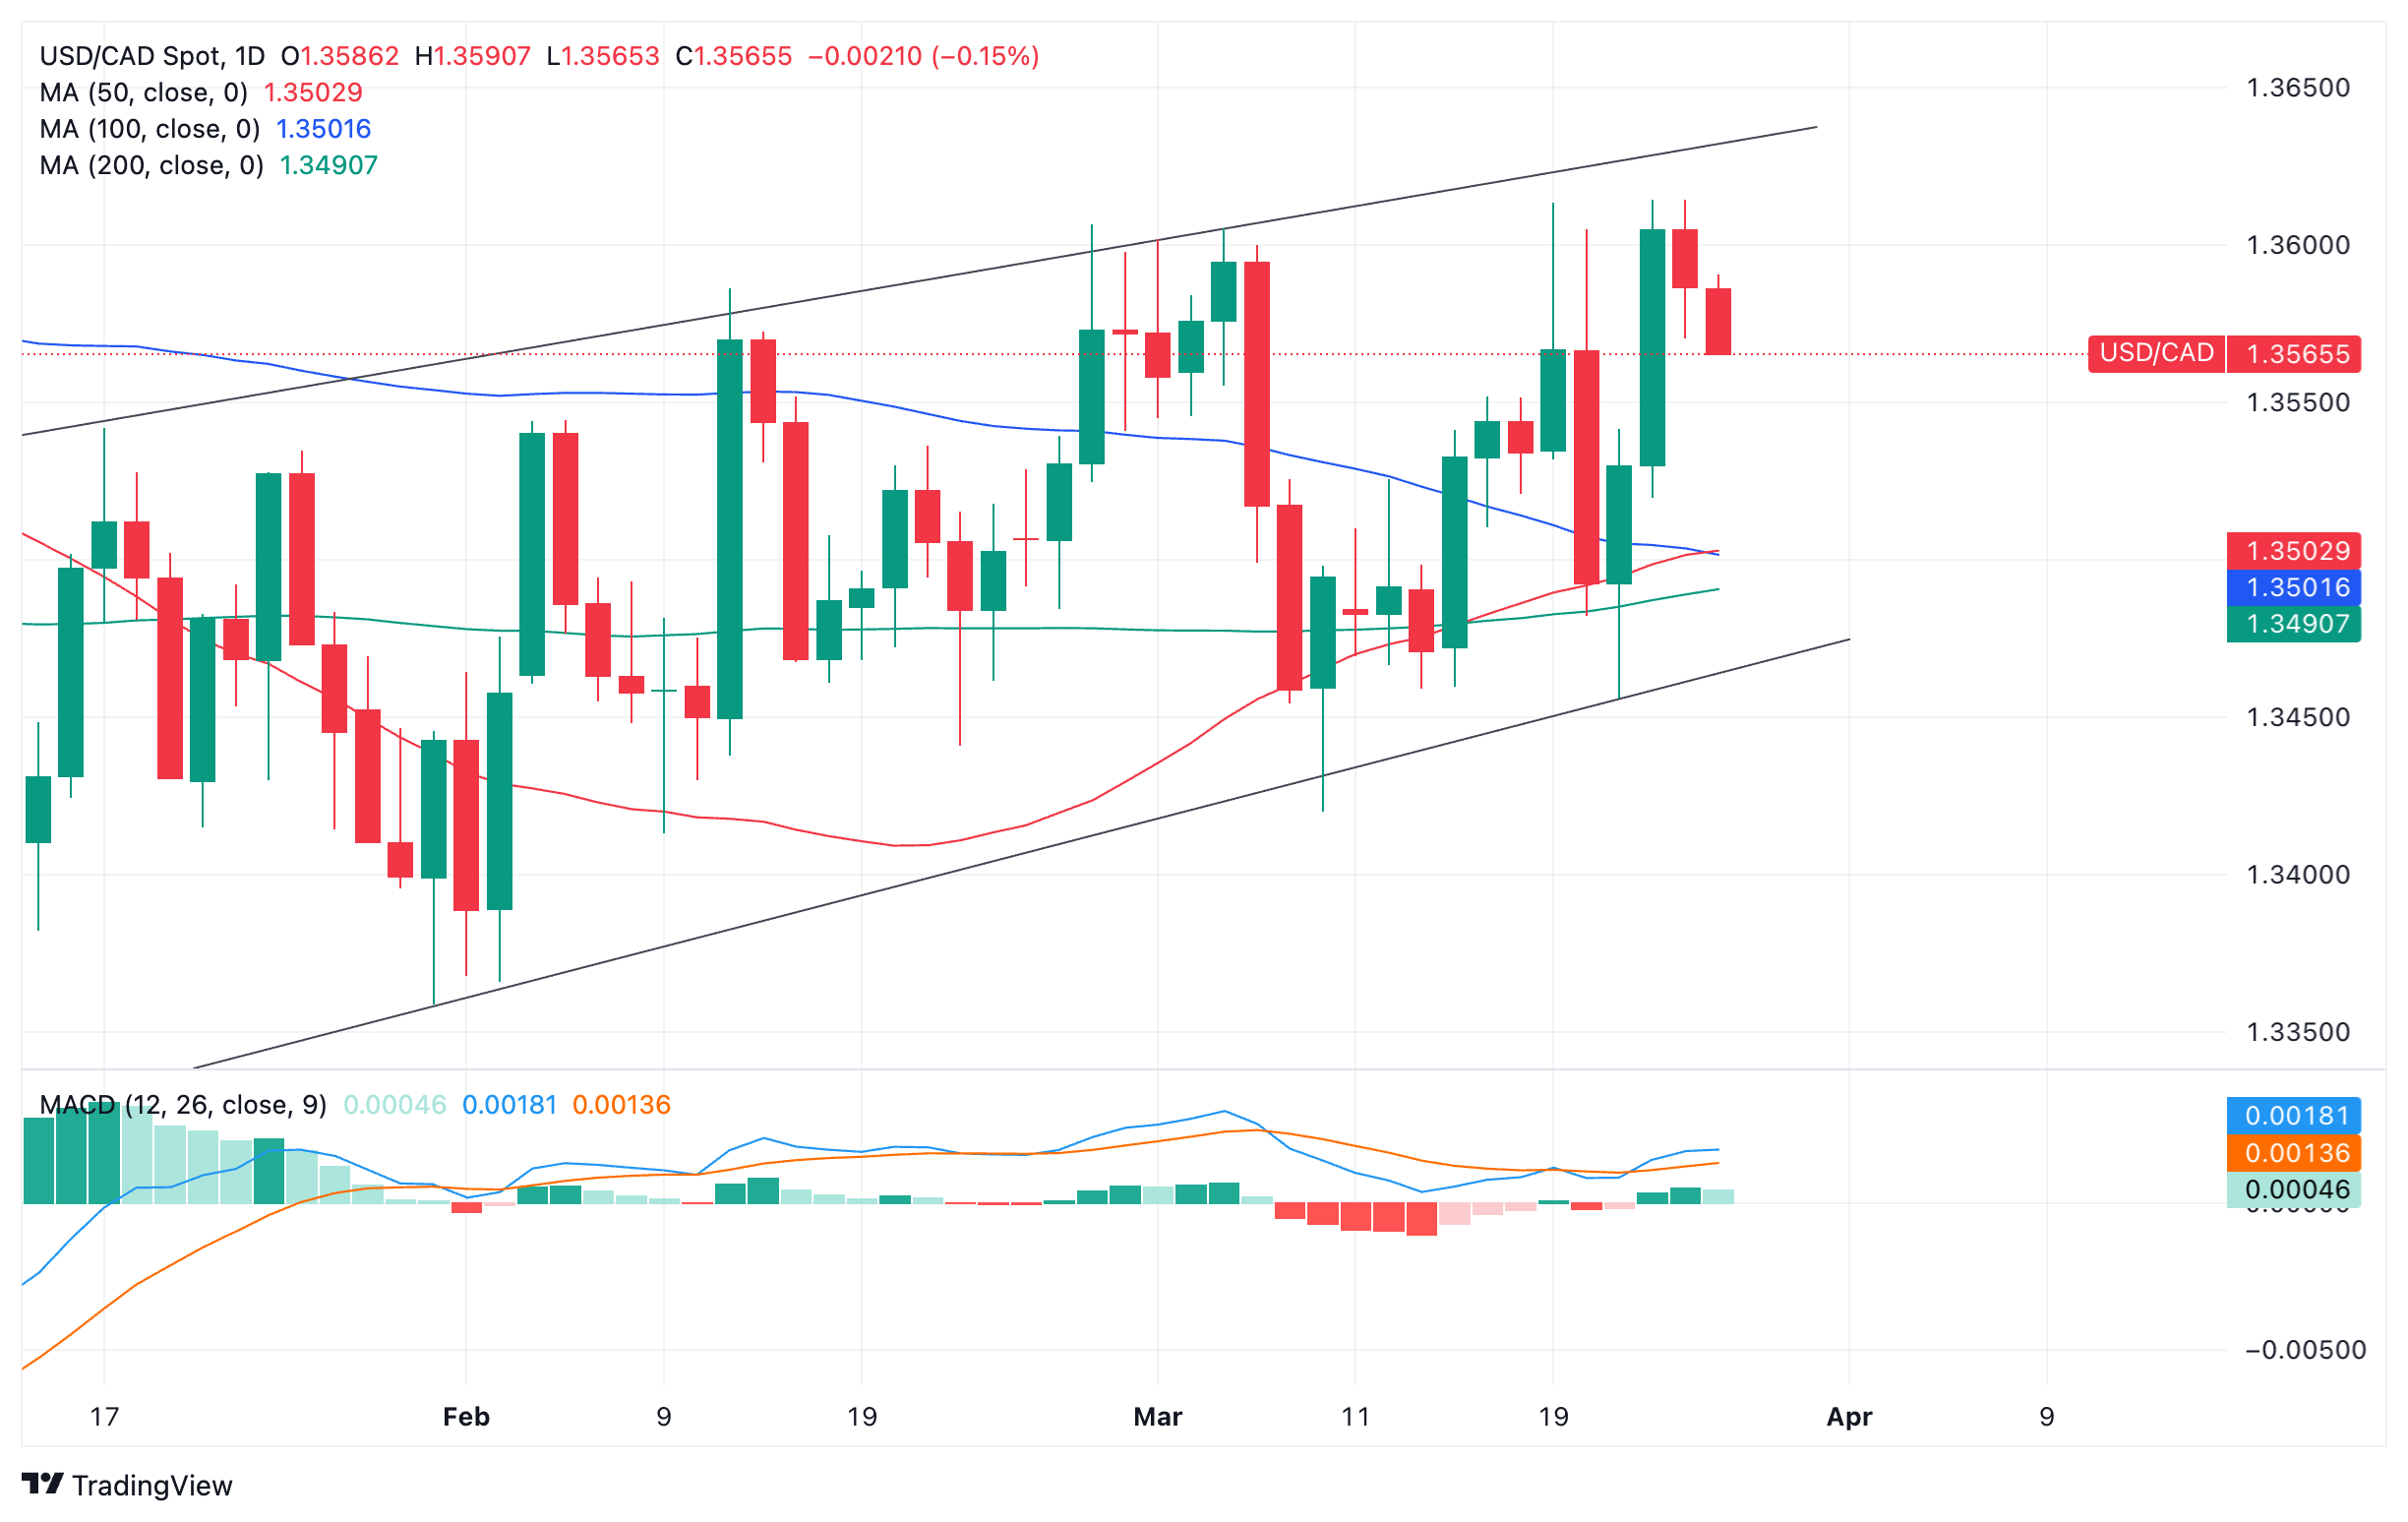
US Dollar to Canadian Dollar: Daily chart
It is quite possible USD/CAD will continue falling to a confluence of two major moving averages – the 50-day and 100-day Simple Moving Averages (SMA) situated at around 1.3500.
- The New Zealand Dollar rises on positive risk appetite.
- Risky assets rise on hopes of central banks cutting interest rates.
- The RBNZ has not committed to cutting rates, however, as inflation remains high despite slow growth.
The New Zealand Dollar (NZD) is trading higher in its most traded pairs on Tuesday as markets adopt a positive risk tone, benefiting commodity currencies like the New Zealand Dollar over safe havens.
European Stocks are mostly higher on hopes it will not be long before the European Central Bank (ECB) cuts interest rates, thereby cheapening credit.
The German DAX, British FTSE 100, Italian IT40 and Spanish IBEX are all showing gains, with only the French CAC40 down, after data showed a wider-than-expected 5.5% French government budget deficit in 2023, according to data from the statistics office INSEE.
New Zealand Dollar suffers from negative fundamentals
Despite this recent uptick, the New Zealand Dollar is under pressure from bearish fundamentals.
Recent data showed the New Zealand economy fell into a technical recession in the fourth quarter of 2024, whilst headline inflation remained relatively high at 4.7% during the same reporting period, even if it fell from the 5.6% recorded in Q3.
Despite weak growth, the Reserve Bank of New Zealand (RBNZ) does not envision itself cutting interest rates due to high inflation. Elevated price growth is partly a result of structural issues such as a tight labor market, which in turn keeps wage inflation high.
In a speech about monetary policy at a Chartered Accountants’ event on Tuesday, RBNZ Chief Economist Paul Conway reiterated the bank's core message that interest rates would have to remain high for some time yet in order to bring down inflation.
“Interest rates need to remain at a restrictive level for a sustained period of time to meet our inflation objective,” said the notes from the speech, repeating the RBNZ’s official line.
Technical Analysis: New Zealand Dollar pulls back in downtrend
NZD/USD – the number of US Dollars one New Zealand Dollar can buy – continues pulling back within a short-term downtrend.
The pair recently broke out of a Wedge pattern and is forecast to continue falling until it reaches the conservative target for the pattern.
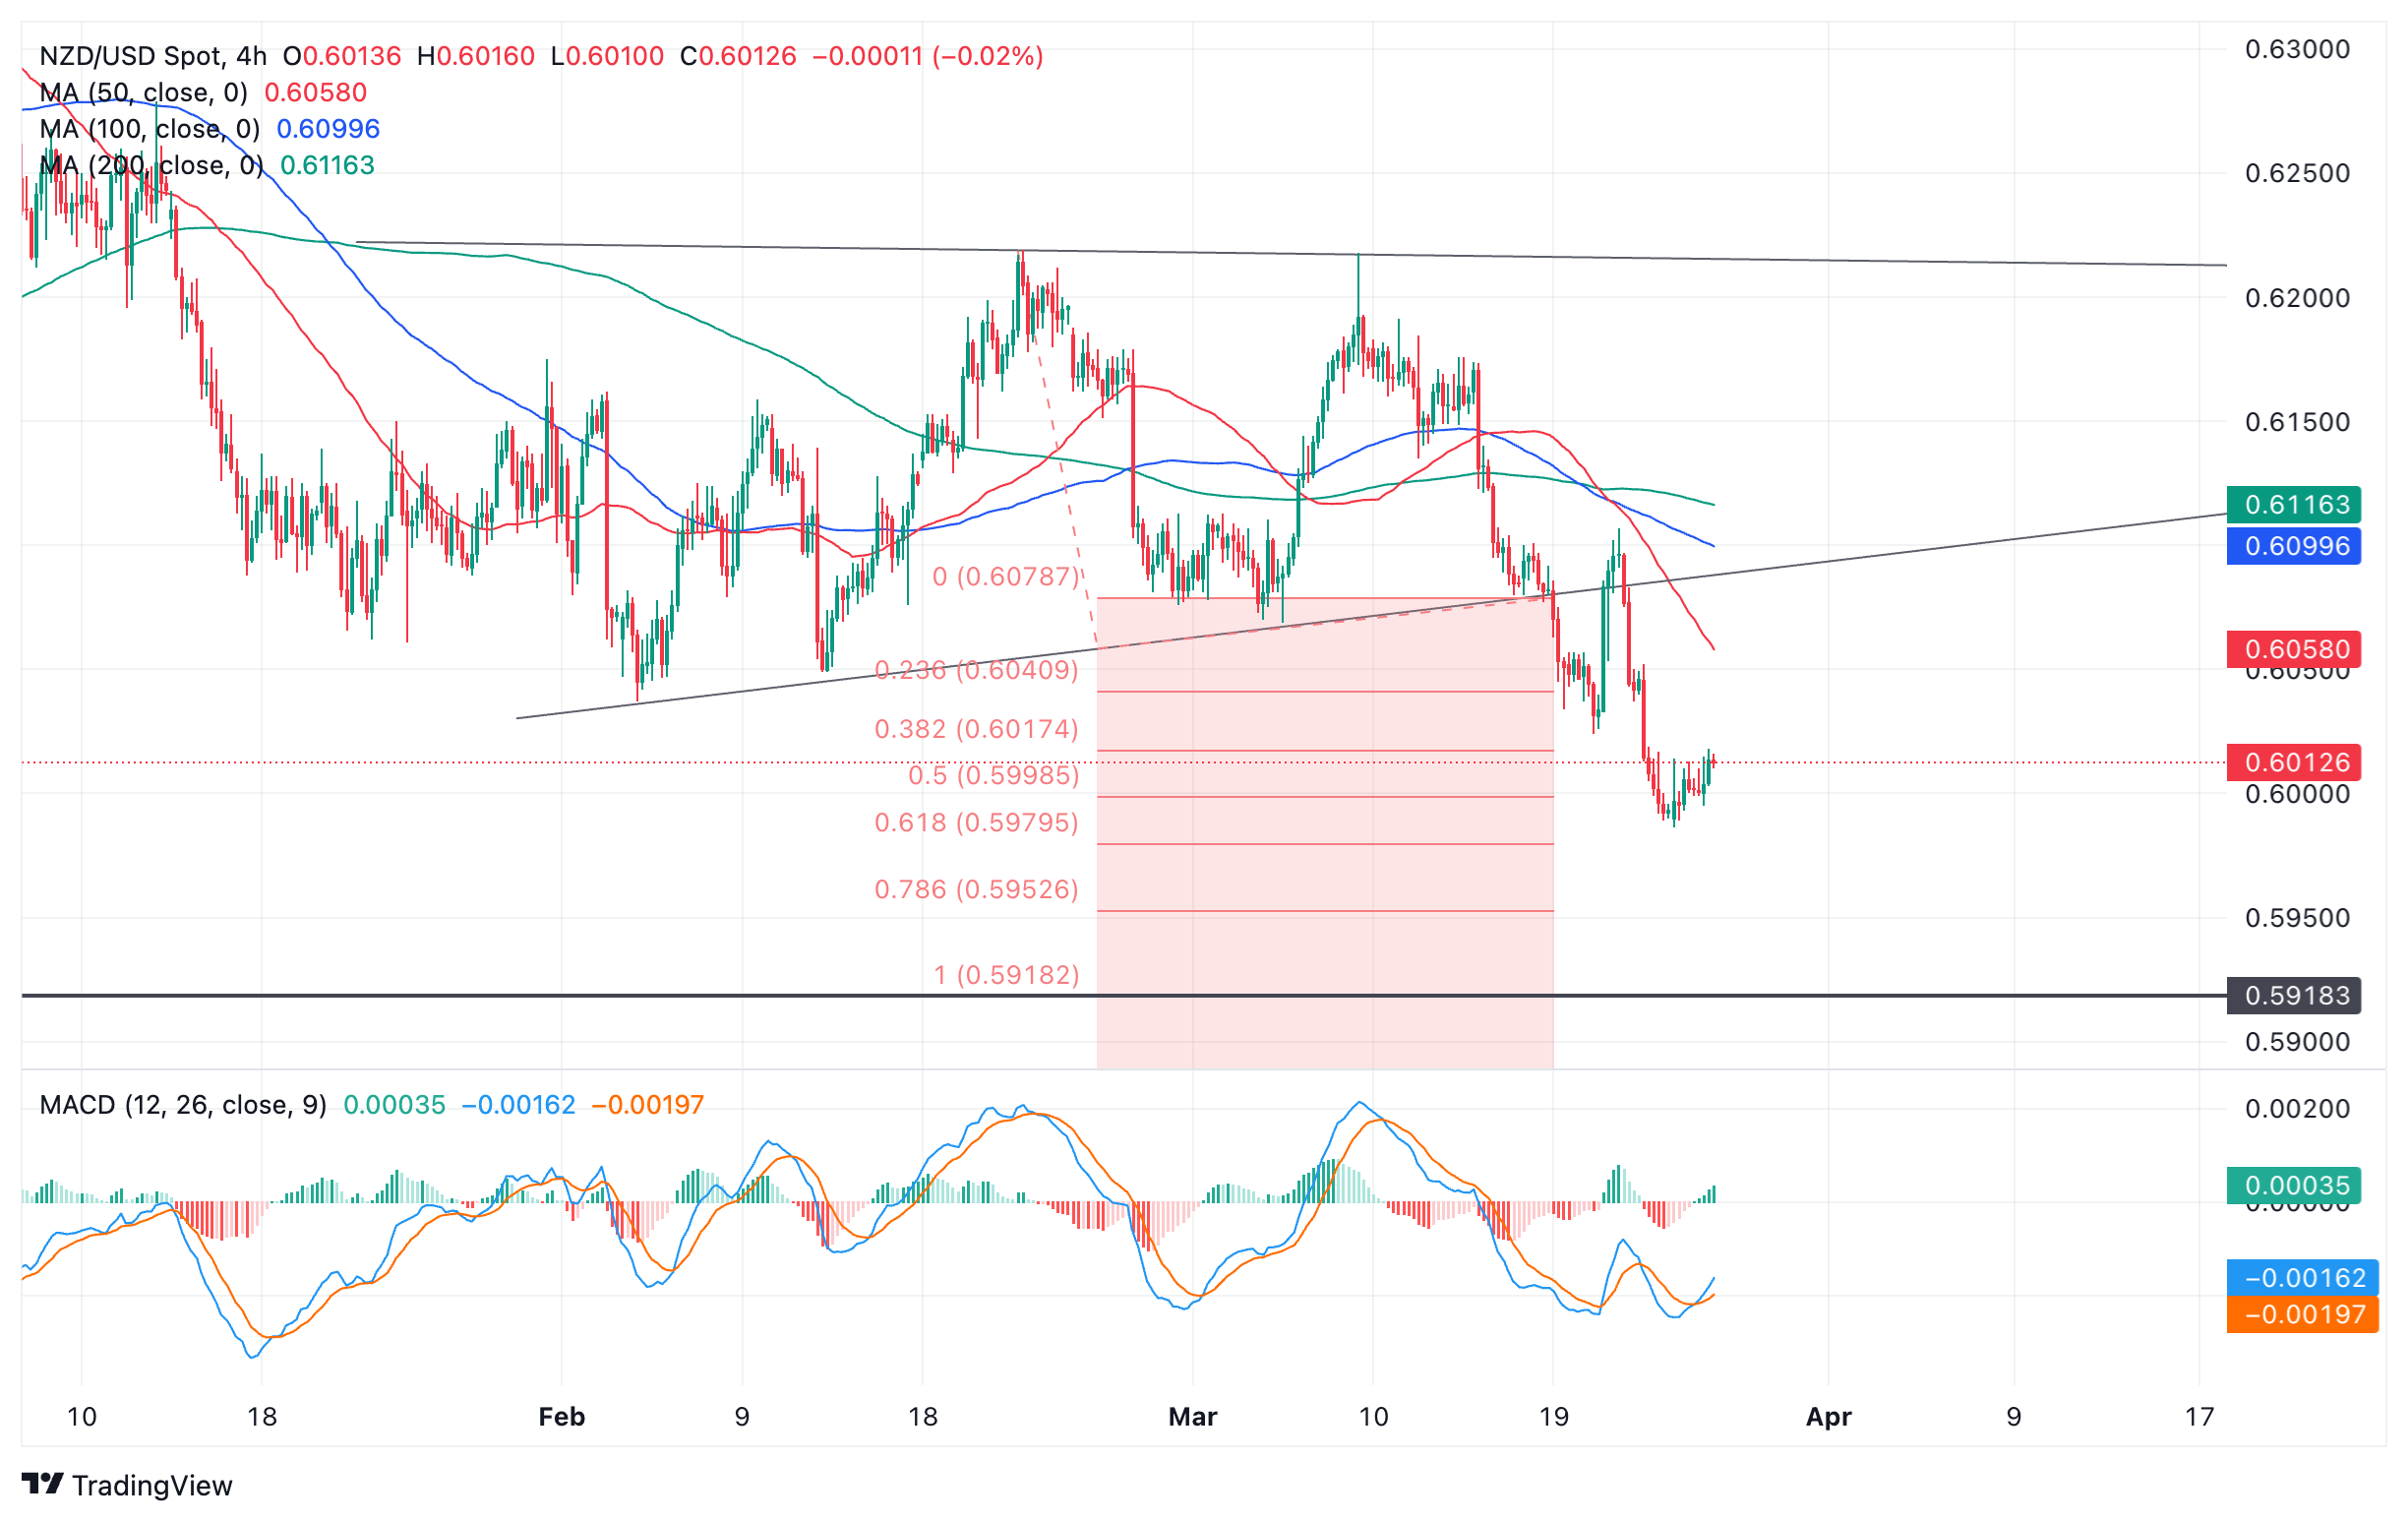
New Zealand Dollar versus US Dollar: 4-hour chart
According to technical analysis theory, the target lies at a distance equivalent to the height of the wedge extrapolated lower. In the case of NZD/USD it suggests more downside to a conservative target at 0.5964, the 0.618 Fibonacci ratio of the height of the pattern extrapolated from the breakout point lower. The full ratio (1.000) provides a further target at 0.5892.
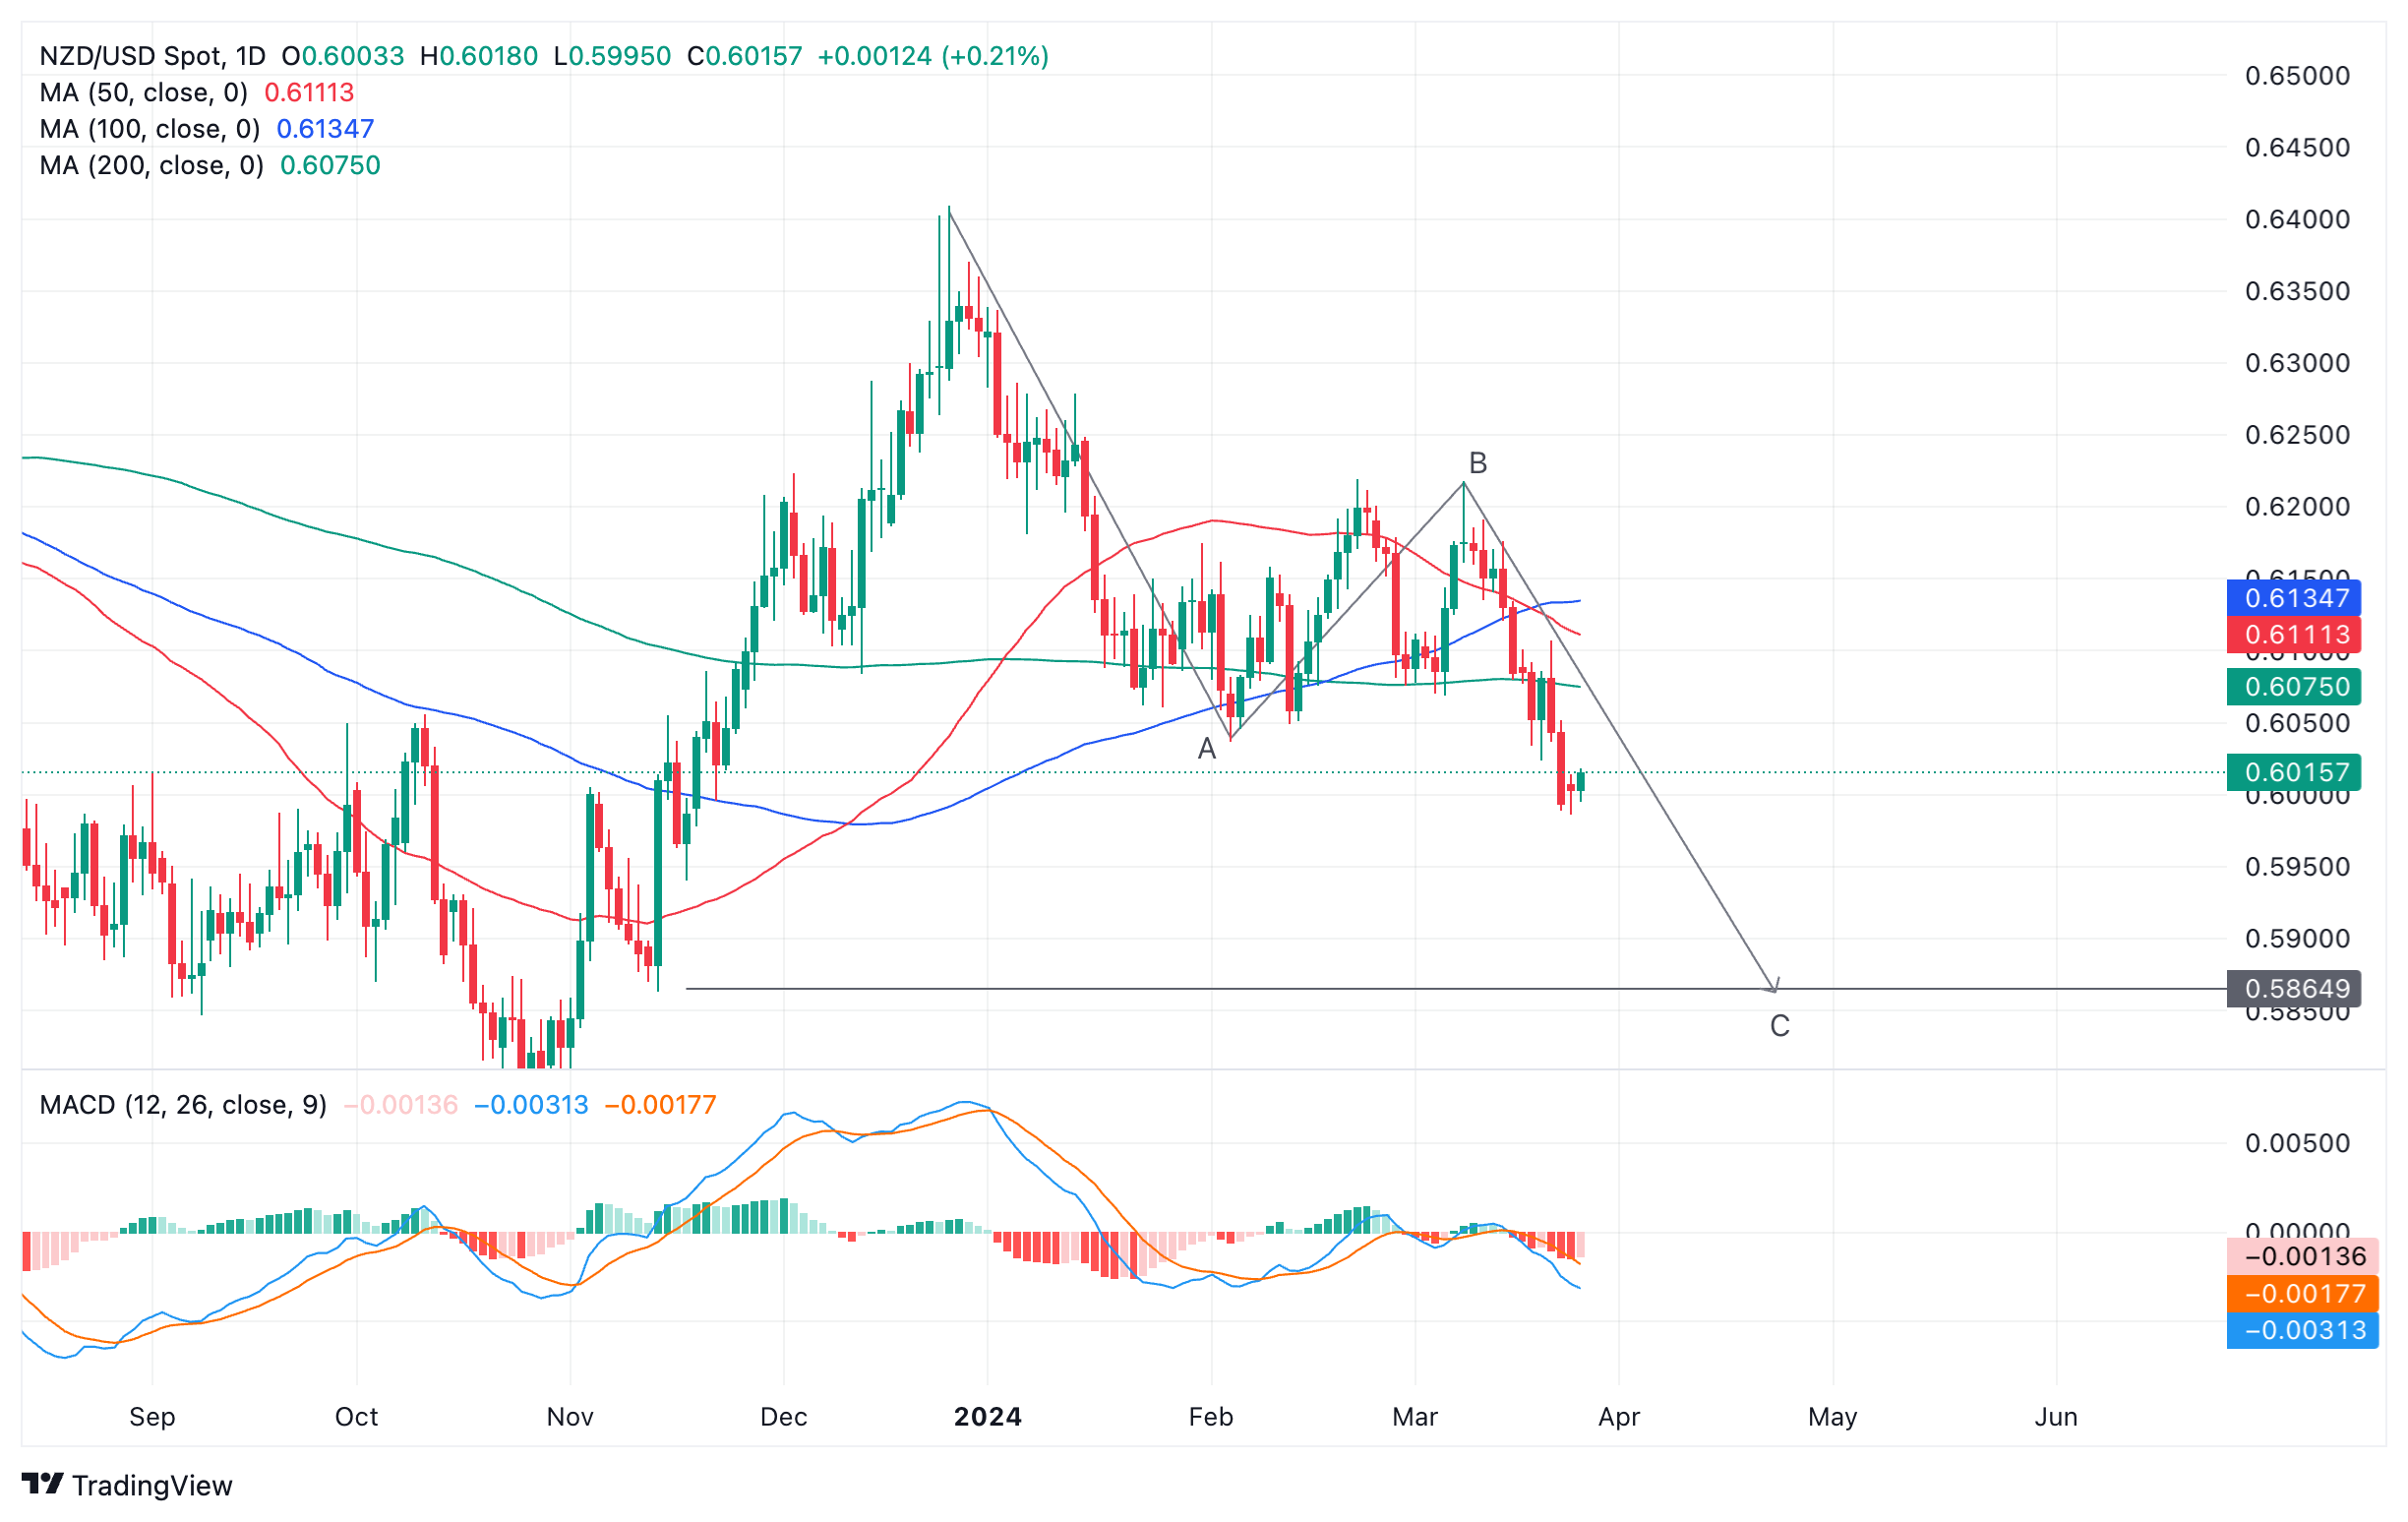
New Zealand Dollar versus US Dollar: Daily chart
Adding to the bearish outlook is the possible formation of an ABC pattern or Measured Move on the daily chart.
If so, NZD/USD could be unfolding in the final wave C of the pattern, which could stretch to a long-term target at 0.5864, where wave C is equal to wave A.
Only a break above the 0.6107 March 21 high would bring into doubt the bearish bias.
New Zealand Dollar FAQs
The New Zealand Dollar (NZD), also known as the Kiwi, is a well-known traded currency among investors. Its value is broadly determined by the health of the New Zealand economy and the country’s central bank policy. Still, there are some unique particularities that also can make NZD move. The performance of the Chinese economy tends to move the Kiwi because China is New Zealand’s biggest trading partner. Bad news for the Chinese economy likely means less New Zealand exports to the country, hitting the economy and thus its currency. Another factor moving NZD is dairy prices as the dairy industry is New Zealand’s main export. High dairy prices boost export income, contributing positively to the economy and thus to the NZD.
The Reserve Bank of New Zealand (RBNZ) aims to achieve and maintain an inflation rate between 1% and 3% over the medium term, with a focus to keep it near the 2% mid-point. To this end, the bank sets an appropriate level of interest rates. When inflation is too high, the RBNZ will increase interest rates to cool the economy, but the move will also make bond yields higher, increasing investors’ appeal to invest in the country and thus boosting NZD. On the contrary, lower interest rates tend to weaken NZD. The so-called rate differential, or how rates in New Zealand are or are expected to be compared to the ones set by the US Federal Reserve, can also play a key role in moving the NZD/USD pair.
Macroeconomic data releases in New Zealand are key to assess the state of the economy and can impact the New Zealand Dollar’s (NZD) valuation. A strong economy, based on high economic growth, low unemployment and high confidence is good for NZD. High economic growth attracts foreign investment and may encourage the Reserve Bank of New Zealand to increase interest rates, if this economic strength comes together with elevated inflation. Conversely, if economic data is weak, NZD is likely to depreciate.
The New Zealand Dollar (NZD) tends to strengthen during risk-on periods, or when investors perceive that broader market risks are low and are optimistic about growth. This tends to lead to a more favorable outlook for commodities and so-called ‘commodity currencies’ such as the Kiwi. Conversely, NZD tends to weaken at times of market turbulence or economic uncertainty as investors tend to sell higher-risk assets and flee to the more-stable safe havens.
AUD/USD is directionless just under its 200-Day Moving Average of 0.6551. Economists at BBH analyze the pair’s outlook.
Australia’s Westpac/Melbourne Institute Consumer Sentiment Index fell in March
AUD/USD will likely remain heavy as iron ore prices are under renewed downside pressure.
Moreover, Australia’s Westpac Melbourne Institute Consumer Sentiment Index fell 1.8% to 84.4 in March, suggesting consumers are more concerned about the near-term economic outlook. The data validates the RBA’s concern about weak household consumption growth and supports money market pricing for 50 bps of rate cut this year.
In his meeting with the Us Executive on Tuesday, China Foreign Minister Wang Yi said that “the crux of China-US relations lies in the US’ position of China as the most important strategic competitor and the most important geopolitical challenge.”
“This has led to problems in bilateral relations,” Wang added.
Additional quotes
This has also led to the failure to translate the commitments made by US leaders into concrete actions.
Situation is not in the interests of the people of the two countries, does not meet expectations of the international community.
US should work with China in the same direction, enhance mutual understanding through face-to-face exchanges, and promote stabilization, improvement and progress of bilateral relations.
Market reaction
AUD/USD is holding higher ground at around 0.6550 following the above comments, adding 0.21% so far.
EUR/GBP was close to unchanged on the day in Monday's session. Economists at ING analyze Pound Sterling’s outlook.
Some speculation on a May cut
The GBP swap curve has recorded a moderate hawkish repricing since the start of the week, although it continues to signal a 25% implied probability of a rate cut by the Bank of England at the May meeting. That is a higher expected chance than for the Fed (also May), and the ECB (April).
When looking at the pricing for December, this is now very similar for the BoE (-76 bps) and the Fed (-80 bps), while ECB expectations remain more dovish (-97 bps). In our view, however, markets are expecting too much easing in the eurozone. We expect 75 bps. Meanwhile, we see the BoE cutting by 100 bps and the Fed by 125 bps by year-end.
Since we forecast the USD decline to start materialising in the coming weeks, we see GBP/USD being supported. However, EUR/GBP, which is a mirror of the BoE-ECB rate expectation gap, may not re-explore the low 0.8500’s seen in February and early March.
European Central Bank (ECB) policymaker Madis Muller said on Tuesday that “we're closer to a point where ECB can start cutting rates.”
Additional quotes
Data may confirm inflation trend for ECB’s June meeting.
The ECB’s financial-market footprint is decreasing step by step.
Market reaction
At the time of writing, EUR/USD is keeping its range at around 1.0850, up 0.18% on the day.
ECB FAQs
The European Central Bank (ECB) in Frankfurt, Germany, is the reserve bank for the Eurozone. The ECB sets interest rates and manages monetary policy for the region. The ECB primary mandate is to maintain price stability, which means keeping inflation at around 2%. Its primary tool for achieving this is by raising or lowering interest rates. Relatively high interest rates will usually result in a stronger Euro and vice versa. The ECB Governing Council makes monetary policy decisions at meetings held eight times a year. Decisions are made by heads of the Eurozone national banks and six permanent members, including the President of the ECB, Christine Lagarde.
In extreme situations, the European Central Bank can enact a policy tool called Quantitative Easing. QE is the process by which the ECB prints Euros and uses them to buy assets – usually government or corporate bonds – from banks and other financial institutions. QE usually results in a weaker Euro. QE is a last resort when simply lowering interest rates is unlikely to achieve the objective of price stability. The ECB used it during the Great Financial Crisis in 2009-11, in 2015 when inflation remained stubbornly low, as well as during the covid pandemic.
Quantitative tightening (QT) is the reverse of QE. It is undertaken after QE when an economic recovery is underway and inflation starts rising. Whilst in QE the European Central Bank (ECB) purchases government and corporate bonds from financial institutions to provide them with liquidity, in QT the ECB stops buying more bonds, and stops reinvesting the principal maturing on the bonds it already holds. It is usually positive (or bullish) for the Euro.
Bank of England (BoE) policymaker Catherine Mann said on Tuesday that “markets are pricing in too many cuts to rates.“
Additional comments
Changed her vote on rates due to consumers disciplining firms pricing, changing dynamic in labor markets and financial market curve.
Discretionary services inflation has started to soften in last couple of month.
Firms are increasingly cutting hours in labor market.
National insurance rate cuts will add more workers to labor market, will affect wage dynamics soon.
In february i thought makrets were easing too much.
Markets are perhaps a bit too complacent about how long the boe will hold rates.
In some ways the BoE does not have to cut because the market already is.
Market curve in the UK is importantly affected by decisions of ECB and Fed.
Wage dynamics in the UK are stronger than in the US and Euro area.
Hard to argue that the BoE would be ahead of the ECB and the Fed.
Market reaction
The above comments fail to move the needle around the Pound Sterling, as the GBP/USD pair continues its struggle with 1.2650, defending 0.13% gains on the day.
The US Dollar (USD) has declined at the start of this week. Economists at ING analyze Greenback’s outlook.
There are no scheduled Fed speakers today
There are a couple of data releases to watch in the US today after a good Chicago Fed Activity index print, soft manufacturing figures (Dallas Fed index) and lower-than-expected new home sales on Monday. Durable Goods Orders for February are expected to rebound after January’s decline, and the Conference Board consumer confidence is seen stabilising after printing 106.7 in February.
There are no scheduled Fed speakers today, but equity markets seemed to react negatively to Monday’s comments by Raphael Bostic, who reiterated his expectation for only one cut this year and stressed the risks of easing too early. Interestingly, the Dollar did not benefit from the remarks, and we suspect that while a core PCE at 0.3% month-on-month (our call and consensus) on Friday shouldn’t do much to encourage dovish bets, the Dollar looks more likely to stabilise than stage another rally at this point.
- USD/MXN could receive upward support on hawkish comments from Fed members.
- The Mexican Peso could potentially benefit from a risk-on sentiment.
- The lower US Treasury yields could undermine the US Dollar.
USD/MXN recovers recent losses, putting efforts to climb higher to nearly 16.70 during the European session on Tuesday. The US Dollar (USD) gains ground, driven by hawkish remarks from US Federal Reserve (Fed) officials. Suggestions from Fed members to delay interest rate cuts have bolstered the idea of maintaining elevated interest rates for a longer period.
Atlanta Fed President Raphael Bostic's expectation of only one rate cut this year reflects caution against premature reductions that could lead to disruption. Conversely, Chicago Fed President Austan Goolsbee emphasized the necessity for further evidence of declining inflation before advocating for such rate adjustments.
The USD/MXN pair experienced downward pressure amidst a risk-on sentiment, while the Mexican Peso (MXN) strengthened despite the recent interest rate cut by the Bank of Mexico (Banxico). Banxico Governor Victoria Rodriguez Ceja commented that the initial rate reduction doesn't signify the end of the battle against inflation. She emphasized the central bank's cautious approach, indicating that adjustments to the main reference rates would be gradual and based on forthcoming data.
The Banxico lowered interest rates due to significant declines in both inflation and growth over the past year. The SNB projects inflation to average 1.9% in 2024, although the current inflation rate remains notably lower at 1.2%. However, there was a noteworthy increase in the Consumer Price Index (CPI) in February, rising by 0.6% compared to the previous month's 0.2% increase.
- Silver meets with a fresh supply on Tuesday and drops closer to last week’s swing low.
- The setup suggests that the path of least resistance for the XAU/USD is to the downside.
- A sustained break below the 38.2% Fibo. will reinforce the near-term negative outlook.
Silver (XAG/USD) comes under some selling pressure on Tuesday and remains depressed near mid-$24.00s through the first half of the European session. Meanwhile, the technical setup seems tilted in favour of bearish traders and supports prospects for an extension of last week's sharp retracement slide from the $25.75-$25.80 region, or its highest level since early December.
The XAG/USD now seems to have found acceptance below the $24.85-$24.80 horizontal support, which coincides with the 23.6% Fibonacci retracement level of the February-March rally. The subsequent slide, however, stalled near the $24.40 area, just ahead of the 38.2% Fibo. level, which should now act as a key pivotal point. Meanwhile, mixed oscillators on the daily chart make it prudent to wait for some follow-through selling below the said support before positioning for any further losses.
The XAG/USD might then accelerate the corrective decline further towards the $24.00 round figure before dropping to 50% Fibo. level support, around the $23.85 region. This is followed by the $23.35 confluence, comprising the 61.8% Fibo. and the very important 200-day Simple Moving Average (SMA). A convincing break below the latter will be seen as a fresh trigger for bearish traders and drag the white metal below the $23.00 mark, towards the next relevant support near the $22.45 region.
On the flip side, any attempted recovery is likely to attract fresh sellers and remain capped near the $25.00 psychological mark. That said, a sustained strength beyond the said handle might trigger a bout of a short-covering rally and lift the XAG/USD to the $25.50 region en route to the YTD peak, around the $25.75-$25.80 region. This is followed by the December 2023 swing high, just ahead of the $26.00 round figure, which if cleared decisively will set the stage for a further near-term appreciating move.
Silver daily chart
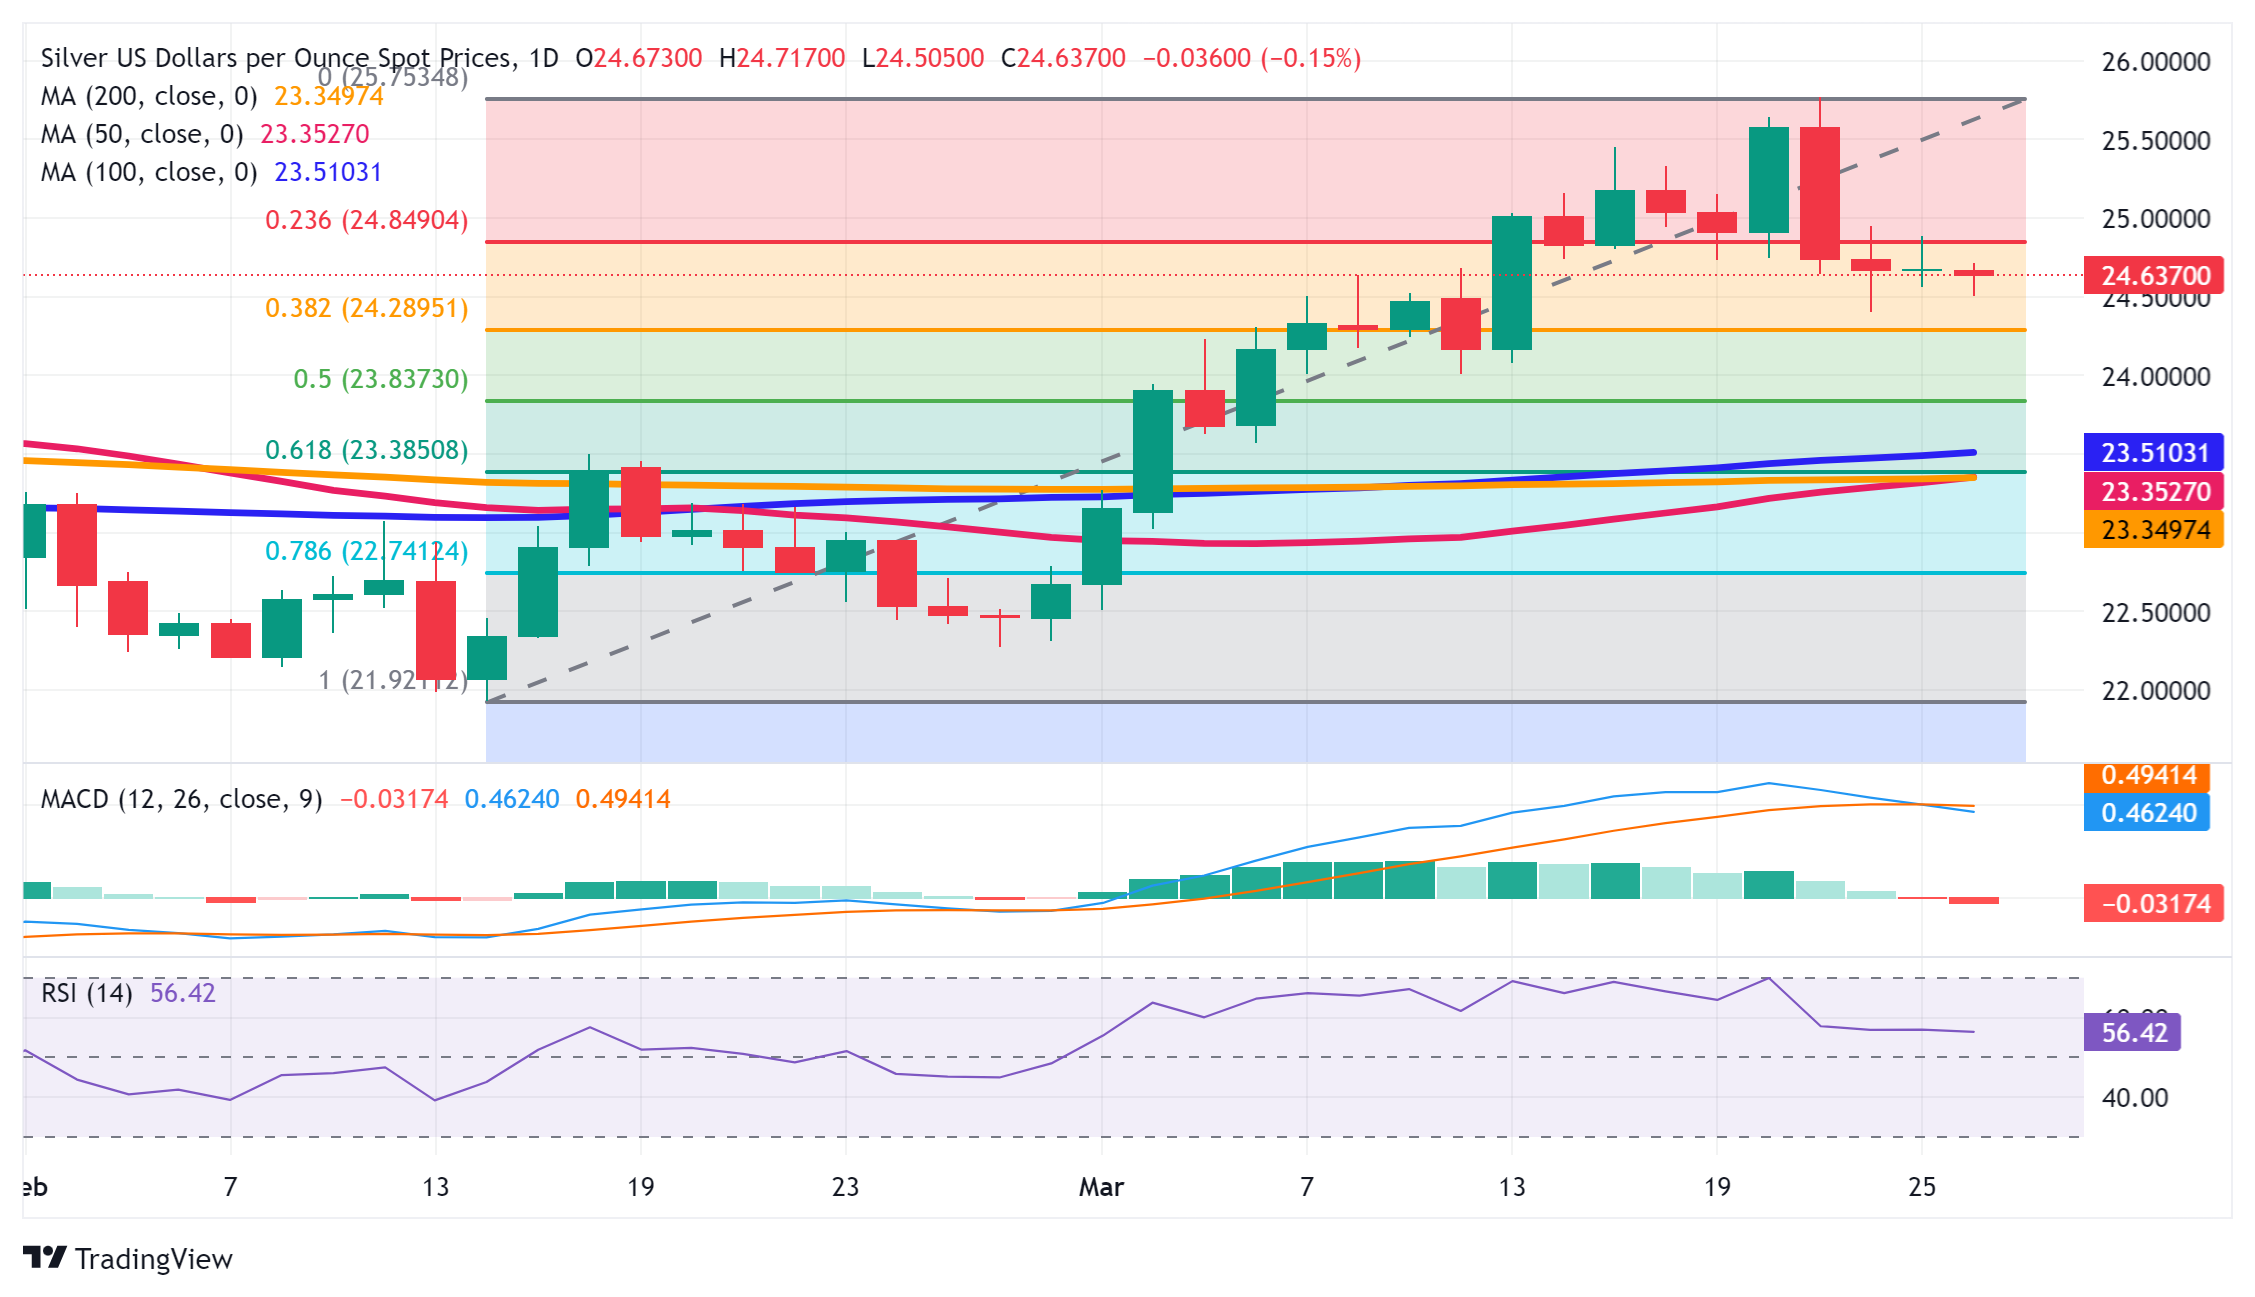
- EUR/USD continues its bounce higher as traders take profit after last week’s volatile sell-off.
- The divergence between Federal Reserve and European Central Bank speakers suggests future weakness is possible.
- US Durable Goods Orders are the main release for the pair on Tuesday.
EUR/USD is trading over a tenth of a percent higher in the mid 1.0800s on Tuesday, in line with broader US Dollar (USD) selling.
Both the US Dollar Index (DXY), which tracks the currency’s performance against a basket of competitors, and the highly correlated US 10-year Note yield are trading lower too.
EUR/USD has now broken back above the key 50-day and 200-day Simple Moving Averages (SMA) as it rebounds from the 1.0801 lows of the previous week.
EUR/USD bounces on profit-taking
EUR/USD continues Monday’s half-hearted bounce, probably on the back of profit taking after last week’s USD surge rather than specific fundamental drivers.
Although US New Home Sales data out on Monday showed a slight decline of 0.3% from the previous month, the overall economic picture continues to indicate the US economy is ticking over exceptionally well and inflation remains elevated.
This in turn suggests that the Federal Reserve (Fed) will not need not be too hasty in cutting interest rates, a key FX driver. Interest rates remaining higher for longer is positive for the Greenback as it attracts greater inflows of foreign capital.
On Monday, commentary from Fed speakers was overall hawkish, advocating for a delay in cutting interest rates.
The President of the Federal Reserve Bank of Atlanta, Raphael Bostic, said he only believed the Fed would cut once in 2024, as opposed to the official line which continues to be for three cuts.
Federal Reserve Governor Lisa Cook was cautious, arguing that the Fed needed to take a “careful approach” to easing over time to “ensure inflation returns sustainably to 2.0%.”
Their comments were probably responsible for the slight recovery in some USD pairs during Monday’s US session.
On Tuesday, US Durable Goods Orders for February will provide further intelligence on the US economy which could impact the pair.
The headline figure is expected to show a 1.3% rise in February following the 6.2% decline in January. A dramatic change from the expected could move EUR/USD, with a higher-than-forecast figure pushing the pair down and vice versa for a lower number.
ECB officials strike dovish tone
In Europe by contrast, central bank officials struck a more dovish tone on Monday, with several European Central Bank (ECB) Governing Council members intimating the possibility of earlier-than-expected interest-rate cuts.
ECB Member Fabio Panetta said that inflation was quickly falling to target and therefore there was a "consensus emerging" for a rate cut. His comments increase the probability of a rate cut in June – or even earlier. A rate cut in April would be bearish for the Euro as lower interest rates attract less flows of foreign capital.
ECB Chief Economist Philip Lane said on Monday that he was “confident” wage inflation was "on track" to falling to a level consistent with the ECB meeting its 2% inflation target. Lane also said that at that point the ECB could start reversing its interest rate policy.
If anything, the widening gap between what Fed speakers are advocating and what ECB officials are saying should be pushing EUR/USD lower. However, it is possible that last week’s sell-off has already priced the Fed-ECB divergence.
Technical Analysis: EUR/USD pulls back in short-term downtrend
EUR/USD continues to labor higher on Tuesday after bouncing off the lows of the wave B of the three-wave Measured Move pattern that unfolded higher during February and early March.
The current recovery looks like a pullback in an established short-term downtrend with eventual weakness likely to resume.
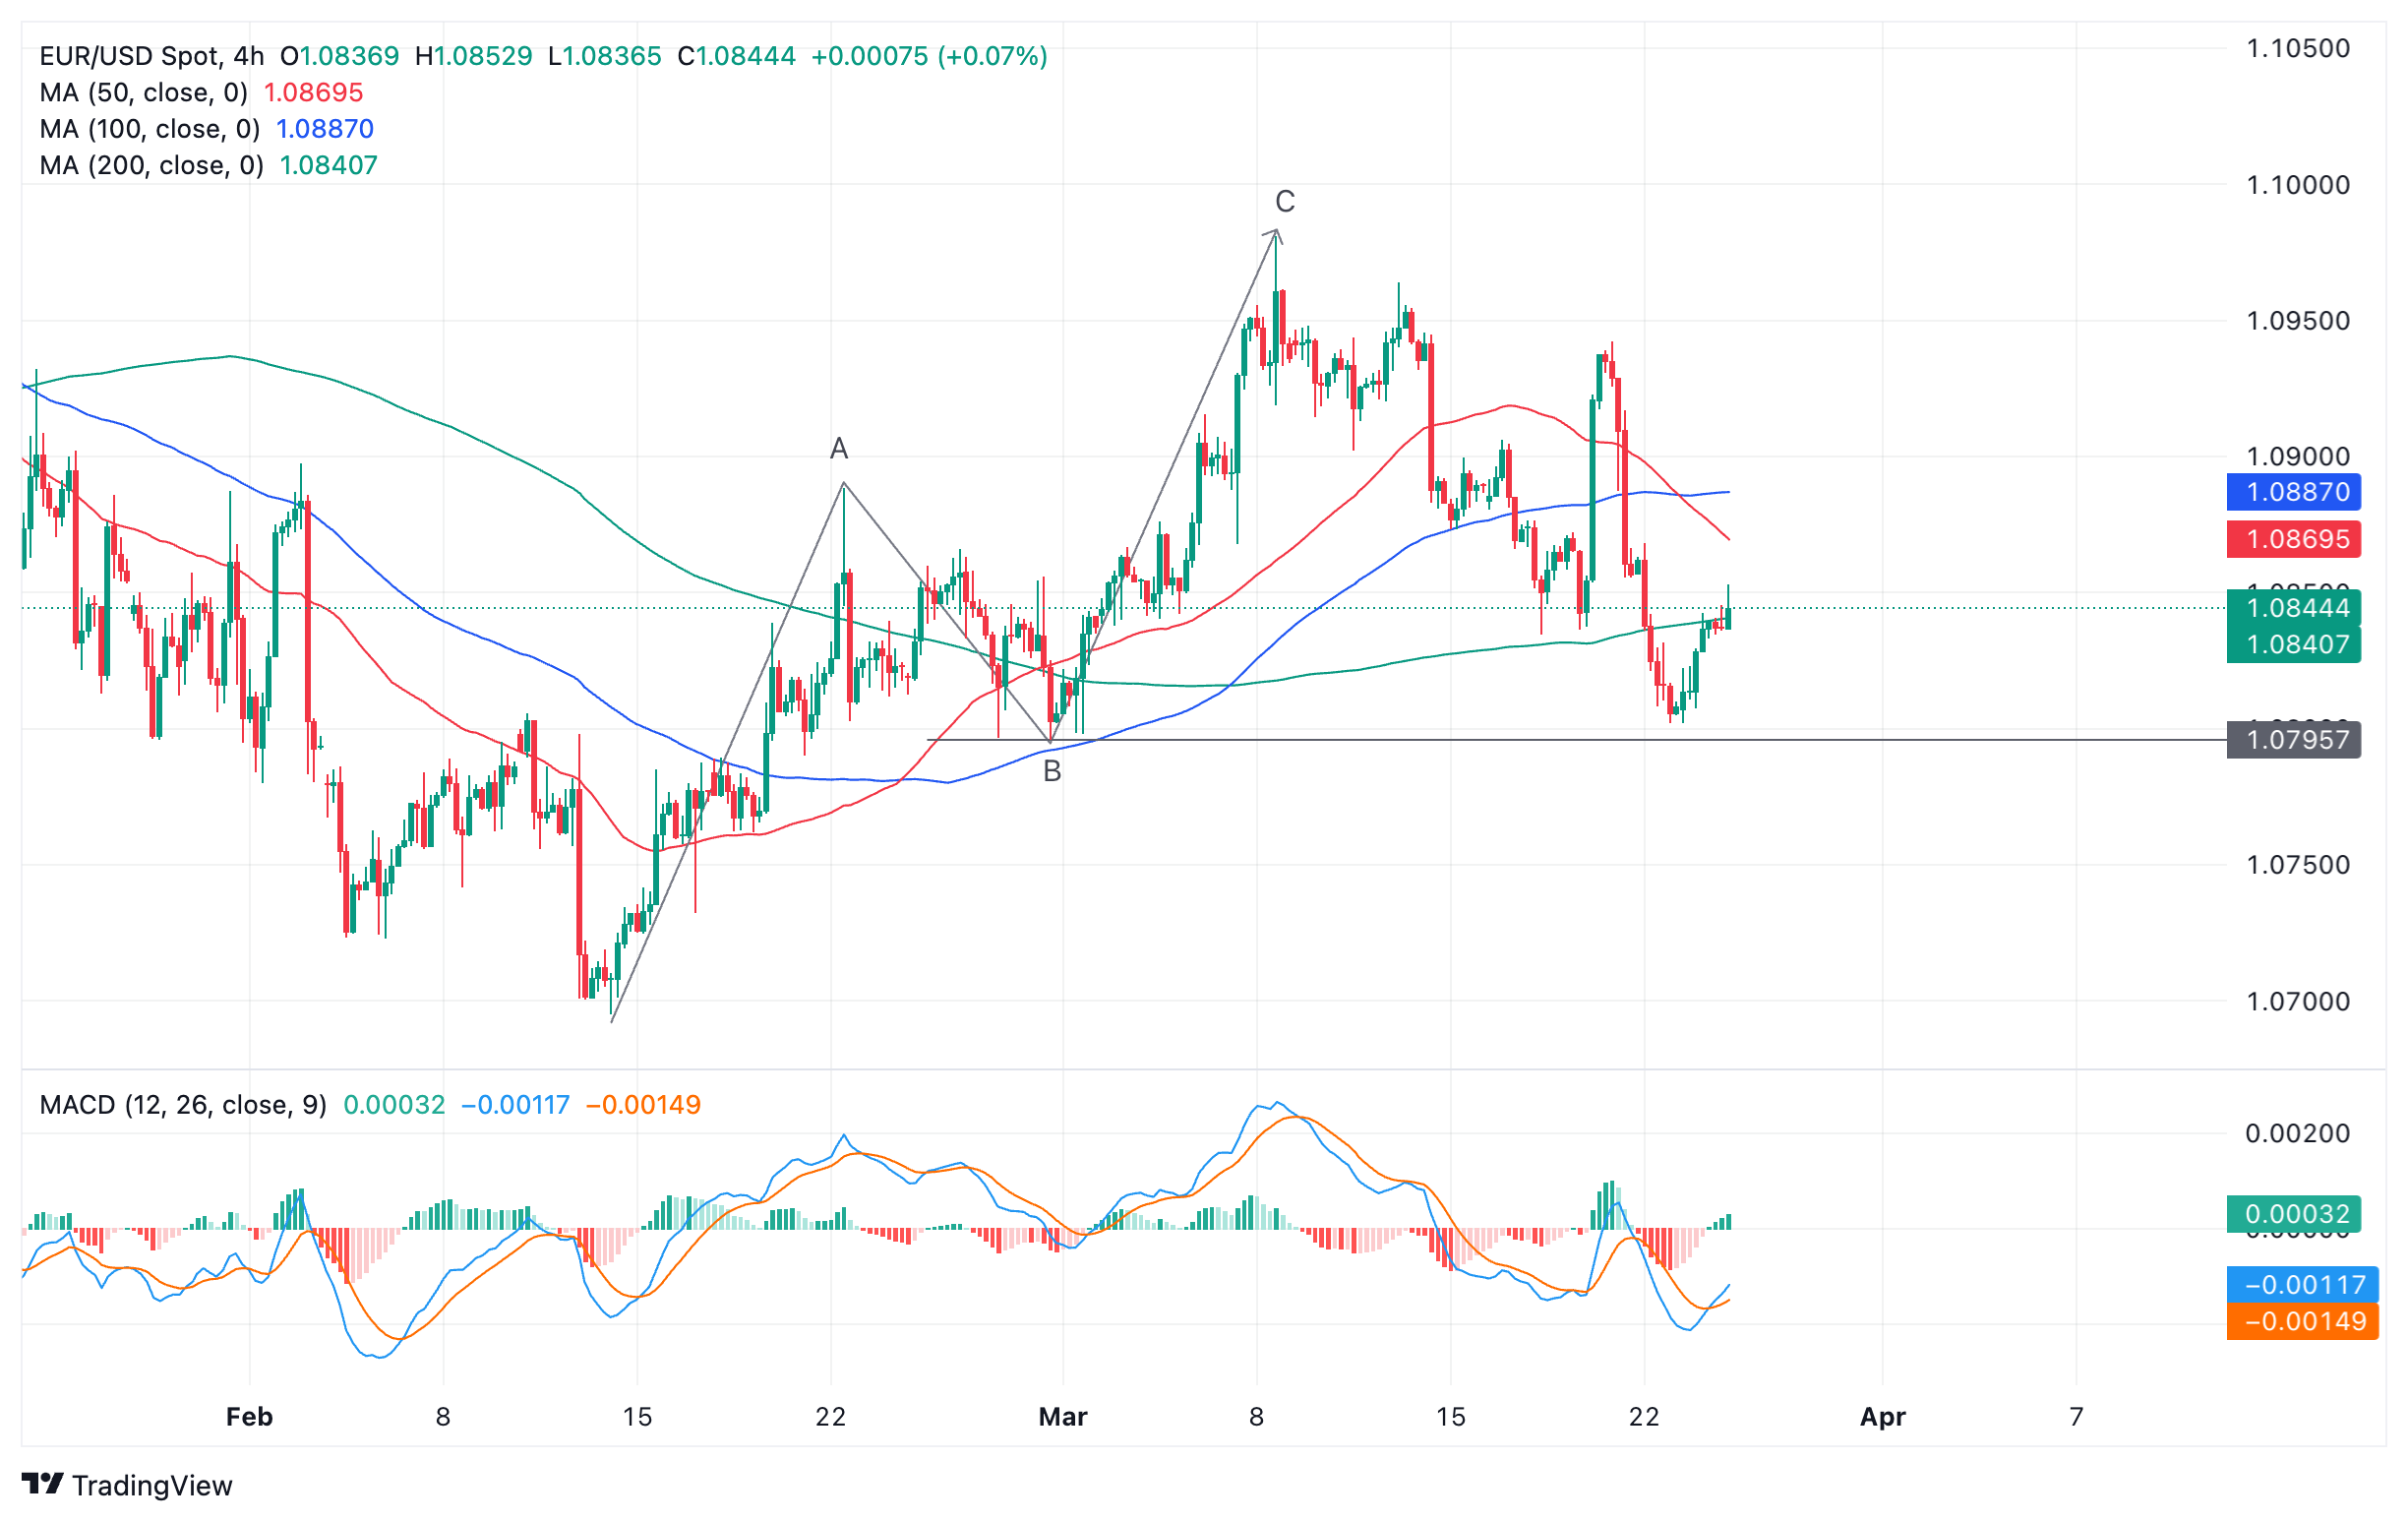
Euro versus US Dollar: 4-hour chart
A decisive break below the B-wave lows at roughly 1.0795 would signal a continuation of the downtrend to the next target at 1.0750 – then the February lows at 1.0700.
A decisive break is one characterized by a long red bearish candle that breaks cleanly through the level and closes near its low, or three down candles in a row that breach the level.
Alternatively, a move above the 1.0950 level would bring into question the validity of the short-term downtrend.
Euro FAQs
The Euro is the currency for the 20 European Union countries that belong to the Eurozone. It is the second most heavily traded currency in the world behind the US Dollar. In 2022, it accounted for 31% of all foreign exchange transactions, with an average daily turnover of over $2.2 trillion a day. EUR/USD is the most heavily traded currency pair in the world, accounting for an estimated 30% off all transactions, followed by EUR/JPY (4%), EUR/GBP (3%) and EUR/AUD (2%).
The European Central Bank (ECB) in Frankfurt, Germany, is the reserve bank for the Eurozone. The ECB sets interest rates and manages monetary policy. The ECB’s primary mandate is to maintain price stability, which means either controlling inflation or stimulating growth. Its primary tool is the raising or lowering of interest rates. Relatively high interest rates – or the expectation of higher rates – will usually benefit the Euro and vice versa. The ECB Governing Council makes monetary policy decisions at meetings held eight times a year. Decisions are made by heads of the Eurozone national banks and six permanent members, including the President of the ECB, Christine Lagarde.
Eurozone inflation data, measured by the Harmonized Index of Consumer Prices (HICP), is an important econometric for the Euro. If inflation rises more than expected, especially if above the ECB’s 2% target, it obliges the ECB to raise interest rates to bring it back under control. Relatively high interest rates compared to its counterparts will usually benefit the Euro, as it makes the region more attractive as a place for global investors to park their money.
Data releases gauge the health of the economy and can impact on the Euro. Indicators such as GDP, Manufacturing and Services PMIs, employment, and consumer sentiment surveys can all influence the direction of the single currency. A strong economy is good for the Euro. Not only does it attract more foreign investment but it may encourage the ECB to put up interest rates, which will directly strengthen the Euro. Otherwise, if economic data is weak, the Euro is likely to fall. Economic data for the four largest economies in the euro area (Germany, France, Italy and Spain) are especially significant, as they account for 75% of the Eurozone’s economy.
Another significant data release for the Euro is the Trade Balance. This indicator measures the difference between what a country earns from its exports and what it spends on imports over a given period. If a country produces highly sought after exports then its currency will gain in value purely from the extra demand created from foreign buyers seeking to purchase these goods. Therefore, a positive net Trade Balance strengthens a currency and vice versa for a negative balance.
The declining FX volatility may keep the Japanese Yen pressured by funding demand for carry trades, making USD/JPY even more reliant on a move in USD rates, economists at ING say.
USD/JPY may retest the 152.00+ “verbal intervention” area in the short term
The drop in FX volatility after last week’s action is being helped by the PBoC's stabilisation of the Yuan and should not help the Yen, which remains the most popular funding currency for carry trades.
Verbal interventions in Japan and the softer Dollar momentum are helping a bit, but the current environment suggests a recovery in JPY remains even more strictly tied to US rates breaking lower.
Our call remains bearish on USD/JPY moving forward, but in the very short term, the pair may retest the 152.00+ ‘verbal intervention’ area.
- USD/CHF rebounds to 0.9000 on broader weakness in the Swiss Franc due to SNB’s surprise rate-cut decision.
- Fed policymakers remain confident about easing price pressures.
- Market participants await the US core PCE inflation data for fresh guidance.
The USD/CHF pair recaptures the psychological resistance of 0.9000 in the European session. The Swiss Franc asset rebounds despite the US Dollar easing after refreshing its monthly high. Weak Swiss Franc due to the surprise rate cut decision by the Swiss National Bank (SNB) reinforces demand for the pair.
Last week, the SNB announced a rate cut by 25 basis points (bps) to 1.50%, while investors anticipated that interest rates would remain unchanged. The SNB became the first among central banks of developed nations to kick off the rate-cut cycle.
S&P 500 futures have posted decent gains in the London session, portraying an improvement in the risk appetite of the market participants. The US Dollar Index (DXY) falls to 104.10 as Federal Reserve (Fed) policymakers remain confident that the underlying inflation is easing despite price pressures remaining stubborn in January and February. 10-year US Treasury yields have dropped to 4.25% due to firm expectations that the Fed will start reducing interest rates from the June policy meeting.
Higher house rentals significantly drive the US inflation but policymakers are confident that inflation will come down to 2%. Chicago Federal Reserve Bank President Austan Goolsbee said on Monday, in an interview with Yahoo Finance, "So we're in an uncertain state but it doesn't feel to me like we've changed fundamentally the story that we're getting back to target," Austan Goolsbee predicted three rate cuts for this year in the March monetary policy.
This week, the next move in the US Dollar will be guided by the US core Personal Consumption Expenditure price index (PCE) for February, which will be published on Friday.
On Monday, the US Dollar (USD) ended the day in the red for once. Economists at Commerzbank analyze Greenback’s outlook.
The USD is running out of steam at current levels
The USD is running out of steam at current levels. But this should not come as a surprise. At some point, even the last market participant will have internalized the officials' statements and formed their own opinion. And to be honest, not much has changed since last week, at least as far as the USD is concerned. Rather, the data will likely continue to be the determining factor in the Fed's direction.
Friday's PCE deflator will certainly be the most important indicator for an assessment. After all, given the strength of the US economy, inflation will ultimately determine when and how quickly the Fed will cut interest rates. However, today's wave of second and third tier data could already cause some movement. If the trend of the last few weeks continues, when the data tended to be disappointing and doubts about the US growth story began to surface, the USD correction could continue today.
- USD/CHF faced challenges due to lower US Treasury yields on Tuesday.
- Fed’s member Raphael Bostic expressed his expectation for only one rate cut this year.
- Swiss Franc may cheer the risk aversion stemming from the EU’s investigations into major tech firms.
USD/CHF moves in the positive direction for the second consecutive day on Tuesday, advancing to near 0.9000 during the early European session. The US Dollar (USD) saw gains fueled by hawkish comments from US Federal Reserve (Fed) officials.
Fed members suggested that the Fed should postpone interest rate cuts, supporting the notion that interest rates should remain at their current elevated levels for a longer duration. This stance bolstered the US Dollar, as higher interest rates tend to attract more foreign capital inflows.
Atlanta Fed President Raphael Bostic expressed his expectation for only one rate cut this year, cautioning against premature rate reductions due to the potential for increased disruption. Conversely, Chicago Fed President Austan Goolsbee, aligning with the majority of the board, anticipates three cuts. However, Goolsbee underscores the need for additional evidence indicating a decline in inflation before advocating for rate cuts.
On the flip side, the Swiss Franc (CHF) may have garnered some strength due to risk aversion stemming from the European Union's (EU) initiation of investigations into major tech firms like Apple, Google, and Meta on Monday. Additionally, geopolitical tensions between Ukraine and Russia may prompt investors to seek refuge in safe-haven currencies such as the Swiss Franc (CHF).
In its March meeting held on Thursday, the Swiss National Bank (SNB) opted to cut interest rates by 25 basis points (bps) to 1.50%. This decision was driven by significant declines in both inflation and growth over the past year.
The SNB projects inflation to average 1.9% in 2024, although the current inflation rate stands notably lower at 1.2%. However, there was a substantial increase in the Consumer Price Index (CPI) in February, rising by 0.6% compared to the previous month's increase of 0.2%.
Looking ahead, the ZEW Survey Expectations for March and the SNB Quarterly Bulletin for the first quarter are scheduled for release on Wednesday. Additionally, Consumer Confidence data will be released from the United States.
- The Pound Sterling rebounds as market mood improves and the US Dollar faces a modest correction.
- BoE Bailey says he doesn’t see market expectations for two or three rate cuts as unreasonable.
- This week, the US Dollar’s moves will be driven by the core PCE price index data.
The Pound Sterling (GBP) extends its upside to 1.2650 against the US Dollar in Tuesday’s London session as the latter faces profit-taking after refreshing monthly highs. The GBP/USD pair exhibits a sound recovery even though investors expect that the Bank of England (BoE) will be more dovish this year than previously anticipated, driven by lower-than-anticipated inflation data in January and February
Two BoE policymakers, Catherine Mann and Jonathan Haskel – who voted for rate hikes in February – dropped their hawkish calls on interest rates in the March meeting. This has boosted confidence among investors that inflation in the United Kingdom is moving in the right direction. The BoE said last week, in his monetary policy statement, that the central bank is not at a point where interest rates can be reduced. However, policymakers didn’t rule out the market’s view of two or three rate cuts this year.
This week, the market sentiment will drive the Pound Sterling’s next move as the UK economic calendar is light. Investors will keenly focus on the United States core Personal Consumption Expenditure Price Index (PCE) data for February, which will be published on Good Friday. The annual Core PCE is forecasted to have grown at a steady pace of 2.8%.
Daily digest market movers: Pound Sterling rises as US Dollar sees modest correction
- The Pound Sterling rebounds to 1.2650 against the US Dollar after discovering support near 1.2580. The GBP/USD pair discovers some buying interest as the US Dollar corrects after printing a fresh monthly high. The US Dollar Index (DXY), which tracks the US Dollar’s value against six major currencies, falls to 104.16. The USD Index corrects as expectations for the Federal Reserve (Fed) reducing interest rates in the June policy meeting increase as policymakers still have faith has inflation is easing.
- The Fed remains confident that underlying price pressures are easing. However, hot US inflation in January and February suggested that the path toward achieving price stability could be bumpier than expected. Higher rentals and service inflation have fed the stubborn US Consumer Price Index (CPI). About rent inflation, Fed Governor Lisa Cook said on Monday, "Although housing-services inflation remains quite high, the current low rate of increase on new rental leases suggests that it will continue to fall."
- Improved market sentiment has offered some relief to the Pound Sterling. However, the downside bias remains unabated as the Bank of England seems to be adopting a slightly dovish tone on interest rates. In the recent monetary policy meeting, no policymakers voted for a rate hike for the first time since September 2021. BoE policymaker Catherine Mann was expected to vote for a rate hike.
- BoE Governor Andrew Bailey said in an interview with the Financial Times last week that market expectations for rate cuts this year are not unreasonable and delivered an optimistic tone on the economic prospects. Over the inflation outlook, Bailey said "We are not seeing a lot of sticky persistence".
- This week, trading volume could remain low due to Good Friday. Also, the United Kingdom's economic calendar has nothing much to offer. However, the US core PCE Inflation data for February will be in focus.
Technical Analysis: Pound Sterling rebounds above 1.2600
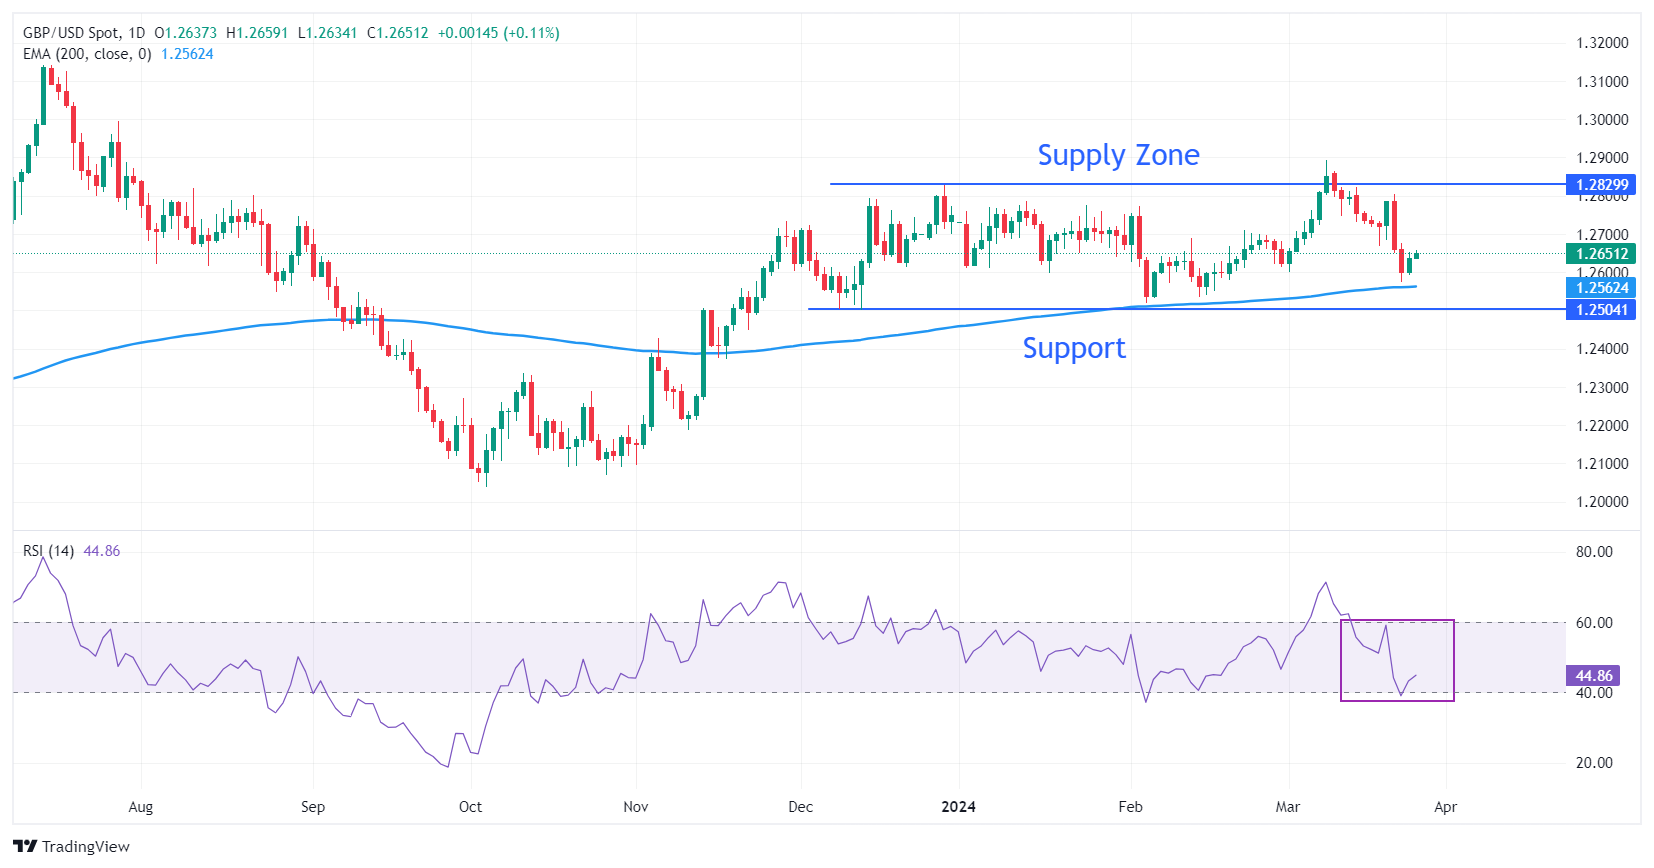
The Pound Sterling bounces back after slipping below the crucial support of 1.2600. The GBP/USD pair has been trading broadly sideways in a wider range between 1.2500 and 1.2900 for almost the last four months. The 200-day Exponential Moving Average (EMA) at 1.2558 will be a major cushion for the Pound Sterling bulls.
The 14-period Relative Strength Index (RSI) saw a pullback move after dipping to 40.00. A bearish momentum would trigger if the RSI dips below this level.
Pound Sterling FAQs
The Pound Sterling (GBP) is the oldest currency in the world (886 AD) and the official currency of the United Kingdom. It is the fourth most traded unit for foreign exchange (FX) in the world, accounting for 12% of all transactions, averaging $630 billion a day, according to 2022 data. Its key trading pairs are GBP/USD, aka ‘Cable’, which accounts for 11% of FX, GBP/JPY, or the ‘Dragon’ as it is known by traders (3%), and EUR/GBP (2%). The Pound Sterling is issued by the Bank of England (BoE).
The single most important factor influencing the value of the Pound Sterling is monetary policy decided by the Bank of England. The BoE bases its decisions on whether it has achieved its primary goal of “price stability” – a steady inflation rate of around 2%. Its primary tool for achieving this is the adjustment of interest rates. When inflation is too high, the BoE will try to rein it in by raising interest rates, making it more expensive for people and businesses to access credit. This is generally positive for GBP, as higher interest rates make the UK a more attractive place for global investors to park their money. When inflation falls too low it is a sign economic growth is slowing. In this scenario, the BoE will consider lowering interest rates to cheapen credit so businesses will borrow more to invest in growth-generating projects.
Data releases gauge the health of the economy and can impact the value of the Pound Sterling. Indicators such as GDP, Manufacturing and Services PMIs, and employment can all influence the direction of the GBP. A strong economy is good for Sterling. Not only does it attract more foreign investment but it may encourage the BoE to put up interest rates, which will directly strengthen GBP. Otherwise, if economic data is weak, the Pound Sterling is likely to fall.
Another significant data release for the Pound Sterling is the Trade Balance. This indicator measures the difference between what a country earns from its exports and what it spends on imports over a given period. If a country produces highly sought-after exports, its currency will benefit purely from the extra demand created from foreign buyers seeking to purchase these goods. Therefore, a positive net Trade Balance strengthens a currency and vice versa for a negative balance.
FX option expiries for Mar 26 NY cut at 10:00 Eastern Time, via DTCC, can be found below
- EUR/USD: EUR amounts
- 1.0785 2b
- 1.0870 4.1b
- 1.0925 2.9b
- GBP/USD: GBP amounts
- 1.2685 983m
- USD/JPY: USD amounts
- 151.00 529m
- 151.25 632m
- AUD/USD: AUD amounts
- 0.6500 726m
- 0.6545 3.2b
- NZD/USD: NZD amounts
- 0.6170 695m
EUR/USD moved towards the 1.0850 mark in Monday's session. Economists at ING analyze the pair’s outlook.
EUR/USD set to stabilise around or modestly above 1.0850
Inflation numbers will be released in the next ten days in the Eurozone, with the EZ-wide March CPI estimate released on April 3. Barring major surprises, markets should continue to gain confidence about a June cut (21 bps already in the price), meaning that the EUR may lag other currencies that have short positioning and/or have higher beta to sentiment once a Dollar decline materialises. In our view, this can happen in the next month.
For this week, EUR/USD should be able to prevent much more pressure on the 1.0800 support and stabilise around or modestly above 1.0850.
The Swedish Krona (SEK) has weakened ahead of Riksbank’s policy meeting on Wednesday. Economists at MUFG Bank analyze SEK outlook.
Riksbank to provide dovish policy guidance that could tee up a rate cut as soon as May
We are recommending a new long EUR/SEK trade idea. The main rationale for the trade idea reflects our expectation that the Riksbank will be the next European central bank to begin cutting rates which we expect to encourage a weaker SEK in the coming months.
While we don’t expect the Riksbank to lower rates at Wednesday’s policy meeting, the updated policy guidance should open the door to the first rate cut being delivered as soon as at the following meeting in May.
There are two main risks to the trade idea: i) the Riksbank proceeds more cautiously given ongoing concerns over SEK weakness, and ii) the global economy and Sweden’s economy start to recover more strongly than expected this year providing more support for SEK. We see only a limited risk that the ECB begins to cut rates earlier in April rather than in June.
Here is what you need to know on Tuesday, March 26:
Major currency pairs fluctuate in relatively tight ranges early Tuesday as investors refrain from taking large positions ahead of macroeconomic data releases from the US. Durable Goods Orders for February and Housing Price Index for January will be featured in the economic calendar in the American session and the Conference Board will publish the Consumer Confidence report. Market participants will also continue to keep a close eye on comments from central bank officials.
US Consumer Confidence Preview: An uptick in confidence can boost the USD.
The US Dollar (USD) struggled to find demand at the beginning of the week, with the USD Index staging a downward correction following the previous week's rally. As Wall Street's main indexes closed the day marginally lower, the USD managed to find a foothold. In the meantime, the benchmark 10-year US Treasury bond yield gained 1% and snapped a four-day losing streak, further supporting the USD. The USD Index moves up and down in a narrow band slightly above 104.00 in the European morning on Tuesday, while US stock index futures trade modestly higher on the day.
US Dollar price this week
The table below shows the percentage change of US Dollar (USD) against listed major currencies this week. US Dollar was the weakest against the Pound Sterling.
| USD | EUR | GBP | CAD | AUD | JPY | NZD | CHF | |
| USD | -0.38% | -0.43% | -0.24% | -0.41% | 0.04% | -0.37% | 0.25% | |
| EUR | 0.39% | -0.04% | 0.16% | -0.01% | 0.41% | 0.05% | 0.64% | |
| GBP | 0.43% | 0.05% | 0.21% | 0.04% | 0.47% | 0.10% | 0.68% | |
| CAD | 0.23% | -0.15% | -0.21% | -0.17% | 0.27% | -0.11% | 0.47% | |
| AUD | 0.41% | 0.02% | -0.01% | 0.17% | 0.44% | 0.04% | 0.65% | |
| JPY | -0.04% | -0.42% | -0.36% | -0.24% | -0.43% | -0.40% | 0.23% | |
| NZD | 0.33% | 0.00% | -0.04% | 0.15% | -0.02% | 0.41% | 0.63% | |
| CHF | -0.25% | -0.64% | -0.68% | -0.48% | -0.66% | -0.21% | -0.58% |
The heat map shows percentage changes of major currencies against each other. The base currency is picked from the left column, while the quote currency is picked from the top row. For example, if you pick the Euro from the left column and move along the horizontal line to the Japanese Yen, the percentage change displayed in the box will represent EUR (base)/JPY (quote).
The Bank of Japan's (BoJ) Research and Statistics Department reported that the trimmed mean reading for core inflation arrived at 2.3% in February, down from 2.6% in January, and was substantially lower than the peak of 3.4% in September last year. Earlier in the day, Japanese Finance Minister Shunichi Suzuki repeated it’s important for currencies to move in a stable manner reflecting fundamentals and added that they will continue to closely watch foreign exchange moves with a high sense of urgency. USD/JPY closed the first trading day of the week virtually unchanged and extended its sideways grind slightly below 151.50 early Tuesday.
Japanese Yen remains confined in a narrow range against USD, bears not ready to give up yet.
EUR/USD capitalized on the USD weakness and closed higher on Monday. The pair holds steady at around 1.0850 in the European morning. Later in the day, European Central Bank (ECB) chief economist Philip Lane is scheduled to deliver a speech.
GBP/USD staged a rebound after testing 1.2600 on Monday gained 0.3% on the day. The pair trades at around 1.2650 to start the European session.
Gold climbed above $2,180 on Monday but erased a large portion of its daily gains, pressured by rising US T-bond yields. XAU/USD stays in a consolidation phase near $2,170 early Tuesday.
Gold price holds steady above $2,170 level amid modest USD weakness, geopolitical risks.
US Dollar FAQs
The US Dollar (USD) is the official currency of the United States of America, and the ‘de facto’ currency of a significant number of other countries where it is found in circulation alongside local notes. It is the most heavily traded currency in the world, accounting for over 88% of all global foreign exchange turnover, or an average of $6.6 trillion in transactions per day, according to data from 2022. Following the second world war, the USD took over from the British Pound as the world’s reserve currency. For most of its history, the US Dollar was backed by Gold, until the Bretton Woods Agreement in 1971 when the Gold Standard went away.
The most important single factor impacting on the value of the US Dollar is monetary policy, which is shaped by the Federal Reserve (Fed). The Fed has two mandates: to achieve price stability (control inflation) and foster full employment. Its primary tool to achieve these two goals is by adjusting interest rates. When prices are rising too quickly and inflation is above the Fed’s 2% target, the Fed will raise rates, which helps the USD value. When inflation falls below 2% or the Unemployment Rate is too high, the Fed may lower interest rates, which weighs on the Greenback.
In extreme situations, the Federal Reserve can also print more Dollars and enact quantitative easing (QE). QE is the process by which the Fed substantially increases the flow of credit in a stuck financial system. It is a non-standard policy measure used when credit has dried up because banks will not lend to each other (out of the fear of counterparty default). It is a last resort when simply lowering interest rates is unlikely to achieve the necessary result. It was the Fed’s weapon of choice to combat the credit crunch that occurred during the Great Financial Crisis in 2008. It involves the Fed printing more Dollars and using them to buy US government bonds predominantly from financial institutions. QE usually leads to a weaker US Dollar.
Quantitative tightening (QT) is the reverse process whereby the Federal Reserve stops buying bonds from financial institutions and does not reinvest the principal from the bonds it holds maturing in new purchases. It is usually positive for the US Dollar.
The Bank of Japan's (BoJ) Research and Statistics Department released the following four measures of underlying inflation in line with the monthly release of the official CPI for Japan: the diffusion index of increasing/decreasing items, the trimmed mean, the mode, and the weighted median.
According to the BOJ's measures, the trimmed mean reading for core inflation arrived at 2.3% in February from 2.6% in January and was substantially lower than the peak of 3.4% in September last year.
Market reaction
Following the headline above, USD/JPY was down 0.04% on the day at 151.35.
Japanese Yen FAQs
The Japanese Yen (JPY) is one of the world’s most traded currencies. Its value is broadly determined by the performance of the Japanese economy, but more specifically by the Bank of Japan’s policy, the differential between Japanese and US bond yields, or risk sentiment among traders, among other factors.
One of the Bank of Japan’s mandates is currency control, so its moves are key for the Yen. The BoJ has directly intervened in currency markets sometimes, generally to lower the value of the Yen, although it refrains from doing it often due to political concerns of its main trading partners. The current BoJ ultra-loose monetary policy, based on massive stimulus to the economy, has caused the Yen to depreciate against its main currency peers. This process has exacerbated more recently due to an increasing policy divergence between the Bank of Japan and other main central banks, which have opted to increase interest rates sharply to fight decades-high levels of inflation.
The BoJ’s stance of sticking to ultra-loose monetary policy has led to a widening policy divergence with other central banks, particularly with the US Federal Reserve. This supports a widening of the differential between the 10-year US and Japanese bonds, which favors the US Dollar against the Japanese Yen.
The Japanese Yen is often seen as a safe-haven investment. This means that in times of market stress, investors are more likely to put their money in the Japanese currency due to its supposed reliability and stability. Turbulent times are likely to strengthen the Yen’s value against other currencies seen as more risky to invest in.
- GBP/USD could meet the immediate barrier at 23.6% Fibonacci and a major level of 1.2650.
- Technical analysis suggests a confirmation of a bearish momentum for the pair.
- The key support could be met around the psychological support level of 1.2600.
GBP/USD attempts to continue gaining ground, advancing to near 1.2640 during the Asian trading hours on Tuesday. The pair could meet the immediate resistance at 23.6% Fibonacci retracement and a major level at 1.2650.
A breakthrough above the latter could exert upward support for the GBP/USD pair to test the 50-day Exponential Moving Average (EMA) at 1.2681. Should the pair surpass these levels, it may approach the psychological barrier of the 1.2700 level.
The technical analysis of the GBP/USD pair shows that the 14-day Relative Strength Index (RSI) is positioned below 50. This indicates a bearish trend for the GBP/USD pair. However, the Moving Average Convergence Divergence (MACD), a lagging indicator, suggests a bearish confirmation for the pair. The MACD line is situated below the centerline but shows divergence below the signal line.
On the downside, the GBP/USD pair may test the psychological support level of 1.2600. If this level is breached, it could prompt the pair to revisit March’s low at 1.2575, followed by the significant level of 1.2550.
GBP/USD: Daily Chart
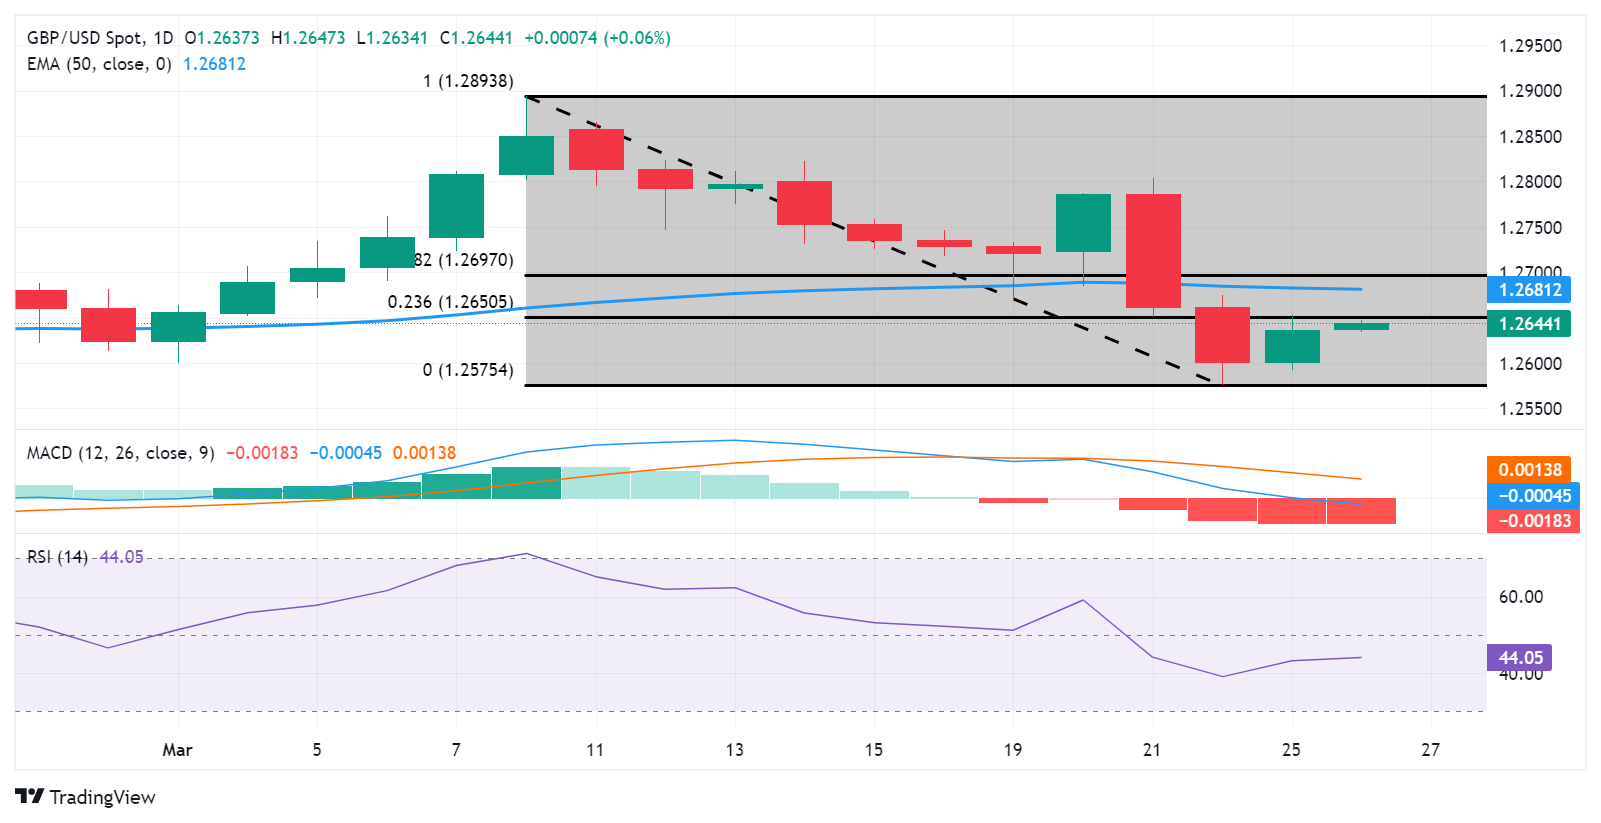
- EUR/JPY posts modest gains around 164.10 in Tuesday’s early European session.
- Some verbal intervention from Japanese authorities lifts the Japanese Yen.
- ECB’s Panetta said the inflation trend was making a rate cut possible.
The EUR/JPY cross trades with a mild bullish bias above the 164.00 mark during the early European session on Tuesday. The intervention warning from the Japanese authorities on Monday provides some support to the Japanese Yen (JPY) and might cap the cross’s upside in the near term. Traders will closely monitor the Tokyo Consumer Price Index (CPI) for March, due on Friday. At press time, the cross is trading at 164.10, gaining 0.01% for the day.
The Japanese Yen has dropped despite the Bank of Japan's (BoJ) raising interest rates last week, marking the first hike since 2007. However, Japan's Vice Minister of Finance for International Affairs, Masato Kanda made some verbal intervention on Monday, saying that he will take appropriate steps to respond to the excessive weakness of the Japanese Yen without excluding any measures. This, in turn, lifts the JPY and acts as a headwind for the EUR/JPY cross.
On the other hand, traders increased their bets on rate cut expectations from the European Central Bank (ECB) after the Swiss National Bank (SNB) became the first major central bank to lower borrowing costs last week. The ECB policymaker Fabio Panetta stated on Monday that the central bank is moving towards an interest rate cut as inflation is falling rapidly and approaching the bank's 2% target. Meanwhile, ECB chief economist Philip Lane said that the ECB is more confident that wage growth is slowing back toward more normal levels, potentially opening the door to rate cuts.
The German Gfk Consumer Confidence Survey for April is due on Tuesday, along with the ECB's Lane speech. Traders will watch the German February Retail Sales on Thursday. On Friday, the Japanese Tokyo CPI inflation data for March will be in the spotlight.
- EUR/USD oscillates in a narrow range and is influenced by a combination of diverging forces.
- The Fed’s projected three rate cuts in 2024 undermine the USD and lend support to the pair.
- Rising bets for a June ECB rate cut keep the Euro bulls on the defensive and act as a headwind.
The EUR/USD pair struggles to capitalize on the previous day's goodish rebound from the 1.0800 mark, or a three-week low and oscillates in a narrow range during the Asian session on Tuesday. Spot prices currently trade around the 1.0840 region, nearly unchanged for the day and remain at the mercy of the US Dollar (USD) price dynamics.
Despite the optimistic outlook about the US economic growth, the USD Index (DXY), which tracks the Greenback against a basket of currencies, fails to attract buyers in the wake of mixed signals over the Federal Reserve's (Fed) rate-cut path. The US central bank said last week that it remains on track to cut interest rates by 75 bps this year. That said, several Fed officials expressed concern about sticky inflation and stronger-than-expected US macro data. This, in turn, holds back traders from placing fresh USD directional bets and leads to the EUR/USD pair's subdued/range-bound price action.
The shared currency, on the other hand, is undermined by bets for a June rate cut by the European Central Bank (ECB). In fact, Bank of Italy Governor Fabio Panetta said on Monday that the ECB is moving towards an interest rate cut as inflation is falling rapidly and approaching the 2% target. Separately, ECB chief economist Philip Lane noted that the central bank can consider reversing interest rates once it becomes more confident that wage growth is slowing and inflation is heading back to the 2% target as projected. This further contributes to capping the upside for the EUR/USD pair.
Market participants now look forward to the US economic docket, featuring the release of Durable Goods Orders, the Conference Board's Consumer Confidence Index and the Richmond Manufacturing Index later during the North American session. This, along with the US bond yield and the broader risk sentiment, will drive demand for the safe-haven buck and provide some impetus to the EUR/USD pair. The market focus, however, will remain glued to the release of the US Personal Consumption and Expenditure (PCE) Price Index – the Fed's preferred inflation gauge on Friday.
- USD/CAD faced challenges due to lower US Treasury yields on Tuesday.
- The lower WTI price could contribute to pressure on the Canadian Dollar.
- Greenback could struggle on market expectations of the Fed commencing an easing cycle.
USD/CAD trims intraday losses but remains in the negative zone, which could be attributed to an improved US Dollar (USD). The USD/CAD pair edges lower to 1.3580 during the Asian trading hours on Tuesday.
Additionally, the decline in Crude oil prices could have provided pressure to undermine the Canadian Dollar (CAD), reinforcing the USD/CAD pair. West Texas Intermediate (WTI) oil price edges lower to near $81.70 per barrel, by the press time. However, oil prices strengthened after the United States Energy Information Administration (EIA)increased its forecast prices for Crude oil and petroleum products for the remainder of 2024.
Moreover, the Canadian Dollar (CAD) encountered downward pressure following indications from the Bank of Canada (BoC) of possible rate cuts in 2024, as revealed in its latest meeting minutes. Deputy Governor Toni Gravelle reiterated the central bank's commitment to completing quantitative tightening by 2025, underscoring its sustainability amid incremental interest rate decreases. Investors are likely to await the release of Canadian Gross Domestic Product (GDP) data for January, scheduled for Thursday, which could further impact market sentiment.
The US Dollar Index (DXY) attempts to retrace its recent losses, inching higher to near 104.20, by the press time. However, the decline in the US Treasury yields, which could have put pressure on the US Dollar. Market sentiment is leaning towards expectations of the Federal Reserve (Fed) commencing an easing cycle, with speculations pointing towards a potential start in June. Traders will likely watch Consumer Confidence for February on Tuesday.
Atlanta Fed President Raphael Bostic anticipates only one rate cut this year, emphasizing the potential for increased disruption if rates are reduced prematurely. Conversely, Chicago Fed President Austan Goolsbee aligns with the majority of the board, foreseeing three cuts. However, Goolsbee emphasizes the importance of additional evidence showing a decline in inflation before advocating for rate cuts.
- Gold price struggles to gain any meaningful traction, though the downside seems cushioned.
- The Fed projected three rate cuts in 2024, which undermines the USD and continues to lend support.
- Tuesday’s US macro data to provide some impetus ahead of the US PCE Price Index on Friday.
Gold price (XAU/USD) struggles to capitalize on the previous day's modest gains and oscillates in a narrow band around the $2,170 level during the Asian session on Tuesday. Meanwhile, the fundamental backdrop warrants some caution before placing aggressive bearish bets around the precious metal and positioning for an extension of the recent sharp pullback from a record peak near the $2,223 region touched last Thursday.
The Federal Reserve (Fed) last week projected a less restrictive monetary policy going forward and signaled that it remains on track to cut interest rates by 75 basis points this year. This, in turn, keeps the US Dollar (USD) bulls on the defensive and acts as a tailwind for the non-yielding Gold price. Apart from this, rising geopolitical tensions further seem to underpin the safe-haven XAU/USD and should help limit any meaningful slide.
Daily Digest Market Movers: Gold price continues to draw support from rising Fed rate cut bets
- Traders are pricing in a 70% probability that the Federal Reserve will start cutting rates in June, which keeps the US Dollar bulls on the defensive and acts as a tailwind for the non-yielding Gold price.
- Several Fed officials, however, expressed concern about still-sticky inflation and stronger-than-expected US macro data, helping limit USD losses and capping the precious metal's upside.
- Atlanta Fed President Raphael Bostic said on Monday that he expects the US economy and inflation to slow gradually and anticipates the US central bank to lower the policy rate only once this year.
- Chicago Fed President Austan Goolsbee noted that three cuts in 2024 were in line with his thinking, though the US central bank needs to see progress in inflation and strike a balance with its dual mandate.
- Separately, Fed Governor Lisa Cook said that inflation has fallen considerably, though the path of disinflation, as expected, has been bumpy and uneven, while the labor market has remained strong.
- Traders look to Tuesday's US economic docket – featuring Durable Goods Orders, Conference Board's Consumer Confidence Index and the Richmond Manufacturing Index – for some impetus.
- The market focus, however, will remain glued to the US Personal Consumption Expenditures (PCE) Price Index data, or the Fed's preferred inflation gauge scheduled for release on Friday.
- In the meantime, geopolitical risks stemming from the protracted Russia-Ukraine war and concerns about whether the UN resolution will lead to an actual ceasefire in the Gaza Strip could underpin the XAU/USD.
Technical Analysis: Gold price seems poised to climb further, $2,147-2,146 holds the key for bulls
From a technical perspective, weakness below the overnight swing low, around the $2,164-2,163 region, is likely to find some support near the $2,156-2,155 area ahead of the $2,147-2,146 horizontal zone. A convincing break below the latter could drag the Gold price further towards the next relevant support near the $2,128-2,127 zone en route to the $2,100 round figure.
Meanwhile, the Relative Strength Index (RSI) on the daily chart has eased from the overbought territory and favours bullish traders. That said, the $2,200 psychological mark could act as an immediate strong barrier hurdle, above which a fresh bout of technical buying should lift the Gold price towards the record high, around the $2,223 zone touched last Thursday.
Gold FAQs
Gold has played a key role in human’s history as it has been widely used as a store of value and medium of exchange. Currently, apart from its shine and usage for jewelry, the precious metal is widely seen as a safe-haven asset, meaning that it is considered a good investment during turbulent times. Gold is also widely seen as a hedge against inflation and against depreciating currencies as it doesn’t rely on any specific issuer or government.
Central banks are the biggest Gold holders. In their aim to support their currencies in turbulent times, central banks tend to diversify their reserves and buy Gold to improve the perceived strength of the economy and the currency. High Gold reserves can be a source of trust for a country’s solvency. Central banks added 1,136 tonnes of Gold worth around $70 billion to their reserves in 2022, according to data from the World Gold Council. This is the highest yearly purchase since records began. Central banks from emerging economies such as China, India and Turkey are quickly increasing their Gold reserves.
Gold has an inverse correlation with the US Dollar and US Treasuries, which are both major reserve and safe-haven assets. When the Dollar depreciates, Gold tends to rise, enabling investors and central banks to diversify their assets in turbulent times. Gold is also inversely correlated with risk assets. A rally in the stock market tends to weaken Gold price, while sell-offs in riskier markets tend to favor the precious metal.
The price can move due to a wide range of factors. Geopolitical instability or fears of a deep recession can quickly make Gold price escalate due to its safe-haven status. As a yield-less asset, Gold tends to rise with lower interest rates, while higher cost of money usually weighs down on the yellow metal. Still, most moves depend on how the US Dollar (USD) behaves as the asset is priced in dollars (XAU/USD). A strong Dollar tends to keep the price of Gold controlled, whereas a weaker Dollar is likely to push Gold prices up.
- Indian Rupee gains traction on Tuesday, backed by the softer US Dollar.
- Higher oil prices amid the rising tensions in the Middle East and Eastern Europe could weigh on the INR.
- US Conference Board Consumer Confidence Index, Durable Goods Orders, and House Price Index will be released on Tuesday.
Indian Rupee (INR) recovers some lost ground on Tuesday amid the weaker US Dollar (USD). Nonetheless, the INR fell to an all-time low of 83.48 on Friday due to broad weakness in its Asian peers and the aggressive local demand for the USD. Meanwhile, the renewed USD demand and higher oil prices amid the escalating geopolitical tensions in the Middle East and Eastern Europe might drag the INR lower and cap the INR’s upside for the time being.
The US Consumer Confidence report by the Conference Board, Durable Goods Orders, and the FHFA’s House Price Index are due on Tuesday. Later this week, the US Gross Domestic Product Annualized (Q4) will be released on Thursday, which is expected to remain steady at 3.2%. Attention will shift to the US Personal Consumption Expenditures Price Index (PCE) data for February. The headline PCE is estimated to show an increase of 0.4% MoM, while the Core PCE is projected to rise by 0.3% MoM. On the Indian docket, the Indian Current Account data will be released on Thursday.
Daily Digest Market Movers: Indian Rupee stays firm despite global headwinds
- India's foreign exchange reserves reached an all-time high of $642.49 billion for the week ended March 15, according to the Reserve Bank of India (RBI).
- The rise in foreign exchange reserves was boosted by the maturity of a $5 billion Dollar/Rupee swap that matured on March 11.
- India’s Gross Domestic Product (GDP) growth estimate for the current fiscal year has revised to 7.6% from 7.3%, signaling the strength of the Indian economy.
- The RBI is likely to keep the repo rate on hold at 6.50% at least until the end of Q2 of 2024 and expects to cut interest rates by 25 basis points (bps) in Q3 2024.
- The US February New Home Sales dropped 0.3% MoM from a 1.7% gain in January, below market expectations for a 2.3% MoM rise.
- The Dallas Fed Manufacturing Survey fell to -14.4 in March from the previous reading of -11.3.
Technical Analysis: Indian Rupee resumes longer-term uptrend
Indian Rupee trades strongly on the day. However, USD/INR resumes its upside in the longer term since the pair surged above a multi-month-old descending trend channel last week.
In the near term, the bullish outlook of USD/INR remains intact as the pair holds above the key 100-day Exponential Moving Average (EMA) on the daily chart. Additionally, the 14-day Relative Strength Index lies above the 50 midline, indicating there is still room for near-term USD/INR appreciation.
An all-time high of 83.49 remains a tough nut to crack for USD/INR buyers. A decisive break above this level will pave the way to the 84.00 psychological level. On the flip side, the resistance-turned-support level at 83.20 acts as an initial support level. The crucial contention level is seen at the confluence of the 100-day EMA and the round figure of the 83.00 mark.
US Dollar price today
The table below shows the percentage change of US Dollar (USD) against listed major currencies today. US Dollar was the weakest against the New Zealand Dollar.
| USD | EUR | GBP | CAD | AUD | JPY | NZD | CHF | |
| USD | -0.05% | -0.04% | -0.05% | -0.13% | -0.05% | -0.14% | 0.02% | |
| EUR | 0.05% | 0.00% | -0.01% | -0.08% | 0.00% | -0.09% | 0.06% | |
| GBP | 0.04% | 0.01% | -0.01% | -0.08% | 0.00% | -0.08% | 0.06% | |
| CAD | 0.06% | 0.01% | 0.01% | -0.07% | 0.00% | -0.08% | 0.07% | |
| AUD | 0.12% | 0.08% | 0.08% | 0.07% | 0.09% | -0.01% | 0.14% | |
| JPY | 0.04% | 0.00% | -0.01% | -0.01% | -0.07% | -0.08% | 0.05% | |
| NZD | 0.14% | 0.09% | 0.10% | 0.09% | 0.01% | 0.10% | 0.16% | |
| CHF | -0.01% | -0.06% | -0.06% | -0.07% | -0.14% | -0.05% | -0.16% |
The heat map shows percentage changes of major currencies against each other. The base currency is picked from the left column, while the quote currency is picked from the top row. For example, if you pick the Euro from the left column and move along the horizontal line to the Japanese Yen, the percentage change displayed in the box will represent EUR (base)/JPY (quote).
Indian Rupee FAQs
The Indian Rupee (INR) is one of the most sensitive currencies to external factors. The price of Crude Oil (the country is highly dependent on imported Oil), the value of the US Dollar – most trade is conducted in USD – and the level of foreign investment, are all influential. Direct intervention by the Reserve Bank of India (RBI) in FX markets to keep the exchange rate stable, as well as the level of interest rates set by the RBI, are further major influencing factors on the Rupee.
The Reserve Bank of India (RBI) actively intervenes in forex markets to maintain a stable exchange rate, to help facilitate trade. In addition, the RBI tries to maintain the inflation rate at its 4% target by adjusting interest rates. Higher interest rates usually strengthen the Rupee. This is due to the role of the ‘carry trade’ in which investors borrow in countries with lower interest rates so as to place their money in countries’ offering relatively higher interest rates and profit from the difference.
Macroeconomic factors that influence the value of the Rupee include inflation, interest rates, the economic growth rate (GDP), the balance of trade, and inflows from foreign investment. A higher growth rate can lead to more overseas investment, pushing up demand for the Rupee. A less negative balance of trade will eventually lead to a stronger Rupee. Higher interest rates, especially real rates (interest rates less inflation) are also positive for the Rupee. A risk-on environment can lead to greater inflows of Foreign Direct and Indirect Investment (FDI and FII), which also benefit the Rupee.
Higher inflation, particularly, if it is comparatively higher than India’s peers, is generally negative for the currency as it reflects devaluation through oversupply. Inflation also increases the cost of exports, leading to more Rupees being sold to purchase foreign imports, which is Rupee-negative. At the same time, higher inflation usually leads to the Reserve Bank of India (RBI) raising interest rates and this can be positive for the Rupee, due to increased demand from international investors. The opposite effect is true of lower inflation.
- Australian Dollar rises amid a US Dollar loses ground on lower Treasury yields.
- Australian equity market experiences gains; supporting the Aussie Dollar.
- Greenback struggles with the expectation of the Fed initiating a rate cut cycle starting in June.
The Australian Dollar (AUD) extends its gains for the second successive session on Tuesday. The decline in the US Dollar (USD) helps to support the AUD/USD pair. However, the AUD faced slight downward pressure following the release of the Westpac Consumer Confidence data from Australia, which dipped 1.8% to 84.4 in March 2024 from February's 86.0, easing from 20-month highs.
The Australian equity market found support from expectations of a rate cut, driven by a decline in the Aussie consumer confidence, contributing to the strength of the Australian Dollar. Despite modest weakness on Wall Street overnight, the ASX 200 Index extended its winning streak. Investors are anticipated to closely monitor the release of the Australian monthly Consumer Price Index (CPI) data on Wednesday.
The US Dollar Index (DXY) experienced a second consecutive day of losses, largely attributed to declining US Treasury yields. Market sentiment is leaning towards expectations of the Federal Reserve (Fed) commencing an easing cycle, with speculations pointing towards a potential start in June.
Daily Digest Market Movers: Australian Dollar extends gains on stronger ASX 200
- Australia's government has pledged to support a minimum wage increase aligned with inflation this year, recognizing the ongoing challenges faced by low-income families amid rising living costs.
- China's Premier Li Qiang stated on Sunday that the nation's low inflation rate and low central government debt ratio provide significant leeway for macroeconomic policy adjustments.
- Atlanta Fed President Raphael Bostic expressed his expectation for just one rate cut this year, cautioning that reducing rates prematurely could lead to greater disruption.
- Chicago Fed President Austan Goolsbee aligns with the majority of the board, anticipating three cuts. However, Goolsbee mentioned the necessity for further evidence indicating a decrease in inflation before proceeding with rate cuts.
- US New Home Sales Change declined by 0.3% month-over-month, compared to the previous rise of 1.7%.
- US New Home Sales (MoM) came in at 0.662M, which is below the expected 0.680M in February and 0.664M prior.
- S&P Global Services PMI showed a slight decrease in March, dropping to 51.7 from 52.3. The expected reading was 52.0. Manufacturing PMI rose to 52.5 against the expected 51.7 and 52.2 prior. Composite PMI showed a slight dip to 52.2 from 52.5 prior.
- Initial Jobless Claims for the week ending on March 15 came in at 210K, below the 215K expected and 212K prior.
Technical Analysis: Australian Dollar hovers around the major level of 0.6550
The Australian Dollar trades near 0.6550 on Tuesday. If it surpasses this level, it could encounter immediate resistance around the major barrier of 0.6550, in conjunction with the nine-day Exponential Moving Average (EMA) at 0.6554. A successful breakthrough above this level might propel the AUD/USD pair to test the 38.2% Fibonacci retracement level at 0.6565. On the downside, if the price retreats, a significant support level lies at the psychological mark of 0.6500, followed by March’s low at 0.6477.
AUD/USD: Daily Chart
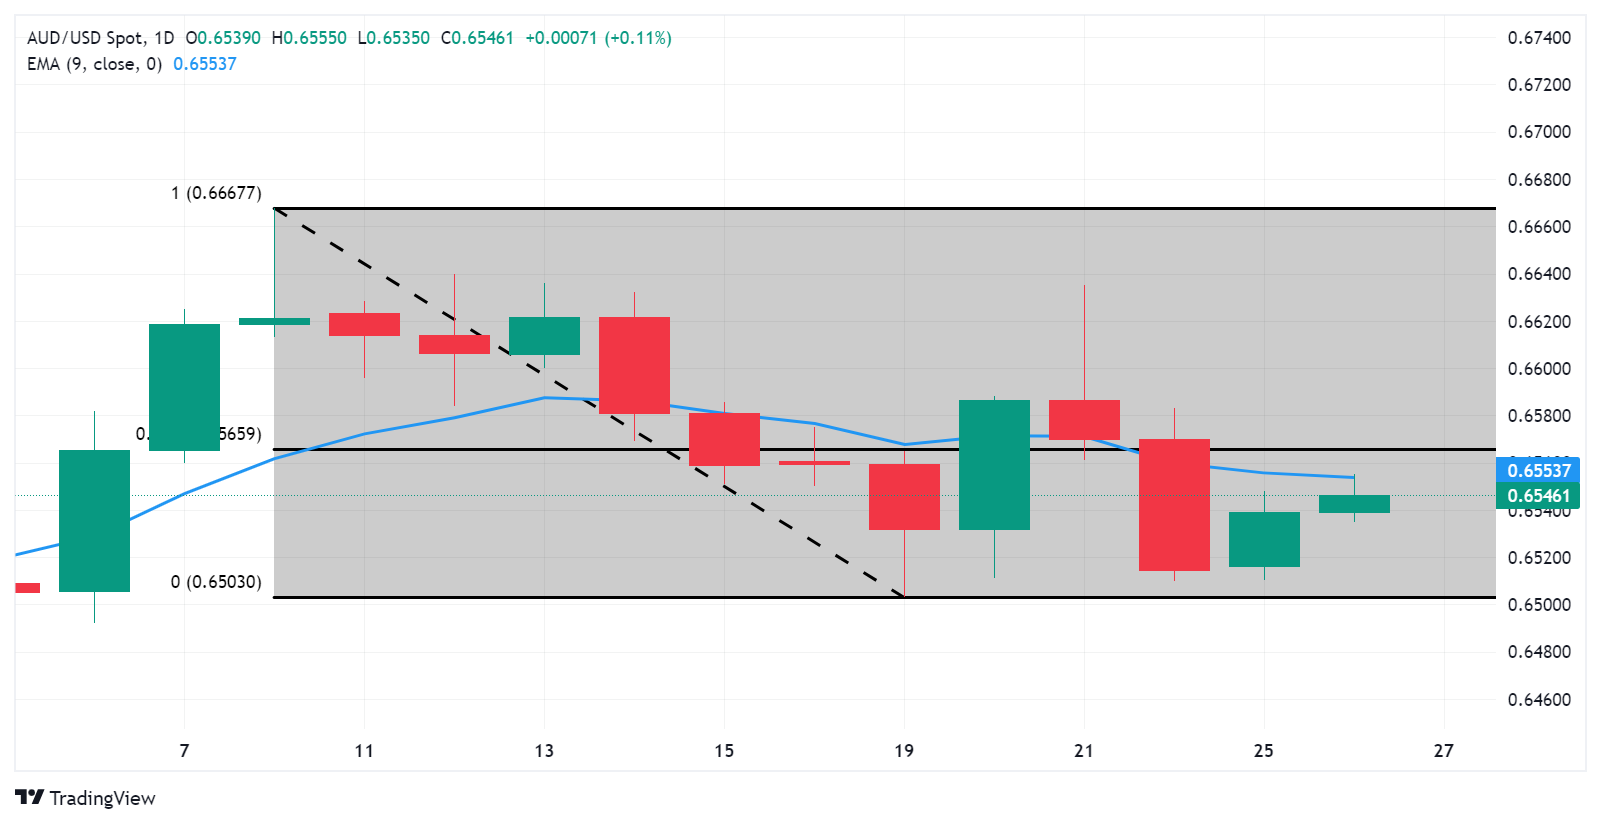
Australian Dollar price today
The table below shows the percentage change of Australian Dollar (AUD) against listed major currencies today. Australian Dollar was the strongest against the Swiss Franc.
| USD | EUR | GBP | CAD | AUD | JPY | NZD | CHF | |
| USD | -0.05% | -0.04% | -0.05% | -0.12% | -0.04% | -0.14% | 0.02% | |
| EUR | 0.05% | 0.03% | 0.00% | -0.08% | 0.00% | -0.10% | 0.06% | |
| GBP | 0.04% | -0.01% | -0.01% | -0.08% | 0.00% | -0.09% | 0.06% | |
| CAD | 0.06% | 0.00% | 0.01% | -0.07% | 0.01% | -0.09% | 0.07% | |
| AUD | 0.12% | 0.08% | 0.09% | 0.08% | 0.09% | -0.02% | 0.14% | |
| JPY | 0.03% | 0.00% | -0.01% | -0.02% | -0.07% | -0.09% | 0.05% | |
| NZD | 0.14% | 0.09% | 0.10% | 0.09% | 0.02% | 0.11% | 0.16% | |
| CHF | -0.01% | -0.06% | -0.06% | -0.07% | -0.13% | -0.04% | -0.15% |
The heat map shows percentage changes of major currencies against each other. The base currency is picked from the left column, while the quote currency is picked from the top row. For example, if you pick the Euro from the left column and move along the horizontal line to the Japanese Yen, the percentage change displayed in the box will represent EUR (base)/JPY (quote).
Australian Dollar FAQs
One of the most significant factors for the Australian Dollar (AUD) is the level of interest rates set by the Reserve Bank of Australia (RBA). Because Australia is a resource-rich country another key driver is the price of its biggest export, Iron Ore. The health of the Chinese economy, its largest trading partner, is a factor, as well as inflation in Australia, its growth rate, and Trade Balance. Market sentiment – whether investors are taking on more risky assets (risk-on) or seeking safe havens (risk-off) – is also a factor, with risk-on positive for AUD.
The Reserve Bank of Australia (RBA) influences the Australian Dollar (AUD) by setting the level of interest rates that Australian banks can lend to each other. This influences the level of interest rates in the economy as a whole. The main goal of the RBA is to maintain a stable inflation rate of 2-3% by adjusting interest rates up or down. Relatively high interest rates compared to other major central banks support the AUD, and the opposite for relatively low. The RBA can also use quantitative easing and tightening to influence credit conditions, with the former AUD-negative and the latter AUD-positive.
China is Australia’s largest trading partner so the health of the Chinese economy is a major influence on the value of the Australian Dollar (AUD). When the Chinese economy is doing well it purchases more raw materials, goods, and services from Australia, lifting demand for the AUD, and pushing up its value. The opposite is the case when the Chinese economy is not growing as fast as expected. Positive or negative surprises in Chinese growth data, therefore, often have a direct impact on the Australian Dollar and its pairs.
Iron Ore is Australia’s largest export, accounting for $118 billion a year according to data from 2021, with China as its primary destination. The price of Iron Ore, therefore, can be a driver of the Australian Dollar. Generally, if the price of Iron Ore rises, AUD also goes up, as aggregate demand for the currency increases. The opposite is the case if the price of Iron Ore falls. Higher Iron Ore prices also tend to result in a greater likelihood of a positive Trade Balance for Australia, which is also positive of the AUD.
The Trade Balance, which is the difference between what a country earns from its exports versus what it pays for its imports, is another factor that can influence the value of the Australian Dollar. If Australia produces highly sought after exports, then its currency will gain in value purely from the surplus demand created from foreign buyers seeking to purchase its exports versus what it spends to purchase imports. Therefore, a positive net Trade Balance strengthens the AUD, with the opposite effect if the Trade Balance is negative.
- GBP/USD attracts some buyers for the second straight day, albeit lacks bullish conviction.
- Rising bets for an imminent interest rate cut by the BoE continue to cap gains for the GBP.
- The Fed’s projected three rate cuts in 2024 keep the USD on the defensive and lend support.
The GBP/USD pair trades with a mild positive bias during the Asian session on Tuesday, albeit lacks follow-through buying and remains below mid-1.2600s, or the overnight swing high. The fundamental backdrop, meanwhile, favours bearish traders and warrants some caution before positioning for an extension of the recent bounce from the 1.2475 area, or a five-week low touched last Friday.
The Bank of England (BoE) Governor Andrew Bailey said last week that expectations of interest rate cuts this year were not unreasonable. This comes after two BoE policymakers, who previously voted for higher rates, changed their positions to keep borrowing costs steady at 5.25%, which might continue to undermine the British Pound (GBP). The US Dollar (USD), on the other hand, stalls the previous day's corrective pullback from the vicinity of the monthly peak amid the optimistic outlook for the US economy. This further contributes to capping the upside for the GBP/USD pair.
Moreover, several Fed officials expressed concern about sticky inflation and stronger-than-expected US macro data. In fact, Atlanta Fed President Raphael Bostic expects the US economy and inflation to slow gradually and anticipates only one rate cut this year. Separately, Chicago Fed President Austan Goolsbee said that the US central bank needs to see progress in inflation and strike a balance with its dual mandate. Meanwhile, Fed Governor Lisa Cook said that there are risks to easing policy too much or too soon as well as too late as the path of disinflation has been bumpy and uneven.
The Fed, however, had signalled last week that it remains on track to cut interest rates by 75 basis points this year, which acts as a headwind for the US Treasury bond yields. This, along with the underlying bullish tone around the equity markets, might hold back traders from placing aggressive bullish bets around the safe-haven Greenback and lend some support to the GBP/USD pair. Market participants now look to the US economic docket – featuring Durable Goods Orders, the Conference Board's Consumer Confidence Index and the Richmond Manufacturing Index– for a fresh impetus.
- The Japanese Yen continues with its struggle to gain any meaningful traction on Tuesday.
- Intervention fears lend some support, while the BoJ policy uncertainty acts as a headwind.
- Traders look forward to the BoJ core CPI for a fresh impetus ahead of the US macro data.
The Japanese Yen (JPY) extends its sideways consolidative price move during the Asian session on Tuesday and remains well within the striking distance of the YTD low against its American counterpart. The overnight comments by Japan's vice-finance minister for international affairs, Masato Kanda fuelled speculations that authorities are prepared to take appropriate action and about to use market operations to prop up the domestic currency. This turns out to be a key factor lending some support to the JPY and acting as a headwind for the USD/JPY pair.
That said, the uncertainty over the Bank of Japan's (BoJ) future policy steps is holding back the JPY bulls from placing aggressive bets. The US Dollar (USD), on the other hand, continues to draw support from the optimism around the US economic growth, which might force the Federal Reserve (Fed) to keep interest rates higher for longer. This, in turn, should help limit any corrective decline for the USD/JPY pair ahead of the BoJ Core CPI later today and the US Personal Consumption Expenditures (PCE) Price Index data, scheduled for release on Friday.
Daily Digest Market Movers: Japanese Yen oscillates in a range amid mixed fundamental cues
- Japan's Vice Minister of Finance for International Affairs Masato Kanda lifts the threat of actual intervention on Monday and turns out to be a key factor lending some support to the Japanese Yen.
- Kanda said that the movement in the JPY was not in line with fundamentals and was driven by speculation and that authorities will take action against excessive fluctuations, without ruling out any options.
- Adding to this, Finance Minister Shunichi Suzuki reiterated on Tuesday that it is important for currencies to move in a stable manner reflecting fundamentals and that rapid FX moves are undesirable.
- The Bank of Japan indicated last week that financial conditions would remain accommodative and fell short of offering any guidance about the pace of policy normalization, capping gains for the JPY.
- Consumer inflation in Japan remains above the central bank's 2% target, which, along with the positive outcome of spring wage negotiations, supports prospects for further policy tightening by the BoJ.
- The Federal Reserve last week upgraded its real GDP growth estimates to 2.1% by the end of this year from 1.4% projected in December and also raised the forecast for core inflation to 2.6% from 2.4%.
- The Fed, however, signaled that it remains on track to cut interest rates by 75 basis points this year despite concerns about still-sticky inflation and the incoming stronger-than-expected economic data.
- Atlanta Fed President Raphael Bostic said on Monday that he expects the US economy and inflation to slow gradually and anticipates the US central bank to lower the policy rate only once this year.
- Chicago Fed President Austan Goolsbee noted that three cuts in 2024 were in line with his thinking, though the US central bank needs to see progress in inflation and strike a balance with its dual mandate.
- Separately, Fed Governor Lisa Cook said inflation has fallen considerably, though the path of disinflation, as expected, has been bumpy and uneven, while the labor market has remained strong.
- Investors now look forward to the release of the BoJ Core CPI for some meaningful impetus ahead of the US macro data –Durable Goods Orders and the Conference Board's Consumer Confidence Index.
Technical Analysis: USD/JPY bulls retain control, await a move beyond the multi-decade peak
From a technical perspective, last week's swing high, around the 151.85 region, could act as an immediate hurdle. Some follow-through buying beyond the multi-decade high, around the 152.00 mark touched in November 2022, will be seen as a fresh trigger for bullish traders. The USD/JPY pair might then build on its well-established uptrend witnessed since January 2023. On the flip side, the 151.00 mark now seems to have emerged as strong support, below which spot prices could accelerate the fall to the 150.25 region. This is followed by the 150.00 psychological mark, which if broken will expose the next relevant support near the 149.35-149.30 region before the pair eventually drops to the 149.00 round-figure mark.
Japanese Yen FAQs
The Japanese Yen (JPY) is one of the world’s most traded currencies. Its value is broadly determined by the performance of the Japanese economy, but more specifically by the Bank of Japan’s policy, the differential between Japanese and US bond yields, or risk sentiment among traders, among other factors.
One of the Bank of Japan’s mandates is currency control, so its moves are key for the Yen. The BoJ has directly intervened in currency markets sometimes, generally to lower the value of the Yen, although it refrains from doing it often due to political concerns of its main trading partners. The current BoJ ultra-loose monetary policy, based on massive stimulus to the economy, has caused the Yen to depreciate against its main currency peers. This process has exacerbated more recently due to an increasing policy divergence between the Bank of Japan and other main central banks, which have opted to increase interest rates sharply to fight decades-high levels of inflation.
The BoJ’s stance of sticking to ultra-loose monetary policy has led to a widening policy divergence with other central banks, particularly with the US Federal Reserve. This supports a widening of the differential between the 10-year US and Japanese bonds, which favors the US Dollar against the Japanese Yen.
The Japanese Yen is often seen as a safe-haven investment. This means that in times of market stress, investors are more likely to put their money in the Japanese currency due to its supposed reliability and stability. Turbulent times are likely to strengthen the Yen’s value against other currencies seen as more risky to invest in.
- ASX 200 Index continues its winning streak that began on March 15.
- Australian equity market gains grounds despite a lower Wall Street overnight.
- Adam Neumann made a bid to acquire the bankrupt WeWork for more than $500 million.
The ASX 200 Index recovers its intraday losses and continues its winning streak following the Westpac Consumer Confidence data from Australia, which fell 1.8% to 84.4 in March 2024 from 86.0 in February, easing from 20-month highs. On Tuesday, the index trades higher around 7,800, up by 0.25%, at the time of writing. However, Wall Street experienced a modest weakness overnight.
Today sees a significant drop in the A-VIX, plummeting 2.26% to 10.82. The All Ords is down by 0.25% at 8,051. Among the top performers within the ASX 200 Index, Elders surged by 5.04% to 9.38; Beach Energy rose by 4.61% to 1.82; and Premier Investments climbed by 2.99% to 31.56. The bottom performing stocks are Atlas Arteria dipped by 0.49% to 5.12; Arcadium Lithium experienced a 4.99% decline to 4.19; and Idp Education dropped by 3.51% to 17.46.
The Chamber of Commerce suggests that lifting the uranium mining ban in Western Australia (WA) could lead to a yearly economic boost of $1 billion and the creation of 9,000 jobs. A report by the Chamber of Commerce and Industry of Western Australia (CCIWA) echoes the call by the Liberal party for a change in attitude towards uranium mining in WA.
Lithium Universe has completed a study aimed at identifying a suitable port location for importing spodumene to its proposed Bécancour lithium refinery in Canada. The company concluded that the optimal port would be located in Bécancour, approximately 2.5 kilometers from the refinery site in Québec.
Mitre Mining has made significant discoveries at the Cristal target within its newly-acquired Cerro Bayo project in Chile, uncovering outcropping silver-gold vein extensions boasting impressive grades of up to 32,849 grams per tonne of silver and 298.6 grams per tonne of gold.
Adam Neumann, the former chief executive and co-founder of WeWork, has recently made a bid to acquire the bankrupt co-working company for more than $500 million.
Australian Stock Market FAQs
Stock markets in Australia are managed by the Australian Securities Exchange (ASX), headquartered in Sydney. The main indices are the S&P/ASX 200 and the S&P/ASX 300, which track the performance of the 200 and 300 largest stocks by market capitalization listed on the exchange, respectively. The S&P/ASX 200 was launched in April 2000, and it is rebalanced every quarter.
Almost half of the index belongs to the financial sector, with major banks like the Commonwealth Bank of Australia, Westpac or National Australia Bank. The so-called materials sector is also relevant – comprising almost 20% of the weighting in the index – with mining giants such as BHP Group or Rio Tinto. Other important sectors are biotechnology, real estate, consumer staples, and industrials.
Many different factors drive the ASX 200, but mainly it is the aggregate performance of the component companies revealed in their quarterly and annual earnings reports the main factor behind its performance. Commodity prices can also affect the index given its significant share of mining companies. Macroeconomic data such as Gross Domestic Product (GDP) growth, inflation, or unemployment data from Australia is also important as they are indicators of the health of the country’s economy and thus the profitability of its largest companies. Global economic conditions may also play a role, particularly from China, as the Asian country is Australia’s largest trading partner.
The level of interest rates in Australia, set by the Reserve Bank of Australia (RBA), also influences the ASX 200 and ASX 300 indexes as it affects the cost of credit, on which many firms are heavily reliant. Generally, when the RBA cuts interest rates (or signals it is going to do it), it is positive for the Australian stock market as it means a lower cost of credit for companies and higher economic growth ahead, likely boosting sales. On the contrary, if the RBA signals that it will increase interest rates, this tends to weigh on the index. As always, there is a caveat: banks. Financial institutions tend to benefit from higher interest rates because they earn more from lending to other businesses, thus boosting their overall income.
On Tuesday, the People’s Bank of China (PBoC) set the USD/CNY central rate for the trading session ahead at 7.0943 as compared to the previous day's fix of 7.0996 and 7.2037 Reuters estimates.
- WTI prices gain momentum on the softer USD and supply concerns.
- Disruptions to oil refineries in Russia by recent attacks, support the upward trajectory of WTI prices.
- The delay of interest rate cuts by the US Federal Reserve (Fed) might cap the upside of WTI prices.
- The US February PCE report on Friday will be the highlight of this week.
Western Texas Intermediate (WTI), the US crude oil benchmark, is trading around $82.00 on Tuesday. WTI prices edge higher amid the weaker US Dollar (USD) and the renewed geopolitical tensions in the Middle East and Eastern Europe, which fuel fears of supply disruption.
The escalating geopolitical tension in the Middle East, combined with a rise in attacks on energy facilities in Russia and Ukraine, raised fears over global oil supplies and lift WTI prices. Disruptions to oil refineries in Russia were caused by Ukraine's recent attacks on Russian oil infrastructure, with at least seven refineries attacked this month alone. This increases the demand for available crude oil shipments. Analysts estimated that these disruptions affected around 12% of Russia's total oil processing capacity.
Apart from this, the anticipation of interest rate cuts by the US Federal Reserve (Fed) this year has lifted the black gold. Lower interest rates typically stimulate the economy, which leads to more demand for WTI prices. Market players will take more cues from the US Personal Consumption Expenditures Price Index (PCE) data for February on Friday for confirmation on the timing of rate cuts. However, if the report shows stronger-than-expected readings, this could delay the expectation of rate cuts from the Fed this year and cap the upside of the WTI prices.
Moving on, oil traders will keep an eye on the US Consumer Confidence by the Conference Board, Durable Goods Orders, and the FHFA’s House Price Index, due on Tuesday. Later this week, the US Gross Domestic Product Annualized (Q4) will be released on Thursday. The US February PCE data will be published on Friday. These events could significantly impact the USD-denominated WTI price. Oil traders will take cues from the data and find trading opportunities around WTI prices.
- Gold Price extends gains around $2,171 amid the weaker USD.
- The upward momentum of gold prices is supported by the expectations of rate cuts by the Fed this year.
- The escalating geopolitical tensions in both Eastern Europe and the Middle East might lift the gold price.
Gold Price (XAU/USD) extends its upside above the mid-$2,150 during the early Asian trading hours on Tuesday. The expectations of interest rate cuts by the US Federal Reserve (Fed) this year and the dovish remarks from Fed officials weigh on the US Dollar (USD) and provide some support to the US Dollar-denominated Gold. At the press time, gold price is trading at $2,171, adding 0.04% on the day.
Meanwhile, the US Dollar Index (DXY), a measure of the value of the USD against a weighted basket of currencies used by US trade partners, retreats from multi-week peaks of 104.50 and hovers around 104.20. The US Treasury bond yields edge slightly higher, with the 10-year yield standing at 4.25%.
The uptick in yellow metal is driven by higher bets on the rate cut expectation in 2024. However, traders will closely monitor the US Personal Consumption Expenditures Price Index (PCE) data for February on Friday for confirmation on the timing of rate cuts. The headline PCE is forecast to show an increase of 0.4% MoM, while the Core figure is expected to rise by 0.3% MoM. Traders have priced in a 70% probability of a June rate cut, versus 65% before the Fed's March meeting last week.
Russia carried out one of its most massive missile and drone attacks on Ukraine's energy infrastructure overnight into Friday since the start of its full-scale invasion more than two years ago, per CNN. That being said, the rising geopolitical tensions in both Eastern Europe and the Middle East could boost the safe-haven flows and benefit the gold price.
Looking ahead, market players will focus on US Consumer Confidence by the Conference Board, Durable Goods Orders, and the FHFA’s House Price Index on Tuesday. Later this week, the US Gross Domestic Product Annualized for the fourth quarter (Q4) will be due on Thursday, and the US PCE report will be released on Friday.
| Pare | Closed | Change, % |
|---|---|---|
| AUDUSD | 0.65386 | 0.43 |
| EURJPY | 164.062 | 0.29 |
| EURUSD | 1.08369 | 0.29 |
| GBPJPY | 191.325 | 0.34 |
| GBPUSD | 1.26362 | 0.34 |
| NZDUSD | 0.60036 | 0.23 |
| USDCAD | 1.35846 | -0.17 |
| USDCHF | 0.89914 | 0.23 |
| USDJPY | 151.411 | 0 |
Japanese Finance Minister Shunichi Suzuki offered some verbal intervention on Tuesday. Suzuki said it’s important for currencies to move in a stable manner reflecting fundamentals and he will closely watch foreign exchange moves with a high sense of urgency.
Key quotes
“Important for currencies to move in a stable manner reflecting fundamentals.”
“Rapid FX moves undesirable.”
“No comment on FX intervention.”
“Closely watching FX moves with a high sense of urgency.”
“Won't rule out any steps to respond to disorderly FX moves.”
Market reaction
At the time of writing, USD/JPY is trading 0.05% lower on the day at 151.34.
Bank of Japan FAQs
The Bank of Japan (BoJ) is the Japanese central bank, which sets monetary policy in the country. Its mandate is to issue banknotes and carry out currency and monetary control to ensure price stability, which means an inflation target of around 2%.
The Bank of Japan has embarked in an ultra-loose monetary policy since 2013 in order to stimulate the economy and fuel inflation amid a low-inflationary environment. The bank’s policy is based on Quantitative and Qualitative Easing (QQE), or printing notes to buy assets such as government or corporate bonds to provide liquidity. In 2016, the bank doubled down on its strategy and further loosened policy by first introducing negative interest rates and then directly controlling the yield of its 10-year government bonds.
The Bank’s massive stimulus has caused the Yen to depreciate against its main currency peers. This process has exacerbated more recently due to an increasing policy divergence between the Bank of Japan and other main central banks, which have opted to increase interest rates sharply to fight decades-high levels of inflation. The BoJ’s policy of holding down rates has led to a widening differential with other currencies, dragging down the value of the Yen.
A weaker Yen and the spike in global energy prices have led to an increase in Japanese inflation, which has exceeded the BoJ’s 2% target. Still, the Bank judges that the sustainable and stable achievement of the 2% target has not yet come in sight, so any sudden change in the current policy looks unlikely.


© 2000-2026. All rights reserved.
This site is managed by Teletrade D.J. LLC 2351 LLC 2022 (Euro House, Richmond Hill Road, Kingstown, VC0100, St. Vincent and the Grenadines).
The information on this website is for informational purposes only and does not constitute any investment advice.
The company does not serve or provide services to customers who are residents of the US, Canada, Iran, The Democratic People's Republic of Korea, Yemen and FATF blacklisted countries.
Making transactions on financial markets with marginal financial instruments opens up wide possibilities and allows investors who are willing to take risks to earn high profits, carrying a potentially high risk of losses at the same time. Therefore you should responsibly approach the issue of choosing the appropriate investment strategy, taking the available resources into account, before starting trading.
Use of the information: full or partial use of materials from this website must always be referenced to TeleTrade as the source of information. Use of the materials on the Internet must be accompanied by a hyperlink to teletrade.org. Automatic import of materials and information from this website is prohibited.
Please contact our PR department if you have any questions or need assistance at pr@teletrade.global.
transfers