- Analytics
- News and Tools
- Market News
Analytics, News, and Forecasts for CFD Markets: currency news — 29-03-2024.
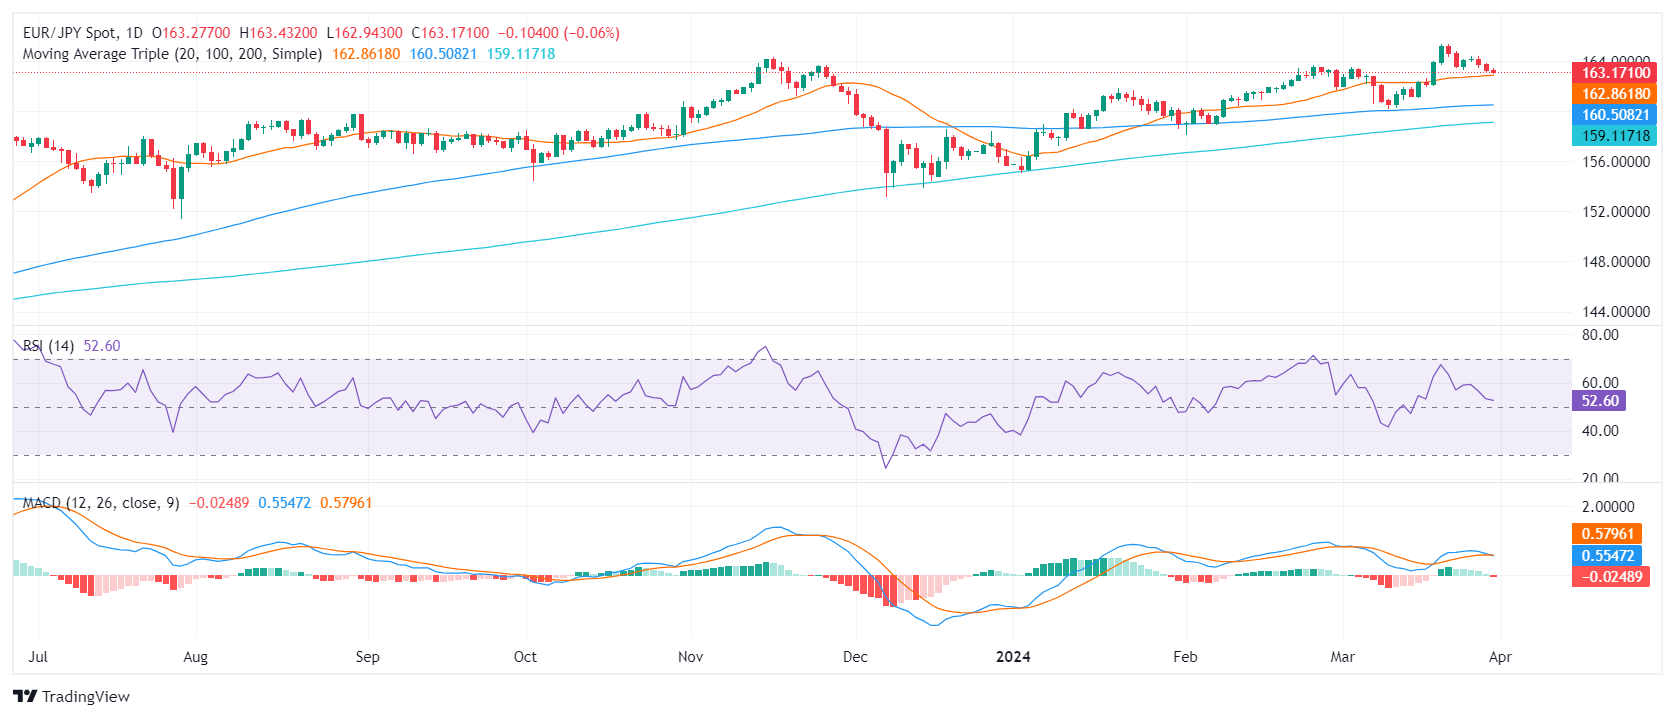
- The daily chart reveals slightly bullish momentum, with RSI at 52, signifying resilient buying traction.
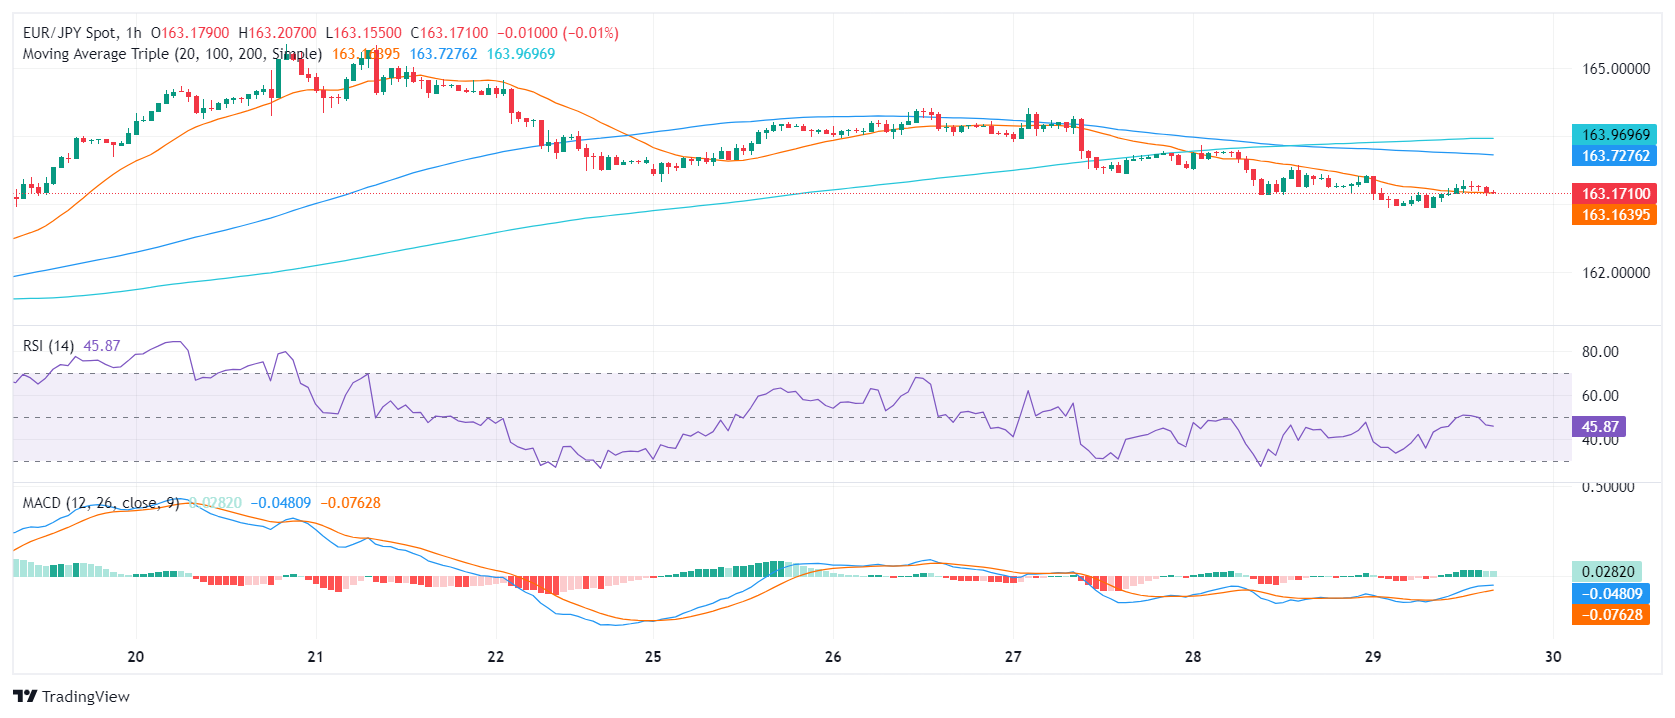
- Indicators in the hourly chart denote a mild downward trend, which could hint at a potential shift.
- Buyers must successfully maintain the main SMAs to mitigate bearish threats and ensure bullish continuation.
The EUR/JPY pair is currently trading at 163.13, exhibiting minimal losses. Despite the declines, the broader momentum remains bullish, but this sentiment remains finely balanced and open to fluctuations.
On the daily chart, the EUR/JPY pair indicates signs of a relatively positive to neutral momentum. The Relative Strength Index (RSI) has maneuvered within the positive territory over the most recent sessions, with the latest reading positioned at 52. This reading suggests a slightly bullish momentum, yet potentially susceptible to changes in market sentiment. Meanwhile, the red bar on the Moving Average Convergence Divergence (MACD) histogram suggests negative momentum, signaling that the sellers might be gearing up.
EUR/JPY daily chart
Shifting focus onto the hourly chart, fluctuations are more noticeable. The RSI values display a slight downward trend throughout the latest hours, reaching as low as 46. Alongside this, the consistently shrinking green bars of the MACD confirms the overall bearish momentum.
EUR/JPY hourly chart
In conclusion, while short-term indicators might show an inclination toward a sellers' market, it's important to note this is within a broader bullish context as seen on the daily chart. Buyers must step in and defend the 20-day SMA at 162.85 to leave the overall bullish trend intact.
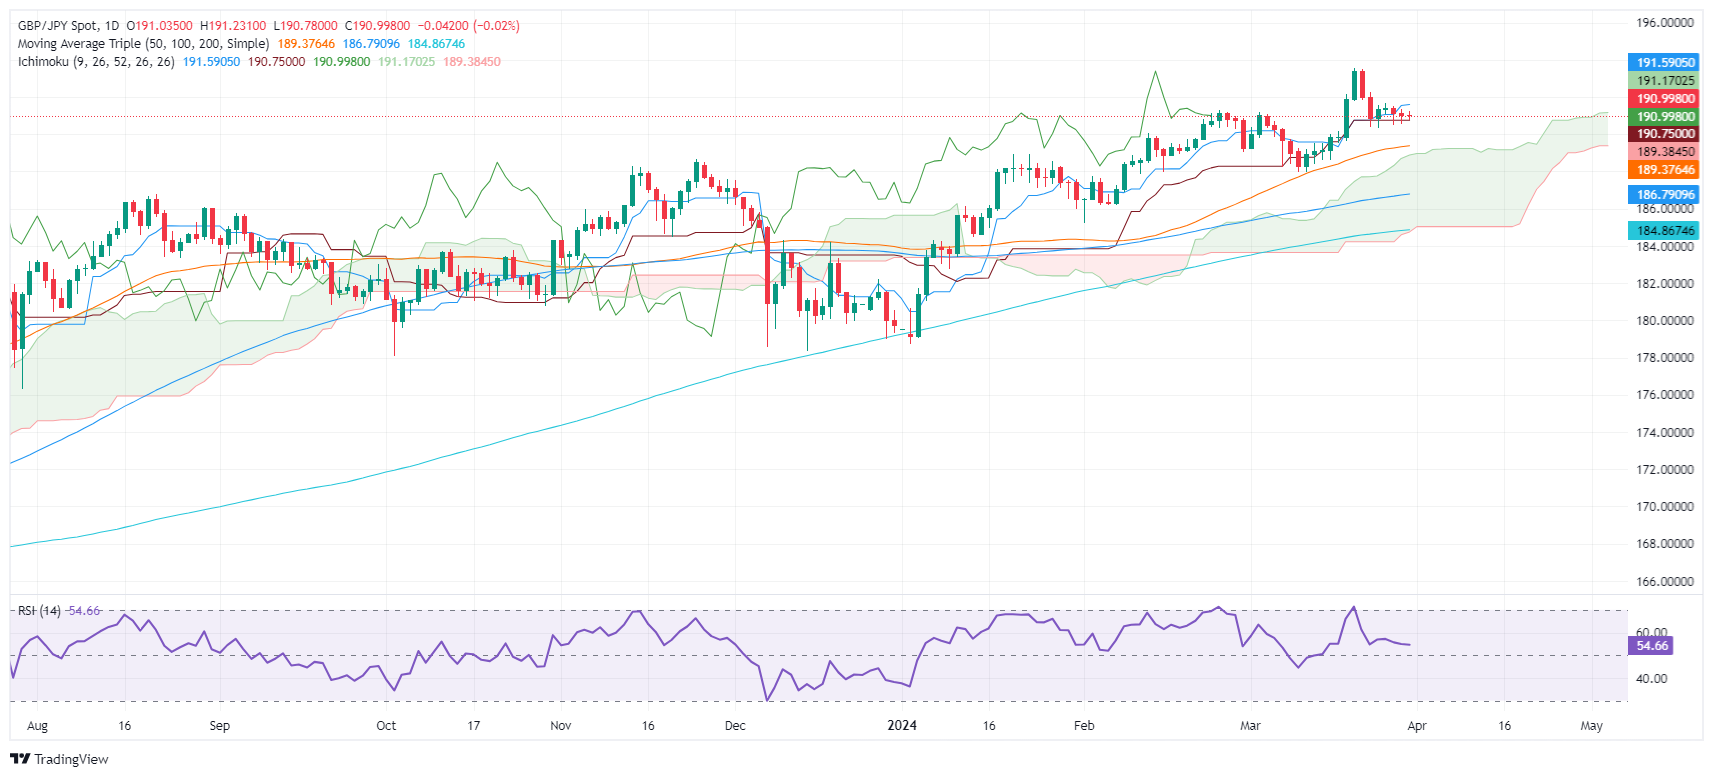
- GBP/JPY hovers around 191.00, with trading subdued due to the Easter holiday.
- Technical indicators show potential for movement, with key levels at 191.57 and 190.74, marking immediate targets.
- Future direction hinges on breaking 192.00 resistance or 190.00 support.
On Friday, the GBP/JPY remained steady at around 191.00, almost flat, as the financial markets remained closed in observance of the Easter holiday. In the meantime, Fed Chair Jerome Powell crossed the newswires, saying that monetary policy is well placed to react to a range of different data paths.
GBP/JPY Price Analysis: Technical outlook
The daily chart suggests the GBP/JPY is trading sideways, capped on the upside by the Tenkan-Sen at 191.57. Since the pair fell below the latter, the exchange rate has remained beneath the 191.40 area, which has opened the door for further downside.
A push below 191.00 could pave the way for a deeper pullback. The next support would be the Kijun Sen at 190.74, followed by the March 25 wing low of 190.33. A breach of the latter would expose the next support level at 190.00.
On the other hand, if GBP/JPY stays afloat and rallies above the Tenkan-Sen, that would open the door to challenge 192.00. Further gains are seen above that level, with the 193.00 mark, followed by the current year-to-date (YTD) high of 193.53.
GBP/JPY Price Action – Daily Chart
Federal Reserve Chair Jerome Powell participates in a discussion at the Macroeconomics and Monetary Policy Conference, in San Francisco.
Key quotes:
Latest core inflation numbers real progress.
We expect inflation to move to 2% on sometimes bumpy path.
If our base case doesn't happen, we would hold rates where they are for longer.
We don't know where rates are going to go back to when this whole thing is over.
The economy is not suffering from this level of rates.
Economy strong without question. Possibility of a recession is not elevated now.
If we see unexpected weakness in labor market, that could draw a policy response.
We won’t make decisions based on political calendars or anything like that.
Market reaction
The US Dollar gains modest upward traction with Powell’s hawkish words. Thinned market conditions do to the widespread Easter Holiday limit price action.
Federal Reserve Chair Jerome Powell participates in a discussion at the Macroeconomics and Monetary Policy Conference, in San Francisco.
Key quotes:
My first thought on PCE was it came in line with expectations.
February reading is definitely more along lines of what we want to see.
Reducing rates too soon would be very disruptive.
Waiting too long could mean unneeded damage to economy and the labour market.
The economy is strong, no hurry to cut rates.
Make the right decisions is more important, we can handle whatever case.
We want to be more confident before we cut rates.
Market reaction
The US Dollar ticked higher as an immediate reaction to his words, although the action is being limited by the Easter Holiday.
- US February’s PCE figures largely met expectations.
- Next week, the focus will be on Nonfarm payrolls for markets to continue placing their bets on the next Fed decisions.
- Hot data may justify a delay in policy rate cuts beyond June.
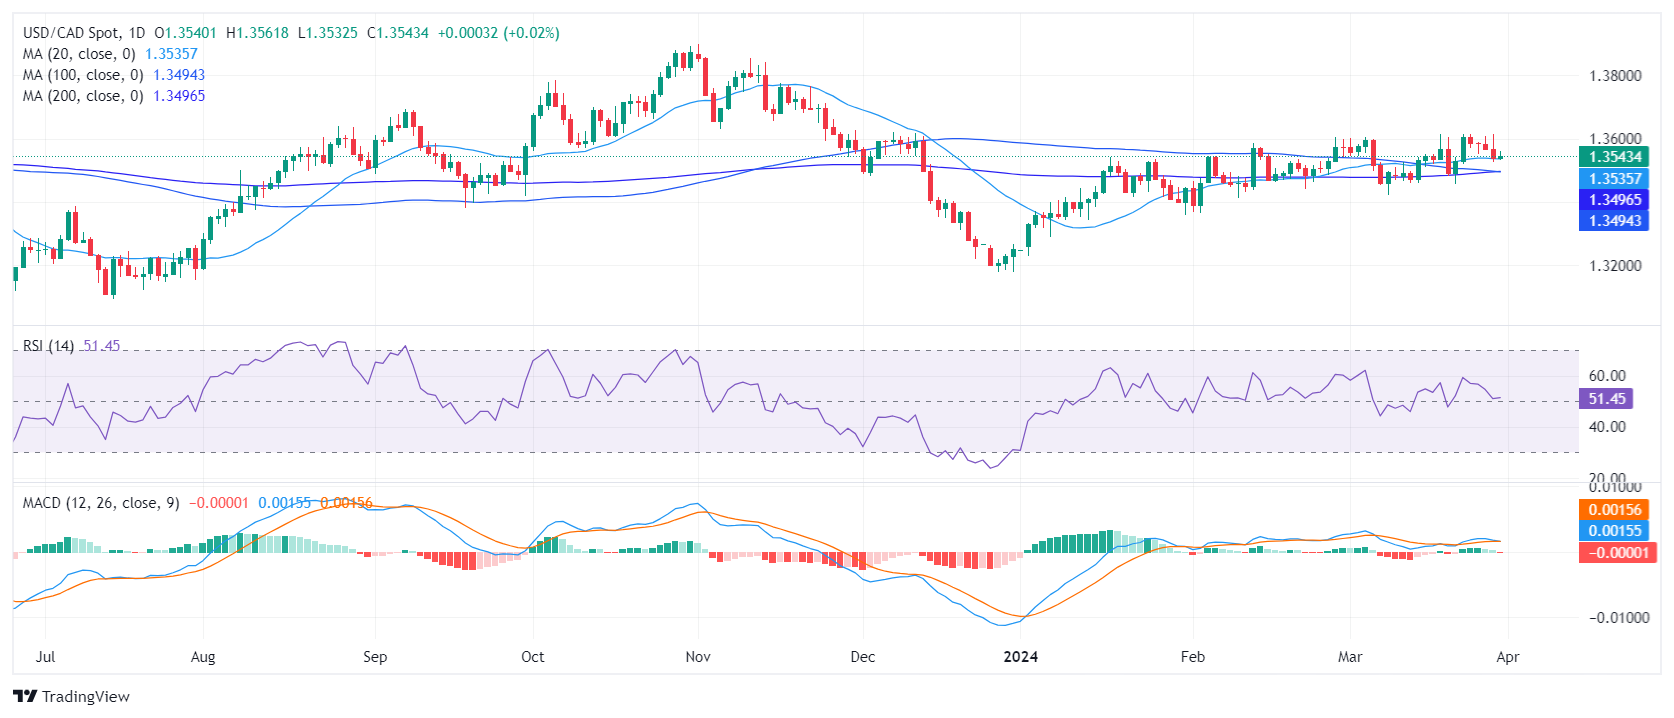
The USD/CAD pair is currently trading around the 1.3543 level on Friday, reflecting minor losses after hitting a high of 1.3560 earlier in the session. While investors digest Personal Consumption Expenditures (PCE) figures, the market will turn its attention toward forthcoming employment-related figures that may add further nuance to the Federal Reserve's (Fed) posture on a probable policy rate delay.
The PCE Price Index, preferred by the Federal Reserve for gauging inflation in the US, saw a slight uptick to 2.5% annually in February, up from January's 2.4%, meeting expectations. The monthly increase of 0.3% was slightly below the forecasted 0.4%. Core PCE, which excludes food and energy, also rose by 2.8% annually, aligning with predictions, with a 0.3% monthly increase. The upward revision of January's core PCE figures suggests a continued trend of inflation, potentially prompting the Federal Reserve to maintain higher interest rates.
Future policy decisions will be influenced by incoming data, and the health of the labor market may potentially lead to adjustments in the timing and scale of rate cuts. Strong employment figures could prompt Fed policymakers to delay rate cuts beyond June and possibly reduce the number of cuts projected for 2024 from three to two, potentially bolstering the US Dollar. As for now, the strongest case scenario continues to be three rate cuts in 2024, starting in June.
USD/CAD technical analysis
On the daily chart, USD/CAD shows a somewhat stable trend. The Relative Strength Index (RSI) primarily maintains itself in positive territory, indicating that buying pressure slightly dominates the market. However, the Moving Average Convergence Divergence (MACD) histogram printed a new red bar which may imply a weak bullish momentum.
Analyzing the Simple Moving Average (SMA), it is seen that on a broader scale, despite showing a neutral outlook in the short term, the pair is above the 20,100,200-day SMAs. This suggests that the bulls command the overall trend, as long as the bulls defend the challenged 20-day average around the 1.3530 area.
USD/CAD daily chart
- USD/MXN falls to 16.57, as the latest US inflation report met forecasts, offering no new impetus for market shifts.
- Fed officials, including Governor Waller, signal a cautious approach to rate cuts, underlining vigilance over inflation trends.
- Investors await further guidance from upcoming Fed speeches..
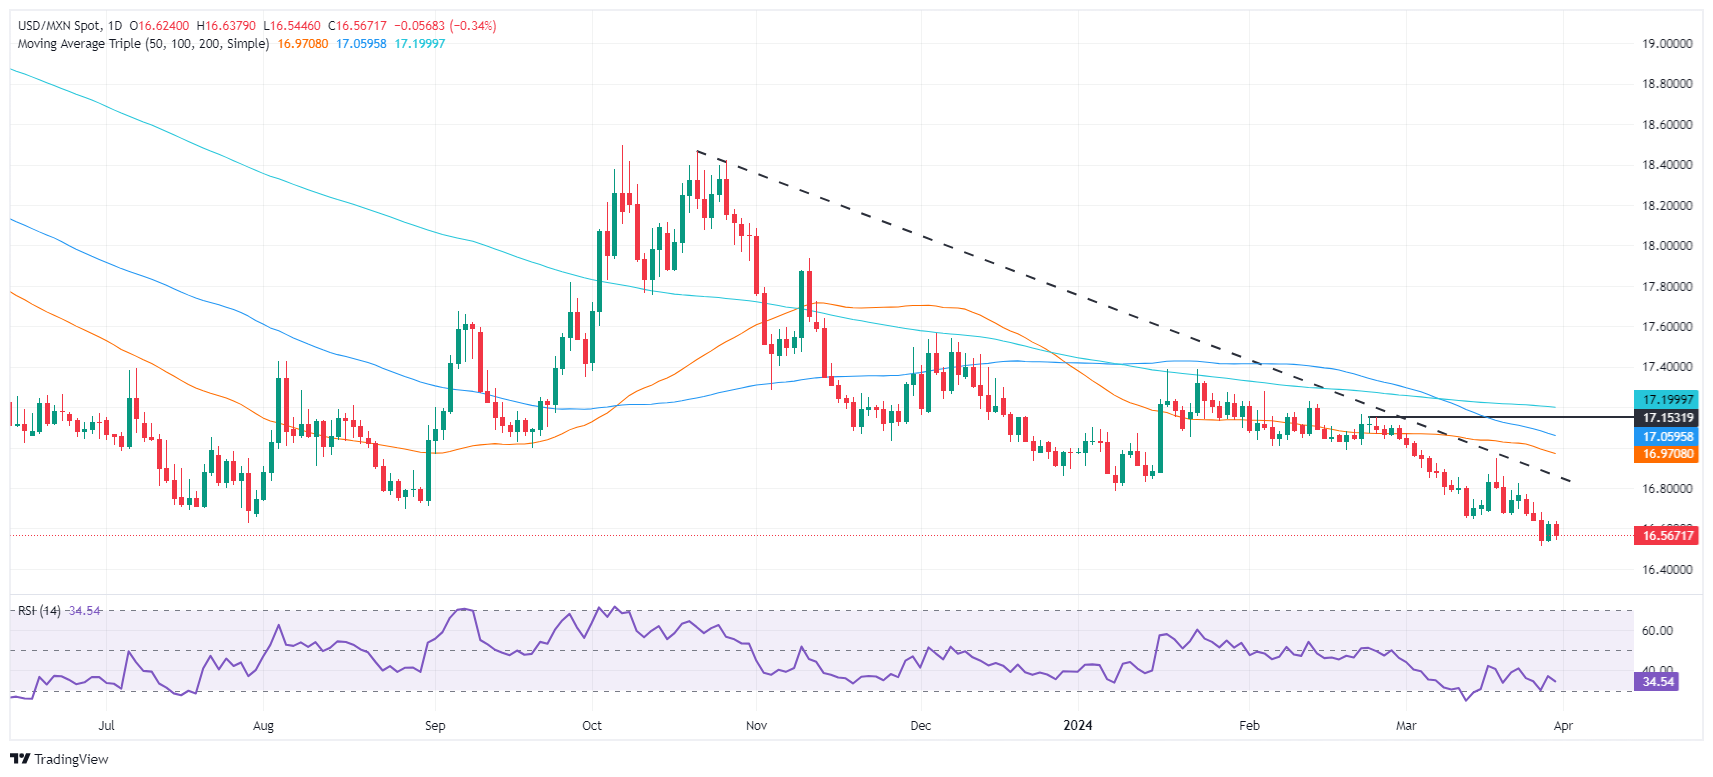
The Mexican Peso (MXN) posted modest gains against the US Dollar (USD) on Friday after the release of inflation data in the United States (US). The Federal Reserve’s (Fed) preferred gauge for inflation, the Core Personal Consumption Expenditure (PCE) price index, met estimates, though it failed to trigger any reaction in the financial markets. The USD/MXN trades at 16.57, down 0.31%.
USD/MXN dips as US inflation aligns with expectations
The US Bureau of Economic Analysis (BEA) reported that February's Core PCE increased by 0.3% month-over-month, coming in lower than the prior month's figures. On an annual basis, the core PCE cooled slightly from 2.9% to 2.8%, aligning with consensus estimates. The headline inflation rate for February also stood at 0.3%, below January's projections, while the year-over-year figure edged up to 2.5% from 2.4%.
Despite somewhat easing inflation, Federal Reserve policymakers remain vigilant. Other inflation metrics, such as the Consumer Price Index (CPI) and the Producer Price Index (PPI), indicate that price pressures could be anchoring above 3%.
Aside from this, traders took some cues from Fed Governor Christopher Waller. He was hawkish, emphasizing that the Fed is not in a hurry to reduce interest rates. The US economic docket will feature San Francisco Fed President Mary Daly and Fed Chair Jerome Powell at 15:20 and 15:30 GMT.
On the Mexican front, the docket will feature the Mexican Ministry of Finance's release of the fiscal balance. Traders are eyeing next week’s S&P Global Manufacturing PMI for March.
USD/MXN Price Analysis: Technical outlook
The USD/MXN trimmed some of its gains today as buyers failed to conquer last year’s low of 16.62. That has opened the door for a pullback, as sellers eye October’s 2015 low of 16.32 ahead of challenging 16.00. On the flip side, if buyers lift the exchange rate above 16.62, that will expose January’s monthly low of 16.78, followed by the March 19 high at 16.94. Next would be the 50-day Simple Moving Average (SMA) at 16.97.
Mexican Peso FAQs
The Mexican Peso (MXN) is the most traded currency among its Latin American peers. Its value is broadly determined by the performance of the Mexican economy, the country’s central bank’s policy, the amount of foreign investment in the country and even the levels of remittances sent by Mexicans who live abroad, particularly in the United States. Geopolitical trends can also move MXN: for example, the process of nearshoring – or the decision by some firms to relocate manufacturing capacity and supply chains closer to their home countries – is also seen as a catalyst for the Mexican currency as the country is considered a key manufacturing hub in the American continent. Another catalyst for MXN is Oil prices as Mexico is a key exporter of the commodity.
The main objective of Mexico’s central bank, also known as Banxico, is to maintain inflation at low and stable levels (at or close to its target of 3%, the midpoint in a tolerance band of between 2% and 4%). To this end, the bank sets an appropriate level of interest rates. When inflation is too high, Banxico will attempt to tame it by raising interest rates, making it more expensive for households and businesses to borrow money, thus cooling demand and the overall economy. Higher interest rates are generally positive for the Mexican Peso (MXN) as they lead to higher yields, making the country a more attractive place for investors. On the contrary, lower interest rates tend to weaken MXN.
Macroeconomic data releases are key to assess the state of the economy and can have an impact on the Mexican Peso (MXN) valuation. A strong Mexican economy, based on high economic growth, low unemployment and high confidence is good for MXN. Not only does it attract more foreign investment but it may encourage the Bank of Mexico (Banxico) to increase interest rates, particularly if this strength comes together with elevated inflation. However, if economic data is weak, MXN is likely to depreciate.
As an emerging-market currency, the Mexican Peso (MXN) tends to strive during risk-on periods, or when investors perceive that broader market risks are low and thus are eager to engage with investments that carry a higher risk. Conversely, MXN tends to weaken at times of market turbulence or economic uncertainty as investors tend to sell higher-risk assets and flee to the more-stable safe havens.
- USD/JPY dips following February's Core PCE data, indicating a gradual cooling of inflation but concerns linger.
- Fed officials maintain a cautious outlook on rate cuts, awaiting further evidence of sustained disinflationary trends.
- Market awaits insights from Fed Chair Powell and other Fed speakers.
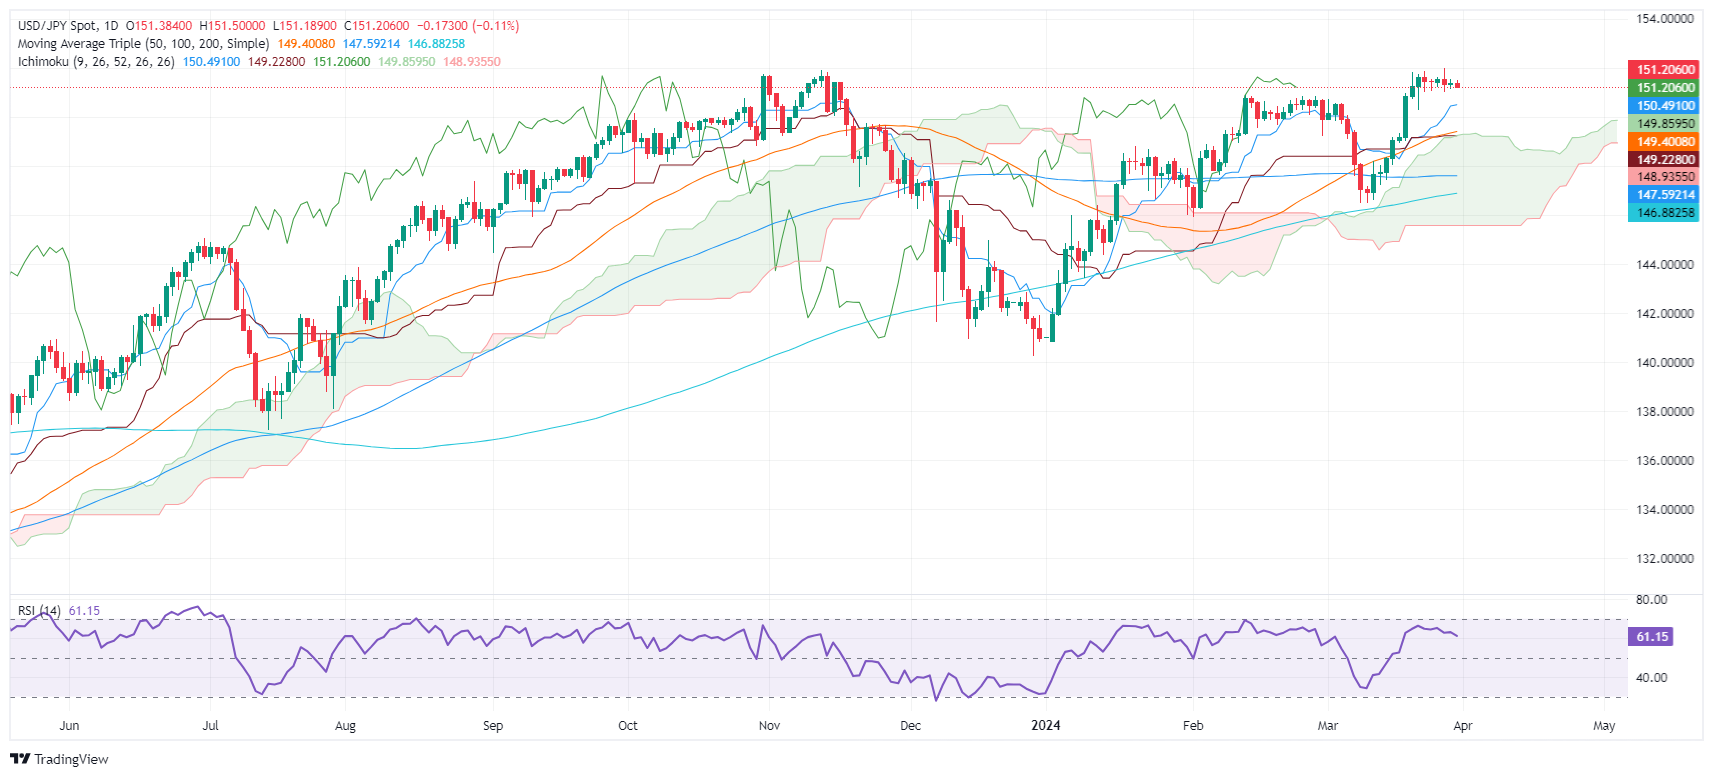
The USD/JPY posts minuscule losses following the release of the US Core Personal Consumption Expenditure (PCE) price index, the US Federal Reserve’s preferred inflation gauge. Data came as expected with prices continuing to trend lower, though at a slower pace. The major trades at 151.25, down 0.09%.
USD/JPY reacts modestly to the latest US economic indicators
The US Bureau of Economic Analysis (BEA) revealed that the Core PCE was lower than expected in February, coming at 0.3% MoM, below the previous month’s data. Yearly data cooled from 2.9% to 2.8%, as estimated by the consensus. Headline inflation came at 0.3% below January’s forecasts, and in the 12 months to February, it was higher than the previous month at 2.5%, up from 2.4%.
Although the data relieves pressure on the Federal Reserve, policymakers continue to take a cautious stance. Other inflationary readings, such as the Consumer Price Index (CPI) and the Producer Price Index (PPI), show signs that inflation is becoming entrenched above the 3% threshold.
On Wednesday, Fed Governor Christopher Waller was hawkish, saying the US central bank is in no rush to cut rates. Later, San Francisco Fed President Mary Daly and Fed Chair Jerome Powell would cross newswires, with traders eyeing their comments.
Even though the disinflationary process is evolving, the labor market is re-tightening again, following four consecutive weeks of fewer Americans filing for unemployment benefits. That can increase spending, which consequently could push prices higher.
Wells Fargo analysts cited by Bloomberg noted “We really just haven’t seen that consumer fatigue that we were getting some hints of in the last month’s data, …. That’s going to make it really hard, I think, for businesses to hold the line on prices if consumers are still willing to splash out at these levels.”
USD/JPY Price Analysis: Technical outlook
The daily chart portras the pair consolidated at around the 151.15/151.60 area, unable to gather tration in eigher way, as Japanese authorities threatened to intervene in the markets. Nevertheless, if the USD/JPY pushes above 152.00, that an clear the path to challenge 153.00. On the flip side, buyers failure to hold prices above 152.00 and 151.00, could sponsor a leg down. The first support would be the Tenkan Sen at 150.49, followed by the Senkou Span A at 149.86.
- The US PCE Price Index, rose to 2.5% YoY and 0.3% MoM in February, in line with market expectations.
- The core PCE also met expectations.
- With inflation indicators in sight, investors will eye next week's employment data, as its influence can potentially postpone any rate cut decision.
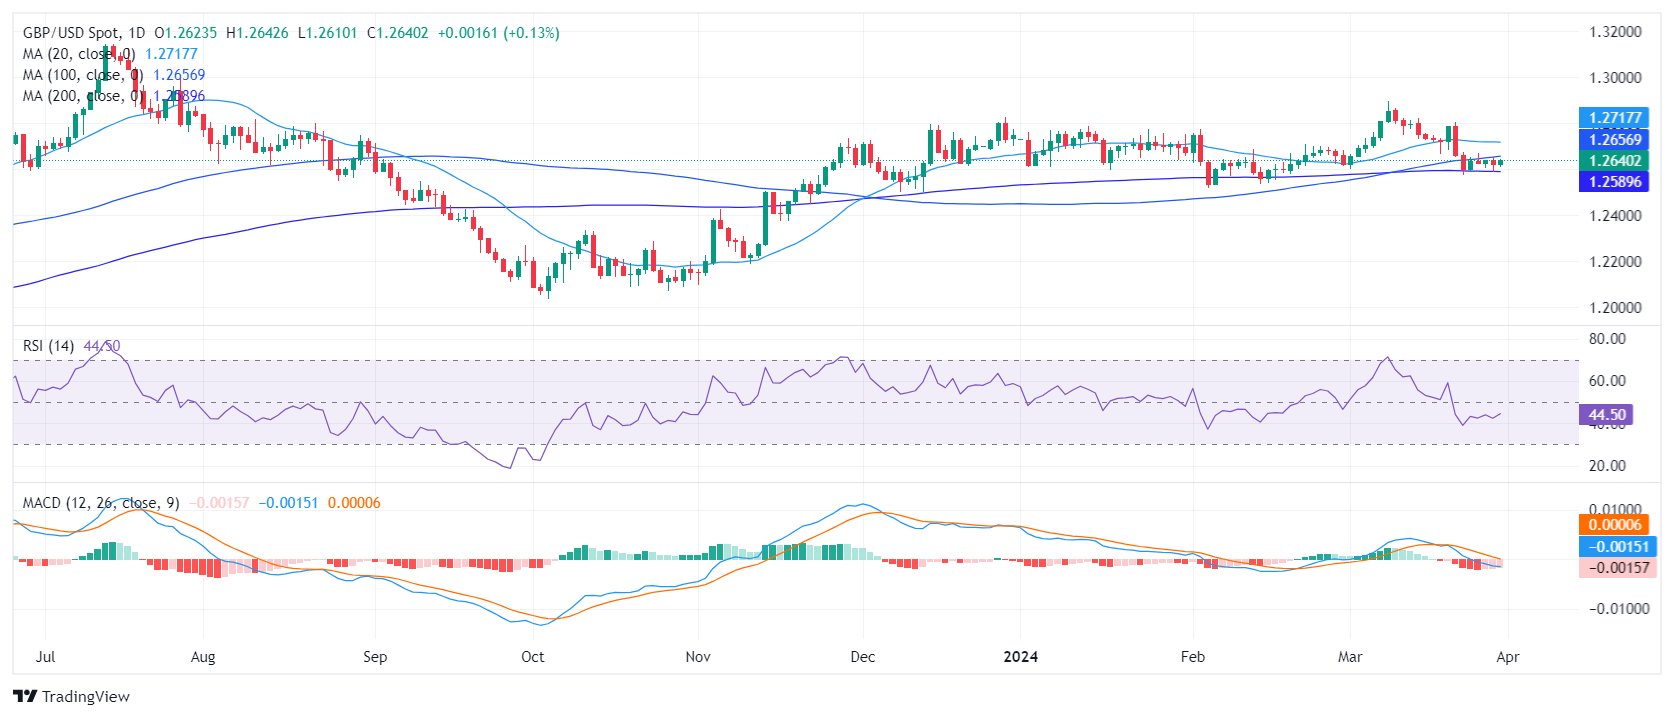
In Friday's session, GBP/USD is being traded around 1.2640, registering a variation of 0.14% as investors digest the US February Personal Consumption Expenditures (PCE) figures.
Inflation in the US increased slightly to 2.5% annually in February, as per the PCE Price Index, which the Fed prefers for tracking inflation. This was a minor rise from January's 2.4% and met expectations. The index rose by 0.3% from the previous month, a tad lower than the 0.4% forecast. Core PCE, excluding food and energy, also rose by 2.8% annually, aligning with predictions, and showed a 0.3% monthly increase. With January's core PCE figures revised up, ongoing inflation may lead the Federal Reserve (Fed) to maintain higher interest rates. Upcoming employment data will be key for future policy decisions, potentially affecting the timing and extent of rate cuts.
In line with that, hot employment data may push Fed policymakers to delay cuts beyond June and post just two instead of the three forecasted cuts for 2024 which could eventually benefit the US Dollar.
GBP/USD technical analysis
On the daily chart, the Relative Strength Index (RSI) for the GBP/USD pair is lingering in the negative territory, currently reading at 44. The prevalence of the RSI within the negative area indicates stronger selling momentum. Meanwhile, the flat red histogram of the Moving Average Convergence Divergence (MACD) implies fading bearish momentum but also serves as a caution to bulls.
On a larger scale, the pair is also below the 20 and 100-day Simple Moving Averages (SMAs), but above the 200-day SMA. This suggests that despite the current conditions, the bulls continue to exhibit strength in the overall trend.
- WTI Oil closed off Thursday at $82.82, close to a fresh five-month high.
- Oil traders remain bullish despite recent US stockpile build-ups.
- The US Dollar Index trades in the green, and could post a fresh monthly high.
Oil prices have been heading higher in recent weeks, with several elements painting a rather sketchy picture of the US status in the global Oil market. Any bearish moves in recent weeks were often attributed to the fact that the US was flooding the markets with Oil in order to temper prices. However, Bloomberg reports that the US Energy Department is very active in buying Oil at current prices to rebuild a 40-year low in US strategic reserves, which means that the US is dumping Oil to get prices lower while it is buying that same Oil back at a higher price.
The US Dollar, meanwhile, is roaring again with the US Dollar bulls performing a four-day winning streak ahead of the US Personal Consumption Expenditures (PCE) Price Index numbers. Markets are on edge as recent inflation measures have pointed to an uptick in price pressures. If the PCE points to accelerating inflation, this could result in markets starting to cut back the number of interest-rate cuts expected for this year, pushing back further down the initial rate cut from the US Federal Reserve.
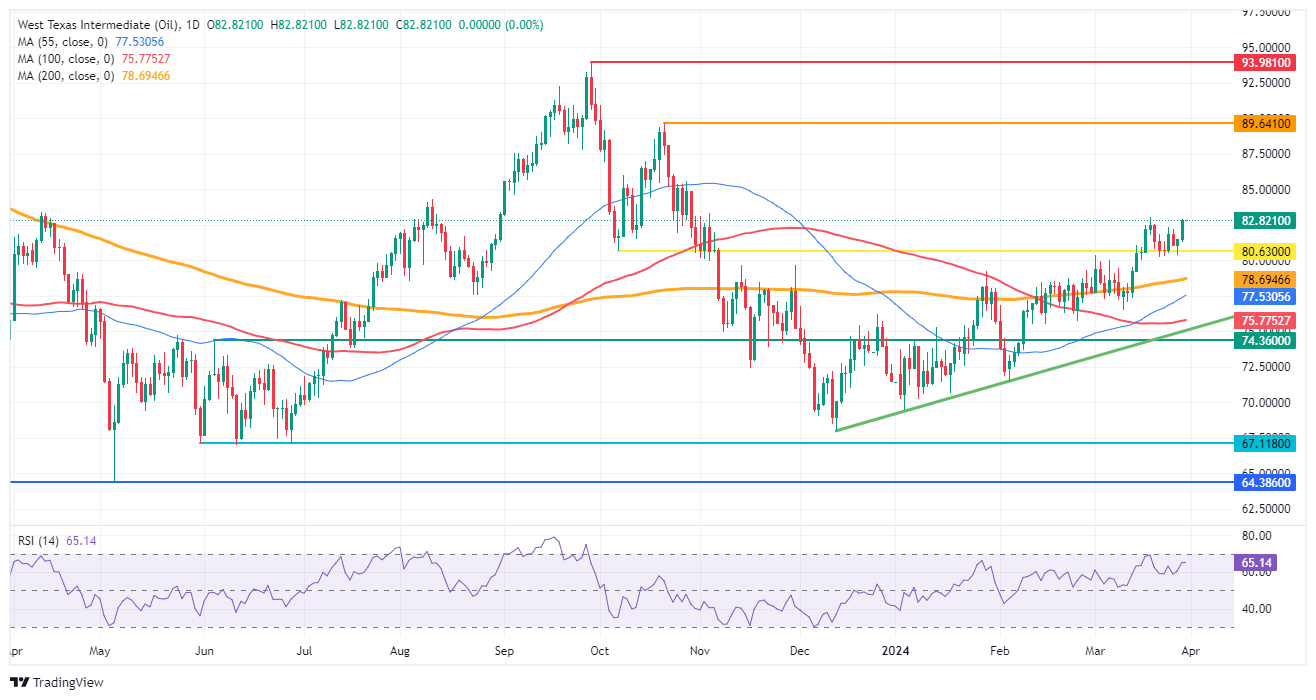
Crude Oil (WTI) closed off at $82.82 per barrel, and Brent Oil closed off at $86.82 per barrel on Thursday evening.
Oil could set sail to $90 as US attempts fail to outweigh OPEC production cuts
- Next Wednesday, OPEC will meet to discuss and decide on the current production cuts. Expectations are that Saudi Arabia will prolong its part until the end of this year.
- Despite Easter Monday, the US Energy Information Administration will release the US stockpile changes for this week on Wednesday as normal.The American Petroleum Institute will release overnight figures on Tuesday as usual.
- Quite a number of Oil tankers are reporting to be stuck in Venezuela off the coast. Traders that jumped on the easing of sanctions against the country are now facing issues with the tankers unable to load.
Oil Technical Analysis: US strategic reserve build-up economics
Oil prices are set to head higher as the game of chicken between the US and OPEC appears to be falling in favor of the Oil cartel. The US is unable to oversupply markets with oil as it is unable to match the production cuts from Saudi Arabia and Russia. Being forced to restock its strategic reserves, the US is paying a very expensive price in its economic war with Russia and OPEC, while it creates a second-round effect in US inflation with prices at the gas pumps remaining fragile for upswings.
Oil bulls will see $86 appearing as the next cap. Further up, $86.90 follows suit before targeting $89.64 and $93.98 as top levels.
On the downside, both $80.00 and $80.60 should be acting as support with the 200-day Simple Moving Average (SMA) as the level to catch any falling knives near $78.55. The 100-day and the 55-day SMA’s are near $75.64 and $77.15, respectively. Add the pivotal level near $75.27, and it looks like the downside is very limited and well-equipped to resist the selling pressure.
US WTI Crude Oil: Daily Chart
WTI Oil FAQs
WTI Oil is a type of Crude Oil sold on international markets. The WTI stands for West Texas Intermediate, one of three major types including Brent and Dubai Crude. WTI is also referred to as “light” and “sweet” because of its relatively low gravity and sulfur content respectively. It is considered a high quality Oil that is easily refined. It is sourced in the United States and distributed via the Cushing hub, which is considered “The Pipeline Crossroads of the World”. It is a benchmark for the Oil market and WTI price is frequently quoted in the media.
Like all assets, supply and demand are the key drivers of WTI Oil price. As such, global growth can be a driver of increased demand and vice versa for weak global growth. Political instability, wars, and sanctions can disrupt supply and impact prices. The decisions of OPEC, a group of major Oil-producing countries, is another key driver of price. The value of the US Dollar influences the price of WTI Crude Oil, since Oil is predominantly traded in US Dollars, thus a weaker US Dollar can make Oil more affordable and vice versa.
The weekly Oil inventory reports published by the American Petroleum Institute (API) and the Energy Information Agency (EIA) impact the price of WTI Oil. Changes in inventories reflect fluctuating supply and demand. If the data shows a drop in inventories it can indicate increased demand, pushing up Oil price. Higher inventories can reflect increased supply, pushing down prices. API’s report is published every Tuesday and EIA’s the day after. Their results are usually similar, falling within 1% of each other 75% of the time. The EIA data is considered more reliable, since it is a government agency.
OPEC (Organization of the Petroleum Exporting Countries) is a group of 13 Oil-producing nations who collectively decide production quotas for member countries at twice-yearly meetings. Their decisions often impact WTI Oil prices. When OPEC decides to lower quotas, it can tighten supply, pushing up Oil prices. When OPEC increases production, it has the opposite effect. OPEC+ refers to an expanded group that includes ten extra non-OPEC members, the most notable of which is Russia.
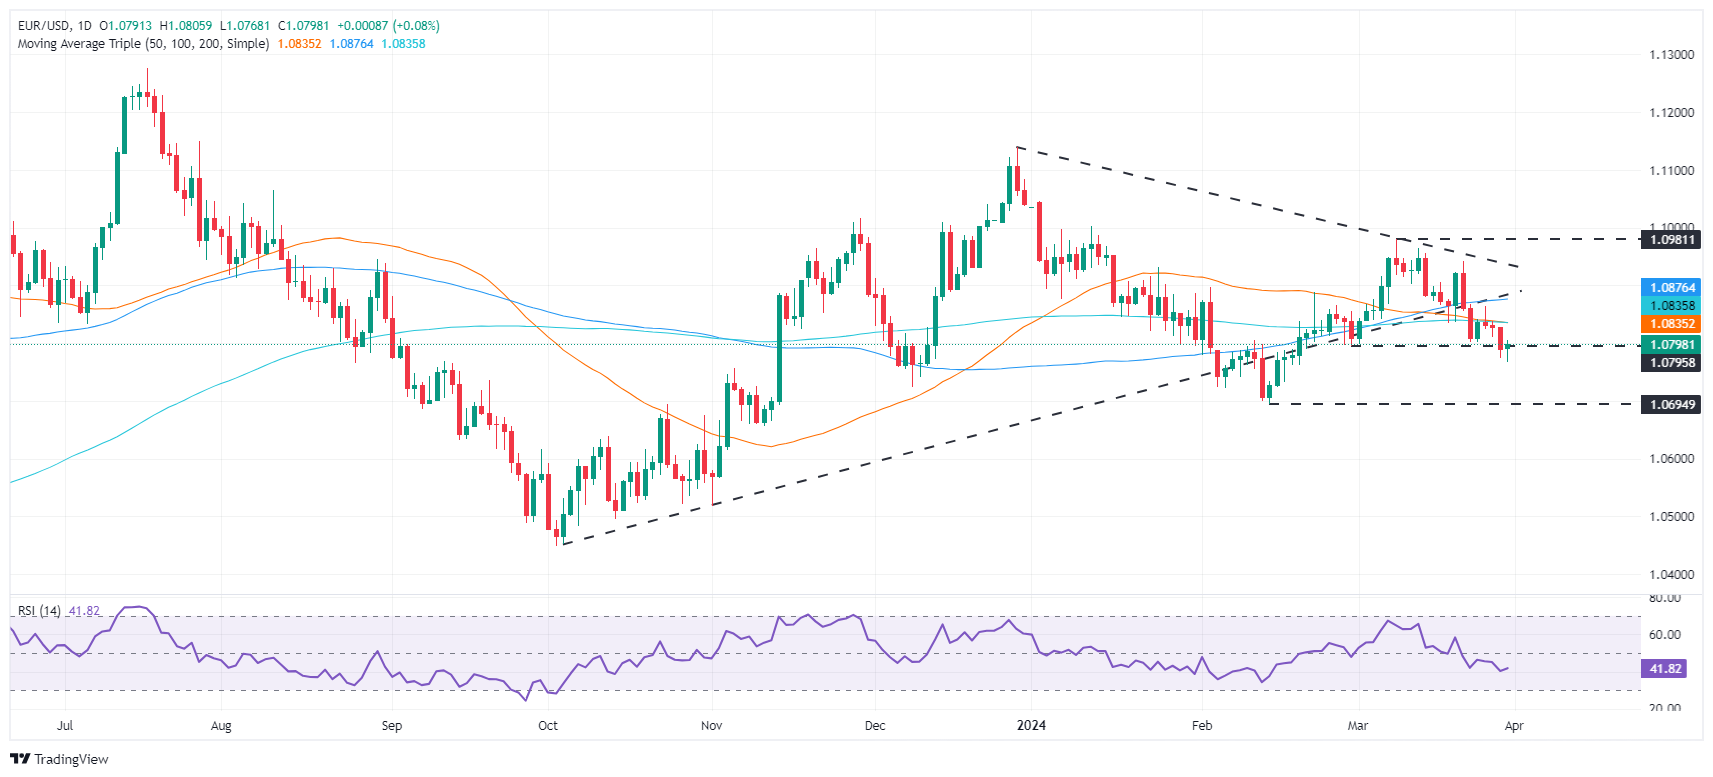
- EUR/USD nudges up slightly to 1.0788 after Core PCE inflation data for February aligns with market forecasts.
- Headline PCE inflation for February shows a modest increase, maintaining market anticipation for the Federal Reserve's next moves.
- Upcoming speeches by Fed Chair Jerome Powell and Mary Daly are eyed by EUR/USD traders.
The EUR/USD remains barely unchanged on thin trading after the US Bureau of Economic Analysis (BEA) revealed the Federal Reserve’s preferred gauge for inflation, the Core Personal Consumption Expenditure (PCE) price index for February was aligned with estimates. That said, the EUR/USD trades at 1.0788, posting minuscule gains of 0.02%
EUR/USD posts minimal movement after US inflation data
The BEA revealed that Core PCE came at 0.3% MoM and at 2.8% YoY, with both figures aligned with the market consensus. Headline PCE figures rose by 0.3% MoM lower than expected and January’s data. In the 12 months to February, PCE came at 2.5%, as foreseen, but a tenth higher than the prior month’s data.
Other data showed that Wholesale Inventories Advanced for February came at 0.5% MoM up from -0.2% in the previous month.
Thin liquidity conditions witnessed the EUR/USD push below 1.0780 before breaking above 1.0790. Buyers are eyeing a clear break above 1.0800, though they will face some intraday resistance, as depicted by the hourly chart, with the 50-Simple Moving Average (SMA) standing at 1.0800.
In addition, traders will watch San Francisco’s Fed President Mary Daly's speech at 15:20 GMT, followed by Fed Chair Jerome Powell's speech at 15:30 GMT.
According to BBH analysts, Fed Chair Jerome Powell's speech will be important. They noted, “Other Fed speakers have tilted hawkish after last week’s FOMC meeting, and markets will be watching to see if Powell follows suit or maintains the dovish tone from his press conference. With Powell, it’s always a coin toss but as we’ve said countless times before, the data will ultimately decide the timing of the first cut. As things stand, odds of a cut June 12 have fallen to 66% after rising to 85% post-FOMC.”
EUR/USD Price Analysis: Technical outlook
During the European session, the pair printed a low of 1.0767. However, the EUR/USD climbed above 1.0790 following the data release, with traders eyeing 1.0800. A decisive break will expose the March 28 high of 1.0827, followed by the 50-day moving average (DMA) at 1.0834, ahead of 1.0835, the 200-DMA. Once those levels are cleared, up next would be the 100-DMA at 1.0876. On the other hand, further losses are eyed below 1.0750, which would expose the February 14 low of 1.0694.
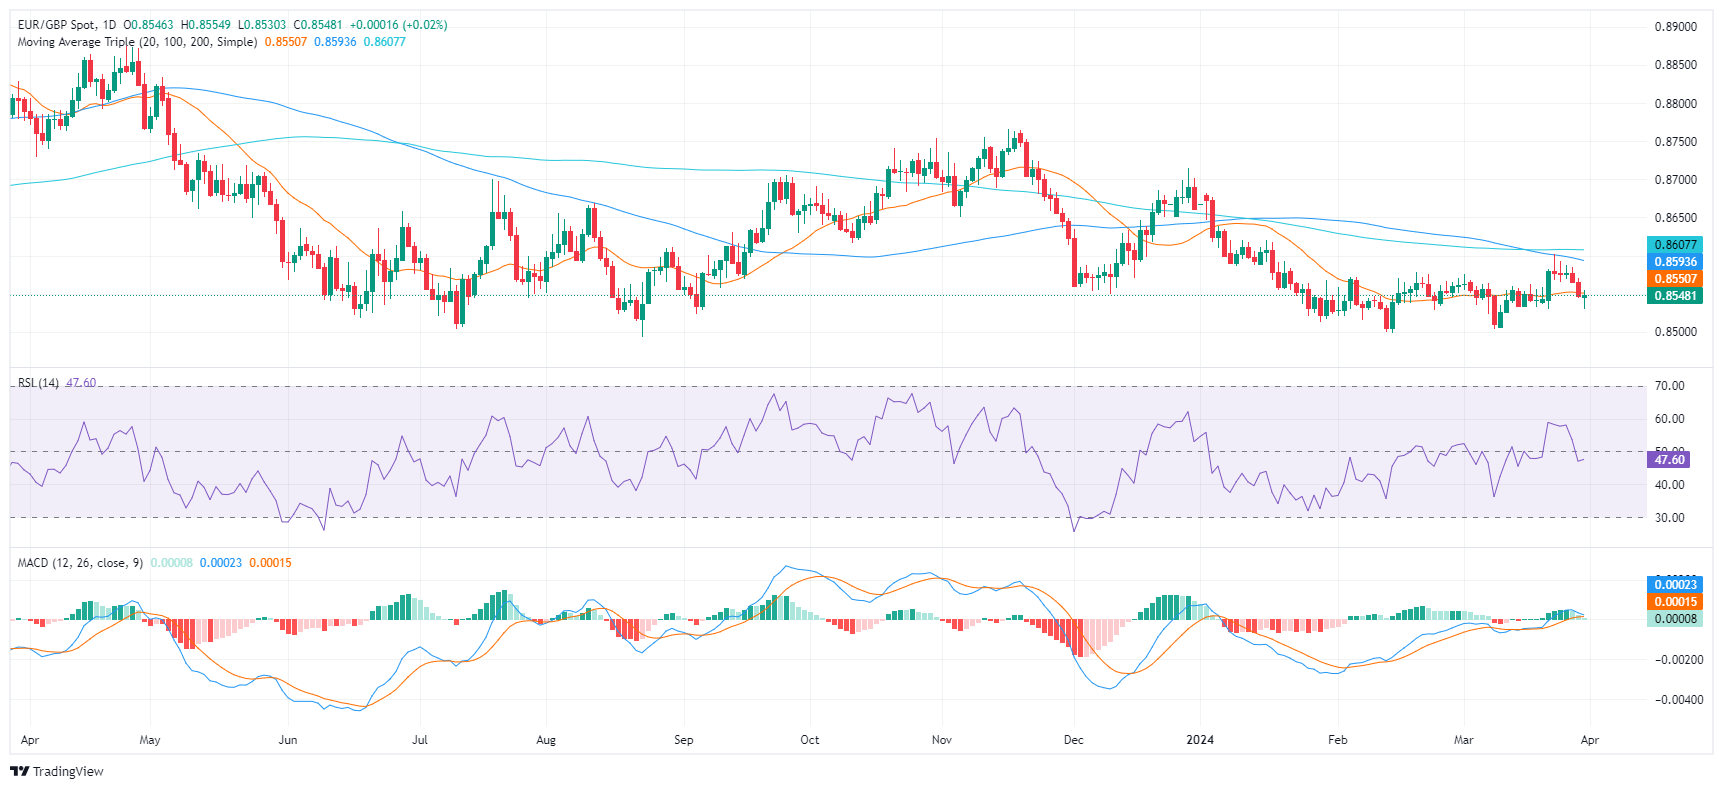
- The daily chart reveals a mostly bearish environment with somewhat flat indicators.
- The hourly chart analysis depicts a potential bearish shift with the RSI reading close to the neutral-negative zone.
The EUR/GBP pair is currently trading at 0.8550, with minor losses on Friday’s session. The sellers are exerting their presence as bullish momentum remains weak and the fact that the cross remains below its main Simple Moving Averages (SMAs) of 20,100 and 200-days contributes to the bearish bias.
On the daily chart, the Relative Strength Index (RSI) currently resides in negative territory but stands flat while the Moving Average Convergence Divergence (MACD) prints neutral green bars, suggesting stagnant momentum. This demonstrates the trend might continue in the near term.
EUR/GBP daily chart
Moving to the hourly chart, the RSI shows a mixed trend with readings ranging from 33 and then recovering to 50 standing on the edge of the neutral-negative territory. Coupled with flat green bars on the MACD histogram, there might be a shift towards a bearish momentum after the bulls' short recovery during the European session.
EUR/GBP hourly chart
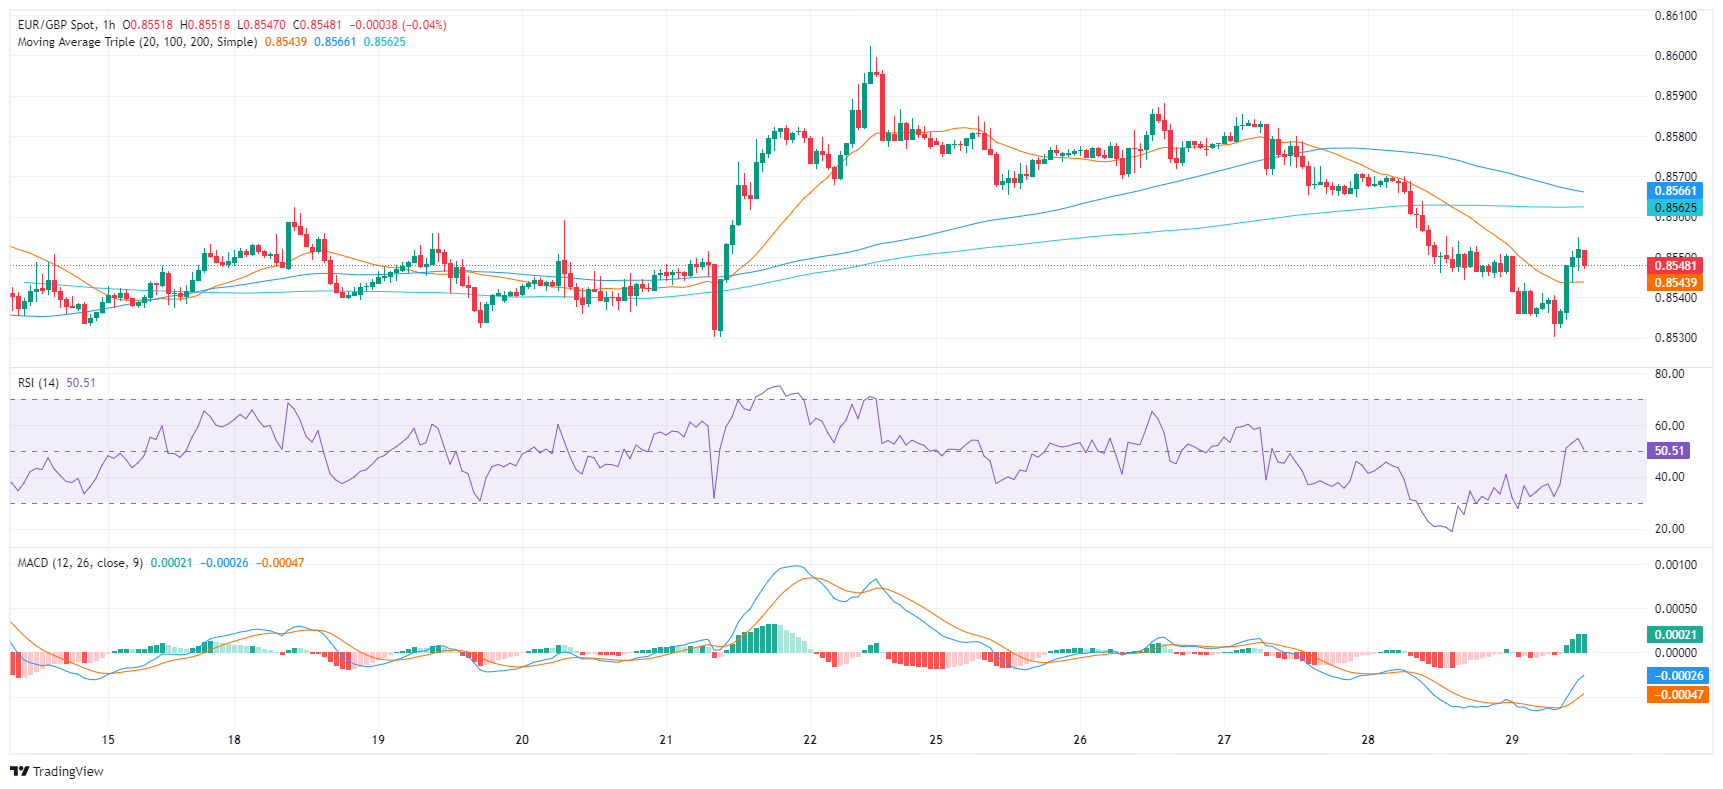
In conclusion, both the daily and hourly analyses point to a primarily negative trend for EUR/GBP, albeit with potential hourly fluctuations. If the buyers want to avoid losses they should reclaim the 200-day SMA around 0.8550 and build support around it.
- AUD/USD stands still with the market awaiting the US Core PCE inflation figures and personal spending insights.
- Forecasts suggest a slight slowdown in Core PCE inflation for February, with personal income and spending data also in focus.
- Australian economic indicators hint at a cooling economy, increasing speculation on RBA's future rate decisions.
The Aussie Dollar remains subdued against the US Dollar on Friday due to thin liquidity conditions in the observance of Good Friday. A busy economic docket in the United States (US) might entertain Forex market traders with the release of the Personal Consumption Expenditures (PCE) price index and Federal Reserve officials' speeches. The AUD/USD trades at 0.6513, virtually unchanged.
AUD/USD traders eye US key economic data ahead of the weekend
The AUD/USD price action shows traders waiting to release the Fed’s preferred gauge for inflation, the Core PCE for February. The consensus foresees the latter slowing from 0.4% to 0.3% MoM, with annual figures expected to remain unchanged at 2.8% as in January. In the meantime, headline PCE is expected to tick higher from 0.3% to 0.4% MoM and, in the 12 months to February, rise from 2.4% to 2.5%.
Alongside that data, the US Bureau of Economic Analysis (BEA) will release Personal Income and Personal Spending data, which would shed some light on American consumer behavior. According to BBH analysts, the jump in February Retail Sales could underpin personal spending data.
On the Australia’s front, economic data revealed during the week, revealed that monthly inflation was below estimates, with Retail Sales missing forecasts. With the economy beginning to show signs of slowing down, has raised expectations for potential interest rate cuts by the Reserve Bank of Australia (RBA) toward the second half of 2024.
Next week, Aussie’s Judo Bank PMI figures, along with the RBA's latest meeting minutes, could shed some light on the economy's progress.
AUD/USD Price Analysis: Technical outlook
The AUD/SD remains neutral to downward biased. Ahead of the release of US PCE, look for stir resistance at the confluence of the 100 and the 200-day moving averages (DMAs) at 0.6546. Further upside is seen at the 100-DMA at 0.6594, ahead of 0.6600. On the flip side, first support is seen at 0.6500, followed by the March 5 low of 0.6477.
- The US Dollar has been trading near the fresh high of March.
- Traders are enjoying a bank holiday despite the release of US economic data.
- The US Dollar Index has 105.00 in reach.
The US Dollar (USD) never sleeps and that proverb certainly applies to this Friday. The Greenback holds onto recent gains on Good Friday, a bank holiday during which European and US trading desks will be running at minimum capacity. This could mean fireworks ahead as thin liquidity in market conditions will be met with pivotal economic data from the US.
That pivotal piece of data is the US Federal Reserve’s preferred inflation gauge: The Personal Consumption Expenditure Price Index (PCE). There are chances for another red hot print after the latest Consumer Price Index (CPI) data also beat expectations. Although he will not be bringing any Easter eggs, US Fed Chairman Jerome Powell is set to speak later this Friday and he may be bearing a surprise.
Daily digest market movers: Looking for clues before looking for chocolate eggs
- At 12:30 GMT the main data release to look out for:
- Personal Consumption Expenditures for February:
- Headline monthly PCE seen heading from 0.3% to 0.4%.
- Headline yearly PCE is expected to head from 2.4% to 2.5%.
- Core monthly PCE is expected to head from 0.4% to 0.3%.
- The core yearly PCE Index should remain stable at 2.8%.
- The US Goods trade balance for February will also be published after reporting a $91.6 billion deficit in January.
- Personal Income is expected to increase 0.4% in February, slowing from 1% rise seen in January.
- Personal Spending should rise from 0.2% to 0.5%.
- Wholesale Inventories data for February will be released as well. In January, inventories fell by 0.3%..
- Personal Consumption Expenditures for February:
- At 15:15 GMT, Federal Reserve Bank of San Francisco President Mary Daly will kick off the Federal Reserve Bank of San Francisco Macroeconomics and Monetary Policy Conference. She will be followed by a statement from Fed Chairman Jerome Powell at around 15:30 GMT.
- Equities will not be moving this Friday with both Europe and US markets closed.
- According to the CME Group’s FedWatch Tool, expectations for the Fed’s May 1 meeting are at 95.8% for keeping the fed funds rate unchanged, while chances of a rate cut are at 4.2%.
- The benchmark 10-year US Treasury Note trades around 4.20%, up from 4.18% earlier this week.
US Dollar Index Technical Analysis: Again, you don’t fight the Fed
The US Dollar Index (DXY) is making its way to a possible fresh high for March seeing its current positioning just below it at 104.72. The US Dollar bulls are clearly back in the game with a four-day winning streak for the Greenback. Although expectations around the PCE numbers are already in favor of an uptick, the magnitude of that uptick could fuel a substantial US Dollar rally amid exceptionally thin liquidity in markets.
That first pivotal level for the DXY at 104.60, where last week’s rally peaked, has been broken. Further up, 104.96 remains the level to beat in order to tackle 105.00. Once above there, 105.12 is the last resistance point for now before the Relative Strength Index (RSI) will trade in overbought levels.
Support from the 200-day Simple Moving Average (SMA) at 103.75, the 100-day SMA at 103.48, and the 55-day SMA at 103.72 are unable to show their importance as support because traders didn’t wait for a drop to those levels for a turnaround. The 103.00 big figure looks to remain unchallenged for longer, after the decline in the wake of the Fed meeting last week got turned around way before reaching it.
Inflation FAQs
Inflation measures the rise in the price of a representative basket of goods and services. Headline inflation is usually expressed as a percentage change on a month-on-month (MoM) and year-on-year (YoY) basis. Core inflation excludes more volatile elements such as food and fuel which can fluctuate because of geopolitical and seasonal factors. Core inflation is the figure economists focus on and is the level targeted by central banks, which are mandated to keep inflation at a manageable level, usually around 2%.
The Consumer Price Index (CPI) measures the change in prices of a basket of goods and services over a period of time. It is usually expressed as a percentage change on a month-on-month (MoM) and year-on-year (YoY) basis. Core CPI is the figure targeted by central banks as it excludes volatile food and fuel inputs. When Core CPI rises above 2% it usually results in higher interest rates and vice versa when it falls below 2%. Since higher interest rates are positive for a currency, higher inflation usually results in a stronger currency. The opposite is true when inflation falls.
Although it may seem counter-intuitive, high inflation in a country pushes up the value of its currency and vice versa for lower inflation. This is because the central bank will normally raise interest rates to combat the higher inflation, which attract more global capital inflows from investors looking for a lucrative place to park their money.
Formerly, Gold was the asset investors turned to in times of high inflation because it preserved its value, and whilst investors will often still buy Gold for its safe-haven properties in times of extreme market turmoil, this is not the case most of the time. This is because when inflation is high, central banks will put up interest rates to combat it. Higher interest rates are negative for Gold because they increase the opportunity-cost of holding Gold vis-a-vis an interest-bearing asset or placing the money in a cash deposit account. On the flipside, lower inflation tends to be positive for Gold as it brings interest rates down, making the bright metal a more viable investment alternative.
- EUR/USD continues to lose ground on dovish remarks from ECB members.
- German Retail Sales MoM and YoY declined by 1.9% and 2.7%, respectively, in February.
- Investors await the US PCE figures to gain further insight into the Fed’s interest rates trajectory.
EUR/USD maintains its position around 1.0770 during the European session on Friday, extending losses for the fourth consecutive day. However, trading volumes are light as market participants are likely observing Good Friday. The Euro faces downward pressure as European Central Bank (ECB) officials are increasingly suggesting a probable interest rate cut in June.
Additionally, the Euro faced downward pressure following weaker-than-expected Retail Sales data from Germany. The monthly report revealed a 1.9% decline in the sales of the German retail sector in February, contrary to expectations of a 0.3% increase following a previous decline of 0.4%. Additionally, year-over-year Retail Sales fell by 2.7%, surpassing the anticipated decline of 0.8% and the previous decrease of 1.4%.
Yannis Stoumaras stated on Tuesday that there is a growing consensus within the ECB for a rate reduction in June. ECB policymaker Francois Villeroy observed a rapid decrease in core inflation, although it remains elevated. He indicated that achieving the ECB's inflation target of 2% is feasible, but cautioned against growing downside risks if the ECB opts not to reduce rates. Additionally, ECB executive board member Fabio Panetta emphasized that restrictive policies are dampening demand and causing a rapid decline in inflation.
The US Dollar Index (DXY) strengthens, nearing 104.60, as recent data indicates annualized economic expansion in the United States (US), driven by consumer spending. In the fourth quarter of 2023, US Gross Domestic Product (GDP) Annualized expanded by 3.4%, surpassing market expectations of remaining unchanged at a 3.2% increase. US Core Personal Consumption Expenditures (QoQ) for the same period came in at 2.0%, slightly below the expected and previous reading of 2.1%.
The hawkish statements from a Federal Reserve (Fed) official, reinforced the Greenback. Fed Governor Christopher Waller's comments on Wednesday hinted at a potential delay in interest rate cuts, given the strong inflation figures. Investors now await the US Personal Consumption Expenditures (PCE) report on Friday, which serves as the Fed’s preferred inflation gauge, to gain additional insight and guidance.
- Gold price appreciates on market bias towards rate cuts possibility by major central banks in 2024.
- Investors expect three rate cuts from the US Federal Reserve (Fed) in the coming months.
- Investors await the US PCE report to gain additional insight into the Fed’s interest rates trajectory.
Gold price appreciates to all-time highs near $2,230 per troy ounce, attempting to continue its winning streak for the fifth successive session on Friday. However, trading volumes are light as market participants are likely observing Good Friday. The glitters of Gold are attracting buyers as market sentiment leans toward major central banks initiating an interest rate-cut cycle this year.
Investors are gaining confidence in Gold as they anticipate three rate cuts from the US Federal Reserve (Fed) in the coming months. Chicago Fed President Austan Goolsbee, leaning towards a dovish stance, expects three cuts but emphasizes the need for more evidence of inflation subsiding before implementing any action.
European Central Bank (ECB) policymaker Francois Villeroy suggested that achieving the ECB's inflation goal of 2% is feasible, but he cautioned against escalating downside risks if the ECB opts against rate cuts. ECB executive board member Fabio Panetta remarked on Thursday that "the conditions to begin easing monetary policy are emerging."
In Europe, the Swiss National Bank unexpectedly cut rates at its March meeting, sparking speculation that other major central banks might take similar actions. Meanwhile, although the Bank of Japan ceased its negative rate policy, it is anticipated to maintain an accommodative stance for the foreseeable future.
The United Nations Security Council passed a resolution urging a ceasefire between Israel and Hamas, along with the release of hostages. However, the conflict in the Gaza Strip continues unabated, with Palestinian militants yet to release any captives. The Palestinian Red Crescent reported that Israeli forces besieged two additional Gaza hospitals on Sunday, trapping medical personnel amidst intense gunfire. The escalation of geopolitical tensions has heightened demand for safe-haven assets like Gold.
- USD/JPY struggles as BoJ’s cautious approach to keep monetary conditions accommodative.
- Japanese CPI (YoY) rose 2.6% in March, from the previous reading of a 2.5% rise.
- The strength of the US Dollar is bolstered by hawkish statements from Fed officials.
USD/JPY remains calm and hovers around 151.40 during the early European hours on Friday. Tokyo Consumer Price Index (YoY) for March climbed 2.6% following a 2.5% rise in February. Meanwhile, the Core Tokyo CPI climbed 2.9% year-over-year, down from a 3.1% rise in February.
Japanese Finance Minister Shunichi Suzuki made remarks on Friday emphasizing the importance of stable currency movements aligned with economic fundamentals. He expressed concern about rapid fluctuations in foreign exchange (FX) markets, attributing speculative activity to these movements. Suzuki stated that authorities are closely monitoring FX developments with a strong sense of urgency and are prepared to take necessary measures to address disorderly FX movements.
Japanese Prime Minister Fumio Kishida remarked on Thursday that it was fitting for the central bank to "maintain accommodative monetary conditions." Kishida also emphasized that the government would persist in collaborating with the Bank of Japan (BoJ) to facilitate wage increases and steer the economy away from deflation. The Japanese Yen (JPY) likely faced challenges due to the Bank of Japan's cautious approach to maintaining accommodative monetary conditions, thereby supporting the USD/JPY pair.
The US Dollar Index (DXY) strengthens, nearing 104.60, as recent data indicates annualized economic expansion in the United States (US), driven by consumer spending. In the fourth quarter of 2023, the US Gross Domestic Product (GDP) Annualized expanded by 3.4%, surpassing market expectations of remaining unchanged at a 3.2% increase. The US Gross Domestic Product Price Index remained steady with a 1.7% increase, in line with expectations for Q4.
The hawkish statements from a Federal Reserve (Fed) official, reinforced the Greenback. Fed Governor Christopher Waller's comments on Wednesday hinted at a potential delay in interest rate cuts, given the strong inflation figures.
- The core Personal Consumption Expenditures Price Index is set to rise 0.3% MoM and 2.8% YoY in February.
- Markets see a strong chance of the Federal Reserve lowering the policy rate by 25 basis points in June.
- The revised Summary of Projections showed that policymakers upwardly revised end-2024 core PCE forecast to 2.6% from 2.4%.
The core Personal Consumption Expenditures (PCE) Price Index, the US Federal Reserve’s (Fed) preferred inflation measure, will be published on Friday by the US Bureau of Economic Analysis (BEA) at 12:30 GMT.
What to expect in the Federal Reserve’s preferred PCE inflation report?
The core PCE Price Index, which excludes volatile food and energy prices, is seen as the more influential measure of inflation in terms of Fed positioning. The index is forecast to rise 0.3% on a monthly basis in February, at a slightly softer pace than the 0.4% increase recorded in January. February core PCE is also projected to grow at an annual pace of 2.8%, matching the previous reading. The headline PCE inflation is forecast to tick up to 2.5% (YoY).
The Federal Reserve’s revised Summary of Economic Projections (SEP), also known as the dot plot– published alongside the policy statement after the March meeting – showed that policymakers expect the annual core PCE inflation to be at 2.6% at the end of 2024, up from the 2.4% forecast seen in the December SEP.
When commenting on the policy outlook in the post-meeting press conference, Fed Chairman Jerome Powell reiterated that they need greater confidence of inflation moving sustainably down toward the 2% target before they start lowering the policy rate. Powell, however, argued that strong inflation numbers in January were impacted by seasonal effects.
Previewing the PCE inflation report, “Given still robust increases in the Feb CPI/PPI data, we look for another firm gain for the core PCE — though notably down from January's 0.42% increase and from the core CPI's 0.36% m/m February gain,” said Oscar Munoz, Chief US Macro Strategist at TD Securities, in a weekly report.
When will the PCE inflation report be released, and how could it affect EUR/USD?
The PCE inflation data is slated for release at 12:30 GMT. The monthly core PCE Price Index gauge is the most-preferred inflation reading by the Fed, as it’s not distorted by base effects and provides a clear view of underlying inflation by excluding volatile items. Investors, therefore, pay close attention to the monthly core PCE figure.
Stronger-than-forecast Consumer Price Index (CPI) and Producer Price Index (PPI) readings in January and February, combined with data that pointed to tight labor market conditions, caused markets to lean toward a delay in the Fed policy pivot from May to June. Nevertheless, the dot plot showed that policymakers still project the US central bank to cut the policy rate by a total of 75 basis points (bps) in 2024. Hence, markets are pricing in a more than 60% chance that the Fed will lower the policy rate by 25 bps to 5%-5.25% in June, according to the CME FedWatch Tool.
It will be tricky to assess the immediate impact of the PCE data on the US Dollar’s (USD) valuation because trading conditions will be thin on Easter Friday.
Even if the monthly core PCE Price Index rises at a stronger pace than expected, it might not be enough to cause investors to reassess the possibility of another policy hold in June. Nevertheless, it could still provide a boost to the USD, with markets doubting the size of the total reduction in the policy rate.
On the other hand, an increase of 0.2% or less in the monthly Core PCE Price Index could weigh on the USD. In this scenario, a bearish opening in the 10-year US yield could be seen when the bond market returns to action at the weekly opening next Monday.
FXStreet Analyst Eren Sengezer offers a brief technical outlook for EUR/USD and explains:
“The 200-day Simple Moving Average (SMA) and the 100-day SMA form a strong resistance for EUR/USD at 1.0830. As long as this level stays intact as resistance, technical sellers could look to retain control. On the downside, 1.0760 (Fibonacci 78.6% retracement of the October-December uptrend) aligns as next support before 1.0700 (Fibonacci 61.8% retracement). In case EUR/USD manages to reclaim 1.0830, buyers could take action and open the door for an extended rebound toward 1.0900 (psychological level, static level) and 1.0950 (Fibonacci 23.6% retracement).
Fed FAQs
Monetary policy in the US is shaped by the Federal Reserve (Fed). The Fed has two mandates: to achieve price stability and foster full employment. Its primary tool to achieve these goals is by adjusting interest rates. When prices are rising too quickly and inflation is above the Fed’s 2% target, it raises interest rates, increasing borrowing costs throughout the economy. This results in a stronger US Dollar (USD) as it makes the US a more attractive place for international investors to park their money. When inflation falls below 2% or the Unemployment Rate is too high, the Fed may lower interest rates to encourage borrowing, which weighs on the Greenback.
The Federal Reserve (Fed) holds eight policy meetings a year, where the Federal Open Market Committee (FOMC) assesses economic conditions and makes monetary policy decisions. The FOMC is attended by twelve Fed officials – the seven members of the Board of Governors, the president of the Federal Reserve Bank of New York, and four of the remaining eleven regional Reserve Bank presidents, who serve one-year terms on a rotating basis.
In extreme situations, the Federal Reserve may resort to a policy named Quantitative Easing (QE). QE is the process by which the Fed substantially increases the flow of credit in a stuck financial system. It is a non-standard policy measure used during crises or when inflation is extremely low. It was the Fed’s weapon of choice during the Great Financial Crisis in 2008. It involves the Fed printing more Dollars and using them to buy high grade bonds from financial institutions. QE usually weakens the US Dollar.
Quantitative tightening (QT) is the reverse process of QE, whereby the Federal Reserve stops buying bonds from financial institutions and does not reinvest the principal from the bonds it holds maturing, to purchase new bonds. It is usually positive for the value of the US Dollar.
- GBP/USD drifts lower to 1.2620 in Friday’s early European trading hours.
- The bearish outlook of the pair remains intact above the key EMA; RSI indicator supports the downward momentum.
- The first upside barrier is seen in the 1.2645–1.2650 region; the 1.2600–1.2605 zone acts as an initial support level.
The GBP/USD pair trades on a weaker note around 1.2620 during the early European session on Friday. The decline of Pound Sterling (GBP) is backed by the growing speculation that the Bank of England (BoE) will begin the rate-cut cycle this year. Markets are fully pricing in the first rate cut in August, with a total of nearly three quarter-point interest rate cuts this year.
Technically, GBP/USD keeps the bearish vibe unchanged as the major pair is below the key 50- and 100-period Exponential Moving Average (EMA) on the four-hour chart. Furthermore, the Relative Strength Index (RSI) lies below the 50 midlines, suggesting the downward momentum of the pair and the further decline look favorable.
The immediate resistance level for GBP/USD is seen in the 1.2645–1.2650 region, representing the confluence of the upper boundary of the Bollinger Band and the 50-period EMA. Any follow-through buying above the latter will expose the 100-period EMA at 1.2677. The additional upside filter to watch is a high of March 18 at 1.2746, en route to the 1.2800 psychological round mark.
On the downside, the lower limit of the Bollinger Band at the 1.2600–1.2605 zone acts as an initial support level for the major pair. A decisive break below this level will pave the way to a low of March 22 at 1.2575. The next downside target is located at a low of February 14 at 1.2535, and finally at the 1.2500 round figure.
GBP/USD four-hour chart
-638472879262853275.png)
- USD/CHF holds the positive ground around 0.9025 on the firmer US Dollar.
- The high-for-longer US rate narrative might boost the Greenback against the CHF.
- SNB’s Schlegel said the SNB will monitor the FX rate closely and intervene if necessary.
The USD/CHF pair snaps the two-day losing streak near 0.9025 on Friday during the Asian session. The hawkish comments from the US Federal Reserve (Fed) and strong US economic data boost the US Dollar (USD) and support USD/CHF. However, the upside of the pair might be limited amid the possibility that the Swiss National Bank (SNB) could intervene in the foreign exchange market.
The Fed governor Christopher Waller said on Wednesday that the US central bank was in no rush to cut interest rates as elevated inflation indicated that the current rates needed more time to work. Meanwhile, Fed Governor Lisa Cook stated on Monday that the path of disinflation has been bumpy, but a cautious approach to further policy shifts can ensure that inflation will return sustainably to the 2% target. The high-for-longer US rate narrative might lift the Greenback and create a tailwind for the pair in the near term.
On the other hand, the Swiss National Bank (SNB) Vice President Martin Schlegel said on Wednesday that the Swiss central bank will monitor the exchange rate closely and intervene in the foreign exchange market as necessary, even though it has no target for the Swiss Franc (CHF) exchange rate. Last week, the SNB surprised the market by cutting its benchmark interest rate for the first time in nine years, which triggered the sell-off in the CHF in previous sessions. The speculation of SNB’s intervention might cap the downside of the CHF against the USD.
Additionally, the escalating geopolitical tensions in the Middle East might benefit safe-haven currencies like the Swiss Franc. The Palestinian Red Crescent said that Israeli forces besieged two more Gaza hospitals on Sunday, pinning down medical teams under heavy gunfire.
Later on Friday, the US Core Personal Consumption Expenditures (PCE) Price Index will be due. The Fed’s preferred inflation gauge is estimated to remain stable at 2.8% YoY. The market is likely to be mute in light trading on Good Friday.
- EUR/GBP edges lower on dovish remarks from ECB policymakers.
- ECB’s Villeroy has expressed confidence in the ECB's inflation target of 2%, but he has also cautioned about the increasing downside risks.
- BoE official Jonathan Haskel said that rate cuts should be "a long way off”.
EUR/GBP continues its downward movement, influenced by challenges facing the Euro following dovish comments from European Central Bank (ECB) policymaker Francois Villeroy. During the Asian session on Friday, the EUR/GBP cross depreciates to near 0.8540.
Villeroy highlighted a notable decline in core inflation. He expressed confidence in the ECB to achieve an inflation target of 2% but cautioned about escalating downside risks if the ECB hesitates to implement rate cuts.
Moreover, ECB executive board member Fabio Panetta emphasized on Thursday that the conditions for implementing monetary policy easing are emerging. He pointed out that restrictive policies are dampening demand, resulting in a rapid decrease in inflation. Panetta also indicated a reduction in risks to price stability.
The Pound Sterling (GBP) maintains its position, possibly due to the hawkish comments from the Bank of England official Jonathan Haskel. He said that rate cuts should be "a long way off," while his colleague Catherine Mann warned against overly high expectations for interest rate cuts this year.
Despite Bank of England officials expressing reluctance towards rate cuts, the British Pound (GBP) may have faced downward pressure following economic data indicating that the United Kingdom’s (UK) economy entered a recession in the second half of 2023. The nation's Gross Domestic Product (GDP) contracted by 0.3% quarter-on-quarter in the fourth quarter of 2023, in line with preliminary estimates.
Speculation persists that the Bank of England (BoE) will initiate three quarter-point reductions in rates throughout 2024. BoE Governor Andrew Bailey stated that interest rate cuts will be under consideration at future BoE policy meetings.
- USD/CAD holds its position after recovering daily losses on Friday.
- US Dollar strengthens on hawkish sentiment surrounding the Fed maintaining higher policy rates.
- Canadian Dollar received upward support from the higher WTI price.
USD/CAD hovers around 1.3540 during the Asian hours on Friday, showing signs of potentially ending its four-day losing streak. However, trading volumes are expected to be light due to Good Friday. The US Dollar's (USD) strength may be attributed to the hawkish sentiment surrounding the Federal Reserve's intention to maintain higher interest rates.
This shift in sentiment could be linked to recent robust economic data from the United States (US). Additionally, Federal Reserve Governor Christopher Waller's cautionary remarks, indicating no urgency to begin rate cuts, have tempered market expectations of three rate cuts in 2024.
US Gross Domestic Product (GDP) Annualized expanded by 3.4% in Q4, surpassing market expectations of remaining unchanged at a 3.2% increase. US Core Personal Consumption Expenditures (QoQ) for the same period came in at 2.0%, slightly below the expected and previous reading of 2.1%.
The Canadian Dollar (CAD) received a boost due to increased prospects of foreign currency inflows, fueled by the uptick in West Texas Intermediate (WTI) oil prices. The rise in Crude oil prices is linked to expectations that the Organization of the Petroleum Exporting Countries and its allies (OPEC+) will continue their production cuts.
Canada's Gross Domestic Product (MoM) expanded by 0.6% in January, surpassing the projected 0.4% increase. This indicates economic resilience and suggests a strengthening economic landscape. These figures have instilled confidence in Canada's economic outlook, dampening market expectations of immediate rate cuts by the Bank of Canada (BoC).
- WTI price gained ground as OPEC+ is expected to maintain their production cuts.
- Ukrainian attacks on Russia's infrastructure are contributing to the sentiment of tightening global Crude supplies.
- Fuel suppliers in Baltimore are expected to encounter delays following the collapse of the Francis Scott Key Bridge.
West Texas Intermediate (WTI) oil price settled higher at $82.82 per barrel on Thursday. Markets are closed on Good Friday. The rise in Crude oil prices is attributed to the likelihood of the Organization of the Petroleum Exporting Countries and its allies (OPEC+) maintaining their production cuts.
Investors are expected to closely monitor the Joint Monitoring Ministerial Committee meeting of the OPEC next week. Despite increased geopolitical risks, which have raised concerns about potential supply disruptions, it is unlikely that OPEC+ will change their oil output policies until a full ministerial gathering scheduled for June. Furthermore, Crude oil prices are buoyed by the ongoing Ukrainian attacks on Russia's energy infrastructure, contributing to the sentiment of tightening global Crude supplies.
The Energy Information Administration (EIA) report indicated a weekly rise in US crude inventories. For the week ending on March 22, the EIA Crude Oil Stocks Change reported an increase of 3.165 million barrels in stock, contrary to the expected decline of 1.275 million barrels and the previous decline of 1.952 million barrels.
Following the collapse of the Francis Scott Key Bridge on Tuesday, fuel suppliers in Baltimore are expected to encounter trucking delays and other logistical challenges. The collapse resulted in parts of the bridge falling into shipping lanes at the mouth of the Port of Baltimore, leading to the indefinite closure of the city's port.
US Gross Domestic Product (GDP) Annualized expanded by 3.4% in the fourth quarter of 2023, exceeding market expectations which anticipated a 3.2% increase. The US Gross Domestic Product Price Index remained stable with a 1.7% increase, aligning with projections for Q4. Investors further await the latest US Personal Consumption Expenditures (PCE) price index report, the Federal Reserve's preferred inflation measure, scheduled for release on Friday, to gain insights into the trajectory of interest rates.
- Gold price hovers around $2,230, nearly record highs in Friday’s Asian session.
- The prospect of interest rate cuts from the US Fed and the ongoing geopolitical tensions lift the yellow metal.
- The hawkish Fed comments and robust US economy data might cap the gold’s upside.
- Investors will closely monitor the US February PCE data, due on Friday.
Gold price (XAU/USD) flirts with record highs around $2,230 during the Asian session on Friday. The uptick of yellow metal is bolstered by the safe-haven flows amidst growing economic concerns and the prospect of interest rate cuts from the US Federal Reserve (Fed). However, the easing expectations for the Fed rate cuts might lift the US Dollar (USD) and cap the upside of USD-denominated gold.
Gold gains momentum as investors anticipate three rate cuts from the US Federal Reserve (Fed) this year. The Fed held its benchmark overnight borrowing rate in a range between 5.25%-5.50% for the fifth consecutive time last week. Furthermore, the central bank still expects three quarter-percentage point cuts by the end of the year. According to the CME FedWatch Tool, traders are currently pricing in nearly 63% odds that the Fed will cut interest rates in June. It’s worth noting that lower interest rates generally weaken the USD, making gold cheaper to investors holding other currencies.
Furthermore, the ongoing geopolitical risk in the Middle East might boost traditional safe-haven assets like gold. The Palestinian Red Crescent said that Israeli forces besieged two more Gaza hospitals on Sunday, pinning down medical teams under heavy gunfire.
On the other hand, a combination of hawkish Fed comments and robust US economy data might weigh on the gold price. Many Fed officials remain cautious about easing too soon. On Wednesday, Fed Governor Christopher Waller said that there was “no rush” to Fed bank President Raphael Bostic stated that he now sees just one quarter-point rate cut this year, down from the two cuts that he had previously estimated.
Most markets are closed for Good Friday, but the US February Personal Consumption Expenditures Price Index (PCE) data will take center stage on Friday. The Core PCE, Fed's preferred inflation gauge, is projected to show an increase of 0.3% in February.
Speaking at the annual Boao Forum on Friday, Xu Zhibin, the deputy head of the State Administration of Foreign Exchange (SAFE), said that he “will steadily promote financial market opening.”
Additional comments
Will improve policies to facilitate cross-border investment.
Will further enhance capital account opening.
Will enhance risk prevention capabilities.
Market reaction
Despite the encouraging comments from China’s FX regulator, AUD/USD remains uninspired near 0.6515, modestly flat on the day.
- EUR/USD depreciates on hawkish sentiment surrounding the US Fed.
- Fed’s Waller hinted at a delay in interest rate cuts due to stronger inflation figures.
- ECB’s Villeroy suggested that the ECB's inflation goal of 2% is attainable.
EUR/USD continues its downward trend for the fourth consecutive day, driven by a stronger US Dollar (USD) influenced by the hawkish market sentiment surrounding the Federal Reserve (Fed) and expectations of prolonged higher interest rates. This shift in sentiment is supported by recent strong economic indicators from the United States (US). The EUR/USD pair edges lower to near 1.0780 during the Asian trading hours on Friday.
The US Dollar Index (DXY) strengthens, nearing 104.60, driven by hawkish statements from a Federal Reserve (Fed) official, which boosted the Greenback. Fed Governor Christopher Waller's comments on Wednesday hinted at a potential delay in interest rate cuts, given the strong inflation figures. Investors now await the US Personal Consumption Expenditures (PCE) report on Friday, which serves as the Fed’s preferred inflation gauge, to gain additional insight and guidance.
In the fourth quarter of 2023, the US Gross Domestic Product (GDP) Annualized expanded by 3.4%, surpassing market expectations of remaining unchanged at a 3.2% increase. The US Gross Domestic Product Price Index remained steady with a 1.7% increase, in line with expectations for Q4.
US Core Personal Consumption Expenditures (QoQ) for the same period came in at 2.0%, slightly below both the expected and previous reading of 2.1%. Additionally, US Initial Jobless Claims decreased to 210,000 in the week ending March 22, contrary to expectations for an increase to 215,000 from the previous 212,000.
The Euro encounters difficulties following dovish remarks from European Central Bank (ECB) policymaker Francois Villeroy. Villeroy noted a rapid decline in core inflation, albeit it remains high. He suggested that the ECB's inflation goal of 2% is attainable, but warned of increasing downside risks if the ECB refrains from cutting rates.
Furthermore, ECB executive board member Fabio Panetta stated on Thursday that "the conditions to start easing monetary policy are materializing." He highlighted that restrictive policies are suppressing demand and leading to a swift drop in inflation. Panetta also indicated that risks to price stability have lessened.
- NZD/USD edges lower to 0.5970 amid stronger USD and dovish comments from RBNZ.
- The US economy grew faster than expected in the fourth quarter (Q4).
- RBNZ’s Orr said the central bank is on course to get inflation back into the target band, rate cuts are getting closer.
- The US February Core PCE will be in the spotlight on Friday.
The NZD/USD pair remains under some selling pressure near 0.5970 after retracing from the 0.6000 barrier during the Asian session on Friday. The dovish comments from the Reserve Bank of New Zealand (RBNZ) Governor Adrian Orr weigh on the New Zealand Dollar (NZD). Investors await the release of US February Personal Consumption Expenditures (PCE) data on Friday for fresh catalysts.
The US economy expanded faster than expected in the fourth quarter (Q4), owing to robust consumer spending and corporate investment, according to the third estimate released by the Bureau of Economic Analysis on Thursday. The final US Gross Domestic Product (GDP) for Q4 grew at an annual rate of 3.4% from the previous 3.2% estimate. The US Dollar (USD) edges higher following the stronger-than-expected data.
On the Kiwi front, the RBNZ Governor Orr said the central bank is on track to getting inflation back into the target band while adding that interest rates have peaked and cuts are getting closer. The RBNZ indicated that it may cut rates from early next year. However, investors have priced in cuts from August this year. This, in turn, drags the NZD lower and acts as a headwind for the NZD/USD pair.
The US Core PCE data will be released later on Friday, which is estimated to show an increase of 0.3% MoM and 0.8% YoY in February. If the report showed firmer readings, this could boost the USD. The Fed’s Chair Jerome Powell and Fed Bank of San Francisco President Mary Daly are set to speak later on Friday.
- Australian Dollar remains tepid as market bias leans towards RBA adopting a dovish stance.
- Australia's central bank may consider cutting interest rates in the second half of 2024.
- US Dollar strengthens as recent data suggests that the Fed may delay implementing rate cuts shortly.
The Australian Dollar (AUD) extends its losses for the second successive session on Friday. However, market activity is expected to be subdued due to light trading on Good Friday. Meanwhile, the US Dollar (USD) strengthens as recent data indicates annualized economic expansion in the United States (US), driven by consumer spending. This development undermines the AUD/USD pair.
The Australian Dollar encountered difficulties amid weaker Consumer Inflation Expectations and Retail Sales figures from Australia. These indicators raised expectations of potential interest rate cuts by the Reserve Bank of Australia (RBA) in the latter half of 2024. Furthermore, Wednesday's release of the softer Australian Monthly Consumer Price Index further reinforced this outlook.
The US Dollar Index (DXY) seems poised to extend its winning streak, buoyed by hawkish comments from a Federal Reserve (Fed) official that bolstered the Greenback. Fed Governor Christopher Waller's remarks on Wednesday suggested that the central bank might delay interest rate cuts in light of robust inflation data. Investors now await the US Personal Consumption Expenditures (PCE) report on Friday, which serves as the Fed’s preferred inflation gauge, to gain additional insight and guidance.
Daily Digest Market Movers: Australian Dollar depreciates as RBA may adopt a dovish stance
- Australia's Consumer Inflation Expectations came in at 4.3% in March, a slight decrease from the previous increase of 4.5%.
- The seasonally adjusted Aussie Retail Sales showed a month-over-month increase of 0.3% in February, falling short of the expected 0.4% and the prior 1.1%.
- Australia's Monthly Consumer Price Index (YoY) for February saw a 3.4% rise, maintaining consistency with previous levels but slightly below the anticipated 3.5%.
- Australia's government has pledged to support a minimum wage increase aligned with inflation this year, recognizing the ongoing challenges low-income families face amid rising living costs.
- At the Boao Forum for Asia (BFA), China's top legislator, Zhao Leji, emphasized China's stance on inclusive economic globalization. He stated that China opposes unilateralism and protectionism in all their forms and is committed to closely linking its development with other countries.
- Federal Reserve Board Governor Christopher Waller still sees 'no rush' to cut rates amid sticky inflation data.
- Atlanta Fed President Raphael Bostic expressed his expectation for just one rate cut this year, cautioning that reducing rates prematurely could lead to greater disruption.
- US Gross Domestic Product Annualized expanded by 3.4% in the fourth quarter of 2023. The market expectation was to be unchanged at a 3.2% increase.
- The US Gross Domestic Product Price Index remained consistent at a 1.7% increase, as expected in Q4.
- Core Personal Consumption Expenditures (QoQ) came in at 2.0% in the fourth quarter, slightly below the expected and previous reading of 2.1%.
- US Initial Jobless Claims fell to 210K in the week ending on March 22, against the expected increase to 215K from 212K prior.
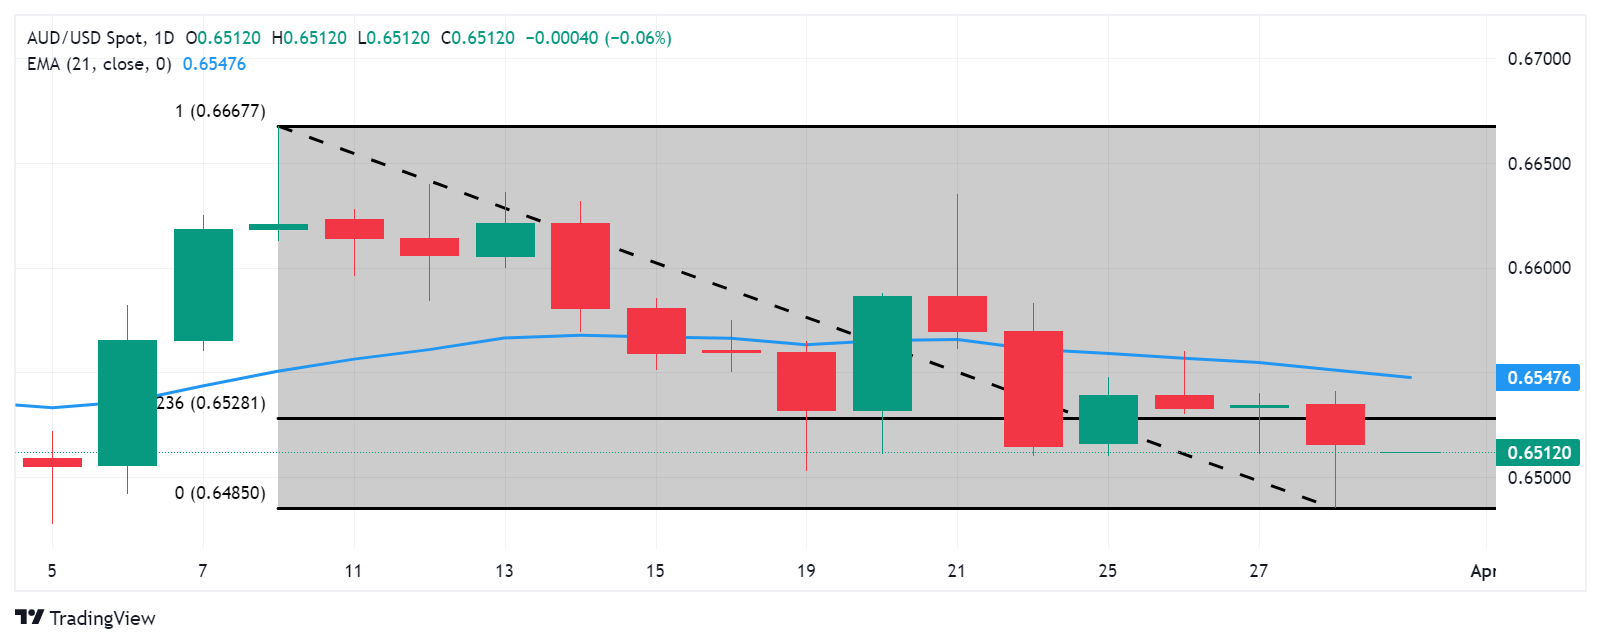
Technical Analysis: Australian Dollar hovers above psychological support at the 0.6500 level
The Australian Dollar trades near 0.6510 on Friday. Immediate resistance is noted around the 23.6% Fibonacci retracement level at 0.6528, followed by the 21-day Exponential Moving Average (EMA) at 0.6547, and the significant barrier of 0.6550. On the downside, a notable support level is located at the psychological mark of 0.6500, followed by March’s low at 0.6477. A breach below this level could potentially lead the AUD/USD pair to test the major support level at 0.6450.
AUD/USD: Daily Chart
Australian Dollar price today
The table below shows the percentage change of Australian Dollar (AUD) against listed major currencies today. Australian Dollar was the weakest against the Pound Sterling.
| USD | EUR | GBP | CAD | AUD | JPY | NZD | CHF | |
| USD | 0.11% | 0.00% | 0.01% | 0.05% | -0.01% | 0.05% | 0.06% | |
| EUR | -0.10% | -0.11% | -0.08% | -0.06% | -0.12% | -0.06% | -0.04% | |
| GBP | 0.00% | 0.12% | 0.02% | 0.04% | -0.01% | 0.05% | 0.07% | |
| CAD | -0.01% | 0.06% | -0.03% | 0.04% | -0.03% | 0.02% | 0.03% | |
| AUD | -0.06% | 0.02% | -0.08% | -0.03% | -0.05% | 0.01% | 0.02% | |
| JPY | 0.02% | 0.11% | 0.00% | 0.03% | 0.11% | 0.09% | 0.13% | |
| NZD | -0.05% | 0.05% | -0.04% | -0.01% | -0.02% | -0.05% | 0.04% | |
| CHF | -0.06% | 0.03% | 0.00% | 0.01% | -0.01% | -0.10% | -0.04% |
The heat map shows percentage changes of major currencies against each other. The base currency is picked from the left column, while the quote currency is picked from the top row. For example, if you pick the Euro from the left column and move along the horizontal line to the Japanese Yen, the percentage change displayed in the box will represent EUR (base)/JPY (quote).
Australian Dollar FAQs
One of the most significant factors for the Australian Dollar (AUD) is the level of interest rates set by the Reserve Bank of Australia (RBA). Because Australia is a resource-rich country another key driver is the price of its biggest export, Iron Ore. The health of the Chinese economy, its largest trading partner, is a factor, as well as inflation in Australia, its growth rate, and Trade Balance. Market sentiment – whether investors are taking on more risky assets (risk-on) or seeking safe havens (risk-off) – is also a factor, with risk-on positive for AUD.
The Reserve Bank of Australia (RBA) influences the Australian Dollar (AUD) by setting the level of interest rates that Australian banks can lend to each other. This influences the level of interest rates in the economy as a whole. The main goal of the RBA is to maintain a stable inflation rate of 2-3% by adjusting interest rates up or down. Relatively high interest rates compared to other major central banks support the AUD, and the opposite for relatively low. The RBA can also use quantitative easing and tightening to influence credit conditions, with the former AUD-negative and the latter AUD-positive.
China is Australia’s largest trading partner so the health of the Chinese economy is a major influence on the value of the Australian Dollar (AUD). When the Chinese economy is doing well it purchases more raw materials, goods, and services from Australia, lifting demand for the AUD, and pushing up its value. The opposite is the case when the Chinese economy is not growing as fast as expected. Positive or negative surprises in Chinese growth data, therefore, often have a direct impact on the Australian Dollar and its pairs.
Iron Ore is Australia’s largest export, accounting for $118 billion a year according to data from 2021, with China as its primary destination. The price of Iron Ore, therefore, can be a driver of the Australian Dollar. Generally, if the price of Iron Ore rises, AUD also goes up, as aggregate demand for the currency increases. The opposite is the case if the price of Iron Ore falls. Higher Iron Ore prices also tend to result in a greater likelihood of a positive Trade Balance for Australia, which is also positive of the AUD.
The Trade Balance, which is the difference between what a country earns from its exports versus what it pays for its imports, is another factor that can influence the value of the Australian Dollar. If Australia produces highly sought-after exports, then its currency will gain in value purely from the surplus demand created from foreign buyers seeking to purchase its exports versus what it spends to purchase imports. Therefore, a positive net Trade Balance strengthens the AUD, with the opposite effect if the Trade Balance is negative.
On Friday, the People’s Bank of China (PBoC) set the USD/CNY central rate for the trading session ahead at 7.0950 as compared to the previous day's fix of 7.0948 and 7.2259 Reuters estimates.
Japanese Finance Minister Shunichi Suzuki offered some verbal intervention on Friday. Suzuki said it’s important for currencies to move in a stable manner reflecting fundamentals and he will closely watch foreign exchange moves with a high sense of urgency.
Key quotes
“Important for currencies to move in a stable manner, reflecting fundamentals.”
“Rapid FX moves are undesirable.”
“Speculative move seen behind forex moves.”
“Closely watching FX moves with a high sense of urgency.”
“Won't rule out any steps to respond to disorderly FX moves.”
“Watching speed of forex moves, not level.”
Market reaction
At the time of writing, USD/JPY is trading 0.01% lower on the day at 151.36.
Bank of Japan FAQs
The Bank of Japan (BoJ) is the Japanese central bank, which sets monetary policy in the country. Its mandate is to issue banknotes and carry out currency and monetary control to ensure price stability, which means an inflation target of around 2%.
The Bank of Japan has embarked in an ultra-loose monetary policy since 2013 in order to stimulate the economy and fuel inflation amid a low-inflationary environment. The bank’s policy is based on Quantitative and Qualitative Easing (QQE), or printing notes to buy assets such as government or corporate bonds to provide liquidity. In 2016, the bank doubled down on its strategy and further loosened policy by first introducing negative interest rates and then directly controlling the yield of its 10-year government bonds.
The Bank’s massive stimulus has caused the Yen to depreciate against its main currency peers. This process has exacerbated more recently due to an increasing policy divergence between the Bank of Japan and other main central banks, which have opted to increase interest rates sharply to fight decades-high levels of inflation. The BoJ’s policy of holding down rates has led to a widening differential with other currencies, dragging down the value of the Yen.
A weaker Yen and the spike in global energy prices have led to an increase in Japanese inflation, which has exceeded the BoJ’s 2% target. Still, the Bank judges that the sustainable and stable achievement of the 2% target has not yet come in sight, so any sudden change in the current policy looks unlikely.
- USD/JPY trades on a stronger note around the mid-151.00s on Friday.
- Japan’s Kishida said it was appropriate for the BoJ to maintain easy monetary policy.
- Fed’s Waller stated there is no rush to cut rate and need to maintain it for longer than expected
The USD/JPY pair holds positive ground for the second consecutive day near 151.45 on Friday during the early Asian trading hours. The cautious approach from the Bank of Japan (BoJ) to keep monetary conditions accommodative exerts some selling pressure on the Japanese Yen (JPY). Additionally, the hawkish comments from the Federal Reserve (Fed) officials provide some support to the US Dollar (USD) and USD/JPY.
Data released from the Statistics Bureau of Japan reported that the headline Tokyo Consumer Price Index (CPI) for March climbed 2.6% YoY following a 2.6% rise in February. Meanwhile, the Tokyo CPI ex Fresh Food, Energy climbed 2.9% YoY, down from a 3.1% rise in February. However, the JPY remains on the defensive following the Japanese inflation data and the dovish comments from the Japanese authorities.
On Thursday, Japanese Prime Minister Fumio Kishida said that it was appropriate for the central bank to “maintain accommodative monetary conditions.” Kishida further stated that the government will continue to work closely with the BoJ to ensure wages continue to rise and the economy exits from deflation.
Nonetheless, the potential intervention from the Japanese authorities might cap the weakening of the JPY. Japan finance minister Shunichi Suzuki came in some verbal intervention on Friday, saying that he will closely watch the foreign exchange moves with a high sense of urgency and will not rule out any actions to respond to disorderly the FX moves.
On the USD’s front, stronger US economic data and the high-for-longer rate narrative from the Fed lift the Greenback against its rivals. The Fed Governor Christopher Waller, the most outspoken policy hawk, said on Thursday that the central bank is in no rush to cut the benchmark rate and may need to “maintain the current rate target for longer than expected.” Waller added that they need to see more inflation progress before supporting rate cuts.
Next week, Japan’s Tankan Large Manufacturing Index for the first quarter (Q1), along with the US ISM Purchasing Managers Index (PMI) report, will be due. The US Nonfarm Payrolls (NFP) for March on April 5 will be a closely watched event.
| Pare | Closed | Change, % |
|---|---|---|
| AUDUSD | 0.6514 | -0.17 |
| EURJPY | 163.277 | -0.21 |
| EURUSD | 1.07889 | -0.27 |
| GBPJPY | 191.004 | 0.03 |
| GBPUSD | 1.262 | -0.04 |
| NZDUSD | 0.59719 | -0.37 |
| USDCAD | 1.35377 | -0.3 |
| USDCHF | 0.9017 | -0.33 |
| USDJPY | 151.379 | 0.05 |


© 2000-2026. All rights reserved.
This site is managed by Teletrade D.J. LLC 2351 LLC 2022 (Euro House, Richmond Hill Road, Kingstown, VC0100, St. Vincent and the Grenadines).
The information on this website is for informational purposes only and does not constitute any investment advice.
The company does not serve or provide services to customers who are residents of the US, Canada, Iran, The Democratic People's Republic of Korea, Yemen and FATF blacklisted countries.
Making transactions on financial markets with marginal financial instruments opens up wide possibilities and allows investors who are willing to take risks to earn high profits, carrying a potentially high risk of losses at the same time. Therefore you should responsibly approach the issue of choosing the appropriate investment strategy, taking the available resources into account, before starting trading.
Use of the information: full or partial use of materials from this website must always be referenced to TeleTrade as the source of information. Use of the materials on the Internet must be accompanied by a hyperlink to teletrade.org. Automatic import of materials and information from this website is prohibited.
Please contact our PR department if you have any questions or need assistance at pr@teletrade.global.
transfers