- Analytics
- News and Tools
- Market News
Analytics, News, and Forecasts for CFD Markets: currency news — 02-04-2024.
- GBP/USD trades on a weaker note near 1.2575 on Wednesday.
- Many Fed officials see three rate cuts as reasonable this year.
- Traders raise their bets the BoE will cut the interest rate before the US Fed this year, weighing on the GBP.
- The US ADP Employment Change, the ISM Services PMI, and Fed’s Powell speech will be the highlights on Wednesday.
The GBP/USD pair trades with a negative mild bias around 1.2575 despite the decline of the US Dollar on Wednesday. The major pair remains vulnerable due to slowing UK inflation and a dismal market mood. The Fedspeak on Wednesday will be closely watched by traders, as it might offer some hints about the interest rate trajectory and policy outlook.
Many Fed officials spoke about the monetary policy outlook on Tuesday. Cleveland Fed Bank President Loretta Mester said that she still expects interest rate cuts this year, but ruled out the next policy meeting in May. San Francisco Fed Bank President Mary Daly also anticipates rate cuts this year but not until there’s more evidence that inflation has cooled down. San Francisco Fed President Daly said that three rate cuts this year are a “very reasonable baseline” though nothing is guaranteed. According to the CME FedWatch Tool, investors are now pricing in about a 65% odds of a rate cut by June, down from about 70% after the Fed's March meeting.
On Tuesday, the US February JOLTS Job Openings climbed to 8.756M in February from a downwardly revised 8.748M in January, better than the market estimation. Meanwhile, the Factory Orders improved to 1.4% MoM in February from a 3.8% fall in the previous reading.
On the other hand, traders raise their bets the Bank of England (BoE) will cut the interest rate before the US Fed this year, which exerts some selling pressure on the Pound Sterling (GBP). Additionally, easing UK inflation and a dismal market mood might weigh on the GBP and cap the upside of the GBP/USD pair.
Market players will keep an eye on the US ADP Employment Change, the final S&P Global Composite PMI, and the ISM Services PMI. Also, the Fed's Bowman, Goolsbee, Barr, Kugler, and Powell are set to speak later on Wednesday. If the Fed officials deliver any dovish comments, this could weigh on the Greenback and create a tailwind for the GBP/USD pair in the near term.
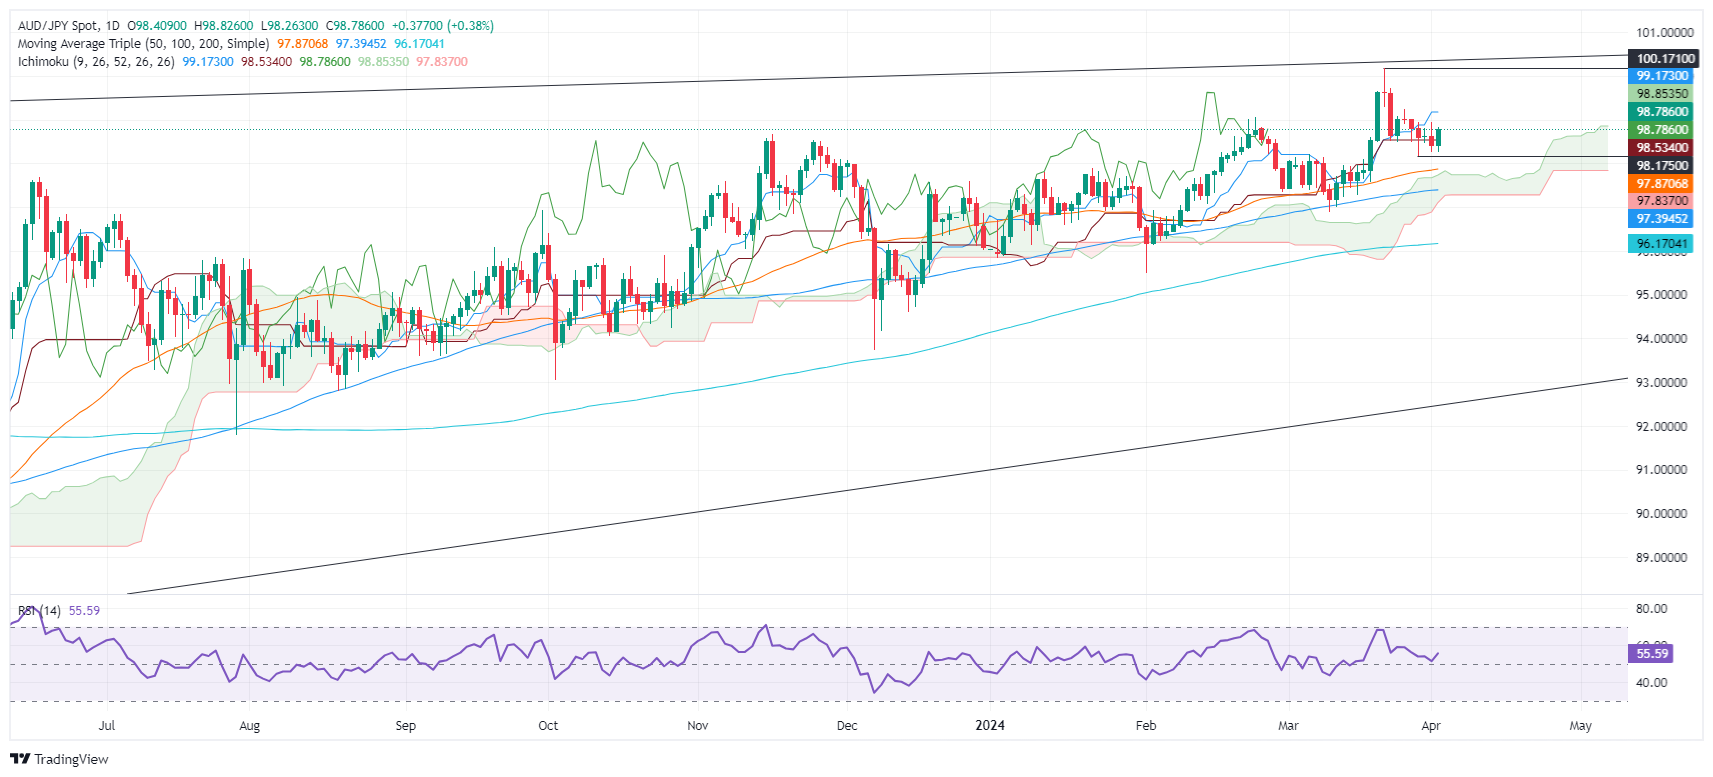
- AUD/JPY advances, navigating through mixed market signals and intervention concerns, marking a 0.38% increase.
- Technical indicators point to the first significant resistance at the Tenkan-Sen, with potential to test year-to-date highs.
- Downside risks remain, with support levels identified at the Kijun-Sen and the 50-day moving average.
The AUD/JPY registered gains of 0.38% on Tuesday, amid a risk-off impulse as depicted by Wall Street. US equities posted mild losses, though it was ignored by risk-perceived currencies in the FX markets, like the Australian Dollar.
AUD/JPY Price Analysis: Technical outlook
The threats of an intervention in the Forex markets to boost the Japanese Yen (JPY) by Japanese authorities, keeps traders at bay, uncommitted to open fresh long bets that could send the AUD/JPY toward the -year-to-date (YTD) high if 100.17. The Relative Strength Index (RSI) depicts that buyers are in charge.
That said, the AUD/JPY first resistance level would be the Tenkan-Sen at 99.17, followed by the YTD high. A breach of the latter will expose the psychological 100.50 mark, followed by the 101.00 mark.
On the flip side, if sellers move in and push prices below the Kijun-Sen of 98.53, that can pave the way to test 98.00. Once surpassed, the next stop would be the 50-day moving average (DMA) at 97.87, ahead of testing the Ichimoku Cloud (Kumo) top at 97.80.
AUD/JPY Price Action – Daily Chart
- On the daily chart, sellers maintain control over as indicators near oversold conditions.
- The hourly RSI recovered and moved deep in positive zone..
- A bearish crossover completed at 0.6070 may have confirmed the bearish bias for the short term.
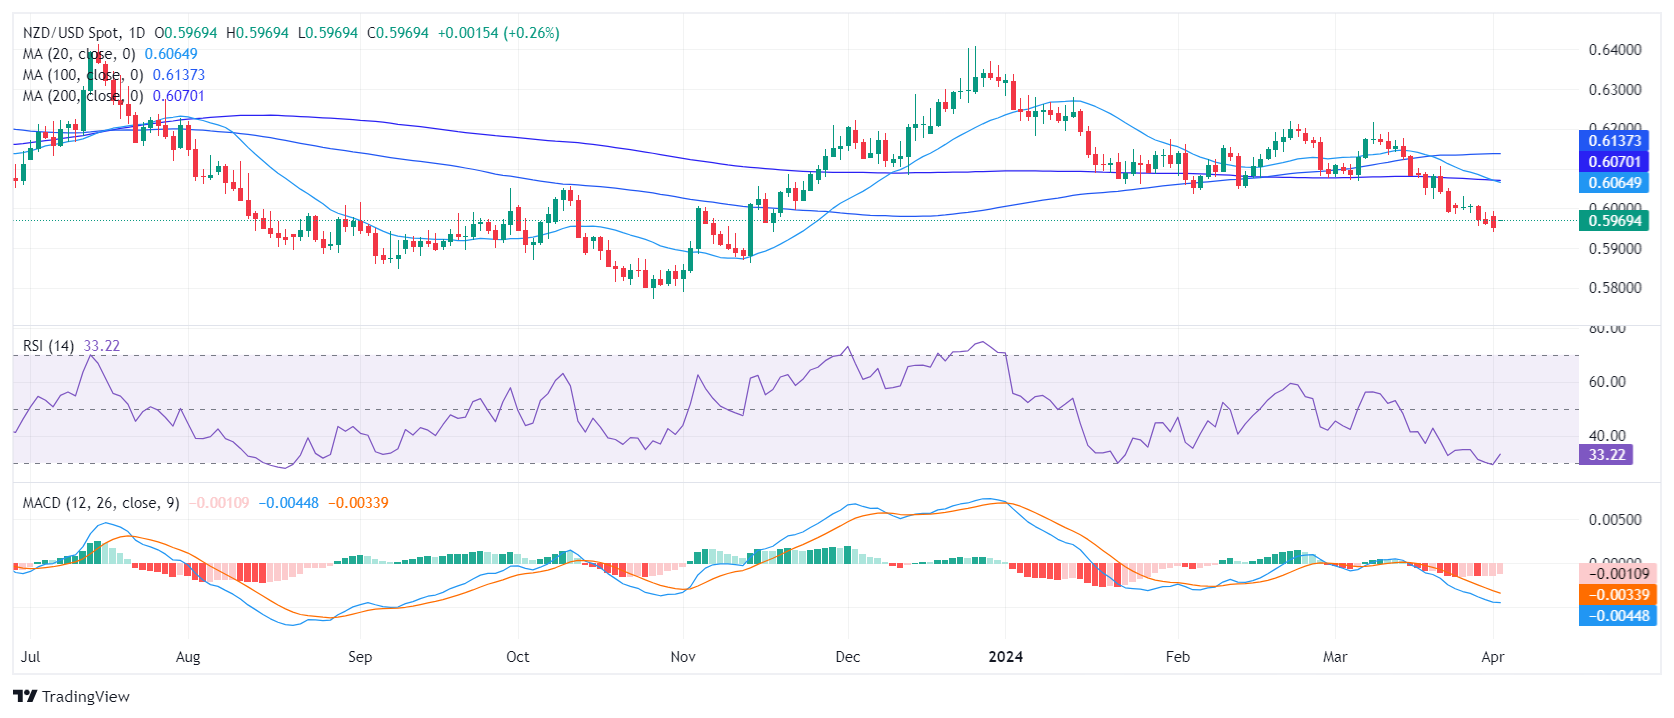
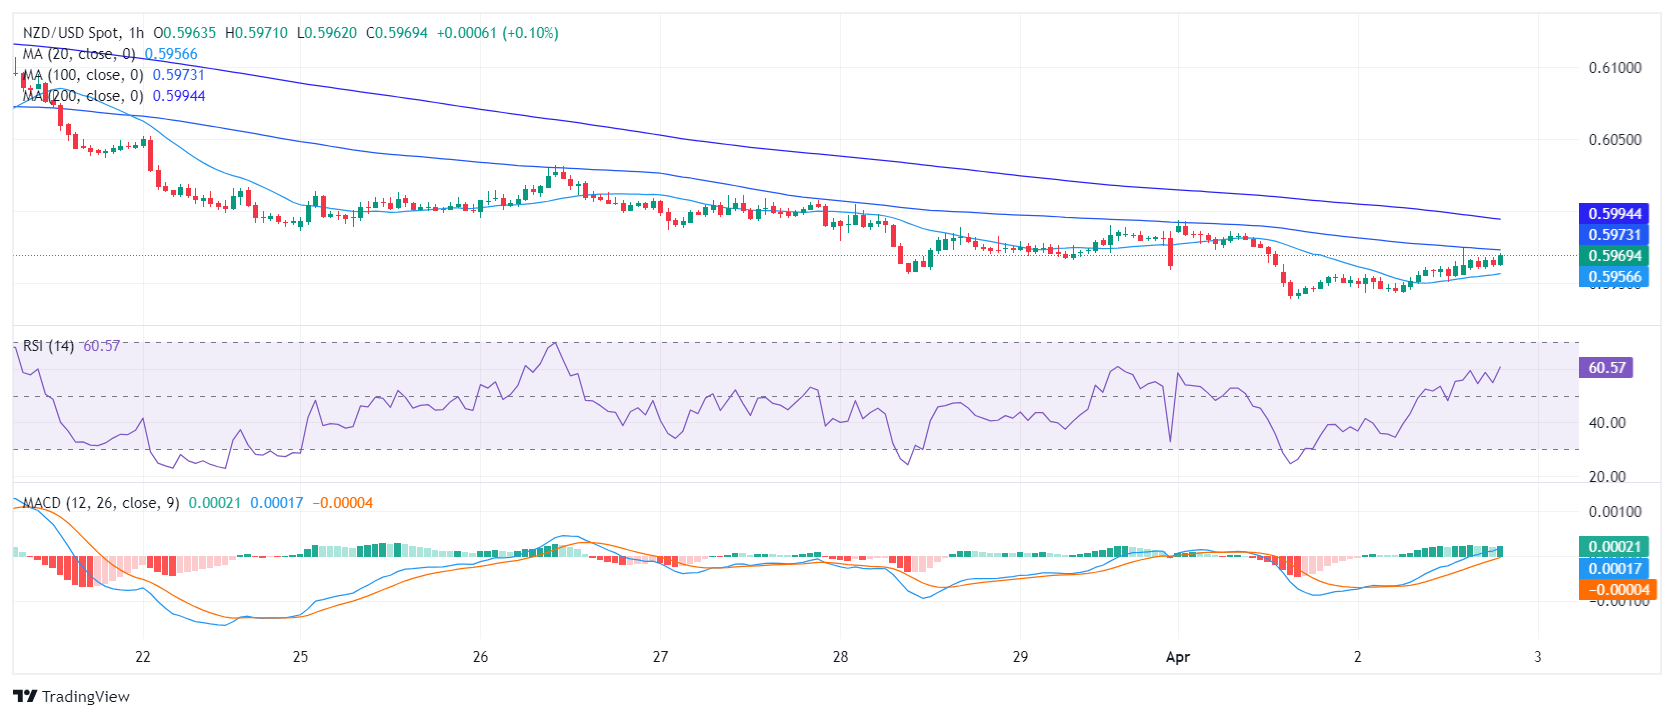
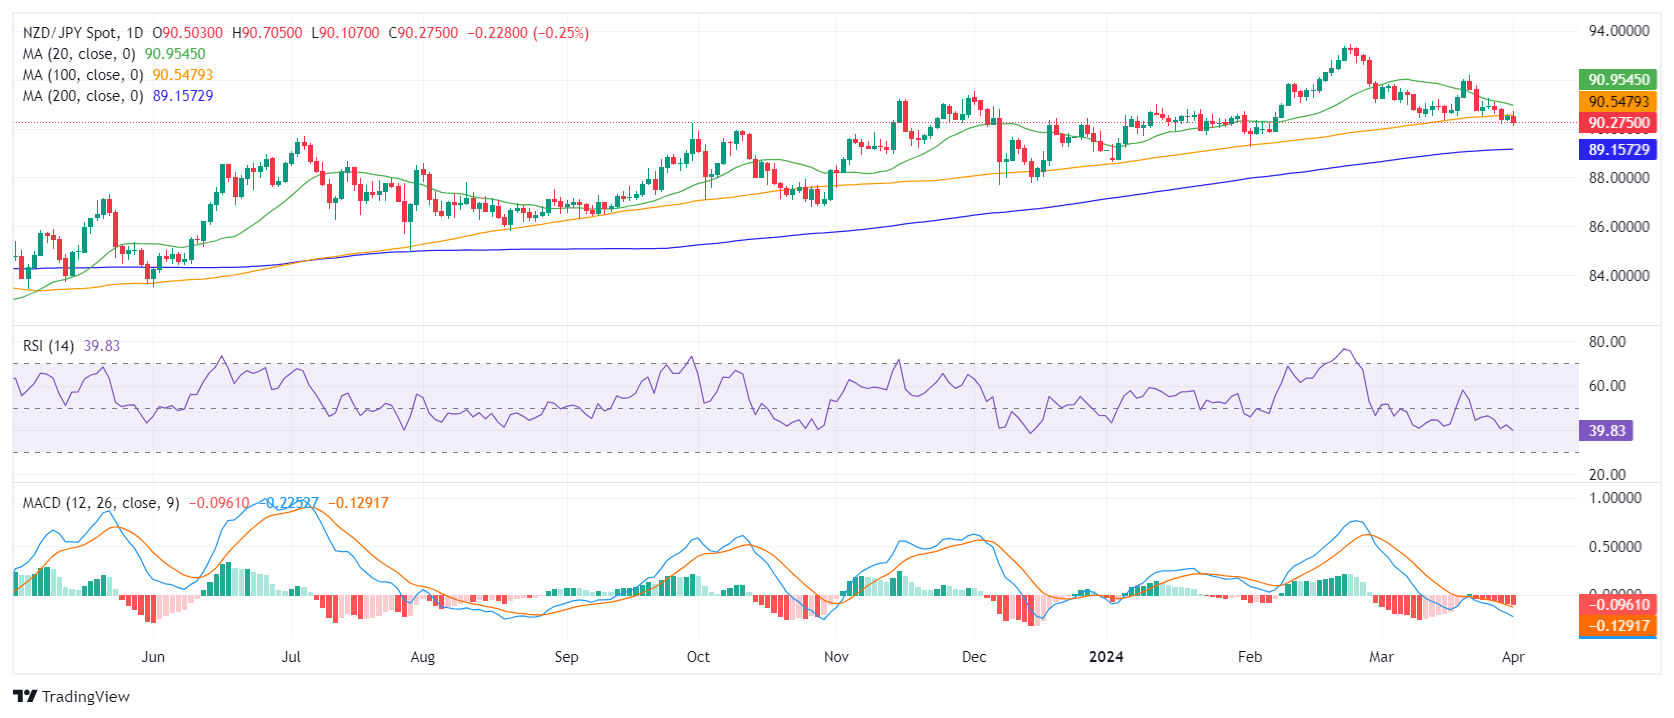
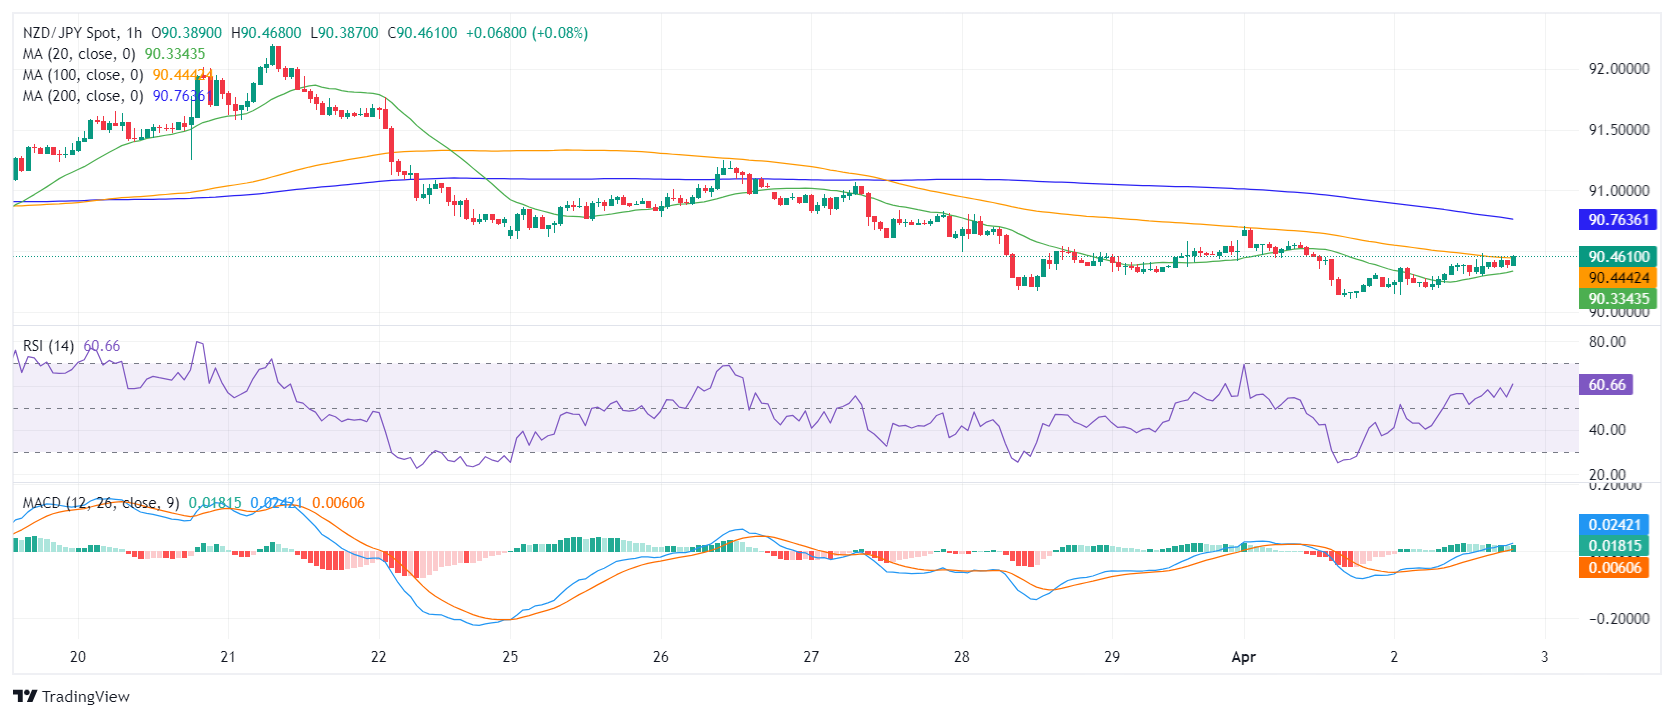
The NZD/USD pair is currently trading at 0.5965, with a marginal gain of 0.13%. Despite these slight gains, the pairing continues to illustrate an overall bearish sentiment, with the selling force maintaining dominance over the market trend. On the shorter timeframes, a light of hope emerged ahead of the Asian session.
On the daily chart, the technical outlook for the NZD/USD pair is primarily bearish. The Relative Strength Index (RSI) remains in negative territory, with the latest reading at 36, flirting with the oversold threshold, indicating a steady dominance by sellers in the market. Meanwhile, the Moving Average Convergence Divergence (MACD) supports this negativity with decreasing red bars, suggesting strengthening downward momentum.
NZD/USD daily chart
In contrast, the hourly chart provides a somewhat different perspective. The latest RSI reading leaned towards positive territory at 60 while the hourly MACD affirms this with rising green bars, showing short-term positive momentum.
NZD/USD hourly chart
The inspection of the broader outlook reveals that the NZD/USD shows a bearish trend, given its position relative to its Simple Moving Averages (SMAs). The pair is below the 20-day, 100-day, and 200-day SMAs, indicating sustained downward bias in both the short-term and long-term contexts. Furthermore, the bearish crossover of the 20 and 200-day SMAs at the 0.6070 level suggests a persistent and significant downtrend is foreseeable, also endorsing the negative outlook.
In conclusion, while the daily chart illustrates a flattened negative trend, the oscillations on the hourly chart offer short-term trading nuances. Overall, the NZD/USD is primarily bearish, with a key focus on the 0.6070 SMA crossover which points for further confirmation of the downtrend.
- Gold climbs to $2,280, driven by Middle East tensions, strong US data.
- High US Treasury yields, strong US Dollar counterbalanced by geopolitical worries, tight labor market.
- Mester lacks info for a May rate cut but predicts three 2024 cuts, balancing inflation and job risks.
- Daly discussed rate duration, supports three rate cuts as a projection, not a promise.
Gold price rallies to new all-time highs of $2,276 late in the North American session amid geopolitical risks and despite higher US Treasury yields. Economic data from the United States (US) prompted investors a flight to safe-haven assets, sending the yellow metal higher. At the time of writing XAU/USD exchanges hands at $2,280 gaining more than 1%.
The recent attack of Israel against an Iran embassy in Syria on April 1, sponsored Gold’s leg up despite witnessing a jump in US yields and a strong US Dollar on Monday. Aside from this, the US Bureau of Labor Statistics (BLS) showed that job vacancies increased, revealing a tight labor market, while the US Census Bureau witnessed an improvement in Factory Orders.
In the meantime, Federal Reserve (Fed) officials crossed the newswires, led by the Cleveland Fed President Loretta Mester and the San Francisco Fed President Mary Daly.
Daily Digest Market Movers: Gold price ignores goodish US data, high US yields
- February’s Job Openings and Labor Turnover (JOLTS) summary revealed that job vacancies remained relatively stable. The figures reached 8.756 million, slightly above the previous month's revised total of 8.748 million and just surpassing the expected 8.75 million.
- Factory Orders in February experienced a growth of 1.4%, recovered from a -3.4% decline in January and exceeded the forecasts of a 1% increase.
- Cleveland Fed Loretta Mester said that she doesn’t have enough information for a May meeting cut, yet foresees three rate cuts in 2024. Mester added the Fed’s challenge would be balancing the risks between inflation and employment.
- San Francisco Fed President Mary Daly said the Fed need to see how long to keep rates at current levels. She supports three rate cuts, but added that it’s a projection, not a promise.
- On Friday, Fed Chair Jerome Powell responded to the latest inflation data, stating it aligned with their expectations and indicating that the Fed would not overreact to these figures. This suggests that the US central bank would remain in a wait-and-see approach toward future monetary policy decisions.
- In terms of the Federal Reserve's future interest rate movements, the CME FedWatch Tool indicates that traders currently assign a 58% likelihood to the prospect of the US central bank reducing borrowing costs.
Technical analysis: Gold rally extends, despite overbought RSI
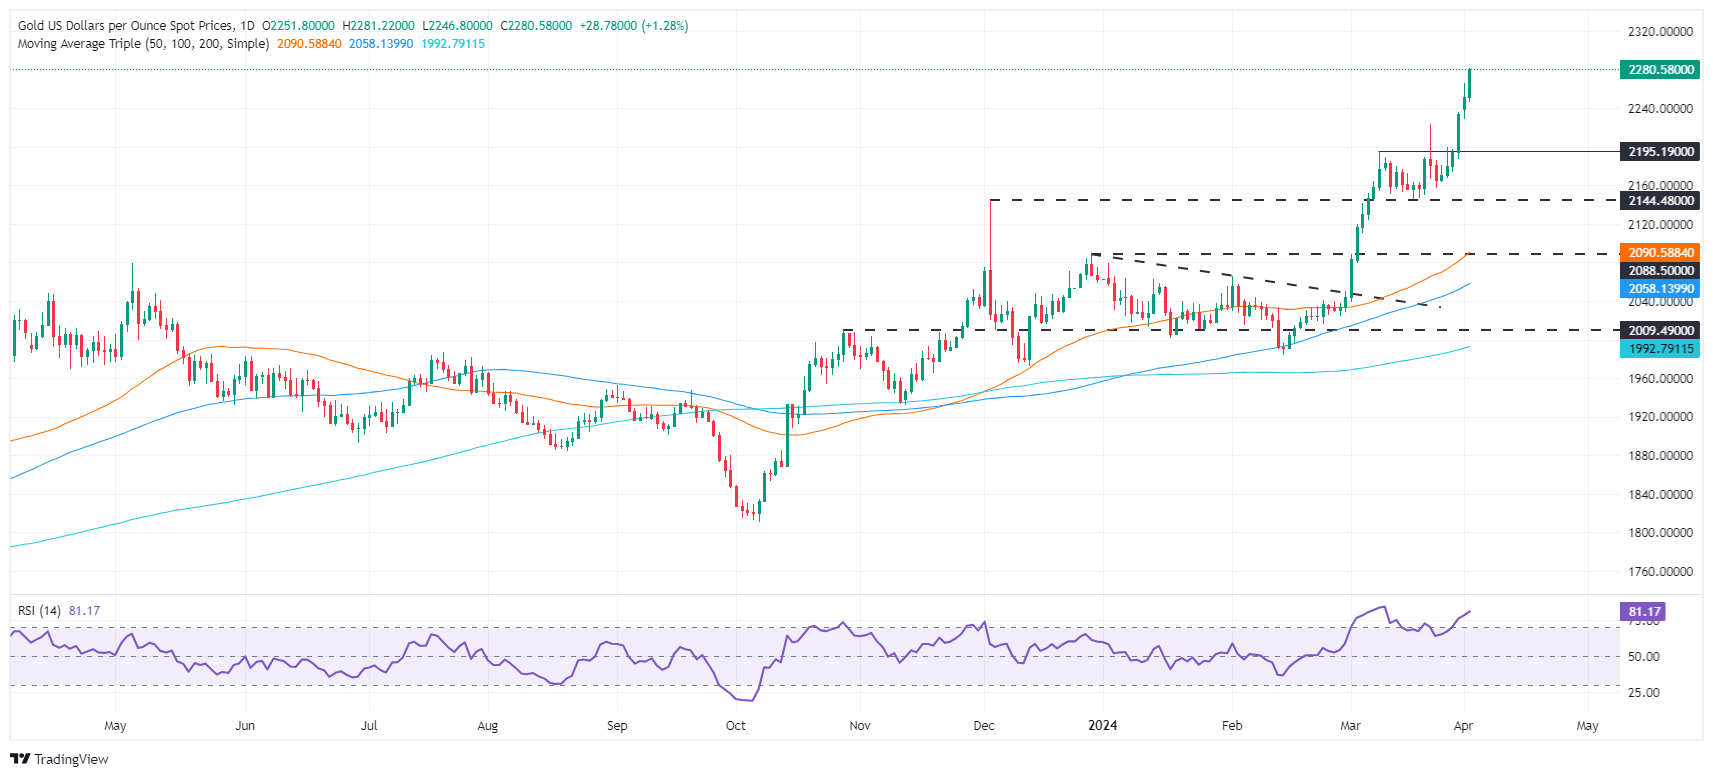
The XAU/USD daily chart suggests the yellow metal is headed towards the $2,300 figure amid renewed buying pressures observed in the Relative Strength Index (RSI). On Monday, it was mentioned that “The XAU/USD daily chart depicts Gold's last uptick to new all-time highs, achieved on lower momentum, as depicted by the Relative Strength Index (RSI).” However, as of writing, the RSI has punched above the 80.00 threshold, an indications that buyers are in charge.
With price action at uncharted territory, the next resistance level would be the $2,300 mark, followed by the $2,350 psychological figure. Up next would be $2,400.
On the other hand, if XAU/USD drops below $2,250, that could sponsor a correction. The first support would be the $2,200 figure, followed by the March 8 high turned support at $2,195, ahead of extending its losses to $2,150.
Gold FAQs
Gold has played a key role in human’s history as it has been widely used as a store of value and medium of exchange. Currently, apart from its shine and usage for jewelry, the precious metal is widely seen as a safe-haven asset, meaning that it is considered a good investment during turbulent times. Gold is also widely seen as a hedge against inflation and against depreciating currencies as it doesn’t rely on any specific issuer or government.
Central banks are the biggest Gold holders. In their aim to support their currencies in turbulent times, central banks tend to diversify their reserves and buy Gold to improve the perceived strength of the economy and the currency. High Gold reserves can be a source of trust for a country’s solvency. Central banks added 1,136 tonnes of Gold worth around $70 billion to their reserves in 2022, according to data from the World Gold Council. This is the highest yearly purchase since records began. Central banks from emerging economies such as China, India and Turkey are quickly increasing their Gold reserves.
Gold has an inverse correlation with the US Dollar and US Treasuries, which are both major reserve and safe-haven assets. When the Dollar depreciates, Gold tends to rise, enabling investors and central banks to diversify their assets in turbulent times. Gold is also inversely correlated with risk assets. A rally in the stock market tends to weaken Gold price, while sell-offs in riskier markets tend to favor the precious metal.
The price can move due to a wide range of factors. Geopolitical instability or fears of a deep recession can quickly make Gold price escalate due to its safe-haven status. As a yield-less asset, Gold tends to rise with lower interest rates, while higher cost of money usually weighs down on the yellow metal. Still, most moves depend on how the US Dollar (USD) behaves as the asset is priced in dollars (XAU/USD). A strong Dollar tends to keep the price of Gold controlled, whereas a weaker Dollar is likely to push Gold prices up.
- The RSI on the daily chart lies deep in negative terrain.
- Inidicators on the hourly chart are showing a slight improvement.
- The 20 and 100-day SMAs are about to complete a bearish crossover around 91.00.
In Tuesday's session, the NZD/JPY pair is trading with a slight rise to 90.42, marking a 0.16% gain. Despite this, sellers retain dominance within the broader market scenario, hinting towards an entrenched bearish sentiment. Encouragingly though, hourly data suggests the potential for short-term bullish corrections, indicating a touch of buyer resilience.
On the daily chart, the Relative Strength Index (RSI) shows a predominantly negative trend, remaining in the negative territory in the last sessions. Concurrently, the Moving Average Convergence Divergence (MACD) histogram reveals rising red bars, indicating a rising negative momentum.
NZD/JPY daily chart
Moving on to the hourly chart, RSI values are inclining more towards the positive side, with the recent readings registered at 53. This shift may hint at a short-term gain in buyers' momentum. In addition, the hourly MACD histogram displays green bars, adding arguments for the recovering bullish momentum.
NZD/JPY hourly chart
Upon examining the broader perspective, the NZD/JPY has showcased significant bearish tendencies as its sits below its 20, 100 and 200-day Simple Moving Averages (SMA). In addition, a bearish crossover of the 20 and 100-day SMA at around 91.00 could precipitate even sharper declines.
Summarizing, sellers seem to have control over the NZD/JPY pair's direction on the daily chart. However, recent hourly data indicates potential short-term bullish corrections. Nevertheless, the prevailing trend is inclined towards further weakness, reinforced by the SMA positioning, and a potential bearish crossover.
The Greenback retreated from recent peaks, sponsoring some much-needed respite in the risk-linked universe as European investors returned to their desks following the extended Easter holidays.
Here is what you need to know on Wednesday, April 3:
The Greenback came under renewed selling pressure and forced the USD Index (DXY) to recede to 104.70 following recent peaks beyond 105.00. On April 3, the ADP Employment Change takes centre stage, seconded by the final S&P Global Services PMI and the ISM Services PMI. In addition, the Fed's Bowman, Goolsbee, Barr, Kugler, and Powell are all due to speak.
EUR/USD managed to regain some balance and bounced off multi-week lows near 1.0720 on the back of the Dollar’s weakness. On April 3, the advanced Inflation Rate in the euro area will be in the spotlight, along with the Unemployment Rate.
GBP/USD set aside three daily negative sessions and advanced modestly on Tuesday, briefly challenging the 1.2580 region on the back of the resurgence of some selling interest in the Dollar.
USD/JPY maintained its consolidative phase unchanged, always above the 151.00 level and surrounded by persistent concerns over a potential FX intervention.
AUD/USD rose markedly and left behind part of the recent weakness, regaining at the same time the area beyond 0.6500 the figure. On April 3, the Ai Group Industry Index is due.
Prices of WTI rose to a new 2024 high past the $85.00 mark per barrel, underpinned by escalating geopolitical tensions.
Gold prices rose to an all-time high near the $2,280 level per troy ounce on the back of strong safe-haven demand. Its cousin Silver advanced nearly 4% and surpassed the $26.00 mark per ounce for the first time since May 2023.
- USD/JPY trades subdued with potential intervention by Japanese authorities.
- Technical analysis shows 152.00 as a crucial hurdle; overcoming this could target the 153.00 level for buyers.
- A break below the Tenkan-Sen could lead to losses below 150.00, with the Ichimoku Cloud providing additional key points for traders.
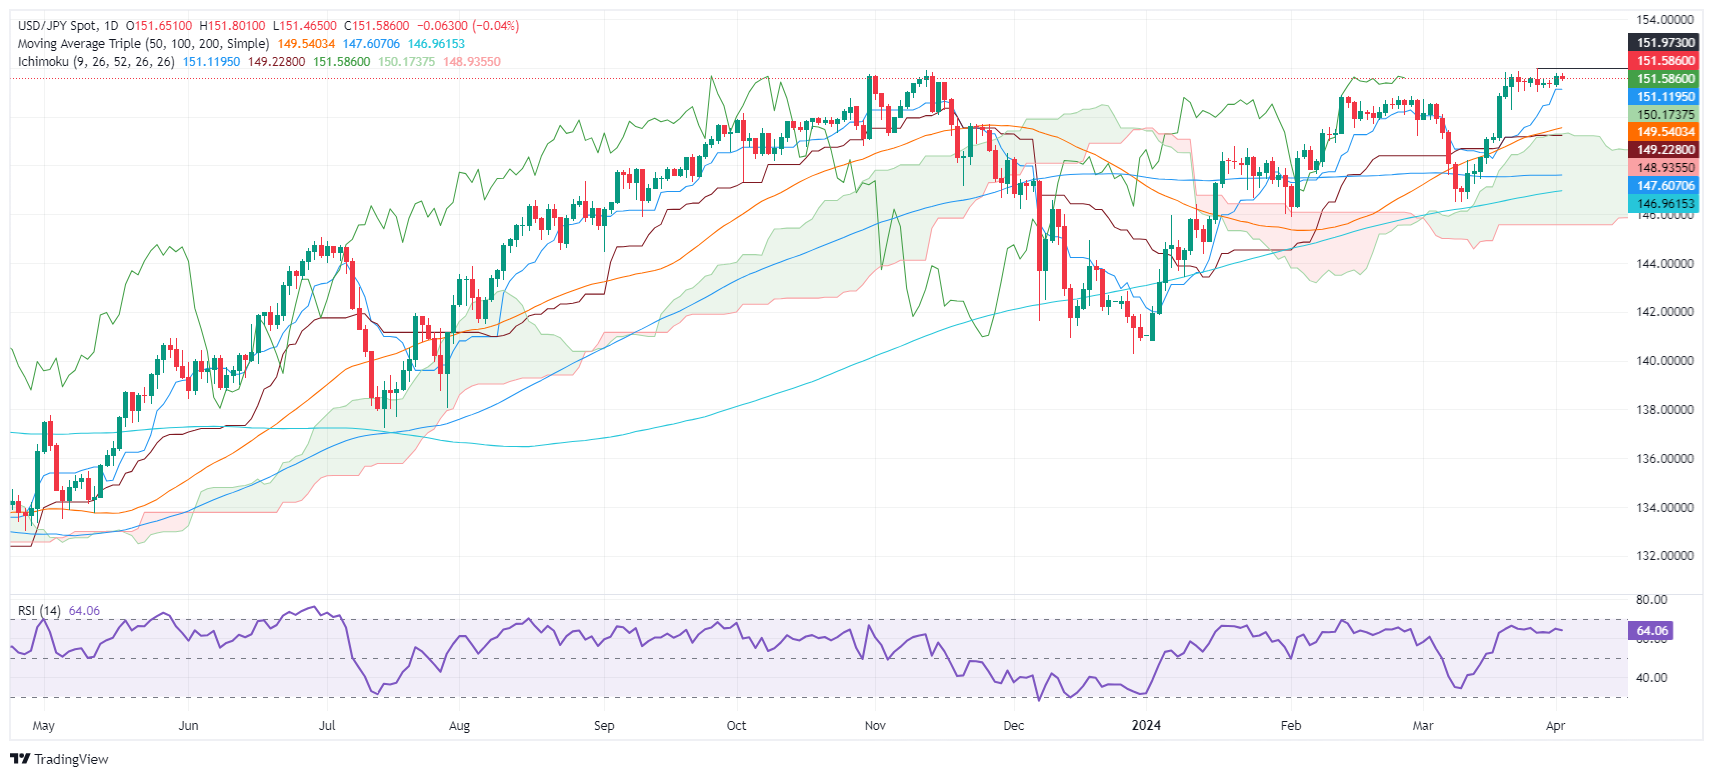
The USD/JPY remained capped at around 151.50 on Tuesday amid intervention threats from Japanese authorities. The close correlation between the US 10-year Treasury notes yield, and the major hasn’t influenced the pair’s price action, which has remained below the 152.00 mark.
USD/JPY Price Analysis: Technical outlook
The USD/JPY remains capped by the 152.00 figure, though technical support lies at the Tenkan-Sen at 151.12. If buyers reclaim 152.00, that will pave the way for resting the 153.00 figure. On the other hand, if sellers push the exchange rate below the Tenkan Sen, that will pave the way to 151.00.
Once surpassed, the next support emerges at the Senkou Span A at 10.17, followed by the Kijun-Sen at 149.23. Further weakness in the pair could send it toward the Senkou Span B at 148.93, well inside the Ichimoku Cloud (Kumo).
USD/JPY Price Action – Daily Chart
Japanese Yen FAQs
The Japanese Yen (JPY) is one of the world’s most traded currencies. Its value is broadly determined by the performance of the Japanese economy, but more specifically by the Bank of Japan’s policy, the differential between Japanese and US bond yields, or risk sentiment among traders, among other factors.
One of the Bank of Japan’s mandates is currency control, so its moves are key for the Yen. The BoJ has directly intervened in currency markets sometimes, generally to lower the value of the Yen, although it refrains from doing it often due to political concerns of its main trading partners. The current BoJ ultra-loose monetary policy, based on massive stimulus to the economy, has caused the Yen to depreciate against its main currency peers. This process has exacerbated more recently due to an increasing policy divergence between the Bank of Japan and other main central banks, which have opted to increase interest rates sharply to fight decades-high levels of inflation.
The BoJ’s stance of sticking to ultra-loose monetary policy has led to a widening policy divergence with other central banks, particularly with the US Federal Reserve. This supports a widening of the differential between the 10-year US and Japanese bonds, which favors the US Dollar against the Japanese Yen.
The Japanese Yen is often seen as a safe-haven investment. This means that in times of market stress, investors are more likely to put their money in the Japanese currency due to its supposed reliability and stability. Turbulent times are likely to strengthen the Yen’s value against other currencies seen as more risky to invest in.
Federal Reserve Bank of San Francisco President Mary Daly mentioned on Tuesday that we must assess the duration for maintaining rates at their current level. She added that inflation is gradually decreasing, though the process is erratic and gradual. Daly noted that while there's no immediate need to modify the rate; maintaining the status quo is the appropriate policy at present. She also argued that progress is being made, but there's a noticeable supply and demand disparity in the housing market. The economy is showing signs of improvement, and while there's a trajectory where interest rates begin to adjust this year, we haven't reached that point yet.
Extra quotes
“There's a 'real risk' of cutting rates too soon.”
“If we lock inflation in at this level, that's a 'toxic tax'.”
“We want to fully bring inflation back to 2%.”
“3 rate cuts this year is 'reasonable' baseline.”
“Projection of 3 rates cuts is not a promise.”
Market Reaction
The Greenback appears unfazed by today’s set of Fedspeakers and keeps trading on the defensive around the 104.80 zone.
- The Sterling has trimmed some losses amid Yen weakness and upbeat UK manufacturing data
- Failure to break above 190.75 would keep the bearish structure intact.
- An AB=CD correction might push the pair to 189.70.
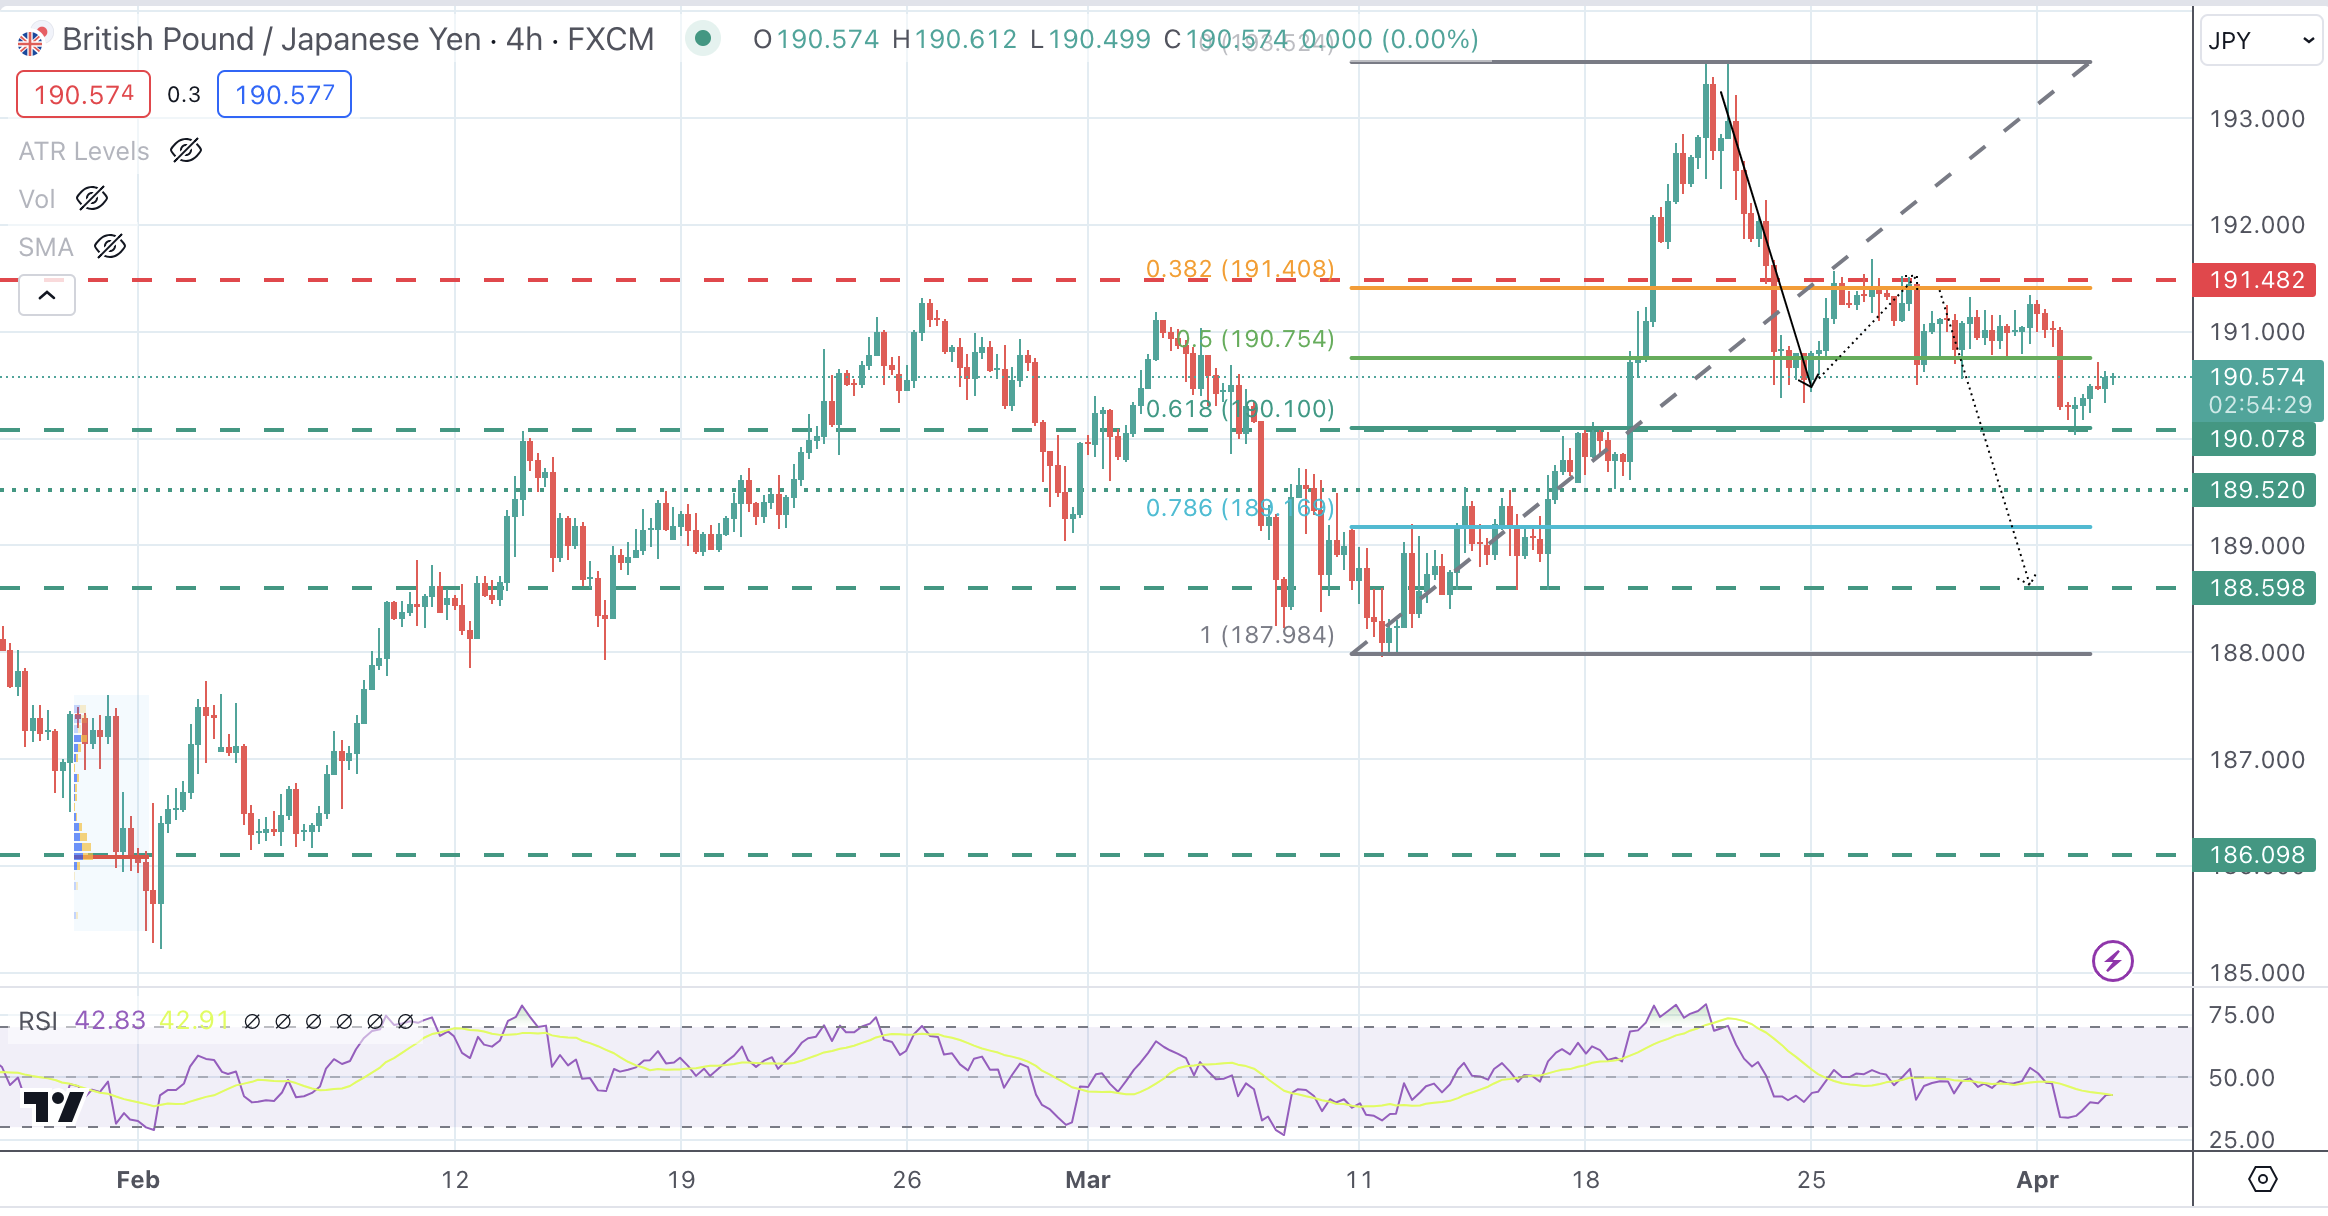
The Sterling is moderately higher on Tuesday, favored by a somewhat weaker Yen, which suffers when US Treasury yields rise and the upbeat UK manufacturing figures. Bulls, however, are likely to be challenged at the 190.75 area.
GBP/JPY Price Analysis: Technical Outlook
The pair has completed a bullish cycle at 193.55 and is going through a corrective reversal with scope for further decline. Bears have been contained so far at the 61.8% Fibonacci retracement of the March rally, but a failure to return above 190.75 would keep the negative structure intact.
An AB=CD correction would push the pair through the 190.11 support area toward the 189.60 level. On the contrary. a confirmation above 190.75 and 1.91.50 would negate this view.
GBP/JPY 4-hour chart
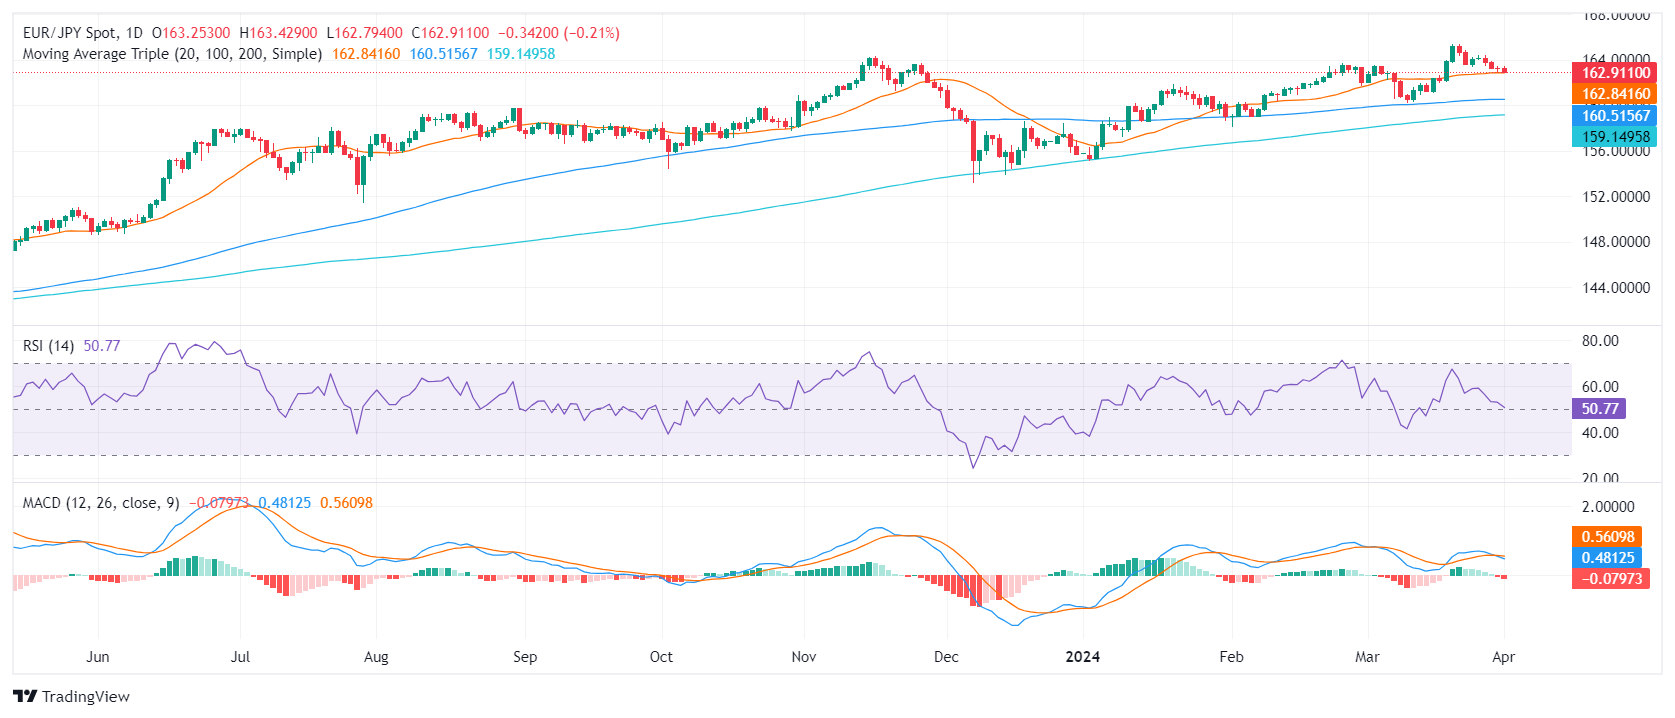
- Indicators on the daily chart show a steady buying momentum.
- Bulls need to maintain control over the current support around the 20-day SMA to avoid additional losses.
- Hourly chart indicators show signs of recovery.
The EUR/JPY pair is currently oscillating around the 163.20 mark, showing a slight increase in Tuesday’s session. The persisting momentum suggests an upper hand for the bulls, but if the pair falls below the 20-day Simple Moving Average (SMA), there may be a likelihood for sellers to force a momentum shift.
On the daily chart, the EUR/JPY pair has a mildly positive outlook. The Relative Strength Index (RSI) fluctuates in the positive territory, peaking at 65 last week before slipping to 52 in the most recent reading. The Moving Average Convergence Divergence (MACD) continues to print flat red bars, indicating a slightly negative momentum.
EUR/JPY daily chart
Switching to the hourly chart, the sentiment also leans towards positivity. The RSI, which started the session from a low point in negative territory at 39, has since recovered strongly to the positive territory with the most recent reading at 61. Reinforcing this positive trend, the MACD histogram prints green bars.
EUR/JPY hourly chart
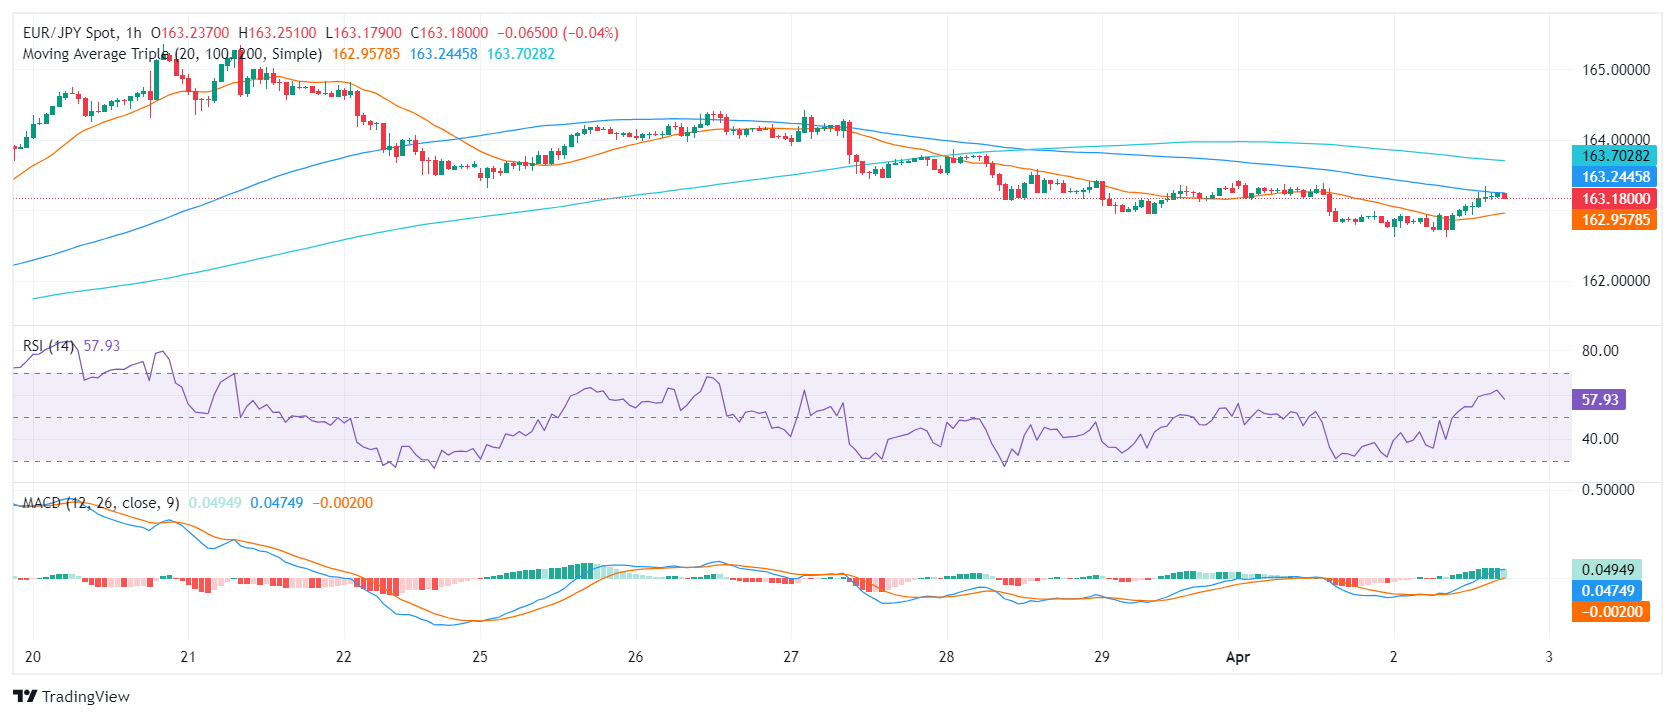
In summary, the EUR/JPY pair is demonstrating an overall upward bias amidst minor setbacks. Both the daily and hourly charts portray a positive sentiment, as indicated by the RSI and MACD values. Along with the pair standing above its 20,100 and 200-day SMA, the overall market inclination leans towards the bulls.
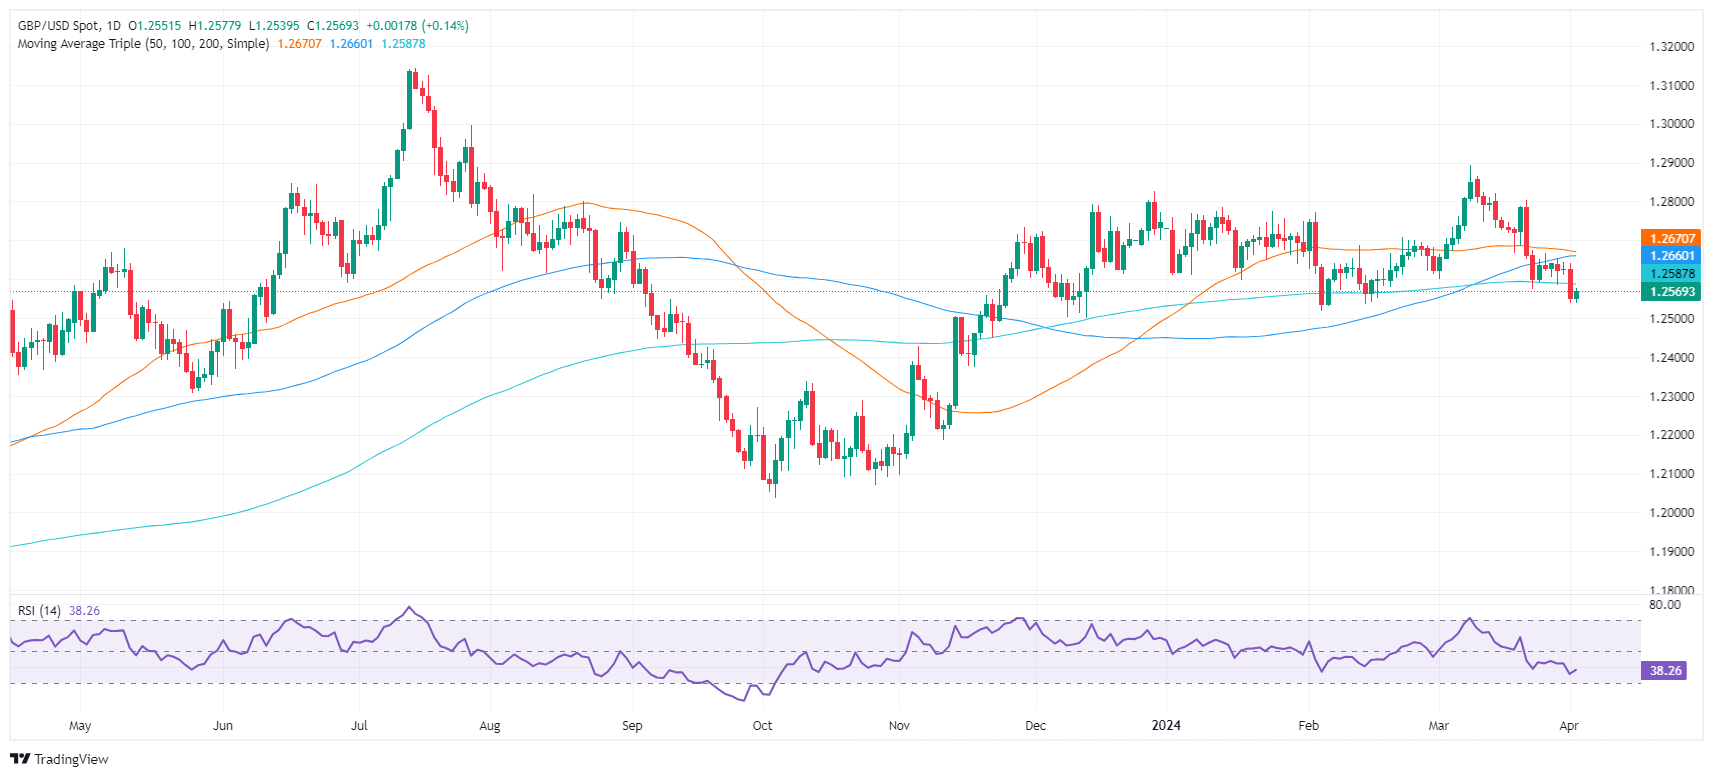
- GBP/USD climbs to 1.2573, rebounding amidst rising US Treasury yields and mixed signals from Fed officials.
- US job openings slightly exceed expectations, while Factory Orders show robust growth, impacting Treasury note rates.
- UK manufacturing sector returns to expansion, boosting Sterling ahead of upcoming service sector data.
The Pound Sterling registered solid gains on Tuesday after diving to a one-month low of 1.2539 on Monday as European financial markets were shut off due to a holiday. At the time of writing, the GBP/USD trades at 1.2573, a gain of 0.18%.
GBP/USD bounces back from monthly lows as manufacturing activity improves
US Treasury yields climbed on solid US economic data. The US Bureau of Labor Statistics revealed that job openings increased from 8.745M to 8.756M, above estimates of 8.75M in February. Layoffs ticked up from 1.6M to 1.7M while the quitting rate rose modestly to 3.5M. In other data, Factory Orders expanded by 1.4% MoM in February, a substantial recovery from January’s -3.8% plunge and above forecasts of 1%.
Following the data, the US 10-year Treasury note coupon rose to 4.409%, its highest since November of last year. Conversely, the US Dollar Index (DXY), which tracks the buck's performance against other six currencies, dropped 0.17% to 104.79.
Recently, Federal Reserve officials have crossed the wires. The Cleveland Fed President Loretta Mester expects the Fed could cut rates later this year, yet doesn’t see the first one at the upcoming meeting. She sees bigger monetary policy risks if the Fed cuts too soon, adding that the economic strength of the economy gives the central bank space before easing policy.
Across the pond, S&P Global revealed that Manufacturing activity, as measured by the PMI in the UK, rose from 47.5 to 50.3, exceeding estimates of 49.9. According to the survey, it was the first month of expansion in twenty, thanks to recovering demand.
Ahead in the week, the UK economic docket will feature S&P Global Services PMI. On the US front, traders’ eye Fed speeches, along with the release of the ADP Employment Change report on Wednesday and the ISM Services PMI.
GBP/USD Price Analysis: Technical outlook
The GBP/USD remains downward biased despite posting a recovery. Buyers failed to reclaim the 200-day moving average (DMA) of 1.2580, which could pave the way for a pullback toward the December 13 low of 1.2500. A breach of the latter will expose the November 17 low of 1.2374. On the other hand, if buyers push prices above the 200-DMA, look for a test of 1.2600. Key resistance levels lie at the 100-DMA at 1.2652 and the 50-DMA at 1.2676.
Pound Sterling FAQs
The Pound Sterling (GBP) is the oldest currency in the world (886 AD) and the official currency of the United Kingdom. It is the fourth most traded unit for foreign exchange (FX) in the world, accounting for 12% of all transactions, averaging $630 billion a day, according to 2022 data. Its key trading pairs are GBP/USD, aka ‘Cable’, which accounts for 11% of FX, GBP/JPY, or the ‘Dragon’ as it is known by traders (3%), and EUR/GBP (2%). The Pound Sterling is issued by the Bank of England (BoE).
The single most important factor influencing the value of the Pound Sterling is monetary policy decided by the Bank of England. The BoE bases its decisions on whether it has achieved its primary goal of “price stability” – a steady inflation rate of around 2%. Its primary tool for achieving this is the adjustment of interest rates. When inflation is too high, the BoE will try to rein it in by raising interest rates, making it more expensive for people and businesses to access credit. This is generally positive for GBP, as higher interest rates make the UK a more attractive place for global investors to park their money. When inflation falls too low it is a sign economic growth is slowing. In this scenario, the BoE will consider lowering interest rates to cheapen credit so businesses will borrow more to invest in growth-generating projects.
Data releases gauge the health of the economy and can impact the value of the Pound Sterling. Indicators such as GDP, Manufacturing and Services PMIs, and employment can all influence the direction of the GBP. A strong economy is good for Sterling. Not only does it attract more foreign investment but it may encourage the BoE to put up interest rates, which will directly strengthen GBP. Otherwise, if economic data is weak, the Pound Sterling is likely to fall.
Another significant data release for the Pound Sterling is the Trade Balance. This indicator measures the difference between what a country earns from its exports and what it spends on imports over a given period. If a country produces highly sought-after exports, its currency will benefit purely from the extra demand created from foreign buyers seeking to purchase these goods. Therefore, a positive net Trade Balance strengthens a currency and vice versa for a negative balance.
- Aussie’s recovery is losing pace, as US macroeconomic data beats expectations.
- US Factory Orders and JOLTS Job Openings endorse the view of a strong economy with a tight labour market.
- Cleveland Fed President, Loreta Mester hints at rate cuts in 2024 but she does not say when.
The Australian Dollar bounced up from the 0.6480 support area on Tuesday. Bulls, however, are struggling to find a significant acceptance above the 0.6500 area, which keeps the broader bearish trend intact.
In the US, data from the Census Bureau reported a larger-than-expected recovery in Factory Orders, which confirms the strong momentum of the manufacturing sector, following Tuesday’s bright ISM PMI report.
Beyond that, the US JOLTS Job Openings increased beyond expectations in February. These data have contributed to endorse the view of a strong economy with a tight labour market, which poses a challenge to the Fed's easing plans.
Cleveland Fed President, Loreta Mester, has calmed markets somewhat, hinting at rate cuts later this year but she added that the bank might need more time to confirm that inflation is on its way to the 2% target. Later today, San Francisco Fed CEO, Mary Daly, a moderate hawk, might give some more insight into the bank’s rate outlook.
- Dow Jones extends its reversal as doubts about a June rate cut increase.
- US Factory Orders and JOLTS Job openings endorse the “no-landing” scenario for US the economy.
- The health sector is leading losses as Medicare rates have disappointed investors.
The main Wall Street indexes are going down for the second consecutive day on Tuesday. The Dow Jones Industrial Average (DJIA) is leading following strong US Factory Orders and JOLTS Jobs Opening data.
Orders for products manufactured in the US have increased 1.4% in February, following a 3.8% decline and beating expectations of a 1% increase. Beyond that, Job Openings have increased from 8.748 million to 8.756 million , above the 8.74 million expected by the markets.
The recent US data confirms the strong US economic outlook and a tight labor market, far from the ideal scenario to start lowering borrowing costs. This has left investors wondering about June’s rate cut, which sent US yields and the US Dollar higher while equities bled.
Dow Jones news
The Dow Jones Index declines 1.23% to 39,078 on Tuesday’s morning trade. The Health sector is leading losses with a 1.98% decline following reports that the Biden administration has failed to increase Medicare rates to the extent investors would have hoped.
The Consumer Discretionary sector drops 1.62%. Only the Energy and Utilities sectors are trading above opening levels with increases of 0.53% and 0.24%, respectively.
United Health Group (UNH) is the biggest loser on Tuesday with a 7.6% sell-off to $452.73. Next is Intel (INTC), trading 2.06% below opening levels to $43.60.
On the positive side, Dow Inc (DOW) advances 0.55% to $58.58 with Verizon Communications (VZ) up 0.4% to $42.45.
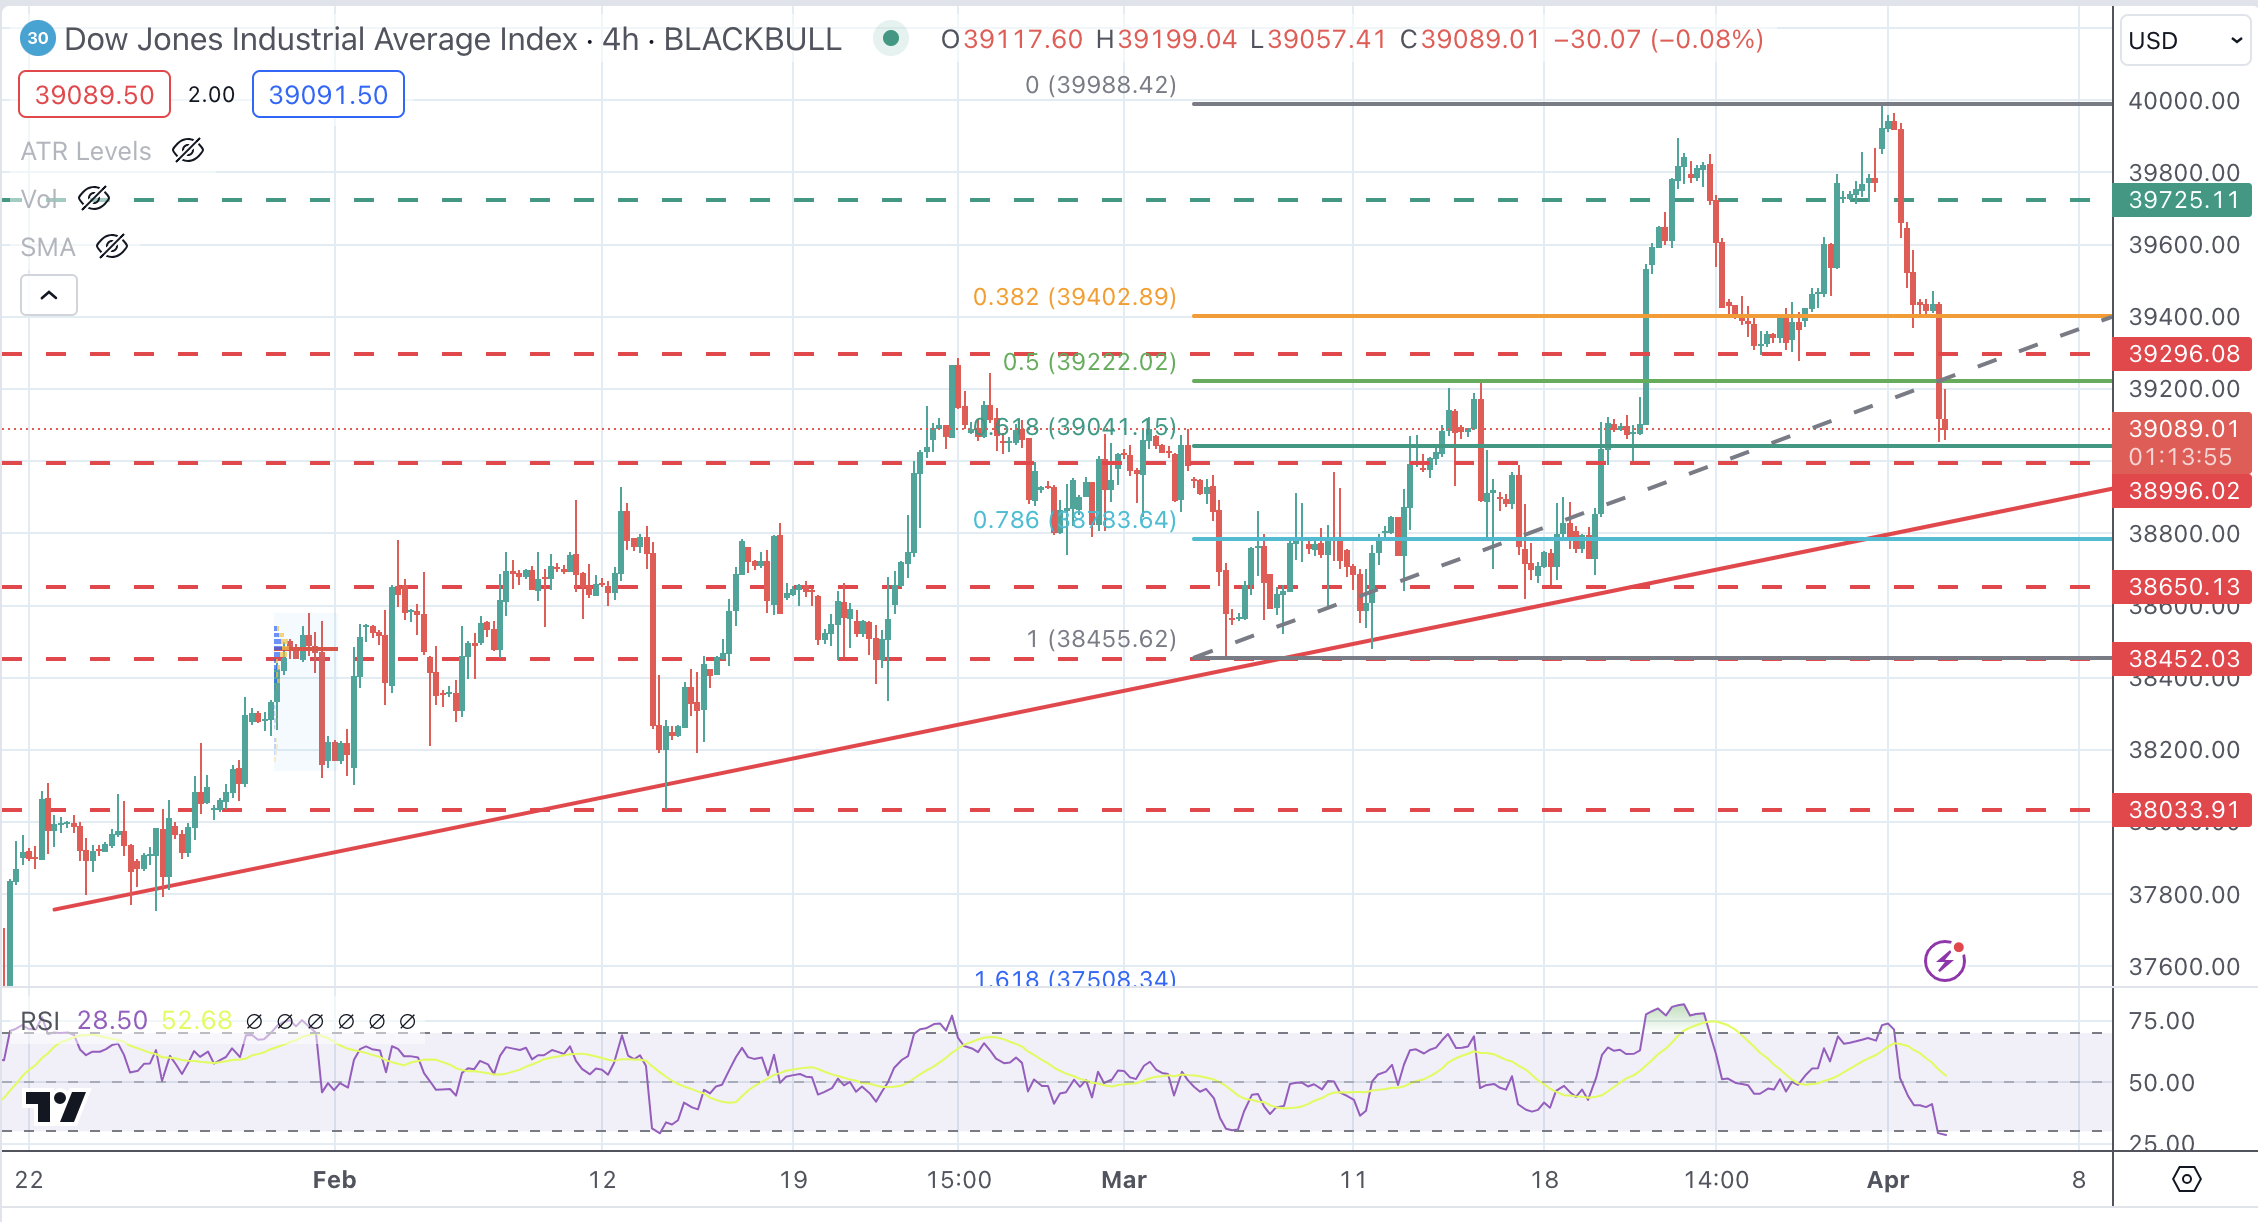
Dow Jones technical outlook
The technical picture shows the Dow Jones Index correcting lower with the broader bullish trend still intact. Price Action has broken the 50% Fibonacci retracement of the March rally, at 39,300, and is heading to the 39,000 support area. Further down, trendline support is at 38,835.
On the upside, the mentioned support at 39,300 might act as a resistance now and close the path toward the key area at 40,000.
DJIA 4-Hour Chart
Dow Jones FAQs
The Dow Jones Industrial Average, one of the oldest stock market indices in the world, is compiled of the 30 most traded stocks in the US. The index is price-weighted rather than weighted by capitalization. It is calculated by summing the prices of the constituent stocks and dividing them by a factor, currently 0.152. The index was founded by Charles Dow, who also founded the Wall Street Journal. In later years it has been criticized for not being broadly representative enough because it only tracks 30 conglomerates, unlike broader indices such as the S&P 500.
Many different factors drive the Dow Jones Industrial Average (DJIA). The aggregate performance of the component companies revealed in quarterly company earnings reports is the main one. US and global macroeconomic data also contributes as it impacts on investor sentiment. The level of interest rates, set by the Federal Reserve (Fed), also influences the DJIA as it affects the cost of credit, on which many corporations are heavily reliant. Therefore, inflation can be a major driver as well as other metrics which impact the Fed decisions.
Dow Theory is a method for identifying the primary trend of the stock market developed by Charles Dow. A key step is to compare the direction of the Dow Jones Industrial Average (DJIA) and the Dow Jones Transportation Average (DJTA) and only follow trends where both are moving in the same direction. Volume is a confirmatory criteria. The theory uses elements of peak and trough analysis. Dow’s theory posits three trend phases: accumulation, when smart money starts buying or selling; public participation, when the wider public joins in; and distribution, when the smart money exits.
There are a number of ways to trade the DJIA. One is to use ETFs which allow investors to trade the DJIA as a single security, rather than having to buy shares in all 30 constituent companies. A leading example is the SPDR Dow Jones Industrial Average ETF (DIA). DJIA futures contracts enable traders to speculate on the future value of the index and Options provide the right, but not the obligation, to buy or sell the index at a predetermined price in the future. Mutual funds enable investors to buy a share of a diversified portfolio of DJIA stocks thus providing exposure to the overall index.
- Tuesday’s highlight was the US Bureau of Labor Statistics reporting on strong JOLTs Job Openings figures for February.
- Markets await additional data to guide easing cycle expectations, widely expected to commence in June.
- Events on the horizon this week include Nonfarm Payrolls, Average Hourly Earnings, and Unemployment rate.
The US Dollar Index (DXY) trades at 104.95 with mild losses. The Federal Reserve (Fed) and economic data are giving signals of a solid US economy, which made markets back off on being fully confident of a June rate cut. Labor data this week will continue modeling those expectations.
The US economy remains resilient as the Federal Reserve adopts a cautious approach under the leadership of Powell. Despite forecasts indicating higher inflation, the Fed is avoiding drastic reactions to temporary price spikes. The potential beginning of a monetary easing phase in June is contingent upon future economic data. Several Fed speakers will be on the wires on Tuesday.
Daily digest market movers: DXY loses ground despite strong labor data
- The Bureau of Labor Statistics (BLS) in the US published the Job Openings and Labor Turnover Survey (JOLTS) for February, which showed 8.75M job openings.
- This figure surpassed January's adjusted count of 8.74M and overtook the market expectation of 8.74M.
- As for now, the market foresees a 63% probability of the first 25 bps rate cut in June, which is still contingent on incoming data.
- US Treasury bond yields are mixed on Tuesday with the 2-year yield at 4.70%, indicating slight downward movement. In contrast, 5 and 10-year yields at 4.34% and 4.36%, respectively, show minor increases.
- Nonfarm Payrolls, Average Hourly Earnings, and Unemployment Rate data will dictate the pace of expectations and the US Dollar for the short term.
DXY technical analysis: DXY bulls take a breather but retain control
On the daily chart, the Relative Strength Index (RSI) is on a negative slope, although still in positive territory, implying a possible weakening of buying momentum. This may be a hint that the bulls are taking a breather at this point after driving the index to its highest level since mid-February. The Moving Average Convergence Divergence (MACD) shows decreasing green bars, further indicating that the bullish momentum seems to be losing steam.
Despite showing a negative outlook in the short term, the pair is operating above its 20, 100, and 200-day Simple Moving Averages (SMAs). This suggests that the overall trend remains predominantly bullish.
US Dollar FAQs
The US Dollar (USD) is the official currency of the United States of America, and the ‘de facto’ currency of a significant number of other countries where it is found in circulation alongside local notes. It is the most heavily traded currency in the world, accounting for over 88% of all global foreign exchange turnover, or an average of $6.6 trillion in transactions per day, according to data from 2022. Following the second world war, the USD took over from the British Pound as the world’s reserve currency. For most of its history, the US Dollar was backed by Gold, until the Bretton Woods Agreement in 1971 when the Gold Standard went away.
The most important single factor impacting on the value of the US Dollar is monetary policy, which is shaped by the Federal Reserve (Fed). The Fed has two mandates: to achieve price stability (control inflation) and foster full employment. Its primary tool to achieve these two goals is by adjusting interest rates. When prices are rising too quickly and inflation is above the Fed’s 2% target, the Fed will raise rates, which helps the USD value. When inflation falls below 2% or the Unemployment Rate is too high, the Fed may lower interest rates, which weighs on the Greenback.
In extreme situations, the Federal Reserve can also print more Dollars and enact quantitative easing (QE). QE is the process by which the Fed substantially increases the flow of credit in a stuck financial system. It is a non-standard policy measure used when credit has dried up because banks will not lend to each other (out of the fear of counterparty default). It is a last resort when simply lowering interest rates is unlikely to achieve the necessary result. It was the Fed’s weapon of choice to combat the credit crunch that occurred during the Great Financial Crisis in 2008. It involves the Fed printing more Dollars and using them to buy US government bonds predominantly from financial institutions. QE usually leads to a weaker US Dollar.
Quantitative tightening (QT) is the reverse process whereby the Federal Reserve stops buying bonds from financial institutions and does not reinvest the principal from the bonds it holds maturing in new purchases. It is usually positive for the US Dollar.
- Mexican Peso climbs on Greenback as Mexico's stable Business Confidence overshadows climbing US Treasury yields.
- Mexico’s economic schedule will feature Gross Fixed Investment and upcoming Banxico minutes.
- Despite positive US job and factory order figures, the Greenback's rally loses momentum.
The Mexican Peso recovered some ground against the US Dollar on Tuesday after upbeat economic data from the United States (US), while Mexico's Business Confidence remained unchanged. Although US Treasury yields climb, the Greenback fails to gain traction. The USD/MXN trades at 16.58, down 0.2%.
Mexico’s economic docket is busy during the week. The National Statistics Agency (INEGI) revealed that business confidence was unchanged at 54.3 in February yet remained at high levels, the last seen in almost eleven years. Traders will be eyeing the release of Gross Fixed Investment figures on Wednesday, followed by the release of the latest meeting minutes for the Bank of Mexico (Banxico).
Across the border, job vacancy figures for February exceeded the downwardly revised data for the previous month, while Factory Orders improved for the same period. Following the data, US Treasury yields climbed, but the US Dollar remains on the defensive.
Daily digest market movers: Mexican Peso ignores upbeat US data and rallies
- Digging deeper into Mexico’s Business Confidence data, confidence in the current economic outlook decreased from 53.7 to 53.1. In regard to expectations for the future, the sub-component cooled from 56.2 to 56.1.
- Mexico´s economic outlook remains solid as manufacturing activity expands, though at a slower pace than in January. That, coupled with strong business optimism, could underpin the Mexican currency, which is at risk of depreciating if Banxico continues to lower rates, diminishing the interest rate differential with the US.
- Last week, Banxico Governor Victoria Rodriguez Ceja remained dovish despite acknowledging that the battle against inflation hasn’t been won. She added, “When macroeconomic conditions and the inflationary outlook allow us to make additional adjustments to the reference rate to the one we already have, I consider that they would be gradual.”
- The US Bureau of Labor Statistics (BLS) revealed that the Job Openings and Labor Turnover (JOLTS) summary report showed that vacancies had changed a little in February. Figures came at 8.756 million, exceeding the previous month's downward revised numbers of 8.748 million and estimates of 8.75 million.
- The US Census Bureau revealed that Factory Orders for February rose by 1.4% after a -3.4% showing in January, exceeding estimates of 1%.
- Tuesday’s data, along with manufacturing activity expanding in March, portrays a strong economic outlook for the US economy. Although Federal Reserve Chair Jerome Powell pivoted last December, data suggests that it’s too early to begin easing policy.
- Regarding future interest rate expectations of the Fed, the CME FedWatch Tool suggests that traders see a 58% chance of the US central bank cutting borrowing costs.
- Chair Powell said at San Francisco Fed: “The fact that the US economy is growing at such a solid pace, the fact that the labor market is still very, very strong, gives us the chance to just be a little more confident about inflation coming down before we take the important step of cutting rates.”
Technical analysis: Mexican Peso buyers eye October 2015 high of 16.32
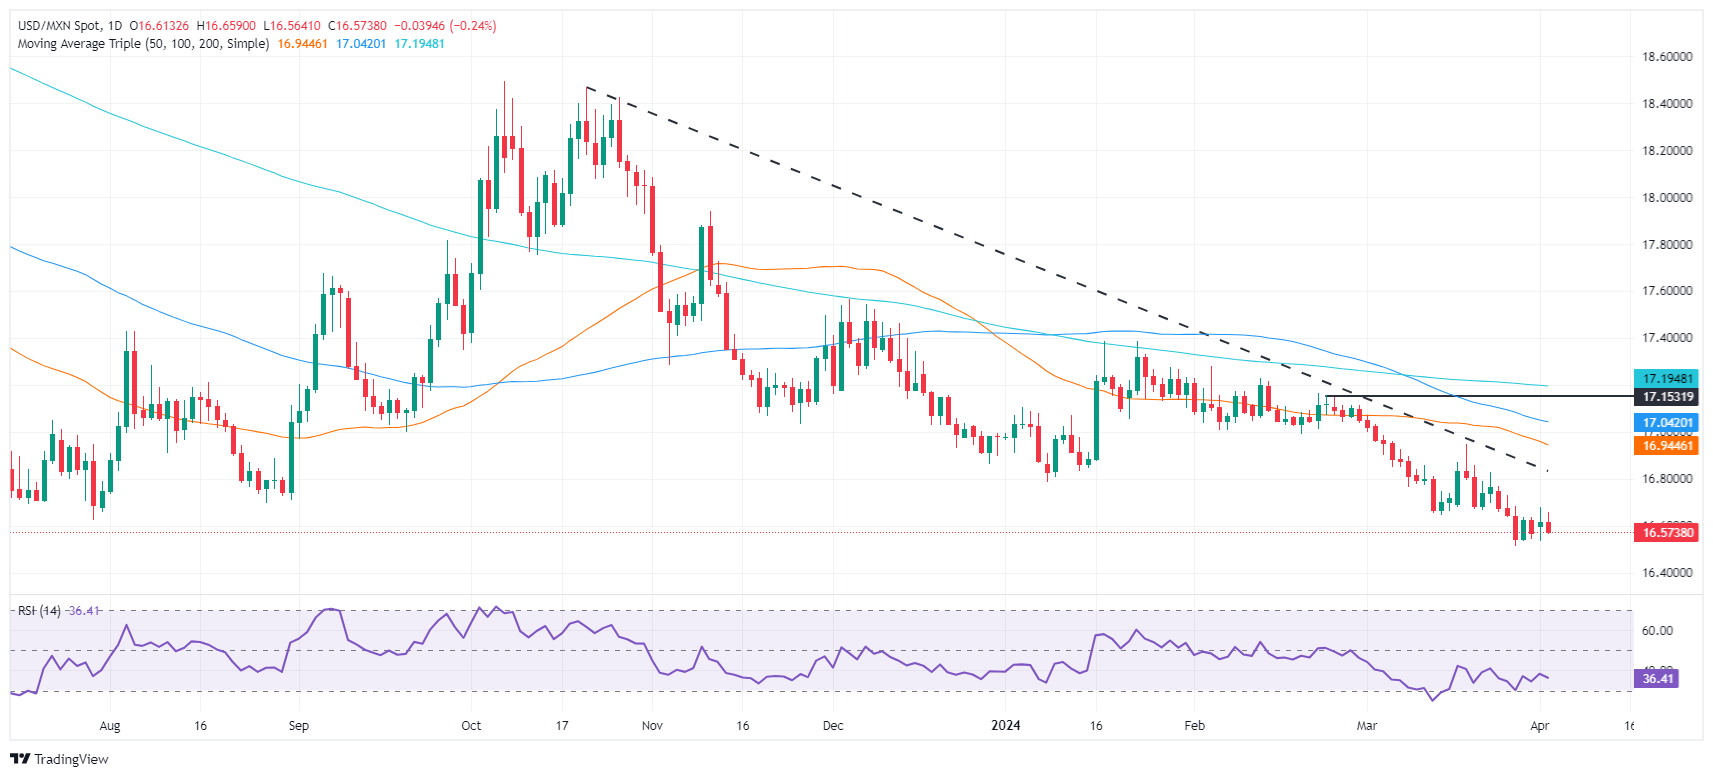
The USD/MXN consolidates within the 16.50/16.65 range for the latest five trading days. The Relative Strength Index (RSI) sees sellers' momentum fading, offering buyers an opportunity. The Mexican Peso is at levels last seen in eight years, making US Dollar longs more attractive, as the pair sits around last year's low.
If USD/MXN buyers enter, they must lift the exchange rate above the 16.70 area. Once cleared, the next stop would be the 50-day Simple Moving Average (SMA) at 16.94, with further upside seen at the 100-day SMA at 17.04, ahead of the 200-day SMA at 17.18
On the flip side, the USD/MXN might extend its losses if it remains below 16.62. A breach of the current year-to-date low of 16.51 can pave the way toward the October 2015 swing low of 16.32.
Mexican Peso FAQs
The Mexican Peso (MXN) is the most traded currency among its Latin American peers. Its value is broadly determined by the performance of the Mexican economy, the country’s central bank’s policy, the amount of foreign investment in the country and even the levels of remittances sent by Mexicans who live abroad, particularly in the United States. Geopolitical trends can also move MXN: for example, the process of nearshoring – or the decision by some firms to relocate manufacturing capacity and supply chains closer to their home countries – is also seen as a catalyst for the Mexican currency as the country is considered a key manufacturing hub in the American continent. Another catalyst for MXN is Oil prices as Mexico is a key exporter of the commodity.
The main objective of Mexico’s central bank, also known as Banxico, is to maintain inflation at low and stable levels (at or close to its target of 3%, the midpoint in a tolerance band of between 2% and 4%). To this end, the bank sets an appropriate level of interest rates. When inflation is too high, Banxico will attempt to tame it by raising interest rates, making it more expensive for households and businesses to borrow money, thus cooling demand and the overall economy. Higher interest rates are generally positive for the Mexican Peso (MXN) as they lead to higher yields, making the country a more attractive place for investors. On the contrary, lower interest rates tend to weaken MXN.
Macroeconomic data releases are key to assess the state of the economy and can have an impact on the Mexican Peso (MXN) valuation. A strong Mexican economy, based on high economic growth, low unemployment and high confidence is good for MXN. Not only does it attract more foreign investment but it may encourage the Bank of Mexico (Banxico) to increase interest rates, particularly if this strength comes together with elevated inflation. However, if economic data is weak, MXN is likely to depreciate.
As an emerging-market currency, the Mexican Peso (MXN) tends to strive during risk-on periods, or when investors perceive that broader market risks are low and thus are eager to engage with investments that carry a higher risk. Conversely, MXN tends to weaken at times of market turbulence or economic uncertainty as investors tend to sell higher-risk assets and flee to the more-stable safe havens.
“Moving rates down too soon or too quickly without sufficient evidence to give us confidence that inflation is on a sustainable and timely path back to 2% would risk undoing the progress we have made on inflation,” Cleveland Federal President Loretta Mester said on Tuesday, as reported by Reuters. “At this point, I think the bigger risk would be to begin reducing the funds rate too early," she added.
Key quotes
"Still expecting Fed can cut rates later this year."
"Fed policy is in good place to navigate risks to economy."
"Fed can cut rates gradually if economy meets expectations."
"Strong economy gives Fed space to take stock before cutting rates."
"Expecting more inflation moderation at slower pace."
"Not expecting smooth path back to 2%."
"Risks to economic outlook have become more balanced."
"Seeing longer run funds rate at 3% versus prior 2.5%."
"Revised up growth view, activity now seen just above 2% this year."
"Labor market in better balance, expecting higher unemployment rate."
Market reaction
These comments failed to trigger a noticeable reaction in the US Dollar. As of writing, the US Dollar Index was down 0.18% on the day at 108.77.
- Canadian Dollar keeps losing ground as US data beats expectations.
- Strong US economic outlook, tight labour market put Fed easing hopes into question.
- Higher Oil prices soften Canadian Dollar’s reversal.
The Canadian Dollar (CAD) is being sold for the second day in a row on Tuesday as the Greenback consolidates gains, buoyed by strong US macroeconomic data. The strong rebound in February’s US Factory orders and the higher-than-expected JOLTS Job Openings add to evidence of a strong US economy and put the Federal Reserve’s (Fed) near-term easing plans into question.
Tuesday’s data confirms Monday’s picture of a strong manufacturing sector combined with a tight labour market. This “no-landing” scenario provides fresh reasons for Fed hawks to keep borrowing costs higher for longer and is pushing up US Treasury yields.
Investors will be waiting for Friday’s Nonfarm Payrolls Report to confirm these fears, but the data seen so far this week has prompted traders to scale back bets of a June cut. The Canadian Dollar has lost 0.3% in the last two days with the rally in Oil prices keeping the Loonie from further depreciation.
Daily digest market movers: USD/CAD consolidates gains as US data casts doubt on Fed easing plans
- Canadian Dollar is losing ground for the second consecutive day and has given back half of the ground taken last week.
- US Factory Orders increased 1.4% in February, following a 3.8% decline in January and beating expectations of a 1% gain.
- At the same time, the US Bureau of Labor Statistics revealed that JOLTS Job Openings increased by 8.756 million in February from 8.748 million in January, above the market consensus of 8.74 million.
- On Monday, the US ISM Manufacturing PMI increased to 50.3 in March from 47.8 in February, beating market expectations of a 48.4 reading.
- Prices Paid in the manufacturing sector have surged to 55.8, their highest level since July 2022, and a positive contribution to inflationary trends.
- Oil prices have reached levels beyond $85 for the first time since October. This is cushioning the Canadian Dollar’s reversal.
- Later today the Federal Reserve’s Williams and Mester, both on the hawkish side of the spectrum, will meet the press. The highlight of the week, however, is Friday’s Nonfarm Payrolls report.
US Dollar price this week
The table below shows the percentage change of US Dollar (USD) against listed major currencies this week. US Dollar was the strongest against the .
| USD | EUR | GBP | CAD | AUD | JPY | NZD | CHF | |
| USD | 0.20% | 0.50% | 0.39% | 0.31% | 0.09% | 0.36% | 0.55% | |
| EUR | -0.21% | 0.28% | 0.19% | 0.11% | -0.13% | 0.13% | 0.34% | |
| GBP | -0.49% | -0.29% | -0.10% | -0.19% | -0.41% | -0.13% | 0.06% | |
| CAD | -0.39% | -0.18% | 0.07% | -0.07% | -0.31% | -0.04% | 0.16% | |
| AUD | -0.32% | -0.10% | 0.17% | 0.07% | -0.23% | 0.03% | 0.23% | |
| JPY | -0.09% | 0.14% | 0.41% | 0.31% | 0.26% | 0.28% | 0.46% | |
| NZD | -0.36% | -0.15% | 0.15% | 0.04% | -0.04% | -0.30% | 0.18% | |
| CHF | -0.56% | -0.34% | -0.05% | -0.16% | -0.23% | -0.46% | -0.18% |
The heat map shows percentage changes of major currencies against each other. The base currency is picked from the left column, while the quote currency is picked from the top row. For example, if you pick the Euro from the left column and move along the horizontal line to the Japanese Yen, the percentage change displayed in the box will represent EUR (base)/JPY (quote).
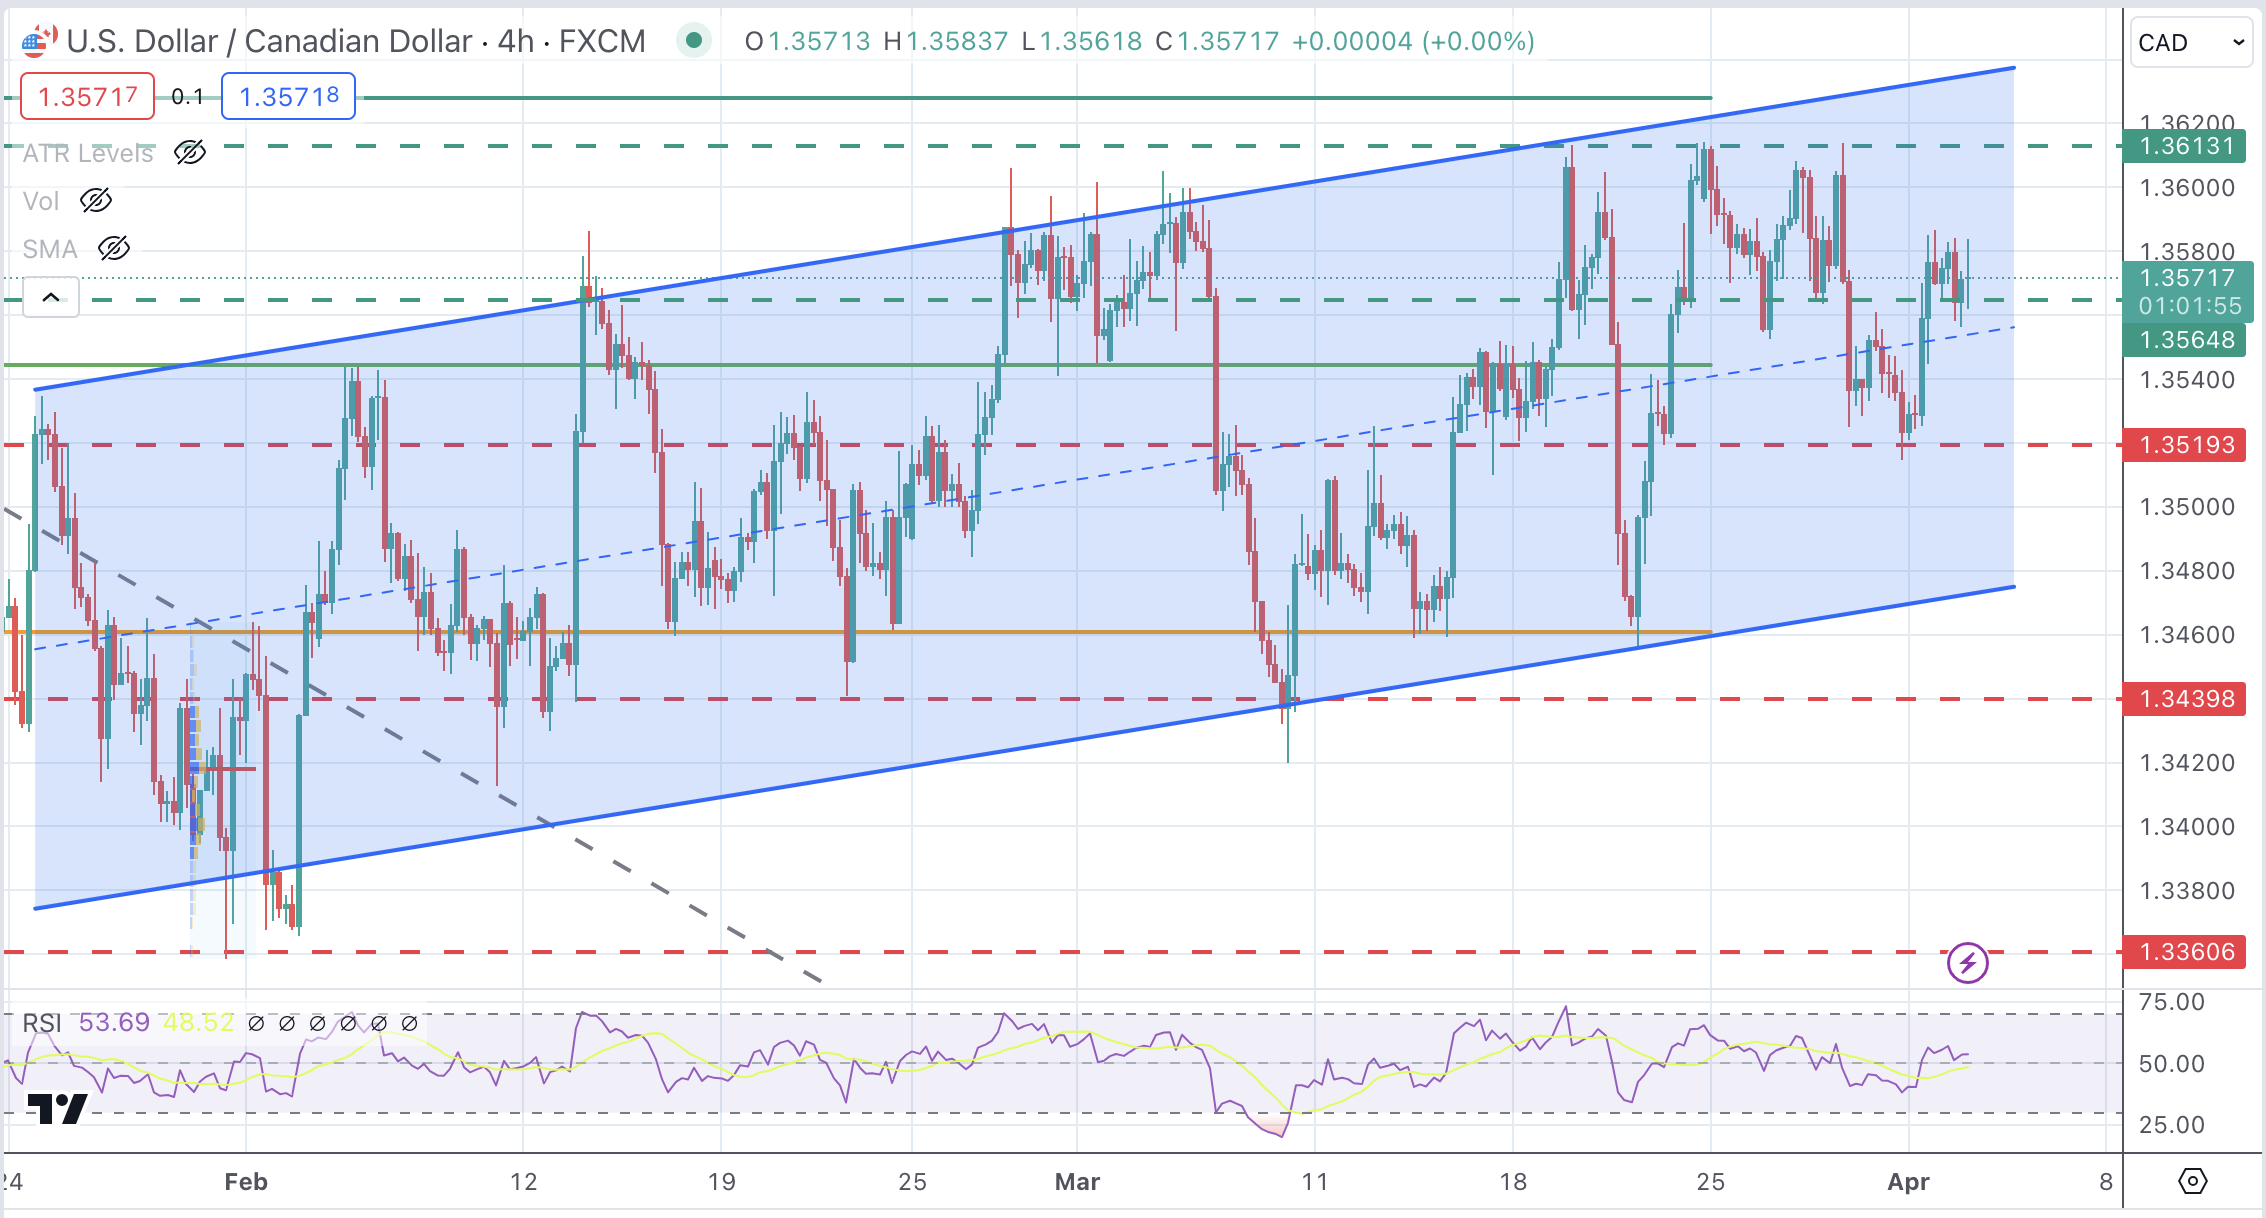
Technical analysis: The USD has scope for rally to 1.3615 resistance area
The USD/CAD bounced up on Monday and is gaining bullish traction amid the favorable fundamental landscape. With US Treasury yields healing north, USD’s bearish attempts are expected to remain limited.
The pair remains moving inside a slightly bullish channel with the previous resistance at 1.3565 providing support. The next upside target is the resistance area at 1.3615, the 61.8% Fibonacci retracement of the late 2023 decline at 1.3630, and the channel top at 1.3635. Below 1.3565, the next support is 1.3520.
USD/CAD 4-Hour Chart
Canadian Dollar FAQs
The key factors driving the Canadian Dollar (CAD) are the level of interest rates set by the Bank of Canada (BoC), the price of Oil, Canada’s largest export, the health of its economy, inflation and the Trade Balance, which is the difference between the value of Canada’s exports versus its imports. Other factors include market sentiment – whether investors are taking on more risky assets (risk-on) or seeking safe-havens (risk-off) – with risk-on being CAD-positive. As its largest trading partner, the health of the US economy is also a key factor influencing the Canadian Dollar.
The Bank of Canada (BoC) has a significant influence on the Canadian Dollar by setting the level of interest rates that banks can lend to one another. This influences the level of interest rates for everyone. The main goal of the BoC is to maintain inflation at 1-3% by adjusting interest rates up or down. Relatively higher interest rates tend to be positive for the CAD. The Bank of Canada can also use quantitative easing and tightening to influence credit conditions, with the former CAD-negative and the latter CAD-positive.
The price of Oil is a key factor impacting the value of the Canadian Dollar. Petroleum is Canada’s biggest export, so Oil price tends to have an immediate impact on the CAD value. Generally, if Oil price rises CAD also goes up, as aggregate demand for the currency increases. The opposite is the case if the price of Oil falls. Higher Oil prices also tend to result in a greater likelihood of a positive Trade Balance, which is also supportive of the CAD.
While inflation had always traditionally been thought of as a negative factor for a currency since it lowers the value of money, the opposite has actually been the case in modern times with the relaxation of cross-border capital controls. Higher inflation tends to lead central banks to put up interest rates which attracts more capital inflows from global investors seeking a lucrative place to keep their money. This increases demand for the local currency, which in Canada’s case is the Canadian Dollar.
Macroeconomic data releases gauge the health of the economy and can have an impact on the Canadian Dollar. Indicators such as GDP, Manufacturing and Services PMIs, employment, and consumer sentiment surveys can all influence the direction of the CAD. A strong economy is good for the Canadian Dollar. Not only does it attract more foreign investment but it may encourage the Bank of Canada to put up interest rates, leading to a stronger currency. If economic data is weak, however, the CAD is likely to fall.
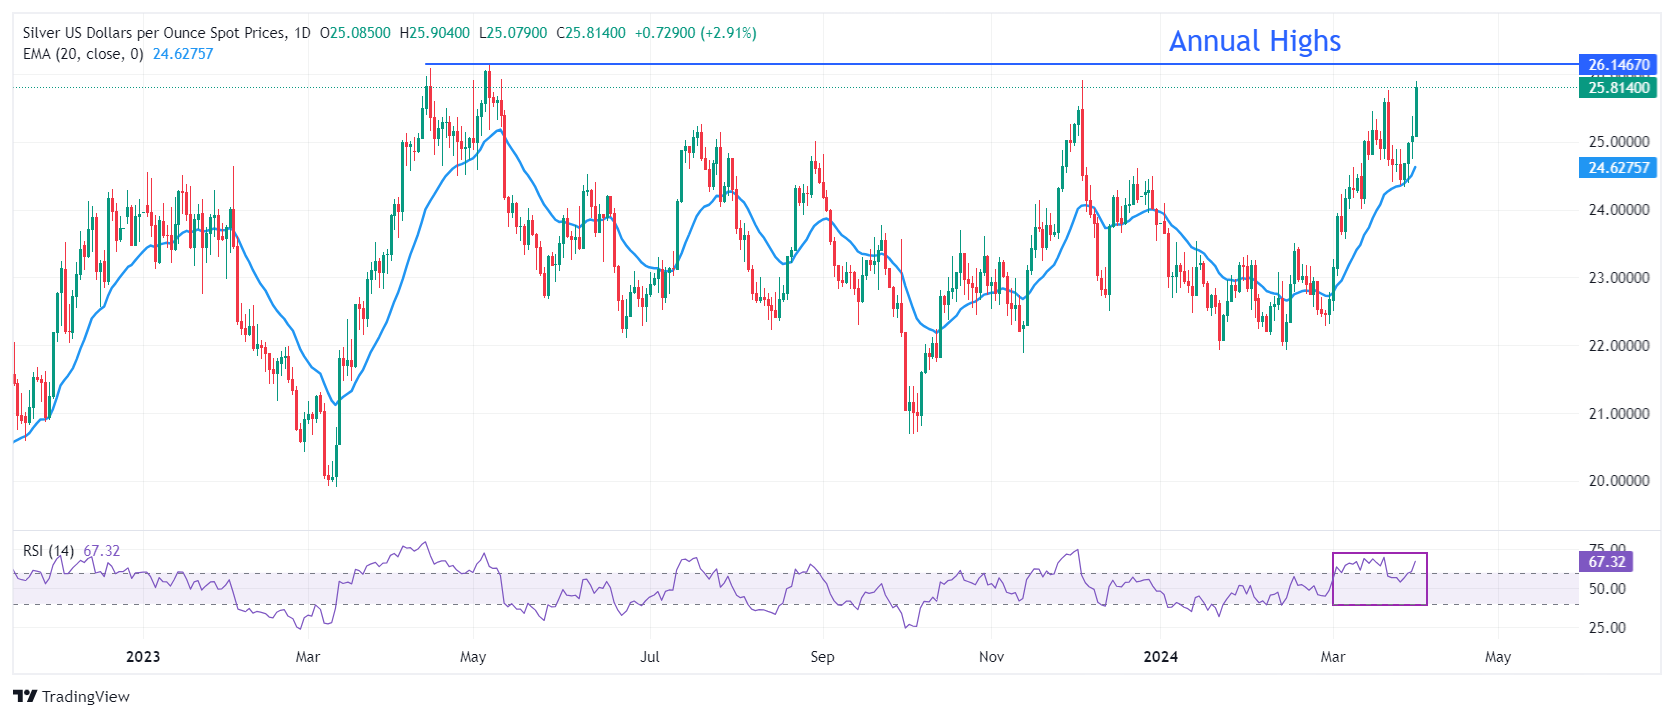
- Silver price climbs above $25.50 as US Dollar’s rally stalls.
- Investors remain risk-averse as Fed rate cut expectations ease.
- Silver price aims to recapture annual highs of $26.14.
Silver price (XAG/USD) jumps to $25.80 after the United States Bureau of Labor Statistics (BLS) reported steady United States JOLTS Job Opening figures for February. US employers posted 8.756 million, against expectations of 8.74 million, and the former release of 8.748 million. This indicates that the labor demand is steady.
The market sentiment is downbeat as the S&P 500 has opened on a negative note. Easing Federal Reserve (Fed) rate cut expectations for the June meeting has turned investors risk-averse. 10-year US Treasury yields soar to 4.40%. The US Dollar Index (DXY) dips to 104.70 after refreshing a four-month high at 105.10.
The US Dollar struggles to maintain strength despite the upbeat US Manufacturing PMI for March, which has strengthened the US economic outlook further. The Institute of Supply Management (ISM) reported that the Manufacturing PMI landed above the 50.0 threshold for the first time after contracting for 15 straight months.
This week, investors will focus on the US Nonfarm Payrolls (NFP) data for March, which will be published on Friday. The labor market data will provide fresh cues about when the Federal Reserve (Fed) will start reducing interest rates.
Silver technical analysis
Silver price is inch away from testing annual highs at $26.14, formed on May 5. The near-term demand for the white metal is bullish as the 20-day Exponential Moving Average (EMA) at $24.63 is sloping higher.
The 14-period Relative Strength Index (RSI) oscillates in the 60.00-80.00 range, indicating that the bullish momentum is intact.
Silver daily chart
- A long-term technical analysis of the Dollar Index suggests a sideways trend.
- This is likely to continue until a decisive break above or below the range.
- The index is currently meeting resistance from the 100-week Simple Moving Average.
The US Dollar Index (DXY), which measures the strength of the US Dollar (USD) against a basket of trade-weighted competitors, is in a long-term sideways trend which has lasted for between six months and a year.
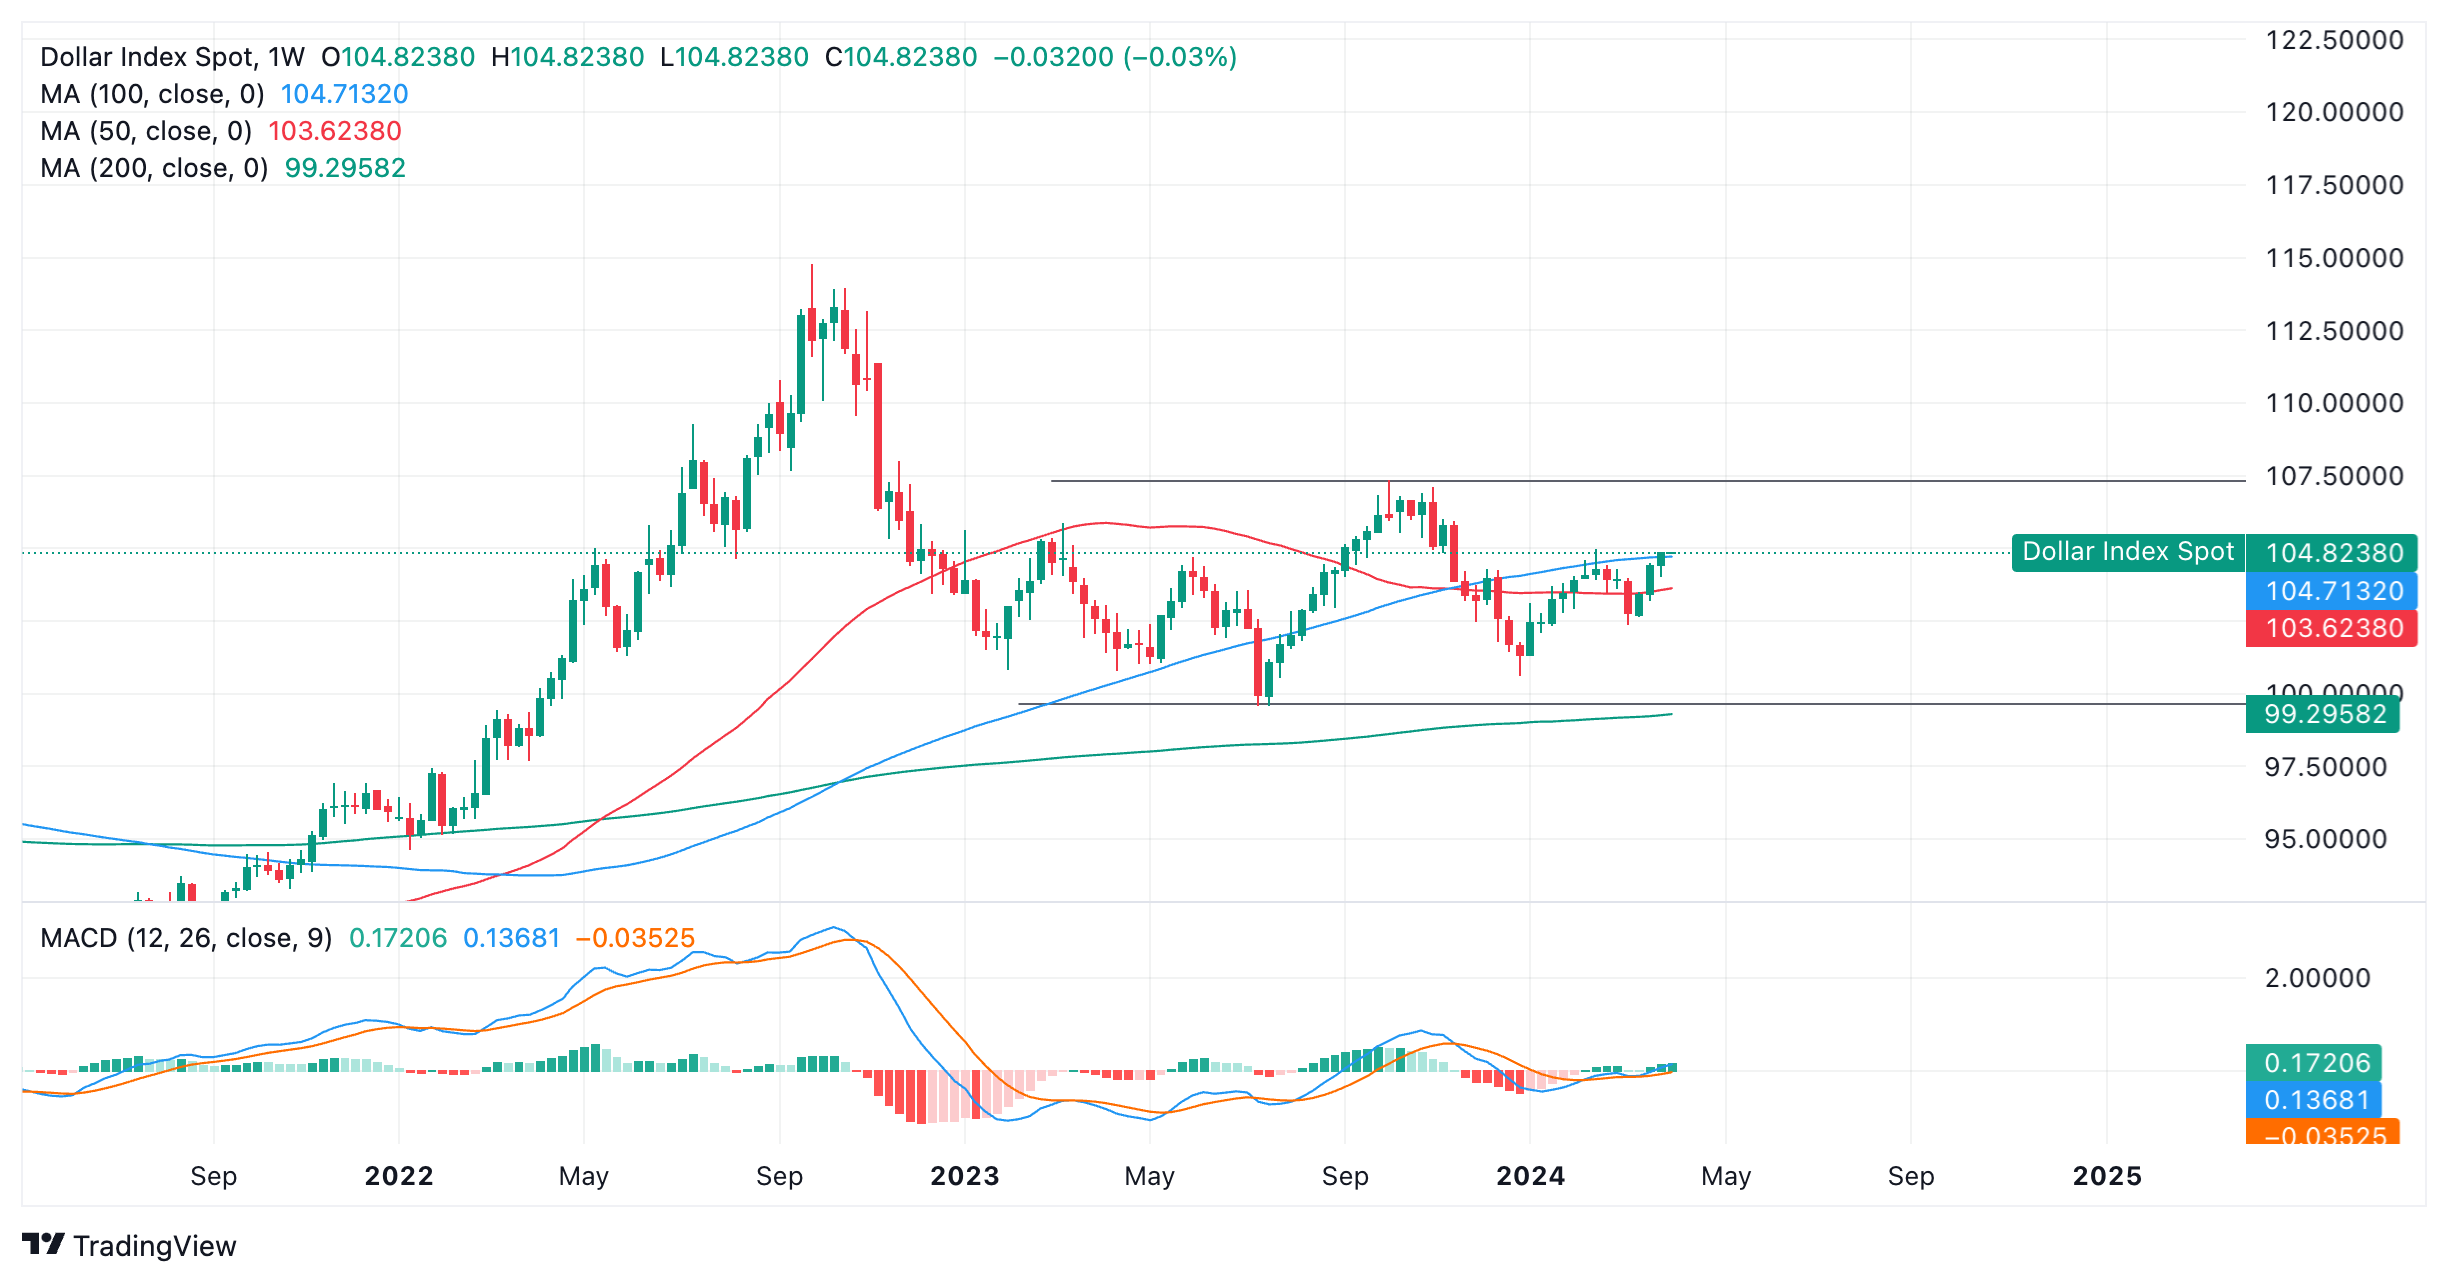
US Dollar Index: Weekly chart
Within its range-locked consolidation, it is currently meeting resistance after rising up to the 100-week Simple Moving Average (SMA) at 104.71.
There is a possibility it could retreat from this substantial barrier. The 50-week SMA sits not far below at around 103.62 and could provide support.
Prior to the formation of the range the Dollar index’s outlook was more bearish. The index reversed sharply at the September 2022 highs and tumbled. The sharpness and depth of the decline suggested the possibility of a major reversal in the trend, however, DXY found support first at 100.00 and then in the 99.00s before reversing and making a recovery.
Since the index found a floor in 2023 it has been oscillating between the aforementioned lows and a top at roughly 107.00.
It would require a decisive break below 99.56 – the July 2023 lows – to indicate bears were back in the driving seat. Such a move would change the trend to bearish and suggest even lower lows were on the horizon.
Alternatively, a decisive break back above 107.00 would tone the chart more bullishly, and suggest a climb back up to the 114.78 high of 2022.
"Decisive" would mean a weekly candle that broke and closed well away from the range high or low, or three consecutive bearish/bullish weeks that ended well away from the range high or low.
Until either materializes, price is seen continuing its sideways trending pattern.
Gold remains firm after making a marginal new high for the move up earlier. Economists at Scotiabank analyze the yellow metal’s outlook.
Gold strength and a firm USD look a little odd; something may have to give
Prospects remain positive as investors bet on lower global interest rates, perhaps look for diversification opportunities away from elevated stocks or, in the case of central banks, continue to reduce exposure to the USD (net central bank gold purchases have grown strongly in the past two years, reports indicate).
Broadly, history suggests higher Gold prices are usually associated with a softer tone in the USD so Gold strength and a firm USD look a little odd; something may have to give.
- AUD/USD faces pressure due to the weak Australian Dollar.
- The RBA didn’t mention the need for more rate hikes in the March’s policy minutes.
- Market sentiment remains downbeat as Fed rate cut expectations for June ease.
The AUD/USD pair struggles to get an auction above the psychological resistance of 0.6500. The Aussie asset is facing pressure despite the US Dollar edging down in Tuesday’s European session after refreshing a four-month high.
The market sentiment shows investors are risk-averse as traders have pared bets favoring Federal Reserve (Fed) rate cuts in the June policy meeting. Considering negative overnight futures, the S&P 500 is expected to open on a bearish note. 10-year US Treasury yields rose sharply to 4.39%. The US Dollar Index (DXY) slips from a fresh four-month high slightly above 105.00 to 104.80.
The near-term appeal of the US Dollar is upbeat due to the firm US economic outlook. The US economy grew at a robust pace of 2.5% in 2023 even though interest rates by the Federal Reserve (Fed) remained historically high. In addition, stronger-than-expected Manufacturing PMI for March has strengthened the outlook further.
On Monday, the US Institute of Supply Management (ISM) reported that the Manufacturing PMI returned to expansion after contracting for 16 straight months.
In today’s session, investors will focus on the US JOLTS Job Openings data for February, which will be published at 14:00 GMT. The economic data will provide fresh cues about the labor demand. US employers are anticipated to have posted 8.74 million job openings, lower than 8.863 million in January.
Meanwhile, the Australian Dollar faces selling pressure as the Reserve Bank of Australia (RBA) policy minutes, released in Tuesday’s Asian session, showed that policymakers do not see the need of more interest rate hikes. In the monetary policy meeting, the RBA kept its Official Cash Rate (OCR) unchanged at 4.35%.
The shares of companies offering artificial intelligence rise spectacularly. Some investors feel reminded of the bubble in internet shares 25 years ago. Economists at Commerzbank show that this time the bull market is on a more solid footing.
Valuation less ambitious than 25 years ago
The current strong share price gains in stocks benefiting from artificial intelligence (AI) are based on a more solid foundation than the internet boom at the turn of the millennium. This is because the most important players are already profitable and much stronger financially than the companies 25 years ago. In addition, the necessary infrastructure is already in place on a large scale.
However, the short-term economic implications of the AI megatrend could be overestimated, while the long-term effects are underestimated, meaning that there are likely to be setbacks.
- EUR/GBP trades marginally down as the Pound Sterling outperforms the Euro.
- The final estimate of the UK Manufacturing PMI is revised above 50 signifying growth in the sector.
- The interest outlook for the Eurozone and Britain are broadly similar leading to a range bound dynamic.
EUR/GBP edges lower into the 0.8550s on Tuesday, on the back of strong UK Manufacturing data. The pair, however, remains plum in the middle of its long-term range stretching the length of 0.8500.
The S&P Global/CIPS Manufacturing PMI final reading for March showed a revision to above the 50 level distinguishing growth from contraction, and beating the preliminary estimate of 49.9, according to data from S&P Global. It is the first time since 2022 that the gauge has risen above 50.
In comparison Eurozone Manufacturing failed to move above the 50 level even though it also came out above preliminary estimates. HCOB Eurozone Manufacturing PMI rose to 46.1 in March, beating the flash estimate of 45.7.
UK House Prices lower-than-expected despite rise in mortgages
On Tuesday, data from the UK’s largest building society Nationwide showed UK house prices rose by 1.6% YoY in March, falling short of estimates of 2.4% but higher than February’s 1.2%.
On a monthly basis prices fell 0.2% after rising 0.7% in February, and below estimates of 0.3%.
Despite the fall in house prices, UK Mortgage Approvals rose by 60.332K, which was above the expected 56.500K and the previous figure, according to data from the Bank of England (BoE).
Borrowing was mixed according to the BoE data, with Net Lending for Mortgages higher but UK Consumer Credit lower. Consumer credit fell to 1.378 billion GBP borrowed in February – below forecasts of 1.600 billion, and below the previous 1.770 billion figure.
The Euro seemed unfazed, meanwhile, by the release of lower-than-expected German inflation data, which showed the Harmonized Index of Consumer Prices slowing to 2.3% YoY in March when 2.4% had been forecast, from 2.7% previously.
Similar interest-rate outlook
A broadly similar outlook for interest rate policy in the two jurisdictions – a major driver for FX markets – does little to change EUR/GBP’s habit over the last two months of seesawing between tepid gains and losses.
According to comments from BoE Governor Andrew Bailey, market forecasts for three 0.25% reductions in 2024 are reasonable, given the BoE isn't observing significant inflationary pressures. Lower interest rates are negative for the Pound Sterling as they reduce foreign capital inflows.
His statements fuel expectations for the BoE to implement interest rate cuts in June, consequently exerting downward pressure on the Pound Sterling (GBP).
The European Central Bank (ECB) is similarly expected to cut interest rates in June. Over the Easter weekend ECB policymaker Robert Holzmann indicated that interest rate cuts in June are probable, but contingent upon the evolution of wage and price data.
Additionally, ECB Governing Council member Yannis Stournaras said on Sunday that there could be a total of four (0.25%) interest rate cuts in 2024, amounting to a cumulative reduction of 100 basis points (bps) by the end of the year.
Economists at ABN Amro analyze EUR/USD outlook.
Expectations for Fed/ECB policy to continue to drive the direction in EUR/USD
For this year, we expect expectations for Fed/ECB policy to continue to drive the direction in EUR/USD.
For both the Fed and the ECB we expect modestly more rate cuts this year than the market now anticipates. So we are somewhat more dovish than the market for both central banks and the difference with the market is roughly the same in each case. This would imply that EUR/USD stays close to current levels if no other driver presents itself.
Our forecast for the end of 2024 stands at 1.1000.
EUR/USD finds support in low 1.0700s. Economists at Scotiabank analyze the pair’s outlook.
Intraday price action is mildly bullish
Short-term price signals suggest some moderation or stabilization in the soft EUR trend in the short run.
Intraday price action is mildly bullish, with a stalling signal developing around the test of 1.0725.
Gains through 1.0760/1.0770 may drive a little more strength in the near term. Key support is 1.0695.
See – EUR/USD: The 1.0695/1.0700 lows seen in mid-February are an obvious short-term target – ING
- Annual CPI inflation in Germany softened to 2.2% in March as expected.
- EUR/USD continues to fluctuate in a tight channel near 1.0750.
Inflation in Germany, as measured by the change in the Consumer Price Index (CPI), declined to 2.2% on a yearly basis in March from 2.5% in February, Germany's Destatis reported on Tuesday. This reading came in line with the market expectation. On a monthly basis, the CPI rose 0.4%, matching February's increase.
The Harmonized Index of Consumer Price (HICP), the European Central Bank's (ECB) preferred gauge of inflation, was up 0.6% and 2.3% on a monthly and yearly basis, respectively, in March.
Market reaction
EUR/USD showed no immediate reaction to these data and was last seen trading virtually unchanged on the day at 1.0748.
- USD/JPY’s next move depends on the actions of the Fed, according to a BofA strategist.
- If the Fed cuts the USD/JPY could fall to 142; if not it could rally higher.
- Intervention is like “leaning against the wind” if the Fed decides not to cut, the market will press higher.
USD/JPY has been seesawing in a narrow range in the 151.000s over the last two weeks as threat of intervention from the Japanese authorities keeps bulls timid whilst stronger-than-expected US data keeps bears in check.
The direction of USD/JPY’s next move has been the subject of much speculation but the factor that will be the most significant is the actions of the US Federal Reserve (Fed), according to Thanos Vamvakidis, Global Head of G-10 FX Strategy, Bank of America Merril Lynch (BofA).
“To a large extent USD/JPY relies on the Fed. If the Fed does not cut rates it could go to 160.000, it does cut rates 142.000,” said Vamvakidis in an interview with Bloomberg News.
If the Fed cuts rates in line with current expectations it will weigh on USD/JPY since it will reduce the advantage of keeping cash in US Dollars (USD) compared to Japanese Yen (JPY) from the point of view of the amount of interest that can be earned.
Stronger-than-expected US data in recent weeks, however, has led some Fed policy makers to row back on promises to cut interest rates in the summer. Over the Easter weekend, Chairman Powell sounded more hawkish – meaning more in favor of keeping interest rates higher for longer – and the markets reacted by buying US Dollars.
The probability of a first rate cut by the Fed in June has now fallen to just above 50% according to the CME FedWatch tool, from over 70% only a few weeks ago. At the start of the year the market was even pricing in a decent likelihood of a first rate cut in March. If the trend for “kicking the can” of interest rate cuts down the road continues, the timing of a first cut could get pushed back even further – to the autumn, winter or even next year.
BoJ out of the Picture
The Bank of Japan (BoJ) on the other hand is unlikely to play a key role and Vamvakidis suggests it is unlikely the BoJ will rush to raise interest rates to combat rising inflation. Japan has the opposite economic problem to most of the rest of the world.
“Japan is a completely different case – inflation there is a solution, not a problem. They are happy to see persistent inflation. It is above the target but not by much. And they have a long history of 30 years deflation.
“They will remain very cautious, leaning in the other direction compared to the other central banks,” said Vamavakidis.
The Intervention Level
In March, Masato Kanda, Vice-Minister of Finance for International Affairs said the Yen had weakened beyond what market fundamentals warranted. He added that the Japanese Authorities would be ready to intervene if the Yen depreciated any further. From past experience of intervention, any level above 150.000 is considered a target for intervention.
“I think 152 is a critical level at this point where we will expect intervention in a scenario where they do expect the Fed to start cutting this year. But if the market prices no cuts by the Fed this year they will realize the level is higher..” Said the Global Head of G-10 FX.”
Even if the authorities intervene, however, they won’t have the power to plug the levee forever, and it will eventually break, pushing USD/JPY higher.
“It will be more like leaning against the wind. They know very well, also from the past, that these interventions don’t work, it is mainly a threat, so they can create some caution in the market, some two-way risk.
“They know very well everything depends on the Fed. If they just buy some time with intervention until the Fed starts to cut rates it will be fine, but if the Fed does not cut this year then there is nothing these interventions can do.” Said Vamvakidis.
GBP/USD edges off support in low 1.2500s. Economists at Scotiabank analyze the pair’s outlook.
Intraday price action looks mildly positive for the GBP
Spot weakness through the upper 1.2500 area on Monday – where Cable had found support over the past week – extended a little but the low 1.2500 area (the base of the range for the GBP since late last year) continues to draw interest from bargain hunting buyers.
Intraday price action looks mildly positive for the GBP (a bullish outside range signal developed through Asian/European trade).
Resistance is 1.2585/1.2590; if Sterling can regain a 1.2600 handle, additional strength should follow.
- GBP/JPY revives from 190.00 as UK Manufacturing PMI returns to expansion.
- UK’s soft shop price inflation boosts BoE rate cut expectations.
- The expectations for Japan’s intervention to support the Japanese Yen have deepened.
The GBP/JPY pair discovers buying interest near the crucial support of 190.00. The cross finds support as the S&P Global/CIPS has reported that the United Kingdom Manufacturing PMI has returned to expansion after contracting for more than a year.
The UK Manufacturing PMI landed above the 50.0 threshold, which separates the expansion from contraction, at 50.3. The factory data was higher than expectations and the prior reading of 49.9.
Rob Dobson, Director at S&P Global Market Intelligence, said: “The end of the first quarter saw UK manufacturing recover from its recent doldrums. Production and new orders returned to growth, albeit only hesitantly, following yearlong downturns, with the main thrust of the expansion coming from stronger domestic demand.
The robust recovery in the UK Manufacturing PMI indicates a revival in household spending, fueled by growing expectations that the Bank of England (BoE) will start reducing interest rates sooner due to easing inflation.
In Tuesday’s Asian session, the British Retail Consortium (BRC) showed that shop price inflation grew by 1.3% in March, at the slowest pace in more than two years, due to softening prices of food and non-food items. This has increased expectations for the BoE to unwind its historically tight interest rate stance.
On the Japanese Yen front, uncertainty over the Bank of Japan’s (BoJ) interest rate outlook could push the Japanese Yen on the back foot. The BoJ is expected to adopt a cautious approach to further policy tightening due to the absence of concrete evidence for the wage growth spiral.
Meanwhile, speculation about Japan’s stealth intervention in the FX domain keeps the downside in the Japanese Yen limited. Japan's Finance Minister Shunichi Suzuki reiterated his warning about the recent rapid JPY moves on Monday, saying he would respond appropriately and would not rule out options against excessive volatility.
Spain’s long-term interest rates have been approaching those of Germany since 2022. Analysts at Natixis say that the positive view that investors have of Spain compared to France, Germany or Italy is reasonable.
Investors are right to prefer Spain to other major European countries
Spain has higher growth than the other three major Eurozone countries.
Spain has a lower exposure than Germany to global trade in goods, which is positive because this trade is declining.
Spain’s cost competitiveness is favourable, which enables Spain’s industrial production to hold up and attract foreign investment.
The trade balance for industrial products is almost balanced and the current account balance is in surplus.
Spain has made great strides in the development of renewable energies, with 50.4% of its electricity production from renewable sources and 70.7% from renewable or nuclear sources in 2023.
- Gold price clings to gains even though the upbeat US Manufacturing PMI has improved the appeal for the US Dollar.
- 10-year US yields rise further as traders pare Fed rate cut expectations for June.
- The US NFP report will guide the next big move for Gold.
Gold price (XAU/USD) trades close to fresh all-time highs near $2,260 in Tuesday’s European session. An improved safe-haven bid has empowered Gold to offset the impact of significant jump in the US Dollar, which was driven by the robust recovery in the United States Manufacturing PMI in March.
Gold seems not ready to surrender gains on expectations that February’s core Personal Consumption Expenditure Price Index (PCE) figure, the lowest in two years, will keep the Fed on track to cut interest rates three times this year.
Going forward, the Gold price could face pressure to maintain higher levels as US bond yields have extended their upside, with 10-year US Treasury yields up to 4.34%. The rise in yields came as investors scaled back their expectations that the Federal Reserve (Fed) will pivot to rate cuts in June. Higher yields on interest-bearing assets increase the opportunity cost of holding investments in non-yielding assets, such as Gold.
This week, investors will focus on the US Nonfarm Payrolls (NFP) for March, which will be published on Friday. The labor market data could give clues about when the Fed could start reducing interest rates. In Tuesday’s session, investors will focus on the US JOLTS Job Openings for February, which will be published at 14:00 GMT. US employers are anticipated to have posted fresh 8.74 million job openings, lower than 8.863 million in January.
Daily digest market movers: Gold price clings to gains near $2,260
- Gold price hovers near fresh all-time highs around $2,260 despite multiple headwinds. Improved outlook of the US Dollar due to strong United States Manufacturing PMI and a decline in bets supporting a rate cut by the Federal Reserve in June failed to push the Gold price down.
- The divergence between the economic prospects of the US and other developed economies has strengthened the US Dollar outlook. While major developed economies struggled to deliver meager growth in 2023, the US economy grew at a robust pace of 2.5%. Adding to this, the US Manufacturing PMI has returned to expansion, strengthening the economic outlook further.
- On Monday, the US Institute for Supply Management (ISM) reported that its Manufacturing PMI came in above the 50.0 threshold at 50.3, better than expectations of 48.4 and the prior reading of 47.8. The Manufacturing PMI returned to expansion after contracting for 16 straight months.
- The US strong economic outlook has dented market expectations for the Fed to begin reducing interest rates from June. According to the CME FedWatch tool, traders are pricing in a 63% chance that the Fed will trim interest rates in June, down from 70% a week ago.
- Still, investors seem to be confident about three rate cuts this year as projected by the Fed in its latest dot plot. Fed Chair Jerome Powell said on Friday after the release of the US core PCE Price Index data for February that the latest US inflation data was "along the lines of what we would like to see." However, Powell also acknowledged that there is no need for the Fed to rush for rate cuts.
Technical Analysis: Gold trades close to all-time highs around $2,260
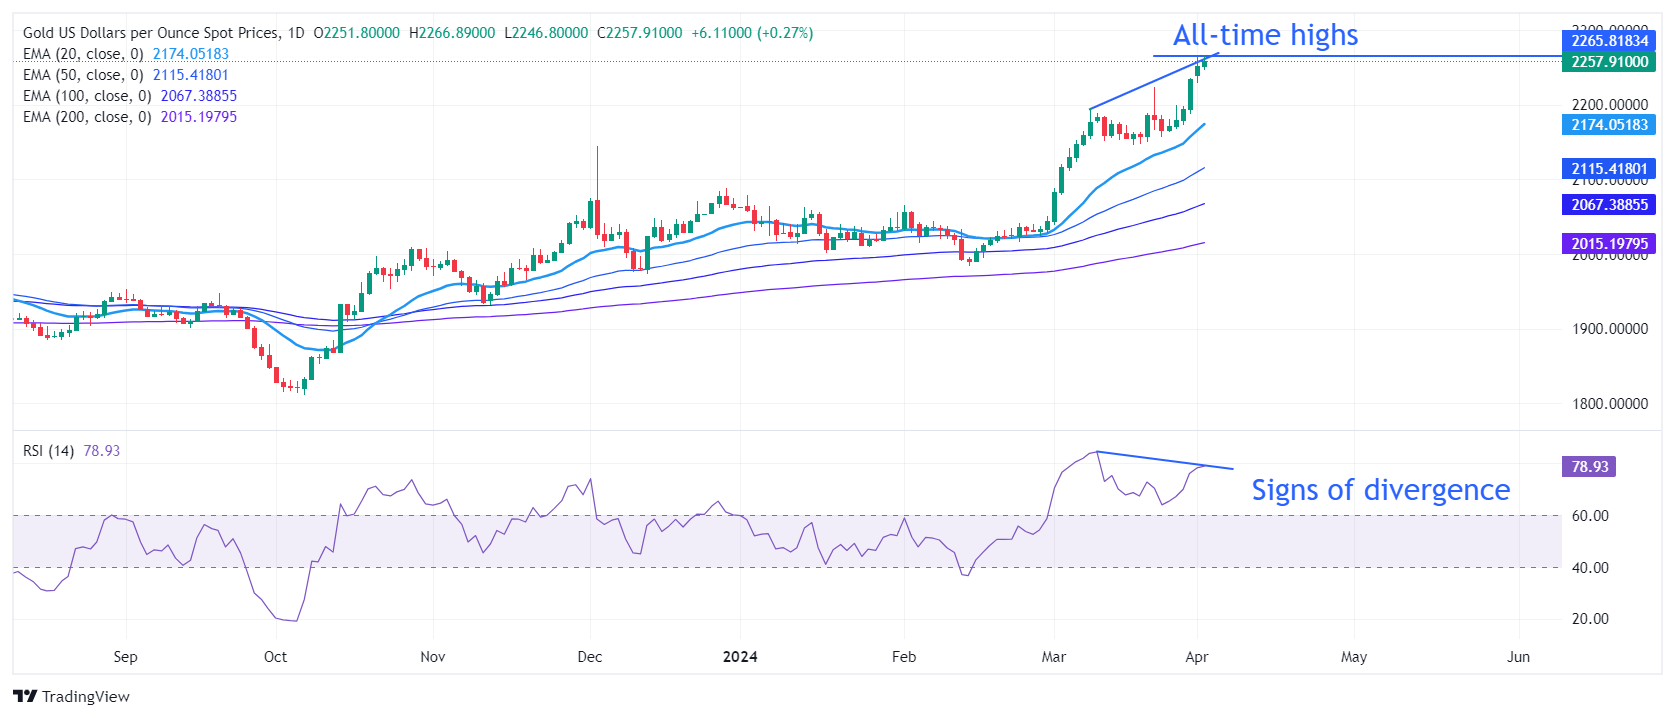
Gold price trades higher, near all-time highs around $2,260. The precious metal strengthened after breaking above the prior lifetime high of $2,223 on March 21. More upside in the Gold price is possible as it is trading in an unchartered territory. All short-to-long term Exponential Moving Averages (EMAs) are sloping higher, suggesting strong near-term demand.
The 14-period Relative Strength Index (RSI) hovers near 78.00, indicating a strong upside momentum. However, signs of divergence between prices and the RSI and overbought levels could result in a correction.
Gold FAQs
Gold has played a key role in human’s history as it has been widely used as a store of value and medium of exchange. Currently, apart from its shine and usage for jewelry, the precious metal is widely seen as a safe-haven asset, meaning that it is considered a good investment during turbulent times. Gold is also widely seen as a hedge against inflation and against depreciating currencies as it doesn’t rely on any specific issuer or government.
Central banks are the biggest Gold holders. In their aim to support their currencies in turbulent times, central banks tend to diversify their reserves and buy Gold to improve the perceived strength of the economy and the currency. High Gold reserves can be a source of trust for a country’s solvency. Central banks added 1,136 tonnes of Gold worth around $70 billion to their reserves in 2022, according to data from the World Gold Council. This is the highest yearly purchase since records began. Central banks from emerging economies such as China, India and Turkey are quickly increasing their Gold reserves.
Gold has an inverse correlation with the US Dollar and US Treasuries, which are both major reserve and safe-haven assets. When the Dollar depreciates, Gold tends to rise, enabling investors and central banks to diversify their assets in turbulent times. Gold is also inversely correlated with risk assets. A rally in the stock market tends to weaken Gold price, while sell-offs in riskier markets tend to favor the precious metal.
The price can move due to a wide range of factors. Geopolitical instability or fears of a deep recession can quickly make Gold price escalate due to its safe-haven status. As a yield-less asset, Gold tends to rise with lower interest rates, while higher cost of money usually weighs down on the yellow metal. Still, most moves depend on how the US Dollar (USD) behaves as the asset is priced in dollars (XAU/USD). A strong Dollar tends to keep the price of Gold controlled, whereas a weaker Dollar is likely to push Gold prices up.
The US Dollar Index (DXY) has moved back above the 105.00 level for the first time since the middle of November. Economists at MUFG Bank analyze USD outlook.
The Fed could lag behind European central banks when starting to cut rates
Market attention in the week ahead will focus on the health of the US labour market with the release later today of the latest JOLTS job openings report for February and the NFP report for March on Friday.
Unless there is a significant slowdown in US employment growth, the US Dollar is likely to continue to trade on a stronger footing this week to reflect the building risk that the Fed could lag behind European central banks when starting to cut rates.
- NZD/USD is declining in the final C leg of a bearish pattern.
- The Measured Move is likely to fall to a target in the 0.5800s.
- The RSI is oversold on the daily chart suggesting a risk of a pullback.
NZD/USD is falling in a bearish three-wave pattern, known as a Measured Move. This type of pattern consists of three waves, usually labeled ABC, in which wave A and C are commonly of the same length – or related by a Fibonacci ratio.
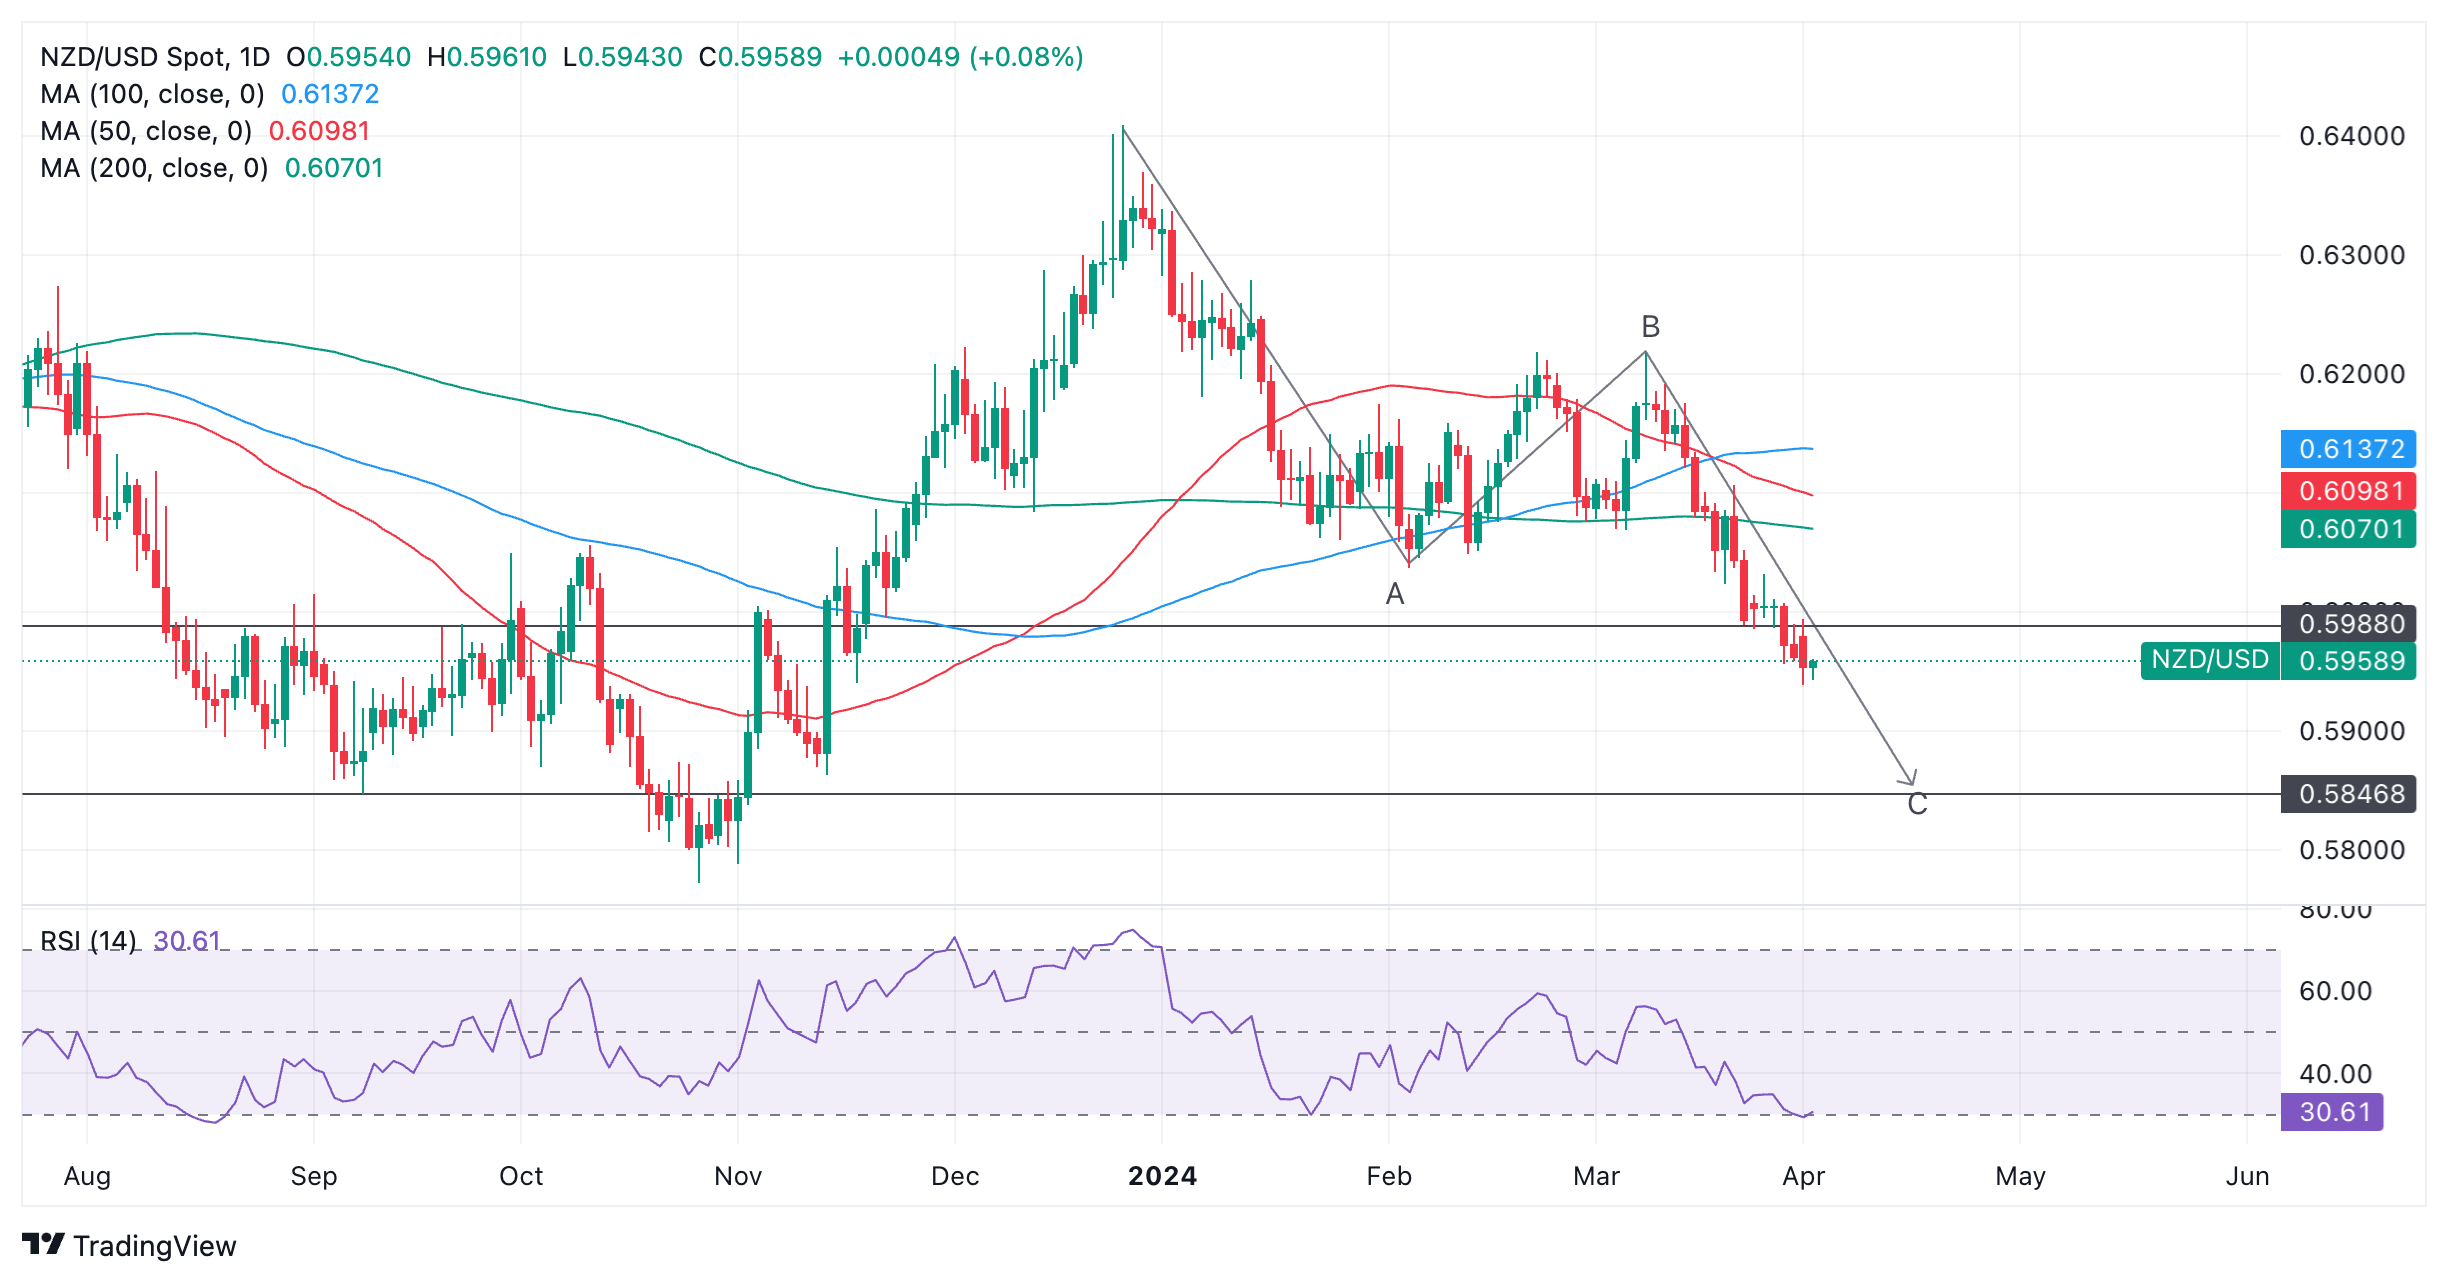
New Zealand Dollar versus US Dollar: Daily chart
Assuming the pattern unfolds as expected, NZD/USD is likely to fall to a target at roughly 0.5847, corresponding to the end of wave C.
NZD/USD has already broken below the conservative target for the pattern at 0.5988, measured as wave C being equal to a 0.618 Fibonacci ratio of wave A.
The pair is in a short-term downtrend which, according to the adage that “the trend is your friend,” is likely to continue.
The Relative Strength Index (RSI) momentum indicator, fixed at 29.32 on Monday’s close, is oversold which means there is now a risk of a pullback occurring.
If the RSI exits oversold it will signal the price will probably rise and traders should close their short bets and open longs.
If the RSI remains below 30 in the oversold zone it will signal traders should keep their short bets open but not add to them.
Gold (XAU/USD) has risen above $2,200. Economists at ANZ Bank analyze the yellow metal’s outlook.
The timing and pace of the easing cycle will be crucial
Increasing geopolitical risks come to the fore to favour haven demand.
The market is ignoring expectations around the Fed’s easing of monetary policy and remains more focused on rate cuts occurring in the second half of 2024. We expect cuts to begin in July.
We remain positive on the price, but a pull-back looks likely without fresh supporting fundamentals in Q2. Our year-end price target is still $2,300.
- The Swiss Franc trades mixed – weakening to the US Dollar but up against the Euro and the Pound Sterling.
- Swiss data showed an unexpected decline in retail sales but an unforeseen recovery in manufacturing PMIs.
- The data suggests the SNB will not be diverted from its easing path.
The Swiss Franc (CHF) is trading mixed in its key pairs on Tuesday, mostly due to the fluctuations of its counterparts, to which it is playing the role of passive partner. Against the US Dollar (USD) the Swiss Franc is lower by about three tenths of a percent in the 0.9080s (USD/CHF) whilst against the Euro and the Pound Sterling it is trading higher by a similar margin.
Swiss data out on Tuesday was mixed, with Real Retail Sales missing estimates by showing a 0.2% decline in February versus the 0.4% increase expected, according to the Federal Statistical Office.
Swiss SVME Manufacturing Purchasing Managers’ Index in March, on the other hand, beat expectations by coming out at 45.2 versus 44.9 forecast.
Swiss Franc mixed after Easter break
The Swiss Franc weakened in its most heavily traded pairs during March after the Swiss National Bank (SNB) took the unexpected step of cutting interest rates from 1.75% to 1.50% at its last policy meeting. This makes it the first major central bank to begin cutting interest rates. Lower interest rates are generally negative for a currency as they reduce capital inflows.
The SNB’s move came on the back of Swiss data showing a faster-than-anticipated slowdown in both inflation and economic growth during the last quarter of 2023 and beginning of 2024.
The continued mixed economic data – with Retail Sales in February falling compared to both the previous month and year, and Manufacturing PMI still below 50 and therefore in contraction – suggests there is unlikely to be a change in the thrust of the SNB’s policy towards favoring lower interest rates.
This should keep the pressure up on the Franc, especially against USD, given lower bets that the Federal Reserve (Fed) will cut interest rates early given continued robust economic data.
Technical Analysis: USD/CHF continues trending higher
USD/CHF – the number of Swiss Francs that can be bought with one US Dollar (USD) – extends its uptrend.
US Dollar versus Swiss Franc: 4-hour chart
The pair is threatening to print overbought, according to the Relative Strength Index (RSI), assuming a bullish close on the current four-hour bar. If so it will recommend that bulls do not add to their positions as the pair is at risk of pulling back.
Beyond that, the pair is overall seen continuing the intermediate-term uptrend. The next target lies at 0.9113, but it is soft – tougher resistance does not appear until the cluster of daily moving averages (not shown) at the 0.9187 level, followed by the key highs at 0.9246.
It would take a deeper slide below 0.8960 to bring into question the dominance of the uptrend and suggest the possibility of a reversal.
A break back inside the old range, confirmed by a move below 0.8890, would be required to mark a short-term trend reversal and the start of a deeper slide.
Swiss Franc FAQs
The Swiss Franc (CHF) is Switzerland’s official currency. It is among the top ten most traded currencies globally, reaching volumes that well exceed the size of the Swiss economy. Its value is determined by the broad market sentiment, the country’s economic health or action taken by the Swiss National Bank (SNB), among other factors. Between 2011 and 2015, the Swiss Franc was pegged to the Euro (EUR). The peg was abruptly removed, resulting in a more than 20% increase in the Franc’s value, causing a turmoil in markets. Even though the peg isn’t in force anymore, CHF fortunes tend to be highly correlated with the Euro ones due to the high dependency of the Swiss economy on the neighboring Eurozone.
The Swiss Franc (CHF) is considered a safe-haven asset, or a currency that investors tend to buy in times of market stress. This is due to the perceived status of Switzerland in the world: a stable economy, a strong export sector, big central bank reserves or a longstanding political stance towards neutrality in global conflicts make the country’s currency a good choice for investors fleeing from risks. Turbulent times are likely to strengthen CHF value against other currencies that are seen as more risky to invest in.
The Swiss National Bank (SNB) meets four times a year – once every quarter, less than other major central banks – to decide on monetary policy. The bank aims for an annual inflation rate of less than 2%. When inflation is above target or forecasted to be above target in the foreseeable future, the bank will attempt to tame price growth by raising its policy rate. Higher interest rates are generally positive for the Swiss Franc (CHF) as they lead to higher yields, making the country a more attractive place for investors. On the contrary, lower interest rates tend to weaken CHF.
Macroeconomic data releases in Switzerland are key to assessing the state of the economy and can impact the Swiss Franc’s (CHF) valuation. The Swiss economy is broadly stable, but any sudden change in economic growth, inflation, current account or the central bank’s currency reserves have the potential to trigger moves in CHF. Generally, high economic growth, low unemployment and high confidence are good for CHF. Conversely, if economic data points to weakening momentum, CHF is likely to depreciate.
As a small and open economy, Switzerland is heavily dependent on the health of the neighboring Eurozone economies. The broader European Union is Switzerland’s main economic partner and a key political ally, so macroeconomic and monetary policy stability in the Eurozone is essential for Switzerland and, thus, for the Swiss Franc (CHF). With such dependency, some models suggest that the correlation between the fortunes of the Euro (EUR) and the CHF is more than 90%, or close to perfect.
- Silver scales higher for the fourth straight day and spikes to a one-and-half-week high.
- The technical setup favours bullish traders and supports prospects for additional gains.
- Any meaningful corrective decline is likely to find decent support near the $25.00 mark.
Silver (XAG/USD) gains positive traction for the fourth straight day on Tuesday and climbs further beyond mid-$25.00s during the first half of the European session, back closer to the YTD peak touched last week.
From a technical perspective, the recent bounce from the $24.35 resistance-turned-support zone and a subsequent strong move up favours bullish traders. Moreover, oscillators on the daily chart are holding in the positive territory and are still far from being in the overbought zone, suggesting that the path of least resistance for the XAG/USD is to the upside.
Hence, some follow-through strength towards testing the December 2023 swing high, just ahead of the $26.00 round figure, looks like a distinct possibility. Some follow-through buying would mark a fresh breakout and allow the XAG/USD to resume its recent strong upward trajectory witnessed since late February.
On the flip side, any meaningful corrective decline is more likely to attract fresh buyers near the $25.00 psychological mark. The next relevant support is pegged near the $24.65 region. A convincing break below the latter could drag the XAG/USD towards the aforementioned resistance-turned-support, around the $24.35 zone, which should act as a key pivotal point.
Some follow-through selling might shift the bias in favour of bearish traders and make the XAG/USD vulnerable to accelerate the decline further towards the $24.15-$24.10 region. The white metal could eventually weaken below the $24.00 round-figure mark, towards the 50-day Simple Moving Average (SMA), currently pegged near the $23.60 zone.
Silver daily chart
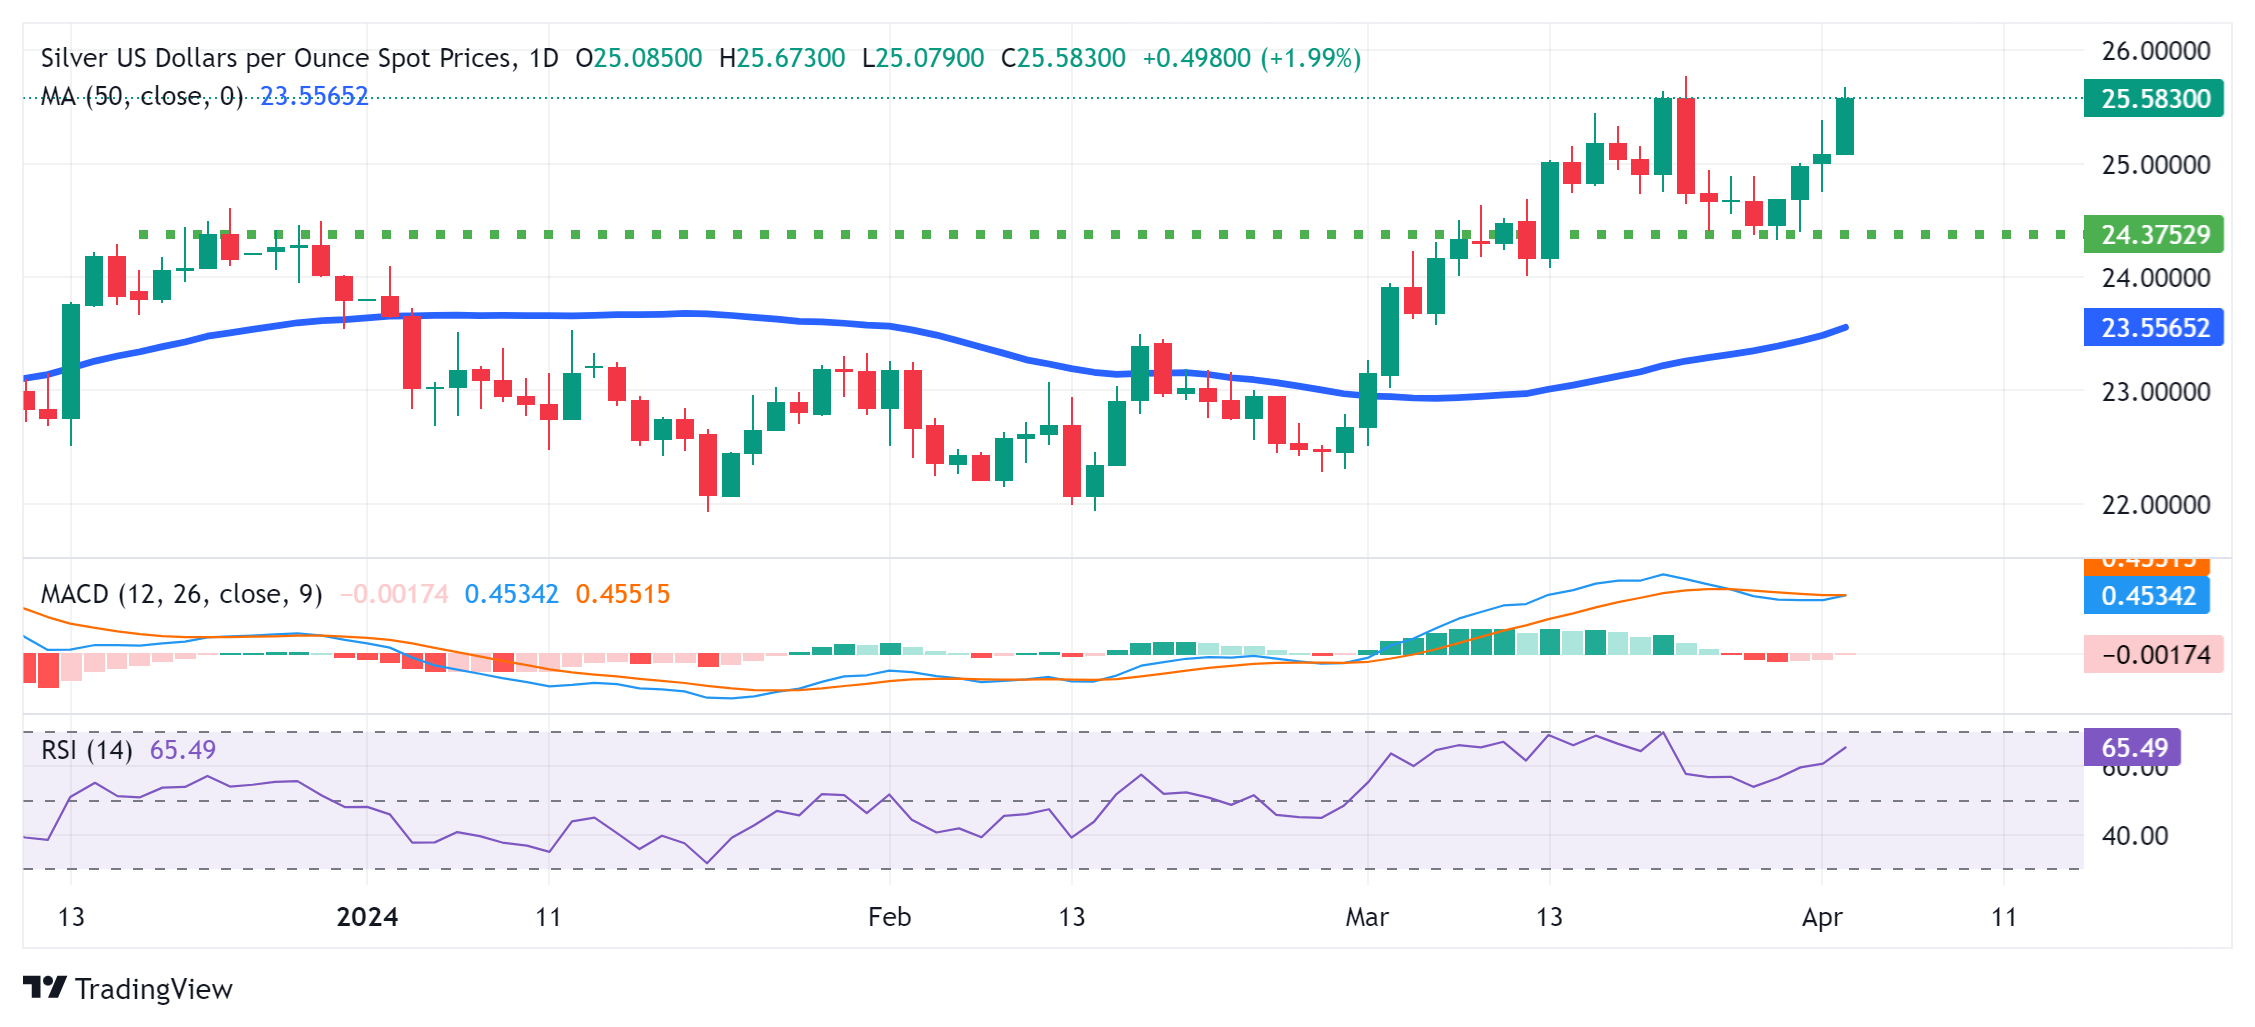
- USD/MXN depreciates as growth in Mexico's manufacturing sector remains steady in March.
- S&P Global Mexico Manufacturing PMI came in at 52.2 in March, remaining largely unchanged from 52.3 prior.
- US Dollar could strengthen as traders revise their expectations of Fed rate cuts in June.
USD/MXN retraces its recent gains, depreciating to near 16.60 during the European session on Tuesday. The Mexican Peso (MXN) strengthens as growth in Mexico's manufacturing sector remains steady in March, contributing to the depreciation of the USD/MXN pair.
Moreover, Mexican inflation has increased to 0.27% and 0.33% for both headline and core measures, respectively, in the first half of March. This positive development has allowed the Bank of Mexico (Banxico) to maintain tight borrowing conditions as part of its efforts to address ongoing inflationary pressures.
In March, the headline S&P Global Mexico Manufacturing Purchasing Managers’ Index (PMI) posted a reading of 52.2, remaining largely unchanged from February's 52.3. This signifies continued improvement in the sector's health. Although the growth rate was moderate, it remained above its long-run trend.
Following positive ISM Manufacturing PMI data from the United States (US) on Monday, US Treasury bond yields experienced a surge, consequently limiting the decline of the USD/MXN pair.
The US ISM Manufacturing PMI revealed an unexpected expansion in March, with the index rising to 50.3 from February's 47.8, surpassing expectations of 48.4. This reading marked the highest level observed since September 2022. Additionally, US ISM Manufacturing Prices Paid increased to 55.8 in March, surpassing both the expected 52.6 and the prior reading of 52.5.
The US Dollar Index (DXY) maintains its upward momentum, extending its winning streak for the fifth consecutive session and trading around 105.00 at present. This favorable trend is attributed to traders revising their expectations for a quarter-point interest rate cut by the Federal Reserve during its June meeting.
The US Dollar Index (DXY) is now trading above 105.00 and is at its strongest level since the middle of last November. Economists at ING analyze USD outlook.
JOLTS data in focus
Any reversal in this dollar strength (if it does come) will have to be data-driven. In addition to this Friday's release of March NFP job numbers, we would pick out today's JOLTS (job opening figures) as an important data release this week.
Markets expect a slightly lower JOLTS job opening figure today, but any sharp slowing in the job vacancy rate would suggest a much better balance in the jobs market and less pressure for higher wages. We see this data as a potential market mover which, if soft, could reverse some of the Dollar gains seen late last week.
Unless, however, today's JOLTS data does come in soft, wider US rate differentials warn that DXY can comfortably trade above the 105.00 area through the early part of the week.
- USD/CAD trades lacklustre around 1.3580 as the focus shifts to US JOLTS Job Openings data.
- Traders pare Fed rate cut bets for June on strong US Manufacturing PMI.
- USD/CAD is on the verge of breaking out of the ascending triangle pattern.
The USD/CAD pair trades sideways around 1.3580 in Tuesday’s European session. The Loonie asset struggles to extend recovery above 1.3580 as investors look for fresh United States labor data to get cues about when the Federal Reserve (Fed) will start reducing interest rates.
This week, investors will focus on the US Nonfarm Payrolls (NFP) report for March, which will be published on Friday. In today’s session, investors will focus on the JOLTS Job Openings for February. US employers are anticipated to have posted fresh 8.74 million job openings, lower than 8.863 million in January.
Meanwhile, the market sentiment is risk-off as strong United States Manufacturing PMI for March forced traders to unwind their bets for the Fed to begin the rate-cut cycle from June. The US Institute of Supply Management (ISM) reported the Manufacturing PMI above the 50.0 threshold at 50.3 after shrinking for 16 months in a row.
S&P 500 futures have posted some losses in the European session. The US Dollar Index (DXY) trades close to four-month high slightly above 105.00.
The next move in the Canadian Dollar will be guided by the labor market data for March, which will be published on Friday. Canadian employers are expected to have recruited 25K job seekers.
USD/CAD is inch from breaking out of the Ascending Triangle pattern formed on a daily time. A breakout of a Triangle pattern could happen in either direction. The chart pattern exhibits a sharp volatility contraction. The upward-sloping border of the aforementioned pattern is placed from December 27 low at 1.3177 while horizontal resistance is plotted from December 7 high at 1.3620
The 20-day Exponential Moving Average (EMA) near 1.3520 remains sticky to spot prices, indicating a sideways trend.
The 14-period Relative Strength Index (RSI) oscillates inside the 40.00-60.00 range, indicating indecisiveness among market participants.
The Loonie asset would observe a fresh upside if it breaks above December 7 high at 1.3620. This will drive the asset towards May 26 high at 1.3655, followed by the round-level resistance of 1.3700.
On the flip side, a downside move below February 22 low at 1.3441 would expose the asset to February 9 low at 1.3413. A breakdown below the latter would extend downside towards January 15 low at 1.3382.
USD/CAD daily chart
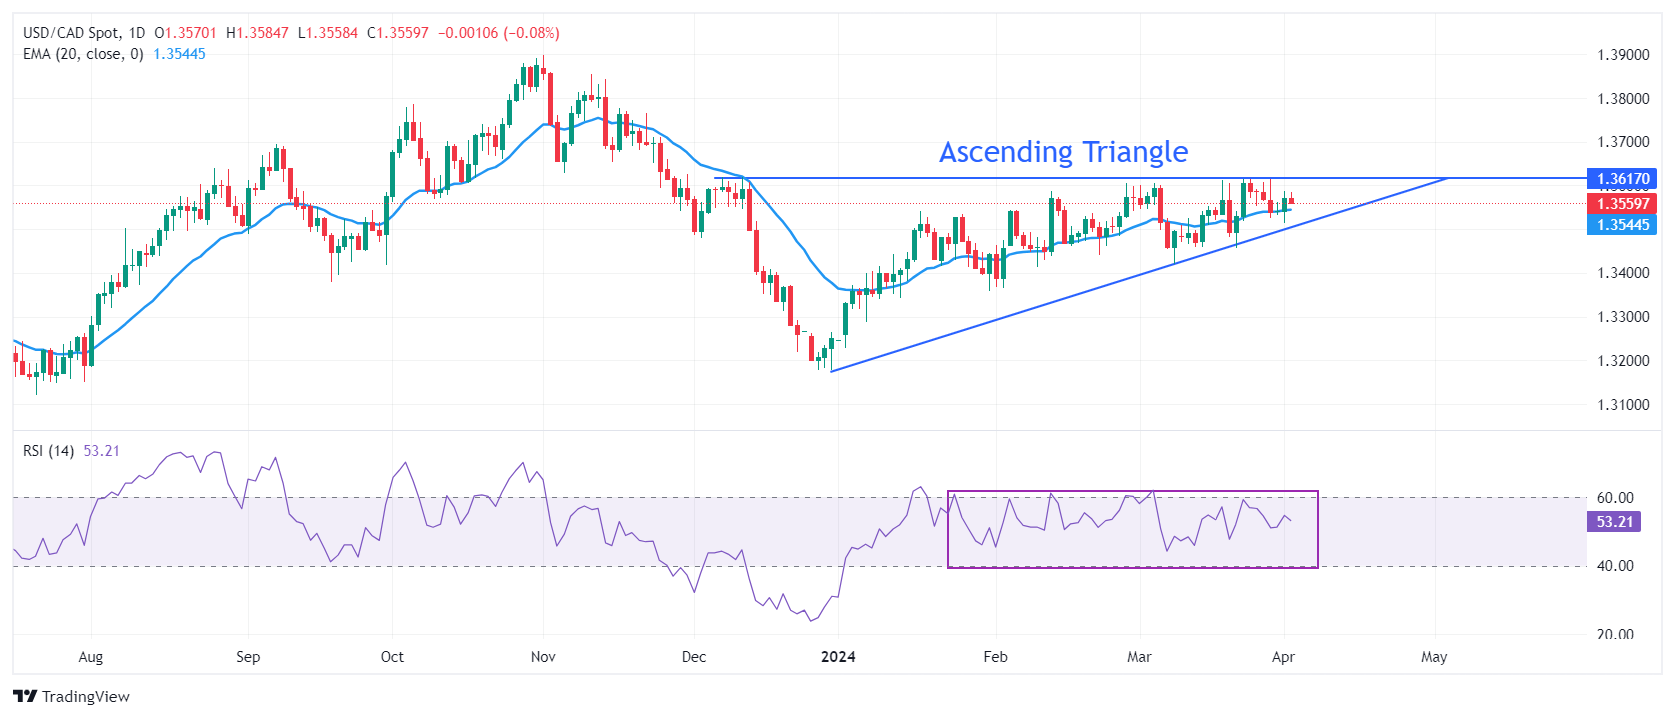
- The Pound Sterling consolidates, although easing UK inflation keeps its broader appeal weak.
- UK’s shop price inflation grew 1.3% in March, the slowest pace since December 2021.
- Easing Fed rate cut bets for June have dented market sentiment.
The Pound Sterling (GBP) trades in a narrow range near a six-week low around 1.2540 in Tuesday’s London session. The broader appeal of the GBP/USD pair is poor, mainly due to weak market sentiment. The near-term outlook of the Cable is downbeat as traders push back prospects for the Federal Reserve’s (Fed) first rate cut, which is expected in the June meeting, after keeping them higher for more than two years. The prospect of interest rates remaining higher for longer than anticipated benefits the US Dollar and weighs on the pair.
The robust recovery in the United States manufacturing sector, which exhibits a strong economic outlook, forced traders to roll back their bets on rate cuts by June. Higher demand for the US manufacturing sector indicates solid household spending, allowing Fed policymakers to avoid rushing for interest rate cuts. Upbeat economic prospects buy significant time for the Fed to observe more inflation data before jumping on rate cuts.
Cautious market sentiment weighs heavily on the Pound Sterling. On the contrary, the US Dollar Index (DXY) prints a fresh four-month high slightly above 105.00 amid a cheerful safe-haven bid and good prospects for the US economy. More uncertainty is anticipated in global markets as the US Bureau of Labor Statistics (BLS) will report the Nonfarm Payrolls (NFP) data for March on Friday. But before that, investors will focus on the US JOLTS Job Openings data for February, which will be published at 14:00 GMT.
Daily digest market movers: Pound Sterling consolidates while US Dollar hovers near four-month high
- The Pound Sterling seems vulnerable near more than six-week low around 1.2540 due to multiple headwinds. Slowing United Kingdom inflation and dismal market mood have weighed heavily on the Pound Sterling.
- The British Retail Consortium (BRC) reported on Tuesday that the UK’s shop price inflation grew 1.3% in March, its slowest pace in more than two years. This marks a deceleration from the 2.5% increase seen in February. Shop price inflation fell due to softer prices of both food and non-food items. Non-food prices rose meagrely by 0.2% from the 1.3% rise seen a month earlier, while food prices grew by 3.7%, down from 5.0%.
- BRC Chief Executive Helen Dickinson said fierce competition among retailers to bring prices down for their customers has eased shop price inflation to its lowest since December 2021. However, she warned that increasing cost pressures could put the progress in bringing down inflation at risk.
- Lower shop price inflation could be a relief for Bank of England policymakers, providing them with ground for reducing interest rates after keeping them at high levels for more than two years. Currently, the market expects that the BoE will begin reducing interest rates from the June meeting.
- Going forward, investors await the S&P Global/CIPS Manufacturing PMI final data for March, which will be published on Tuesday. The factory data is forecasted to have remained unchanged from its preliminary reading of 49.9, which came in marginally below the 50.0 threshold that separates expansion from contraction.
- Meanwhile, market sentiment has turned downbeat as traders have pared expectations for the Federal Reserve to cut interest rates in June. The prospects for a Fed rate cut that month eased after the United States Institute of Supply Management (ISM) reported stronger-than-expected Manufacturing PMI data for March. The Manufacturing PMI landed above the 50.0 threshold for the first time after 16 straight months of contraction. The US factory sector seems to be recovering from the high interest rate environment, which has weighed on activity for the last year and a half.
Technical Analysis: Pound Sterling declines toward 1.2500
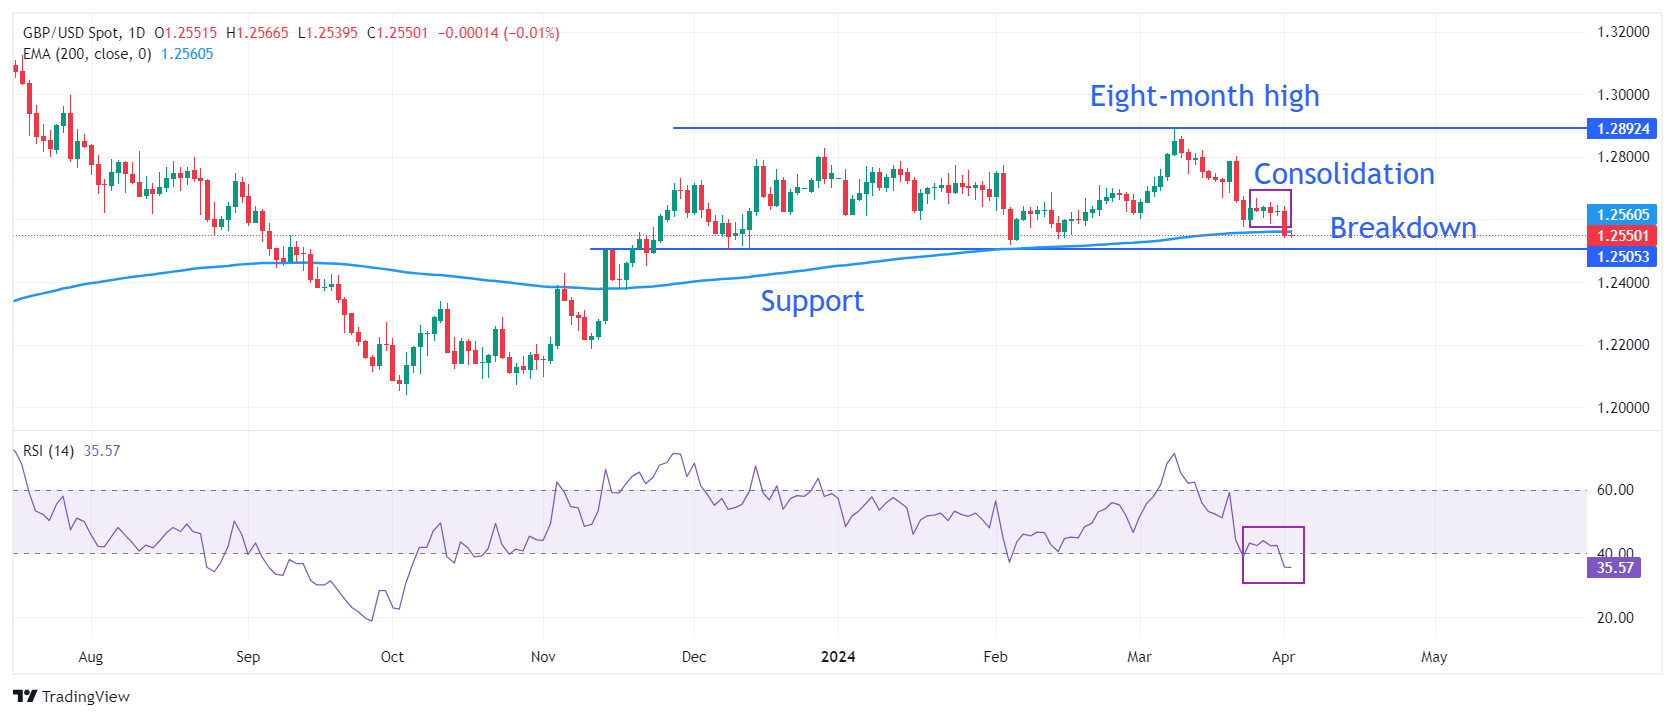
The Pound Sterling delivers a breakdown of the consolidation formed in the range between 1.2575 and 1.2675 last week. The Cable seems vulnerable as it trades near the 200-day Exponential Moving Average (EMA) at 1.2568, indicating weak demand in the longer term.
On a broader time frame, the horizontal support from December 8 low at 1.2500 could provide further cushion to the Pound Sterling. Meanwhile, the upside is expected to remain limited near an eight-month high of around 1.2900.
The 14-period Relative Strength Index (RSI) dips below 40.00. If it sustains below this level, bearish momentum will trigger.
Pound Sterling FAQs
The Pound Sterling (GBP) is the oldest currency in the world (886 AD) and the official currency of the United Kingdom. It is the fourth most traded unit for foreign exchange (FX) in the world, accounting for 12% of all transactions, averaging $630 billion a day, according to 2022 data. Its key trading pairs are GBP/USD, aka ‘Cable’, which accounts for 11% of FX, GBP/JPY, or the ‘Dragon’ as it is known by traders (3%), and EUR/GBP (2%). The Pound Sterling is issued by the Bank of England (BoE).
The single most important factor influencing the value of the Pound Sterling is monetary policy decided by the Bank of England. The BoE bases its decisions on whether it has achieved its primary goal of “price stability” – a steady inflation rate of around 2%. Its primary tool for achieving this is the adjustment of interest rates. When inflation is too high, the BoE will try to rein it in by raising interest rates, making it more expensive for people and businesses to access credit. This is generally positive for GBP, as higher interest rates make the UK a more attractive place for global investors to park their money. When inflation falls too low it is a sign economic growth is slowing. In this scenario, the BoE will consider lowering interest rates to cheapen credit so businesses will borrow more to invest in growth-generating projects.
Data releases gauge the health of the economy and can impact the value of the Pound Sterling. Indicators such as GDP, Manufacturing and Services PMIs, and employment can all influence the direction of the GBP. A strong economy is good for Sterling. Not only does it attract more foreign investment but it may encourage the BoE to put up interest rates, which will directly strengthen GBP. Otherwise, if economic data is weak, the Pound Sterling is likely to fall.
Another significant data release for the Pound Sterling is the Trade Balance. This indicator measures the difference between what a country earns from its exports and what it spends on imports over a given period. If a country produces highly sought-after exports, its currency will benefit purely from the extra demand created from foreign buyers seeking to purchase these goods. Therefore, a positive net Trade Balance strengthens a currency and vice versa for a negative balance.
- EUR/GBP trims intraday losses after weaker Nationwide Housing Prices data from the United Kingdom.
- Germany’s HCOB Manufacturing PMI increased to 41.9 in March, from the previous reading of 41.6.
- UK Housing Prices stood at 1.6% in March, falling short of the expected 2.4% rise.
EUR/GBP trims intraday losses after weaker housing data from the United Kingdom (UK). However, the cross remains in the negative territory and trades around 0.8550 during the European trading hours on Tuesday.
In March, non-seasonally adjusted Nationwide Housing Prices witnessed a year-over-year increase of 1.6%, falling short of market expectations of a 2.4% rise and trailing the previous figure of 1.2%. The monthly index indicated a decrease of 0.2%, contrary to the anticipated increase of 0.3% and the previous increase of 0.7%. Traders are expected to evaluate the UK economic landscape by closely monitoring key indicators such as the S&P Global PMI and Halifax House Prices data.
BoE Governor Andrew Bailey remarked that market forecasts for three quarter-point rate reductions in 2024 are reasonable noting that the UK central bank isn't observing significant persistent inflationary pressures. These statements have fueled expectations for the BoE to implement interest rate cuts in June, consequently exerting downward pressure on the Pound Sterling (GBP).
Germany’s HCOB Manufacturing PMI rose to 41.9 in March, from the previous reading of 41.6. Furthermore, traders await Consumer Price Index (CPI) data from Germany scheduled to be released later in the day. Wednesday brings Harmonized Index of Consumer Prices (HICP) data from the Eurozone.
The Euro struggles after the dovish remarks from the European Central Bank’s (ECB) members, which in turn, undermined the EUR/GBP cross. ECB Governing Council member Yannis Stournaras proposed on Sunday that there could be a total of four interest rate cuts in 2024, amounting to a cumulative reduction of 100 basis points (bps) by the end of the year. Additionally, ECB policymaker Robert Holzmann indicated that interest rate cuts are probable, contingent upon the evolution of wage and price dynamics by June.
- The US JOLTS data will be watched closely by investors ahead of the March jobs report.
- Job openings are forecast to edge lower to 8.79 million on the last business day of February.
- Markets see a strong probability of a 25 bps Fed rate cut in June.
The Job Openings and Labor Turnover Survey (JOLTS) will be released on Tuesday by the US Bureau of Labor Statistics (BLS). The publication will provide data about the change in the number of job openings in February, alongside the number of layoffs and quits.
JOLTS data is scrutinized by market participants and Federal Reserve (Fed) policymakers because it can provide valuable insights regarding the supply-demand dynamics in the labor market, a key factor impacting salaries and inflation. While job openings have been trending down over the last year and a half – a sign of cooling demand for labor – they remain above pre-pandemic levels.
What to expect in the next JOLTS report?
"Over the month, the number of hires and total separations were little changed at 5.7 million and 5.3 million, respectively," the BLS noted in its January JOLTS report and added: "Within separations, quits (3.4 million) and layoffs and discharges (1.6 million) changed little."
After declining steadily from 10.5 million to 8.85 million in the January-October period, job openings seem to have stabilized below 9 million since. For the upcoming February data, markets expect another slight downtick to 8.79 million from 8.86 million in January. In 2019, before the hit of the Covid-19 pandemic, openings were at an average of around 7 million. Meanwhile, Nonfarm Payrolls rose by 275,000 in February following January’s 229,000 increase (revised from 353,000).
The US Dollar (USD) ended March on a bullish note. The USD Index (DXY), which measures the USD’s valuation against a basket of six major currencies, turned north in the second half of the month and closed in positive territory. Although the Federal Reserve’s (Fed) revised Summary of Projections (SEP) showed that policymakers still expect the US central bank to lower the policy rate by a total of 75 basis points (bps) in 2024, upbeat macroeconomic data releases from the US helped the USD hold its ground. According to the CME FedWatch Tool, markets are currently pricing in a 65% probability of a 25 bps rate cut in June.
FXStreet Analyst Eren Sengezer shares his view on the JOLTS Job Openings data and the potential market reaction:
“In case the JOLTS Job Openings data for February comes in at or below 8.5 million, it could reaffirm loosening conditions in labor market and weigh on the USD with the immediate reaction. On the other hand, a reading close to 9.5 million could cause investors to refrain from pricing in a June rate cut, at least until Friday’s March jobs report, and allow the USD to stay resilient against its peers.”
When will the JOLTS report be released and how could it affect EUR/USD?
Job openings numbers will be published at 14:00 GMT. Eren points out key technical levels to watch for EUR/USD ahead of JOLTS data:
“The 200-day Simple Moving Average and the Fibonacci 38.2% retracement of the latest downtrend form strong resistance at 1.0840-1.0850 for EUR/USD. In case the pair manages to clear that hurdle, it could attract technical buyers and target 1.0900 (Fibonacci 50% retracement) and 1.0950 (Fibonacci 61.8% retracement).”
“On the downside, sellers are likely to retain control while EUR/USD stays below 1.0800 (Fibonacci 23.6% retracement). The 1.0700 level (end-point of the downtrend) could be seen as next support before 1.0650 (static level from November).”
Economic Indicator
United States JOLTS Job Openings
JOLTS Job Openings is a survey done by the US Bureau of Labor Statistics to help measure job vacancies. It collects data from employers including retailers, manufacturers and different offices each month.
Read more.
US Dollar FAQs
The US Dollar (USD) is the official currency of the United States of America, and the ‘de facto’ currency of a significant number of other countries where it is found in circulation alongside local notes. It is the most heavily traded currency in the world, accounting for over 88% of all global foreign exchange turnover, or an average of $6.6 trillion in transactions per day, according to data from 2022. Following the second world war, the USD took over from the British Pound as the world’s reserve currency. For most of its history, the US Dollar was backed by Gold, until the Bretton Woods Agreement in 1971 when the Gold Standard went away.
The most important single factor impacting on the value of the US Dollar is monetary policy, which is shaped by the Federal Reserve (Fed). The Fed has two mandates: to achieve price stability (control inflation) and foster full employment. Its primary tool to achieve these two goals is by adjusting interest rates. When prices are rising too quickly and inflation is above the Fed’s 2% target, the Fed will raise rates, which helps the USD value. When inflation falls below 2% or the Unemployment Rate is too high, the Fed may lower interest rates, which weighs on the Greenback.
In extreme situations, the Federal Reserve can also print more Dollars and enact quantitative easing (QE). QE is the process by which the Fed substantially increases the flow of credit in a stuck financial system. It is a non-standard policy measure used when credit has dried up because banks will not lend to each other (out of the fear of counterparty default). It is a last resort when simply lowering interest rates is unlikely to achieve the necessary result. It was the Fed’s weapon of choice to combat the credit crunch that occurred during the Great Financial Crisis in 2008. It involves the Fed printing more Dollars and using them to buy US government bonds predominantly from financial institutions. QE usually leads to a weaker US Dollar.
Quantitative tightening (QT) is the reverse process whereby the Federal Reserve stops buying bonds from financial institutions and does not reinvest the principal from the bonds it holds maturing in new purchases. It is usually positive for the US Dollar.
Investment demand for Gold has not been moving in tandem with prices for more than a year. Strategic investment inflows will be crucial for the Gold price, economists at ANZ Bank say.
A less crowded investment in Gold presents significant upside potential
Record highs of equity markets, along with heightened geopolitical tension, will encourage investors to add Gold to portfolios.
In our view, a less crowded investment in Gold presents significant upside potential as this leaves more room for increasing Gold holdings.
We estimate investment demand to shoulder nearly 460t of Gold to keep the market balanced in 2024.
- EUR/USD is selling off after the release of more positive data from the US.
- The data suggests the Federal Reserve could delay cutting interest rates, supporting USD.
- The ECB continues to target June as the first month to cut interest rates.
EUR/USD falls to the lower 1.0700s on Tuesday after more strong US macroeconomic data supports the US Dollar (USD), pushing down the probability of the US Federal Reserve (Fed) cutting interest rates by June to close to 50%. The maintenance of higher interest rates is good for the USD as it attracts more capital inflows.
In Europe, slower growth and lower inflation mean rate-setters at the European Central Bank (ECB) are not as cautious about cutting interest rates to help stimulate the wheels of growth. This divergence of trajectories between both central banks is negative for EUR/USD.
EUR/USD declines as US data bears up
EUR/USD takes another step lower, breaching the key 1.0800 level over the Easter weekend, as some firm US data suggests the Fed will have to delay reducing interest rates as inflation is likely to remain stubbornly above target.
On Good Friday, the inflation metric favored by the Fed, the core Personal Consumption Expenditures Price Index (PCE) in February, came out at 2.8%, exactly as expected, if below the 2.9% of January. It showed price pressures remain buoyant and well above the Fed’s 2.0% target.
US Manufacturing data on Easter Monday was also overall quite positive, with the ISM Manufacturing PMI for March vaulting over 50 – the dividing line between expansion and contraction – from a previous level of 47.8. The result was well above expectations of a rise to 48.4. It was the first result denoting expansion in the US manufacturing sector since November 2022.
The Euro was kept under pressure, meanwhile, by another ECB rate setter joining the chorus line for a June rate cut. ECB Governing Council member and Austrian Central Bank Governor Robert Holzmann said that the ECB could cut interest rates before the Fed, and in regards to when, “will depend largely on what wage and price developments look like by June.”
Technical Analysis: EUR/USD continues pushing lower
EUR/USD extends the dominant short-term downtrend that started at the March 8 high. It is currently on its way down to key support at the 1.0694 year-to-date (YTD) lows.
Euro versus US Dollar: 4-hour chart
The pair is oversold according to the Relative Strength Index (RSI) momentum indicator. This is a signal for sellers not to add any more shorts to their positions. If the indicator rises out of oversold (above 30), it will be a signal to close all short positions and open longs. This could lead to a pullback, although the precedence of the downtrend suggests an eventual capitulation.
The 1.0694 February and YTD lows are likely to present substantial support and a bounce off that level is likely at the first test. A decisive break below, however, would usher in another bout of weakness, and target the 1.0650s.
A decisive break is one characterized by a long red down candle breaking cleanly through the level and closing near its low, or three consecutive red candles breaching the level.
Euro FAQs
The Euro is the currency for the 20 European Union countries that belong to the Eurozone. It is the second most heavily traded currency in the world behind the US Dollar. In 2022, it accounted for 31% of all foreign exchange transactions, with an average daily turnover of over $2.2 trillion a day. EUR/USD is the most heavily traded currency pair in the world, accounting for an estimated 30% off all transactions, followed by EUR/JPY (4%), EUR/GBP (3%) and EUR/AUD (2%).
The European Central Bank (ECB) in Frankfurt, Germany, is the reserve bank for the Eurozone. The ECB sets interest rates and manages monetary policy. The ECB’s primary mandate is to maintain price stability, which means either controlling inflation or stimulating growth. Its primary tool is the raising or lowering of interest rates. Relatively high interest rates – or the expectation of higher rates – will usually benefit the Euro and vice versa. The ECB Governing Council makes monetary policy decisions at meetings held eight times a year. Decisions are made by heads of the Eurozone national banks and six permanent members, including the President of the ECB, Christine Lagarde.
Eurozone inflation data, measured by the Harmonized Index of Consumer Prices (HICP), is an important econometric for the Euro. If inflation rises more than expected, especially if above the ECB’s 2% target, it obliges the ECB to raise interest rates to bring it back under control. Relatively high interest rates compared to its counterparts will usually benefit the Euro, as it makes the region more attractive as a place for global investors to park their money.
Data releases gauge the health of the economy and can impact on the Euro. Indicators such as GDP, Manufacturing and Services PMIs, employment, and consumer sentiment surveys can all influence the direction of the single currency. A strong economy is good for the Euro. Not only does it attract more foreign investment but it may encourage the ECB to put up interest rates, which will directly strengthen the Euro. Otherwise, if economic data is weak, the Euro is likely to fall. Economic data for the four largest economies in the euro area (Germany, France, Italy and Spain) are especially significant, as they account for 75% of the Eurozone’s economy.
Another significant data release for the Euro is the Trade Balance. This indicator measures the difference between what a country earns from its exports and what it spends on imports over a given period. If a country produces highly sought after exports then its currency will gain in value purely from the extra demand created from foreign buyers seeking to purchase these goods. Therefore, a positive net Trade Balance strengthens a currency and vice versa for a negative balance.
EUR/USD is heavy around 1.0730. Economists at Société Générale analyze the pair’s outlook.
Next support is 1.0710/1.0695
EUR/USD has staged a steady pullback after forming a lower peak near 1.0980 last month. It has failed to defend 50-DMA resulting in deeper decline.
Daily MACD has dipped within negative territory highlighting lack of steady upward momentum.
Inability to cross the MA at 1.0835 can lead to continuation in decline towards February low of 1.0710/1.0695 and perhaps even towards 1.0610, the 76.4% retracement from last October.
- EUR/JPY edges lower to 162.75 amid the fear of FX intervention from the Bank of Japan (BoJ).
- The cross keeps the negative outlook below the key EMA; RSI indicator lies in bearish territory.
- The first upside barrier will emerge at 163.15; the first downside target is located at 162.65.
The EUR/JPY cross loses momentum near 162.75 during the early European trading hours on Tuesday. The growing speculation that the Bank of Japan (BoJ) will intervene in the foreign exchange market might support the Japanese Yen (JPY) in the near term. Early Tuesday, Japanese Finance Minister Shunichi Suzuki said that he will not rule out any steps to respond to disorderly moves and that he will monitor foreign exchange (FX) moves with a high sense of urgency.
From a technical perspective, the bearish outlook of EUR/JPY remains intact as the cross is below the 50- and 100-period Exponential Moving Averages (EMA) on the four-hour chart. The Relative Strength Index (RSI) lies in bearish territory around 36.40, supporting the sellers for the time being.
The first upside barrier for EUR/JPY will emerge near the 100-period EMA at 163.15. Further north, the next target is seen at the 50-period EMA at 163.32. A decisive break above the latter will expose the upper boundary of the Bollinger Band at 163.58. Any follow-through buying above this level would sustain its bullish move to a high of March 27 at 164.41.
On the flip side, the lower limit of the Bollinger Band at 162.65 acts as an initial support level for the cross. The key contention level is located at the 162.00 mark, representing a low of March 19 and a psychological level. A breach below 162.00 will see a drop to a low of March 14 at 161.10.
EUR/JPY four-hour chart
- USD/CHF appreciated as the US Dollar improved after stronger US ISM data.
- Swiss Franc receives downward pressure after weaker Real Retail Sales.
- Swiss Real Retail Sales declined by 0.2% YoY in February, against the expected rise of 0.4%.
USD/CHF extends gains for the second consecutive day, advancing to near 0.9080 during the early European hours on Tuesday. The US Dollar (USD) received a boost as US Treasury bond yields surged following positive ISM Manufacturing PMI data from the United States (US), thereby supporting the USD/CHF pair.
The US Dollar Index (DXY) continues its winning streak for the fifth successive session, trading around 105.10 at the time of writing. This positive trend is attributed to traders lowering their expectations for a quarter-point interest rate cut by the Federal Reserve in its June meeting.
However, Federal Reserve Chairman Jerome Powell indicated on Friday that recent US inflation data aligns with the anticipated path, reinforcing the Fed's stance on interest rate adjustments for the year.
On the other side, Real Retail Sales (YoY) from Switzerland declined by 0.2% in February, against the expected increase of 0.4% and the previous increase of 0.3%. This lower figure has contributed to downward pressure on Swiss Franc (CHF).
The Swiss National Bank’s (SNB) statement highlighted that the easing of monetary policy was feasible due to the effectiveness of the inflation-fighting efforts over the past two and a half years.
Moreover, ING analysts anticipate two additional rate cuts from the SNB in the year 2024, barring any unexpected developments in the global economic landscape that could rapidly escalate inflationary pressures once more.
EUR/USD is comfortably trading under 1.0800. Economists at ING analyze the pair’s outlook.
Can't argue with wider rate differentials
Two-year EUR:USD swap rate differentials are now at 145 bps in favour of the Dollar. These are the most supportive rate conditions for the dollar since December 2022.
The 1.0695/1.0700 lows seen in mid-February are now an obvious short-term target.
The US JOLTS data will have a big say in whether EUR/USD trades much below 1.0700 today, but equally a soft JOLTS figure could be worth a bounce back to 1.0770/1.0780.
Here is what you need to know on Tuesday, April 2:
Trading conditions are starting to normalizing on Tuesday with investors returning from the long Easter holiday. Germany's Destatis will release preliminary Consumer Price Index data for March and the US economic docket will feature Factory Orders and JOLTS Job Openings data for February. Several Federal Reserve (Fed) policymakers are scheduled to deliver speeches during the American trading hours as well.
Following a quiet European session on Monday, the US Dollar (USD) gathered strength against its rivals in the second half of the day, supported by rising US Treasury bond yields and the ISM Manufacturing PMI data, which came in better than expected. The USD Index rose 0.4% on the day and reached its highest level since November before going into a consolidation phase above 105.00 early Tuesday. Meanwhile, the 10-year US Treasury bond yield holds steady above 4.3% after rising 2.5% on Monday.
US Dollar price this week
The table below shows the percentage change of US Dollar (USD) against listed major currencies this week. US Dollar was the strongest against the Pound Sterling.
| USD | EUR | GBP | CAD | AUD | JPY | NZD | CHF | |
| USD | 0.61% | 0.73% | 0.40% | 0.67% | 0.22% | 0.67% | 0.62% | |
| EUR | -0.62% | 0.12% | -0.21% | 0.05% | -0.40% | 0.05% | 0.01% | |
| GBP | -0.74% | -0.12% | -0.33% | -0.06% | -0.53% | -0.06% | -0.12% | |
| CAD | -0.42% | 0.21% | 0.32% | 0.25% | -0.20% | 0.24% | 0.20% | |
| AUD | -0.66% | -0.04% | 0.08% | -0.26% | -0.44% | 0.01% | -0.04% | |
| JPY | -0.23% | 0.41% | 0.51% | 0.19% | 0.48% | 0.46% | 0.40% | |
| NZD | -0.67% | -0.05% | 0.07% | -0.25% | 0.01% | -0.46% | -0.05% | |
| CHF | -0.63% | -0.01% | 0.11% | -0.22% | 0.05% | -0.41% | 0.05% |
The heat map shows percentage changes of major currencies against each other. The base currency is picked from the left column, while the quote currency is picked from the top row. For example, if you pick the Euro from the left column and move along the horizontal line to the Japanese Yen, the percentage change displayed in the box will represent EUR (base)/JPY (quote).
EUR/USD broke below 1.0800 and lost nearly 0.5% on a daily basis on Monday. The pair stays on the back foot and trades in negative territory below 1.0750 in the European morning.
GBP/USD turned south in the American session on Monday and slumped to the 1.2550 area. The pair holds steady near that level on Tuesday.
The minutes of the Reserve Bank of Australia's (RBA) March meeting showed that board members did not consider the option for an interest rate rise. AUD/USD showed no reaction to this publication and was last seen consolidating Monday's losses slightly below 0.6500.
Australian Dollar moves sideways amid an improved US Dollar.
After moving sideways in a very tight channel for several days, USD/JPY closed in positive territory and came within a touching distance of multi-decade highs on Monday. The pair stays relatively quiet at around 151.70 early Tuesday. Japanese Finance Minister Shunichi Suzuki repeated that they will not rule out any steps to respond to disorderly moves and that they will monitor foreign exchange moves with a high sense of urgency.
Japanese Yen languishes near multi-decade low, seems vulnerable to slide further.
Gold reached a new all-time high above $2,260 early Monday but erased a portion of its daily gains on broad-based USD strength in the American session. XAU/USD seems to have stabilized at around $2,250 on Tuesday.
US Dollar FAQs
The US Dollar (USD) is the official currency of the United States of America, and the ‘de facto’ currency of a significant number of other countries where it is found in circulation alongside local notes. It is the most heavily traded currency in the world, accounting for over 88% of all global foreign exchange turnover, or an average of $6.6 trillion in transactions per day, according to data from 2022. Following the second world war, the USD took over from the British Pound as the world’s reserve currency. For most of its history, the US Dollar was backed by Gold, until the Bretton Woods Agreement in 1971 when the Gold Standard went away.
The most important single factor impacting on the value of the US Dollar is monetary policy, which is shaped by the Federal Reserve (Fed). The Fed has two mandates: to achieve price stability (control inflation) and foster full employment. Its primary tool to achieve these two goals is by adjusting interest rates. When prices are rising too quickly and inflation is above the Fed’s 2% target, the Fed will raise rates, which helps the USD value. When inflation falls below 2% or the Unemployment Rate is too high, the Fed may lower interest rates, which weighs on the Greenback.
In extreme situations, the Federal Reserve can also print more Dollars and enact quantitative easing (QE). QE is the process by which the Fed substantially increases the flow of credit in a stuck financial system. It is a non-standard policy measure used when credit has dried up because banks will not lend to each other (out of the fear of counterparty default). It is a last resort when simply lowering interest rates is unlikely to achieve the necessary result. It was the Fed’s weapon of choice to combat the credit crunch that occurred during the Great Financial Crisis in 2008. It involves the Fed printing more Dollars and using them to buy US government bonds predominantly from financial institutions. QE usually leads to a weaker US Dollar.
Quantitative tightening (QT) is the reverse process whereby the Federal Reserve stops buying bonds from financial institutions and does not reinvest the principal from the bonds it holds maturing in new purchases. It is usually positive for the US Dollar.
The next step for the Fed is still a cut and a less restrictive rates environment. This should be favourable for Gold, economists at OCBC Bank say.
Risk of pullback in the near term
We continue to maintain a constructive outlook on Gold on expectations that real rates should eventually correct lower (especially after the recent rise). This should happen when the Fed embarks on rate cut cycle in 2Q24.
To add, Gold’s risk-off hedge (safe haven proxy) against geopolitical risks and portfolio diversifier is now playing up. But near term, we do not rule out the risk of pullback given the rapid breakout while long Gold positions in CFTC have hit record highs.
FX option expiries for Apr 2 NY cut at 10:00 Eastern Time, via DTCC, can be found below
- EUR/USD: EUR amounts
- 1.0735 1.3b
- 1.0750 582m
- 1.0800 1.3b
- GBP/USD: GBP amounts
- 1.2600 400m
- USD/JPY: USD amounts
- 151.15 1.4b
- 152.50 863m
- 153.00 1.1b
- AUD/USD: AUD amounts
- 0.6500 2.3b
- EUR/USD faces some sell-off around 1.0730 in Tuesday’s early European session.
- The major pair holds below the key EMA with an oversold RSI condition.
- The first downside target is located at 1.0720; the 1.0800–1.0805 region acts as an immediate resistance level.
The EUR/USD pair extends its downside to 1.0730, the weekly low during the early European session on Tuesday. The upbeat US ISM Manufacturing PMI for March lifts the US Dollar (USD) and drags the EUR/USD pair lower. Investors will take more cues from Fedspeak later on Tuesday, including Michelle Bowman, Loretta Mester, John Williams, and Mary Daly.
Technically, EUR/USD maintains the bearish outlook unchanged as the major pair is below the 50- and 100-period Exponential Moving Average (EMA) on the four-hour chart, which means the path of least resistance level is to the downside. It’s worth noting that the Relative Strength Index (RSI) holds in bearish territory around 28. However, the oversold RSI condition indicates that further consolidation cannot be ruled out before positioning for any near-term EUR/USD depreciation.
The key contention level will emerge near the confluence of the lower limit of the Bollinger Band and a low of February 13 at 1.0720. Any follow-through selling below the latter will see a drop to a low of November 9, 2023, at 1.0660, followed by a low of November 2, 2023, at 1.0565.
On the upside, the 50-period EMA and a high of March 29 at the 1.0800-1.0805 zone act as an immediate resistance level for EUR/USD. The additional upside filter to watch is the 100-period EMA at 1.0822. The next hurdle is seen near a high of March 26 at 1.0864.
EUR/USD four-hour chart
-638476354961323870.png)
- GBP/JPY trades with a mild negative bias around 190.30 on Tuesday.
- The verbal intervention from the Japanese Finance Minister and rising Middle East geopolitical tensions lift the Japanese Yen (JPY).
- BoE’s Bailey signaled markets are right to expect more than one interest rate cut this year.
The GBP/JPY cross trades in negative territory for the fifth straight day near 190.30 on Tuesday during the early European session. The verbal intervention from the Japanese authorities provides some support to the Japanese Yen (JPY) for the time being.
Japanese Finance Minister Shunichi Suzuki said on Tuesday that he will not rule out any steps to respond to disorderly moves and that he will monitor foreign exchange (FX) moves with a high sense of urgency. The verbal intervention might lift the JPY in the near term and cap the upside for the GBP/JPY cross.
Additionally, warplanes attacked a building inside Iran's consulate complex in Damascus, Syria, on Monday. Some of the most senior members of Iran's Revolutionary Guard were killed, marking an escalation in the confrontation that has lasted over half a year. The ongoing geopolitical tensions in the Middle East might further boost safe-haven assets like JPY.
On the other hand, the dovish stance of the Bank of England (BoE) weighs on the Pound Sterling (GBP). The BoE Governor Andrew Bailey signaled markets are right to expect more than one interest rate cut this year, saying he is increasingly confident inflation is heading towards the central bank’s target. Any further dovish comments from the BoE official are likely to exert selling pressure on the GBP and create a headwind for the GBP/JPY pair.
- USD/CAD gains positive traction for the second straight day, albeit lacks follow-through.
- Reduced bets for a June Fed rate cut lift the USD to a multi-week top and lend support.
- Bullish Crude Oil prices seem to underpin the Loonie and act as a headwind for the pair.
The USD/CAD pair attracts some buyers for the second straight day on Tuesday and looks to build on the overnight bounce from the 1.3515 region, or over a one-week low. Spot prices currently trade around the 1.3580 area and remain supported by some follow-through US Dollar (USD) buying, though bullish Crude Oil prices might cap any further gains.
The USD Index (DXY), which tracks the Greenback against a basket of currencies, has advanced to its highest level since February 14 in the wake of doubts over whether the Federal Reserve (Fed) will cut interest rates three times this year. Investors trimmed their bets for a June Fed rate cut following the release of the upbeat US data, which showed that the manufacturing sector registered growth in March for the first time since September 2022. This remains supportive of elevated US Treasury bond yields, which, in turn, act as a tailwind for the buck and the USD/CAD pair.
Apart from this, the risk-off impulse turns out to be another factor benefitting the safe-haven Greenback. Meanwhile, Crude Oil prices stand tall near a five-month high touched on Monday amid signs of improved demand and the risk of a further escalation of tensions in the Middle East. This is seen underpinning the commodity-linked Loonie, which, in turn, might hold back traders from placing fresh bullish bets around the USD/CAD pair. Even from a technical perspective, the recent repeated failures to find acceptance above the 1.3600 mark warrant some caution.
Market participants now look forward to the US economic docket – featuring the release of JOLTS Job Openings and Factory Orders later during the early North American session. This, along with speeches by influential FOMC members, the US bond yields and the broader risk sentiment, should rive the USD demand and provide some impetus to the USD/CAD pair. Traders will further take cues from Oil price dynamics to grab short-term opportunities.
- ASX 200 Index corrects after reaching record highs on Tuesday.
- Australia’s market sentiment improved due to the positive manufacturing performance in China.
- Genex Power has verified that Fortescue has not fulfilled the conditions precedent for one of Queensland's largest renewable energy projects.
The ASX 200 Index retreats to around 7,870 after reaching new record highs on Tuesday. The index saw support from gains in materials, mining, and utilities sectors. Sentiment received a boost from positive manufacturing performance in China, Australia's primary trading partner, as indicated by a private survey showing factory activity expanding at its fastest rate in 13 months.
Some of the top gainers included West African Resources, which surged by 5.00% to reach 1.26; Newmont, rising by 1.65% to 36.43; and Gold Road Resources, gaining 4.87% to reach 1.66. Conversely, among the top losers were Orora, plummeting by 13.42% to 2.36; Netwealth Group, declining by 5.16% to 20.03; and Megaport, decreasing by 4.60% to 14.30.
Macmahon Holdings specializes in providing comprehensive mining services to clients across Australia and Southeast Asia, with a particular focus on the gold sector. The company has expanded its operations into capital-tight sectors such as mining support services and civil infrastructure, diversifying its portfolio.
Genex Power has confirmed that Fortescue, a major Australian resources company, has not yet met the conditions precedent for one of Queensland's largest renewable energy projects. Fortescue had previously entered into a 25-year solar power purchase agreement (PPA) with Genex in October 2023 for the Bulli Creek Solar and Battery Project (BCP).
The Reserve Bank of Australia's (RBA) March meeting minutes indicate that the central bank did not consider the option of raising interest rates. With inflation rates persisting higher than those in other countries and a tight job market, the RBA is anticipated to maintain the current cash rate until at least November.
Australian Stock Market FAQs
Stock markets in Australia are managed by the Australian Securities Exchange (ASX), headquartered in Sydney. The main indices are the S&P/ASX 200 and the S&P/ASX 300, which track the performance of the 200 and 300 largest stocks by market capitalization listed on the exchange, respectively. The S&P/ASX 200 was launched in April 2000, and it is rebalanced every quarter.
Almost half of the index belongs to the financial sector, with major banks like the Commonwealth Bank of Australia, Westpac or National Australia Bank. The so-called materials sector is also relevant – comprising almost 20% of the weighting in the index – with mining giants such as BHP Group or Rio Tinto. Other important sectors are biotechnology, real estate, consumer staples, and industrials.
Many different factors drive the ASX 200, but mainly it is the aggregate performance of the component companies revealed in their quarterly and annual earnings reports the main factor behind its performance. Commodity prices can also affect the index given its significant share of mining companies. Macroeconomic data such as Gross Domestic Product (GDP) growth, inflation, or unemployment data from Australia is also important as they are indicators of the health of the country’s economy and thus the profitability of its largest companies. Global economic conditions may also play a role, particularly from China, as the Asian country is Australia’s largest trading partner.
The level of interest rates in Australia, set by the Reserve Bank of Australia (RBA), also influences the ASX 200 and ASX 300 indexes as it affects the cost of credit, on which many firms are heavily reliant. Generally, when the RBA cuts interest rates (or signals it is going to do it), it is positive for the Australian stock market as it means a lower cost of credit for companies and higher economic growth ahead, likely boosting sales. On the contrary, if the RBA signals that it will increase interest rates, this tends to weigh on the index. As always, there is a caveat: banks. Financial institutions tend to benefit from higher interest rates because they earn more from lending to other businesses, thus boosting their overall income.
- Gold price stalls its recent upward trajectory to a fresh all-time peak touched on Monday.
- Reduced June Fed rate cut bets continue to underpin the USD and act as a headwind.
- The downside remains cushioned amid the risk-off mood and persistent geopolitical risks.
Gold price (XAU/USD) oscillates in a range during the Asian session on Tuesday and consolidates its gains registered over the past five days to the all-time peak, around the $2,265-2,266 area touched the previous day. The upbeat US manufacturing data released on Monday raised doubts if the Federal Reserve (Fed) will cut interest rates three times this year. This remains supportive of elevated US Treasury bond yields, which, in turn, pushes the US Dollar (USD) to its highest level since February 14 and turns out to be a key factor undermining the non-yielding yellow metal.
The markets, however, are still pricing in a greater chance that the Fed will begin its rate-cutting cycle in June. This, along with the risk-off impulse and geopolitical risks stemming from conflicts in the Middle East, should help limit losses for the safe-haven Gold price. This makes it prudent to wait for strong follow-through selling before confirming that the XAU/USD has topped out in the near term and positioning for any meaningful corrective decline. Traders now look to the US macro data and speeches by a slew of influential FOMC members for a fresh impetus.
Daily Digest Market Movers: Gold price bulls take a brief pause amid mixed fundamental cues
- The Institute for Supply Management reported that the US manufacturing sector expanded in March after 16 straight months of contraction, forcing investors to trim their bets for a June rate cut by the Federal Reserve.
- The shift in expectations lifts the yield on the rate-sensitive two-year and the benchmark 10-year US government bonds to a two-week peak, which underpins the US Dollar and exerts some pressure on the Gold price.
- A sharp rise in the US Treasury bond yields, along with the risk of a further escalation of geopolitical tensions in the Middle East, tempers investors' appetite for riskier assets and lends support to the safe-haven XAU/USD.
- Israeli air strikes destroyed the Iranian embassy's consular annex in Syria on Monday, killing seven members, including a top Revolutionary Guard commander, and fuelling fears of further violence between Israel and Iran's allies.
- Moreover, the US PCE Price Index released on Friday indicated a moderate rise in inflation during February and kept Fed rate cut hopes on the table, which should contribute to limiting the downside for the non-yielding metal.
- Tuesday's US economic docket features the release of JOLTS Job Openings and Factory Orders, which, along with speeches by a slew of influential FOMC members, should drive the USD demand and provide a fresh impetus.
Technical Analysis: Gold price needs to consolidate amid overbought RSI before the next leg up
From a technical perspective, the Relative Strength Index (RSI) on the daily chart is flashing overbought conditions, which makes it prudent to wait for some near-term consolidation or a modest pullback before the next leg up. That said, any meaningful corrective decline is more likely to find decent support and attract fresh buyers near the $2,223 region, or the previous record high. This should help limit the downside near the $2,200 mark, which should now act as a key pivotal point for the Gold price. A convincing break below the latter might prompt some technical selling and pave the way for deeper losses.
On the flip side, the $2,265-2,266 region, or a fresh record peak touched on Monday, now seems to act as an immediate hurdle for the Gold price. A sustained strength beyond should allow the XAU/USD to prolong its appreciating move further towards conquering the $2,300 round-figure mark.
Gold FAQs
Gold has played a key role in human’s history as it has been widely used as a store of value and medium of exchange. Currently, apart from its shine and usage for jewelry, the precious metal is widely seen as a safe-haven asset, meaning that it is considered a good investment during turbulent times. Gold is also widely seen as a hedge against inflation and against depreciating currencies as it doesn’t rely on any specific issuer or government.
Central banks are the biggest Gold holders. In their aim to support their currencies in turbulent times, central banks tend to diversify their reserves and buy Gold to improve the perceived strength of the economy and the currency. High Gold reserves can be a source of trust for a country’s solvency. Central banks added 1,136 tonnes of Gold worth around $70 billion to their reserves in 2022, according to data from the World Gold Council. This is the highest yearly purchase since records began. Central banks from emerging economies such as China, India and Turkey are quickly increasing their Gold reserves.
Gold has an inverse correlation with the US Dollar and US Treasuries, which are both major reserve and safe-haven assets. When the Dollar depreciates, Gold tends to rise, enabling investors and central banks to diversify their assets in turbulent times. Gold is also inversely correlated with risk assets. A rally in the stock market tends to weaken Gold price, while sell-offs in riskier markets tend to favor the precious metal.
The price can move due to a wide range of factors. Geopolitical instability or fears of a deep recession can quickly make Gold price escalate due to its safe-haven status. As a yield-less asset, Gold tends to rise with lower interest rates, while higher cost of money usually weighs down on the yellow metal. Still, most moves depend on how the US Dollar (USD) behaves as the asset is priced in dollars (XAU/USD). A strong Dollar tends to keep the price of Gold controlled, whereas a weaker Dollar is likely to push Gold prices up.
- WTI price receives upward support on concerns over a supply shortage.
- Reuters survey indicates that Iraq and Nigeria have reduced their oil exports in March.
- Gasoline prices could spike in the US due to tighter global fuel supplies following Ukrainian attacks on Russian refineries.
West Texas Intermediate (WTI) oil price remains on the defensive at around $83.50 per barrel during the Asian trading hours on Tuesday. However, Crude oil prices are on the rise due to robust manufacturing data from both the United States (US) and China, exceeding expectations. The expansion of manufacturing activity in both countries during March is seen by markets as a positive signal for increased oil demand.
Furthermore, Crude oil prices receive additional upward support from a Reuters survey indicating a decline in oil output from the Organization of the Petroleum Exporting Countries (OPEC) in March. Iraq and Nigeria have reduced their oil exports, aligning with ongoing voluntary supply cuts by certain members in agreement with the broader OPEC+ alliance. The group produced 26.42 million barrels per day (bpd) last month, representing a decrease of 50,000 bpd compared to February.
OPEC+ is set to convene for a joint ministerial meeting on Wednesday, where market fundamentals and member adherence to production targets will be evaluated. There is widespread anticipation that current output policies will be maintained.
According to Patrick De Haan, a petroleum analyst at GasBuddy.com, the US market could see gasoline prices spike by up to 15 cents per gallon due to tighter global fuel supplies following Ukraine's recent attacks on Russian refineries.
Ukrainian drone strikes have severely impacted several Russian refineries, resulting in a reduction in Russia's fuel exports. These attacks have caused nearly 1 million barrels per day of Russian crude processing capacity to become inactive.
- Indian Rupee trades sideways on Monday despite the stronger USD.
- Several polls showed the RBI would maintain the repo rate steady at 6.50% in the forthcoming meeting on Friday.
- Investors will closely watch the Indian March HSBC Manufacturing Purchasing Managers Index (PMI) data on Tuesday.
Indian Rupee (INR) trades on a flat note on Tuesday despite the firmer US Dollar (USD) following the upbeat US ISM Manufacturing PMI. The Reserve Bank of India (RBI) will schedule its first bi-monthly monetary policy meeting for Wednesday to Friday. Various polls indicate that the RBI will keep the repo rate steady at 6.50% in the upcoming meeting as it weighs robust domestic economic growth prospects amid sticky food inflation, while Fed officials hinted at potential rate cuts later this year. The high-for-longer rate narrative in India might lift the INR and create a tailwind for the USD/INR pair.
Looking ahead, market players will monitor India’s HSBC Manufacturing Purchasing Managers Index (PMI) data on Tuesday, which is projected to remain steady at 59.2 in March. All eyes will be on the RBI interest rate decision and the US March Nonfarm Payrolls on Friday.
Daily digest market movers: Indian Rupee remains flat amid uncertainties
- India’s Prime Minister Narendra Modi said on Monday that the RBI must prioritize the country's economic growth and also ensure the rupee is made more accessible and acceptable globally. ”
- India's GDP will be the fastest expanding among the G-20 countries by 2024. In the previous three quarters, India's GDP grew by 7.8% in Q1, 7.6% in Q2, and 8.4% in Q3.
- The US ISM Manufacturing PMI climbed to 50.3 in March from 47.8 in the previous reading, above the market consensus of 48.4. The reading registered the highest level since September 2022, with increased production and new orders,
- Investors have priced in nearly 61% odds of the Fed cutting rates by 25 basis points (bps) in June, up from 55.2 before the data release, according to the CME FedWatch Tool.
- Fed Chairman Jerome Powell said on Friday that recent US inflation data was in line with expectations and that the Fed's goal for the interest rate this year remained unchanged.
Technical analysis: USD/INR maintains a positive outlook in the longer term
Indian Rupee trades flat with mild losses on the day. USD/INR maintains a bullish bias in the longer term since the pair rose above a nearly four-month-old descending trend channel last week.
In the near term, USD/INR remains above the key 100-day Exponential Moving Average (EMA) on the daily timeframe. The upward momentum is supported by the 14-day Relative Strength Index, which lies above the 50 midline. This indicates more room for further upside.
A bullish break past a high of November 10, 2023, at 83.49 could spur a rally to an all-time high of 83.70 en route to 84.00 (psychological level). On the other hand, a break below the support level near a high of March 21 at 83.20 would sustain its bearish move to 83.00 (round mark, the 100-day EMA), followed by a low of March 14 at 82.80.
US Dollar price today
The table below shows the percentage change of US Dollar (USD) against listed major currencies today. US Dollar was the strongest against the Japanese Yen.
| USD | EUR | GBP | CAD | AUD | JPY | NZD | CHF | |
| USD | 0.04% | 0.01% | 0.00% | -0.06% | 0.08% | 0.05% | 0.01% | |
| EUR | -0.05% | -0.03% | -0.03% | -0.12% | 0.02% | 0.00% | 0.04% | |
| GBP | -0.03% | 0.03% | -0.01% | -0.09% | 0.04% | 0.02% | 0.00% | |
| CAD | -0.03% | 0.02% | 0.00% | 0.00% | 0.04% | 0.04% | 0.04% | |
| AUD | 0.06% | 0.10% | 0.09% | 0.01% | 0.14% | 0.13% | 0.15% | |
| JPY | -0.08% | -0.02% | -0.06% | -0.02% | -0.11% | -0.01% | 0.02% | |
| NZD | -0.06% | -0.01% | -0.03% | -0.03% | -0.11% | 0.02% | -0.01% | |
| CHF | -0.09% | -0.05% | -0.06% | -0.06% | -0.15% | -0.02% | -0.02% |
The heat map shows percentage changes of major currencies against each other. The base currency is picked from the left column, while the quote currency is picked from the top row. For example, if you pick the Euro from the left column and move along the horizontal line to the Japanese Yen, the percentage change displayed in the box will represent EUR (base)/JPY (quote).
Indian Rupee FAQs
The Indian Rupee (INR) is one of the most sensitive currencies to external factors. The price of Crude Oil (the country is highly dependent on imported Oil), the value of the US Dollar – most trade is conducted in USD – and the level of foreign investment, are all influential. Direct intervention by the Reserve Bank of India (RBI) in FX markets to keep the exchange rate stable, as well as the level of interest rates set by the RBI, are further major influencing factors on the Rupee.
The Reserve Bank of India (RBI) actively intervenes in forex markets to maintain a stable exchange rate, to help facilitate trade. In addition, the RBI tries to maintain the inflation rate at its 4% target by adjusting interest rates. Higher interest rates usually strengthen the Rupee. This is due to the role of the ‘carry trade’ in which investors borrow in countries with lower interest rates so as to place their money in countries’ offering relatively higher interest rates and profit from the difference.
Macroeconomic factors that influence the value of the Rupee include inflation, interest rates, the economic growth rate (GDP), the balance of trade, and inflows from foreign investment. A higher growth rate can lead to more overseas investment, pushing up demand for the Rupee. A less negative balance of trade will eventually lead to a stronger Rupee. Higher interest rates, especially real rates (interest rates less inflation) are also positive for the Rupee. A risk-on environment can lead to greater inflows of Foreign Direct and Indirect Investment (FDI and FII), which also benefit the Rupee.
Higher inflation, particularly, if it is comparatively higher than India’s peers, is generally negative for the currency as it reflects devaluation through oversupply. Inflation also increases the cost of exports, leading to more Rupees being sold to purchase foreign imports, which is Rupee-negative. At the same time, higher inflation usually leads to the Reserve Bank of India (RBI) raising interest rates and this can be positive for the Rupee, due to increased demand from international investors. The opposite effect is true of lower inflation.
- NZD/USD remains on the defensive near its lowest level since November amid a bullish USD.
- Reduced bets for a June Fed rate cut and the risk-off mood lifts the USD to a multi-week top.
- Traders now look to the US macro data and speeches by Fed officials for short-term impetus.
The NZD/USD pair oscillates in a narrow trading band during the Asian session on Tuesday and consolidates its recent losses to the lowest level since November 14 touched the previous day. Spot prices hold steady around mid-0.5900s and seem vulnerable to prolonging a multi-week-old descending trend.
The US Dollar (USD) stands tall near its highest level since February 2024 touched in the aftermath of the upbeat US data on Monday, showing that the manufacturing sector registered growth in March for the first time since September 2022. The US ISM Manufacturing PMI increased to 50.3 in March from 47.8 in the previous month to end 16 straight months of contraction. This forced investors to trim their bets that the Federal Reserve (Fed) will start cutting interest rates in June, triggering a fresh leg up in the US Treasury bond yields and underpinning the buck.
In fact, the yield on the rate-sensitive two-year and the benchmark 10-year US government bonds climbed to a two-week peak, which, along with the risk-off impulse, should benefit the safe-haven Greenback and drive flows away from the risk-sensitive Kiwi. The NZD/USD pair, meanwhile, fails to gain any respite from the Reserve Bank of New Zealand (RBNZ) Governor Adrian Orr's comments, saying that the MPC remains laser-focused on its job to control inflation. Orr added that the central bank is on track to getting inflation back into the target band.
Market participants now look to the US economic docket – featuring the release of JOLTS Job Openings and Factory Orders – for some impetus later during the early North American session. This, along with speeches by influential FOMC members, the US bond yields and the broader risk sentiment, might influence the USD price dynamics and produce short-term opportunities around the NZD/USD pair. Nevertheless, the aforementioned fundamental backdrop favours bearish traders and suggests that the path of least resistance for spot prices is to the downside.
- The Japanese Yen fails to lure buyers despite intervention fears and the risk-off impulse.
- The BoJ’s cautious outlook continues to undermine the JPY and lend support to USD/JPY.
- Reduced bets for a June Fed rate cut lift the USD to a multi-week top and act as a tailwind.
The Japanese Yen (JPY) struggles to capitalize on a modest uptick against its American counterpart during the Asian session on Tuesday and remains well within the striking distance of a multi-decade low touched last week. Japanese government officials continued with their jawboning to defend the domestic currency, which, along with the risk-off impulse, turn out to be key factors offering some support to the safe-haven JPY. That said, the Bank of Japan's (BoJ) dovish outlook, saying that monetary policy will remain easy for some time, holds back the JPY bulls from placing aggressive bets and keeps a lid on any meaningful upside.
The US Dollar (USD), on the other hand, stands tall near its highest level since February 2024 touched in the aftermath of the upbeat US data on Monday. In fact, the Institute for Supply Management (ISM) reported that the US manufacturing sector registered growth in March for the first time since September 2022. This overshadows the US PCE Price Index on Friday, which indicated a moderate rise in inflation during February, and forces investors to trim their bets for a June rate cut by the Federal Reserve (Fed). This acts as a tailwind for the buck and suggests that the path of least resistance for the USD/JPY pair is to the upside.
Daily Digest Market Movers: Japanese Yen bulls remain on the sidelines despite intervention warnings and risk-off
- Speculations that Japanese authorities will intervene in the markets to prop up the domestic currency lend some support to the Japanese Yen, though the Bank of Japan's cautious outlook keeps a lid on any meaningful gains.
- Japan's Finance Minister Shunichi Suzuki reiterated his warning on the recent rapid JPY moves and said on Monday that he would respond appropriately and would not rule out options against excessive volatility.
- Reports that Israeli warplanes bombed Iran's embassy in Syria raise the risk of a further escalation of geopolitical tensions in the Middle East, tempering investors' appetite for riskier assets and benefitting the safe-haven JPY.
- Investors lowered their bets that the Federal Reserve will cut rates in June after the Institute for Supply Management reported that the US manufacturing sector expanded in March to end 16 straight months of contraction.
- The yield on the rate-sensitive two-year and the benchmark 10-year US government bonds climbed to a two-week peak after the upbeat data, pushing the US Dollar to a seven-week top and lending support to the USD/JPY pair.
- Traders now look to the US economic docket – featuring the release of JOLTS Job Openings and Factory Orders – and speeches by influential FOMC members for some meaningful impetus later during the North American session.
Technical Analysis: USD/JPY seems poised to challenge multi-decade high near 152.00 and appreciate further
From a technical perspective, the range-bound price action witnessed over the past two weeks or so might still be categorized as a bullish consolidation phase on the back of a strong rally from the March swing low. Moreover, oscillators on the daily chart are holding in the positive territory and are still far from being in the overbought zone. This, in turn, validates the near-term positive outlook for the USD/JPY pair. That said, it will still be prudent to wait for a move beyond a multi-decade high, around the 152.00 mark set last week, before positioning for any further appreciating move.
On the flip side, a slide back towards the 151.00 round figure might now be seen as a buying opportunity and remain limited near the 150.85-150.80 horizontal resistance breakpoint. Some follow-through selling, however, could expose the next relevant support near the 150.25 area. This is closely followed by the 150.00 psychological mark, which if broken decisively might turn the USD/JPY pair vulnerable to accelerate the corrective decline further towards the 149.35-149.30 region before eventually dropping to the 149.00 mark.
Japanese Yen FAQs
The Japanese Yen (JPY) is one of the world’s most traded currencies. Its value is broadly determined by the performance of the Japanese economy, but more specifically by the Bank of Japan’s policy, the differential between Japanese and US bond yields, or risk sentiment among traders, among other factors.
One of the Bank of Japan’s mandates is currency control, so its moves are key for the Yen. The BoJ has directly intervened in currency markets sometimes, generally to lower the value of the Yen, although it refrains from doing it often due to political concerns of its main trading partners. The current BoJ ultra-loose monetary policy, based on massive stimulus to the economy, has caused the Yen to depreciate against its main currency peers. This process has exacerbated more recently due to an increasing policy divergence between the Bank of Japan and other main central banks, which have opted to increase interest rates sharply to fight decades-high levels of inflation.
The BoJ’s stance of sticking to ultra-loose monetary policy has led to a widening policy divergence with other central banks, particularly with the US Federal Reserve. This supports a widening of the differential between the 10-year US and Japanese bonds, which favors the US Dollar against the Japanese Yen.
The Japanese Yen is often seen as a safe-haven investment. This means that in times of market stress, investors are more likely to put their money in the Japanese currency due to its supposed reliability and stability. Turbulent times are likely to strengthen the Yen’s value against other currencies seen as more risky to invest in.
- Australian Dollar retraces its recent losses amid a stronger US Dollar.
- RBA minutes revealed that the board did not consider the possibility of increasing interest rates.
- US ISM Manufacturing PMI rose to 50.3 in March, reaching its highest level since September 2022.
The Australian Dollar (AUD) recovers its losses registered in the previous session, edging higher on Tuesday. The US Dollar (USD) received a boost as US Treasury bond yields surged overnight due to the positive ISM Manufacturing PMI data from the United States (US). This development created headwinds for the AUD/USD pair. The Reserve Bank of Australia (RBA) March meeting minutes revealed that the central bank did not entertain the possibility of raising interest rates.
The Reserve Bank of Australia is expected to maintain the current cash rate until at least November due to inflation rates persisting higher than those in other countries, coupled with a tight job market. Despite concerns over potential fluctuations in inflation, experts suggest that this trajectory is unlikely to prevent the RBA from eventually implementing monetary policy easing measures.
The US Dollar Index (DXY) continues its winning streak for the fifth successive session. This trend is attributed to traders reducing their expectations for a quarter-point interest rate cut by the Federal Reserve in its June meeting. Nevertheless, Federal Reserve Chairman Jerome Powell indicated on Friday that recent US inflation data is in line with the anticipated path, reinforcing the Fed's position on interest rate adjustments for the year.
Daily Digest Market Movers: Australian Dollar depreciates after stronger US ISM data
- Australia’s TD Securities Inflation (YoY) came in at 3.8% in March, against the previous increase of 4.0%.
- Melbourne Institute's Monthly Inflation Gauge increased by 0.1% in March, following a decrease of 0.1% in the previous month.
- ANZ Job Advertisements declined by 1.0% in March, compared to the previous decline of 2.1%.
- RBA March minutes showed that the board did not contemplate the option of raising interest rates. They unanimously agreed that it was challenging to definitively predict future changes in the cash rate. While the economic outlook remained uncertain, the risks appeared to be generally balanced. The board acknowledged that it would require "some time" before they could express confidence in inflation returning to the target level.
- According to Rodrigo Catril from NAB, the Reserve Bank is likely to face difficulties in declaring victory on inflation and might postpone rate cuts until 2025.
- On Monday, China's Caixin Manufacturing PMI came in at 51.1, against the expected 51.0 and 50.9 prior.
- China's National Bureau of Statistics (NBS) announced on Sunday that the monthly NBS Manufacturing PMI rose to 50.8 in March from 49.1 in the prior month. Additionally, the NBS Non-Manufacturing PMI increased to 53.0 in March from 51.4 in February.
- On Thursday, San Francisco Federal Reserve (Fed) President Mary C. Daly emphasized that although the Fed stands prepared to decrease rates when data supports such action, there's no need for haste as the US economy remains robust with minimal risk of weakening.
- US ISM Manufacturing PMI indicated a surprise expansion in March, as the index climbed to 50.3 in March from February's 47.8, surpassing expectations of 48.4. This reading marked the highest level observed since September 2022.
- US ISM Manufacturing Prices Paid increased to 55.8 in March, compared to the expected 52.6 and 52.5 prior.
- US Core PCE came at 0.3% (MoM) in February against January’s 0.5%, aligned with the market consensus. The annual index rose by 2.8% as expected, compared to the previous increase of 2.9%.
- US Headline PCE (MoM) increased by 0.3%, slightly lower than expected and a previous rise of 0.4%. The year-over-year PCE increased by 2.5%, as expected.
Technical Analysis: Australian Dollar moves below the psychological level of 0.6500
The Australian Dollar trades near 0.6490 on Tuesday. The immediate support appears at March’s low at 0.6477, followed by the major level of 0.6450. A break below this level could prompt the AUD/USD pair to navigate the region around the psychological mark of 0.6400. On the upside, Immediate resistance appears at the psychological level of 0.6500. A breakthrough above the latter could lead the AUD/USD pair to reach the 23.6% Fibonacci retracement level of 0.6528 and the 21-day Exponential Moving Average (EMA) at 0.6537, followed by the major resistance level of 0.6550.
AUD/USD: Daily Chart
Australian Dollar price today
The table below shows the percentage change of the Australian Dollar (AUD) against listed major currencies today. The Australian Dollar was the weakest against the Canadian Dollar.
| USD | EUR | GBP | CAD | AUD | JPY | NZD | CHF | |
| USD | 0.01% | 0.01% | 0.00% | -0.09% | 0.10% | -0.04% | 0.04% | |
| EUR | -0.01% | -0.01% | -0.03% | -0.11% | 0.08% | -0.03% | 0.03% | |
| GBP | -0.01% | 0.00% | -0.02% | -0.08% | 0.01% | 0.03% | 0.00% | |
| CAD | 0.01% | 0.01% | 0.02% | 0.00% | 0.11% | 0.00% | 0.04% | |
| AUD | 0.09% | 0.09% | 0.09% | 0.01% | 0.02% | 0.09% | 0.08% | |
| JPY | -0.10% | -0.01% | 0.00% | -0.10% | -0.18% | -0.11% | 0.01% | |
| NZD | 0.01% | -0.01% | -0.02% | -0.04% | -0.01% | 0.11% | -0.01% | |
| CHF | -0.04% | 0.00% | -0.05% | -0.06% | -0.10% | 0.05% | -0.05% |
The heat map shows percentage changes of major currencies against each other. The base currency is picked from the left column, while the quote currency is picked from the top row. For example, if you pick the Euro from the left column and move along the horizontal line to the Japanese Yen, the percentage change displayed in the box will represent EUR (base)/JPY (quote).
Australian Dollar FAQs
One of the most significant factors for the Australian Dollar (AUD) is the level of interest rates set by the Reserve Bank of Australia (RBA). Because Australia is a resource-rich country another key driver is the price of its biggest export, Iron Ore. The health of the Chinese economy, its largest trading partner, is a factor, as well as inflation in Australia, its growth rate, and Trade Balance. Market sentiment – whether investors are taking on more risky assets (risk-on) or seeking safe havens (risk-off) – is also a factor, with risk-on positive for AUD.
The Reserve Bank of Australia (RBA) influences the Australian Dollar (AUD) by setting the level of interest rates that Australian banks can lend to each other. This influences the level of interest rates in the economy as a whole. The main goal of the RBA is to maintain a stable inflation rate of 2-3% by adjusting interest rates up or down. Relatively high interest rates compared to other major central banks support the AUD, and the opposite for relatively low. The RBA can also use quantitative easing and tightening to influence credit conditions, with the former AUD-negative and the latter AUD-positive.
China is Australia’s largest trading partner so the health of the Chinese economy is a major influence on the value of the Australian Dollar (AUD). When the Chinese economy is doing well it purchases more raw materials, goods and services from Australia, lifting demand for the AUD, and pushing up its value. The opposite is the case when the Chinese economy is not growing as fast as expected. Positive or negative surprises in Chinese growth data, therefore, often have a direct impact on the Australian Dollar and its pairs.
Iron Ore is Australia’s largest export, accounting for $118 billion a year according to data from 2021, with China as its primary destination. The price of Iron Ore, therefore, can be a driver of the Australian Dollar. Generally, if the price of Iron Ore rises, AUD also goes up, as aggregate demand for the currency increases. The opposite is the case if the price of Iron Ore falls. Higher Iron Ore prices also tend to result in a greater likelihood of a positive Trade Balance for Australia, which is also positive for the AUD.
The Trade Balance, which is the difference between what a country earns from its exports versus what it pays for its imports, is another factor that can influence the value of the Australian Dollar. If Australia produces highly sought-after exports, then its currency will gain in value purely from the surplus demand created by foreign buyers seeking to purchase its exports versus what it spends to purchase imports. Therefore, a positive net Trade Balance strengthens the AUD, with the opposite effect if the Trade Balance is negative.
The People’s Bank of China (PBoC) set the USD/CNY central rate for the trading session ahead on Tuesday at 7.0957 as compared to the previous day's fix of 7.0938 and 7.2433 Reuters estimates.
The Reserve Bank of Australia (RBA) published the Minutes of its March monetary policy meeting on Tuesday, highlighting that the Board members did not consider the option for an interest rate rise. Additional details of the RBA Minutes suggest that it was difficult to either rule in or out future changes in the cash rate.
Key takeaways
“No mention in minutes that board considered option to raise rates.”
“Board agreed it was difficult to either rule in or out future changes in cash rate.”
“Economic outlook uncertain but risks seemed broadly balanced.”
“Would take "some time" before board could be confident inflation returning to target.”
“Upside risks to inflation had not yet materialised, while consumption was very weak.”
“Inflation high but gradually returning toward target, labour market easing.”
“Gap between demand and supply in economy "closing relatively quickly”.”
“Board judged demand would continue to exceed supply for a time
Labour market a little tighter than consistent with inflation at target.”
“Wage growth may have peaked, but not expected to decline quickly.”
“Recovery in productivity needed to balance high unit labour “costs.”
Overall financial conditions remained restrictive, particularly for households.”
Market reaction
At the time of writing, the AUD/USD pair is trading near 0.6488, holding lower while losing 0.01% on the day.
Australian Dollar FAQs
One of the most significant factors for the Australian Dollar (AUD) is the level of interest rates set by the Reserve Bank of Australia (RBA). Because Australia is a resource-rich country another key driver is the price of its biggest export, Iron Ore. The health of the Chinese economy, its largest trading partner, is a factor, as well as inflation in Australia, its growth rate and Trade Balance. Market sentiment – whether investors are taking on more risky assets (risk-on) or seeking safe-havens (risk-off) – is also a factor, with risk-on positive for AUD.
The Reserve Bank of Australia (RBA) influences the Australian Dollar (AUD) by setting the level of interest rates that Australian banks can lend to each other. This influences the level of interest rates in the economy as a whole. The main goal of the RBA is to maintain a stable inflation rate of 2-3% by adjusting interest rates up or down. Relatively high interest rates compared to other major central banks support the AUD, and the opposite for relatively low. The RBA can also use quantitative easing and tightening to influence credit conditions, with the former AUD-negative and the latter AUD-positive.
China is Australia’s largest trading partner so the health of the Chinese economy is a major influence on the value of the Australian Dollar (AUD). When the Chinese economy is doing well it purchases more raw materials, goods and services from Australia, lifting demand for the AUD, and pushing up its value. The opposite is the case when the Chinese economy is not growing as fast as expected. Positive or negative surprises in Chinese growth data, therefore, often have a direct impact on the Australian Dollar and its pairs.
Iron Ore is Australia’s largest export, accounting for $118 billion a year according to data from 2021, with China as its primary destination. The price of Iron Ore, therefore, can be a driver of the Australian Dollar. Generally, if the price of Iron Ore rises, AUD also goes up, as aggregate demand for the currency increases. The opposite is the case if the price of Iron Ore falls. Higher Iron Ore prices also tend to result in a greater likelihood of a positive Trade Balance for Australia, which is also positive of the AUD.
The Trade Balance, which is the difference between what a country earns from its exports versus what it pays for its imports, is another factor that can influence the value of the Australian Dollar. If Australia produces highly sought after exports, then its currency will gain in value purely from the surplus demand created from foreign buyers seeking to purchase its exports versus what it spends to purchase imports. Therefore, a positive net Trade Balance strengthens the AUD, with the opposite effect if the Trade Balance is negative.
Japanese Finance Minister Shunichi Suzuki offered some verbal intervention on Tuesday. Suzuki said that he will not rule out any steps to respond to disorderly moves and he will monitor foreign exchange moves with a high sense of urgency.
Key quotes
"Closely watching FX moves with a high sense of urgency.”
“Won't rule out any steps to respond to disorderly moves.”
“Important for currencies to move in a stable manner reflecting fundamentals, rapid FX moves are undesirable.”
“Declines to comment on FX intervention.”
“Won't comment when asked about specific means of how MOF may intervene in the FX market.”
“Various factors are behind FX moves, not just monetary policy.”
Market reaction
At the time of writing, USD/JPY is trading 0.01% lower on the day at 151.63.
Bank of Japan FAQs
The Bank of Japan (BoJ) is the Japanese central bank, which sets monetary policy in the country. Its mandate is to issue banknotes and carry out currency and monetary control to ensure price stability, which means an inflation target of around 2%.
The Bank of Japan has embarked in an ultra-loose monetary policy since 2013 in order to stimulate the economy and fuel inflation amid a low-inflationary environment. The bank’s policy is based on Quantitative and Qualitative Easing (QQE), or printing notes to buy assets such as government or corporate bonds to provide liquidity. In 2016, the bank doubled down on its strategy and further loosened policy by first introducing negative interest rates and then directly controlling the yield of its 10-year government bonds.
The Bank’s massive stimulus has caused the Yen to depreciate against its main currency peers. This process has exacerbated more recently due to an increasing policy divergence between the Bank of Japan and other main central banks, which have opted to increase interest rates sharply to fight decades-high levels of inflation. The BoJ’s policy of holding down rates has led to a widening differential with other currencies, dragging down the value of the Yen.
A weaker Yen and the spike in global energy prices have led to an increase in Japanese inflation, which has exceeded the BoJ’s 2% target. Still, the Bank judges that the sustainable and stable achievement of the 2% target has not yet come in sight, so any sudden change in the current policy looks unlikely.
The Reserve Bank of New Zealand (RBNZ) Governor Adrian Orr said on Tuesday that the central bank remains laser-focused on its job to control inflation. Orr further stated that the central bank is on track to get inflation back into the target band.
Key quotes
“The MPC remains laser-focused on its job to control inflation and Carl and Prasanna will play an important part in our discussions.”
"We're now in a much happier space, where most central banks feel we're back on top of inflation, not there yet."
"But inflation expectations have been the big concern, the more people think inflation will rise next year, the more inflation will rise next year."
"We are on track to getting inflation back into the target band.”
Market reaction
The NZD/USD pair is trading lower by 0.05% on the day to trade at 0.5951, as of writing.
RBNZ FAQs
The Reserve Bank of New Zealand (RBNZ) is the country’s central bank. Its economic objectives are achieving and maintaining price stability – achieved when inflation, measured by the Consumer Price Index (CPI), falls within the band of between 1% and 3% – and supporting maximum sustainable employment.
The Reserve Bank of New Zealand’s (RBNZ) Monetary Policy Committee (MPC) decides the appropriate level of the Official Cash Rate (OCR) according to its objectives. When inflation is above target, the bank will attempt to tame it by raising its key OCR, making it more expensive for households and businesses to borrow money and thus cooling the economy. Higher interest rates are generally positive for the New Zealand Dollar (NZD) as they lead to higher yields, making the country a more attractive place for investors. On the contrary, lower interest rates tend to weaken NZD.
Employment is important for the Reserve Bank of New Zealand (RBNZ) because a tight labor market can fuel inflation. The RBNZ’s goal of “maximum sustainable employment” is defined as the highest use of labor resources that can be sustained over time without creating an acceleration in inflation. “When employment is at its maximum sustainable level, there will be low and stable inflation. However, if employment is above the maximum sustainable level for too long, it will eventually cause prices to rise more and more quickly, requiring the MPC to raise interest rates to keep inflation under control,” the bank says.
In extreme situations, the Reserve Bank of New Zealand (RBNZ) can enact a monetary policy tool called Quantitative Easing. QE is the process by which the RBNZ prints local currency and uses it to buy assets – usually government or corporate bonds – from banks and other financial institutions with the aim to increase the domestic money supply and spur economic activity. QE usually results in a weaker New Zealand Dollar (NZD). QE is a last resort when simply lowering interest rates is unlikely to achieve the objectives of the central bank. The RBNZ used it during the Covid-19 pandemic.
- EUR/USD trades on a weaker note for the fourth consecutive day near 1.0730 on Tuesday.
- The US Manufacturing PMI climbed to 50.3 in March against 47.8 in the previous reading, better than expected.
- ECB’s Stournaras said it could cut rates by a total of 100 basis points this year.
The EUR/USD pair remains under selling pressure, reaching nearly weekly lows of 1.0730 on Tuesday during the early Asian trading hours. The uptick of the US Dollar Index (DXY) above the 105.00 mark and higher US Treasury bond yields weigh on the major pair. Many Federal Reserve (Fed) officials, including Michelle Bowman, Loretta Mester, John Williams, and Mary Daly are set to speak later on Tuesday.
The US manufacturing activity in March has entered an expansion phase for the first time in nearly 18 months with increased production and new orders, according to the Institute for Supply Management (ISM) on Monday. The Manufacturing PMI climbed to 50.3 in March from 47.8 in the previous reading, above the market consensus of 48.4. The US Dollar gains traction following the upbeat US Manufacturing PMI. Investors have priced in nearly 61% odds of the Fed cutting rates by 25 basis points (bps) in June, up from 55.2 before the data release, according to the CME FedWatch Tool.
Across the pond, the European Central Bank (ECB) Governing Council member Robert Holzmann said on Saturday that the central bank could lower its key interest rate before the US Fed. Additionally, the ECB policymaker Yannis Stournaras stated that the ECB could possibly cut rates by a total of 100 basis points this year, but there is still no consensus on that. Stournaras said last week that the central had no reason to wait for the Fed to cut rates first. The dovish comments from the ECB policymakers exert some selling pressure on the Euro (EUR) and act as a headwind for the EUR/USD pair.
Market players will watch the HCOB manufacturing PMI for Spain, Italy, France, Germany, and the Eurozone. The preliminary Eurozone Harmonized Index of Consumer Prices (HICP) for March will be closely watched by traders on Wednesday. On Friday, attention will shift to US Nonfarm Payrolls.
| Pare | Closed | Change, % |
|---|---|---|
| AUDUSD | 0.64886 | -0.71 |
| EURJPY | 162.901 | -0.24 |
| EURUSD | 1.07436 | -0.48 |
| GBPJPY | 190.305 | -0.46 |
| GBPUSD | 1.25492 | -0.71 |
| NZDUSD | 0.59534 | -0.58 |
| USDCAD | 1.35705 | 0.37 |
| USDCHF | 0.90403 | 0.36 |
| USDJPY | 151.645 | 0.26 |


© 2000-2026. All rights reserved.
This site is managed by Teletrade D.J. LLC 2351 LLC 2022 (Euro House, Richmond Hill Road, Kingstown, VC0100, St. Vincent and the Grenadines).
The information on this website is for informational purposes only and does not constitute any investment advice.
The company does not serve or provide services to customers who are residents of the US, Canada, Iran, The Democratic People's Republic of Korea, Yemen and FATF blacklisted countries.
Making transactions on financial markets with marginal financial instruments opens up wide possibilities and allows investors who are willing to take risks to earn high profits, carrying a potentially high risk of losses at the same time. Therefore you should responsibly approach the issue of choosing the appropriate investment strategy, taking the available resources into account, before starting trading.
Use of the information: full or partial use of materials from this website must always be referenced to TeleTrade as the source of information. Use of the materials on the Internet must be accompanied by a hyperlink to teletrade.org. Automatic import of materials and information from this website is prohibited.
Please contact our PR department if you have any questions or need assistance at pr@teletrade.global.
transfers