- Analytics
- News and Tools
- Market News
Analytics, News, and Forecasts for CFD Markets: currency news — 03-04-2024.
- AUD/USD edges up, buoyed by Fed's rate talk and mixed US data.
- Fed's data-focused rate policy, strong US job market, and services data are headwinds for the US Dollar.
- Australia's services sector gains boost AUD amid global economic uncertainties.
The Aussie Dollar posted solid gains against the US Dollar on Wednesday, boosted by falling US Treasury yields and a soft US Dollar. Federal Reserve policymakers grabbed the headlines, while US economic data was mixed, with a strong ADP report but softer PMIs. The AUD/USD trades at 0.6565, posting minimal gains of 0.02% early during Thursday’s Asian session.
AUD/USD sees slight uptick as dovish Federal Reserve remarks and uneven US data fuel optimism in Forex markets.
On Wednesday, the market was attentive to the remarks of Fed Chair Jerome Powell, who reiterated the US central bank's readiness to cut rates, albeit with a data-dependent approach. Atlanta Fed President Raphael Bostic's statement, supporting a rate cut in the last quarter of 2024, also drew significant attention.
Lately, Adriana Kugler, one of the newest Fed Governors appointed to the board, stated that the disinflation process would continue, and that would warrant lowering rates at least three times toward the last quarter of 2024.
The Aussie Dollar also benefited from an upbeat market mood as Wall Street snapped two days of losses. US Treasury yields finished flat, a headwind for the American currency. The US Dollar Index (DXY) tumbles more than 0.50%, down to 104.22.
Elsewhere, the March ADP report revealed that private hiring increased by 184K, exceeding estimates and forecasts. In the meantime, the US S&P Global and the ISM Services PMIs, were a touch softer.
In the meantime, Aussie’s data revealed the Judo Bank Services PMI improved from 53.5 in February to 54.4 in March. The report highlighted “This is the fourth consecutive month of improvement, with the services output index increasing by 8.4 points, the largest gain in the series outside of recovery from lockdowns.”
AUD/USD Price Analysis: Technical outlook
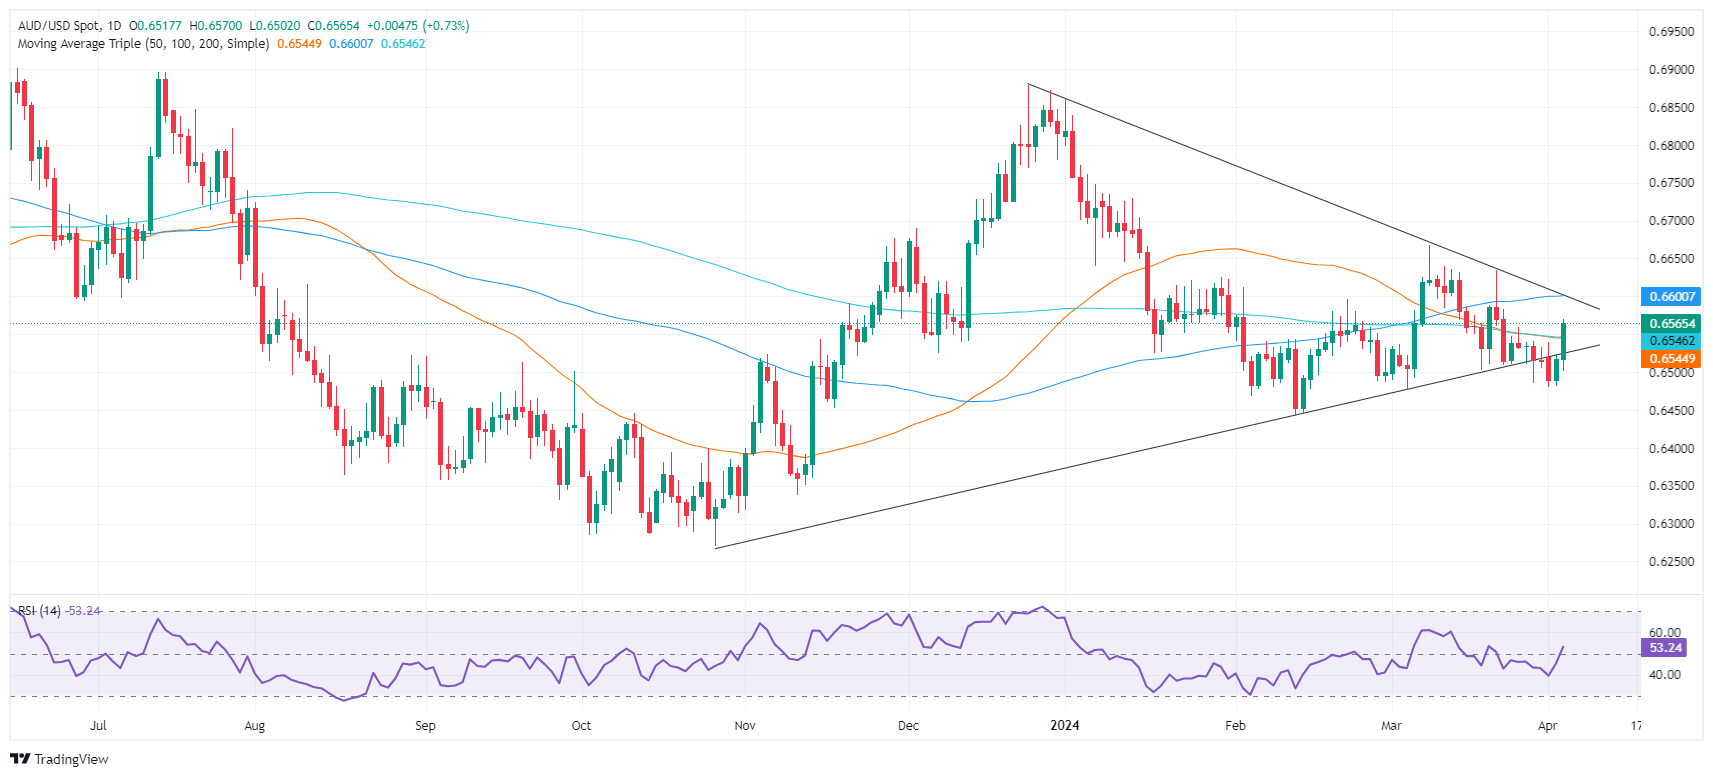
From a technical perspective, the AUD/USD shifted to a neutral-upward bias. A ‘bullish harami’ candlestick chart pattern, followed by Wednesday’s large candle breaching the 200-day moving average (DMA) at 0.6543, could pave the way to challenge the 100-DMA at 0.6597, ahead of the 0.6600 mark. The momentum has shifted in favor of the bulls, as the Relative Strength Index (RSI) turned bullish and aims higher.
On the other hand, a drop below the 200-DMA could expose the 0.6500 figure.
Australian Dollar FAQs
One of the most significant factors for the Australian Dollar (AUD) is the level of interest rates set by the Reserve Bank of Australia (RBA). Because Australia is a resource-rich country another key driver is the price of its biggest export, Iron Ore. The health of the Chinese economy, its largest trading partner, is a factor, as well as inflation in Australia, its growth rate and Trade Balance. Market sentiment – whether investors are taking on more risky assets (risk-on) or seeking safe-havens (risk-off) – is also a factor, with risk-on positive for AUD.
The Reserve Bank of Australia (RBA) influences the Australian Dollar (AUD) by setting the level of interest rates that Australian banks can lend to each other. This influences the level of interest rates in the economy as a whole. The main goal of the RBA is to maintain a stable inflation rate of 2-3% by adjusting interest rates up or down. Relatively high interest rates compared to other major central banks support the AUD, and the opposite for relatively low. The RBA can also use quantitative easing and tightening to influence credit conditions, with the former AUD-negative and the latter AUD-positive.
China is Australia’s largest trading partner so the health of the Chinese economy is a major influence on the value of the Australian Dollar (AUD). When the Chinese economy is doing well it purchases more raw materials, goods and services from Australia, lifting demand for the AUD, and pushing up its value. The opposite is the case when the Chinese economy is not growing as fast as expected. Positive or negative surprises in Chinese growth data, therefore, often have a direct impact on the Australian Dollar and its pairs.
Iron Ore is Australia’s largest export, accounting for $118 billion a year according to data from 2021, with China as its primary destination. The price of Iron Ore, therefore, can be a driver of the Australian Dollar. Generally, if the price of Iron Ore rises, AUD also goes up, as aggregate demand for the currency increases. The opposite is the case if the price of Iron Ore falls. Higher Iron Ore prices also tend to result in a greater likelihood of a positive Trade Balance for Australia, which is also positive of the AUD.
The Trade Balance, which is the difference between what a country earns from its exports versus what it pays for its imports, is another factor that can influence the value of the Australian Dollar. If Australia produces highly sought after exports, then its currency will gain in value purely from the surplus demand created from foreign buyers seeking to purchase its exports versus what it spends to purchase imports. Therefore, a positive net Trade Balance strengthens the AUD, with the opposite effect if the Trade Balance is negative.
Federal Reserve (Fed) Governor Adriana Kugler said on Wednesday that she believes inflation will continue to fall this year and pave the way for the central bank to cut interest rates, per Reuters
Key quotes
“My policy rate expectation is consistent with March FOMC meeting policymaker projections.”
“If disinflation and labor market conditions proceed as I am currently expecting, then some lowering of the policy rate this year would be appropriate.”
“Expect the disinflationary trend to continue.”
“Policy is currently restrictive, and my baseline expectation is that disinflation will continue without a broad economic slowdown.”
“Such an outcome is not assured.”
“Inflation progress has sometimes been bumpy.”
“Annual core PCE at 2.8% represents 'considerable progress' but is still 'meaningfully above' Fed's 2% target.”
“Data on new tenant rent agreements suggest that housing inflation broadly will continue to cool.”
“Continued disinflation will indeed require further progress in housing and non-housing services.”
“Labor market has moved into better balance.”
“Suspect strong population growth 'helps resolve the puzzle' of labor market growth and strong consumption even as inflation eases.”
“Important that wage growth be consistent with 2% inflation over time; US is moving back toward that kind of wage growth.”
“Anchored inflation expectations are evident in consumer and business surveys.”
“Expect consumption growth to slow some this year.”
“Consumer spending was soft in January and February, suggesting we are on track for lower consumption growth in q1 vs second half of 2023.”
“Expect GDP growth this year to be solid but slower than 2023 pace of 3.1%.”
“My baseline expectation is that further disinflation can be accomplished without a significant rise in unemployment.”
“Appears supply networks are adapting to port of Baltimore disruption.”
“New businesses are creating a lot of new jobs.”
“Around 150,000 jobs a month have come from new businesses.”
Market reaction
At the press time, the US Dollar Index (DXY) was down 0.01% on the day to trade at 104.23.
Fed FAQs
Monetary policy in the US is shaped by the Federal Reserve (Fed). The Fed has two mandates: to achieve price stability and foster full employment. Its primary tool to achieve these goals is by adjusting interest rates. When prices are rising too quickly and inflation is above the Fed’s 2% target, it raises interest rates, increasing borrowing costs throughout the economy. This results in a stronger US Dollar (USD) as it makes the US a more attractive place for international investors to park their money. When inflation falls below 2% or the Unemployment Rate is too high, the Fed may lower interest rates to encourage borrowing, which weighs on the Greenback.
The Federal Reserve (Fed) holds eight policy meetings a year, where the Federal Open Market Committee (FOMC) assesses economic conditions and makes monetary policy decisions. The FOMC is attended by twelve Fed officials – the seven members of the Board of Governors, the president of the Federal Reserve Bank of New York, and four of the remaining eleven regional Reserve Bank presidents, who serve one-year terms on a rotating basis.
In extreme situations, the Federal Reserve may resort to a policy named Quantitative Easing (QE). QE is the process by which the Fed substantially increases the flow of credit in a stuck financial system. It is a non-standard policy measure used during crises or when inflation is extremely low. It was the Fed’s weapon of choice during the Great Financial Crisis in 2008. It involves the Fed printing more Dollars and using them to buy high grade bonds from financial institutions. QE usually weakens the US Dollar.
Quantitative tightening (QT) is the reverse process of QE, whereby the Federal Reserve stops buying bonds from financial institutions and does not reinvest the principal from the bonds it holds maturing, to purchase new bonds. It is usually positive for the value of the US Dollar.
The final reading of Australia's Judo Bank Services Purchasing Managers Index (PMI) improved to 54.4 in March from the previous reading of 53.5, the latest data published by Judo Bank and S&P Global showed on Thursday.
The Judo Bank Australian Composite PMI rose to 53.3 in March versus 52.4 in the previous reading.
Additional takeaways
“Output index rising to a new cyclical high of 54.4. This is the fourth consecutive month of improvement, with the services output index increasing by 8.4 points, the largest gain in the series outside of recovery from lockdowns.”
“Services output index is now above its long-run average level of 51.7.”
“March 2024 reading is the highest since April 2022, when the monetary policy tightening cycle commenced.”
“Outstanding Business Index rose to its highest level since the Reserve Bank of Australia started raising interest rates in May 2022.”
“Other activity indicators in the survey were down slightly in March, but remained well above the neutral 50 index level.”
“Cost pressures remain elevated, although there are some signs of a gradual easing over the past six months.”
“Input price index fell slightly to 61.5, the lowest since 2021, but not much lower than the average reading of 62.8 seen through the second half of 2023.”
“Prices Charged Index remained unchanged at 55.0 in March, a little higher than the average over the past quarter and broadly in line with index readings of the past year.”
Market reaction
At the press time, the AUD/USD pair was up 0.01% on the day to trade at 0.6565.
Australian Dollar FAQs
One of the most significant factors for the Australian Dollar (AUD) is the level of interest rates set by the Reserve Bank of Australia (RBA). Because Australia is a resource-rich country another key driver is the price of its biggest export, Iron Ore. The health of the Chinese economy, its largest trading partner, is a factor, as well as inflation in Australia, its growth rate and Trade Balance. Market sentiment – whether investors are taking on more risky assets (risk-on) or seeking safe-havens (risk-off) – is also a factor, with risk-on positive for AUD.
The Reserve Bank of Australia (RBA) influences the Australian Dollar (AUD) by setting the level of interest rates that Australian banks can lend to each other. This influences the level of interest rates in the economy as a whole. The main goal of the RBA is to maintain a stable inflation rate of 2-3% by adjusting interest rates up or down. Relatively high interest rates compared to other major central banks support the AUD, and the opposite for relatively low. The RBA can also use quantitative easing and tightening to influence credit conditions, with the former AUD-negative and the latter AUD-positive.
China is Australia’s largest trading partner so the health of the Chinese economy is a major influence on the value of the Australian Dollar (AUD). When the Chinese economy is doing well it purchases more raw materials, goods and services from Australia, lifting demand for the AUD, and pushing up its value. The opposite is the case when the Chinese economy is not growing as fast as expected. Positive or negative surprises in Chinese growth data, therefore, often have a direct impact on the Australian Dollar and its pairs.
Iron Ore is Australia’s largest export, accounting for $118 billion a year according to data from 2021, with China as its primary destination. The price of Iron Ore, therefore, can be a driver of the Australian Dollar. Generally, if the price of Iron Ore rises, AUD also goes up, as aggregate demand for the currency increases. The opposite is the case if the price of Iron Ore falls. Higher Iron Ore prices also tend to result in a greater likelihood of a positive Trade Balance for Australia, which is also positive of the AUD.
The Trade Balance, which is the difference between what a country earns from its exports versus what it pays for its imports, is another factor that can influence the value of the Australian Dollar. If Australia produces highly sought after exports, then its currency will gain in value purely from the surplus demand created from foreign buyers seeking to purchase its exports versus what it spends to purchase imports. Therefore, a positive net Trade Balance strengthens the AUD, with the opposite effect if the Trade Balance is negative.
- The daily RSI recovered from near-oversold levels.
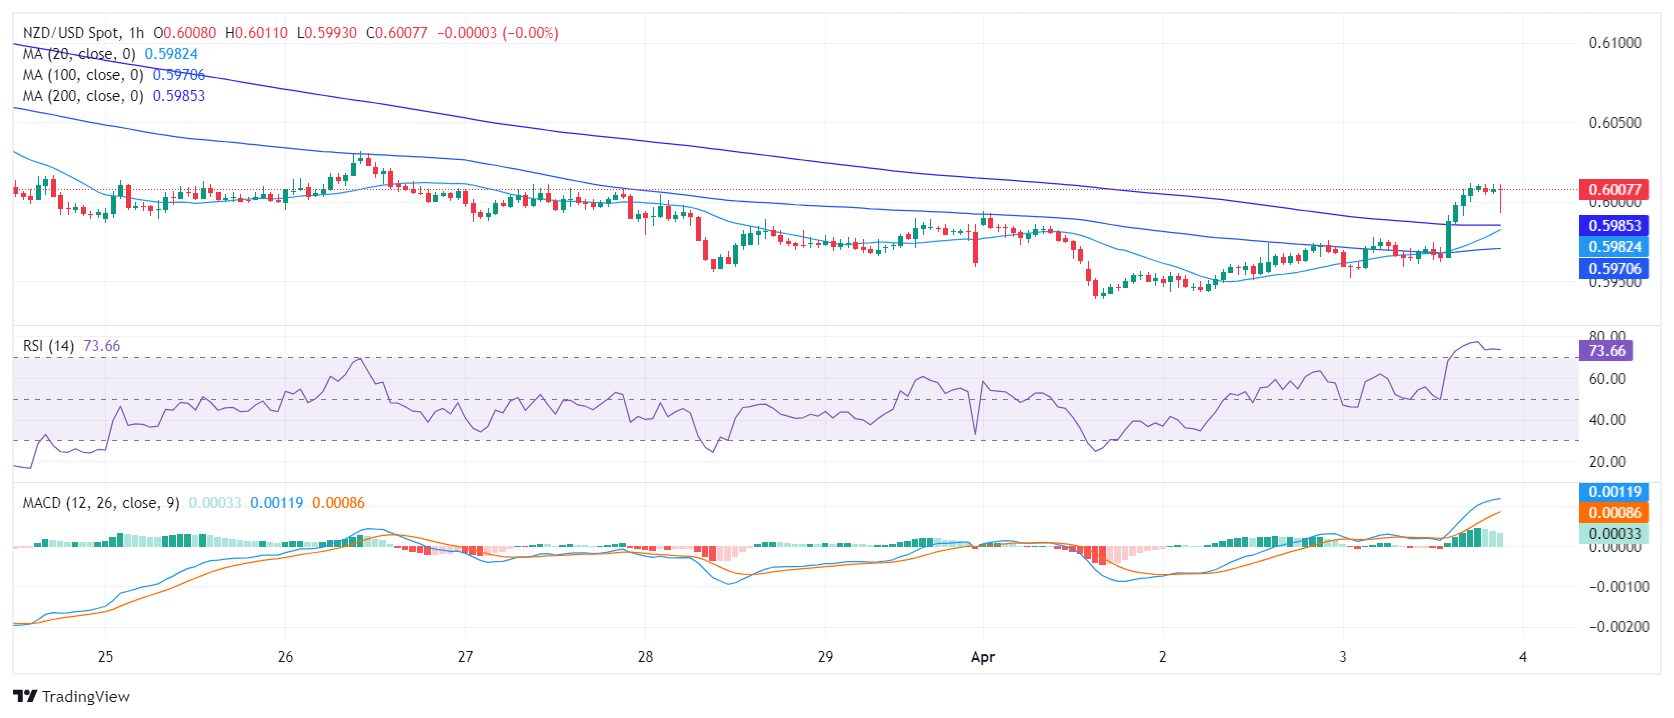
- The hourly chart indicators exhibited a sharp uptick with the RSI above 70.
- Buyers need to breach the key 20-day SMA for further ascents.
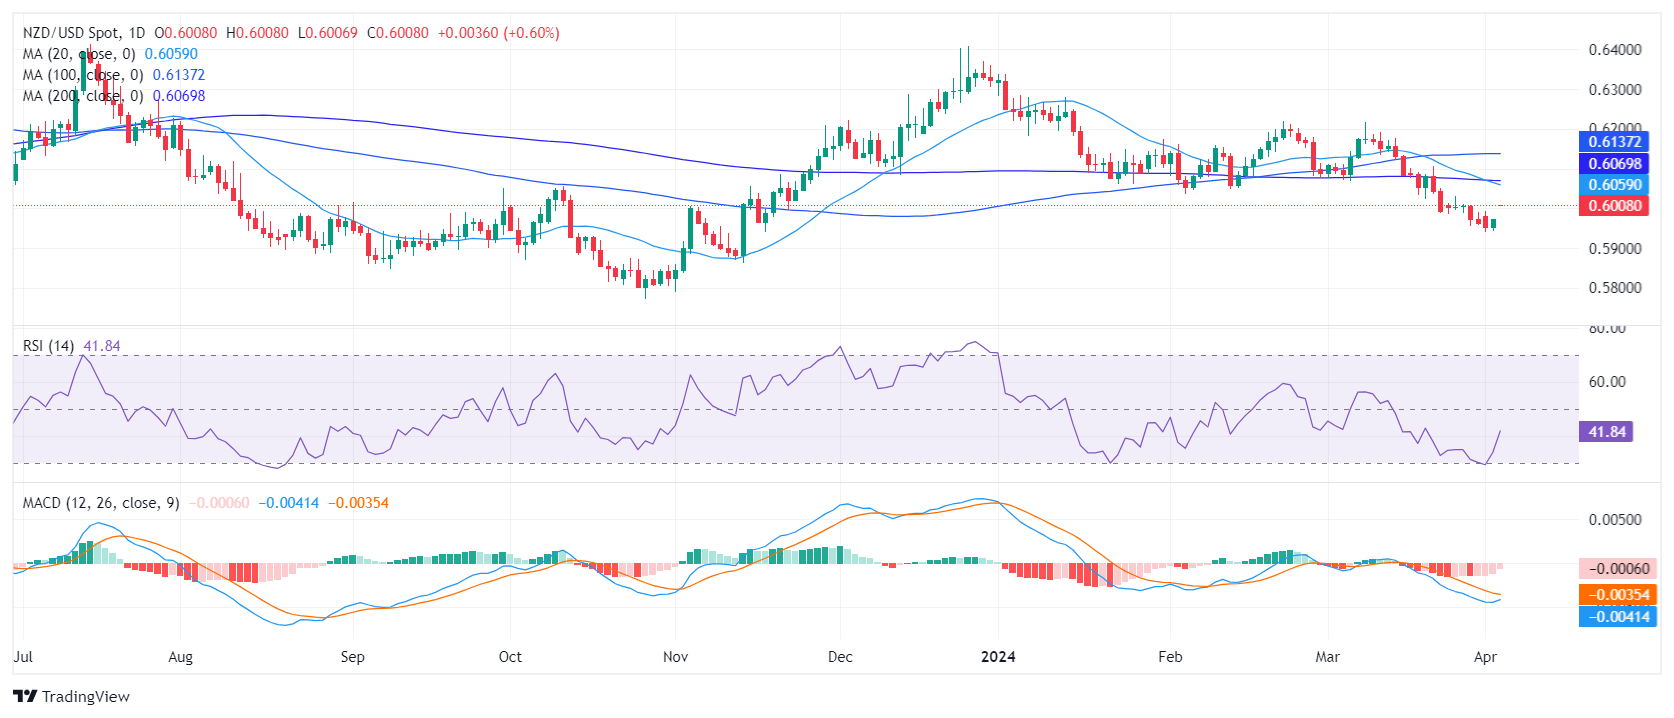
The NZD/USD was trading around the 0.6000 zone during Wednesday's session, reflecting an increase of 0.55%. The technical outlook indicates that sellers have had a more significant influence on the market. Nevertheless, buying momentum grew during the session as the Greenback was one of the weakest performers due to fundamental reasons.
On the daily chart, the Relative Strength Index (RSI) predominantly exists in negative territory, despite Wednesday’s recovery from oversold areas, and currently stands at 44. This indicates that stronger market influence is currently in the hands of sellers despite the slight recovery.
NZD/USD daily chart
Turning to the hourly chart, an upward trend in the RSI was observed, reaching a peak at 76 before falling slightly to 71 as investors took some profits. At the same time, the Moving Average Convergence Divergence (MACD) histogram exhibited flat green bars, hinting at a waning short-term momentum. Despite an active sellers' market on the daily chart, the hourly indicators suggest a more balanced market with potential opportunities for buyers.
NZD/USD hourly chart
Broadly speaking, the NZD/USD is currently performing under a bearish signal across all Simple Moving Averages (SMA) as it trades below its 20,100-day, and 200-day averages. The completed SMA crossover between the 20 and 200-day averages adds arguments for a negative outlook and could limit the pair's upside.
- GBP/USD climbs to 1.264, lifted by soft USD and dovish Fed cues, weak services data.
- Powell ties rate cuts to data; Bostic hints at delayed cuts to late 2024.
- Shifts in BoE and Fed rate cut expectations indicate evolving monetary policies.
The Pound Sterling posted solid gains against the Greenback on Wednesday after bouncing from a seven-week low of 1.2539 on Tuesday. Federal Reserve officials crossing the newswires and weaker-than-expected US services sector data are a headwind for the US Dollar, which tumbled for the second day in a row. The GBP/USD trades at 1.264, gains 0.56%.
GBP/USD rebounds from lows as Fed officials' comments and US services sector data influence currency dynamics
The Institute for Supply Management (ISM) revealed a softer-than-expected Services PMI, along with Fed Chair Jerome Powell, reaffirming that interest rates would be cut, but it would depend on upcoming data. On the contrary, Atlanta’s Fed President Raphael Bostic stood by his stance of just one rate cut, adding that it could happen in the last quarter of 2024.
In the meantime, US Treasury yields trimmed its earlier gains a headwind for the buck. The US Dollar Index (DXY) which tracks the performance of the American currency against other six, tumbles 0.46%, down at 104.26. This comes after the release of the ISM Manufacturing PMI sent the DXY rallying to the 105.00 mark.
Bank of England and Fed rate cut expectations
Money market futures traders see the Bank of England (BoE) cutting rates 25 basis points in June, with odds standing at 66%. Across the Atlantic, traders had fully priced in a 25-basis point cut by the Fed until July 31.
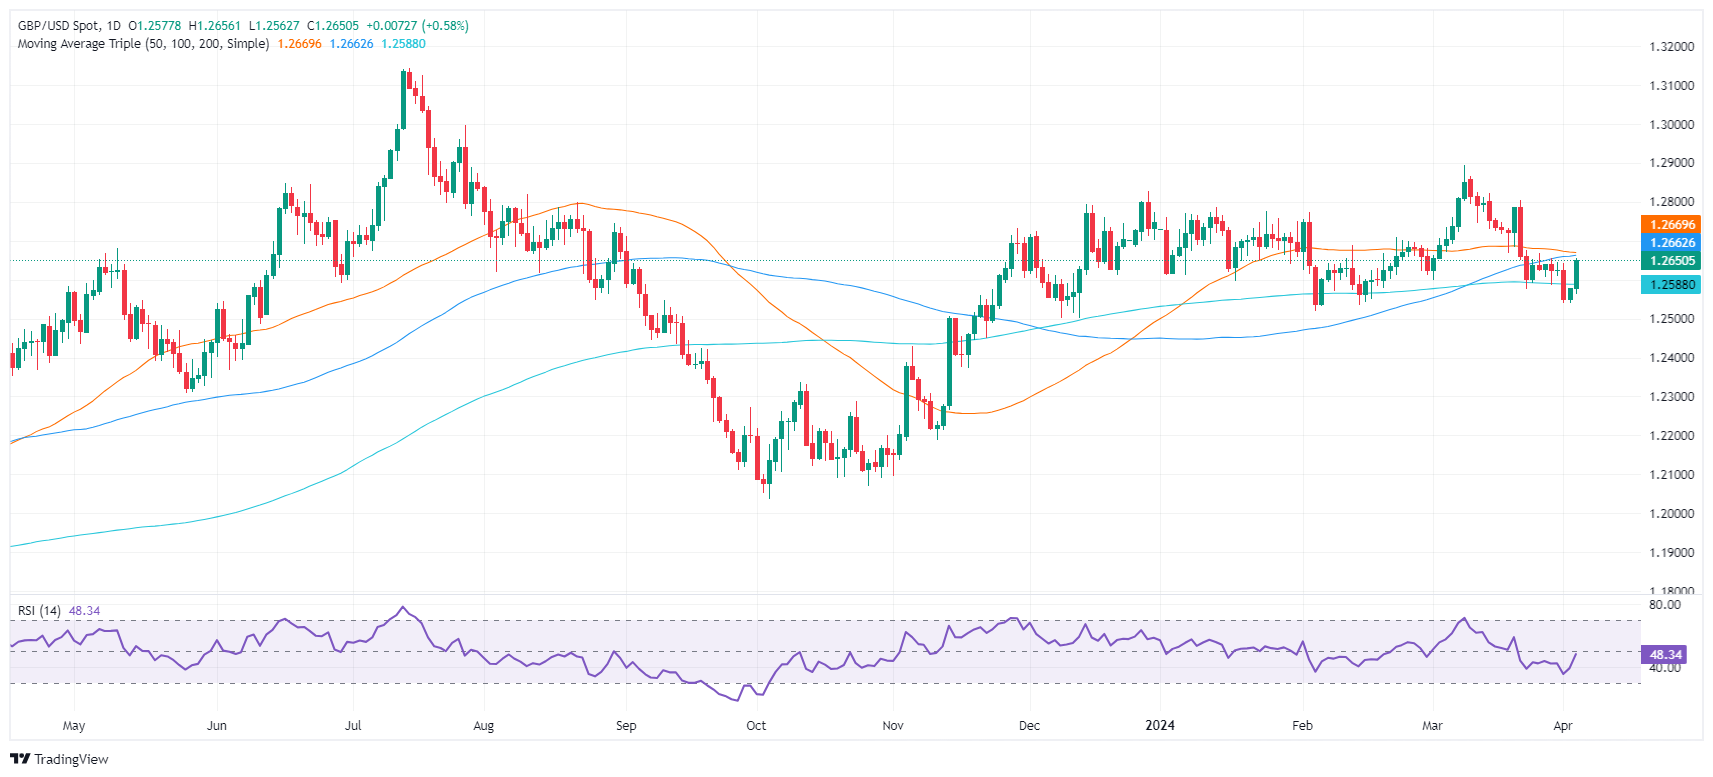
GBP/USD Price Analysis: Technical outlook
Given the fundamental backdrop, GBP/USD price action suggests the pair could test the 50-day moving average (DMA) after reclaiming the 200 and the 100-DMA, each at 1.2586 and 1.2656, respectively. If those levels are taken out of the way, expect further upside at around 1.2700. On the other hand, if sellers step in and push the exchange rate below the 200-DMA at 1.2586, that could spur a test of 1.2500.
Pound Sterling FAQs
The Pound Sterling (GBP) is the oldest currency in the world (886 AD) and the official currency of the United Kingdom. It is the fourth most traded unit for foreign exchange (FX) in the world, accounting for 12% of all transactions, averaging $630 billion a day, according to 2022 data. Its key trading pairs are GBP/USD, aka ‘Cable’, which accounts for 11% of FX, GBP/JPY, or the ‘Dragon’ as it is known by traders (3%), and EUR/GBP (2%). The Pound Sterling is issued by the Bank of England (BoE).
The single most important factor influencing the value of the Pound Sterling is monetary policy decided by the Bank of England. The BoE bases its decisions on whether it has achieved its primary goal of “price stability” – a steady inflation rate of around 2%. Its primary tool for achieving this is the adjustment of interest rates. When inflation is too high, the BoE will try to rein it in by raising interest rates, making it more expensive for people and businesses to access credit. This is generally positive for GBP, as higher interest rates make the UK a more attractive place for global investors to park their money. When inflation falls too low it is a sign economic growth is slowing. In this scenario, the BoE will consider lowering interest rates to cheapen credit so businesses will borrow more to invest in growth-generating projects.
Data releases gauge the health of the economy and can impact the value of the Pound Sterling. Indicators such as GDP, Manufacturing and Services PMIs, and employment can all influence the direction of the GBP. A strong economy is good for Sterling. Not only does it attract more foreign investment but it may encourage the BoE to put up interest rates, which will directly strengthen GBP. Otherwise, if economic data is weak, the Pound Sterling is likely to fall.
Another significant data release for the Pound Sterling is the Trade Balance. This indicator measures the difference between what a country earns from its exports and what it spends on imports over a given period. If a country produces highly sought-after exports, its currency will benefit purely from the extra demand created from foreign buyers seeking to purchase these goods. Therefore, a positive net Trade Balance strengthens a currency and vice versa for a negative balance.
- The daily chart presents a strong buying momentum with indicators deep in positive territory.
- On the hourly chart, the RSI resides in the overbought zone, suggesting a short-term consolidation of the recent gains.
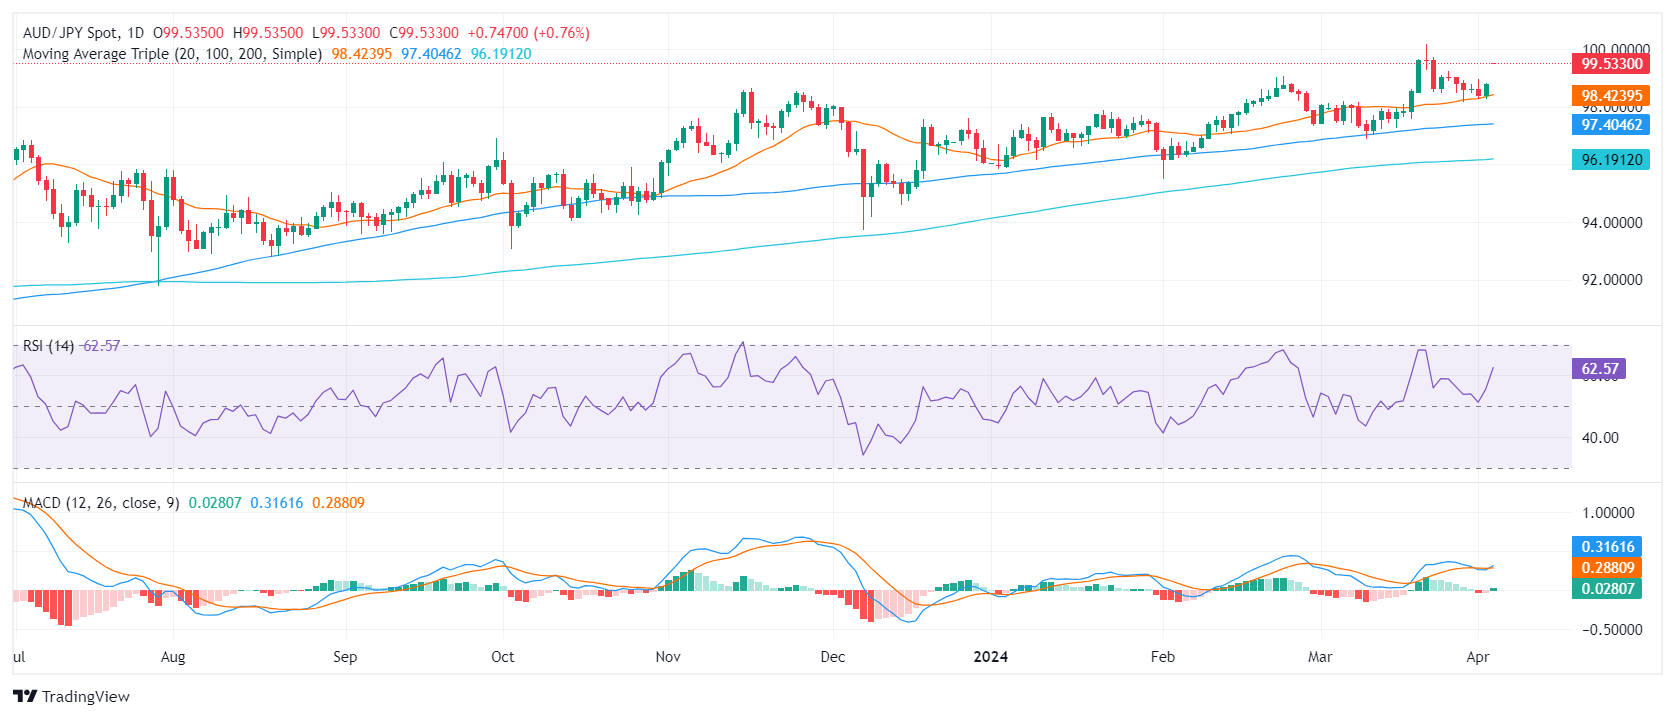
In Wednesday's session, the AUD/JPY pair is trading at 99.58, following an increase of 0.82%. Buyers appear in control, but indicators are flashing signals of a short-term consolidation.
On the daily chart, the AUD/JPY pair reveals a bullish sentiment. The Relative Strength Index (RSI) resides deep in positive territory, with recent readings reaching as high as 61, indicating the domination of buyers in the market. Furthermore, the rising green bars on the Moving Average Convergence Divergence (MACD) histogram show a positive momentum, supporting the bullish outlook.
AUD/JPY daily chart
Upon inspecting the hourly chart, the RSI readings consistently hover in the overbought zone, with the latest entry at 78 but the index has started to edge downwards. A flat green histogram on the MACD also gives arguments for a short-term consolidation.
AUD/JPY hourly chart
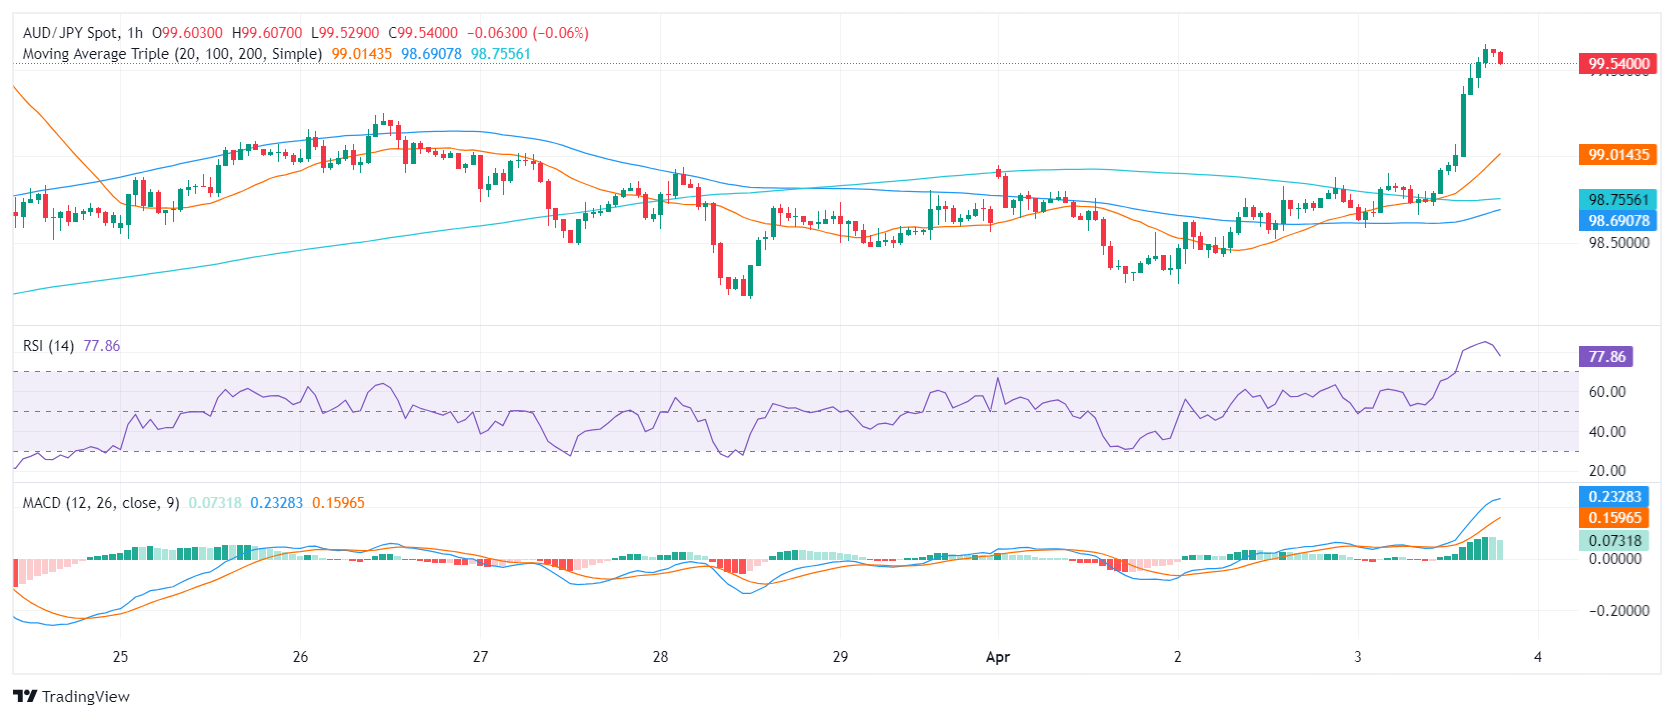
Considering the broader outlook, the pair also stands above the 20,100 and 200-day Simple Moving Averages (SMAs). This setup suggests short-term and long-term trends are bullish, and traders may expect further upside.
In conclusion, both daily and hourly charts for the AUD/JPY pair highlight a bullish outlook. The RSI values and the MACD histograms across both timelines point to strong upward movement, with buyers currently holding market reins. However, indicators on the hourly chart point to further consolidation as they lie deep in the overbought zone.
- Gold price soars, supported by weakening US Dollar in face of high Treasury yields.
- XAU/USD was boosted by Fed Chair Powell hinting at rate cuts within the year, contingent on sustained inflation decline.
- Despite a strong job market as shown by ADP data, indications of a slowdown in services activity contribute to the precious metal's gains.
Gold price climbs steadily, eyeing Wednesday's $2,300 psychological figure amid high US Treasury bond yields and a soft US Dollar. Speeches from Federal Reserve officials, strong jobs data, and a dip in services business activity weighed on the American currency. Therefore, the XAU/USD spot price is at $2,295, refreshing all-time highs and gaining more than 0.60%.
Recently, Fed Chair Jerome Powell stated the US central bank has time to deliberate about rate cuts, given the strength of the economy and the inflation readings. He reiterated that if the economy evolves as expected, they will cut borrowing costs “at some point this year.”
Nevertheless, Powell emphasized that could happen once they “have greater confidence that inflation is moving sustainably down.”
Earlier, Atlanta Fed President Raphael Bostic acknowledged the robust momentum of the economy yet stressed the necessity for both growth and inflation to decelerate. He forecasts a rate cut in the final quarter of 2024 and envisions inflation aligning with the Fed's 2% target by 2026.
The US economic calendar highlighted employment figures and Services PMI. ADP reported higher-than-expected private sector job growth in March, indicating a robust labor market favorable to the US Dollar. However, signs of slowing business activity from recent S&P Global and ISM Services PMI reports have limited the US Dollar's recovery.
Daily digest movers: Gold price shrugs off hawkish Fed speakers amid mixed data
- The ADP Employment Change for March exceeded expectations, reporting 184,000 jobs added, outperforming the anticipated 148,000 and February's 155,000.
- In service sector activity, S&P Global noted a decrease in the Services PMI to 51.7 from 52.3, with the Composite Index also dipping from 52.5 to 52.1. The ISM's Non-Manufacturing PMI fell to 51.4, below the expected 52.7 and the previous 52.6, indicating a slowdown in service sector expansion.
- Cleveland Fed President Loretta Mester expressed that current data does not support a rate cut by the May meeting, but she anticipates three rate cuts in 2024, highlighting the Fed's task of balancing inflation and employment risks.
- Similarly, San Francisco Fed President Mary Daly emphasized the need to evaluate the duration for maintaining current interest rates. While Daly supports the possibility of three rate cuts, she clarified that this outlook should be seen as a projection rather than a guarantee.
- In terms of the Federal Reserve's future interest rate movements, the CME FedWatch Tool indicates that traders currently assign a 58% likelihood to the prospect of the US central bank reducing borrowing costs.
Technical analysis: Gold rally to extend as buyers target $2,300
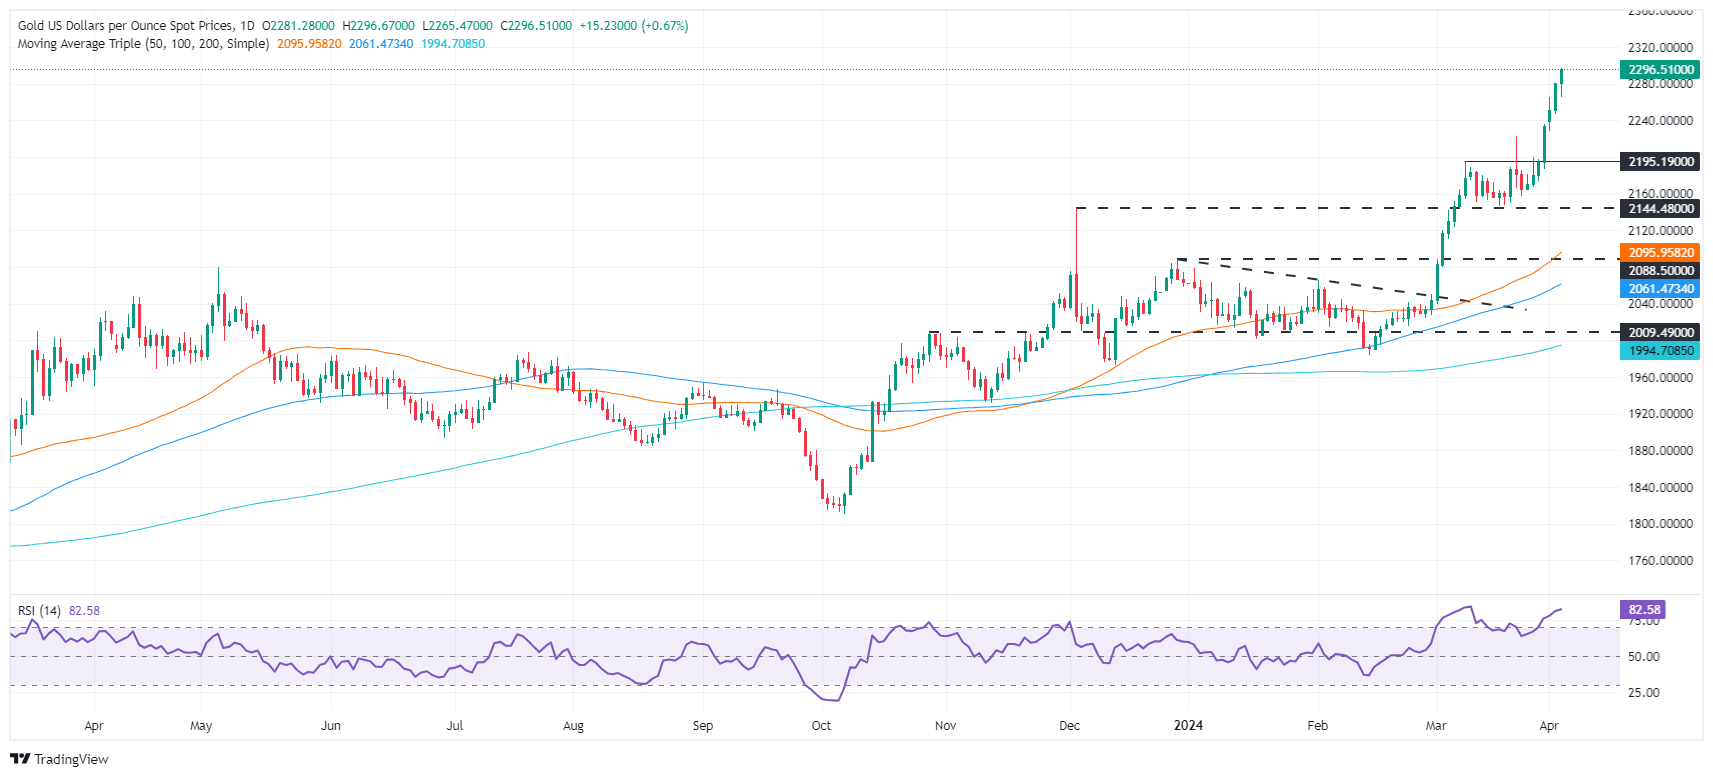
The XAU/USD daily chart suggests the yellow metal is headed toward the $2,300 figure amid renewed buying pressures observed in the Relative Strength Index (RSI). On Monday, I mentioned that “The XAU/USD daily chart depicts Gold's last uptick to new all-time highs, achieved on lower momentum, as depicted by the Relative Strength Index (RSI).” However, as of writing, the RSI has punched above the 80.00 threshold, an indication that buyers are in charge.
With price action at uncharted territory, the next resistance level would be the $2,300 mark, followed by the $2,350 psychological figure. Up next would be $2,400.
On the other hand, if XAU/USD drops below $2,250, that could sponsor a correction. The first support would be the $2,200 figure, followed by the March 8 high turned support at $2,195, ahead of extending its losses to $2,150.
Gold FAQs
Gold has played a key role in human’s history as it has been widely used as a store of value and medium of exchange. Currently, apart from its shine and usage for jewelry, the precious metal is widely seen as a safe-haven asset, meaning that it is considered a good investment during turbulent times. Gold is also widely seen as a hedge against inflation and against depreciating currencies as it doesn’t rely on any specific issuer or government.
Central banks are the biggest Gold holders. In their aim to support their currencies in turbulent times, central banks tend to diversify their reserves and buy Gold to improve the perceived strength of the economy and the currency. High Gold reserves can be a source of trust for a country’s solvency. Central banks added 1,136 tonnes of Gold worth around $70 billion to their reserves in 2022, according to data from the World Gold Council. This is the highest yearly purchase since records began. Central banks from emerging economies such as China, India and Turkey are quickly increasing their Gold reserves.
Gold has an inverse correlation with the US Dollar and US Treasuries, which are both major reserve and safe-haven assets. When the Dollar depreciates, Gold tends to rise, enabling investors and central banks to diversify their assets in turbulent times. Gold is also inversely correlated with risk assets. A rally in the stock market tends to weaken Gold price, while sell-offs in riskier markets tend to favor the precious metal.
The price can move due to a wide range of factors. Geopolitical instability or fears of a deep recession can quickly make Gold price escalate due to its safe-haven status. As a yield-less asset, Gold tends to rise with lower interest rates, while higher cost of money usually weighs down on the yellow metal. Still, most moves depend on how the US Dollar (USD) behaves as the asset is priced in dollars (XAU/USD). A strong Dollar tends to keep the price of Gold controlled, whereas a weaker Dollar is likely to push Gold prices up.
Further selling pressure prompted the Greenback to retreat further and put the USD Index (DXY) on track to challenge the 104.00 support after weaker-than-expected. On another front, further disinflationary pressures in the euro area bolstered an ECB rate cut in the summer.
Here is what you need to know on Thursday, April 4:
The Greenback faced extra downside pressure, putting the 104.00 zone to the test when tracked by the USD Index (DXY). On April 4, February’s Balance of Trade results are due seconded by weekly Initial Jobless Claims. In addition, the Fed's Barkin, Goolsbee, and Mester are all due to speak.
EUR/USD gathered extra upside traction and managed to confront the key 200-day SMA in the 1.0830 region. On April 4, the final HCOB Services PMIs in Germany and the euro area are expected along with the release of the ECB Accounts.
GBP/USD rose to multi-day highs well past the 1.2600 mark, an area coincident with the interim 100-day SMA. The final S&P Global Services PMI will take centre stage across the Channel on April 4.
USD/JPY kept its side-lined performance intact for yet another session, always below the 152.00 milestone. The usual weekly Foreign Bond Investment figures are scheduled for April 4 in the Japanese docket.
AUD/USD picked up further buying interest and left behind the critical 200-day SMA around 0.6545. On April 4, the final Judo Bank Services PMI is due.
Unabated geopolitical concerns lifted WTI prices to new 2024 peaks north of the $86.00 mark per barrel.
Persistent safe-haven demand and hopes of Fed rate cuts in June helped Gold prices reach a record peak near the $2,300 mark per troy ounce. In the same line, the rally in Silver remained unabated, hitting fresh highs just above the $27.00 level per ounce for the first time since June 2021.
- The daily RSI on the GBP/JPY reveals a strong bullish posture, while the MACD shows a shift towards a more balanced market.
- The hourly chart discloses the RSI regularly exceeding overbought thresholds.
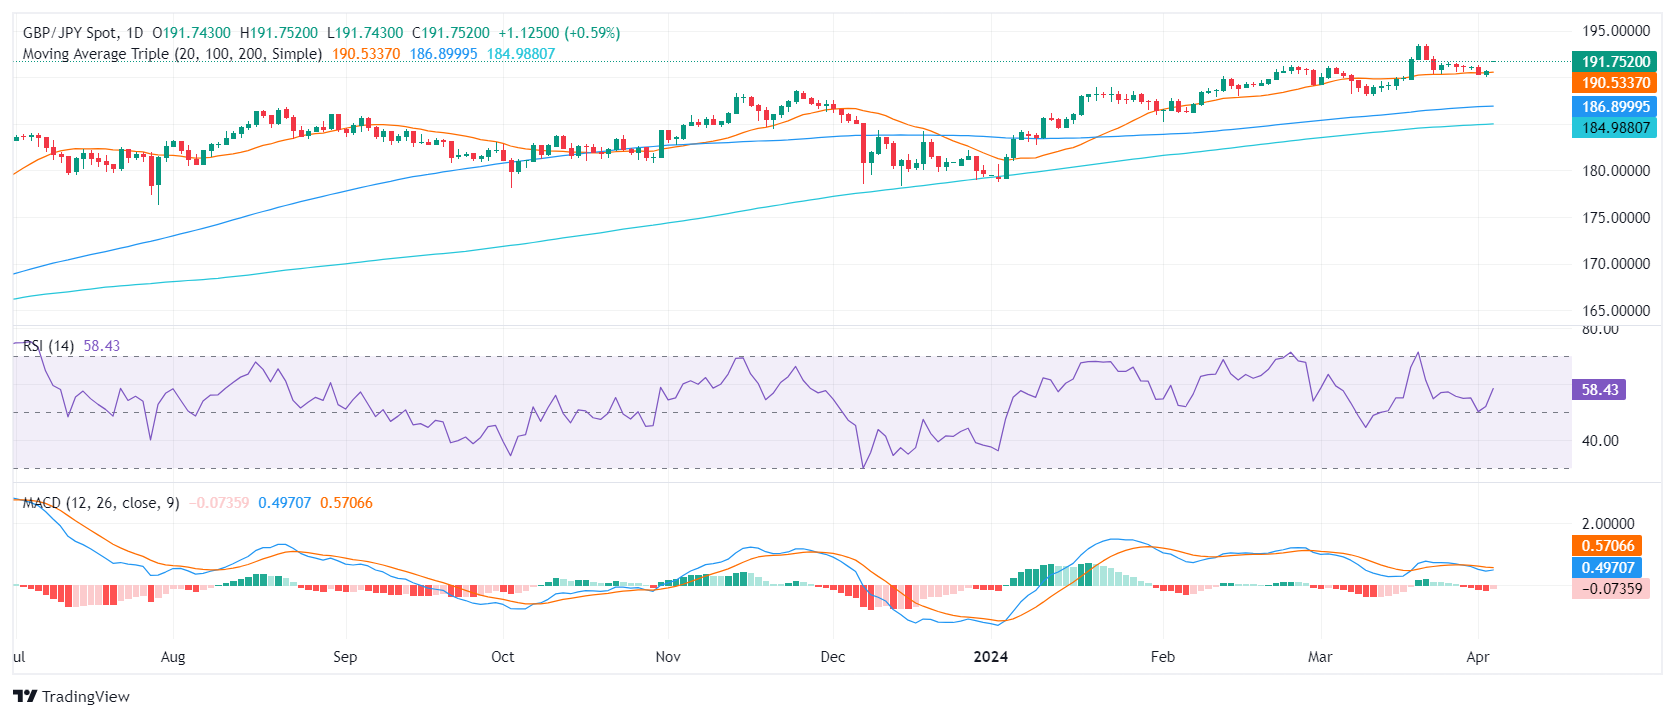
In Wednesday's session, the GBP/JPY is trading at the 191.65 level, showing a 0.57% uptick. The market sentiment for GBP/JPY is majorly bullish, but there is a high likelihood that investors may start taking profits as the cross reached overbought conditions on the hourly chart.
On the daily chart, the Relative Strength Index (RSI) pointing north above 50 indicates that buyers currently have a slight advantage in the market. While there are no extreme levels, suggesting overbought conditions, the RSI reveals a generally strong bullish posture. On the contrary, the Moving Average Convergence Divergence (MACD) is generating decreasing red bars, hinting at the presence of negative momentum and pointing toward more balanced market conditions.
GBP/JPY daily Chart
The hourly chart presents a contrasting perspective with the RSI logging higher values, lying deep in overbought terrain. This tends to predict a downward correction as the upward momentum may be overextended. In addition, the green rising bars of the MACD histogram also demonstrate positive momentum, reinforcing the strong presence of buyers in the market.
GBP/JPY hourly Chart
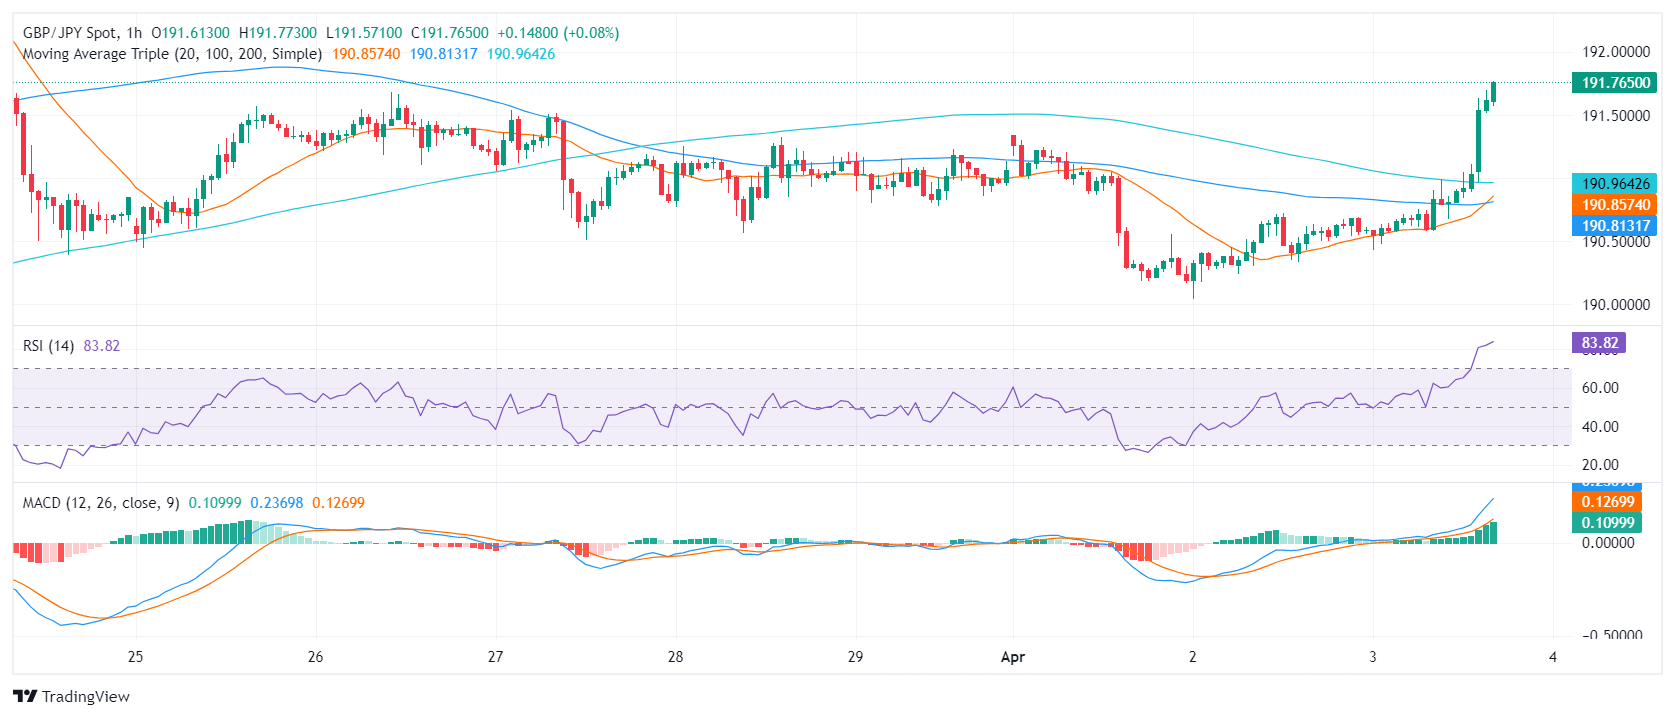
In terms of the overall trend, the GBP/JPY is positioned above its 20-day, 100-day, and 200-day SMAs. This pattern signals an enduring bullish trend in both short-term and long-term periods. In summary, while both the daily and hourly charts appear mostly bullish, the indicators reveal a stronger upward momentum in the hourly market with the possibility of a downward correction in the short term. However, as the pair holds above the main SMAs, the downward movements could be considered a mere correction.
- The Euro jumps on Wednesday with the US Dollar dropping across the board.
- The unexpected decline of the US ISM Services PMI has eased concerns about a hawkish turn by the Fed.
- Earlier on Wednesday Eurozone CPI reflected softer-than-expected price pressures in March.
The Euro is going through a sharp recovery in Wednesday’s US trading session. The pair has rallied about 60 pips following weaker-than-expected US services sector’s activity, which has eased fears of a hawkish steer by the Federal Reserve.
Data released by ISM Insitute revealed that business activity in the services sector slowed down to 51.4 in March from 52.6 in the previous month, against expectations of a slight acceleration to 52.7. Beyond that, the Prices Paid sub-index has dropped to 53.4 from 58.6 in February and 64 in January confirming the disinflationary trend in the sector.
The PMI figures have offset the impact of a strong ADP report, which suggests a resilient labour market ahead of Friday’s Nonfarm Payrolls report. later on Wednesday Atlanta Fed President Bostic and Fed Chair Powell have cooled hopes about imminent rate cuts, yet with no significant impact on the pair.
During the European Session, the Eurozone CPI figures confirmed the soft inflation readings seen in Germany on Tuesday. The Core Inflation has declined below the 3% yearly rate, with the headline CPI easing to 2.4%, well below the 2.6% foreseen by the market. These figures pave the path for the ECB to cut rates over the coming months, although the impact on the Euro has been marginal.
- EUR/JPY breaks above Tenkan-Sen, eyes 165.00 potential.
- Holding above 164.00 may lead to testing yearly highs.
- Bears aim below 164.00 for reversal; Tenkan-Sen, Kijun-Sen as supports.
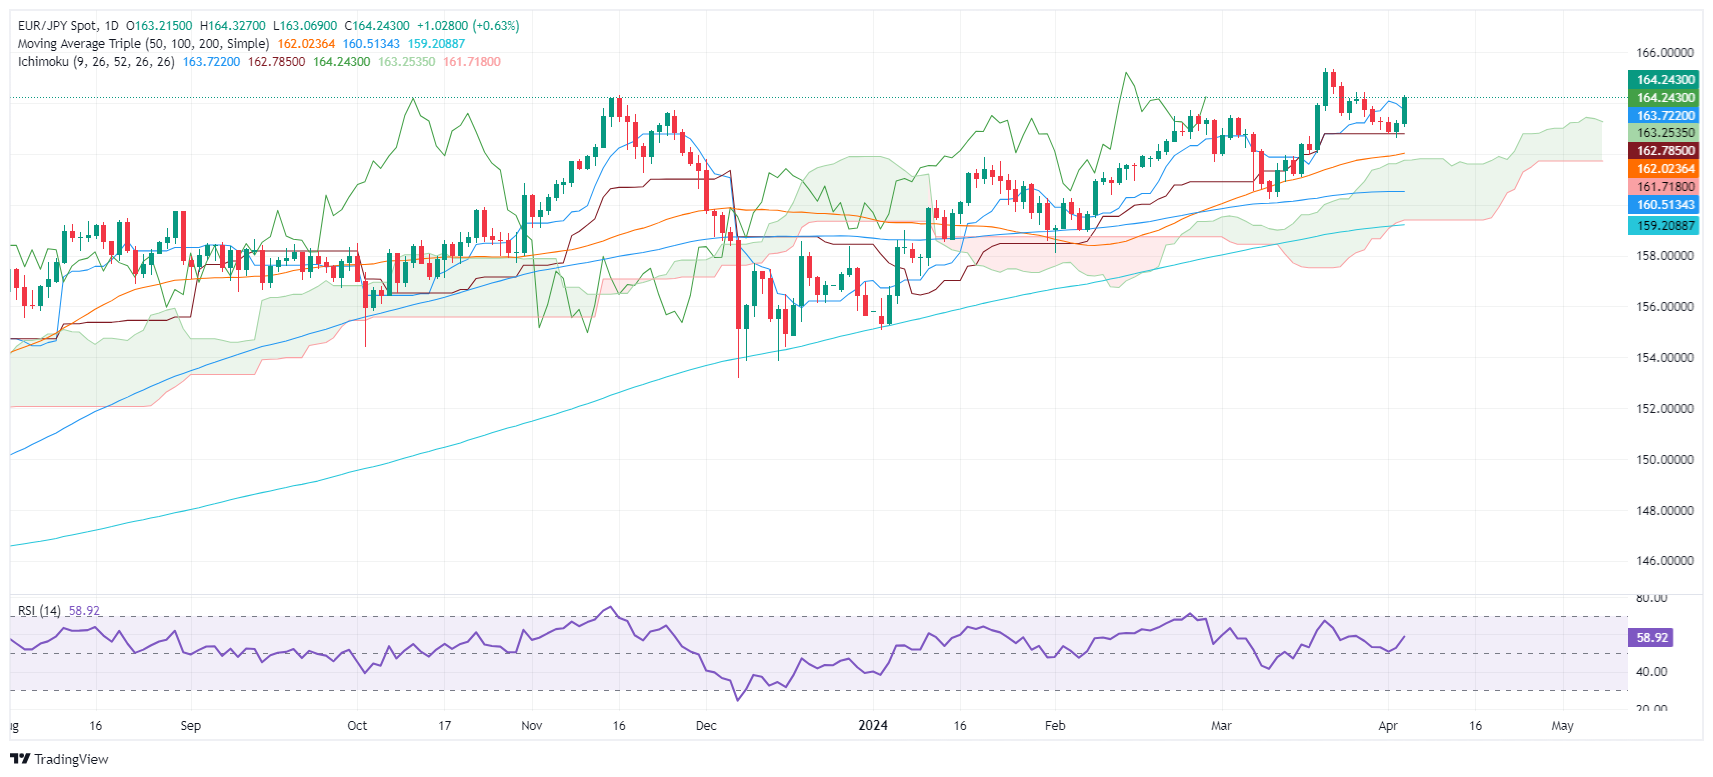
The Euro posted solid gains against the Japanese Yen (JPY) on Wednesday, amid an improvement in risk appetite and the dovish stance adopted by the Bank of Japan (BoJ) despite rising interest rates. At the time of writing, the EUR/JPY trades at 164.25, up 0.67%.
EUR/JPY Price Analysis: Technical outlook
Euro bulls re-entered the market, lifting the EUR/JPY pair above the Tenkan-Sen a 163.71, which opened the door to reclaim the 164.00 mark. That suggests that buyers are gathering steam, which would open the door to challenge the 165.00 mark. A breach of the latter will expose the year-to-date (YTD) high of 165.34.
On the flip side, sellers must drag prices below 164.00 to challenge the new Tenkan-Sen level at 163.71, the next support level. Once surpassed, traders could test the Senkou Span Aat 163.25, followed by the Kijun-Sen level at 162.78.
EUR/JPY Price Action – Daily Chart
- ISM Services PMI figures from March were weaker than expected. ADP numbers were strong.
- The odds of an interest rate cut somewhat increased for the June Fed meeting.
- The focus is set on Friday’s Nonfarm Payroll report.
The US Dollar Index (DXY) is currently trading at 104.3, reflecting a daily decline. Despite the Federal Reserve's (Fed) cautious stance, consensus forecasts indicate that the beginning of the easing cycle will begin in June. That being said, mixed data from the US economy may make Fed officials think twice about rushing to start cutting.
The US labor market remains resilient as well as the overall economy, with little signs of a slowdown. In case the economy doesn’t show conclusive evidence of cooling down, the Fed might consider delaying the start of the easing cycle.
Daily digest market movers: DXY impacted by service sector slowdown, Fed remains cautious
- The Institute for Supply Management (ISM) released a report noting that business activity in the US service sector expanded in March, but growth was slower than the previous month. The ISM Services Purchasing Managers Index (PMI) decreased to 51.4 from February's 52.6.
- The reported YoY decrease in the Prices Paid Index from 58.6 to 53.4 suggests an overall declining trend in inflation.
- The Employment Index noted a slight yearly increase, up to 48.5 from an earlier 48.0, continuing to signify a decline in payrolls within the service sector.
- Data from Automatic Data Processing (ADP) showed private sector employment in the US increased in March with 184,000 new jobs, which was an improvement upon the revised February figures of 155,000 from 140,000.
- Cleveland Fed President Loretta Mester and San Francisco Fed President Mary Daly suggested three potential rate cuts in 2024 but underscored that it's too soon to act.
- On Tuesday, Jerome Powell commented that there was no rush to cut rates and that the bank remains data-dependent.
- June has not been ruled out for the initial cut, with current market odds still favoring a rate cut at 68%.
DXY technical analysis: DXY grapples with slight selling pressure, overall bullish sentiment remains
In the DXY technical landscape, the Relative Strength Index (RSI), although on a negative slope, is still situated in positive territory, implying a stalling upward momentum. However, the recent decrease in green bars on the Moving Average Convergence Divergence (MACD) histogram echoes a similar sentiment, suggesting a subtle shift in the dynamics from buying to selling pressure.
Still, on an encouraging note, the index continues to trade above the critical support levels dictated by its 20, 100, and 200-day Simple Moving Averages (SMAs). Despite a short-term negative outlook, this notably upbeat stance suggests that the bulls are still in control over the longer horizon.
US Dollar FAQs
The US Dollar (USD) is the official currency of the United States of America, and the ‘de facto’ currency of a significant number of other countries where it is found in circulation alongside local notes. It is the most heavily traded currency in the world, accounting for over 88% of all global foreign exchange turnover, or an average of $6.6 trillion in transactions per day, according to data from 2022. Following the second world war, the USD took over from the British Pound as the world’s reserve currency. For most of its history, the US Dollar was backed by Gold, until the Bretton Woods Agreement in 1971 when the Gold Standard went away.
The most important single factor impacting on the value of the US Dollar is monetary policy, which is shaped by the Federal Reserve (Fed). The Fed has two mandates: to achieve price stability (control inflation) and foster full employment. Its primary tool to achieve these two goals is by adjusting interest rates. When prices are rising too quickly and inflation is above the Fed’s 2% target, the Fed will raise rates, which helps the USD value. When inflation falls below 2% or the Unemployment Rate is too high, the Fed may lower interest rates, which weighs on the Greenback.
In extreme situations, the Federal Reserve can also print more Dollars and enact quantitative easing (QE). QE is the process by which the Fed substantially increases the flow of credit in a stuck financial system. It is a non-standard policy measure used when credit has dried up because banks will not lend to each other (out of the fear of counterparty default). It is a last resort when simply lowering interest rates is unlikely to achieve the necessary result. It was the Fed’s weapon of choice to combat the credit crunch that occurred during the Great Financial Crisis in 2008. It involves the Fed printing more Dollars and using them to buy US government bonds predominantly from financial institutions. QE usually leads to a weaker US Dollar.
Quantitative tightening (QT) is the reverse process whereby the Federal Reserve stops buying bonds from financial institutions and does not reinvest the principal from the bonds it holds maturing in new purchases. It is usually positive for the US Dollar.
- Dow Jones bounces up as soft US services data eases concerns about a “higher for longer” monetary policy outlook.
- US Services activity softened against expectations in March with the Prices Paid sub-index posting its lowest reading in years.
- Intel is leading losses in the Dow Jones after news of hefty losses in its foundry business.
The Dow Jones Industrial Average (DJIA) has moved into positive territory following a weak opening. The soft US services activity data has offered some relief to investors, increasingly concerned that a string of strong US macroeconomic releases would force the Fed to dial down their monetary easing plans.
The US ISM Services PMI eased to 51.4 in March from 52.6 in February against market expectations of a slight increase to 52.7. Beyond that, the Prices Paid sub-index retreated to 53.4 from 58.6 in the previous month. This is the lowest reading in years and suggests a disinflationary contribution to the economy.
All three main Wall Street Indexes have jumped after the data. The Dow Jones is lagging with a 1.2% advance, trading at 39,243, still well below the 40,000 high hit last week. The NASDAQ is leading gains with a 0.53% advance to 16,326, followed by the S&P 500, up 0.37% to 5,225.
Dow Jones news
The Energy sector is the best performer on Wednesday with a 0.65% advance followed by Industrials, up 0.61%. On the losing end, only three of the eleven sectors are in the red with Consumer Staples losing 0.99% followed by the Real State, down 0.25%.
Down to single stocks, the market is showing a more mixed picture. Intel (INTC) fell 7.2% to $40.88 following a report stating that its foundry business recorded an operating loss of $7 billion in 2023.
Next is Procter & Gamble (PG), down 2.54% to $156.52, and Johnson & Johnson (JNJ), losing 1.35% to $155.59.
On the positive side, Caterpillar (CAT) advances 1.7% to $372, followed by Apple (AAPL), which is 0.88% up at $170.37.
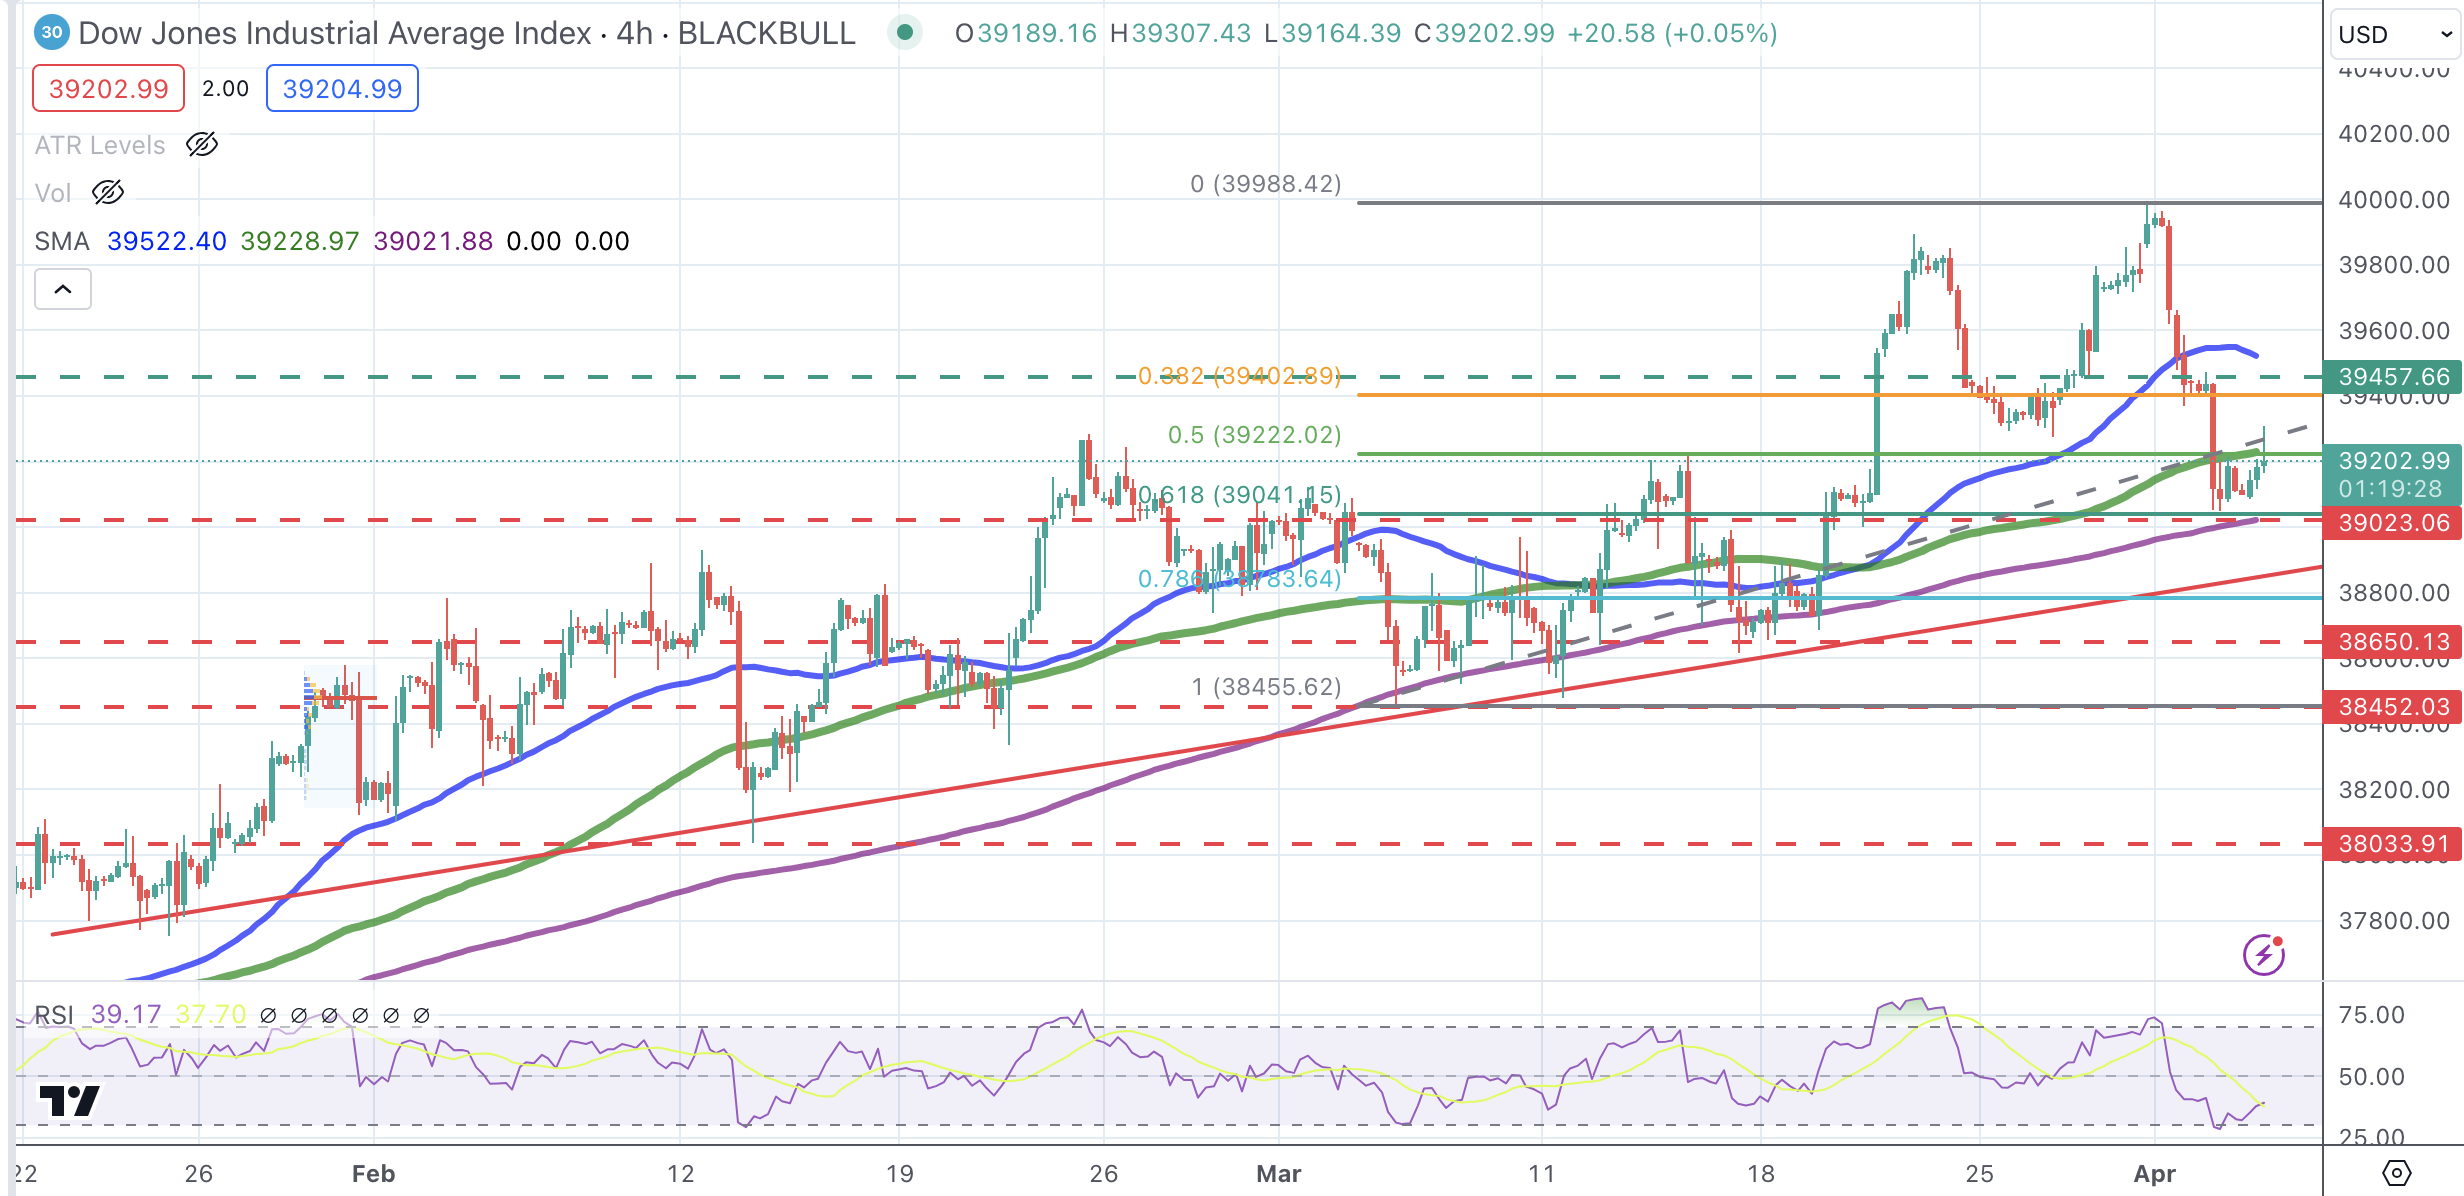
Dow Jones technical outlook
The technical picture is little changed from Tuesday, with the Dow Jones Index correcting lower, yet with the broader bullish trend still intact. Price Action remains contained between the 50% and the 61.8% Fibonacci retracement of the March rally, at 39,300, with bears in control after the rejection at the 40,000 psychological level last week.
The 39,000 support area is holding sellers for now and closing the path to the trendline support, now at 38,850. On the upside, the index is struggling to breach the mentioned 50% Fibonacci retracement at 39,195. Further up at 39,457 and the mentioned 40,000 would be the next targets.
Dow Jones 4-Hour Chart
Dow Jones FAQs
The Dow Jones Industrial Average, one of the oldest stock market indices in the world, is compiled of the 30 most traded stocks in the US. The index is price-weighted rather than weighted by capitalization. It is calculated by summing the prices of the constituent stocks and dividing them by a factor, currently 0.152. The index was founded by Charles Dow, who also founded the Wall Street Journal. In later years it has been criticized for not being broadly representative enough because it only tracks 30 conglomerates, unlike broader indices such as the S&P 500.
Many different factors drive the Dow Jones Industrial Average (DJIA). The aggregate performance of the component companies revealed in quarterly company earnings reports is the main one. US and global macroeconomic data also contributes as it impacts on investor sentiment. The level of interest rates, set by the Federal Reserve (Fed), also influences the DJIA as it affects the cost of credit, on which many corporations are heavily reliant. Therefore, inflation can be a major driver as well as other metrics which impact the Fed decisions.
Dow Theory is a method for identifying the primary trend of the stock market developed by Charles Dow. A key step is to compare the direction of the Dow Jones Industrial Average (DJIA) and the Dow Jones Transportation Average (DJTA) and only follow trends where both are moving in the same direction. Volume is a confirmatory criteria. The theory uses elements of peak and trough analysis. Dow’s theory posits three trend phases: accumulation, when smart money starts buying or selling; public participation, when the wider public joins in; and distribution, when the smart money exits.
There are a number of ways to trade the DJIA. One is to use ETFs which allow investors to trade the DJIA as a single security, rather than having to buy shares in all 30 constituent companies. A leading example is the SPDR Dow Jones Industrial Average ETF (DIA). DJIA futures contracts enable traders to speculate on the future value of the index and Options provide the right, but not the obligation, to buy or sell the index at a predetermined price in the future. Mutual funds enable investors to buy a share of a diversified portfolio of DJIA stocks thus providing exposure to the overall index.
In his remarks at the Stanford Graduate School of Business, Chair Jerome Powell reiterated once again that the policy rate is likely at its peak in the current cycle.
Additional key quotes
“If economy evolves as central bank expects, most federal open market committee participants see it as likely appropriate to begin cutting policy rate at some point this year.”
“Too soon to say whether recent inflation readings are more than just a bump”.
“Fed has time to let incoming data guide its policy decisions; central bank is making decisions meeting by meeting.”
“Recent readings on job gains and inflation higher than expected, but do not materially change overall picture.”
“Outlook still quite uncertain, fed faces risks on both sides of its mandate”.
“Fed continues to believe policy rate likely at peak for this cycle.”
Market Reaction
The Greenback mainatins its negative performance so far on Wednesday, prompting the USD Index (DXY) to drop to new lows near 104.30 amidst higher yields and a dominating risk-on sentiment among investors.
- Mexican Peso rises despite higher US Treasury yields, mixed data.
- Atlanta Fed President Bostic’s hawkish outlook sponsored traders repricing for a less dovish Fed.
- US jobs data was strong, while Services PMI suggests business activity decelerates.
The Mexican Peso posts gains against the US Dollar on Wednesday as US Treasury yields climbed, sponsored by Atlanta Federal Reserve President Raphael Bostic's hawkish comments. Economic data from the United States (US) was mixed, while goodish Gross Fixed Investment figures in Mexico capped the emerging market currency’s fall. The USD/MXN trades at 16.54, down 0.06%.
The Greenback is trading mixed during the session, depreciating against most G8 currencies but clocking gains against emerging market ones. Atlanta Fed President Raphael Bostic highlighted the economy's strong momentum but emphasized the need for growth and inflation to slow. He anticipates a rate cut in the last quarter of 2024 and projects inflation to reach the Fed's 2% target by 2026.
Data-wise, the US economic docket features employment data and Services Purchasing Managers Index (PMI) by S&P and the Institute for Supply Management (ISM). Automatic Data Processing (ADP) revealed that private hiring increased above estimates and the previous month’s reading in March, portraying a tight labor market, which is positive for the Greenback. However, recently released data suggesting that business activity is cooling down, as portrayed by S&P Global and ISM Services PMI, capped US Dollar recovery.
Daily digest market movers: Mexican Peso advances, shrugging off mixed US data
- Mexico’s Gross Fixed Investment figures in January came at 0.1% MoM, up from December’s 0%. In the twelve months to January, investment grew 15.3%, crushing December’s 13.4% increase.
- Last week, Banxico Governor Victoria Rodriguez Ceja remained dovish despite acknowledging that the battle against inflation hasn’t been won. She added, “When macroeconomic conditions and the inflationary outlook allow us to make additional adjustments to the reference rate to the one we already have, I consider that they would be gradual.”
- The ADP Employment Change in March was 184K, above the 148K foreseen by the consensus and February’s 155K.
- S&P Global revealed that the Services PMI came to 51.7, down from 52.3, while the Composite Index slowed from 52.5 to 52.1. The ISM revealed that Non-Manufacturing PMI was 51.4, down from 52.6 and lower than projections for a 52.7 expansion.
- On Tuesday, Cleveland Fed President Loretta Mester said that she doesn’t have enough information for a May meeting cut yet foresees three rate cuts in 2024. Mester added the Fed’s challenge would be balancing the risks between inflation and employment.
- San Francisco Fed President Mary Daly said the Fed needs to see how long to keep rates at current levels. She supports three rate cuts but added that it’s a projection, not a promise.
- Regarding future interest rate expectations of the Fed, the CME FedWatch Tool suggests that traders see a 57% chance of the US central bank cutting borrowing costs.
Technical analysis: Mexican Peso buyers in charge but could shift neutral with USD/MXN clearing 16.70
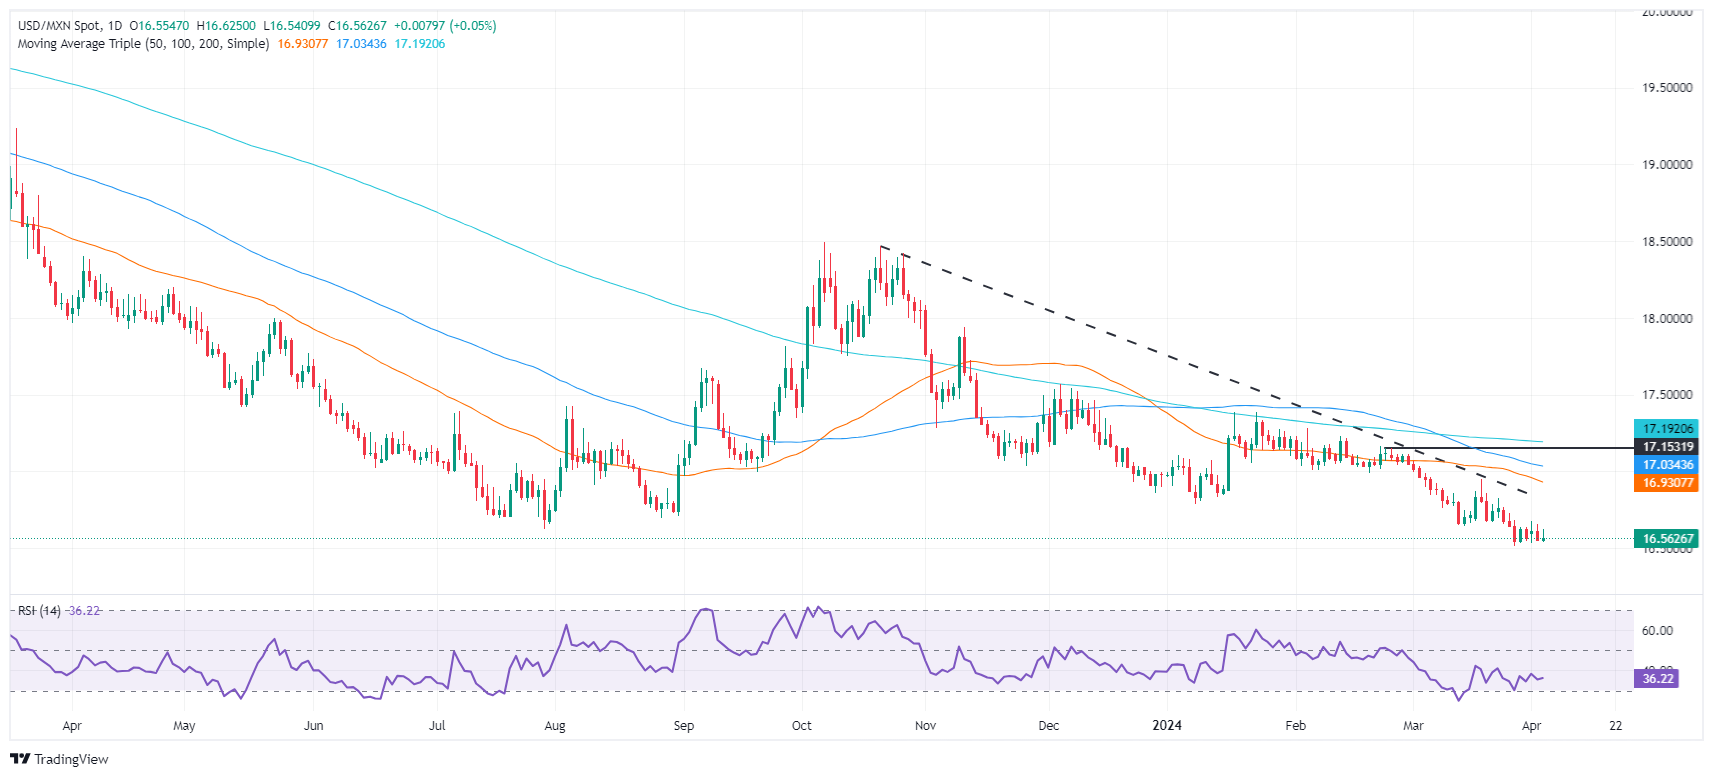
The USD/MXN remains bearish with sellers eyeing a re-test of the year-to-date (YTD) low of 16.51. Nevertheless, the pair could consolidate at 16.50 as the Relative Strength Index (RSI) remains in bearish territory. But sellers are losing momentum. However, a push below 16.50 would expose the October 2015 low of 16.32, ahead of the 16.00 mark.
On the flip side, If USD/MXN buyers enter, they must lift the exchange rate above the 16.70 area. Once cleared, the next stop would be the 50-day Simple Moving Average (SMA) at 16.94, with further upside seen at the 100-day SMA at 17.04, ahead of the 200-day SMA at 17.18.
Mexican Peso FAQs
The Mexican Peso (MXN) is the most traded currency among its Latin American peers. Its value is broadly determined by the performance of the Mexican economy, the country’s central bank’s policy, the amount of foreign investment in the country and even the levels of remittances sent by Mexicans who live abroad, particularly in the United States. Geopolitical trends can also move MXN: for example, the process of nearshoring – or the decision by some firms to relocate manufacturing capacity and supply chains closer to their home countries – is also seen as a catalyst for the Mexican currency as the country is considered a key manufacturing hub in the American continent. Another catalyst for MXN is Oil prices as Mexico is a key exporter of the commodity.
The main objective of Mexico’s central bank, also known as Banxico, is to maintain inflation at low and stable levels (at or close to its target of 3%, the midpoint in a tolerance band of between 2% and 4%). To this end, the bank sets an appropriate level of interest rates. When inflation is too high, Banxico will attempt to tame it by raising interest rates, making it more expensive for households and businesses to borrow money, thus cooling demand and the overall economy. Higher interest rates are generally positive for the Mexican Peso (MXN) as they lead to higher yields, making the country a more attractive place for investors. On the contrary, lower interest rates tend to weaken MXN.
Macroeconomic data releases are key to assess the state of the economy and can have an impact on the Mexican Peso (MXN) valuation. A strong Mexican economy, based on high economic growth, low unemployment and high confidence is good for MXN. Not only does it attract more foreign investment but it may encourage the Bank of Mexico (Banxico) to increase interest rates, particularly if this strength comes together with elevated inflation. However, if economic data is weak, MXN is likely to depreciate.
As an emerging-market currency, the Mexican Peso (MXN) tends to strive during risk-on periods, or when investors perceive that broader market risks are low and thus are eager to engage with investments that carry a higher risk. Conversely, MXN tends to weaken at times of market turbulence or economic uncertainty as investors tend to sell higher-risk assets and flee to the more-stable safe havens.
- Canadian Dollar bounces up with the US Dollar retreating on downbeat US data.
- US service sector activity decelerated against expectations with Prices Paid printing lowest level in years.
- Strong US ADP and hawkish comments from Fed’s Bostic have failed to support USD.
The Canadian Dollar (CAD) is trading higher on Wednesday, retracing the previous two days’ losses. The Loonie is favored by the US Dollar's knee-jerk reaction following downbeat US services activity data.
The US ISM Services PMI missed market expectations in March, with the Prices Paid sub-index showing a significant slowdown. This has eased investors' fears of a strong economy that would prompt the Federal Reserve (Fed) to dial down its monetary easing plans, which have pushed US Treasury yields and the US Dollar lower.
The downbeat services data has offset the larger-than-expected increase in the ADP Employment Report, which opens the doors for a bright Nonfarm Payrolls reading on Friday that might restore confidence in the US Dollar.
Beyond that, the increasing geopolitical tensions and growing concerns about tighter supply have pushed crude prices to a fresh year-to-date (YTD) high. This is providing additional support to the commodity-linked CAD.
Daily digest market movers: USD/CAD dives as services activity data disappoints
- Later on Wednesday, Fed Chair Jerome Powell will speak about the US economic outlook and might shed some light on the central bank’s monetary policy plans.
- Canadian Dollar regained lost ground on Wednesday with the USD under pressure ahead of Fed Powell’s speech.
- US ISM Services PMI dropped to 51.4 in March from 52.6 in February against market expectations of a slight increase to 52.7.
- The ISM Prices Paid sub-index has dropped to 53.4, its lowest level in years, from 58.6 in February and 64 in January. This signals a disinflationary contribution to the economy.
- Earlier on Wednesday, the US ADP Employment Report showed an increase of 184,000 new payrolls in March from 155,000 in February. The market had forecasted a decline to 148,000.
- Atlanta Fed President Raphael Bostic struck a hawkish note on Wednesday suggesting that rate cuts might not arrive after the Q4.
Canadian Dollar price today
The table below shows the percentage change of Canadian Dollar (CAD) against listed major currencies today. Canadian Dollar was the weakest against the .
| USD | EUR | GBP | CAD | AUD | JPY | NZD | CHF | |
| USD | -0.53% | -0.44% | -0.30% | -0.66% | 0.12% | -0.44% | -0.43% | |
| EUR | 0.53% | 0.08% | 0.23% | -0.13% | 0.64% | 0.07% | 0.09% | |
| GBP | 0.43% | -0.10% | 0.14% | -0.22% | 0.55% | -0.01% | 0.01% | |
| CAD | 0.30% | -0.23% | -0.13% | -0.35% | 0.42% | -0.14% | -0.15% | |
| AUD | 0.64% | 0.12% | 0.23% | 0.35% | 0.77% | 0.19% | 0.23% | |
| JPY | -0.11% | -0.65% | -0.57% | -0.41% | -0.76% | -0.56% | -0.57% | |
| NZD | 0.44% | -0.09% | 0.01% | 0.14% | -0.22% | 0.56% | 0.01% | |
| CHF | 0.43% | -0.09% | -0.01% | 0.12% | -0.22% | 0.55% | -0.01% |
The heat map shows percentage changes of major currencies against each other. The base currency is picked from the left column, while the quote currency is picked from the top row. For example, if you pick the Euro from the left column and move along the horizontal line to the Japanese Yen, the percentage change displayed in the box will represent EUR (base)/JPY (quote).
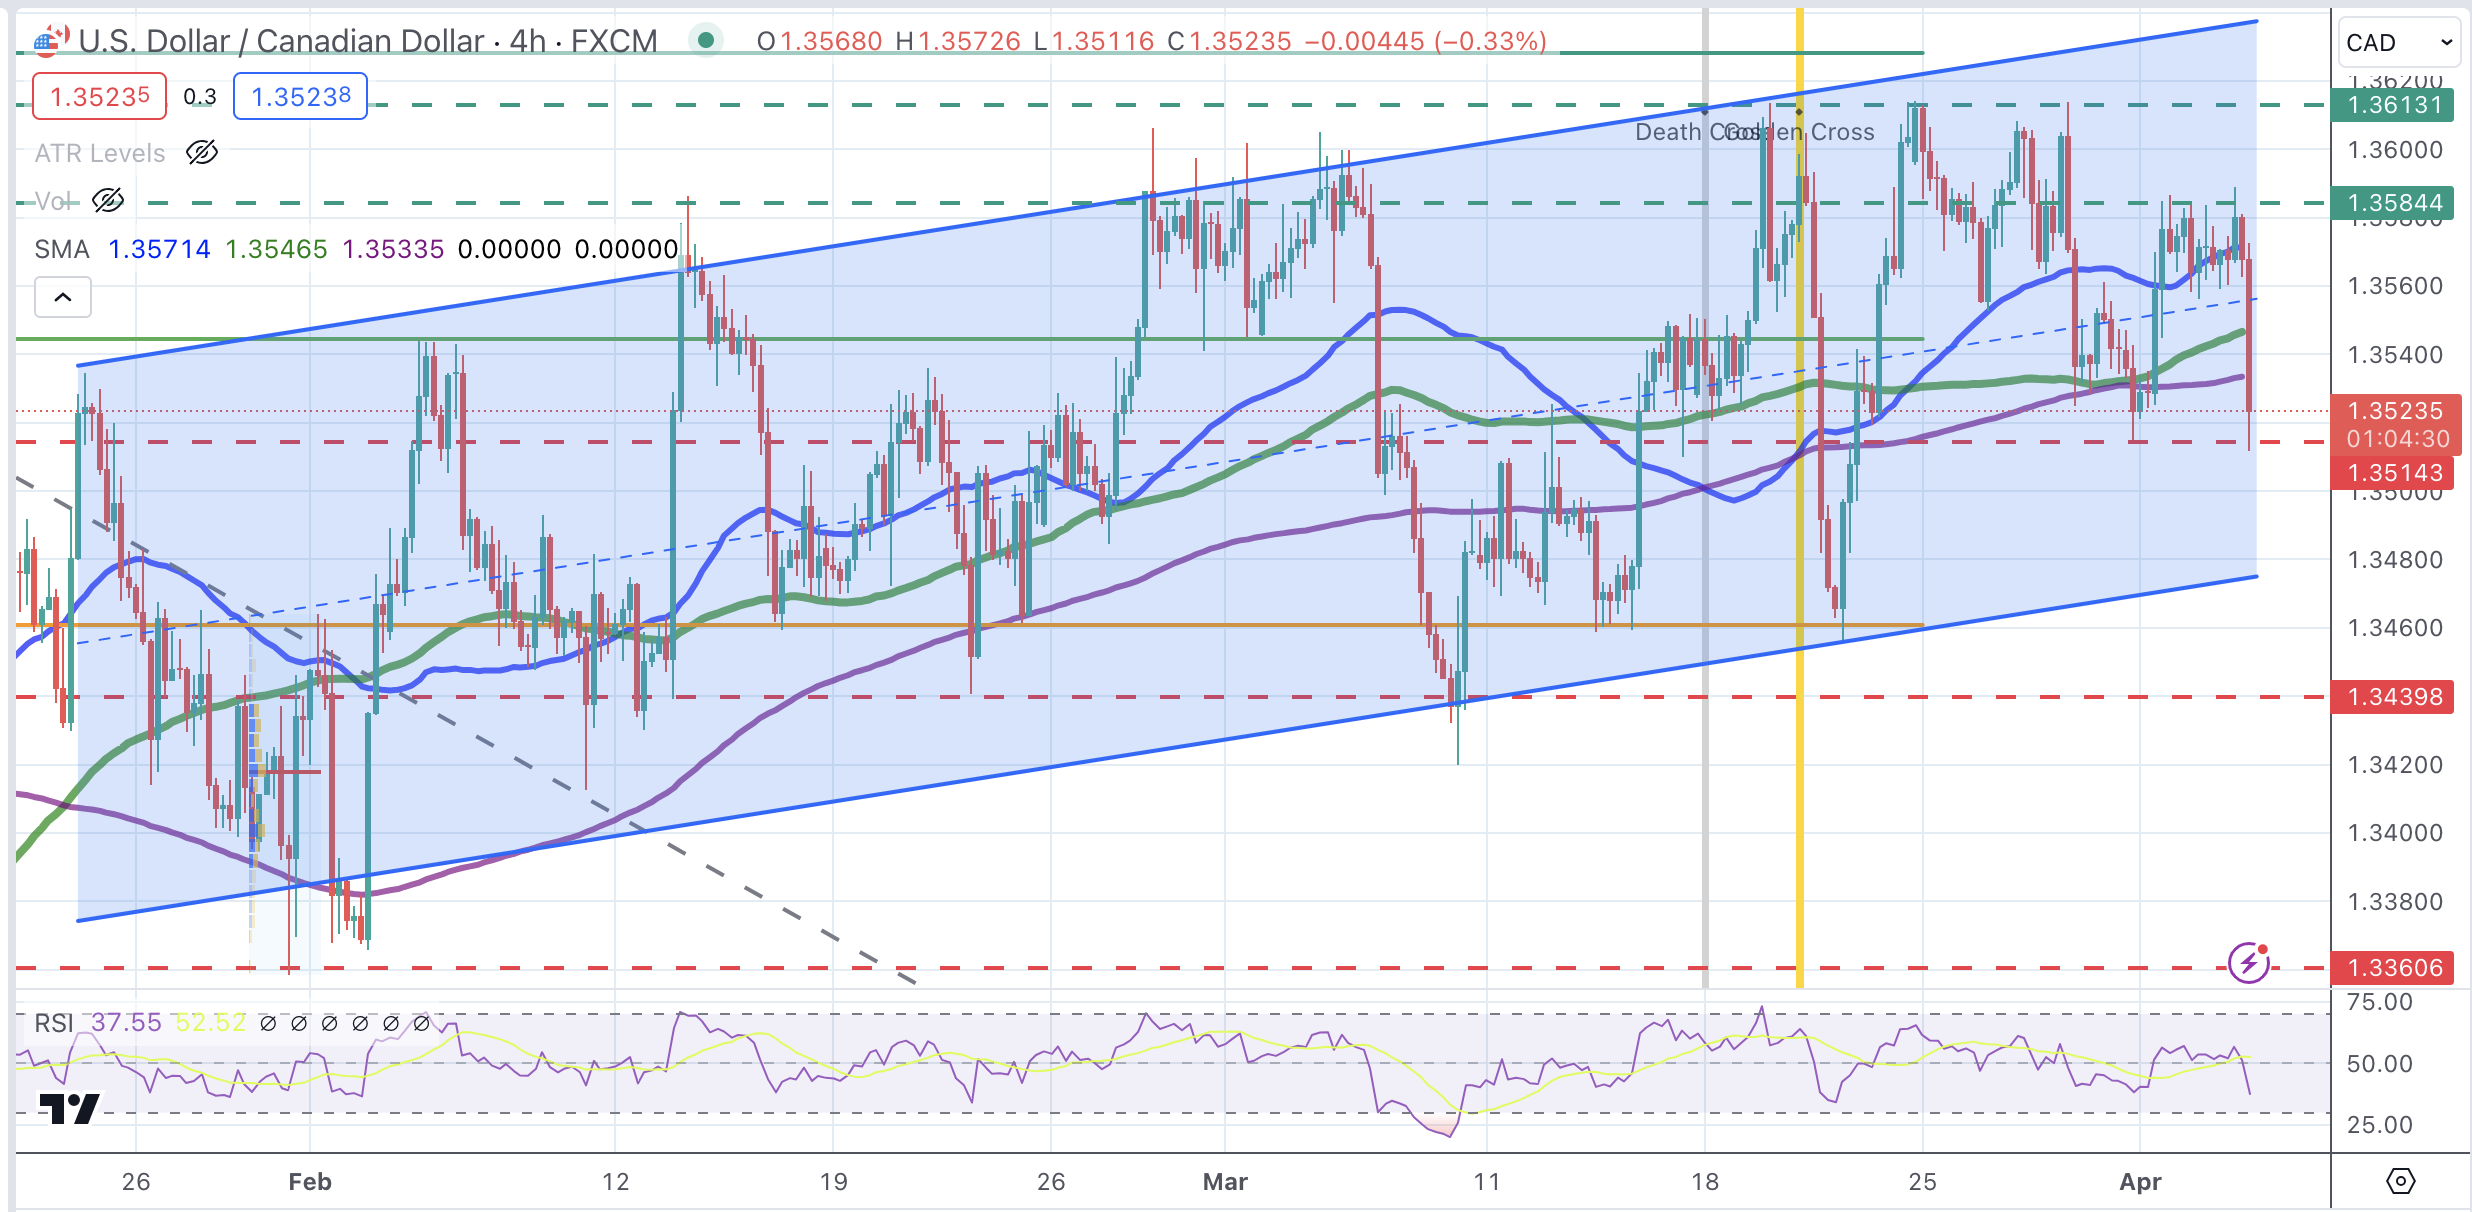
Technical analysis: The USD/CAD is under pressure with support levels at 1.3515 and 1.3475
The strong bearish reversal on the USD/CAD following the release of the ISM Services PMI has put bears back in control. They aim to breach support at 1.3515, which is under pressure at the moment.
The overall picture shows choppy and volatile trading with the pair still moving inside a slightly bullish channel. The mentioned 1.3515 level is guarding the base of the channel at 1.3475 and 1.3440. On the upside, resistances are at 1.3585 and 1.3615.
USD/CAD 4-Hour Chart
- USD/CHF faces selling pressure near 0.9100 as US Dollar drops on weak ISM Services PMI data.
- Fed’s hawkish guidance has dented Fed rate cut expectations for June.
- Swiss weak Retail Sales boost speculation for more rate cuts by the SNB.
The USD/CHF pair faces a sharp sell-off near the round-level resistance of 0.9100 as the United States Institute of Supply Management (ISM) has reported weak Services PMI data for March. The Services PMI, which represents the service sector that accounts for two-thirds of the US economy, falls to 51.4 from expectations of 52.7 and the prior reading of 52.6.
The US Dollar has faced significant selling pressure after weak US Services PMI data. The US Dollar Index (DXY), which tracks the Greenback’s value against six major currencies, drop to 104.40. The market sentiment improves as the S&P 500 has added significant gains after a subdued opening
Meanwhile, market expectations for the Federal Reserve (Fed) reducing interest rates from the June meeting have eased significantly. The CME FedWatch tool shows that traders are pricing in a 54% chance that the Fed will trim interest rates in June, down from 70% a week ago. 10-year US Treasury yields rise to 4.39%.
Market prospects for the Fed pivoting to rate cuts have eased due to hawkish guidance from Fed policymakers. Atlanta Fed Bank President Raphael Bostic told CNBC that he sees the central bank reducing interest rates only once this year as the economy is maintaining strong momentum.
This week, investors will keenly focus on the US Nonfarm Payrolls (NFP) data for March, which will be published on Friday.
On the Swiss Franc front, weak Real Retail Sales have boosted expectations of more rate cuts by the Swiss National Bank (SNB). The Retail Sales data, which represents consumer spending, surprisingly dropped by 0.2% while investors projected a growth of 0.4%. Deepening cost-of-living crisis would force SNB policymakers to consider more quantitative easing decisions.
- US ISM Services PMI declined in March but held above 50.
- US Dollar Index stays in negative territory near 104.50.
Business activity in the US service sector continued to expand in March, albeit at a more moderate pace than in February, with the ISM Services PMI edging lower to 51.4 from 52.6. This reading came in below the market expectation of 52.7.
Other details of the report showed that the Prices Paid Index, the inflation component, declined to 53.4 from 58.6, while the Employment Index recovered to 48.5 from 48.0, reflecting a continuing decrease in the sector's payrolls.
Assessing the survey's findings, "the decrease in the rate of growth in March and the decline in the composite index is a result of slower new orders growth, faster supplier deliveries and a contraction in employment," said Anthony Nieves, Chair of the Institute for Supply Management Services Business Survey Committee, and continued:
"The report continued to reflect growth month over month. Respondents indicated continuing improvement in logistics and the supply chain. Employment challenges remain a combination of difficulties in backfilling positions and/or controlling labor expenses."
Market reaction
The US Dollar came under selling pressure with the immediate reaction to the PMI data. At the time of press, the US Dollar Index was down 0.25% on the day at 104.49.
- USD/CAD is steadily channeling higher on US Dollar strength.
- Underneath price lie the three most important Moving Averages providing a safety net.
- Price is marginally biased to continue rising within the bullish channel.
USD/CAD is broadly channeling higher on the daily chart as the US Dollar (USD) steadily appreciates against the Canadian Dollar (CAD).
The range stretches from around the 1.3600s to the 1.3400s at the moment, although it is incrementally slanting higher.
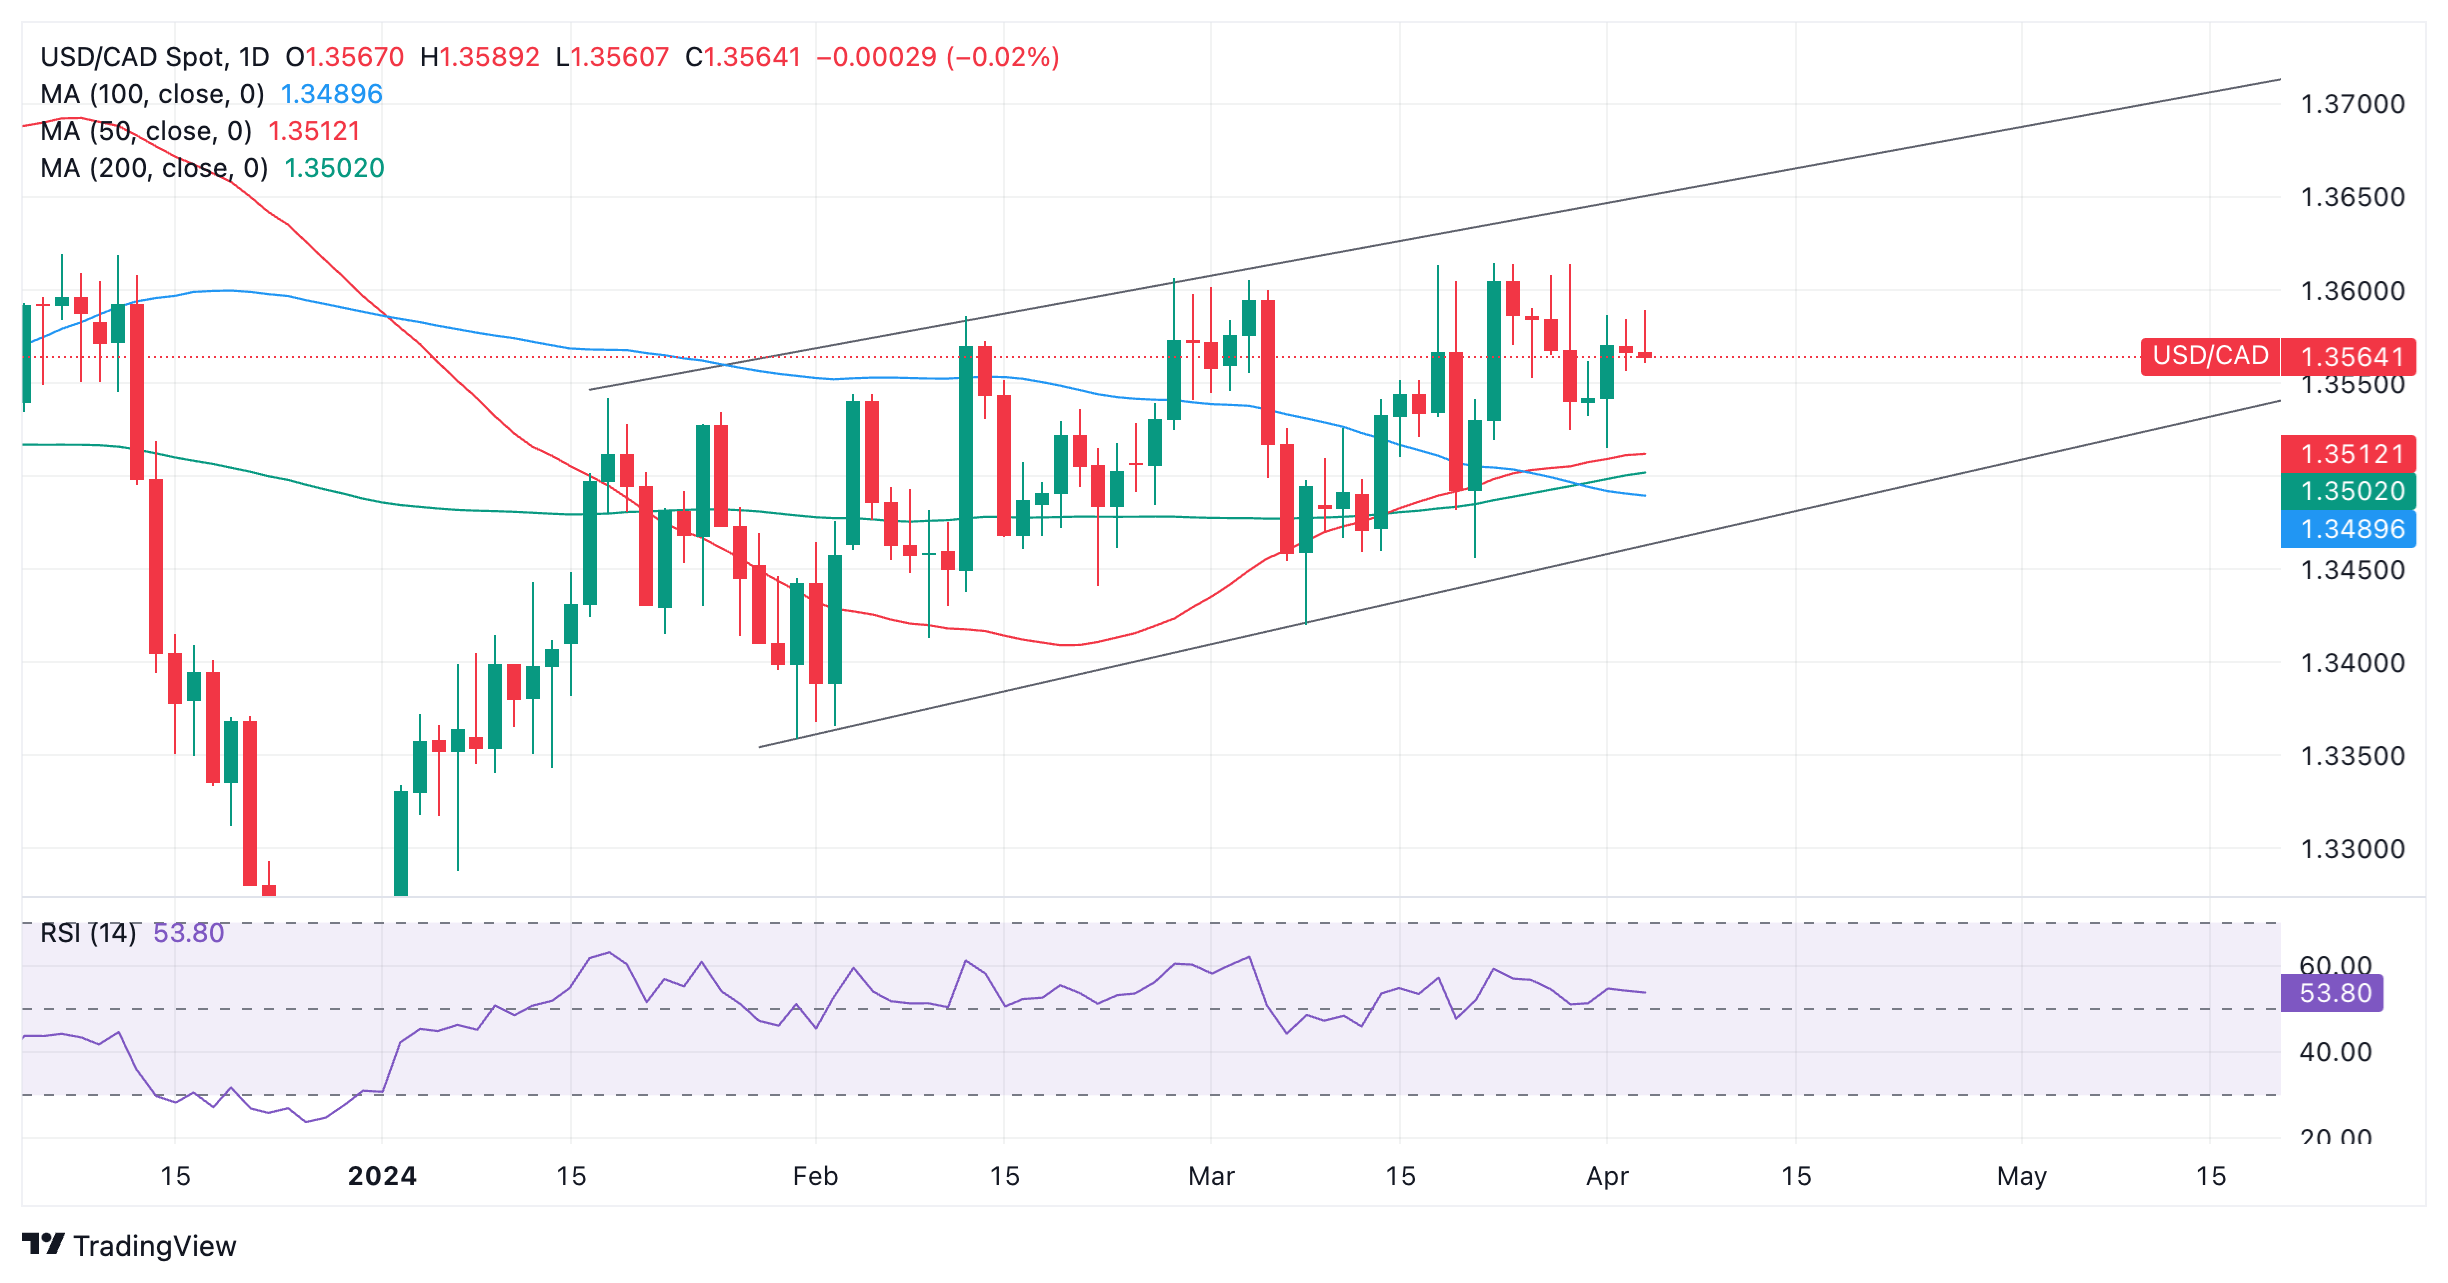
US Dollar versus Canadian Dollar: Daily chart
USD/CAD is currently trading plum in the middle of the channel as it seesaws between tepid gains and losses.
Given the bullish slant to the channel there is a slight but not significant bias for more upside and the pair could rise to the top of the channel at roughly 1.3675.
Clustering just beneath price action around the 1.3500 level are the three most important Moving Averages – the 50, 100 and 200-day (Simple Moving Averages). These are key because they are not only followed by private investors but also institutional players.
Additionally, on the chart of USD/CAD it is notable how price action has respected the support cushion provided by these SMAs on several occasions during the formation of the channel.
A move down from the current level in the mid 1.3500s will find support at the first SMA, the 50-day, at 1.3512, and probably bounce. Even if it penetrates below it is likely to find support from the 200-day SMA at 1.3502.
If it gets through all three SMAs the bottom of the channel comes in with further support at roughly 1.3470.
- USD/JPY hovers near historic highs around 152.00 ahead of Fed Powell’s speech.
- The US ADP Employment report for March has indicated that private labor demand remains strong.
- Investors remain uncertain over Japan’s wage growth spiral.
The USD/JPY pair rebounds to historic highs of 152.00 in Wednesday’s early American session. The asset is expected to extend its upside by easing expectations that the Federal Reserve (Fed) will begin reducing interest rates from the June meeting.
Fed policymakers don’t see any urgency for rate cuts as labor market conditions are tight and the economic outlook is strong. On Tuesday, Cleveland Fed Bank President Loretta Mester said that the central bank sees more risk in cutting interest rates too early. Fed Mester added: “With labor markets and economic growth both being very solid, we do not need to take that risk”. At the same time, she sees three rate cuts as “reasonable” this year.
Meanwhile, the United States ADP reported upbeat employment data for March. The agency reported that private employers hired 184K new workers against expectations of 148K and the prior reading of 155K (revised up from 140K).
Going forward, investors will focus on Fed Chairman Jerome Powell's speech, which is expected at 16:10 GMT. Powell is expected to provide cues about when the central bank will pivot to rate cuts.
Meanwhile, the Japanese Yen is broadly weak as investors lack confidence that the Bank of Japan (BoJ) will tighten its policy sooner due to uncertainty over the wage growth spiral. Investors seem to have digested fears of Japan’s intervention in the FX domain to support the Japanese Yen.
- AUD/USD pauses its slide from the March 8 highs following the release of the RBA minutes.
- The minutes showed risks to the outlook as more balanced and notably did not mention discussing raising interest rates.
- US data showed a rise in payrolls commensurate with the US’s solid run of employment data.
The AUD/USD trades marginally higher in the 0.6510s midweek after pivoting and temporarily pausing its almost-month-long broad slide down from the early March 0.6660 highs.
The key event for the Australian Dollar was the release of the Reserve Bank of Australia (RBA) meeting minutes from the March policy meeting on Tuesday.
In the minutes, a shift in language was noted by the mention, for the first time, that the Board had not considered the option to raise interest rates.
On monetary policy, the central thrust appeared to be that the Board agreed “it was difficult to either rule in or out future changes in cash rate,” a statement repeated several times in the minutes.
The balance of risks to the outlook had changed and were “a little more even” than previously, it was noted.
The minutes showed a shift from a slightly hawkish view to a more “neutral stance,” according to analysts at Westpac.
In the US, data out on Wednesday showed ADP Employment Change private payrolls registered a rise of 184,000 new workers starting jobs in the month of March, beating analysts’ expectations of 148,000.
The prior month was revised up from 140,000 to 155,000. The data continued the theme of a robust US labor market, which is likely to support the US Dollar (USD) going forward.
Other data from Australia showed CoreLogic March house prices rose 0.6%, matching February’s monthly gain, while the Melbourne Institute inflation gauge eased to 3.8% YoY from 4.0% YoY.
Atlanta Federal Reserve Bank President Raphael Bostic told CNBC on Wednesday that he is forecasting the US central bank to lower the policy rate just one time this year.
Key quotes
"Economy is maintaining strong momentum it has had."
"If there is any weakening, it's at a very incremental level."
"Over longer arc, economy does need to slow to get to longer-run potential."
"I think you can still get growth and get inflation to continue to come down."
"But in that environment, inflation would come down much slower than expected."
"That's partly why I changed my forecast as fed would have to be more patient than expected."
"I am still forecasting one rate cut this year."
"We are going to have to watch and wait and see how things evolve."
"If economy evolves as I expect, I think appropriate to cut rates in Q4 this year."
"My outlook right now is inflation will drop incrementally through 2024."
"I think we won't be back to 2% inflation target until 2026."
"The road is going to be bumpy, over last several months inflation hasn't moved very much relative to 2023."
"I am not in a rush to disrupt economy's dynamic as long as inflation is moving toward our target rate."
"That said, if employment starts to degrade I would have to take that on board."
"My contacts are not giving me any concerns on employment though."
Market reaction
The US Dollar Index showed no immediate reaction to these comments and was last seen losing 0.04% on the day at 104.70.
- Gold price rises further to $2,290 as investors ignore higher bond yields.
- Fed policymakers see no urgency for rate cuts.
- Investors await the US ADP Employment Change, Services PMI, and Fed Powell’s speech.
Gold price (XAU/USD) falls after refreshing all-time highs near $2,290 in Wednesday’s European session on multiple tailwinds. The near-term demand for the precious metal is upbeat due to deepening geopolitical tensions in Eastern Europe and the Middle East regions. Escalating geopolitical tensions have increased demand for safe-haven assets, providing strength to bullions. This is offsetting the impact of higher bond yields and waning Federal Reserve (Fed) rate cut expectations for the June meeting.
10-year US Treasury yields rise to 4.37% as Fed policymakers see no need to hurry for rate cuts due to a strong economic outlook and tight labor market conditions. Cleveland Fed Bank President Loretta Mester, “I think the bigger risk would be to begin reducing the funds rate too early.” Fed’s pivot to rate cuts could tighten the labor market further, which will eventually increase wage growth and revamp inflation. Generally, higher bond yields dampen Gold’s appeal as they increase the opportunity cost of holding investment in the latter.
This week, the major event will be the United States Nonfarm Payrolls (NFP) data, which will be published on Friday. The labor market data will influence market expectations for Fed rate cuts in June.
Daily digest market movers: Gold price rises while US Dollar corrects
- Gold price keeps rising as geopolitical tensions strengthen the safe-haven bid and the US Dollar corrects from fresh four-month highs. Rising geopolitical tensions lead investors towards safe-haven assets such as Gold.
- In the eastern part of Europe, continuous drone attacks from Ukraine on Russian Oil refineries have resulted in a fresh escalation in the Moscow-Kyiv tensions. US President Joe Biden criticized the event of Ukraine targeting Russia’s Oil infrastructure as it could have drastic consequences for global Oil prices.
- In the Middle East, Iran vows to retaliate on the deaths of their high-ranking commanders in an attack at the Iranian embassy in Damascus by the Israeli army. This has deepened fears of Iran’s direct entry into Israel-Palestine tensions. Moreover, the killing of seven aid workers in Gaza on Tuesday after an Israeli attack has also raised tensions between Israel and some of its main allies in the West.
- Meanwhile, the US Dollar Index (DXY) corrects to 104.70 from a four-month high at 105.10 even though Federal Reserve policymakers seem to be leaning towards delaying interest-rate cuts until later than June.
- Cleveland Fed Bank President Loretta Mester and San Francisco Fed Bank President Mary Daly spoke on Tuesday. They both suggested that the Fed sees more risk in cutting interest rates too early. Fed Mester added: “With labor markets and economic growth both being very solid, we do not need to take that risk.” Both policymakers see three rate cuts as “reasonable” this year.
- In Wednesday’s session, investors will focus on Fed Chairman Jerome Powell’s speech and the economic data such as ADP Employment Change and the ISM Services PMI data for March. Powell is expected to provide cues about when the central bank will pivot to rate cuts.
- US private employers are anticipated to have hired 148K job-seekers, slightly higher from 140K payrolls in February. The ISM is expected to report that the Services PMI rose marginally to 52.7 from 52.6 in February.
Technical Analysis: Gold price prints fresh lifetime highs near $2,290
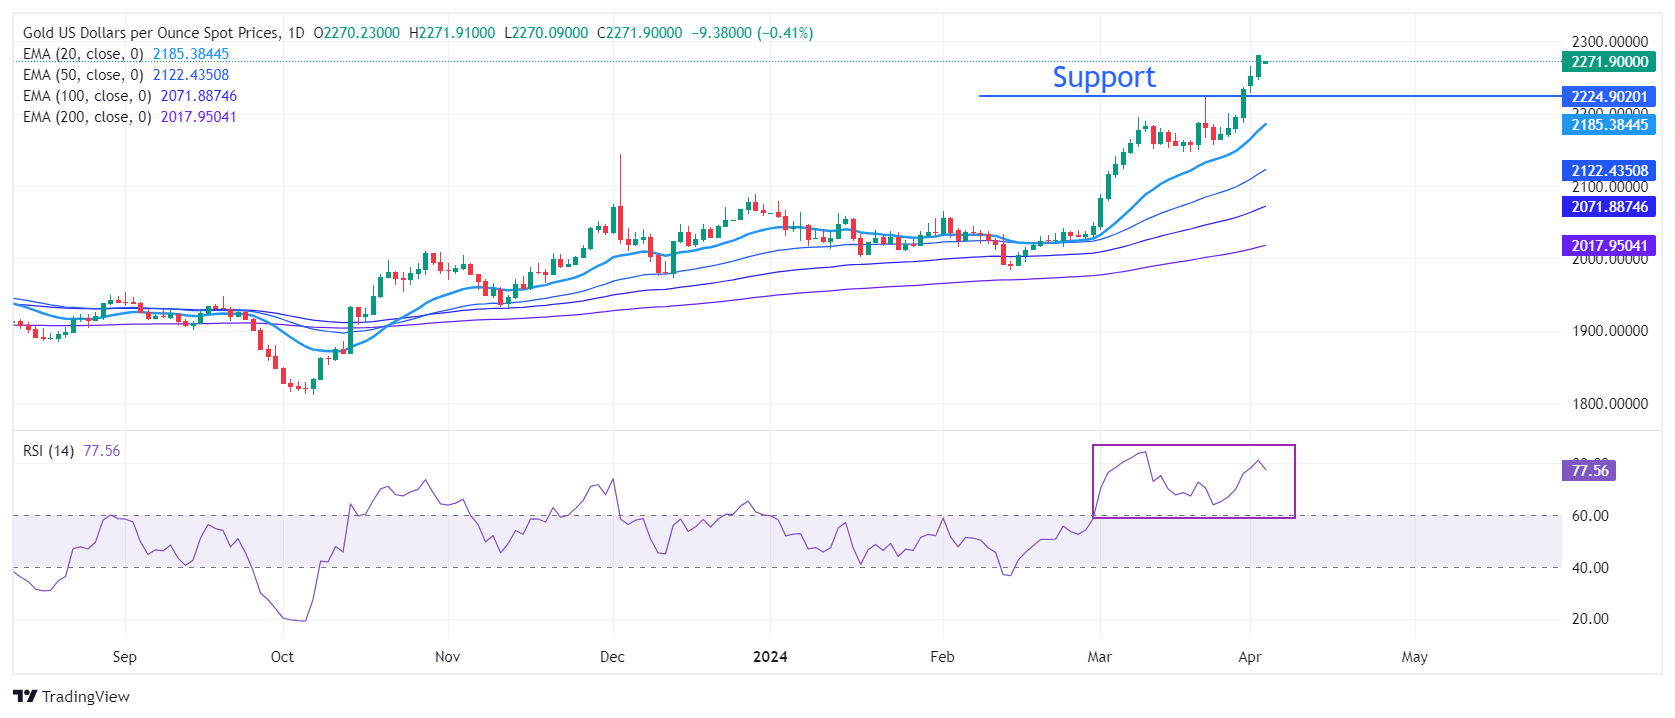
Gold price secures another milestone in Wednesday’s session. The precious metal prints a fresh all-time high near $2,290 after extending above Tuesday’s high of $2,275. However, the yellow metal struggles to continue its six-day winning spell as momentum oscillators have turned extremely overbought. The 14-period Relative Strength Index (RSI) tests 80.00.
The near-term demand is strong as the RSI has been oscillating in the bullish range of 60.00-80.00 for more than a month, making it a “buy on dips” contender.
All short-to-long term Exponential Moving Averages (EMAs) are sloping higher, suggesting strong near-term demand. On the downside, March 21 high at $2,223 will be a major support area for the Gold price bulls.
Gold FAQs
Gold has played a key role in human’s history as it has been widely used as a store of value and medium of exchange. Currently, apart from its shine and usage for jewelry, the precious metal is widely seen as a safe-haven asset, meaning that it is considered a good investment during turbulent times. Gold is also widely seen as a hedge against inflation and against depreciating currencies as it doesn’t rely on any specific issuer or government.
Central banks are the biggest Gold holders. In their aim to support their currencies in turbulent times, central banks tend to diversify their reserves and buy Gold to improve the perceived strength of the economy and the currency. High Gold reserves can be a source of trust for a country’s solvency. Central banks added 1,136 tonnes of Gold worth around $70 billion to their reserves in 2022, according to data from the World Gold Council. This is the highest yearly purchase since records began. Central banks from emerging economies such as China, India and Turkey are quickly increasing their Gold reserves.
Gold has an inverse correlation with the US Dollar and US Treasuries, which are both major reserve and safe-haven assets. When the Dollar depreciates, Gold tends to rise, enabling investors and central banks to diversify their assets in turbulent times. Gold is also inversely correlated with risk assets. A rally in the stock market tends to weaken Gold price, while sell-offs in riskier markets tend to favor the precious metal.
The price can move due to a wide range of factors. Geopolitical instability or fears of a deep recession can quickly make Gold price escalate due to its safe-haven status. As a yield-less asset, Gold tends to rise with lower interest rates, while higher cost of money usually weighs down on the yellow metal. Still, most moves depend on how the US Dollar (USD) behaves as the asset is priced in dollars (XAU/USD). A strong Dollar tends to keep the price of Gold controlled, whereas a weaker Dollar is likely to push Gold prices up.
- Silver price drops slightly from fresh two-year of $26.30 ahead of key events.
- The near-term appeal is upbeat due to deepening geopolitical tensions.
- The US Dollar corrects ahead of Fed Powell speech.
Silver price (XAG/USD) faces nominal selling pressure after printing a fresh two-year high at $26.30 in the European session on Wednesday. The near-term demand for the white metal is upbeat due to deepening geopolitical tensions and a correction in the US Dollar.
Major agencies have accused Israel’s military for targeting charity staff who were advised to deliver necessities to civilians in Gaza. Non-yielding assets, such as Silver, expect higher investment in times of geopolitical uncertainty.
Meanwhile, a corrective move in the US Dollar has also boosted demand for silver. The US Dollar Index (DXY) drops to 104.73 despite upbeat United States Manufacturing PMI for March has improved the economic outlook.
In today’s session, investors will focus on the Federal Reserve (Fed) Chairman Jerome Powell’s speech, and the release of the ADP Employment Change and the Services PMI for March. Fed Powell’s speech could provide clues about when the central bank will start reducing interest rates. The ADP agency will report the number of jobseekers recruited by private employers.
Later this week, the release of the US Nonfarm Payrolls (NFP) data for March will be the major event. The official labor market data could influence market expectations for Fed rate cuts at the June meeting.
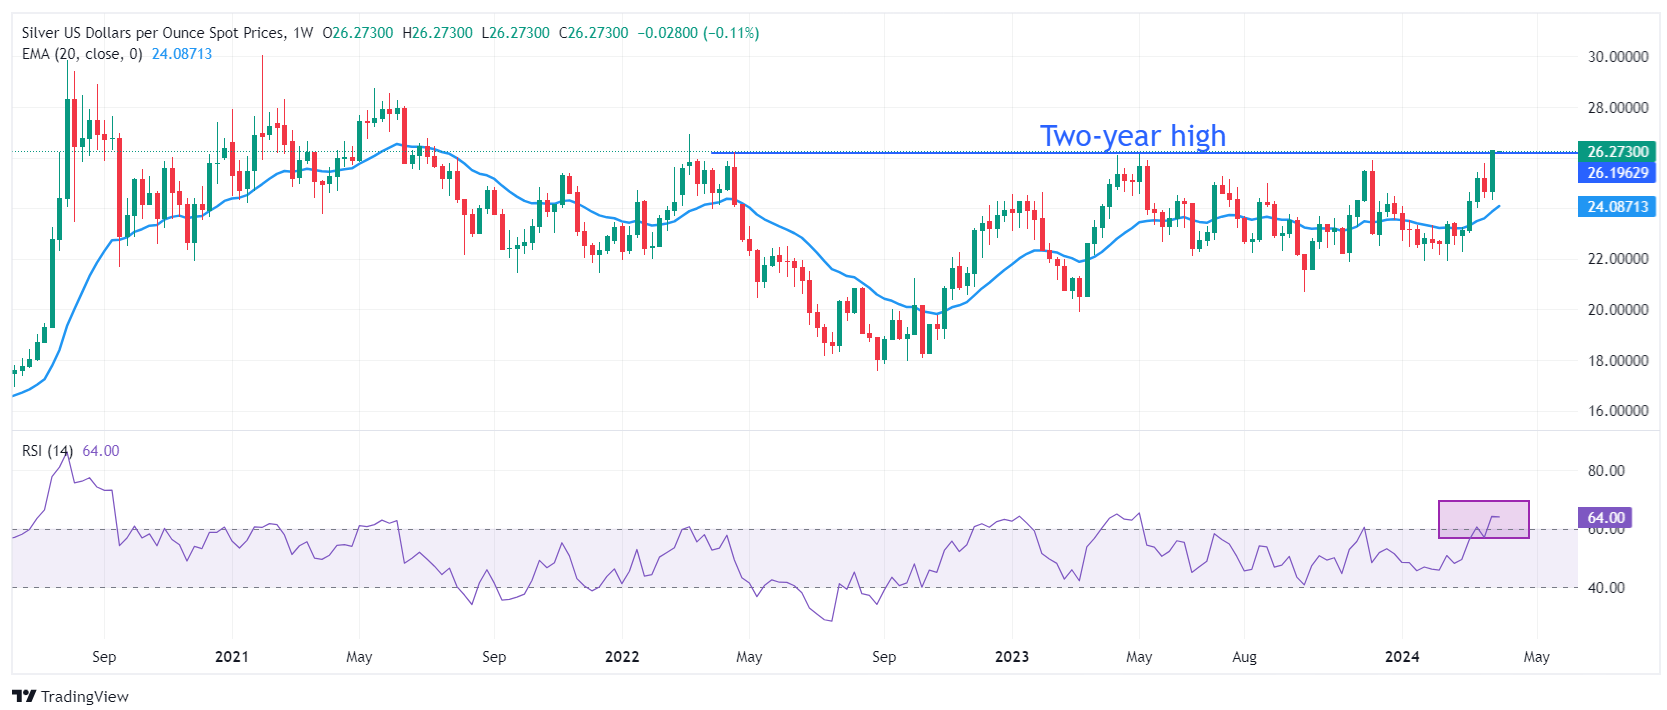
Silver technical analysis
Silver price prints a fresh two-year high at $25.30 after break above the crucial resistance of $26.22, plotted from 22 April 2022. The near-term demand is strong as the 20-week Exponential Moving Average (EMA) at $24.08 is sloping higher.
The 14-period Relative Strength Index (RSI) moves into the bullish range of 60.00-80.00, indicating that momentum towards the upside is strong.
- The New Zealand Dollar extends its downtrend in most pairs as broadly weak fundamentals exert pressure.
- RBNZ governor Orr says the bank is “laser-focused” on beating inflation.
- Technically, price could be about to correct higher within a persistent downtrend.
The New Zealand Dollar (NZD) edges lower in its most heavily-traded pairs on Wednesday following the trend of the previous weeks as bearish fundamentals, including an overall negative outlook for growth, continue to weigh.
Recent comments from the Reserve Bank of New Zealand (RBNZ) Governor Adrian Orr failed to give the Kiwi much support, despite the prospect of the RBNZ maintaining relatively high interest rates. Orr stressed the importance of battling too-high inflation in a speech on Tuesday.
Normally higher interest rates help a currency as they attract more foreign capital inflows but in the case of New Zealand this does not appear to be the case. It is possible this is because the high inflation is accompanied by weak growth after the economy fell into a technical recession in the fourth quarter of 2023.
New Zealand Dollar in downtrend as negative fundamentals weigh
The New Zealand Dollar is under pressure. The latest figures from Statistics New Zealand showed the New Zealand economy contracted by 0.1% in Q4 of 2023 following a 0.3% contraction in Q3.
At the same time, headline inflation remained relatively high at 4.7% during the same reporting period, although it showed a slowdown from the 5.6% recorded in Q3.
Normally weak growth would call for lower interest rates. However, the Reserve Bank of New Zealand (RBNZ) cannot cut interest rates because of too-high inflation. Elevated price growth is partly a result of structural issues such as a tight labor market, which in turn keeps wage inflation high.
In his speech on Tuesday, Governor Orr said the RBNZ remains “laser-focused on its job to control inflation.”
“We're now in a much happier space, where most central banks feel we're back on top of inflation, [but we are] not there yet,” he added.
Technical Analysis: New Zealand Dollar could undergo a correction
NZD/USD is falling in the final wave C of a bearish three-wave pattern, known as a Measured Move. This type of pattern is made up of three waves, usually labeled ABC.
The end of wave C can be calculated because it is often the same length or a 0.618 Fibonacci ratio of wave A. According to that method of forecasting, wave C still has a way to go before completing.
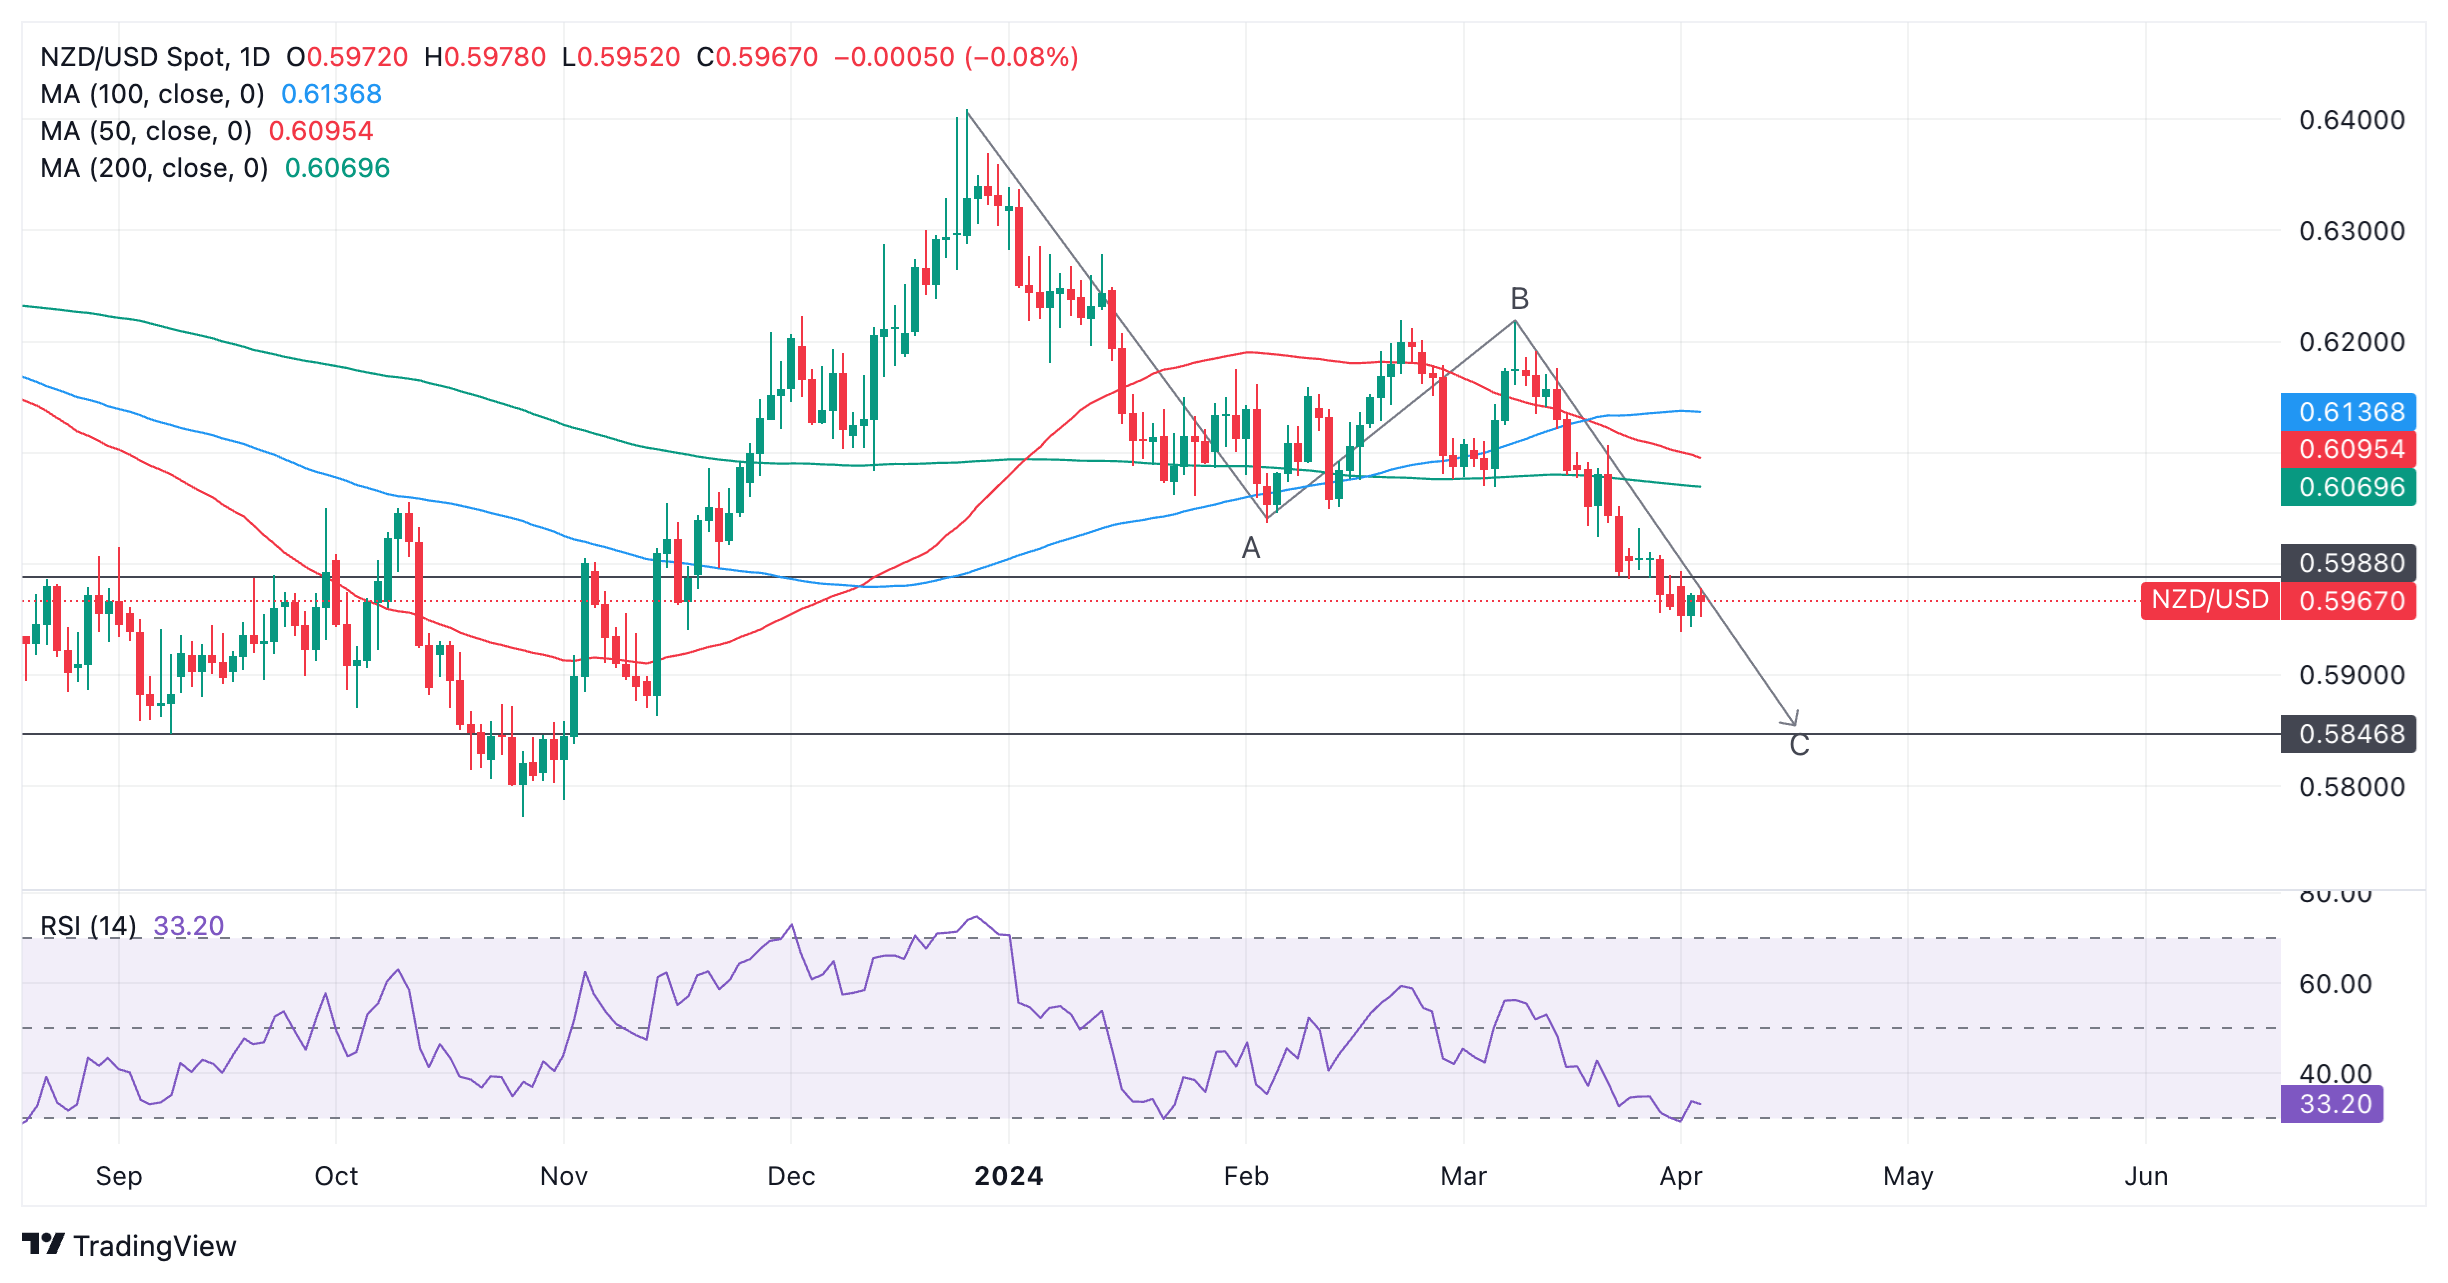
New Zealand Dollar versus US Dollar: Daily chart
Assuming the pattern unfolds as expected, NZD/USD is likely to fall to a target at roughly 0.5847, corresponding to the end of wave C. It has already met the conservative target measured using the 0.618 Fibonacci ratio of wave A, at 0.5988.
The bearish outlook is complicated by The Relative Strength Index (RSI) momentum indicator, however, which briefly dipped into oversold territory on Monday and then recovered on Tuesday. The entry and then exit from oversold levels is a buy signal. It recommends that short sellers should close their bets and open longs. It suggests the possibility of a correction evolving.
It is therefore quite possible NZD/USD could undergo some upside before eventually continuing lower in line with the dominant downtrend, towards the target generated by the Measured Move.
New Zealand Dollar FAQs
The New Zealand Dollar (NZD), also known as the Kiwi, is a well-known traded currency among investors. Its value is broadly determined by the health of the New Zealand economy and the country’s central bank policy. Still, there are some unique particularities that also can make NZD move. The performance of the Chinese economy tends to move the Kiwi because China is New Zealand’s biggest trading partner. Bad news for the Chinese economy likely means less New Zealand exports to the country, hitting the economy and thus its currency. Another factor moving NZD is dairy prices as the dairy industry is New Zealand’s main export. High dairy prices boost export income, contributing positively to the economy and thus to the NZD.
The Reserve Bank of New Zealand (RBNZ) aims to achieve and maintain an inflation rate between 1% and 3% over the medium term, with a focus to keep it near the 2% mid-point. To this end, the bank sets an appropriate level of interest rates. When inflation is too high, the RBNZ will increase interest rates to cool the economy, but the move will also make bond yields higher, increasing investors’ appeal to invest in the country and thus boosting NZD. On the contrary, lower interest rates tend to weaken NZD. The so-called rate differential, or how rates in New Zealand are or are expected to be compared to the ones set by the US Federal Reserve, can also play a key role in moving the NZD/USD pair.
Macroeconomic data releases in New Zealand are key to assess the state of the economy and can impact the New Zealand Dollar’s (NZD) valuation. A strong economy, based on high economic growth, low unemployment and high confidence is good for NZD. High economic growth attracts foreign investment and may encourage the Reserve Bank of New Zealand to increase interest rates, if this economic strength comes together with elevated inflation. Conversely, if economic data is weak, NZD is likely to depreciate.
The New Zealand Dollar (NZD) tends to strengthen during risk-on periods, or when investors perceive that broader market risks are low and are optimistic about growth. This tends to lead to a more favorable outlook for commodities and so-called ‘commodity currencies’ such as the Kiwi. Conversely, NZD tends to weaken at times of market turbulence or economic uncertainty as investors tend to sell higher-risk assets and flee to the more-stable safe havens.
- AUD/JPY retraces its recent gains on risk-off sentiment on Wednesday.
- JPY could have received some support from the fear of intervention by Japanese authorities.
- Australian Dollar weakens as the ASX 200 Index extends losses.
AUD/JPY edges lower to near 98.70 during the European session on Wednesday. The prevailing risk-off sentiment bolsters demand for the safe-haven Japanese Yen (JPY). Moreover, investors are exercising caution amidst speculation that Japanese authorities may intervene in the markets to prevent a notable depreciation of the Yen.
Despite this, the Bank of Japan's (BoJ) cautious approach towards further policy tightening failed to kindle bullish sentiment or generate significant momentum. Although the Japanese Yen (JPY) encountered difficulties in sustaining its strength in the current market environment.
The Australian Dollar (AUD) faces difficulties attributed to the decline in the ASX 200 Index, consequently exerting downward pressure on the AUD/JPY cross. However, the Australian Industry Group (AiG) Industry Index displayed improvement in February, rising to a reading of -5.3 from the previous -14.9. Similarly, the AiG Manufacturing PMI recorded -7, compared to the prior reading of -12.6.
In the Reserve Bank of Australia (RBA) March minutes, the board indicated that they did not consider the option of raising interest rates. Despite acknowledging the uncertain economic outlook, the board perceived the risks to be generally balanced. Additionally, the board highlighted that it would take "some time" before they could express confidence in inflation returning to the target level.
Additionally, Westpac's summary of the Reserve Bank of Australia (RBA) March meeting minutes stated the current cash rate level is deemed appropriate for the prevailing circumstances, although conditions are subject to potential changes in the future.
- The Pound Sterling faces pressure above 1.2580 on cautious sentiment.
- The UK Manufacturing PMI signaled expansion in March for the first time in two years.
- Investors see the BoE kick-start the rate-cut cycle in June.
The Pound Sterling (GBP) struggles to extend recovery above 1.2580 in Wednesday’s London session. Caution among market participants ahead of the United States Nonfarm Payrolls (NFP) data for March has offset the positive impact of the United Kingdom (UK) Manufacturing PMI’s return to growth.
The UK Manufacturing PMI surprisingly expanded in March after contracting for 20 months, driven by upbeat domestic demand for consumer goods. S&P Global/CIPS reported that business optimism rose to its highest level since April 2023, with 58% of manufacturers expecting their level of production to increase over the coming 12 months. The agency added: “Improved sentiment reflected signs of stronger demand, new product launches, a better trading environment, export opportunities and hopes the cost and supply situations would move closer to normal conditions.”
This week, the GBP/USD pair will be influenced by the US labor market data and market expectations about when the Bank of England (BoE) will start reducing interest rates. Currently, investors’ expectations for rate cuts have been brought forward to the June policy meeting from prior anticipation for August after UK inflation softened more than expected in February.
Daily digest market movers: Pound Sterling recovery stalls
- The Pound Sterling ranges slightly below 1.2600 against the US Dollar (USD) ahead of key events. Investors shift focus to the speech from Federal Reserve Chairman Jerome Powell, which is expected at 16:10 GMT, and the United States NFP data, which will be published on Friday.
- The speech from Fed Powell could provide more cues about when the central bank will start reducing interest rates. Currently, investors expect that the Fed will start reducing borrowing costs from the June meeting. The US Dollar Index (DXY) retreats from a fresh four-month high of 105.10. In today’s session, investors will focus on the ISM Services PMI and the ADP Employment Change data for March.
- On Tuesday, the upbeat S&P Global/CIPS Manufacturing PMI for March supported a rebound for the Pound Sterling. The agency reported that the Manufacturing PMI returned to expansion after contracting for 20 straight months. The Manufacturing PMI rose to 50.3, above the 50.0 threshold, beating expectations and the prior reading of 49.9.
- Apart from the strong recovery in the Manufacturing PMI, British house prices rose 1.6% in March, the highest pace since December 2022. The activity in the housing sector has picked up despite the Bank of England maintaining interest rates at higher levels.
- A strong recovery in the manufacturing and real estate sectors suggests that the recession in the second half of 2023 was likely shallow and that the economy has returned to growth. In such a case, the BoE could achieve a so-called “soft landing” – a situation when an economy gets inflation under control without triggering a recession.
- Going forward, investors will focus on the S&P Global/CIPS Services PMI final data for March, which will be published on Thursday. The Services PMI is forecasted to have remained unchanged from its preliminary reading of 53.4.
Technical Analysis: Pound Sterling struggles to extend recovery above 1.2580

The Pound Sterling faces selling pressure while testing the breakout of last week’s consolidation formed in a range between 1.2575 and 1.2668. The Cable struggles to sustain above the 200-day Exponential Moving Average (EMA), which trades around 1.2570.
On a broader time frame, the horizontal support from December 8 low at 1.2500 would provide further cushion to the Pound Sterling. Meanwhile, the upside is expected to remain limited near an eight-month high of around 1.2900.
The 14-period Relative Strength Index (RSI) dips below 40.00. If it sustains below this level, bearish momentum will trigger.
Pound Sterling FAQs
The Pound Sterling (GBP) is the oldest currency in the world (886 AD) and the official currency of the United Kingdom. It is the fourth most traded unit for foreign exchange (FX) in the world, accounting for 12% of all transactions, averaging $630 billion a day, according to 2022 data. Its key trading pairs are GBP/USD, aka ‘Cable’, which accounts for 11% of FX, GBP/JPY, or the ‘Dragon’ as it is known by traders (3%), and EUR/GBP (2%). The Pound Sterling is issued by the Bank of England (BoE).
The single most important factor influencing the value of the Pound Sterling is monetary policy decided by the Bank of England. The BoE bases its decisions on whether it has achieved its primary goal of “price stability” – a steady inflation rate of around 2%. Its primary tool for achieving this is the adjustment of interest rates. When inflation is too high, the BoE will try to rein it in by raising interest rates, making it more expensive for people and businesses to access credit. This is generally positive for GBP, as higher interest rates make the UK a more attractive place for global investors to park their money. When inflation falls too low it is a sign economic growth is slowing. In this scenario, the BoE will consider lowering interest rates to cheapen credit so businesses will borrow more to invest in growth-generating projects.
Data releases gauge the health of the economy and can impact the value of the Pound Sterling. Indicators such as GDP, Manufacturing and Services PMIs, and employment can all influence the direction of the GBP. A strong economy is good for Sterling. Not only does it attract more foreign investment but it may encourage the BoE to put up interest rates, which will directly strengthen GBP. Otherwise, if economic data is weak, the Pound Sterling is likely to fall.
Another significant data release for the Pound Sterling is the Trade Balance. This indicator measures the difference between what a country earns from its exports and what it spends on imports over a given period. If a country produces highly sought-after exports, its currency will benefit purely from the extra demand created from foreign buyers seeking to purchase these goods. Therefore, a positive net Trade Balance strengthens a currency and vice versa for a negative balance.
- EUR/USD is rebounding from intraday-chart oversold lows.
- Eurozone inflation data on Wednesday could impact interest-rate expectations and the exchange rate.
- The recovery could rise a little further but the short-term trend remains bearish.
EUR/USD is edging higher on Wednesday, making it back into the 1.0770s and extending the previous day’s rebound from six-week lows. It is still too early to say whether the move is corrective in nature or a reversal of the dominant short-term downtrend – but probably the former.
The pair has been bearish since the second week of March, mainly on the back of shifting expectations regarding the outlook for interest rates in Europe and America. In the US, borrowing costs are expected to remain higher for longer, supporting the US Dollar (USD), since higher interest rates attract more foreign capital inflows. This view is unlikely to change much.
EUR/USD: It’s all down to interest rate expectations
On both sides of the Atlantic inflation has been falling, removing the necessity for high interest rates. However, in the US the process has been slower and experts are not as confident it is on its way down to the Fed’s 2.0% target in a sustainable fashion.
Most economists had expected both the European Central Bank (ECB) and the US Federal Reserve (Fed) to begin cutting interest rates at about the same time, in June or thereabouts. However, more recently the outlook has started diverging, with the Fed seen as possibly delaying and the ECB as bringing forward the moment.
EUR/USD rebounded from six-week lows in the 1.0720s on Tuesday although it is unclear what prompted the move. It may have been predominantly technical in nature due to indicators reaching oversold readings on intraday charts.
It is also possible that commentary from Federal Reserve Bank of San Francisco President Mary Daly may have contributed marginally to the recovery as she struck a dovish tone, saying “three rate cuts this year as a ‘reasonable’ baseline,” although she added that three rate cuts was “not a promise.” However, there was no immediate reaction from prices when her words hit the wires.
The HCOB Eurozone Manufacturing PMI could also have provided a catalyst for EUR/USD’s recovery, after it was revised up to 46.1 in March from a flash estimate of 45.7. However, it remains below 50 and therefore in contraction territory. Additionally, the US ISM manufacturing PMI on Monday was even better and actually rose above 50 to 50.3 in March – reaching growth territory for the first time since November 2022.
On the horizon
On Wednesday, EUR/USD could be impacted by Eurozone inflation data when the Harmonized Index of Consumer Prices (HICP) and the Unemployment Rate are released at 09:00 GMT. If HICP inflation is shown to have cooled considerably then it could weaken the pair as it will increase the chances of an even earlier interest-rate cut from the ECB, raising even the possibility of a cut in April.
German inflation data, which came out on Tuesday, ticked lower to 2.2% YoY in line with expectations and below the 2.5% in February. The German Harmonized Index of Consumer Prices, however, fell short of expectations at 2.3%, suggesting a risk of a similar weakness for Eurozone-wide HICP.
In the US the main data release on Wednesday will probably be ADP Employment Change at 12:15 GMT, seconded by the final S&P Global Services PMI and the ISM Services PMI. Services inflation is seen as one of the stickiest components in the CPI basket so markets may pay extra attention if the real figure diverges from expectations.
More Fedspeak is also in the offing with Fed's Bowman, Goolsbee, Barr, Kugler, and Powell all due to speak.
Technical Analysis: EUR/USD bounces off new lows
EUR/USD rebounded from short-term multi-week lows in the 1.0720s on Tuesday and in the process formed a bullish Piercing Line Japanese candlestick reversal pattern on the daily chart. This occurs when price makes a new low but on the same day recovers and closes above the midpoint of the previous day.
The pattern could indicate a temporary continuation of the rebound higher, with the next key resistance coming into play at the resistance level from the swing low (and B wave low of the prior ABC pattern) at 1.0798.
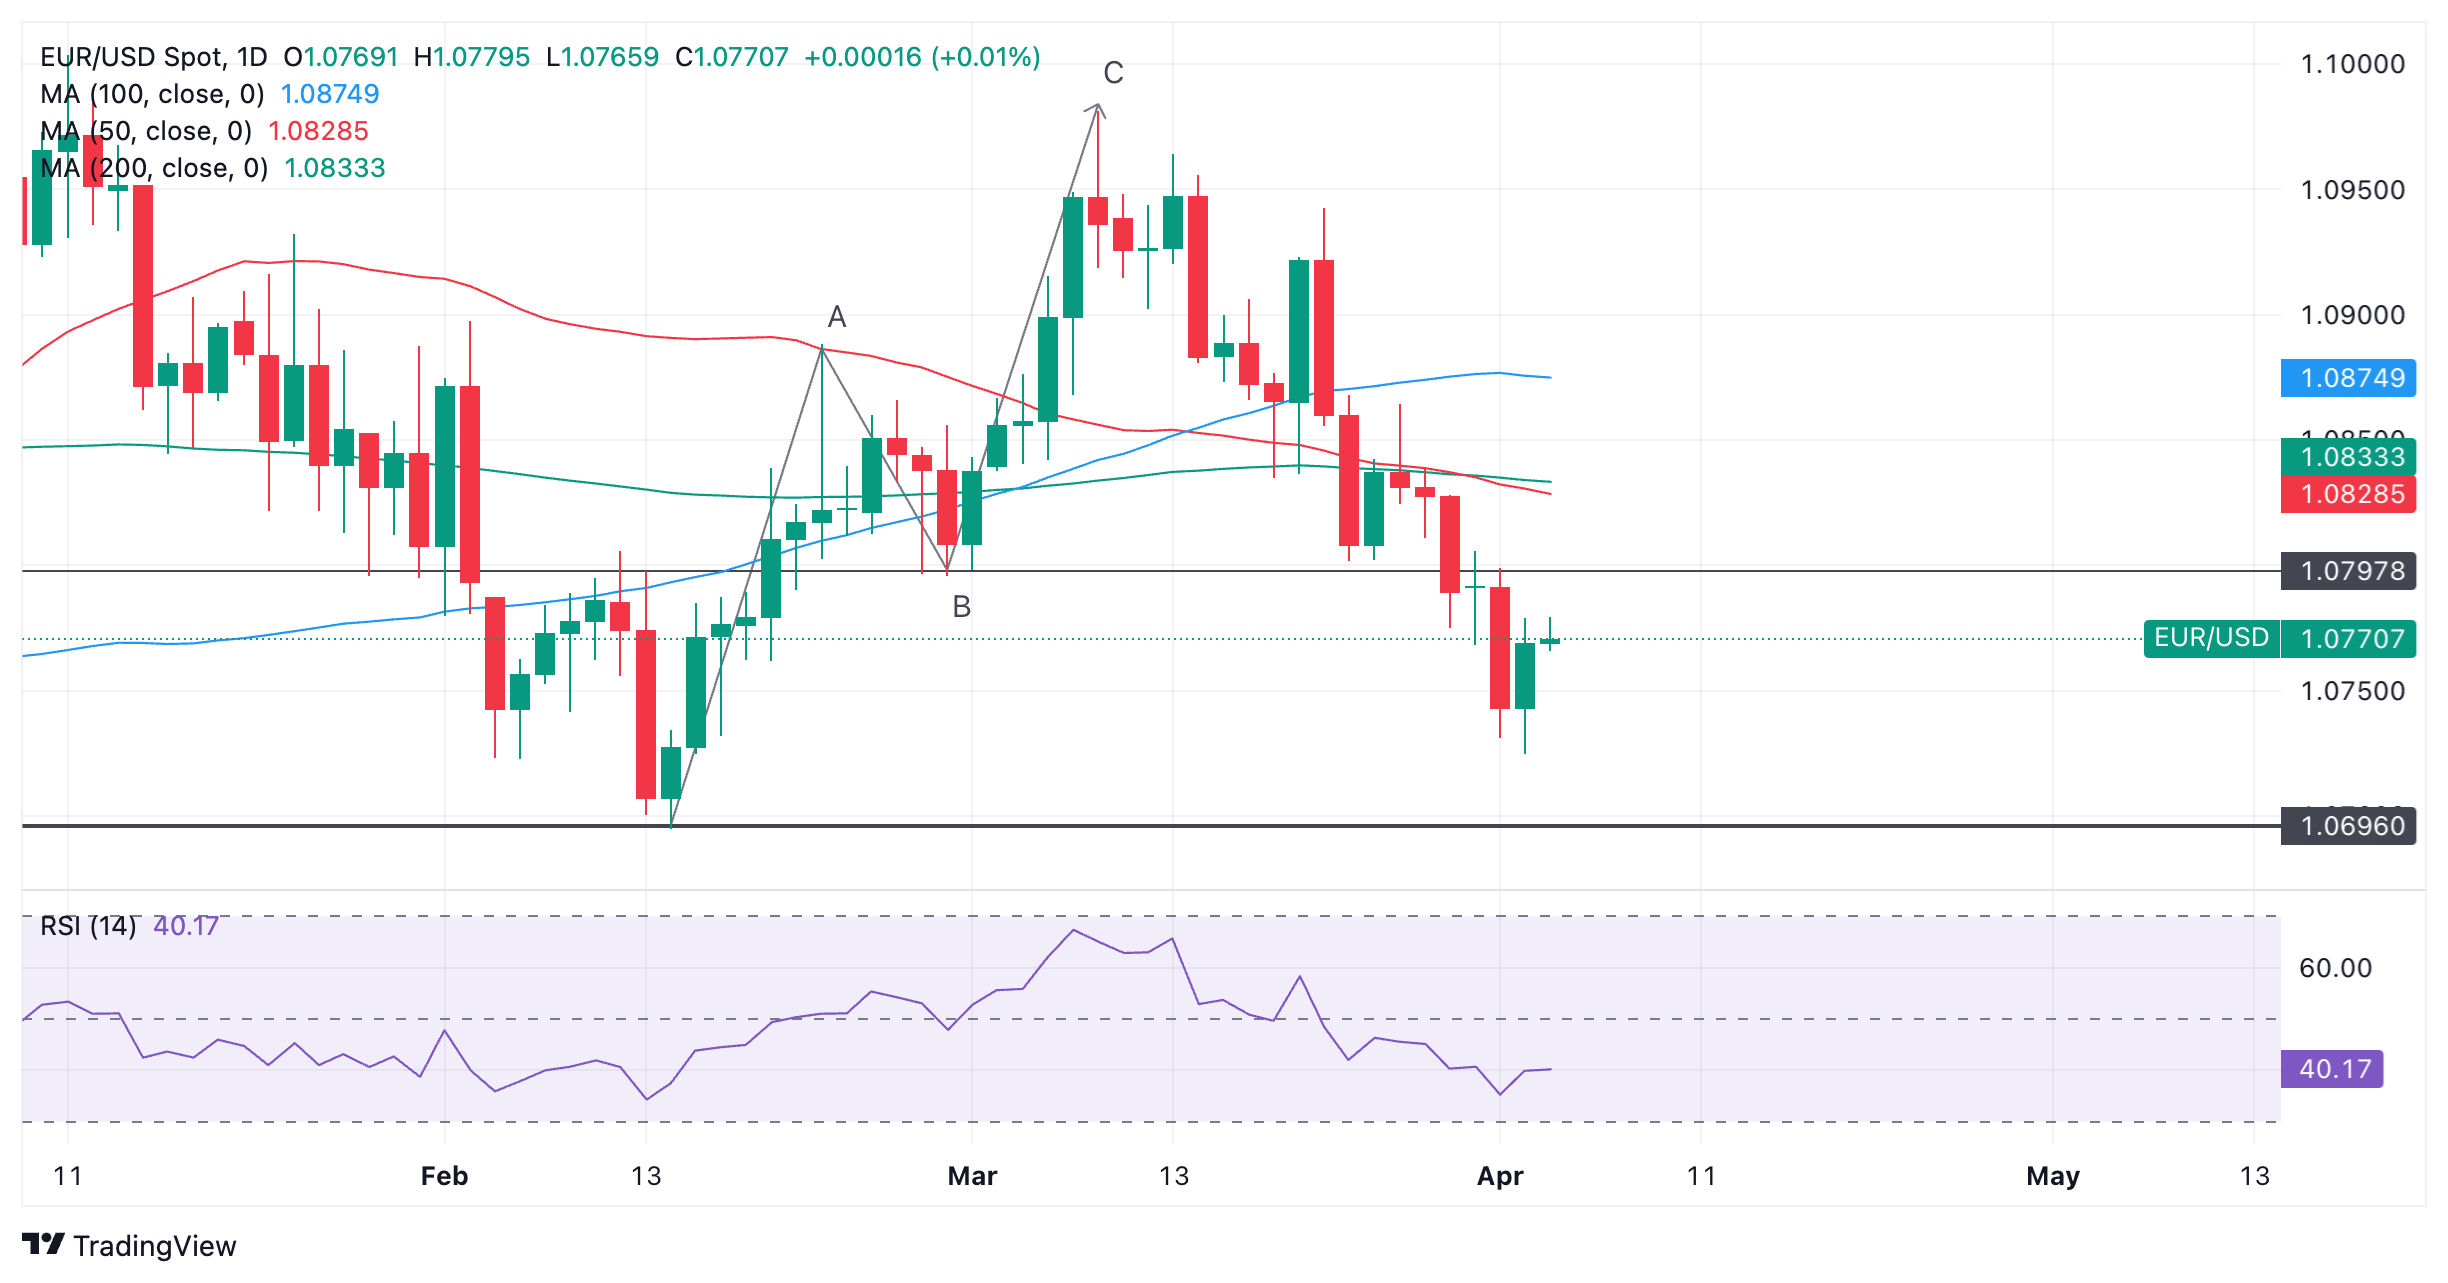
Euro versus US Dollar: Daily chart
The pair is in a short-term downtrend, however, and this is likely to continue once the pullback runs out of steam.
The 1.0694 February and year-to-date lows are an obvious next target to the downside and also likely to provide substantial support, with a bounce likely at the first test. A decisive break below, however, would usher in another bout of weakness, and target the 1.0650s.
A decisive break is one characterized by a long red down candle breaking cleanly through the level and closing near its low, or three consecutive red candles breaching the level.
Euro FAQs
The Euro is the currency for the 20 European Union countries that belong to the Eurozone. It is the second most heavily traded currency in the world behind the US Dollar. In 2022, it accounted for 31% of all foreign exchange transactions, with an average daily turnover of over $2.2 trillion a day. EUR/USD is the most heavily traded currency pair in the world, accounting for an estimated 30% off all transactions, followed by EUR/JPY (4%), EUR/GBP (3%) and EUR/AUD (2%).
The European Central Bank (ECB) in Frankfurt, Germany, is the reserve bank for the Eurozone. The ECB sets interest rates and manages monetary policy. The ECB’s primary mandate is to maintain price stability, which means either controlling inflation or stimulating growth. Its primary tool is the raising or lowering of interest rates. Relatively high interest rates – or the expectation of higher rates – will usually benefit the Euro and vice versa. The ECB Governing Council makes monetary policy decisions at meetings held eight times a year. Decisions are made by heads of the Eurozone national banks and six permanent members, including the President of the ECB, Christine Lagarde.
Eurozone inflation data, measured by the Harmonized Index of Consumer Prices (HICP), is an important econometric for the Euro. If inflation rises more than expected, especially if above the ECB’s 2% target, it obliges the ECB to raise interest rates to bring it back under control. Relatively high interest rates compared to its counterparts will usually benefit the Euro, as it makes the region more attractive as a place for global investors to park their money.
Data releases gauge the health of the economy and can impact on the Euro. Indicators such as GDP, Manufacturing and Services PMIs, employment, and consumer sentiment surveys can all influence the direction of the single currency. A strong economy is good for the Euro. Not only does it attract more foreign investment but it may encourage the ECB to put up interest rates, which will directly strengthen the Euro. Otherwise, if economic data is weak, the Euro is likely to fall. Economic data for the four largest economies in the euro area (Germany, France, Italy and Spain) are especially significant, as they account for 75% of the Eurozone’s economy.
Another significant data release for the Euro is the Trade Balance. This indicator measures the difference between what a country earns from its exports and what it spends on imports over a given period. If a country produces highly sought after exports then its currency will gain in value purely from the extra demand created from foreign buyers seeking to purchase these goods. Therefore, a positive net Trade Balance strengthens a currency and vice versa for a negative balance.
- USD/MXN edges higher ahead of key economic data from the United States.
- Mexico’s Business Confidence remained consistent at 54.3 in February.
- The US Dollar could appreciate due to reducing expectations for a Fed interest rate cut in June.
USD/MXN rises to near 16.60 during the European trading hours on Wednesday. The National Statistics Agency (INEGI) reported that Business Confidence remained unchanged at 54.3 in February, maintaining high levels last seen nearly eleven years ago. However, investment prospects improved to 48.5 from 47.2, though they remain pessimistic.
The Mexican Peso (MXN) strengthened as growth in Mexico's manufacturing sector remained steady in March, contributing to undermining the USD/MXN pair. Traders will be closely monitoring the release of Gross Fixed Investment figures on Wednesday, followed by the publication of the latest meeting minutes for the Bank of Mexico (Banxico).
The steady performance of the US Dollar (USD) is contributing to the hawkish price action of the USD/MXN pair. Market sentiment is shifting, with reduced expectations for a Federal Reserve (Fed) interest rate cut in June. This has led to elevated US Treasury bond yields, favoring USD bulls.
On Tuesday, US February JOLTS Job Openings surpassed market expectations, rising to 8.756 million from the previous figure of 8.748 million. Additionally, Factory Orders rebounded with a 1.4% month-on-month increase in February, following a 3.8% decline in the prior reading.
In the United States (US), investors are focusing on the ADP Employment Change and ISM Services PMI data scheduled for release on Wednesday. Furthermore, Federal Reserve Chairman Jerome Powell is scheduled to deliver a speech on the US economic outlook at the Stanford Business, Government, and Society Forum in Stanford.
- The ADP survey is expected to show the private sector added 148K new positions in March.
- The Federal Reserve has made it clear that policymakers are in no rush to cut interest rates.
- The US Dollar trades with a firmer tone in a risk-averse environment.
The United States (US) Automatic Data Processing (ADP) Research Institute will release the private employment data for March on Wednesday. The survey provides information about job creation in the private sector and it is usually released two days before the official jobs report of the Bureau of Labor Statistics (BLS), which features Nonfarm Payrolls (NFP) data.
According to market analysts, the ADP survey is expected to show 148K new positions were added in March, slightly above the 140K reported in February. However, previous readings are always subject to revisions, and a solid ADP survey hardly means an in-line NFP report, as the correlation between the two reports has been sporadic, to say the least.
Still, the relevance of the ADP survey is enhanced by the fact the US releases multiple employment-related data in the days previous to the NFP publication. All combined help market participants find clues on what the Federal Reserve (Fed) may do next with monetary policy.
Fed Chairman Jerome Powell has multiple times explained a tight labor market weighs against the case of lower interest rates, as it risks lifting inflationary pressures through wage increases. As of lately, American policymakers are less concerned about the employment situation, although they seem comfortable where they are.
Powell participated in a discussion at the Macroeconomics and Monetary Policy Conference in San Francisco on Friday. He said the economy is strong and that policymakers are not in a hurry to cut rates. He repeated that they want to be more confident before doing so. According to the CME FedWatch Tool, the odds for a June rate cut are roughly 56%, following Powell’s comments and data indicating that the core Personal Consumption Expenditures (PCE) inflation remained steady at 2.8% YoY in February.
The ADP survey also offers pay data. In February, the report showed that “pay gains for job-changers accelerated for the first time in more than a year, rising to 7.6% from 7.2%.”
Nela Richardson, ADP Chief Economist, noted: “Job gains remain solid. Pay gains are trending lower but are still above inflation. In short, the labor market is dynamic but doesn't tip the scales in terms of a Fed rate decision this year.”
With that in mind, another solid report will likely further undermine the odds of a rate cut in June and put financial markets in risk-off mode.
When will the ADP Jobs Survey will be released and how could it affect EUR/USD?
The ADP survey on job creation will be out on Wednesday and is expected to report the private sector added 148K new positions in March. If the headline reading widely surpasses the estimate, it could be understood as a stubbornly strong labor market. Combined with higher wages, the news will likely boost demand for the USD. The opposite scenario, weak job creation alongside easing wages, should push the Greenback into negative ground amid a better sentiment.
From a technical perspective, Valeria Bednarik, Chief Analyst at FXStreet, notes: “The Dollar Index (DXY) flirts with 105.00 ahead of the announcement, after hitting 105.10 on Tuesday, a fresh 2024 high. The bullish momentum, however, is missing in the daily chart, despite the overall picture favors an upward continuation. The DXY develops above its moving averages, although the 100 and 200 Simple Moving Averages (SMAs) lack directional strength. Only the 20 SMA seems to be giving signs of life, grinding marginally higher and poised to cross above the 100 SMA. Meanwhile, technical indicators remain within positive levels, although without clear directional strength.”
Bednarik adds: “Beyond the 105.20 region, the DXY has little to deal with until 105.50. A daily close above the latter should confirm the bullish case and pave the way for a test of the 106.00-106.10 price zone. On the other hand, immediate support is located at 104.70, followed by 104.25.”
Economic Indicator
United States ADP Employment Change
The ADP Employment Change is a gauge of employment in the private sector released by the largest payroll processor in the US, Automatic Data Processing Inc. It measures the change in the number of people privately employed in the US. Generally speaking, a rise in the indicator has positive implications for consumer spending and is stimulative of economic growth. So a high reading is traditionally seen as bullish for the US Dollar (USD), while a low reading is seen as bearish.
Read more.Why it matters to traders
Traders often consider employment figures from ADP, America’s largest payrolls provider, report as the harbinger of the Bureau of Labor Statistics release on Nonfarm Payrolls (usually published two days later), because of the correlation between the two. The overlaying of both series is quite high, but on individual months, the discrepancy can be substantial. Another reason FX traders follow this report is the same as with the NFP – a persistent vigorous growth in employment figures increases inflationary pressures, and with it, the likelihood that the Fed will raise interest rates. Actual figures beating consensus tend to be USD bullish.
Employment FAQs
Labor market conditions are a key element to assess the health of an economy and thus a key driver for currency valuation. High employment, or low unemployment, has positive implications for consumer spending and thus economic growth, boosting the value of the local currency. Moreover, a very tight labor market – a situation in which there is a shortage of workers to fill open positions – can also have implications on inflation levels and thus monetary policy as low labor supply and high demand leads to higher wages.
The pace at which salaries are growing in an economy is key for policymakers. High wage growth means that households have more money to spend, usually leading to price increases in consumer goods. In contrast to more volatile sources of inflation such as energy prices, wage growth is seen as a key component of underlying and persisting inflation as salary increases are unlikely to be undone. Central banks around the world pay close attention to wage growth data when deciding on monetary policy.
The weight that each central bank assigns to labor market conditions depends on its objectives. Some central banks explicitly have mandates related to the labor market beyond controlling inflation levels. The US Federal Reserve (Fed), for example, has the dual mandate of promoting maximum employment and stable prices. Meanwhile, the European Central Bank’s (ECB) sole mandate is to keep inflation under control. Still, and despite whatever mandates they have, labor market conditions are an important factor for policymakers given its significance as a gauge of the health of the economy and their direct relationship to inflation.
- EUR/GBP gains ground near 0.8565 in Wednesday’s early European session.
- BoE’s Bailey said UK economy is moving towards the point where the central bank can begin cutting rates.
- ECB’s Holzmann said he has ‘no in-principle objection’ to a June rate cut, but wants to see more supportive data.
- The preliminary Eurozone HICP inflation data for March will be in the spotlight on Wednesday.
The EUR/GBP cross trades in positive territory for the fourth consecutive day around 0.8565 on Wednesday. The rising expectation that the Bank of England (BoE) will lower its borrowing cost in June exerts some selling pressure on the Pound Sterling (GBP).
The BoE Governor Andrew Bailey said in recent weeks that, due to further encouraging signs that inflation is cooling, the UK economy is moving towards the point where the central bank can begin cutting interest rates. Meanwhile, BoE interest-rate setter Jonathan Haskel said rate cuts should be "a long way off, although the fall in headline inflation is very good news. Jeremy Hunt, Chancellor of the Exchequer, stated that as inflation gets closer to its target that opens the door for the BoE to consider lowering interest rates.
On the Euro front, the European Central Bank (ECB) policymaker Robert Holzmann said on Wednesday that he has ‘no in-principle objection’ to a June rate cut, but wants to see more supportive data before the central bank could start cutting interest rates. The ECB's policymaker Yannis Stournaras said on the weekend that the ECB could possibly cut rates by a total of 100 basis points this year, but there was still no consensus within the Eurozone's central bank on that.
ING economist, Carsten Brzeski, said that wage developments remain key and as long as the economy doesn’t fall off a cliff, the ECB will remain restrictive on policy and wait for more evidence on data. The less dovish stance of the ECB might lift the Euro (EUR) against the GBP and create a tailwind for the EUR/GBP cross.
Later on Wednesday, the preliminary Eurozone Harmonized Index of Consumer Prices (HICP) for March will be released. In case the report shows the easing inflation in the Euro area in March, this could bolster hopes that the ECB will soon start cutting interest rates and weigh on the EUR.
- EUR/JPY gains ground as Japanese Yen struggles to maintain its strength.
- Japanese authorities could intervene in the markets to support the Yen.
- ECB’s Robert Holzmann would like to see more supportive data before initiating rate cuts in June.
EUR/JPY continues to advance for the second consecutive session, trading around 163.30 during the early European hours. Despite a modest uptick in the Japanese Yen (JPY) yesterday, it struggles to maintain its strength. Investors are cautious amid the possibility of Japanese authorities intervening in the markets to prevent a significant decline in the Yen.
This, coupled with a subdued risk sentiment, provides some support to the safe-haven JPY. However, the Bank of Japan's (BoJ) cautious stance on further policy tightening fails to inspire bullish sentiment or offer substantial momentum.
Japanese Finance Minister Shunichi Suzuki reiterated his caution regarding excessive exchange-rate volatility and reaffirmed authorities' readiness to take appropriate action. His remarks provided some backing to the Japanese Yen.
European Central Bank (ECB) policymaker Robert Holzmann stated in a Reuters interview on Wednesday, "I have no inherent objection to a rate cut in June, but I would like to see more supportive data before making a decision."
German inflation moderated slightly more than anticipated in March, reaching its lowest level in almost three years. The preliminary German Harmonized Index of Consumer Prices (HICP) increased by 0.6% month-on-month (MoM) in March, slightly below the forecasted 0.7% rise. The year-on-year rate of HICP climbed by 2.3%, falling short of the market consensus of 2.4%.
The softer inflation figures suggest that Germany edges closer to the European Central Bank's (ECB) target of 2%, leading to market expectations of a potential interest rate cut in the near future. Consequently, this exerts selling pressure on the Euro (EUR) and presents a headwind for the EUR/JPY cross. Investors are now awaiting the advanced Eurozone Harmonized Index of Consumer Prices data for March on Wednesday for further insights.
Here is what you need to know on Wednesday, April 3:
The US Dollar (USD) lost its strength following the bullish action seen on Monday and the USD Index closed in negative territory on Tuesday. On Wednesday, Eurostat will release the preliminary Harmonized Index of Consumer Prices (HICP) data for March. Later in the day, the US economic calendar will offer ADP Employment Change and the ISM Services PMI reports for March. During the American trading hours, Federal Reserve Chairman Jerome Powell will speak on the economic outlook at the Stanford Business, Government, and Society Forum.
US Dollar price this week
The table below shows the percentage change of US Dollar (USD) against listed major currencies this week. US Dollar was the strongest against the Swiss Franc.
| USD | EUR | GBP | CAD | AUD | JPY | NZD | CHF | |
| USD | 0.21% | 0.50% | 0.38% | 0.27% | 0.15% | 0.23% | 0.79% | |
| EUR | -0.21% | 0.28% | 0.18% | 0.07% | -0.06% | 0.01% | 0.56% | |
| GBP | -0.50% | -0.29% | -0.11% | -0.22% | -0.36% | -0.27% | 0.28% | |
| CAD | -0.38% | -0.17% | 0.10% | -0.11% | -0.24% | -0.17% | 0.39% | |
| AUD | -0.28% | -0.06% | 0.22% | 0.10% | -0.13% | -0.06% | 0.51% | |
| JPY | -0.16% | 0.08% | 0.33% | 0.26% | 0.14% | 0.05% | 0.62% | |
| NZD | -0.24% | -0.01% | 0.25% | 0.17% | 0.06% | -0.08% | 0.54% | |
| CHF | -0.77% | -0.55% | -0.27% | -0.38% | -0.49% | -0.62% | -0.54% |
The heat map shows percentage changes of major currencies against each other. The base currency is picked from the left column, while the quote currency is picked from the top row. For example, if you pick the Euro from the left column and move along the horizontal line to the Japanese Yen, the percentage change displayed in the box will represent EUR (base)/JPY (quote).
US Treasury bond yields continued to push higher on Tuesday and major equity indexes turned south after the opening bell. Despite these developments, the USD struggled to outperform its rivals as market participants started to adjust their positions ahead of key data releases. Early Wednesday, the 10-year yield holds comfortably above 4.3% and US stock index futures trade modestly lower. Meanwhile, the USD Index stays in a consolidation phase below 105.00 after losing 0.2% on Tuesday.
EUR/USD gathered recovery momentum on Tuesday and erased a large portion of Monday's losses. Early Wednesday, the pair fluctuates in a narrow range below 1.0800.
Eurozone Inflation Release: Lower price pressures could weigh on the Euro.
GBP/USD closed modestly higher on Tuesday and stabilized above 1.2550 in the European session on Wednesday.
USD/JPY registered marginal losses on Tuesday but remained within the extremely narrow trading channel above 151.50.
Japanese Yen struggles for firm near-term direction amid mixed fundamental cues.
Gold extended its winning streak into a sixth consecutive day on Tuesday and closed at a new record high above $2,280. XAU/USD holds steady near all-time highs early Wednesday.
Gold price consolidates recent strong gains to record peak, bullish potential seems intact.
AUD/USD posted modest gains on Tuesday and went into a consolidation phase above 0.6500 midweek.
Australian Dollar moves back and forth amid firmer US Dollar, ISM Services PMI eyed.
Inflation FAQs
Inflation measures the rise in the price of a representative basket of goods and services. Headline inflation is usually expressed as a percentage change on a month-on-month (MoM) and year-on-year (YoY) basis. Core inflation excludes more volatile elements such as food and fuel which can fluctuate because of geopolitical and seasonal factors. Core inflation is the figure economists focus on and is the level targeted by central banks, which are mandated to keep inflation at a manageable level, usually around 2%.
The Consumer Price Index (CPI) measures the change in prices of a basket of goods and services over a period of time. It is usually expressed as a percentage change on a month-on-month (MoM) and year-on-year (YoY) basis. Core CPI is the figure targeted by central banks as it excludes volatile food and fuel inputs. When Core CPI rises above 2% it usually results in higher interest rates and vice versa when it falls below 2%. Since higher interest rates are positive for a currency, higher inflation usually results in a stronger currency. The opposite is true when inflation falls.
Although it may seem counter-intuitive, high inflation in a country pushes up the value of its currency and vice versa for lower inflation. This is because the central bank will normally raise interest rates to combat the higher inflation, which attract more global capital inflows from investors looking for a lucrative place to park their money.
Formerly, Gold was the asset investors turned to in times of high inflation because it preserved its value, and whilst investors will often still buy Gold for its safe-haven properties in times of extreme market turmoil, this is not the case most of the time. This is because when inflation is high, central banks will put up interest rates to combat it. Higher interest rates are negative for Gold because they increase the opportunity-cost of holding Gold vis-a-vis an interest-bearing asset or placing the money in a cash deposit account. On the flipside, lower inflation tends to be positive for Gold as it brings interest rates down, making the bright metal a more viable investment alternative.
- The US Dollar Index (DXY) loses ground around 104.75 after retracing from the weekly top of 105.10 on Wednesday.
- Fed’s Mester said she expects rate cuts this year but ruled out the next policy meeting in May.
- The US February JOLTS Job Openings rose to 8.756M in February against 8.748M prior, better than estimated.
- Investors await the Fed’s Powell speech for fresh catalysts.
The US Dollar Index (DXY) trades in negative territory for the second consecutive day near 104.75 during the early European session on Wednesday. The DXY has retreated from the weekly top of 105.10 following the dovish comments from Federal Reserve (Fed) policymakers on Tuesday. The attention will shift to the US ADP Employment Change and the ISM Services PMI, due on Wednesday.
On Tuesday, Cleveland Fed President Loretta Mester said that she expects the US central bank to cut rates this year. Mester noted that the June policy meeting is possible if the data allows it. Meanwhile, San Francisco Fed President Mary Daly stated that three rate cuts this year are a “very reasonable baseline”. However, she acknowledged that the labor market remains strong and growth is continuing. So there's no urgency to adjust the rate. Financial markets are now pricing in about a 65% odds of a rate cut by June, down from about 70% after the Fed's March meeting, according to the CME FedWatch Tool.
Data released from the US Bureau of Labor Statistics on Tuesday showed that February JOLTS Job Openings rose to 8.756M in February from a downwardly revised 8.748M in the previous month, better than market expectations. Additionally, Factory Orders improved to 1.4% MoM in February from a 3.8% decline in the previous reading.
On the other hand, the rising geopolitical tensions in the Middle East and Russia-Ukraine might boost safe-haven assets, benefiting the US Dollar. On Monday, warplanes attacked a building inside Iran's consulate complex in Syria, and some of the most senior members of Iran's Revolutionary Guard were killed. Additionally, there are reports of new attacks on commercial ships in the Red Sea.
Investors will also monitor the Fed’s Powell speech later on Wednesday, which might offer some hints about the monetary policy and interest rate outlook. In case Fed’s Powell delivers some hawkish comments, this could lift the Greenback against its rivals in the near term.
- USD/CHF stands tall near its highest level since November 11 touched on Tuesday.
- A softer risk tone underpins the safe-haven CHF and caps gains amid a weaker USD.
- Reduced Fed rate cut bets should limit the USD downfall and favour USD/CHF bulls.
The USD/CHF pair enters a bullish consolidation phase during the Asian session on Wednesday and oscillates in a narrow band near its highest level since November 11 touched the previous day. Spot prices currently trade around the 0.9080 region and seem poised to prolong the recent positive momentum witnessed over the past month or so.
The Swiss Franc (CHF) continues to be undermined by the Swiss National Bank's (SNB) unexpected move to cut interest rates in March amid a faster-than-anticipated slowdown in inflation and economic growth. In contrast, the markets have been scaling back their expectations for rate cuts by the Federal Reserve (Fed) amid signs of a still-resilient US economy. This, in turn, favours the US Dollar (USD) bulls and validates the positive outlook for the USD/CHF pair.
Data released this week showed that the US manufacturing sector expanded in March for the first time since September 2022 and that demand for labor remains elevated. Adding to this, comments by a slew of influential FOMC members raised doubts over whether the Fed will cut interest rates three times this year. In fact, the current market pricing points to a total of 65 basis points (bps) rate cut for 2024, lower than the 75 bps projected by the US central bank in March.
The shift in outlook, meanwhile, remains supportive of elevated US Treasury bond yields and should help limit the ongoing USD corrective decline from its highest level since February 14. That said, the risk-off impulse, which tends to underpin demand for traditional safe-haven assets, could lend some support to the CHF and act as a headwind for the USD/CHF pair. Traders now look to the US macro data and speeches by influential FOMC members for a fresh impetus.
European Central Bank (ECB) policymaker Robert Holzmann said in a Reuters interview on Wednesday, “I have no in-principle objection to a June rate cut but want to see more supportive data.”
Additional quotes
Cutting rates out of sync with the Fed would diminish impact of policy easing.
Given weak productivity in Eurozone, 3.0% deposit rate may still prove too tight over longer term.
It’s possible that inflation may even do better than ECB projections.
ECB needs to stop subsidizing commercial banks and should cut interest payments on the piles of cash lenders got from the central bank on the cheap.
Market reaction
At the time of writing, EUR/USD is adding 0.08% on the day to trade at 1.0776, little affected by the above comments.
ECB FAQs
The European Central Bank (ECB) in Frankfurt, Germany, is the reserve bank for the Eurozone. The ECB sets interest rates and manages monetary policy for the region. The ECB primary mandate is to maintain price stability, which means keeping inflation at around 2%. Its primary tool for achieving this is by raising or lowering interest rates. Relatively high interest rates will usually result in a stronger Euro and vice versa. The ECB Governing Council makes monetary policy decisions at meetings held eight times a year. Decisions are made by heads of the Eurozone national banks and six permanent members, including the President of the ECB, Christine Lagarde.
In extreme situations, the European Central Bank can enact a policy tool called Quantitative Easing. QE is the process by which the ECB prints Euros and uses them to buy assets – usually government or corporate bonds – from banks and other financial institutions. QE usually results in a weaker Euro. QE is a last resort when simply lowering interest rates is unlikely to achieve the objective of price stability. The ECB used it during the Great Financial Crisis in 2009-11, in 2015 when inflation remained stubbornly low, as well as during the covid pandemic.
Quantitative tightening (QT) is the reverse of QE. It is undertaken after QE when an economic recovery is underway and inflation starts rising. Whilst in QE the European Central Bank (ECB) purchases government and corporate bonds from financial institutions to provide them with liquidity, in QT the ECB stops buying more bonds, and stops reinvesting the principal maturing on the bonds it already holds. It is usually positive (or bullish) for the Euro.
- GBP/USD trades on a stronger note near 1.2580 on the weaker USD.
- The pair keeps the bearish vibe below the key EMA; RSI indicator holds in bearish territory.
- The immediate resistance level will emerge at 1.2617; 1.2540 acts as an initial support level.
The GBP/USD pair recovers some lost ground and currently trades around 1.2580 on Wednesday during the early European session. The decline of the USD Index (DXY) and the dismal market mood in the UK economy act as a tailwind for the major pair. Later on Wednesday, the ADP Employment Change and the ISM Services PMI will be due. Also, Federal Reserve (Fed) Chair Jerome Powell's speech will be a closely watched event.
Technically, the bearish outlook of GBP/USD remains intact as the major pair is below the key 50-period and 100-period Exponential Moving Average (EMA) on the four-hour chart with a downward slope. Furthermore, the downward momentum is confirmed by the Relative Strength Index (RSI), which hovers around 44.5 in bearish territory, supporting the sellers for the time being.
The immediate resistance level for GBP/USD will emerge near the 50-period EMA at 1.2617. The next hurdle is seen near the 1.2650–1.2660 region, portraying the 100-period EMA and the upper boundary of the Bollinger Band. A break above the latter will pave the way to the 1.2700 psychological level. Further north, the next upside target is located at a high of March 18 at 1.2746.
On the downside, a low of April 1 at 1.2540 acts as an initial support level for the major pair. The additional downside filter to watch is a low of April 1 at 1.2540. A breach of the lower limit of the Bollinger Band at 1.2525 will expose a low of December 8 and the round mark of 1.2500.
GBP/USD four-hour chart
-638477175754585793.png)
- Eurostat is set to release key Europe inflation data on Wednesday.
- Headline annual inflation is seen holding steady at 2.6% in March.
- The European Central Bank (ECB) is expected to cut rates in June.
The Harmonized Index of Consumer Prices (HICP), a measure of inflation for the Eurozone, will be released on Wednesday, April 3. The inflation data from the old continent will be closely scrutinized by the European Central Bank (ECB) against rising speculation that the bank could start its easing cycle as soon as at its June event.
A glimpse at recent European data saw consumer prices in the euro bloc climb at an annualized 2.9% in the year to December 2023, just to recede in the subsequent two months to 2.8% and 2.6%, a move that mirrored other G10 nations.
In her last comments on March 20, ECB’s President Christine Lagarde expressed difficulty in determining whether the current price pressures stem merely from delays in adjusting wages and services prices, combined with the cyclical fluctuations in productivity, or if they indicate persistent inflationary trends.
Lagarde added that, unlike previous phases of their policy cycle, there are indications that the anticipated disinflationary trajectory will persist. Should the data unveil a significant correlation between the underlying inflation trend and the ECB projections, Lagarde thinks the bank can transition into the phase of scaling back its policy measures.
What to expect in the next European inflation report?
As a result, economists anticipate that Core HICP inflation will rise by 3.0% on a yearly basis in March (from 3.1%), while the headline gauge is seen rising by 2.6% from a year earlier, matching the gain observed in the previous month.
Reinforcing the idea of persistent disinflationary pressures, the advanced Consumer Price Index (CPI) in Germany rose by 2.2% on a yearly basis in March, down from February’s 2.5% gain.
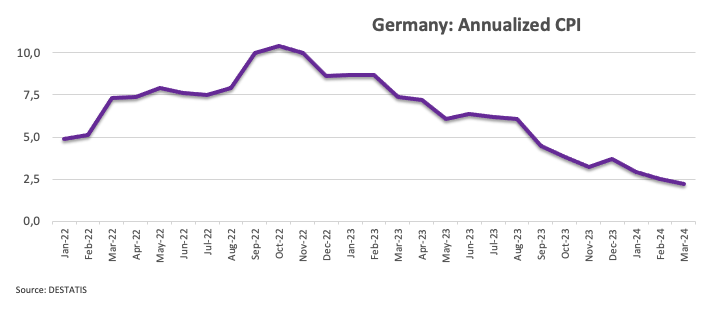
According to the ECB Consumer Expectations Survey (CES), the median predictions for inflation in the next 12 months dropped from 3.3% to 3.1%. However, expectations for inflation three years ahead stayed steady at 2.5%.
When will the Harmonised Index of Consumer Prices report be released and how could it affect EUR/USD?
Eurozone preliminary HICP is due to be published at 09:00 GMT on Wednesday.
Heading into the highly-anticipated inflation release from Europe, the Euro (EUR) is struggling below the round milestone of 1.0800 against the US Dollar (USD), as investors continue to assess the likelihood of the start of the easing cycle by the Federal Reserve (Fed) in June.
According to Pablo Piovano, Senior Analyst at FXStreet, “Looking ahead, the EUR/USD is anticipated to encounter initial resistance at the key 200-day SMA at 1.0833. A move above this zone in a convincing fashion should restore the constructive bias and potentially allow for further gains in the short-term horizon.”
Pablo adds, “On the flip side, a reach of the so-far April low of 1.0724 (April 2) could trigger a deeper decline towards the 2024 low of 1.0694 (February 14).”
Economic Indicator
Eurozone Harmonized Index of Consumer Prices (YoY)
The Harmonized Index of Consumer Prices (HICP) measures changes in the prices of a representative basket of goods and services in the European Monetary Union. The HICP, released by Eurostat on a monthly basis, is harmonized because the same methodology is used across all member states and their contribution is weighted. The YoY reading compares prices in the reference month to a year earlier. Generally, a high reading is seen as bullish for the Euro (EUR), while a low reading is seen as bearish.
Read more.Euro price this week
The table below shows the percentage change of Euro (EUR) against listed major currencies this week. Euro was the weakest against the .
| USD | EUR | GBP | CAD | AUD | JPY | NZD | CHF | |
| USD | 0.26% | 0.62% | 0.39% | 0.45% | 0.17% | 0.39% | 0.45% | |
| EUR | -0.26% | 0.36% | 0.15% | 0.19% | -0.09% | 0.13% | 0.20% | |
| GBP | -0.61% | -0.35% | -0.21% | -0.16% | -0.46% | -0.22% | -0.16% | |
| CAD | -0.40% | -0.14% | 0.21% | 0.05% | -0.24% | -0.02% | 0.05% | |
| AUD | -0.45% | -0.19% | 0.16% | -0.06% | -0.29% | -0.07% | -0.01% | |
| JPY | -0.18% | 0.11% | 0.46% | 0.25% | 0.32% | 0.23% | 0.27% | |
| NZD | -0.39% | -0.13% | 0.24% | 0.03% | 0.07% | -0.23% | 0.06% | |
| CHF | -0.46% | -0.19% | 0.18% | -0.05% | 0.00% | -0.29% | -0.06% |
The heat map shows percentage changes of major currencies against each other. The base currency is picked from the left column, while the quote currency is picked from the top row. For example, if you pick the Euro from the left column and move along the horizontal line to the Japanese Yen, the percentage change displayed in the box will represent EUR (base)/JPY (quote).
- EUR/USD extends gains towards the psychological barrier of 1.0800.
- Technical analysis indicates a potential confirmation of bearish momentum for the pair.
- The key support appears around March’s low of 1.0767 and the major level of 1.0750.
EUR/USD continues its winning streak for the second consecutive session on Wednesday, inching higher to near 1.0780 during the Asian hours. The immediate resistance appears at the 23.6% Fibonacci retracement level of 1.0785.
A breakthrough above this level could exert upward support for the EUR/USD pair to explore the region around the nine-day Exponential Moving Average (EMA) at 1.0798, aligned with the psychological resistance of 1.0800. Further resistance lies at the major level of 1.0850, following the psychological resistance at 1.0900.
Technical analysis suggests a bearish sentiment for the EUR/USD pair. The 14-day Relative Strength Index (RSI) is positioned below the 50 mark, indicating weakness in buying momentum. Additionally, the Moving Average Convergence Divergence (MACD) shows a divergence below the signal line and remains below the centerline. Although a lagging indicator, this alignment indicates a confirmation of the bearish momentum for the EUR/USD pair.
On the downside, immediate support appears at March’s low of 1.0767, followed by the major support at 1.0750. A break below this level could lead the EUR/USD pair to revisit the weekly low of 1.0724, followed by psychological support at the 1.0700 level.
EUR/USD: Daily Chart
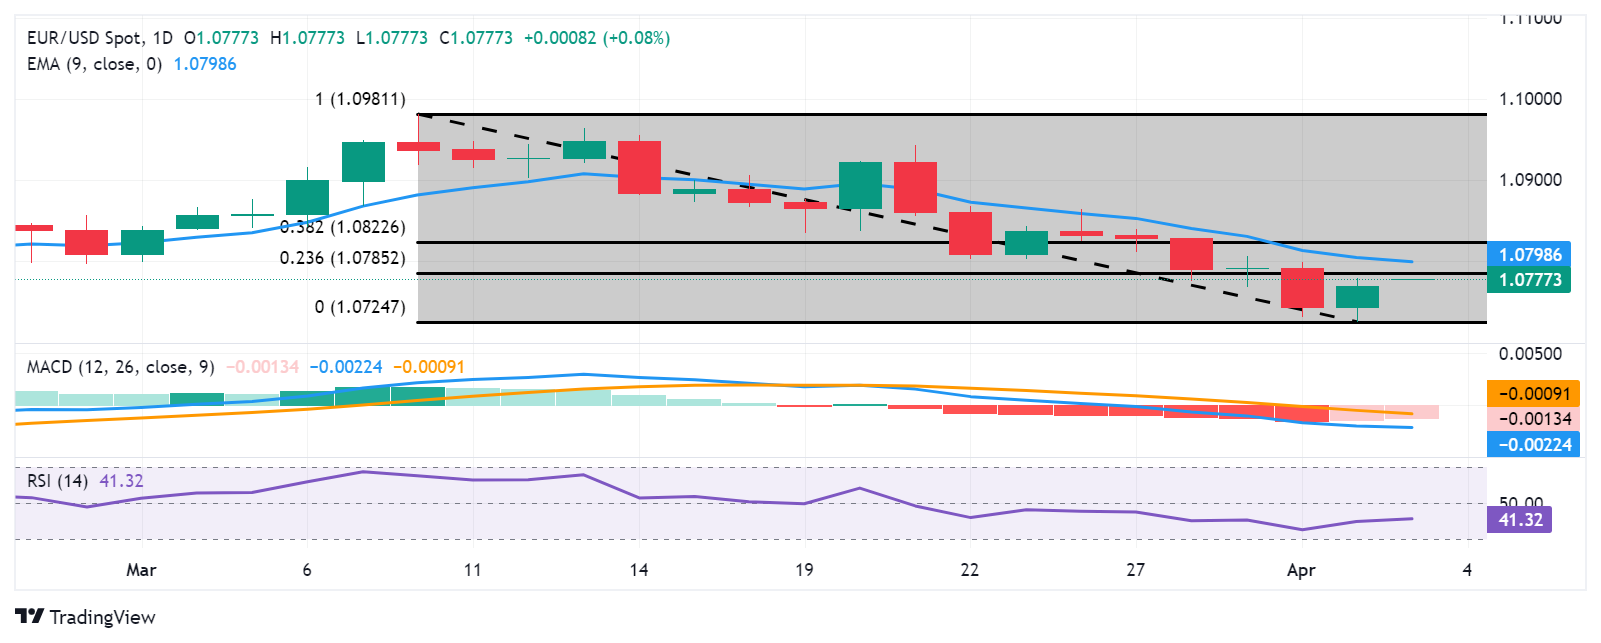
- NZD/USD reverses an Asian session dip and turns positive for the second straight day.
- The USD retreats further from a multi-month peak set on Tuesday and lends support.
- Reduced June Fed rate cut bets and a softer risk tone should help limit the USD losses.
The NZD/USD pair attracts some dip-buying during the Asian session on Wednesday and might now be looking to build on the overnight recovery move from levels just below mid-0.5900s, or the YTD low. Spot prices currently trade near the top end of the daily range, around the 0.5970-0.5975 region, and remain at the mercy of the US Dollar (USD) price dynamics.
The USD Index (DXY), which tracks the Greenback against a basket of currencies, drift lower for the second successive day and moves away from its highest level since February 14, which, in turn, is seen acting as a tailwind for the NZD/USD pair. That said, reduced bets for rate cuts by the Federal Reserve (Fed) should help limit any meaningful downside for the Greenback and keep a lid on any further gains for the currency pair.
Data released this week showed that the US manufacturing sector expanded in March for the first time since September 2022 and that demand for labor remains elevated. Adding to this, comments by a slew of influential FOMC members raised doubts over whether the Fed will cut interest rates three times this year. The current market pricing points to a total of 65 basis points (bps) rate cut for 2024, lower than the central bank's projected 75 bps.
Meanwhile, the shift in expectations pushed the yield on the benchmark 10-year US government bond to a four-month high. This, along with a generally weaker tone around the equity markets, supports prospects for the emergence of some dip-buying around the safe-haven buck and caps the upside for the risk-sensitive Kiwi. Hence, it will be prudent to wait for strong follow-through buying before confirming that the NZD/USD pair has bottomed out.
Market participants now look forward to the US economic docket – featuring the release of the ADP report on private-sector employment and ISM Services PMI. Apart from this, traders will take cues from speeches by FOMC members, including Fed Chair Jerome Powell. This, along with the US bond yields and the broader risk sentiment, will drive the USD demand and contribute to producing short-term trading opportunities around the NZD/USD pair.
- Gold price scales higher for the seventh straight day and advances to a fresh record peak.
- Rising geopolitical tensions in the Middle East continue to benefit the safe-haven XAU/USD.
- A weaker USD also lends support, though reduced June Fed rate cut bets might cap gains.
Gold price (XAU/USD) enters a bullish consolidation phase after touching a fresh all-time high, around the $2,288-2,289 area during the Asian session on Wednesday, and seems poised to appreciate further. Against the backdrop of persistent geopolitical risks stemming from the protracted Russia-Ukraine war and conflicts in the Middle East, the uncertainty over the Federal Reserve’s (Fed) plans to cut interest rates tempers investors' appetite for riskier assets. This is evident from a generally weaker tone around the equity markets and turns out to be a key factor acting as a tailwind for the safe-haven precious metal.
Apart from this, a modest US Dollar (USD) downtick is seen lending additional support to the Gold price. Bulls, meanwhile, seem rather unaffected by reduced bets for a June rate cut by the Federal Reserve (Fed), which tends to drive flows away from the non-yielding yellow metal. That said, overstretched conditions on the daily chart cap gains for the XAU/USD. Nevertheless, the aforementioned fundamental backdrop suggests that the path of least resistance for the commodity is to the upside. Hence, any meaningful corrective pullback could be seen as a buying opportunity and is more likely to remain limited.
Daily Digest Market Movers: Gold price continues to attract haven flows amid persistent geopolitical risks
- Geopolitical tensions ratcheted up after Israeli strikes on Iran's embassy in Syria, raising the risk of a further escalation of conflict in the Middle East and lifting the safe-haven Gold price to a fresh record peak on Wednesday.
- Data released this week showed that the US manufacturing sector expanded in March for the first time since September 2022 and that demand for labor remains elevated, forcing investors to trim their bets for rate cuts in the US.
- The Labor Department published the Job Openings and Labor Turnover Survey (JOLTS) on Tuesday, which showed that job openings rose modestly from 8.75 million and stayed at a historically high level of 8.76 million in February.
- Separately, the Commerce Department reported that orders for manufactured goods rebounded in February after two straight monthly declines and rose more than expected by 1.4% amid demand for machinery and commercial aircraft.
- San Francisco Fed President Mary Daly noted on Tuesday that inflation is gradually decreasing, though she feels no urgency to lower interest rates, and that three rate cuts this year is a projection, not a promise.
- Cleveland President Loretta Mester said that substantial progress has been made on inflation, though she wants to see more evidence that inflation is headed towards the 2% target before cutting interest rates.
- This comes on the back of Fed Chair Jerome Powell's remarks on Friday, saying that there was no need to be in a hurry to cut interest rates and raised doubts if the central bank will cut rates three times this year.
- The current market pricing indicates a nearly even chance that the Federal Reserve will start cutting rates in June and a total of 65 basis points (bps) rate cut for 2024, lower than the central bank's projection of 75 bps.
- The yield on the benchmark 10-year US government bond advanced to a four-month high, which should help limit the downside for the US Dollar and cap gains for the non-yielding yellow metal amid overbought conditions.
- Investors now look to the US economic docket, featuring the ADP report on private-sector employment and ISM Services PMI, which, along with speeches by influential FOMC members, should provide a fresh impetus.
Technical Analysis: Gold price needs to consolidate before the next leg up amid overbought RSI on the daily chart
From a technical perspective, the Gold price has been scaling higher in uncharted territory, and the recent momentum seems strong enough to allow bulls to conquer the $2,300 mark. That said, the Relative Strength Index (RSI) on the daily chart is flashing extremely overbought conditions and warrants some caution. Hence, it will be prudent to wait for some near-term consolidation or a modest pullback before positioning for any further gains.
Meanwhile, any corrective decline now seems to find support near the $2,265 area ahead of the $2,250 level. This is followed by the weekly low, around the $2,228 region, which, if broken, might prompt some technical selling and drag the Gold price back toward the $2,200 psychological mark. The latter should act as a key pivotal point, and a convincing break below might shift the near-term bias in favor of bearish traders.
Gold FAQs
Gold has played a key role in human’s history as it has been widely used as a store of value and medium of exchange. Currently, apart from its shine and usage for jewelry, the precious metal is widely seen as a safe-haven asset, meaning that it is considered a good investment during turbulent times. Gold is also widely seen as a hedge against inflation and against depreciating currencies as it doesn’t rely on any specific issuer or government.
Central banks are the biggest Gold holders. In their aim to support their currencies in turbulent times, central banks tend to diversify their reserves and buy Gold to improve the perceived strength of the economy and the currency. High Gold reserves can be a source of trust for a country’s solvency. Central banks added 1,136 tonnes of Gold worth around $70 billion to their reserves in 2022, according to data from the World Gold Council. This is the highest yearly purchase since records began. Central banks from emerging economies such as China, India and Turkey are quickly increasing their Gold reserves.
Gold has an inverse correlation with the US Dollar and US Treasuries, which are both major reserve and safe-haven assets. When the Dollar depreciates, Gold tends to rise, enabling investors and central banks to diversify their assets in turbulent times. Gold is also inversely correlated with risk assets. A rally in the stock market tends to weaken Gold price, while sell-offs in riskier markets tend to favor the precious metal.
The price can move due to a wide range of factors. Geopolitical instability or fears of a deep recession can quickly make Gold price escalate due to its safe-haven status. As a yield-less asset, Gold tends to rise with lower interest rates, while higher cost of money usually weighs down on the yellow metal. Still, most moves depend on how the US Dollar (USD) behaves as the asset is priced in dollars (XAU/USD). A strong Dollar tends to keep the price of Gold controlled, whereas a weaker Dollar is likely to push Gold prices up.
- USD/CAD could lose ground on stronger Crude prices on Wednesday.
- WTI price gains support due to concerns over a shortage of supply.
- US Dollar faces challenges after Fed officials made dovish comments.
USD/CAD seems to move in the negative direction for the second consecutive session, edging lower to near 1.3560 during the Asian session on Wednesday. The strength of the Crude oil prices contributes support for the Canadian Dollar (CAD), consequently, undermining the USD/CAD pair.
Western Texas Intermediate (WTI) oil price hovers around $84.80, near Wednesday's highest since October 2023. The increase in WTI price is supported by the weakening US Dollar and concerns over supply due to geopolitical uncertainties.
Moreover, the weaker US Dollar Index (DXY) applies downward pressure on the USD/CAD pair. DXY faces challenges after Federal Reserve (Fed) officials made dovish comments. Cleveland Fed President Loretta Mester expressed expectations of rate cuts later this year, while San Francisco Fed President Mary Daly deemed three rate cuts in 2024 "reasonable," pending further convincing evidence.
On Tuesday, US February JOLTS Job Openings rose to 8.756 million from the previous figure of 8.748 million, surpassing market expectations. Additionally, Factory Orders increased by 1.4% month-on-month in February from a 3.8% decline in the prior reading.
Market participants are anticipated to closely monitor Canadian Import and Export data on Thursday, along with labor data scheduled for release on Friday. In the United States (US), attention will be on the ADP Employment Change and ISM Services PMI data on Wednesday. Additionally, Federal Reserve Chairman Jerome Powell is set to deliver a speech on the US economic outlook at the Stanford Business, Government, and Society Forum in Stanford.
- Indian Rupee struggles to gain ground amid the higher oil prices.
- The rising Middle East geopolitical tensions might weigh on the INR.
- Investors will focus on the US ADP Employment Change and the ISM Services PMI, due on Wednesday.
Indian Rupee (INR) loses momentum on Wednesday. The rise in crude oil prices to nearly a five-month high has exerted some selling pressure on the INR, as India is the world's second-biggest oil importer. The escalating geopolitical tensions in the Middle East and Russia-Ukraine might further boost crude oil prices and drag the INR lower. However, the robust Indian economic data and optimistic outlook for the Indian economy might limit the INR’s downside.
The final reading of Indian HSBC Services PMI for March will be due on Thursday. On Friday, Reserve Bank of India (RBI) Governor Shaktikanta Das will unveil the first monetary policy of the financial year 2024–25. According to a majority of analysts, the Indian central bank is likely to keep its key repo rate unchanged at 6.50% at its April meeting and maintain its stance of withdrawal of accommodation. On the US docket, the ADP Employment Change and the ISM Services PMI will be published on Wednesday. On Friday, the Nonfarm Payrolls (NFP) will be released.
Daily digest market movers: Indian Rupee seems vulnerable amid higher crude oil prices and global factors
- Oil prices edge higher to their highest level in five months, propelled by concerns that rising tensions in the Middle East could crimp supply.
- India’s HSBC Manufacturing PMI rose to 59.1 in March from the flash estimate of 56.9, below the market consensus of 59.2.
- RBI would allow exchanges to offer forex derivative contracts involving the INR only for contracted exposure or hedging, compared to the current allowance of up to $100 million without any explicit underlying exposure. The rule will come into effect on April 5.
- The RBI's MPC decided to keep the benchmark interest rate unchanged at 6.5% for the sixth straight meeting at its last meeting in February, citing inflationary concerns, and decided to remain focused on the withdrawal of accommodation.
- Cleveland Fed President Loretta Mester said on Tuesday that she expects rate cuts this year but ruled out the next policy meeting in May.
- San Francisco Fed President Mary Daly stated she thinks three rate cuts in 2024 seem "reasonable," but she needs more convincing evidence to confirm it.
- According to the CME FedWatch Tool, investors are now pricing in about a 65% odds of a rate cut by June, down from about 70% after the Fed's March meeting.
- The US February JOLTS Job Openings climbed to 8.756M in February from a downwardly revised 8.748M in January, better than the market estimation.
Technical analysis: USD/INR keeps the bullish vibe in the longer term
Indian Rupee trades on a weaker note on the day. The bullish outlook of USD/INR remains unchanged since the pair has risen above a nearly four-month-old descending trend channel since last week.
In the near term, USD/INR is above the key 100-day Exponential Moving Average (EMA) on the daily timeframe. The 14-day Relative Strength Index hovers around 64.15 in the bullish territory, indicating that further upside looks favorable for the pair.
Any follow-through buying above a high of November 10, 2023, at 83.49 may extend its upswing to an all-time high of 83.70. The additional upside filter to watch is the 84.00 psychological level. In case of sustained trading below the support level near a high of March 21 at 83.20, the pair could fall back to 83.00 (round mark, the 100-day EMA), followed by a low of March 14 at 82.80.
US Dollar price today
The table below shows the percentage change of US Dollar (USD) against listed major currencies today. US Dollar was the strongest against the Euro.
| USD | EUR | GBP | CAD | AUD | JPY | NZD | CHF | |
| USD | -0.05% | 0.03% | 0.04% | 0.07% | 0.03% | 0.18% | 0.05% | |
| EUR | 0.06% | 0.09% | 0.11% | 0.15% | 0.09% | 0.23% | 0.10% | |
| GBP | -0.04% | -0.09% | 0.00% | 0.04% | -0.02% | 0.13% | 0.01% | |
| CAD | -0.05% | -0.10% | -0.02% | 0.02% | -0.02% | 0.14% | 0.00% | |
| AUD | -0.08% | -0.13% | -0.05% | -0.03% | -0.04% | 0.10% | -0.02% | |
| JPY | -0.02% | -0.08% | -0.02% | 0.02% | 0.06% | 0.15% | 0.03% | |
| NZD | -0.18% | -0.23% | -0.15% | -0.14% | -0.10% | -0.16% | -0.13% | |
| CHF | -0.05% | -0.10% | -0.02% | 0.00% | 0.04% | -0.02% | 0.13% |
The heat map shows percentage changes of major currencies against each other. The base currency is picked from the left column, while the quote currency is picked from the top row. For example, if you pick the Euro from the left column and move along the horizontal line to the Japanese Yen, the percentage change displayed in the box will represent EUR (base)/JPY (quote).
Indian Rupee FAQs
The Indian Rupee (INR) is one of the most sensitive currencies to external factors. The price of Crude Oil (the country is highly dependent on imported Oil), the value of the US Dollar – most trade is conducted in USD – and the level of foreign investment, are all influential. Direct intervention by the Reserve Bank of India (RBI) in FX markets to keep the exchange rate stable, as well as the level of interest rates set by the RBI, are further major influencing factors on the Rupee.
The Reserve Bank of India (RBI) actively intervenes in forex markets to maintain a stable exchange rate, to help facilitate trade. In addition, the RBI tries to maintain the inflation rate at its 4% target by adjusting interest rates. Higher interest rates usually strengthen the Rupee. This is due to the role of the ‘carry trade’ in which investors borrow in countries with lower interest rates so as to place their money in countries’ offering relatively higher interest rates and profit from the difference.
Macroeconomic factors that influence the value of the Rupee include inflation, interest rates, the economic growth rate (GDP), the balance of trade, and inflows from foreign investment. A higher growth rate can lead to more overseas investment, pushing up demand for the Rupee. A less negative balance of trade will eventually lead to a stronger Rupee. Higher interest rates, especially real rates (interest rates less inflation) are also positive for the Rupee. A risk-on environment can lead to greater inflows of Foreign Direct and Indirect Investment (FDI and FII), which also benefit the Rupee.
Higher inflation, particularly, if it is comparatively higher than India’s peers, is generally negative for the currency as it reflects devaluation through oversupply. Inflation also increases the cost of exports, leading to more Rupees being sold to purchase foreign imports, which is Rupee-negative. At the same time, higher inflation usually leads to the Reserve Bank of India (RBI) raising interest rates and this can be positive for the Rupee, due to increased demand from international investors. The opposite effect is true of lower inflation.
- Australian Dollar depreciates due to the lower ASX 200 Index on Wednesday.
- Australian Industry Group Industry Index improved to a reading of -5.3 from -14.9 prior.
- China's Services PMI improved to 52.7 in March, compared with the previous reading of 52.5.
- US Dollar receives downward pressure following dovish remarks from Fed officials.
The Australian Dollar (AUD) retraces its recent gains registered on Tuesday, edging lower on Wednesday. However, the US Dollar (USD) experienced depreciation due to downward pressure on US Treasury yields, consequently providing support to the AUD/USD pair. Additionally, the decline in the ASX 200 Index contributes to pressure on the AUD.
The Australian Industry Group (AiG) Industry Index showed improvement in February, rising to a reading of -5.3 from the previous -14.9. Similarly, the Manufacturing PMI came in at -7, compared to the prior reading of -12.6. According to Westpac's summary of the Reserve Bank of Australia (RBA) March meeting minutes, the current cash rate level is considered suitable for the present circumstances, although conditions may change in the future.
The US Dollar Index (DXY) encounters obstacles following dovish remarks from Federal Reserve (Fed) officials. Cleveland Fed President Loretta Mester indicated on Tuesday her anticipation of rate cuts later this year. Concurrently, San Francisco Fed President Mary Daly expressed her view that three rate cuts in 2024 appear "reasonable," contingent upon further convincing evidence to solidify such a decision.
Daily Digest Market Movers: Australian Dollar depreciates on weaker ASX 200
- AiG Construction PMI posted a reading of -12.9 in February, against the previous -18.4 reading.
- Australia’s TD Securities Inflation (YoY) came in at 3.8% in March, against the previous increase of 4.0%.
- Melbourne Institute's Monthly Inflation Gauge increased by 0.1% in March, following a decrease of 0.1% in the previous month.
- ANZ Job Advertisements declined by 1.0% in March, compared to the previous decline of 2.1%.
- RBA March minutes showed that the board did not contemplate the option of raising interest rates. They unanimously agreed that it was challenging to definitively predict future changes in the cash rate. While the economic outlook remained uncertain, the risks appeared to be generally balanced. The board acknowledged that it would require "some time" before they could express confidence in inflation returning to the target level.
- On Monday, China's Caixin Manufacturing PMI came in at 51.1, against the expected 51.0 and 50.9 prior.
- China's National Bureau of Statistics (NBS) announced on Sunday that the monthly NBS Manufacturing PMI rose to 50.8 in March from 49.1 in the prior month. Additionally, the NBS Non-Manufacturing PMI increased to 53.0 in March from 51.4 in February.
- US President Joe Biden engaged in a phone conversation with Chinese leader Xi Jinping sometime after November. During the call, the two leaders had an open and constructive dialogue covering various bilateral, regional, and global topics, addressing both areas of collaboration and points of divergence.
- Treasury Secretary Janet Yellen is set to visit China this week, where she will hold meetings with China's Finance Minister, as well as engage with economists, students, and members of the business community.
- US ISM Manufacturing PMI indicated a surprise expansion in March, as the index climbed to 50.3 in March from February's 47.8, surpassing expectations of 48.4. This reading marked the highest level observed since September 2022.
- US ISM Manufacturing Prices Paid increased to 55.8 in March, compared to the expected 52.6 and 52.5 prior.
Technical Analysis: Australian holds position above psychological level of 0.6500
The Australian Dollar hovers around 0.6510 on Wednesday. Immediate support is seen around the psychological level of 0.6500. A breach beneath this mark may lead the AUD/USD pair towards the vicinity of March’s low at 0.6477 and the significant level of 0.6450. Conversely, key resistance is noted at the 23.6% Fibonacci retracement level of 0.6525, followed by the 14-day Exponential Moving Average (EMA) at 0.6530. Additional resistance is situated at the major level of 0.6550.
AUD/USD: Daily Chart
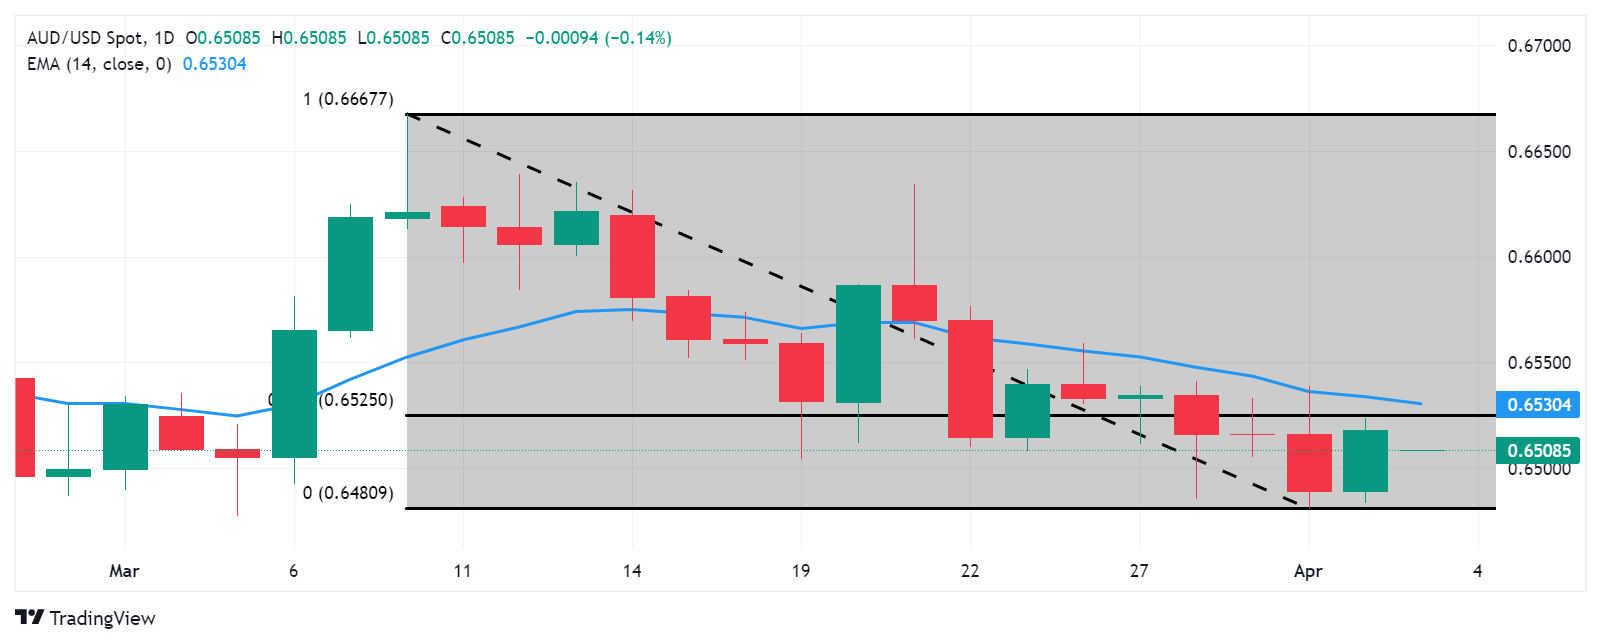
Australian Dollar price today
The table below shows the percentage change of Australian Dollar (AUD) against listed major currencies today. Australian Dollar was the weakest against the Euro.
| USD | EUR | GBP | CAD | AUD | JPY | NZD | CHF | |
| USD | -0.06% | 0.04% | 0.06% | 0.09% | 0.03% | 0.17% | 0.05% | |
| EUR | 0.05% | 0.09% | 0.12% | 0.15% | 0.08% | 0.22% | 0.10% | |
| GBP | -0.04% | -0.10% | 0.02% | 0.05% | -0.01% | 0.13% | 0.01% | |
| CAD | -0.05% | -0.12% | -0.03% | 0.02% | -0.03% | 0.12% | -0.01% | |
| AUD | -0.10% | -0.12% | -0.05% | -0.03% | -0.06% | 0.09% | -0.04% | |
| JPY | -0.03% | -0.08% | -0.02% | 0.03% | 0.06% | 0.14% | 0.02% | |
| NZD | -0.17% | -0.22% | -0.13% | -0.11% | -0.09% | -0.15% | -0.12% | |
| CHF | -0.05% | -0.11% | -0.01% | 0.01% | 0.04% | -0.02% | 0.12% |
The heat map shows percentage changes of major currencies against each other. The base currency is picked from the left column, while the quote currency is picked from the top row. For example, if you pick the Euro from the left column and move along the horizontal line to the Japanese Yen, the percentage change displayed in the box will represent EUR (base)/JPY (quote).
Australian Dollar FAQs
One of the most significant factors for the Australian Dollar (AUD) is the level of interest rates set by the Reserve Bank of Australia (RBA). Because Australia is a resource-rich country another key driver is the price of its biggest export, Iron Ore. The health of the Chinese economy, its largest trading partner, is a factor, as well as inflation in Australia, its growth rate, and Trade Balance. Market sentiment – whether investors are taking on more risky assets (risk-on) or seeking safe havens (risk-off) – is also a factor, with risk-on positive for AUD.
The Reserve Bank of Australia (RBA) influences the Australian Dollar (AUD) by setting the level of interest rates that Australian banks can lend to each other. This influences the level of interest rates in the economy as a whole. The main goal of the RBA is to maintain a stable inflation rate of 2-3% by adjusting interest rates up or down. Relatively high interest rates compared to other major central banks support the AUD, and the opposite for relatively low. The RBA can also use quantitative easing and tightening to influence credit conditions, with the former AUD-negative and the latter AUD-positive.
China is Australia’s largest trading partner so the health of the Chinese economy is a major influence on the value of the Australian Dollar (AUD). When the Chinese economy is doing well it purchases more raw materials, goods, and services from Australia, lifting demand for the AUD, and pushing up its value. The opposite is the case when the Chinese economy is not growing as fast as expected. Positive or negative surprises in Chinese growth data, therefore, often have a direct impact on the Australian Dollar and its pairs.
Iron Ore is Australia’s largest export, accounting for $118 billion a year according to data from 2021, with China as its primary destination. The price of Iron Ore, therefore, can be a driver of the Australian Dollar. Generally, if the price of Iron Ore rises, AUD also goes up, as aggregate demand for the currency increases. The opposite is the case if the price of Iron Ore falls. Higher Iron Ore prices also tend to result in a greater likelihood of a positive Trade Balance for Australia, which is also positive for the AUD.
The Trade Balance, which is the difference between what a country earns from its exports versus what it pays for its imports, is another factor that can influence the value of the Australian Dollar. If Australia produces highly sought-after exports, then its currency will gain in value purely from the surplus demand created by foreign buyers seeking to purchase its exports versus what it spends to purchase imports. Therefore, a positive net Trade Balance strengthens the AUD, with the opposite effect if the Trade Balance is negative.
China's Services Purchasing Managers' Index (PMI) improved to 52.7 in March, compared with the February print of 52.5, the latest data published by Caixin showed on Tuesday.
The data came in line with the market expectations in the reported period.
Key points
Incoming new business rises solidly, driving higher business activity.
Business confidence improves.
Selling prices increase at slower rate alongside fall in cost inflation.
Commenting on the China General Services PMI ™ data, Dr. Wang Zhe, Senior Economist at Caixin Insight Group said: “Growth of supply and demand picked up pace. Improved market demand drove a continuous increase in supply.”
“Business activity and total new orders both grew for the 15th straight month, while exports continued to grow amid a recovery of the global economy, pushing the corresponding measure to its highest level since June,” Wang added.
AUD/USD reaction to China’s Services PMI
Upbeat Chinese Services PMI fails to impress the Aussie Dollar, as AUD/USD challenges lows near 0.6500. At the time of writing, the pair is down 0.10% on the day.
Australian Dollar price today
The table below shows the percentage change of Australian Dollar (AUD) against listed major currencies today. Australian Dollar was the weakest against the Euro.
| USD | EUR | GBP | CAD | AUD | JPY | NZD | CHF | |
| USD | -0.03% | 0.03% | 0.04% | 0.07% | 0.04% | 0.19% | 0.02% | |
| EUR | 0.04% | 0.07% | 0.08% | 0.11% | 0.07% | 0.21% | 0.04% | |
| GBP | -0.04% | -0.07% | 0.01% | 0.03% | -0.01% | 0.14% | -0.02% | |
| CAD | -0.04% | -0.07% | -0.01% | 0.03% | -0.01% | 0.15% | -0.03% | |
| AUD | -0.07% | -0.10% | -0.03% | -0.02% | -0.03% | 0.13% | -0.05% | |
| JPY | -0.03% | -0.08% | -0.02% | 0.02% | 0.04% | 0.13% | -0.03% | |
| NZD | -0.19% | -0.22% | -0.15% | -0.15% | -0.11% | -0.15% | -0.17% | |
| CHF | -0.01% | -0.04% | 0.02% | 0.03% | 0.07% | 0.03% | 0.17% |
The heat map shows percentage changes of major currencies against each other. The base currency is picked from the left column, while the quote currency is picked from the top row. For example, if you pick the Euro from the left column and move along the horizontal line to the Japanese Yen, the percentage change displayed in the box will represent EUR (base)/JPY (quote).
- The Japanese Yen struggles to capitalize on the overnight modest uptick against the USD.
- The BoJ’s dovish stance undermines the JPY, though intervention fears limit the downside.
- Reduced bets for a June Fed rate cut should lend support to the Greenback and USD/JPY.
The Japanese Yen (JPY) edges higher against its American counterpart during the Asian session on Wednesday, albeit it lacks follow-through and remains confined in a familiar range held over the past two weeks or so. Investors remain on alert amid the possibility of intervention by Japanese authorities to prevent a destabilising fall in the domestic currency. This, along with a generally weaker sentiment around the equity markets, turns out to be a key factor lending some support to the safe-haven JPY.
The US Dollar (USD), on the other hand, is seen consolidating the previous day's retracement slide from a five-month top and contributes to the mildly offered tone surrounding the USD/JPY pair. Any meaningful appreciating move for the JPY, however, seems elusive in the wake of the Bank of Japan's (BoJ) dovish language, signalling that the next rate hike will be some time away. In contrast, the markets continue trimming their bets that the Federal Reserve (Fed) will cut interest rates in June.
Expectations that the gap between US and Japanese interest rates will stay wide might further hold back the JPY bulls from placing aggressive bets, which, in turn, should help limit the downside for the USD/JPY pair. Investors now look to the US economic docket – featuring the release of the ADP report on private-sector employment and ISM Services PMI. This, along with speeches by influential FOMC members, including the Fed Chair Jerome Powell, should provide a fresh impetus later today.
Daily Digest Market Movers: Japanese Yen lacks firm near-term direction amid mixed fundamental cues
- Japanese Finance Minister Shunichi Suzuki repeated his warning that authorities were ready to take appropriate action against excessive exchange-rate volatility and offered some support to the Japanese Yen.
- The uncertainty over the Federal Reserve’s plans to cut interest rates, along with persistent geopolitical risks, tempers investors' appetite for riskier assets and further benefits the JPY's relative safe-haven status.
- The Bank of Japan struck a dovish tone at the end of the March meeting and stopped short of offering any guidance about future policy steps, or the pace of policy normalization, which caps gains for the JPY.
- Odds of a June Fed rate cut dip below 50% after data released this week showed that the US manufacturing sector expanded in March for the first time since September 2022 and that demand for labor remains elevated.
- The US Bureau of Labor Statistics (BLS) reported in the Job Openings and Labor Turnover Survey (JOLTS) on Tuesday that the number of job openings on the last business day of February stood at 8.75 million.
- A separate report by the Commerce Department's Census Bureau showed that new orders for US-manufactured goods rebounded more than expected, by 1.4% in February following a 3.8% drop in the previous month.
- San Francisco Fed President Mary Daly said on Tuesday that inflation is gradually decreasing, though the process is erratic and gradual, and that maintaining the status quo is the appropriate policy at present.
- Adding to this, Cleveland Fed President Loretta Mester expects the central bank to cut rates later this year, though noted that moving rates down too soon would risk undoing the progress made on inflation.
- This comes on the back of Fed Chair Jerome Powell's remarks on Friday, saying that there was no need to be in a hurry to cut interest rates and raised doubts if the central bank will cut rates three times this year.
- The yield on the benchmark 10-year US government bond advanced to a four-month high, helping the US Dollar to stall the overnight pullback from a multi-month top and acting as a tailwind for the USD/JPY pair.
Technical Analysis: USD/JPY extends its consolidative price move in a familiar range, bullish bias remains
From a technical perspective, the range-bound price action witnessed over the past two weeks or so might still be categorised as a bullish consolidation phase against the backdrop of a strong rally from the March swing low. Moreover, oscillators on the daily chart are holding in the positive territory and are still far from being in the overbought zone. This, in turn, suggests that the path of least resistance for the USD/JPY pair is to the upside. That said, bulls might for a sustained breakout through the trading range resistance, around the 152.00 mark, or a multi-decade high, before positioning for any further appreciating move.
On the flip side, the lower end of the aforementioned trading range, around the 151.10-151.00 area, is likely to protect the immediate downside. Some follow-through selling below the 150.85-150.80 horizontal resistance breakpoint, now turned support, could expose the next relevant support near the 150.25 area. This is closely followed by the 150.00 psychological mark, which if broken decisively might turn the USD/JPY pair vulnerable to accelerate the corrective decline further towards the 149.35-149.30 region before eventually dropping to the 149.00 mark.
Japanese Yen FAQs
The Japanese Yen (JPY) is one of the world’s most traded currencies. Its value is broadly determined by the performance of the Japanese economy, but more specifically by the Bank of Japan’s policy, the differential between Japanese and US bond yields, or risk sentiment among traders, among other factors.
One of the Bank of Japan’s mandates is currency control, so its moves are key for the Yen. The BoJ has directly intervened in currency markets sometimes, generally to lower the value of the Yen, although it refrains from doing it often due to political concerns of its main trading partners. The current BoJ ultra-loose monetary policy, based on massive stimulus to the economy, has caused the Yen to depreciate against its main currency peers. This process has exacerbated more recently due to an increasing policy divergence between the Bank of Japan and other main central banks, which have opted to increase interest rates sharply to fight decades-high levels of inflation.
The BoJ’s stance of sticking to ultra-loose monetary policy has led to a widening policy divergence with other central banks, particularly with the US Federal Reserve. This supports a widening of the differential between the 10-year US and Japanese bonds, which favors the US Dollar against the Japanese Yen.
The Japanese Yen is often seen as a safe-haven investment. This means that in times of market stress, investors are more likely to put their money in the Japanese currency due to its supposed reliability and stability. Turbulent times are likely to strengthen the Yen’s value against other currencies seen as more risky to invest in.
The Bank of Japan (BoJ) announced on Wednesday that it will continue to buy Japanese Government Bonds (JBGs) unchanged from the previous offer.
The BoJ offered to buy 150 billion yen in up to 1-year JGBs, 375 billion yen in one to three-year JGBs, 425 billion yen in three to five-year JGBs, and 150 billion yen in 10 to 25-year JGBs
Market reaction
At the time of writing, USD/JPY is trading 0.03% higher on the day at 151.60.
Bank of Japan FAQs
The Bank of Japan (BoJ) is the Japanese central bank, which sets monetary policy in the country. Its mandate is to issue banknotes and carry out currency and monetary control to ensure price stability, which means an inflation target of around 2%.
The Bank of Japan has embarked in an ultra-loose monetary policy since 2013 in order to stimulate the economy and fuel inflation amid a low-inflationary environment. The bank’s policy is based on Quantitative and Qualitative Easing (QQE), or printing notes to buy assets such as government or corporate bonds to provide liquidity. In 2016, the bank doubled down on its strategy and further loosened policy by first introducing negative interest rates and then directly controlling the yield of its 10-year government bonds.
The Bank’s massive stimulus has caused the Yen to depreciate against its main currency peers. This process has exacerbated more recently due to an increasing policy divergence between the Bank of Japan and other main central banks, which have opted to increase interest rates sharply to fight decades-high levels of inflation. The BoJ’s policy of holding down rates has led to a widening differential with other currencies, dragging down the value of the Yen.
A weaker Yen and the spike in global energy prices have led to an increase in Japanese inflation, which has exceeded the BoJ’s 2% target. Still, the Bank judges that the sustainable and stable achievement of the 2% target has not yet come in sight, so any sudden change in the current policy looks unlikely.
- ASX 200 Index loses ground as the real estate and information technology sectors weaken.
- Wall Street declined as the US Treasury yields have risen after strong US economic data.
- Resonance Health is positioned to finalize the acquisition of TrialsWest in an $8 million deal.
The ASX 200 Index continues its decline, nearing 7,790 and dropping by nearly 0.90% on Wednesday, following a downturn on Wall Street the previous day. The domestic equity market is weighed down by the real estate and information technology sectors, which are sensitive to interest rate changes. US Treasury yields have risen after strong US economic data, leading to speculation that the Federal Reserve (Fed) may be cautious in reducing borrowing costs.
According to Westpac's summary of the Reserve Bank of Australia (RBA) March meeting minutes, the current cash rate level is deemed appropriate for the time being, although conditions may evolve. The Board also indicates a balanced approach as the preferred model for future policy implementation.
The ASX 200 Index saw Regis Resources as the weakest performer, plunging by 5.21% to 1.91, followed by Credit Corp Group, down by 4.83% to 17.95, and Arcadium Lithium, which dropped by 3.94% to 4.14. In the meantime, the top gainers included Ramelius Resources, surging by 10.06% to 1.99, West African Resources, rising by 4.31% to 1.33, and Boss Energy, gaining by 3.43% to 5.12.
Boss Energy has reached a crucial technical milestone in its Honeymoon re-start strategy, clearing the path for the first drum of uranium to be filled within the next two weeks at the South Australian mine. The company has effectively filled the processing plant's ion exchange (IX) column with uranium-rich lixiviant sourced from the Honeymoon wellfields.
Resonance Health is positioned to finalize the acquisition of TrialsWest in an $8 million deal., thereby broadening its global clinical trial outreach. TrialsWest, renowned as one of Australia’s most seasoned clinical research centers, engages in collaborations with prominent pharmaceutical and biotechnology firms across the globe. Its mission revolves around facilitating the development of novel medicines and vaccines for the benefit of the global community.
Australian Stock Market FAQs
Stock markets in Australia are managed by the Australian Securities Exchange (ASX), headquartered in Sydney. The main indices are the S&P/ASX 200 and the S&P/ASX 300, which track the performance of the 200 and 300 largest stocks by market capitalization listed on the exchange, respectively. The S&P/ASX 200 was launched in April 2000, and it is rebalanced every quarter.
Almost half of the index belongs to the financial sector, with major banks like the Commonwealth Bank of Australia, Westpac or National Australia Bank. The so-called materials sector is also relevant – comprising almost 20% of the weighting in the index – with mining giants such as BHP Group or Rio Tinto. Other important sectors are biotechnology, real estate, consumer staples, and industrials.
Many different factors drive the ASX 200, but mainly it is the aggregate performance of the component companies revealed in their quarterly and annual earnings reports the main factor behind its performance. Commodity prices can also affect the index given its significant share of mining companies. Macroeconomic data such as Gross Domestic Product (GDP) growth, inflation, or unemployment data from Australia is also important as they are indicators of the health of the country’s economy and thus the profitability of its largest companies. Global economic conditions may also play a role, particularly from China, as the Asian country is Australia’s largest trading partner.
The level of interest rates in Australia, set by the Reserve Bank of Australia (RBA), also influences the ASX 200 and ASX 300 indexes as it affects the cost of credit, on which many firms are heavily reliant. Generally, when the RBA cuts interest rates (or signals it is going to do it), it is positive for the Australian stock market as it means a lower cost of credit for companies and higher economic growth ahead, likely boosting sales. On the contrary, if the RBA signals that it will increase interest rates, this tends to weigh on the index. As always, there is a caveat: banks. Financial institutions tend to benefit from higher interest rates because they earn more from lending to other businesses, thus boosting their overall income.
On Wednesday, the People’s Bank of China (PBoC) set the USD/CNY central rate for the trading session ahead at 7.0949 as compared to the previous day's fix of 7.0957 and 7.2282 Reuters estimates.
- WTI edges higher to $84.85, a five-month high on Wednesday.
- Geopolitical uncertainties in the Middle East and supply fears boosted oil prices.
- The weaker US Dollar from the Fed’s dovish comments lift WTI prices.
Western Texas Intermediate (WTI), the US crude oil benchmark, is trading around $84.85, the highest since October 2023 on Wednesday. The uptick in WTI prices is bolstered by the weaker US Dollar (USD), and the supply fears amid the geopolitical uncertainties.
The escalating geopolitical tensions in the Middle East and Russia-Ukrain, such as the Israeli airstrike on an Iranian embassy in Syria on Monday, the ongoing Ukrainian attacks on Russian refineries, and the Houthi attacks on shipping in the Red Sea, raise fear of further tightening supplies, which boost WTI prices.
Oil traders will monitor the Joint OPEC/non-OPEC Ministerial Monitoring Committee (JMMC) meeting on Wednesday. The markets expect the OPEC+ committee to extend voluntary cuts for the second quarter of the year.
Furthermore, the softer Greenback amid the growing speculation on rate cuts from the Fed also provides some support for WTI prices. Futures traders anticipate the US Fed to start easing in the June meeting and to cut by three-quarters of a percentage point by the end of the year. A weaker USD lifts WTI prices as it makes dollar-denominated oil more cheaper for holders of other currencies, boosting oil demand.
Market players will closely watch Fedspeak on Wednesday. The Fed's Bowman, Goolsbee, Barr, Kugler, and Powell are set to speak later in the day. If they deliver any hawkish comments, the US Dollar could attract some buyers, which might cap the WTI’s upside.
| Pare | Closed | Change, % |
|---|---|---|
| AUDUSD | 0.65175 | 0.45 |
| EURJPY | 163.257 | 0.24 |
| EURUSD | 1.07729 | 0.28 |
| GBPJPY | 190.614 | 0.18 |
| GBPUSD | 1.25768 | 0.22 |
| NZDUSD | 0.59714 | 0.32 |
| USDCAD | 1.35617 | -0.08 |
| USDCHF | 0.90762 | 0.37 |
| USDJPY | 151.554 | -0.04 |
- EUR/USD trades softer around 1.0765 despite the softer US Dollar.
- Futures traders expect the US Fed to start easing in the June meeting.
- The German HICP figure rose 2.3% YoY in March, its lowest level since June 2021.
The EUR/USD pair clings to mild losses near 1.0765 after bouncing off the multi-week lows near 1.0720 on Wednesday. The weaker US Dollar Index (DXY) below the 105.00 mark provided some support to the major pair. However, the softer German inflation data on Tuesday weighs on the Euro as it has triggered the speculation of rate cuts from the European Central Bank (ECB). Investors await the advanced Eurozone inflation data for March and the US ISM Services PMI for fresh impetus.
The dovish comments from many Federal Reserve (Fed) officials weigh on the Greenback. Cleveland Fed President Loretta Mester said on Tuesday that she expects rate cuts this year, but ruled out the next policy meeting in May. Meanwhile, San Francisco Fed President Mary Daly, stated she thinks three rate cuts in 2024 seem "reasonable," but she needs more convincing evidence to confirm it. Futures traders anticipate the US Fed to start easing in the June meeting and to cut by three-quarters of a percentage point by the end of the year.
German inflation eased slightly more than expected in March, the lowest in almost three years, the German statistics office Destatis reported on Tuesday. The preliminary German Harmonized Index of Consumer Prices (HICP) rose 0.6% MoM in March, slightly below the estimation of a 0.7% MoM rise. The year-on-year rate of HICP rose 2.3%, below the market consensus of 2.4%. The softer inflation indicated Germany is nearing the European Central Bank's (ECB) target of 2%, raising market hopes for an imminent interest rate cut. This, in turn, exerts some selling pressure on the Euro (EUR) and creates a headwind for the EUR/USD pair.


© 2000-2026. All rights reserved.
This site is managed by Teletrade D.J. LLC 2351 LLC 2022 (Euro House, Richmond Hill Road, Kingstown, VC0100, St. Vincent and the Grenadines).
The information on this website is for informational purposes only and does not constitute any investment advice.
The company does not serve or provide services to customers who are residents of the US, Canada, Iran, The Democratic People's Republic of Korea, Yemen and FATF blacklisted countries.
Making transactions on financial markets with marginal financial instruments opens up wide possibilities and allows investors who are willing to take risks to earn high profits, carrying a potentially high risk of losses at the same time. Therefore you should responsibly approach the issue of choosing the appropriate investment strategy, taking the available resources into account, before starting trading.
Use of the information: full or partial use of materials from this website must always be referenced to TeleTrade as the source of information. Use of the materials on the Internet must be accompanied by a hyperlink to teletrade.org. Automatic import of materials and information from this website is prohibited.
Please contact our PR department if you have any questions or need assistance at pr@teletrade.global.
transfers