- Analytics
- News and Tools
- Market News
Analytics, News, and Forecasts for CFD Markets: currency news — 01-04-2024.
- GBP/USD struggles to gain ground near 1.2545 on the stronger US Dollar.
- The US ISM manufacturing data unexpectedly expanded for the first time in nearly 18 months.
- The dovish stance of the Bank of England (BoE) drags the GBP lower against the USD.
The GBP/USD pair remains on the defensive around 1.2545 during the early Asian session on Tuesday. The US Dollar Index (DXY) rises above the 105.00 mark, and the US Treasury bond yields edges higher sharply overnight following the upbeat US ISM data, which creates a headwind for the GBP/USD pair.
The US ISM Manufacturing PMI data unexpectedly expanded in March, with the index rising to 50.3 from 47.8 in February, stronger than the expectation of 48.4. The reading registered the highest level since September 2022, and it is the first time manufacturing activity has expanded since October 2022. A reading above 50 indicates that the manufacturing economy is generally expanding, while a reading below 50 signals that factory activity is generally declining. In response to the stronger-than-expected data, the US Dollar (USD) attracts some buyers across the board.
The dovish stance of the Bank of England (BoE) in its latest monetary policy statement has exerted some selling pressure on the Pound Sterling (GBP). The BoE Governor Andrew Bailey said that market expectations for two or three rate cuts this year are “reasonable,” while adding that the UK central bank is not seeing a lot of sticky persistence. These comments trigger expectations for the BoE to cut interest rates in June and drag the GBP lower against the Greenback.
Later on Tuesday, the UK Nationwide Housing Prices and S&P Global/CIPS Manufacturing PMI for March are due. Also, Federal Reserve (Fed) officials, including Governor Michelle Bowman, Loretta Mester, John Williams, and Mary Daly, are set to speak on Tuesday.
- AUD/USD stays at 0.6490, pressured by surging US Treasury yields and a strengthening US economic outlook.
- Mixed manufacturing PMI readings highlight contrasting economic narratives between the US and Australia.
- Upcoming RBA minutes and comments from central bank officials to offer insights into Australia's monetary policy trajectory.
On Monday, the Australian Dollar registered losses of 0.4% against the US Dollar, sponsored by an improvement in business activity in the United States (US). However, with the Tuesday Asian session beginning, the AUD/USD is virtually unchanged at 0.6490, near the weekly lows at the time of writing.
Australian Dollar struggles for direction against a robust US Dollar, with market eyes on RBA minutes and policy cues.
The economic docket features essential data driving financial markets' price action. Firstly, the Institute for Supply Management (ISM) revealed that March’s Manufacturing PMI improved to expansionary territory for the first time in nearly eighteen months. Figures came at 50.3, exceeding estimates of 48.4 and February’s 47.8. Before the ISM release, S&P Global depicted the US economy as beginning to slow down, as the March number came at 51.9, down from 52.2.
Following the data release, US Treasury yields soared, underpinning the Greenback. The US Dollar Index (DXY), which measures the currency against six peers, aims up 0.42% at 104.96, after briefly peaking above 105.00.
The market reaction is linked to traders cutting bets for a quarter of a percentage point by the Federal Reserve’s June meeting.
Delving into over-the-weekend data, Fed Chair Jerome Powell commented that the US Core PCE aligned with their estimates. He said they need more evidence before cutting rates, adding they aren’t in a hurry to cut rates.
In addition, the Aussie’s Jibun Bank Manufacturing PMI reading for March was 47.3, below estimates of 47.8. According to the report, conditions deteriorated due to falls in new work inflows, leading to a reduction in manufacturing output. This is the second consecutive negative reading in the manufacturing segment.
Upbeat data from China keep the AUD/USD from further sliding, as China’s Caixin PMIs beat estimates in March, with new export orders increasing.
Ahead of the day, AUD/USD traders will dissect the latest Reserve Bank of Australia (RBA) meeting minutes, looking for cues regarding the forward path of monetary policy. As of writing, RBA Assistant Governor Kent is crossing the wires.
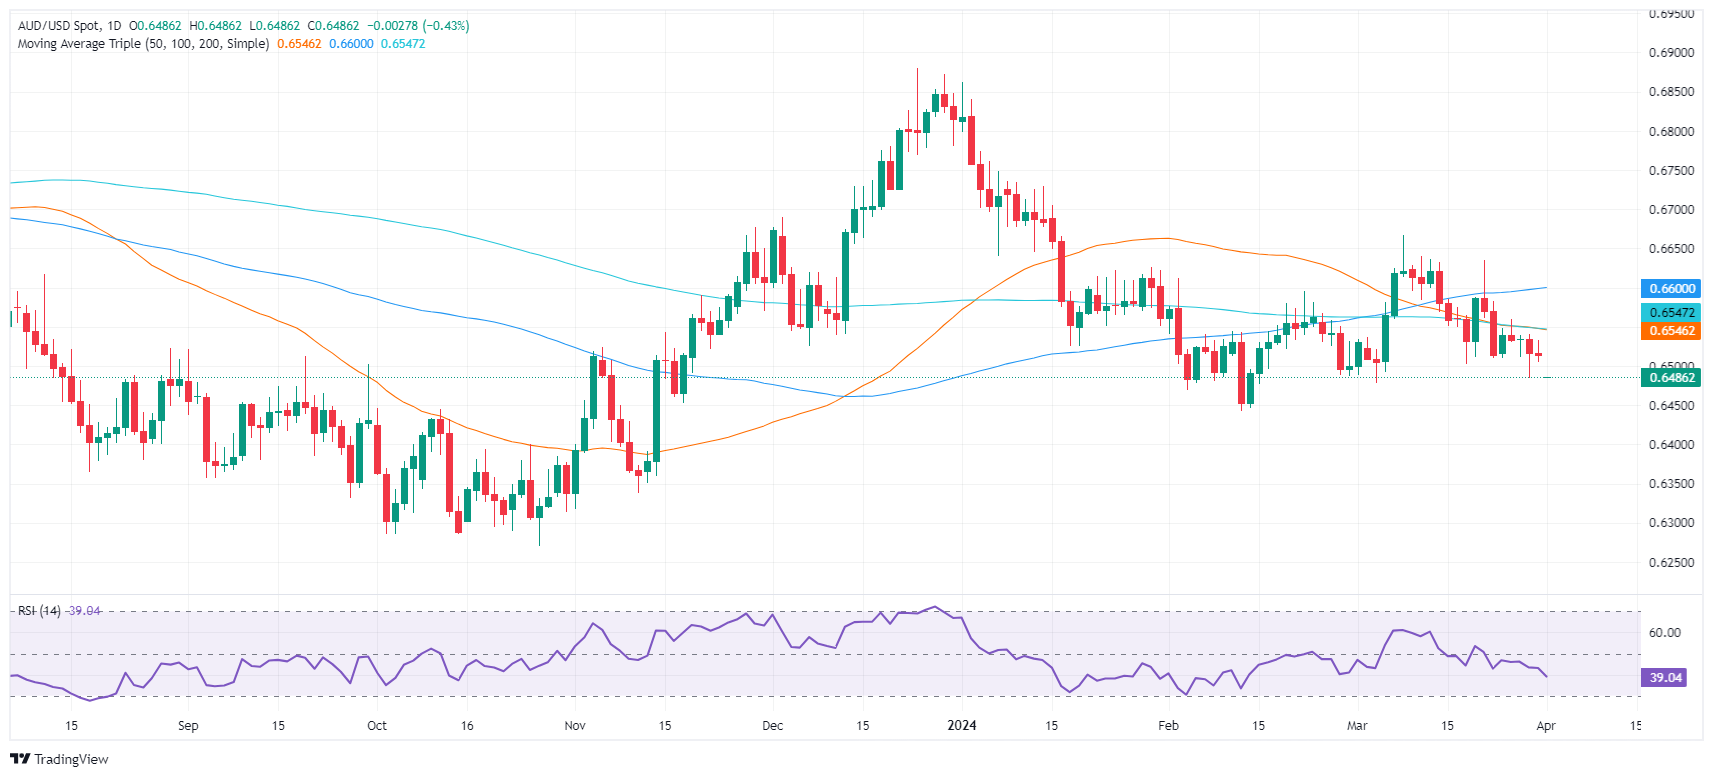
AUD/USD Price Analysis: Technical outlook
The AUD/USD seems to have bottomed out at around current levels, yet the Relative Strength Index (RSI) is bearish. If sellers push prices below the March 5 low of 0.6477, look for a pullback toward the February 13 low of 0.6442, ahead of 0.6400. On the flip side, the first resistance would be the 0.6500 mark, followed by the confluence of the 50 and 200-day moving averages (DMAs) at 0.6544.
Australian Dollar FAQs
One of the most significant factors for the Australian Dollar (AUD) is the level of interest rates set by the Reserve Bank of Australia (RBA). Because Australia is a resource-rich country another key driver is the price of its biggest export, Iron Ore. The health of the Chinese economy, its largest trading partner, is a factor, as well as inflation in Australia, its growth rate and Trade Balance. Market sentiment – whether investors are taking on more risky assets (risk-on) or seeking safe-havens (risk-off) – is also a factor, with risk-on positive for AUD.
The Reserve Bank of Australia (RBA) influences the Australian Dollar (AUD) by setting the level of interest rates that Australian banks can lend to each other. This influences the level of interest rates in the economy as a whole. The main goal of the RBA is to maintain a stable inflation rate of 2-3% by adjusting interest rates up or down. Relatively high interest rates compared to other major central banks support the AUD, and the opposite for relatively low. The RBA can also use quantitative easing and tightening to influence credit conditions, with the former AUD-negative and the latter AUD-positive.
China is Australia’s largest trading partner so the health of the Chinese economy is a major influence on the value of the Australian Dollar (AUD). When the Chinese economy is doing well it purchases more raw materials, goods and services from Australia, lifting demand for the AUD, and pushing up its value. The opposite is the case when the Chinese economy is not growing as fast as expected. Positive or negative surprises in Chinese growth data, therefore, often have a direct impact on the Australian Dollar and its pairs.
Iron Ore is Australia’s largest export, accounting for $118 billion a year according to data from 2021, with China as its primary destination. The price of Iron Ore, therefore, can be a driver of the Australian Dollar. Generally, if the price of Iron Ore rises, AUD also goes up, as aggregate demand for the currency increases. The opposite is the case if the price of Iron Ore falls. Higher Iron Ore prices also tend to result in a greater likelihood of a positive Trade Balance for Australia, which is also positive of the AUD.
The Trade Balance, which is the difference between what a country earns from its exports versus what it pays for its imports, is another factor that can influence the value of the Australian Dollar. If Australia produces highly sought after exports, then its currency will gain in value purely from the surplus demand created from foreign buyers seeking to purchase its exports versus what it spends to purchase imports. Therefore, a positive net Trade Balance strengthens the AUD, with the opposite effect if the Trade Balance is negative.
Reserve Bank of Australia Assistant Governor Christopher Kent said on Monday that there is no change to current rundown of balance sheet by holding bonds to maturity.
Key quotes
“RBA to adopt an ample reserves system for monetary policy.”
“To use open market repo operations at a price near the cash rate target.”
“To offer repos in full allotment auctions.”
“Supply of reserves can rise and fall in line with changes in demand.”
“RBA could also supply reserves via purchases of short-dated government bonds and/or fx swaps.”
“Can respond to market stresses if needed, including by conducting OMO more frequently than once a week.”
“Will end the current ‘floor’ system with an excess of reserves.”
“RBA’s balance sheet will be no larger than needs to be in order to implement monetary policy.”
“No change to current rundown of balance sheet by holding bonds to maturity.”
“Public consultation and liaison with market participants will commence shortly.”
Market reaction
At the press time, the AUD/USD pair was up 0.02% on the day to trade at 0.6490.
Australian Dollar FAQs
One of the most significant factors for the Australian Dollar (AUD) is the level of interest rates set by the Reserve Bank of Australia (RBA). Because Australia is a resource-rich country another key driver is the price of its biggest export, Iron Ore. The health of the Chinese economy, its largest trading partner, is a factor, as well as inflation in Australia, its growth rate and Trade Balance. Market sentiment – whether investors are taking on more risky assets (risk-on) or seeking safe-havens (risk-off) – is also a factor, with risk-on positive for AUD.
The Reserve Bank of Australia (RBA) influences the Australian Dollar (AUD) by setting the level of interest rates that Australian banks can lend to each other. This influences the level of interest rates in the economy as a whole. The main goal of the RBA is to maintain a stable inflation rate of 2-3% by adjusting interest rates up or down. Relatively high interest rates compared to other major central banks support the AUD, and the opposite for relatively low. The RBA can also use quantitative easing and tightening to influence credit conditions, with the former AUD-negative and the latter AUD-positive.
China is Australia’s largest trading partner so the health of the Chinese economy is a major influence on the value of the Australian Dollar (AUD). When the Chinese economy is doing well it purchases more raw materials, goods and services from Australia, lifting demand for the AUD, and pushing up its value. The opposite is the case when the Chinese economy is not growing as fast as expected. Positive or negative surprises in Chinese growth data, therefore, often have a direct impact on the Australian Dollar and its pairs.
Iron Ore is Australia’s largest export, accounting for $118 billion a year according to data from 2021, with China as its primary destination. The price of Iron Ore, therefore, can be a driver of the Australian Dollar. Generally, if the price of Iron Ore rises, AUD also goes up, as aggregate demand for the currency increases. The opposite is the case if the price of Iron Ore falls. Higher Iron Ore prices also tend to result in a greater likelihood of a positive Trade Balance for Australia, which is also positive of the AUD.
The Trade Balance, which is the difference between what a country earns from its exports versus what it pays for its imports, is another factor that can influence the value of the Australian Dollar. If Australia produces highly sought after exports, then its currency will gain in value purely from the surplus demand created from foreign buyers seeking to purchase its exports versus what it spends to purchase imports. Therefore, a positive net Trade Balance strengthens the AUD, with the opposite effect if the Trade Balance is negative.
- The daily chart of the pair reflects a prevailing negative trend with indicators flashing oversold signals.
- Indicators on the hourly chart also stand deep in the red zone.
- Moreover, a bearish SMA crossover further emphasizes the depth of the bearish outlook.
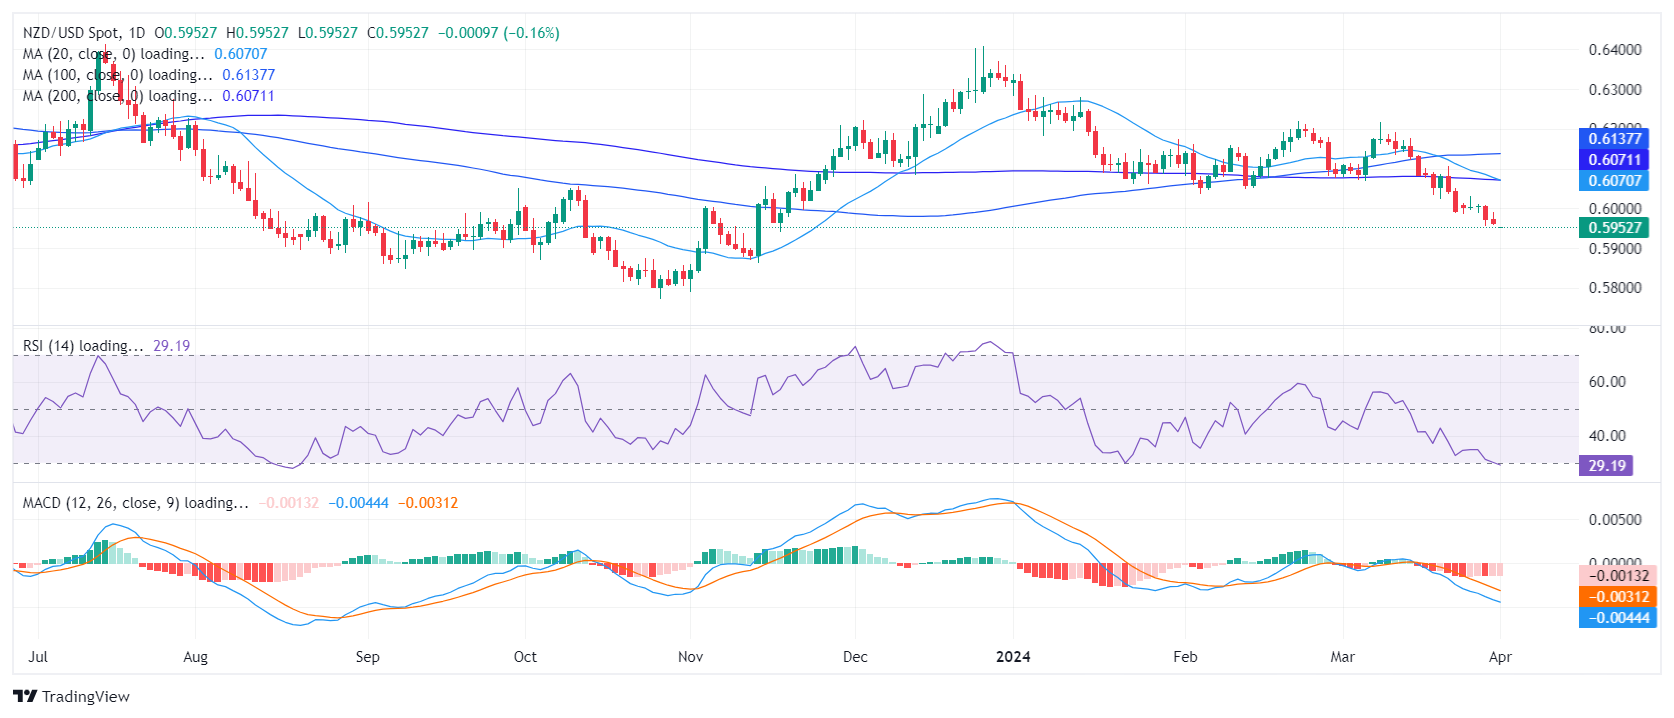
The NZD/USD pair is currently trading at 0.5950, showing a 0.50% decrease in the session. Sellers maintain control as the broader outlook remains bearish. However, some signs of a mild bullish reversal are emerging.
On the daily chart, the Relative Strength Index (RSI) value reveals a continuation of the negative trend. This suggests dominant selling conditions for this pair, signaling a possible oversold market soon. Conversely, the steady red bars of the Moving Average Convergence Divergence (MACD) also support this negative momentum.
NZD/USD daily chart
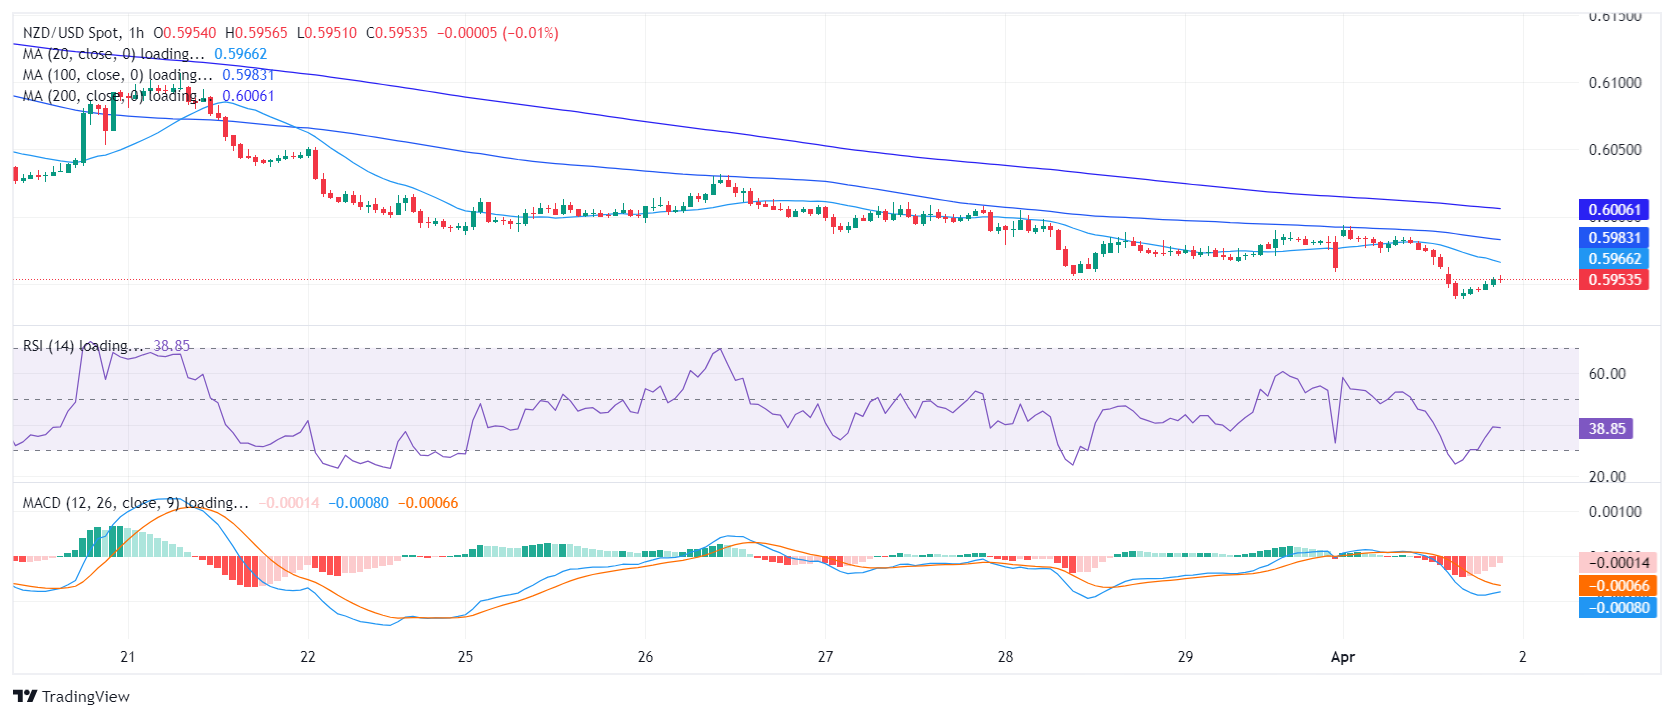
When examining the hourly chart, the RSI values largely stay within the negative zone, echoing the daily chart's sentiment. However, the most recent RSI reading at 41 shows a minor increase, which could suggest a glimmer of a short-term bullish reversal after the index fell below 30 earlier in the session. Even though the corresponding MACD bars remain red, additional upward movements could be seen ahead of the Asian session.
NZD/USD hourly chart
Upon inspecting the broader outlook, the NZD/USD is demonstrating bearish signals across all periods examined. In addition, the pair’s position below the 20, 100-day, and 200-day Simple Moving Averages (SMAs), implies a forecast of negative momentum in the short term. This downward trend is further confirmed by the potential bearish SMA crossover of 20 and 200-day SMAs at 0.6070. However, as the daily indicators enter oversold conditions, a corrective bullish reversal shouldn’t be taken off the table.
- USD/JPY is modestly up, reflecting a cautious market amidst higher US Treasury yields and potential for Japanese intervention.
- Technical indicators suggest resistance at 152.00, with further targets at 153.00 and 155.00 should the major break higher.
- A move below the Tenkan-Sen could see USD/JPY testing support levels down to 148.93, amid ongoing market vigilance.
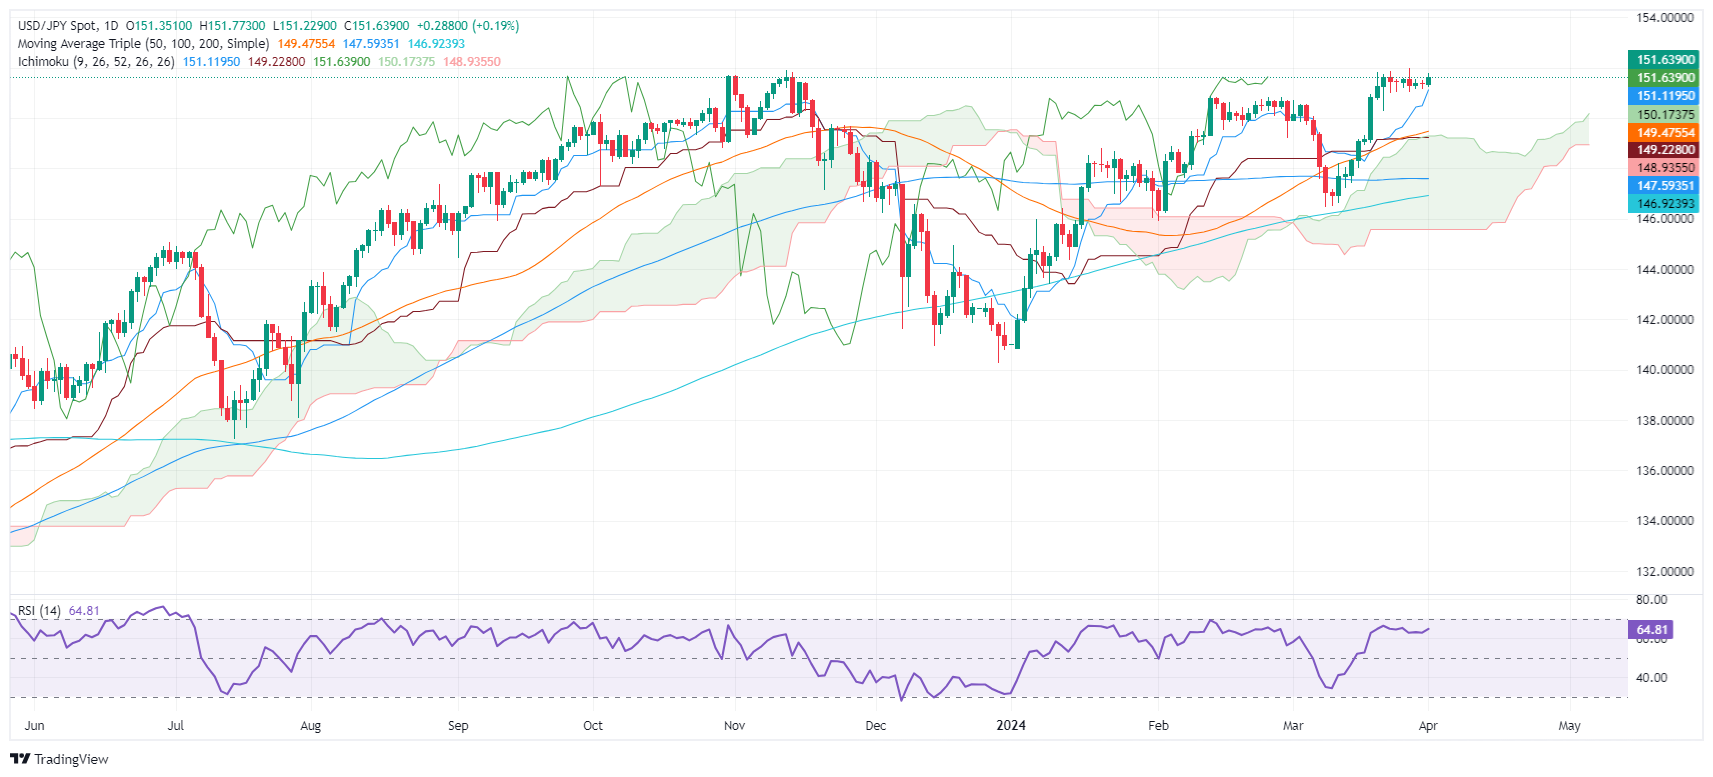
The USD/JPY remains subdued amid speculation of possible intervention by Japanese authorities. Although US Treasury yields pushed higher during Monday’s session, with the 10-year benchmark note rate rising 11 basis points, the pair stood shy of the day’s high of 151.77. At the time of writing, the major trades at 151.63, up 0.15%.
USD/JPY Price Analysis: Technical outlook
The USD/JPY daily chart depicts the pair consolidating around the 151.00/152.00 region, with intervention threats strengthening the 152.00 mark as a first resistance level. A breach of the latter will expose the 153.00 psychological figure, ahead of 155.00.
On the other hand, if the USD/JPY pulls back below the Tenkan-Sen at 151.12, that would send the pair sliding to the Senkou Span A at 150.17, followed by the Kijun-Sen at 149.22. Further downside is seen at the Senkou Span B at 148.93.
USD/JPY Price Action – Daily Chart\
- Gold price experiences slight gains in a market bolstered by positive US manufacturing activity reports.
- Surge in US Treasury yields following optimistic ISM and S&P Global reports challenges the appeal of non-yielding Gold.
- A stronger US Dollar Index curtails Gold's upward trajectory as market participants trim their bets on Fed rate cuts.
Gold price climbed on Monday, but it remained below the all-time high of $2,265. The bright metal is losing some momentum, yet it remains up 0.30% on the day. At the time of writing, XAU/USD exchanges hands at $2,240 after hitting a daily low of $2,228.
Business activity in the United States (US) picked up in March, according to the Institute for Supply Management’s (ISM) Manufacturing Purchasing Managers Index (PMI) and to S&P Global. The former exceeded estimates and crushed February’s data, while the latter cooled but stood in expansionary territory. This data along with a robust economic outlook in the US could dent the Federal Reserve (Fed) from cutting interest rates.
The ISM Manufacturing PMI expanded for the first time since September 2022. That pushed US Treasury bond yields higher, a headwind for the non-yielding metal. Investors were prompted to take profits in the yellow metal in exchange for US treasuries, which tend to be more appealing amid expectations for higher interest rates.
The US Dollar Index (DXY), which measures the American currency’s value against six others, stood at 104.99 and gained 0.44%, limiting the XAU/USD advance.
Daily digest market movers: Gold stays afloat but off all-time highs
- On Friday, Fed Chair Jerome Powell responded to the latest inflation data, stating it aligned with their expectations and indicating that the Fed would not overreact to these figures. This suggests that the US central bank would remain in a wait-and-see approach toward future monetary policy decisions.
- Following Friday’s report of the Fed’s preferred inflation gauge, the Personal Consumption Expenditures (PCE), a softer reading, sent Gold prices rallying sharply, though it retreated on Powell’s words.
- The ISM Manufacturing PMI expanded by 50.3, above estimates of 48.4, crushing February’s 47.8 reading. The Prices Paid Index increased by 55.8, its highest level since August 2022, when it hit 52.5.
- S&P Global revealed the latest revision of March’s Manufacturing PMI for the United States, which came in at 51.9, up from the previous reading of 52.2.
- After the data release, market participants diminished their bets for a 25-basis-point rate cut in June to 58% from above 60% last Friday.
Technical analysis: Gold rally appears overextended but is set to continue
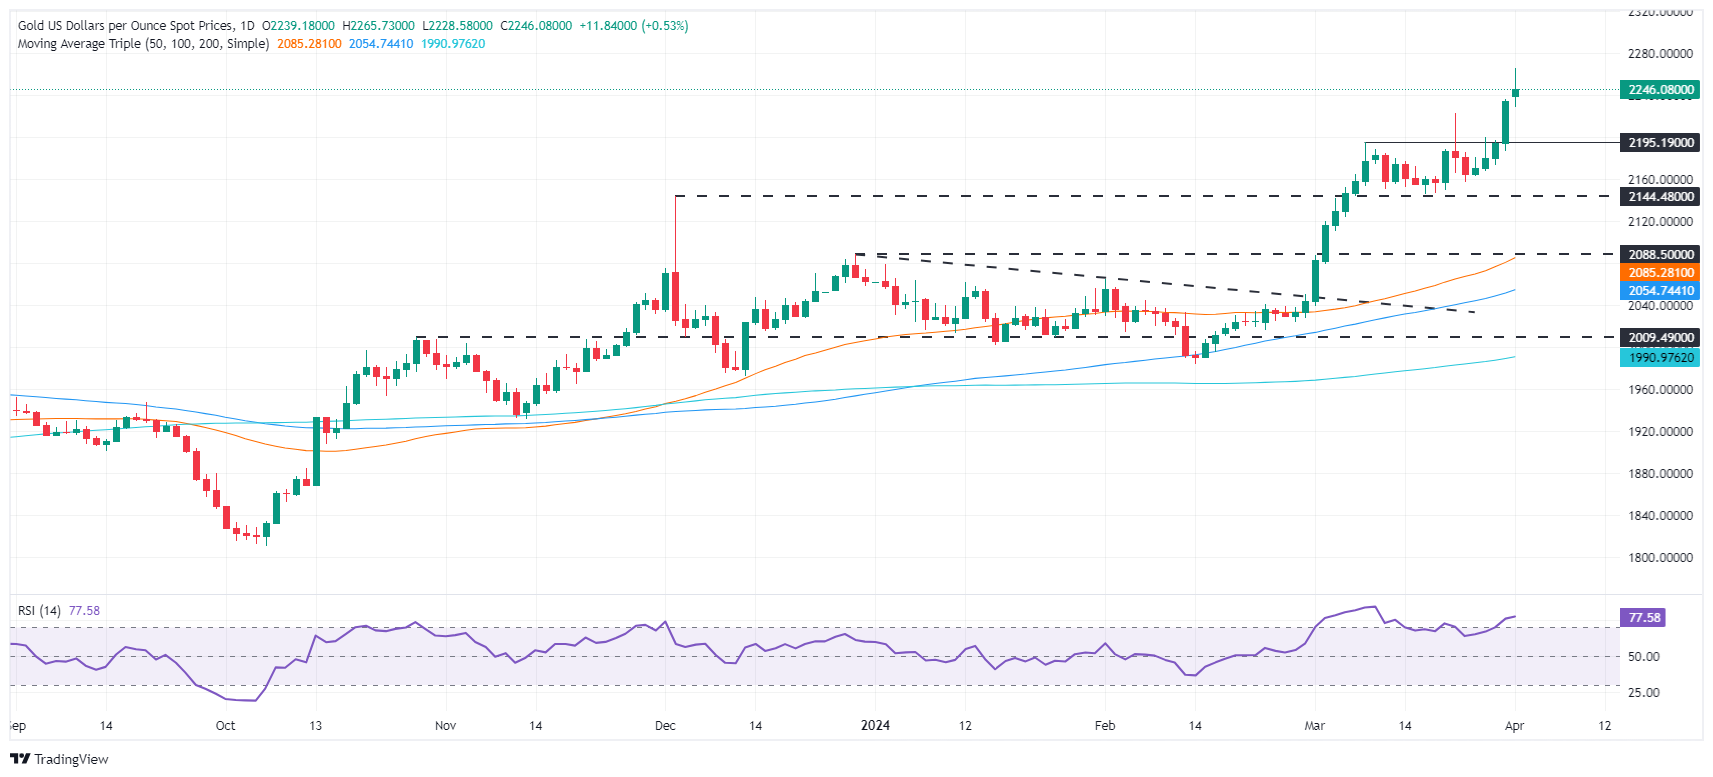
The XAU/USD daily chart depicts Gold's last uptick to new all-time highs, achieved on lower momentum, as depicted by the Relative Strength Index (RSI). As Gold reached the ATH, the RSI stood at 77.21, below its highest level reached on March 11 at 84.41, suggesting a negative divergence is forming.
Nevertheless, the scenario of a mean reversion move is riskier. Still, a break below $2,200 could sponsor a pullback toward the March 8 high turned support at $2,195, ahead of extending its losses to $2,150.
Look for a break above $2,270 for a bullish resumption, which would expose $2,300.
Gold FAQs
Gold has played a key role in human’s history as it has been widely used as a store of value and medium of exchange. Currently, apart from its shine and usage for jewelry, the precious metal is widely seen as a safe-haven asset, meaning that it is considered a good investment during turbulent times. Gold is also widely seen as a hedge against inflation and against depreciating currencies as it doesn’t rely on any specific issuer or government.
Central banks are the biggest Gold holders. In their aim to support their currencies in turbulent times, central banks tend to diversify their reserves and buy Gold to improve the perceived strength of the economy and the currency. High Gold reserves can be a source of trust for a country’s solvency. Central banks added 1,136 tonnes of Gold worth around $70 billion to their reserves in 2022, according to data from the World Gold Council. This is the highest yearly purchase since records began. Central banks from emerging economies such as China, India and Turkey are quickly increasing their Gold reserves.
Gold has an inverse correlation with the US Dollar and US Treasuries, which are both major reserve and safe-haven assets. When the Dollar depreciates, Gold tends to rise, enabling investors and central banks to diversify their assets in turbulent times. Gold is also inversely correlated with risk assets. A rally in the stock market tends to weaken Gold price, while sell-offs in riskier markets tend to favor the precious metal.
The price can move due to a wide range of factors. Geopolitical instability or fears of a deep recession can quickly make Gold price escalate due to its safe-haven status. As a yield-less asset, Gold tends to rise with lower interest rates, while higher cost of money usually weighs down on the yellow metal. Still, most moves depend on how the US Dollar (USD) behaves as the asset is priced in dollars (XAU/USD). A strong Dollar tends to keep the price of Gold controlled, whereas a weaker Dollar is likely to push Gold prices up.
- Significant selling momentum is revealed in the daily chart as the RSI slips into negative zones while MACD signifies growing negative traction.
- In line with the daily chart, the hourly indicators show mounting selling pressure.
- The recent dip beneath the 20-day SMA may suggest a possible short-term bearish realignment.
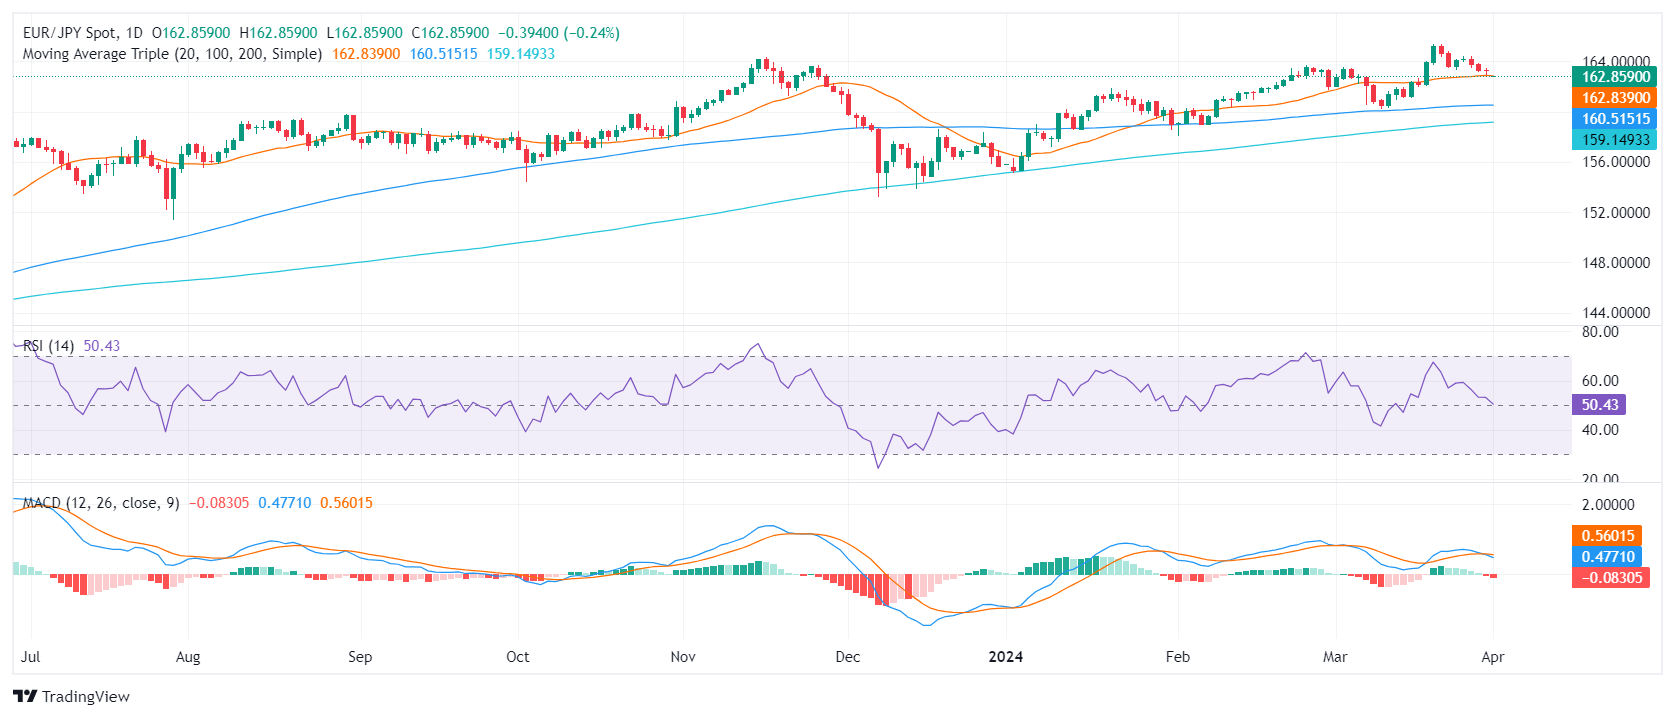
The EUR/JPY pair is currently trading around 162.85, representing a decline of 0.30% during Monday's session. Bearish cues are intensifying as seen in the increase in selling momentum, which signals a possible shift from the preceding bullish trend.
On the daily chart for EUR/JPY, the most recent Relative Strength Index (RSI) reading fell near negative territory. This situation tends to indicate a growing selling momentum. Concurrently, the Moving Average Convergence Divergence (MACD) histogram showcases rising red bars, implying a surge in negative momentum.
EUR/JPY daily chart
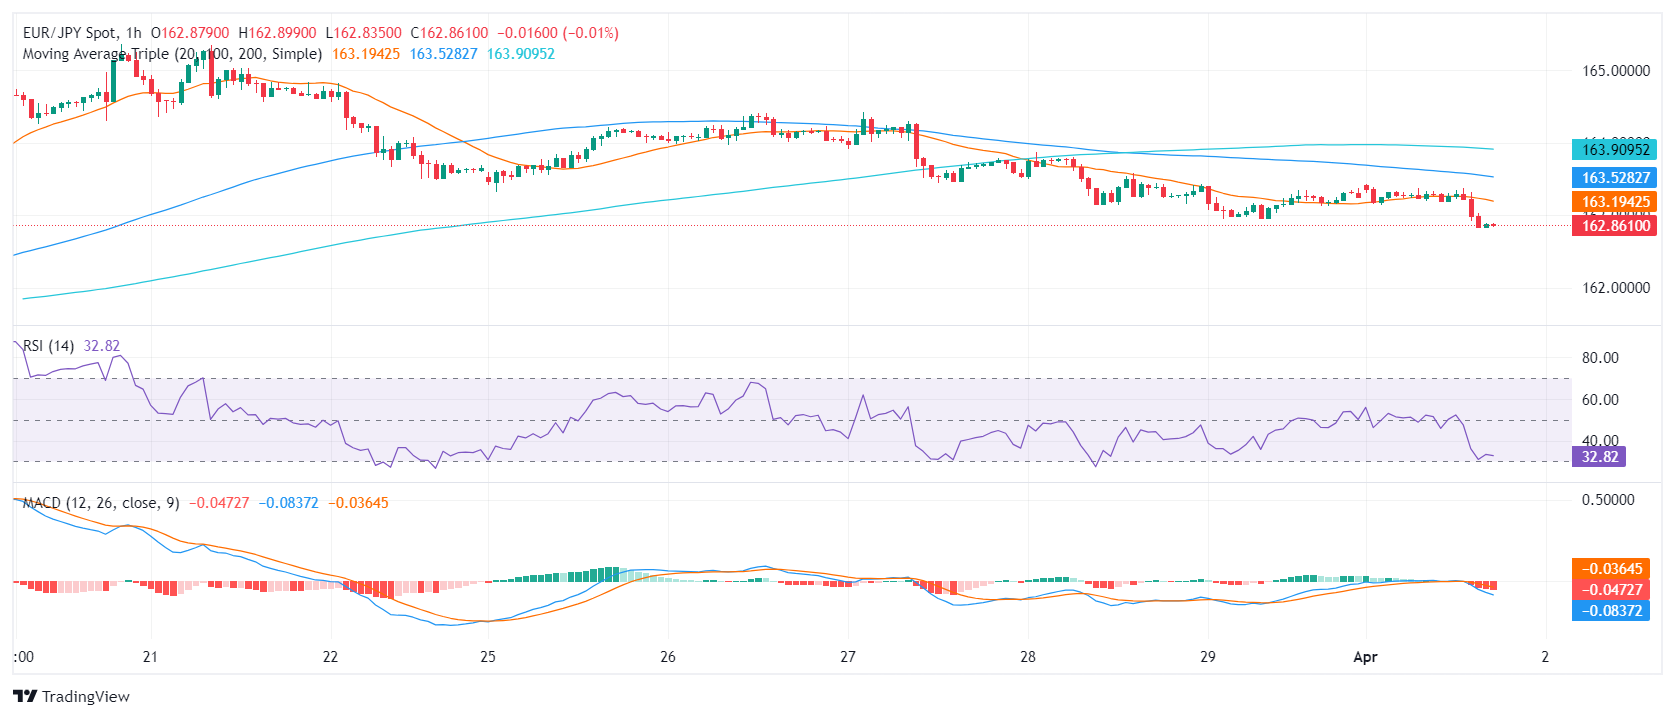
Assessing the hourly chart, the EUR/JPY pair showcases similar bearish sentiments. The RSI dipped near the oversold territory demonstrating the sellers' dominance in the market over the recent hours. Adding to this, the hourly MACD histogram reinforces this sentiment, illustrating rising red bars indicating a tilt towards negative momentum.
EUR/JPY hourly chart
Scrutinizing the broader outlook, EUR/JPY portrays a blend of bullish and bearish signals. A bullish stance manifests through its standing above the 100-day and 200-day Simple Moving Averages (SMA), revealing a positive trend for the pair in the long run. However, the cross has dipped just below the 20-day SMA today, inferring a potential bearish shift in the short term.
In summary, although the longer-term trends demonstrate a predominantly bullish stance for EUR/JPY, recent readings from both the daily and hourly charts suggest a possible shift towards a sellers' market which could fuel additional downward movements in case the buyers fail to step in.
What you need to take care of on Tuesday, April 2:
The US Dollar stands as the overall winner at the end of Monday, with some major markets remaining closed amid Easter Monday. The focus was on growth-related figures as the day started with China reporting an upbeat manufacturing output in March. The news, however, fell short of maintaining investors optimism.
Financial markets priced in Friday's news that US inflation, as measured by the Personal Consumption Expenditures (PCE) Price Index, held at 2.8% YoY in February. Following the report, Federal Reserve (Fed) Chairman Jerome Powell said the central bank is in no rush to hike rates amid still high inflation and a resilient economy.
Over the weekend, European Central Bank (ECB) officials delivered hawkish comments that also failed to boost the mood. Austrian Central Bank Governor Robert Holzmann said on Sunday that the ECB could cut interest rates before the US Fed. When the ECB would pull the trigger “will depend largely on what wage and price developments look like by June,” Holzmann added. Also, Bank of Greece Governor Yannis Stournaras put on the table several rate cuts for this year, saying it is “possible” to trim 25 basis points (bps) four times this year.
The US Dollar gathered momentum following the release of a much-better-than-anticipated United States (US) ISM Manufacturing PMI. The report showed that economic activity in the manufacturing sector expanded in March after contracting for 16 consecutive months, with the index jumping to 50.3 from 47.8 in February. At the same time, S&P Global also released the final estimate of its Manufacturing PMI, which was confirmed at 51.9, below the 52.5 expected but still with expansionary levels.
EUR/USD settled around 1.0740, not far from the February low at 1.0694. GBP/USD trades around 1.2545, while USD/CHF is comfortable above 0.9040. Commodity-linked currencies fell alongside US indexes, with AUD/USD trading around 0.6480 and USD/CAD up to 1.3580. Finally, the USD/JPY stands at 151.60.
Gold soared to $2,265 a troy ounce, a record high, before pulling back towards $2,240 mid-US afternoon.
US Dollar price today
The table below shows the percentage change of US Dollar (USD) against listed major currencies today. US Dollar was the strongest against the Pound Sterling.
| USD | EUR | GBP | CAD | AUD | JPY | NZD | CHF | |
| USD | 0.48% | 0.72% | 0.43% | 0.72% | 0.17% | 0.61% | 0.31% | |
| EUR | -0.48% | 0.24% | -0.04% | 0.25% | -0.31% | 0.12% | -0.17% | |
| GBP | -0.73% | -0.25% | -0.29% | 0.01% | -0.57% | -0.12% | -0.42% | |
| CAD | -0.43% | 0.03% | 0.27% | 0.29% | -0.27% | 0.16% | -0.13% | |
| AUD | -0.73% | -0.25% | -0.01% | -0.30% | -0.56% | -0.13% | -0.42% | |
| JPY | -0.17% | 0.33% | 0.55% | 0.29% | 0.59% | 0.45% | 0.14% | |
| NZD | -0.61% | -0.13% | 0.11% | -0.16% | 0.12% | -0.45% | -0.31% | |
| CHF | -0.31% | 0.18% | 0.42% | 0.13% | 0.42% | -0.14% | 0.31% |
The heat map shows percentage changes of major currencies against each other. The base currency is picked from the left column, while the quote currency is picked from the top row. For example, if you pick the Euro from the left column and move along the horizontal line to the Japanese Yen, the percentage change displayed in the box will represent EUR (base)/JPY (quote).
- GBP/USD declines as strong US manufacturing activity and pricing pressures fuel speculation of a persistent Fed policy.
- The resilience of the US economy, evidenced by ISM data, contrasts with quiet European markets due to holiday closures.
- Upcoming UK PMI data releases could weigh the GBP/USD as market participants expect further deterioration.
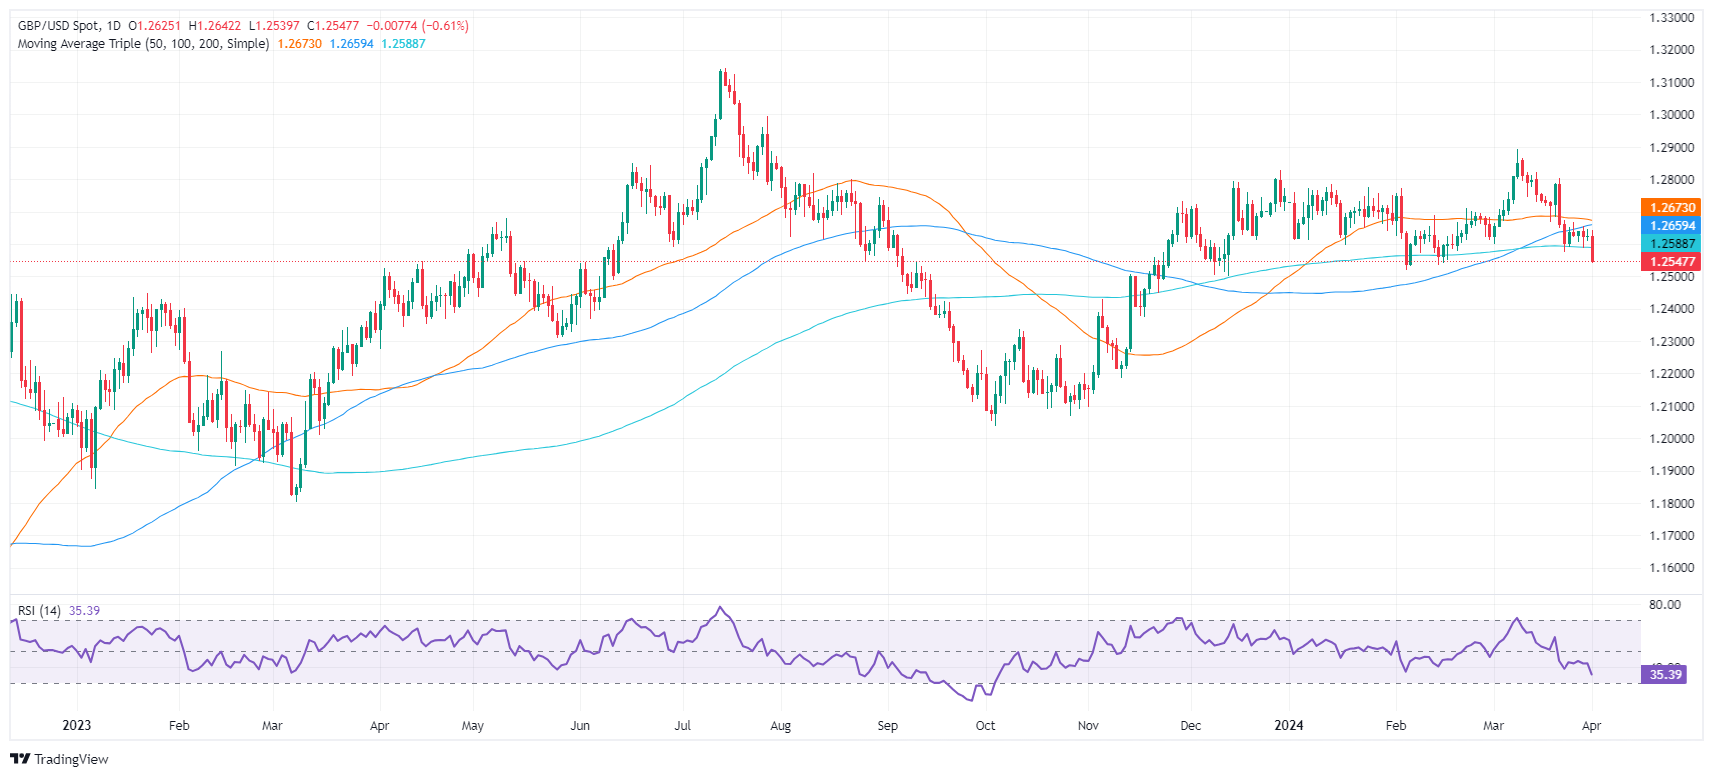
The Pound Sterling slumps in the mid-North American session, as robust US economic data could dent the Federal Reserve’s intentions to cut rates. That underpinned the Greenback while US Treasury yields skyrocketed, a headwind for Cable. The GBP/USD trades at 1.2587, down 0.57%.
Pound Sterling treads water amid strong US Dollar and higher US yields.
A holiday in Europe keeps the financial markets closed. Across the Atlantic, data from the Institute for Supply Management (ISM) revealed that business activity in the US expanded in March for the first time since September 2022, suggesting the economy's resilience. The Manufacturing Purchasing Managers' Index (PMI) reached 50.3, surpassing the consensus of 48.4 and improving upon February's 47.8. Furthermore, the report highlighted an increase in the Prices Paid Index, which was its highest point since August 2022. Given the economy's better-than-expected performance, this resurgence in pricing pressures might hinder the Federal Reserve's inclination to soften its monetary policy.
Earlier, S&P Global announced a slight adjustment to March’s Manufacturing PMI for the United States, finalizing it at 51.9 compared to the initial reading of 52.2, around 13:45 GMT.
Following the data, money market traders slashed the odds for a Federal Reserve’s rate cut in June from around 60% to 56.9%, according to data from the CME FedWatch Tool.
Last week, Fed Chair Jerome Powell commented in a speech at the San Francisco Fed that the US central bank is in no rush to cut rates. Even though last week’s Core Personal Consumption Expenditure (PCE) price index came to a touch softer, the Consumer Price Index (CPI) remains above the 3% threshold. That would keep Fed officials with their hands tied and adhere to the higher for longer mantra.
On Tuesday, the UK economic docket will feature the release of Housing Prices, the BoE Consumer Credit, and the S&P Global Manufacturing PMI.
GBP/USD Price Analysis: Technical outlook
The GBP/USD exchange rate has broken the previous dynamic support level seen at the 200-day moving average (DMA) at 1.2857, opening the door for further losses. If sellers push the exchange rate below 1.2550, the 1.2500 figure is up next. Otherwise, if the pair edges are higher than the 200-DMA, look for 1.2600 as the next supply zone, ahead of the 100-DMA at 1.2649.
- Recent ISM report signaled an uptick in US business activity, with PMIs beating expectations.
- Markets are discounting a reduced likelihood of a rate cut at the Fed's June meeting.
- Perceived hawkish bets on the Fed fueled a surge in US Treasury bond yields which weigh on non-yielding metals.
- Investors await key US labor market indicators to gain further guidance on the economy's health.
The XAG/USD pair is trading near the $24.98 level, mostly neutral during Monday's session. This comes after the signals of resilience in the US economy underscored by the recent Institute for Supply Management (ISM) report and the surprising uptick in the Manufacturing Purchasing Managers' Index (PMI). In that sense, the resilience of the US economy fueled a rise in hawkish bets on the Federal Reserve (Fed) in hand with higher US Treasury yields which made the grey metal decline.
The recent figures from the Institute for Supply Management (ISM) report have brought a breath of fresh air to perceptions of the US economy, revealing an uptick in business activity for March. This comes as a signal of economic robustness, a sentiment echoed by the Manufacturing Purchasing Managers' Index (PMI) which climbed to 50.3 in March. This figure not only surpassed the forecasted 48.4 but marked a noticeable advance from February's 47.8. Meanwhile, the ISM report's Prices Paid Index leaped to an annual high of 55.8, a level not seen since it stood at 52.5 in August 2022.
This pattern of improvement might lead the Federal Reserve (Fed) to think twice about easing its monetary policy. Market reactions were swift, with the likelihood of a rate cut at the Fed's June meeting plummeting from 85% to around 65% in response to the enduring resilience of the US economy. The bond market has also felt the ripples of these developments, with a notable surge in US Treasury bond yields, often seen as the cost of holding non-yielding metals, with the 2-year yield rising to 4.71%, while both the 5-year and the 10-year yields are at 4.33%, all pointing to a sharp uptick and possibly reflecting increased hawkish bets on the Fed.
Looking ahead, key US labor market indicators such as Nonfarm Payrolls, Average Hourly Earnings, and the Unemployment Rate are highly anticipated. These figures are poised to provide deeper insights into the current health and trajectory of the country's workforce, offering critical clues to both policymakers and investors.
XAG/USD technical analysis
On the daily chart, the Relative Strength Index (RSI) reveals a positive trend for the XAG/USD. The RSI reading, nestled in the positive territory, remains steady affirming the dominance of buyers, which may lead to continued upward momentum. However, the Moving Average Convergence Divergence (MACD) stands in negative territory, printing red bars which suggests that there is a mild bearish presence.
When scrutinizing the overall trend, the XAG/USD currently sits above the 20-day, 100-day, and 200-day Simple Moving Averages (SMA), denoting strong upward momentum over the larger time frames.
- Mexican Peso drops as a reflection of investor reaction to upbeat US manufacturing figures and a surge in Treasury yields.
- Mexico's manufacturing sector shows stability, but stronger US economic outlook overshadows domestic positive data.
- Despite interest rate differential favoring Mexican Peso, hints emerge of possible Banxico rate cuts.
The Mexican Peso begins the week on a lower note versus the US Dollar, tumbling 0.57% after strong economic data from the United States (US) that could prevent the Federal Reserve (Fed) from cutting borrowing costs. That and a softer manufacturing activity report in Mexico kept the Greenback bid against the emerging market currency. The USD/MXN trades at 16.65, up 0.62%.
Mexico’s S&P Global Manufacturing PMI came at 52.2, virtually unchanged from 52.3 in February. Pollyanna de Lima, economic associate director at S&P Global, said, “Mexico's manufacturing sector expanded further in March, underpinned by a solid rise in domestic new orders as pending contracts continued to get the green light. This buoyant client appetite had positive impacts on factory production, buying levels and employment.”
Across the border, the Institute for Supply Management (ISM) revealed that manufacturing activity expanded for the first time in the US since September 2022, while an index of prices paid surprisingly jumped to levels last seen in August 2022.
The data sent US Treasury yields skyrocketing, while the US Dollar Index (DXY) soars above 105.00 and gains 0.49%. Upbeat data weighs on the Mexican currency, which has been appreciating by the wide interest rate differential between Mexico and the US.
Daily digest market movers: Mexican Peso treads water after strong US manufacturing activity figures
- Last Monday, Banxico Governor Victoria Rodriguez Ceja remained dovish despite acknowledging that the battle against inflation hasn’t been won. She added, “When macroeconomic conditions and the inflationary outlook allow us to make additional adjustments to the reference rate to the one we already have, I consider that they would be gradual.”
- A weaker Mexican Manufacturing PMI, along with the Indicator of General Economic Activity contracting in January, could open the door for further easing by Banxico. The latest meeting minutes will be released on April 4.
- The ISM Manufacturing PMI expanded by 50.3, above forecasts of 48.4, smashing February’s 47.8 reading. The Prices Paid Index expanded to 55.8, its highest level since August 2022, when it hit 52.5.
- S&P Global revealed the latest revision of March’s Manufacturing PMI for the United States, which came in at 51.9, up from the previous reading of 52.2.
- Last week, the Core Personal Consumption Expenditure (PCE) price index, the Fed’s favored gauge for inflation, cooled as expected.
- Chair Powell said at San Francisco Fed: “The fact that the US economy is growing at such a solid pace, the fact that the labor market is still very, very strong, gives us the chance to just be a little more confident about inflation coming down before we take the important step of cutting rates.”
Technical analysis: Mexican Peso at risk of shifting neutral as USD/MXN hovers around 16.65
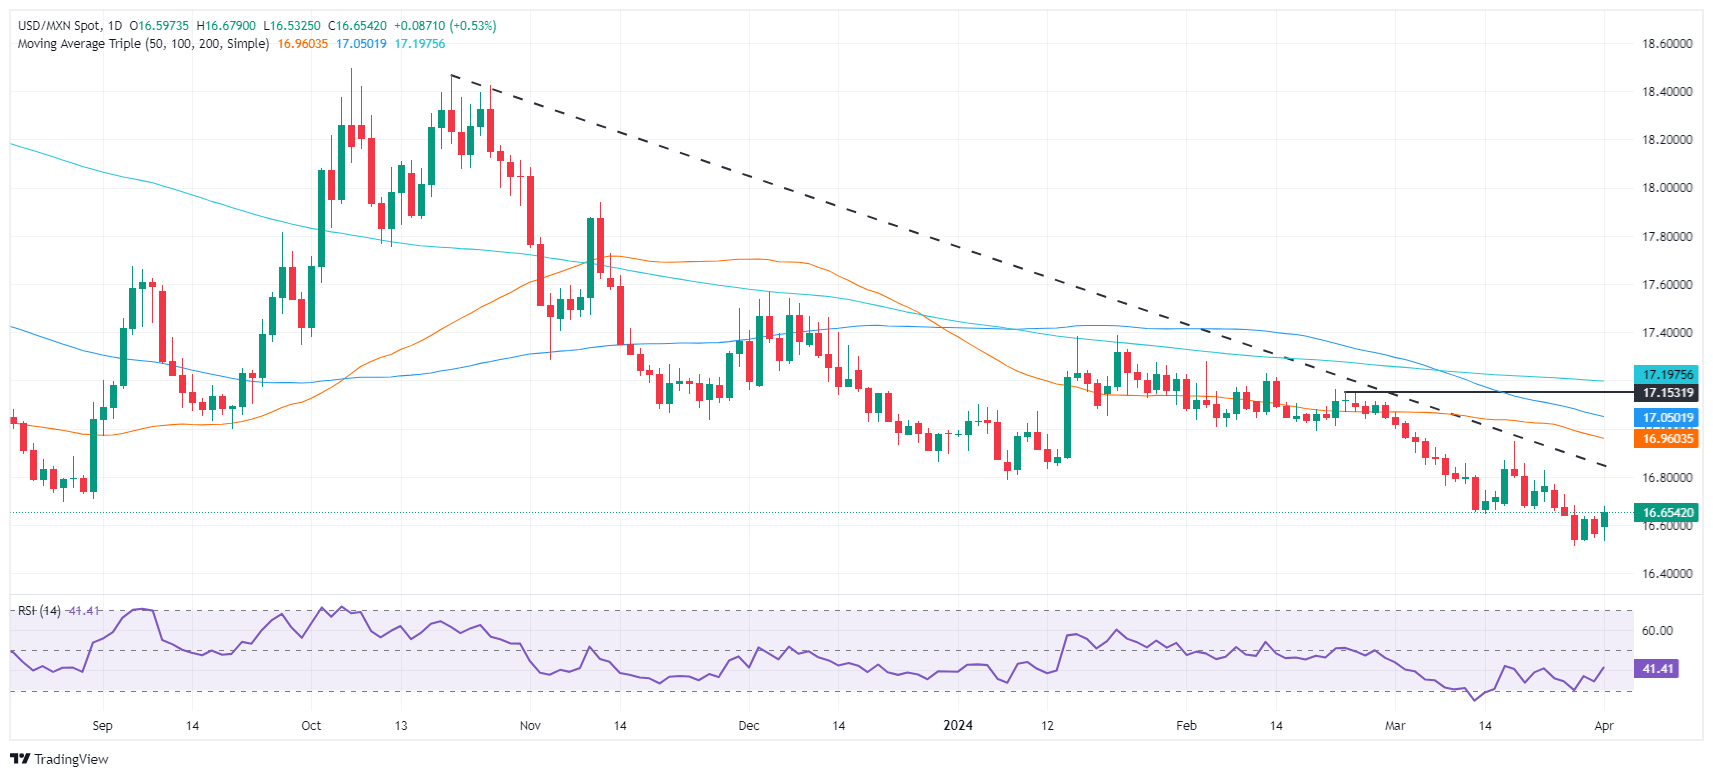
The USD/MXN daily chart depicts that buyers lifted the exchange rate to a new four-day high of 16.67. Yet they still need to achieve a daily close above last year’s low of 16.62 before moving to test the 50-day Simple Moving Average (SMA) at 16.95. Further upside is seen at the 100-day SMA at 17.05, ahead of the 200-day SMA at 17.19.
On the flip side, the USD/MXN might extend its losses if it remains below 16.62. A breach of the current year-to-date (YTD) low of 16.51 can pave the way toward the October 2015 swing low of 16.32.
Mexican Peso FAQs
The Mexican Peso (MXN) is the most traded currency among its Latin American peers. Its value is broadly determined by the performance of the Mexican economy, the country’s central bank’s policy, the amount of foreign investment in the country and even the levels of remittances sent by Mexicans who live abroad, particularly in the United States. Geopolitical trends can also move MXN: for example, the process of nearshoring – or the decision by some firms to relocate manufacturing capacity and supply chains closer to their home countries – is also seen as a catalyst for the Mexican currency as the country is considered a key manufacturing hub in the American continent. Another catalyst for MXN is Oil prices as Mexico is a key exporter of the commodity.
The main objective of Mexico’s central bank, also known as Banxico, is to maintain inflation at low and stable levels (at or close to its target of 3%, the midpoint in a tolerance band of between 2% and 4%). To this end, the bank sets an appropriate level of interest rates. When inflation is too high, Banxico will attempt to tame it by raising interest rates, making it more expensive for households and businesses to borrow money, thus cooling demand and the overall economy. Higher interest rates are generally positive for the Mexican Peso (MXN) as they lead to higher yields, making the country a more attractive place for investors. On the contrary, lower interest rates tend to weaken MXN.
Macroeconomic data releases are key to assess the state of the economy and can have an impact on the Mexican Peso (MXN) valuation. A strong Mexican economy, based on high economic growth, low unemployment and high confidence is good for MXN. Not only does it attract more foreign investment but it may encourage the Bank of Mexico (Banxico) to increase interest rates, particularly if this strength comes together with elevated inflation. However, if economic data is weak, MXN is likely to depreciate.
As an emerging-market currency, the Mexican Peso (MXN) tends to strive during risk-on periods, or when investors perceive that broader market risks are low and thus are eager to engage with investments that carry a higher risk. Conversely, MXN tends to weaken at times of market turbulence or economic uncertainty as investors tend to sell higher-risk assets and flee to the more-stable safe havens.
- The Aussie extends losses against a stronger USD as US data beats expectations.
- The US manufacturing sector expands with the prices sub index at recent highs.
- AUD/USD is testing support at 0.6480 with the key area at 0.6440 on focus.
The Australian Dollar resumed its bearish trend on Monday, weighed by US Dollar’s strength following better-than-expected US manufacturing data.
The US ISM Manufacturing PMI improved to 50.03 in March, returning to expansion levels after more than one year, and beating market expectations of a milder improvement to 48.2. beyond that, the Prices Paid subindex has accelerated at its fastest pace in almost two years, posing upside pressures to inflation.
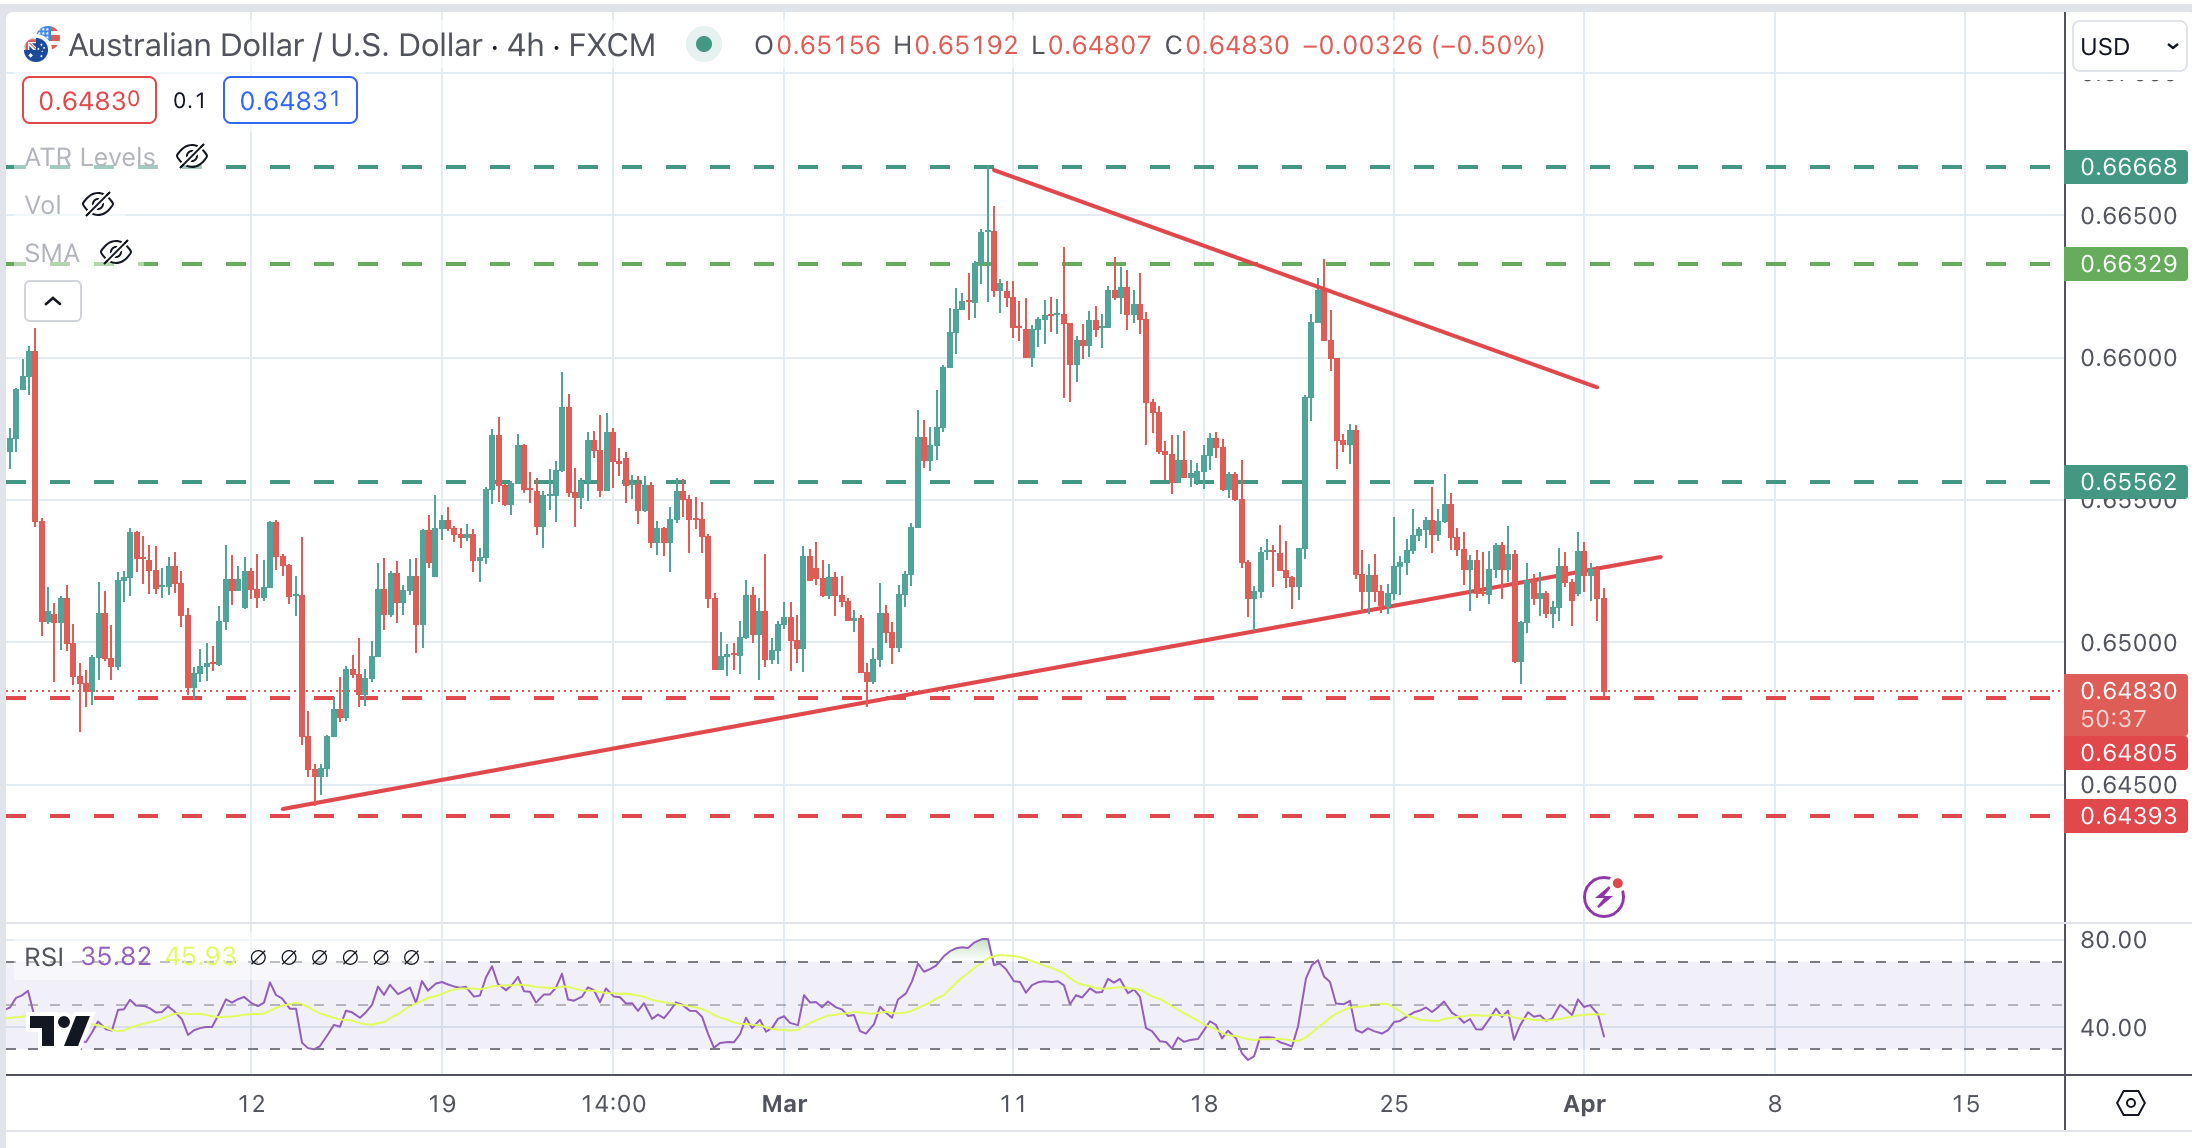
AUD/USD Technical analysis
The Australian Dollar is under growing bearish pressure after having breached the bottom of a triangle pattern, at 0.6530. This level capped recovery attempts on Thursday and Friday, and bears have taken control on Monday.
The pair is now testing support at 0.6480, which closes the path to the big target, at 0.6440. To the upside, the mentioned reverse trendline, at 0.6530 is the immediate resistance before 0.6555.
AUD/USD 4-Hour Chart
- DXY Index stands positively at 104.95, reflecting a noticeable gain for the day.
- Investors focus on incoming data amidst speculation of an easing cycle commencing in June.
- ISM PMI readings from March beat expectations.
- Markets await Nonfarm Payrolls, Average Hourly Earnings, and Unemployment Rate from March to gauge insights into the economy's health.
The US Dollar Index (DXY) trades at 104.95 on Monday morning, reflecting some gains. The strong ISM business activity report from March, showing the highest growth since September 2022, could discourage the Federal Reserve (Fed) from rushing to the start of the easing cycle. Labor market data to be released later this week will shape expectations.
The US economy appears steady with the Fed’s stance treading a cautious path. Despite upward revisions in inflation projections, the Fed, under Powell's guidance, refrains from overreacting to short-term spikes in inflation. The speculated start of an easing cycle in June remains dependent on incoming data.
Daily digest market movers: DXY buoyed by robust business activity, hawkish Fed bets
- Institute for Supply Management (ISM) report shows business activity for March improved for the first time since September 2022, indicating a robust economy.
- Manufacturing Purchasing Managers Index (PMI) hit 50.3 in March, surpassing projected figures of 48.4 and appreciably exceeding February's reading of 47.8.
- ISM report's Prices Paid Index rose to its highest level of 55.8 YoY since 52.5 in August 2022.
- An improving economy might discourage the Fed from relaxing its monetary policy.
- As a reaction to ongoing US economic resilience, the odds for a rate cut in June's meeting dropped from 85% to around 65%.
- In the bond market, US Treasury bond yields surged. The 2-year yield is at 4.71%, the 5-year yield at 4.33%, and the 10-year yield at 4.33%, all showing sharp increases and reflecting a boost in hawkish bets.
- Pertinent US labor market data such as Average Hourly Earnings, Nonfarm Payrolls, and the Unemployment Rate will provide a vital understanding of the health and trends of the country's workforce.
DXY technical analysis: DXY bears recede, bulls gain control
The technical indicators on the daily chart reflect an increasing buying momentum for DXY. The Relative Strength Index (RSI) is in positive territory and exhibits a positive slope, which is generally known as a bullish signal. Furthermore, the Moving Average Convergence Divergence (MACD) indicators display rising green bars, amplifying the emphasis on bullish momentum.
Additionally, the index position above the 20, 100, and 200-day Simple Moving Averages (SMAs) adds arguments for a positive technical outlook for the USD.
US Dollar FAQs
The US Dollar (USD) is the official currency of the United States of America, and the ‘de facto’ currency of a significant number of other countries where it is found in circulation alongside local notes. It is the most heavily traded currency in the world, accounting for over 88% of all global foreign exchange turnover, or an average of $6.6 trillion in transactions per day, according to data from 2022. Following the second world war, the USD took over from the British Pound as the world’s reserve currency. For most of its history, the US Dollar was backed by Gold, until the Bretton Woods Agreement in 1971 when the Gold Standard went away.
The most important single factor impacting on the value of the US Dollar is monetary policy, which is shaped by the Federal Reserve (Fed). The Fed has two mandates: to achieve price stability (control inflation) and foster full employment. Its primary tool to achieve these two goals is by adjusting interest rates. When prices are rising too quickly and inflation is above the Fed’s 2% target, the Fed will raise rates, which helps the USD value. When inflation falls below 2% or the Unemployment Rate is too high, the Fed may lower interest rates, which weighs on the Greenback.
In extreme situations, the Federal Reserve can also print more Dollars and enact quantitative easing (QE). QE is the process by which the Fed substantially increases the flow of credit in a stuck financial system. It is a non-standard policy measure used when credit has dried up because banks will not lend to each other (out of the fear of counterparty default). It is a last resort when simply lowering interest rates is unlikely to achieve the necessary result. It was the Fed’s weapon of choice to combat the credit crunch that occurred during the Great Financial Crisis in 2008. It involves the Fed printing more Dollars and using them to buy US government bonds predominantly from financial institutions. QE usually leads to a weaker US Dollar.
Quantitative tightening (QT) is the reverse process whereby the Federal Reserve stops buying bonds from financial institutions and does not reinvest the principal from the bonds it holds maturing in new purchases. It is usually positive for the US Dollar.
- Dow Jones corrects lower following strong US manufacturing activity data.
- Real Estate and Health sectors are leading losses, while Communication Services and Energy advance.
- DJIA corrects lower after rejection at the 40,000 psychological level.
The Dow Jones Industrial Average (DJIA) is going through a significant pullback on Monday. The positive surprise in the US ISM Manufacturing PMI Index confirms strong US economic momentum and pours cold water on the US Federal Reserve’s (Fed) easing expectations.
The US manufacturing sector’s activity expanded again after more than one year of contraction. The headline PMI rose to 50.3 from 47.8 in March, beating expectations of a milder increase to 48.4. Beyond that, the Prices Paid sub-index surged to 55.8, its highest reading since July 2022 and a positive contribution to inflationary trends.
These figures will likely back Fed hawks’ view that there is no rush to start lowering borrowing costs. This week we have a string of Fed speakers and key employment figures to provide more clues about the central bank’s plans.
Dow Jones news
The Dow Jones Index dropped 0.56% during the Monday morning session, with most sectors in the red. The Real Estate and Health sectors are the biggest losers, dropping 1.29% and 1.16% each. On the positive side, Communication Services picked up 1%, and the Energy sector advanced 0.32%.
Home Depot (HD) shares are leading the decline with a 2.32% drop to $374.69, followed by Nike (NKE), down 2.16% to $91.97. Boeing (BA) continued bleeding with the company under a major crisis that has led to the replacement of the board. The planemaker loses 1.59% to $189.92.
On the positive side, 3M (MMM) outperformed the rest of the companies in the Index with a 3.63% jump to $91.90, followed by Microsoft (MSFT), up 0.7% to $423.82.
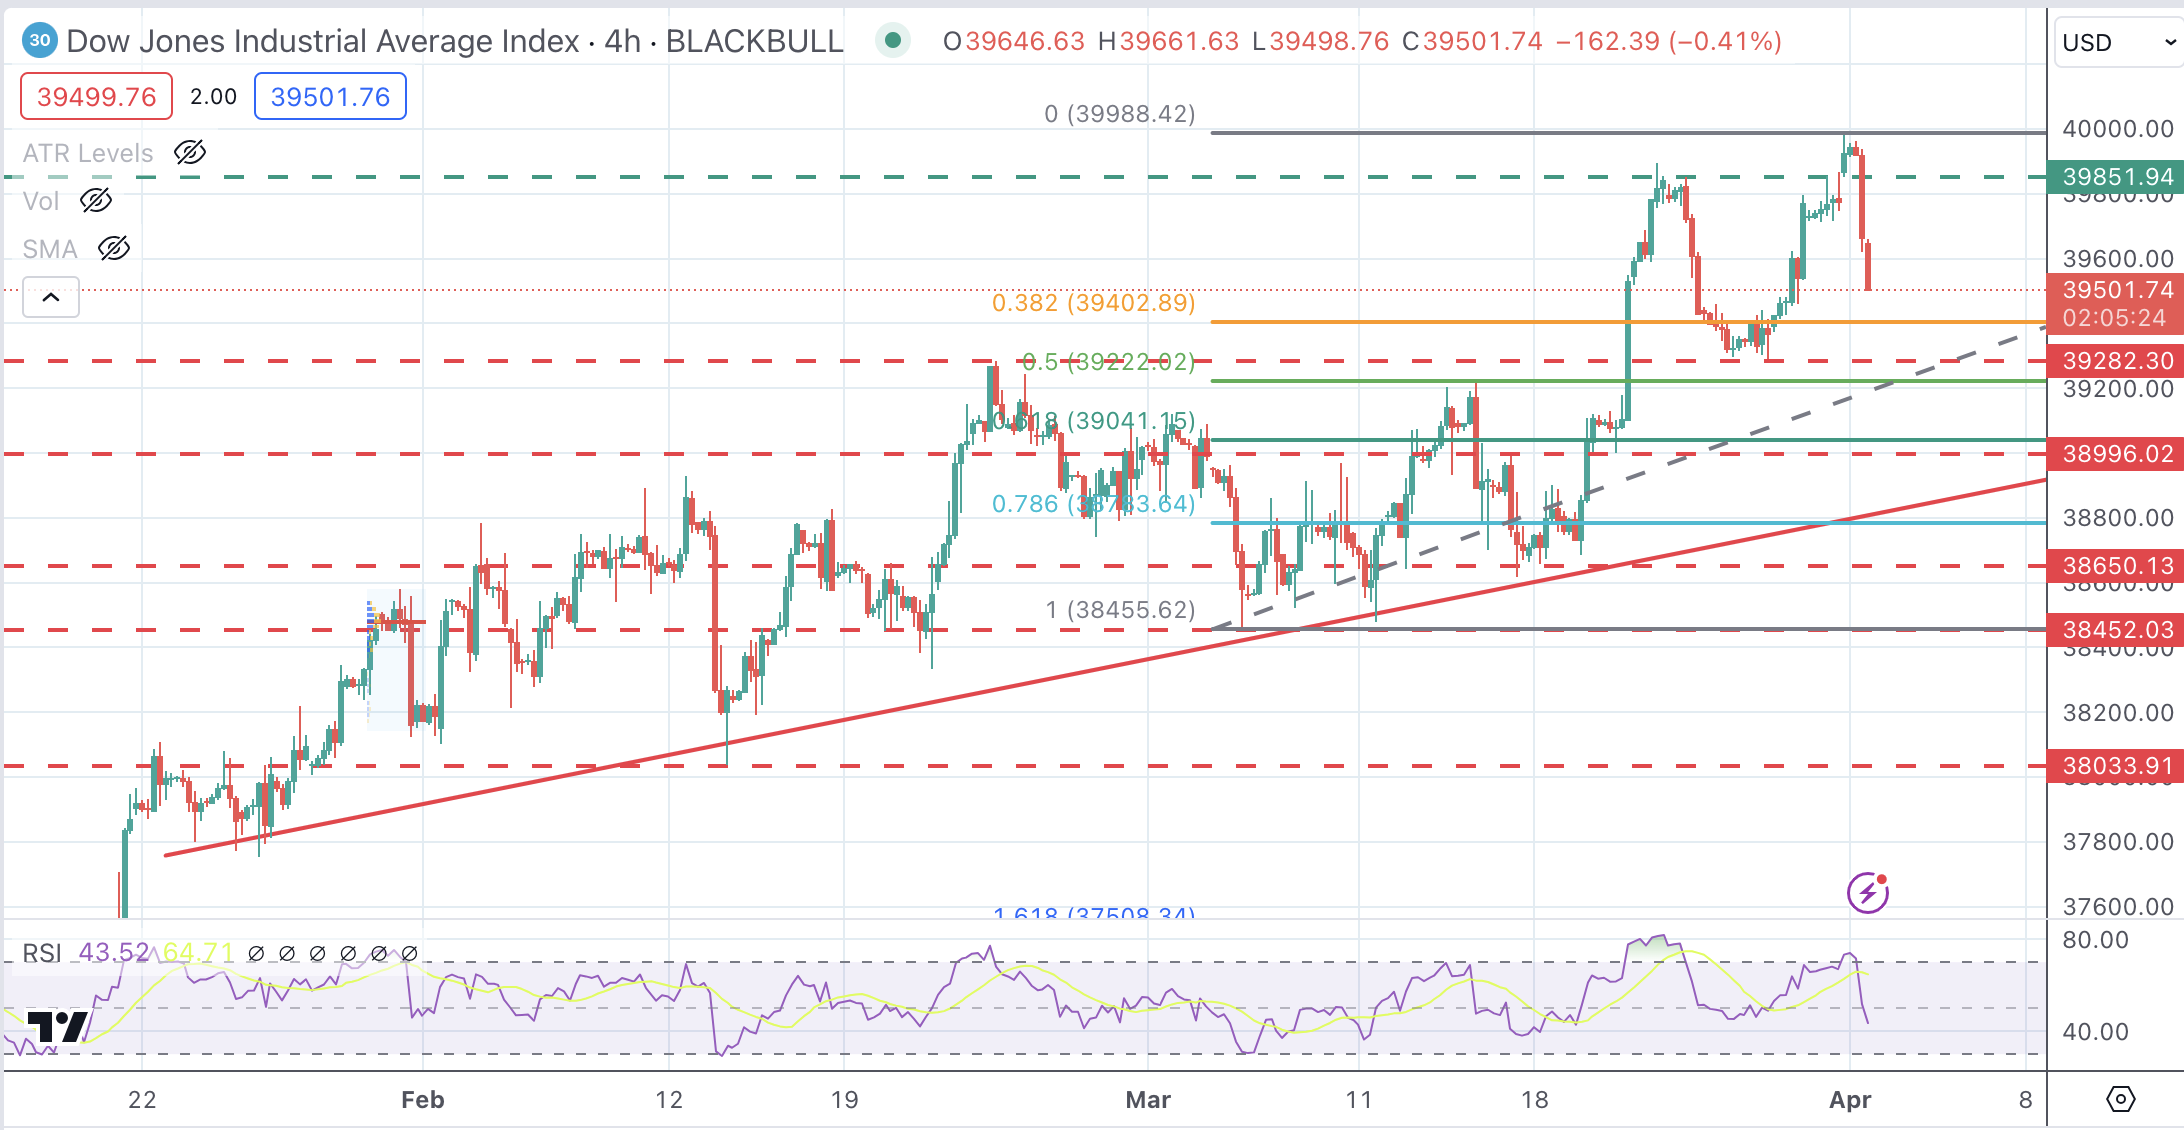
Dow Jones technical outlook
The Dow Jones Index is going through a significant downward correction on Monday, giving away half of the ground taken last week. The overall trend remains bullish, but the pullback from all-time highs gives bears hopes of testing support at the previous resistance level of 39,240.
DJIA remains bullish, standing comfortably above previous highs and the 4-hour 50 Simple Moving Average (SMA) at 39,250. Below here, the next downside targets lie at the 39,000 level and the trendline support at 38,775.
Further down, the trendline resistance from late January lows at 38,850 would be next.
On the upside, the resistance area between 39,850 and the 40,000 psychological levels seems a tough nut to crack for bulls.
DJIA 4-Hour Chart
Dow Jones FAQs
The Dow Jones Industrial Average, one of the oldest stock market indices in the world, is compiled of the 30 most traded stocks in the US. The index is price-weighted rather than weighted by capitalization. It is calculated by summing the prices of the constituent stocks and dividing them by a factor, currently 0.152. The index was founded by Charles Dow, who also founded the Wall Street Journal. In later years it has been criticized for not being broadly representative enough because it only tracks 30 conglomerates, unlike broader indices such as the S&P 500.
Many different factors drive the Dow Jones Industrial Average (DJIA). The aggregate performance of the component companies revealed in quarterly company earnings reports is the main one. US and global macroeconomic data also contributes as it impacts on investor sentiment. The level of interest rates, set by the Federal Reserve (Fed), also influences the DJIA as it affects the cost of credit, on which many corporations are heavily reliant. Therefore, inflation can be a major driver as well as other metrics which impact the Fed decisions.
Dow Theory is a method for identifying the primary trend of the stock market developed by Charles Dow. A key step is to compare the direction of the Dow Jones Industrial Average (DJIA) and the Dow Jones Transportation Average (DJTA) and only follow trends where both are moving in the same direction. Volume is a confirmatory criteria. The theory uses elements of peak and trough analysis. Dow’s theory posits three trend phases: accumulation, when smart money starts buying or selling; public participation, when the wider public joins in; and distribution, when the smart money exits.
There are a number of ways to trade the DJIA. One is to use ETFs which allow investors to trade the DJIA as a single security, rather than having to buy shares in all 30 constituent companies. A leading example is the SPDR Dow Jones Industrial Average ETF (DIA). DJIA futures contracts enable traders to speculate on the future value of the index and Options provide the right, but not the obligation, to buy or sell the index at a predetermined price in the future. Mutual funds enable investors to buy a share of a diversified portfolio of DJIA stocks thus providing exposure to the overall index.
- Canadian Dollar is losing momentum with strong US macroeconomic data boosting Greenback.
- Canadian S&P Manufacturing PMI fails to support Loonie.
- Oil prices have stalled near year-to-date highs, which adds negative pressure on CAD.
The Canadian Dollar (CAD) has opened the week on its back foot against a somewhat stronger US Dollar. Upbeat US manufacturing activity data and the softer crude prices are weighing on the Loonie in a thin market session as most European markets are closed on the Monday following Easter.
The US ISM Manufacturing index has shown levels above 50 for the first time since October 2022. These figures suggest an unexpected expansion of the sector’s activity in March and have been combined with improvements in all sub-indices with the prices component increasing at its fastest pace in almost two years, suggesting a positive contribution to inflation.
Earlier today, the Canadian S&P Manufacturing PMI remained little changed in March to complete a whole year of contraction in the sector’s activity. Beyond that, crude Oil prices have pulled back from recent highs, which adds negative pressure to the Canadian Dollar.
Daily digest market movers: USD/CAD bounces up on bright US data
- Canadian Dollar trades lower on Monday with the US Dollar favoured by upbeat US macroeconomic data.
- US ISM Manufacturing PMI has increased to 50.3 in March from 47.8 in February, beating market expectations of a 48.4 reading.
- Prices Paid in the manufacturing sector have surged to 55.8, their highest level since July 2022.
- Canadian S&P Manufacturing PMI has ticked up to 49.8 from 49.7 in February.
- Oil prices have pulled back from YTD highs at $83.65, which has added negative pressure to the commodity-linked CAD.
- On Friday, US PCE Prices Index grew at a 0.3% monthly pace in February, 2.5% YoY. The market was expecting a 0.4% monthly increase.
- US Consumer spending jumped 0.8% in February from 0.2% in January, well above the 0.5% increase anticipated by market experts.
- This week a slew of Fed speakers are likely to give further hints regarding the monetary policy outlook ahead of Friday’s Nonfarm Payrolls report.
US Dollar price today
The table below shows the percentage change of US Dollar (USD) against listed major currencies today. US Dollar was the weakest against the Japanese Yen.
| USD | EUR | GBP | CAD | AUD | JPY | NZD | CHF | |
| USD | 0.46% | 0.59% | 0.37% | 0.61% | 0.21% | 0.59% | 0.32% | |
| EUR | -0.46% | 0.13% | -0.08% | 0.15% | -0.25% | 0.13% | -0.14% | |
| GBP | -0.59% | -0.13% | -0.22% | 0.03% | -0.39% | 0.00% | -0.28% | |
| CAD | -0.37% | 0.10% | 0.21% | 0.24% | -0.17% | 0.21% | -0.06% | |
| AUD | -0.62% | -0.15% | -0.02% | -0.25% | -0.41% | -0.04% | -0.29% | |
| JPY | -0.22% | 0.28% | 0.38% | 0.17% | 0.43% | 0.42% | 0.12% | |
| NZD | -0.60% | -0.12% | 0.00% | -0.21% | 0.02% | -0.38% | -0.27% | |
| CHF | -0.33% | 0.14% | 0.27% | 0.06% | 0.29% | -0.11% | 0.27% |
The heat map shows percentage changes of major currencies against each other. The base currency is picked from the left column, while the quote currency is picked from the top row. For example, if you pick the Euro from the left column and move along the horizontal line to the Japanese Yen, the percentage change displayed in the box will represent EUR (base)/JPY (quote).
Technical analysis: The USD has scope for further appreciation to 1.3615
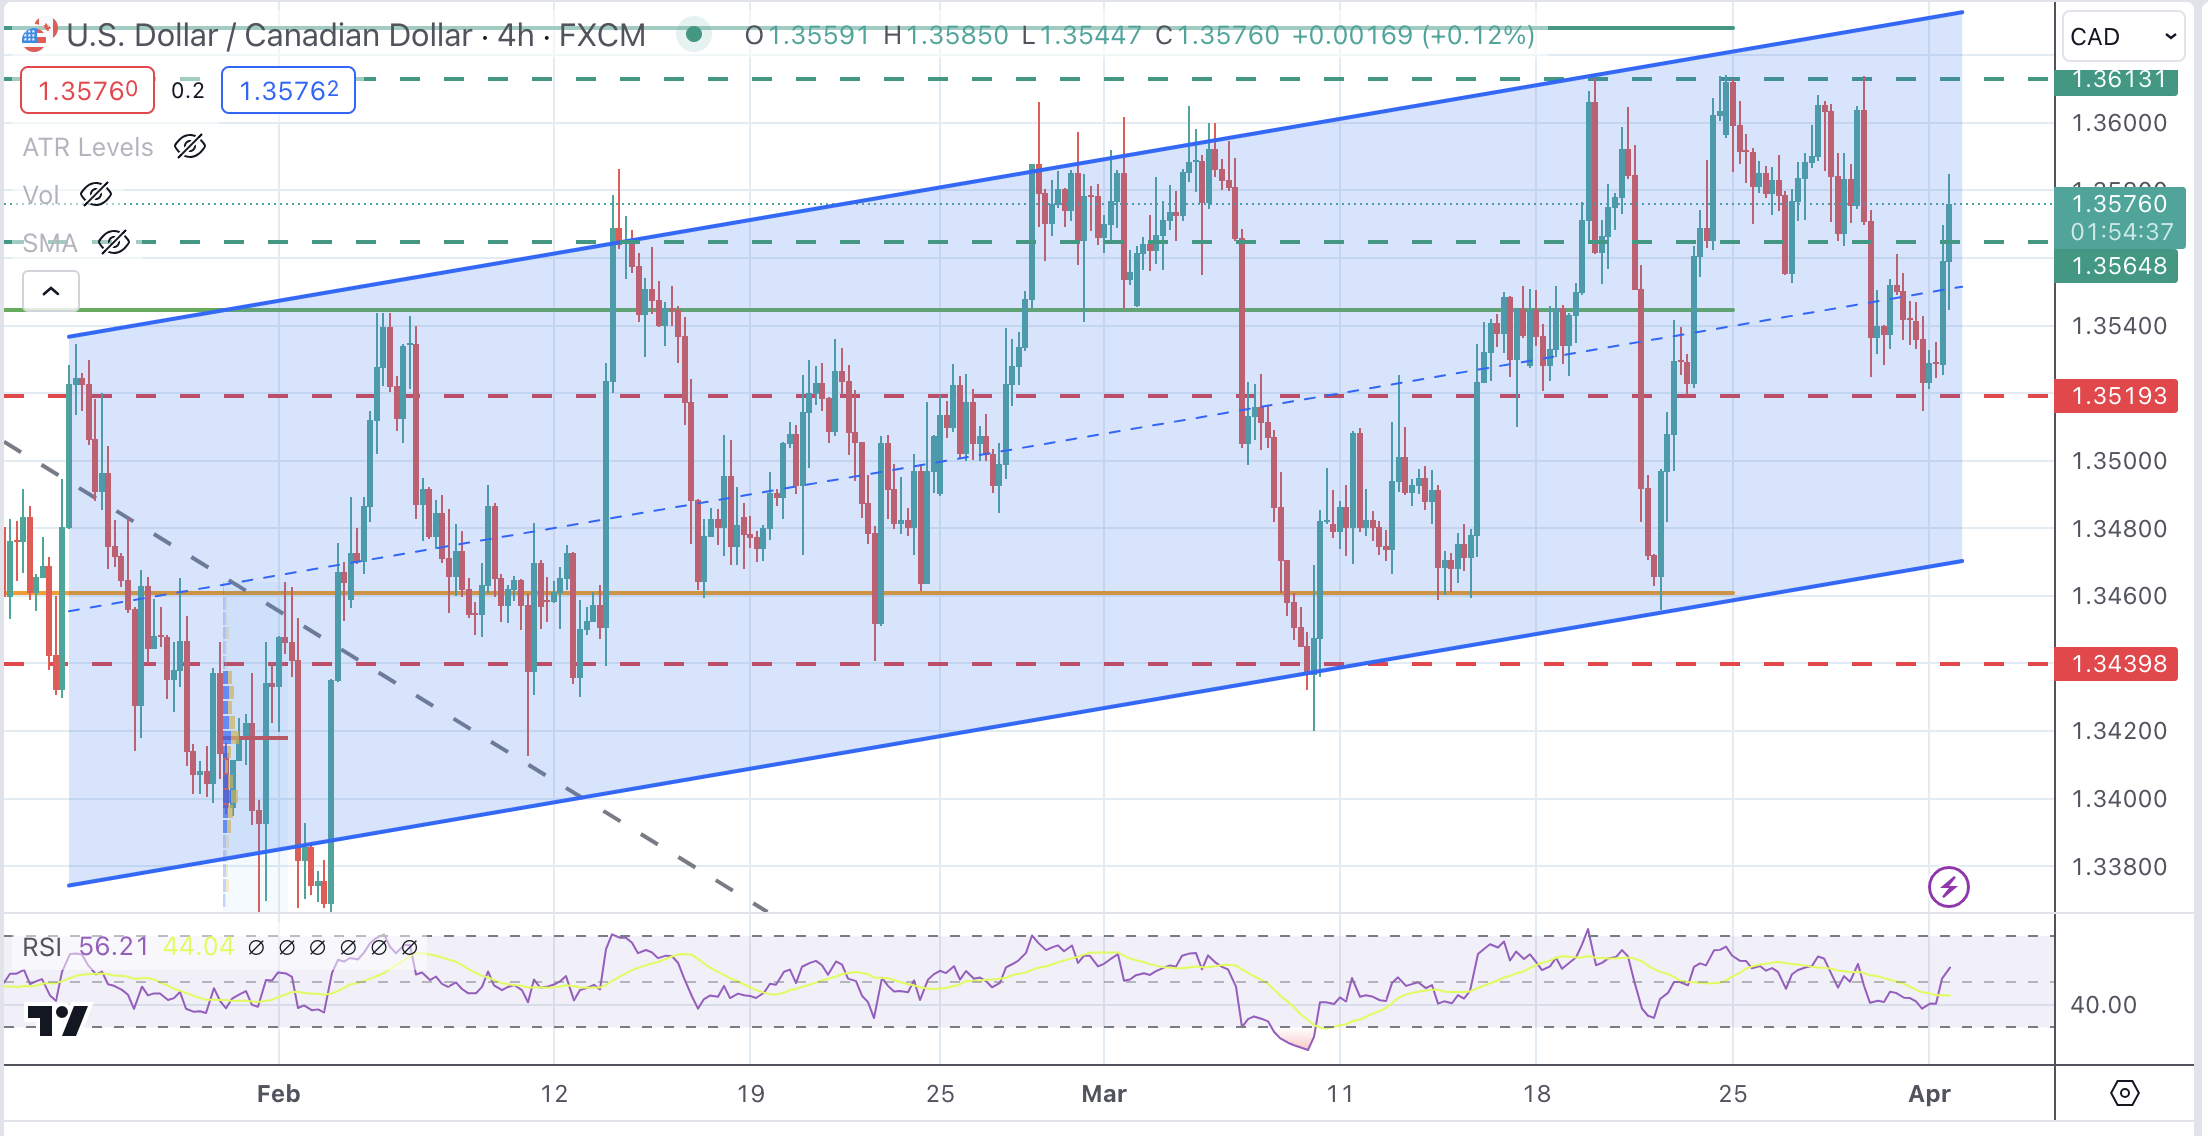
The USD/CAD regained positive traction on Monday, underpinned by the strong US macroeconomic data that endorses the “soft landing” rhetoric and opens cracks in the market view tat anticipates three rate hikes in 2024.
The pair keeps trading within a slightly bullish channel. The rebound from last week’s lows has breached resistance at 1.3565, which gives buyers hope to extend gains toward 1.3615 and the top of the channel at 1.3632. Supports are 1.3520 and 1.3470.
USD/CAD 4-Hour Chart
Canadian Dollar FAQs
The key factors driving the Canadian Dollar (CAD) are the level of interest rates set by the Bank of Canada (BoC), the price of Oil, Canada’s largest export, the health of its economy, inflation and the Trade Balance, which is the difference between the value of Canada’s exports versus its imports. Other factors include market sentiment – whether investors are taking on more risky assets (risk-on) or seeking safe-havens (risk-off) – with risk-on being CAD-positive. As its largest trading partner, the health of the US economy is also a key factor influencing the Canadian Dollar.
The Bank of Canada (BoC) has a significant influence on the Canadian Dollar by setting the level of interest rates that banks can lend to one another. This influences the level of interest rates for everyone. The main goal of the BoC is to maintain inflation at 1-3% by adjusting interest rates up or down. Relatively higher interest rates tend to be positive for the CAD. The Bank of Canada can also use quantitative easing and tightening to influence credit conditions, with the former CAD-negative and the latter CAD-positive.
The price of Oil is a key factor impacting the value of the Canadian Dollar. Petroleum is Canada’s biggest export, so Oil price tends to have an immediate impact on the CAD value. Generally, if Oil price rises CAD also goes up, as aggregate demand for the currency increases. The opposite is the case if the price of Oil falls. Higher Oil prices also tend to result in a greater likelihood of a positive Trade Balance, which is also supportive of the CAD.
While inflation had always traditionally been thought of as a negative factor for a currency since it lowers the value of money, the opposite has actually been the case in modern times with the relaxation of cross-border capital controls. Higher inflation tends to lead central banks to put up interest rates which attracts more capital inflows from global investors seeking a lucrative place to keep their money. This increases demand for the local currency, which in Canada’s case is the Canadian Dollar.
Macroeconomic data releases gauge the health of the economy and can have an impact on the Canadian Dollar. Indicators such as GDP, Manufacturing and Services PMIs, employment, and consumer sentiment surveys can all influence the direction of the CAD. A strong economy is good for the Canadian Dollar. Not only does it attract more foreign investment but it may encourage the Bank of Canada to put up interest rates, leading to a stronger currency. If economic data is weak, however, the CAD is likely to fall.
- EUR/USD declines following upbeat US Manufacturing PMI and Prices Paid Index, hinting the Fed might refrain from easing policy.
- The rise in the US Dollar Index and Treasury yields reflects growing confidence in the US economic outlook.
- Upcoming Eurozone manufacturing PMIs could push the EUR/USD further down, with estimates expected to contract further.
The Euro extends its losses against the US Dollar, with most European markets being closed in observance of Easter Monday. Data from the United States sponsored a leg down in the EUR/USD, which tumbled more than 0.40% and traded at 1.0742.
Strong US ISM Manufacturing PMI and a jump in prices paid, to keep Fed on hold
The Institute for Supply Management (ISM) revealed that business activity in March expanded for the first time since September 2022, an indication that the economy remains solid. The Manufacturing PMI came at 50.3, exceeding estimates of 48.4 and smashing February’s 47.8 reading. The same report revealed that the Prices Paid Index expanded to 55.8, its highest level since August 2022, when it hit 52.5. This could deter the Federal Reserve from easing policy, as the economy fares better than expected.
At around 13:45 GMT, S&P Global revealed the latest revision of March’s Manufacturing PMI for the United States, coming at 51.9, below the previous reading of 52.2.
Following the data, the EUR/USD has extended its losses past the psychological 1.0750 figure, which could exacerbate a test of the February 14 swing low of 1.0694.
In the meantime, the US Dollar Index (DXY), which measures the buck’s performance against a basket of peers rally 0.36%, is up at 105.93, while US Treasury yields rise. The 10-year benchmark note rate is at 4.305%, up almost ten basis points.
Following the data release, money market traders see a 61% chance of the Fed cutting rates by 25 basis points, as depicted via the CME FedWatch Tool.
Across the pond, the Eurozone (EU) economic docket will feature the release of the HCOB manufacturing PMI for Spain, Italy, France, Germany, and the whole bloc. Most readings, except for Spain, are expected to deteriorate further and remain in recessionary territory.
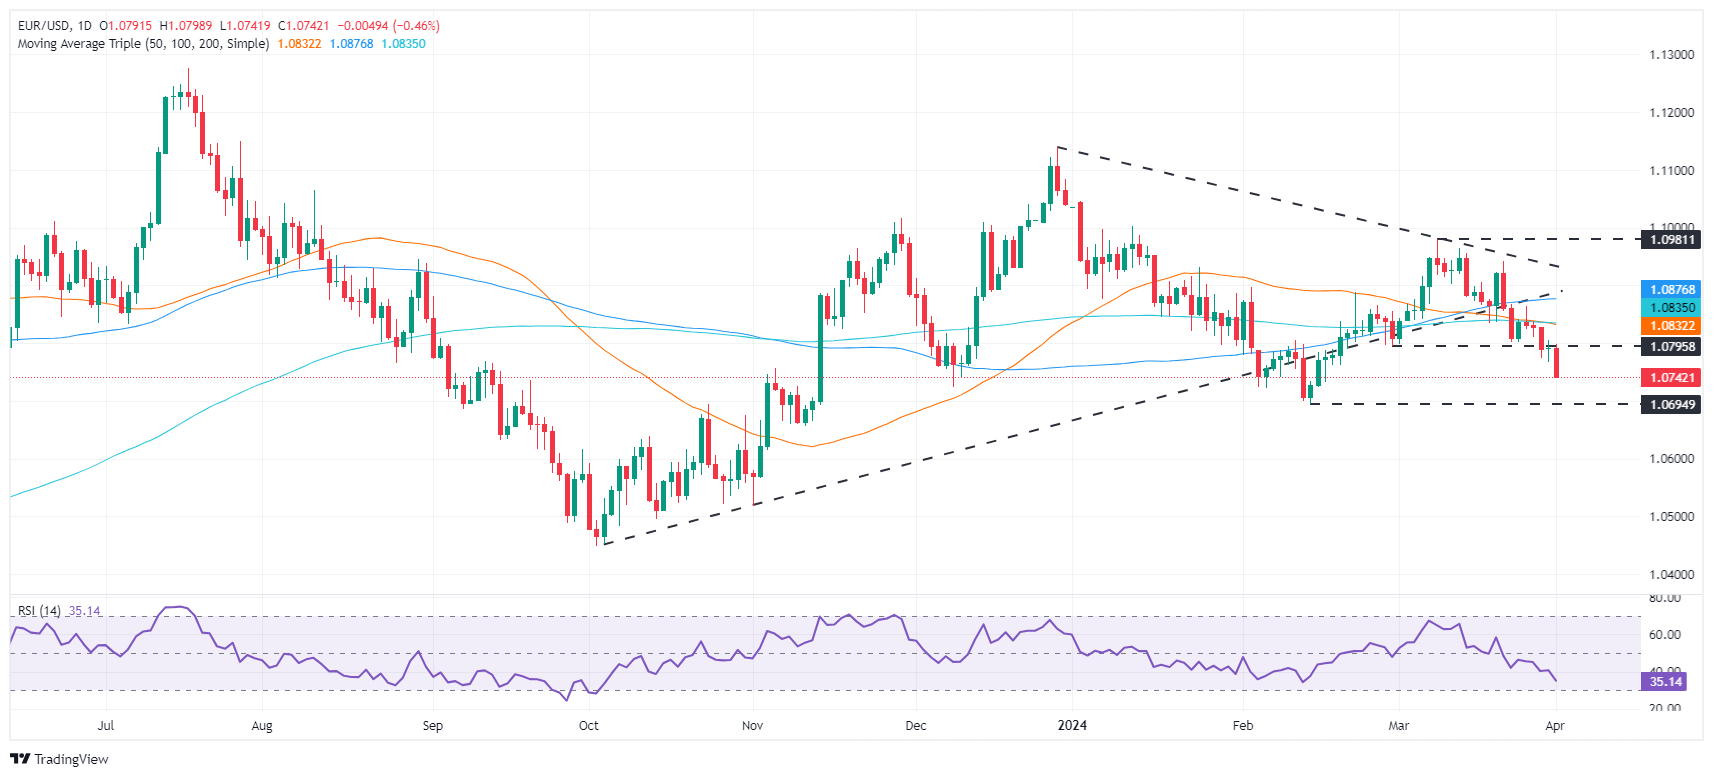
EUR/USD Price Analysis: Technical outlook
The EUR/USD daily chart portrays the pair as aiming toward the 1.0700 figure, ahead of challenging 1.0694, February’s 14 low. A breach of the latter will expose the November 10 low intermediate support level at 1.0656, followed by major support at 1.0516, the November 1 swing low. On the other hand, if buyers reclaim 1.0750, look for an upside correction toward 1.0800.
- US ISM Manufacturing PMI rose above 50 in March.
- The US Dollar gathers strength against its rivals after upbeat PMI data.
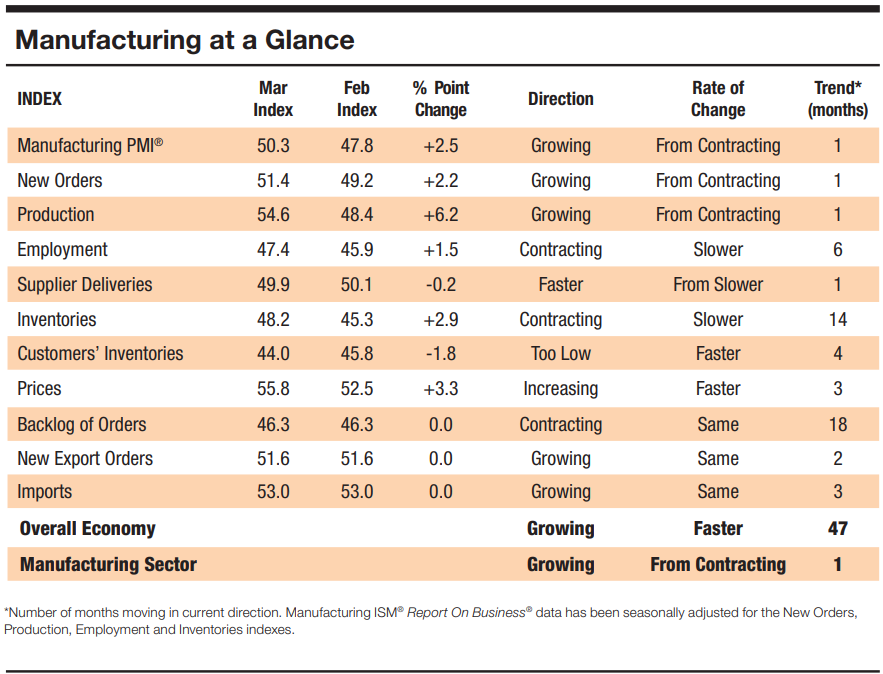
Business activity in the US manufacturing sector expanded at a modest pace in March, with the ISM Manufacturing PMI rising to 50.3 from 47.8 in February. This reading came in better than the market expectation of 48.4.
Other details of the report showed that the Employment Index edged higher to 47.4 from 45.9, the New Orders Index climbed to 51.4 from 49.2 and the Prices Paid Index, the inflation component, rose to 55.8 from 52.5.
Assessing the survey's findings,"the U.S. manufacturing sector moved into expansion for the first time since September 2022. Demand was positive, output strengthened and inputs remained accommodative," said Timothy R. Fiore, CPSM, C.P.M., Chair of the Institute for Supply Management (ISM) Manufacturing Business Survey Committee, and added: "The Prices Index moved further upward in moderate expansion (or ‘increasing’) territory as commodity driven costs remain unstable."
Market reaction
The US Dollar gathered strength against its rivals with the immediate reaction. At the time of press, the US Dollar Index was up 0.35% on the day at 104.89.
- AUD/USD trades sideways around 0.6500 as the focus shifts to US NFP data.
- Fed Powell sees no need to rush for rate cuts.
- Investors await the RBA minutes for fresh guidance on interest rates.
The AUD/USD pair trades sideways in a narrow range slightly above the psychological support of 0.6500 in the early New York session on Monday. The Aussie asset consolidates as investors seek fresh guidance on when the Reserve Bank of Australia (RBA) and the Federal Reserve (Fed) will pivot to rate cuts.
The S&P 500 opens on a cautious note after a holiday-stretched weekend due to Good Friday. The US Dollar Index (DXY) moves higher to 104.65 amid a cautious market mood. Investors turn cautious ahead of the United States Nonfarm Payrolls (NFP) data for March, which will be published on Friday.
Firm market expectations for the Federal Reserve (Fed) to cut interest rates keep the upside of the US Dollar capped. Fed Chair Jerome Powell’s commentary that there is no need to rush for rate cuts restricts the downside.
On the Australian Dollar front, investors await the Reserve Bank of Australia (RBA) monetary policy minutes, which will be published on Tuesday. The policy minutes will provide a detailed explanation behind the steady interest rate decision on March 19.
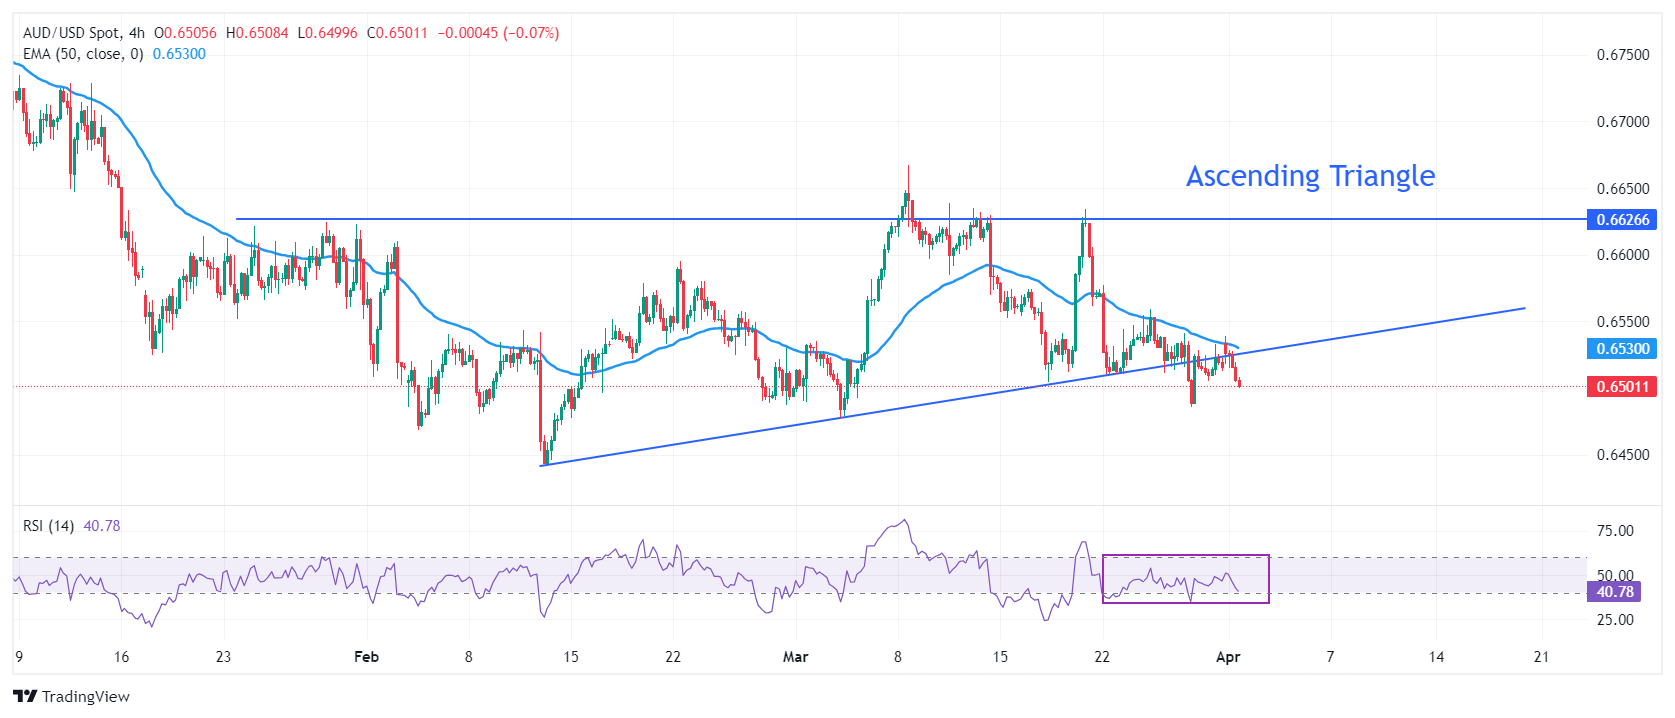
AUD/USD delivers a breakdown of the Ascending Triangle chart pattern near 0.6520 formed on a four-hour timeframe. The upward-sloping border of the aforementioned pattern is plotted from February 13 low at 0.6442 while the horizontal resistance is placed from January 30 high at 0.6626.
Downward-sloping 50-period Exponential Moving Averages (EMA) at 0.6530, indicates that the near-term demand is weak.
The 14-period Relative Strength Index (RSI) oscillates in the 40.00-60.00 range, indicating indecisiveness among market participants.
Investors might build fresh shorts below March 28 low at 0.6485. Profits on shorts would be booked near February 13 low around 0.6440 and the round-level support of 0.6400.
On the contrary, a sharp recovery move above March 26 high at 0.6560 will drive the asset toward the round-level resistance of 0.6600, followed by March 12 high at 0.6640.
AUD/USD four-hour chart
- EUR/USD drops after a short-lived pullback from 1.0800 ahead of a data-packed US economic calendar.
- The USD Index rises as market sentiment turns downbeat ahead of the US opening after an extended weekend.
- Eurozone preliminary inflation data will guide market expectations for the ECB rate cuts in June.
The EUR/USD pair falls after a pullback move to near the round-level resistance of 1.0800 in the late London session. The major currency pair faces pressure as investors turn cautious ahead of a data-packed week.
The market sentiment appears to be risk-off as risk-sensitive currencies are down. S&P 500 futures have surrendered almost entire gains posted in the European session ahead of opening after a long weekend fur to Good Friday. The US Dollar Index (DXY) advances to 104.65 amid uncertainty ahead of the crucial United States Nonfarm Payrolls (NFP) report for March, scheduled for Friday.
Before the US NFP, investors will focus on the US Manufacturing PMI report for March, which will be published at 14:00 GMT. The factory data is estimated to have increased to 48.4 from 47.8 in February, but will remain below the 50.0 threshold.
The US Dollar rises even though market expectations for the Federal Reserve (Fed) pivoting to rate cuts from the June policy meeting have increased. According to the CME FedWatch tool, traders are pricing in a 65% chance that the Fed will trim interest rates in June.
The likelihood of a rate cut has increased after US core Personal Consumption Expenditure Inflation (PCE) data for February softened as expected. The monthly and annual core PCE inflation grew by 0.3% and 2.8%, respectively. Also, Fed Chair Jerome Powell said after the release of the US core PCE report that the latest US inflation data was "along the lines of what we would like to see.”
On the Eurozone front, investors await the preliminary inflation data for March, which will be released on Wednesday. The annual core inflation is expected to have decelerated to 3.0% from 3.1% in February. The annual Harmonized Index of Consumer Prices (HICP) is forecasted to have risen at a steady pace of 2.6%. Easing price pressures would accelerate investors’ prospects for the European Central Bank (ECB), kickstarting the rate-cut cycle from the June meeting.
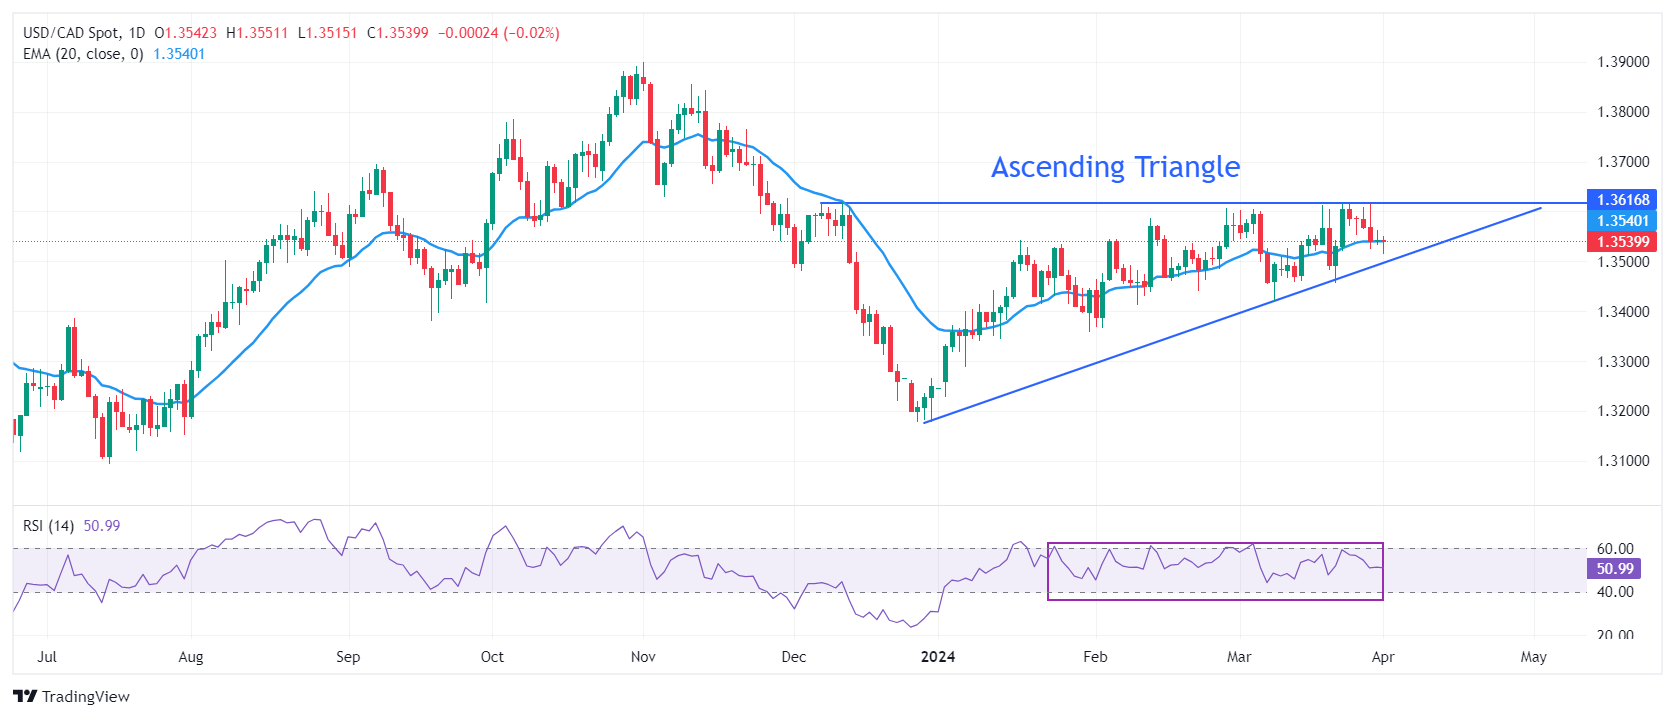
- USD/CAD finds cushion near 1.3500 as Oil prices drop on tighter supply concerns.
- The US Dollar moves higher while risk-sensitive currencies edge down amid uncertainty ahead of US data.
- The Loonie is expected to blow out of the ascending Triangle formation.
The USD/CAD pair discovers a temporary support near the psychological support of 1.3500 in the European session on Monday. The Loonie asset finds cushion as the Oil prices edge down after a three-day rally.
The appeal for the Oil prices remains buoyant on tighter supply concerns. OPEC pledges to extend production cuts by the June end. Also, Ukraine’s drone attacks on some Russian refineries have deepened supply concerns. It is worth noting that Canada is the leading exporter of oil to the United States and higher Oil prices strengthen the Canadian Dollar.
Meanwhile, the US Dollar rises slightly to 104.58 amid caution ahead of the United States Nonfarm Payrolls (NFP) and related labor market data this week. The market is experiencing asset-specific action as risk-perceived currencies are down while US equity futures have posted significant gains.
In today’s session, investors will focus on the United States ISM Manufacturing PMI data for March, which will be published at 14:00 GMT. The factory data is estimated to increase to 48.4 from 47.8 in February.
USD/CAD seems close to exploding the Ascending Triangle pattern formed on a daily time. The chart pattern exhibits a sharp volatility contraction. The upward-sloping border of the aforementioned pattern is placed from December 27 low at 1.3177 while horizontal resistance is plotted from December 7 high at 1.3620
The 20-day Exponential Moving Average (EMA) near 1.3520 remains stick to spot prices, indicating a consolidation ahead.
The 14-period Relative Strength Index (RSI) oscillates inside the 40.00-60.00 range, indicating indecisiveness among investors.
The Loonie asset would observe a fresh upside if it breaks above December 7 high at 1.3620. This will drive the asset towards May 26 high at 1.3655, followed by the round-level resistance of 1.3700.
On the flip side, a downside move below February 22 low at 1.3441 would expose the asset to February 9 low at 1.3413. A breakdown below the latter would extend downside towards January 15 low at 1.3382.
USD/CAD daily chart
- Gold price corrects slightly after refreshing a new all-time high at $2,265 ahead of US data-packed week.
- Jerome Powell sees the pace of decline in February’s core PCE inflation aligned with the Fed’s required rate.
- Investors await the US ISM Manufacturing PMI for fresh guidance on the US Dollar’s next move.
Gold price (XAU/USD) trades close to a fresh all-time high of around $2,260 ahead of a busy week in the United States’ economic calendar. The precious metal clings to gains as expectations for the Federal Reserve (Fed) lean towards June as the meeting to cut interest rates have increased. Fed Chair Jerome Powell validated the decline in February’s core Personal Consumption Expenditures inflation (PCE) data as the Fed looks for evidence of price pressures easing to the 2% target.
Higher expectations for the Fed to cut rates, especially after a two-year period of rate hikes, dent yields on interest-bearing assets such as US bonds. However, this increases the investment value of Gold. 10-year US Treasury yields were slightly up in Monday’s European session but have come down to 4.20%.
The US Dollar Index (DXY), which tracks the value of the US Dollar against six major currencies, consolidates around 104.50. The upside in the US Dollar remains capped due to firm Fed rate cut expectations, while uncertainty ahead of the release of the United States Nonfarm Payrolls (NFP) report and related labor data is limiting the downside.
Daily digest market movers: Gold price capitalizes on firm Fed rate cut prospects
- Gold price turns sideways after refreshing an all-time high near $2,260. The demand for the precious metal remains buoyant as market expectations for the Federal Reserve starting its rate-cut cycle in June escalate.
- Fed Chair Jerome Powell said Friday at a that the latest US inflation data was "along the lines of what we would like to see," while interviewed by public radio's "Marketplace" program, boosted rate-cut expectations for June. According to the CME FedWatch tool, traders see a 68% chance that rate cuts will be announced in June. The expectations have increased from the 60% observed before the release of February’s core PCE Price Index data on Friday.
- While Fed Powell remains confident in progress in easing inflation, he acknowledged that the central bank doesn’t need to hurry for rate cuts with the economy on a strong footing. He recognized the need to see more progress on inflation before cutting interest rates and cautioned the need to be careful on rate cuts, citing strong economy and labor market conditions.
- The monthly and annual core PCE inflation grew by 0.3% and 2.8% in February as expected. However, January’s estimates were upwardly revised to 0.5% on month and 2.9% on year from the 0.4% and 2.8% increases previously estimated, respectively.
- The Fed’s preferred inflation measure is at its lowest level in almost two years, supporting higher Fed rate cut expectations for June.
- This week, the United States NFP report for March, scheduled for Friday, is the main event to look at as it will likely provide more clarity on when the Fed could start reducing interest rates.
- In Monday’s session, market participants will keenly focus on the US ISM Manufacturing PMI for March, which will be published at 14:00 GMT. The factory data is estimated to increase to 48.4 from 47.8 in February, below 50.0 or the 16th month in a row. A figure below the 50.0 threshold suggests that the business activity in the US manufacturing sector contracted in this period.
Technical Analysis: Gold price prints fresh highs at $2,265
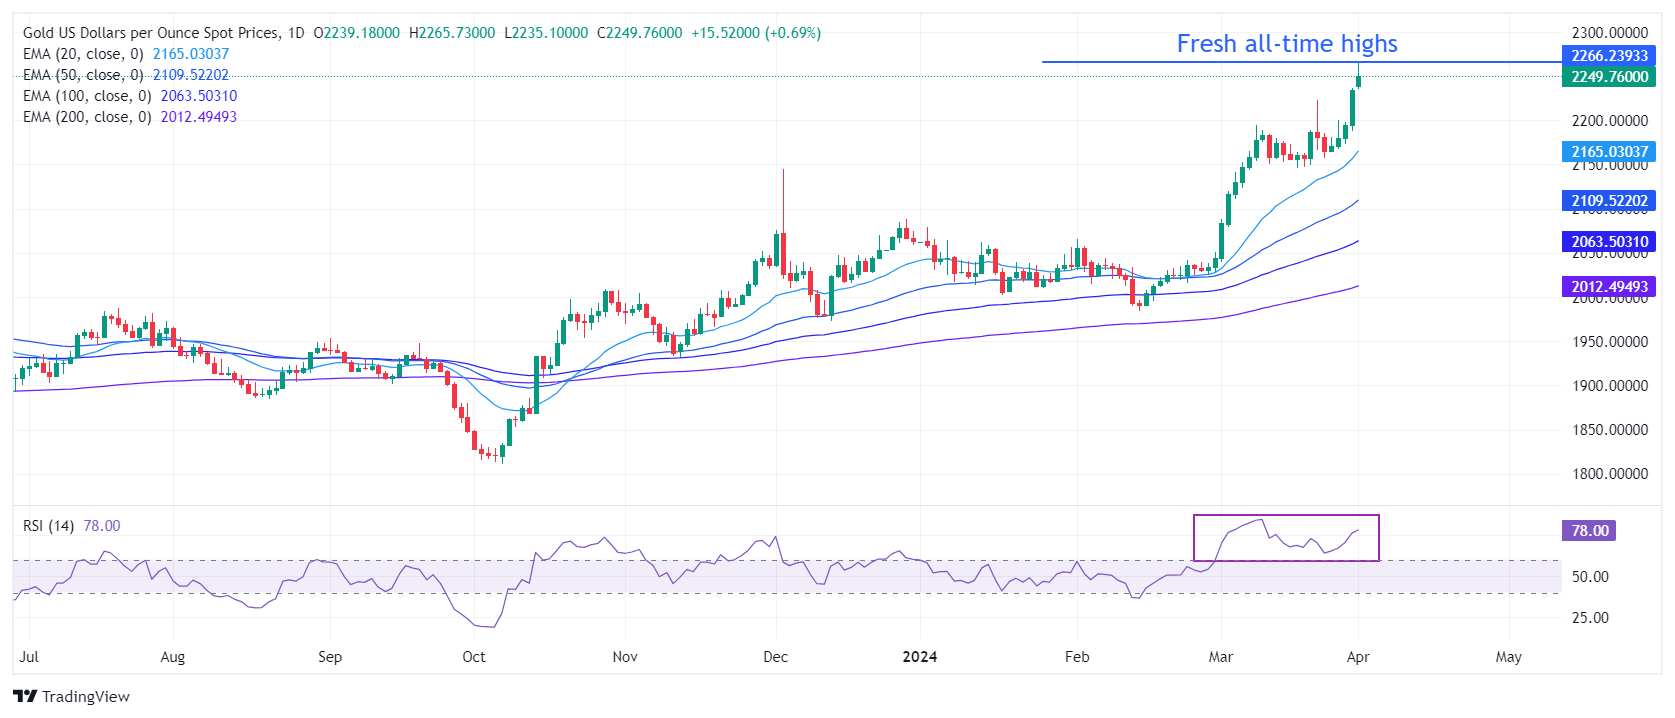
Gold price refreshes all-time highs at $2,265. The precious metal strengthened after breaking above the prior lifetime high of $2,223, printed on March 21. More upside in the Gold price is possible as it is trading in unchartered territory. All short-to-long term Exponential Moving Averages (EMAs) are sloping higher, suggesting strong near-term demand.
The 14-period Relative Strength Index (RSI) reaches 78.00, indicating strong upside momentum but already in overbought territory. Signs of divergence are absent, and an overbought signal cannot be ruled out.
Gold FAQs
Gold has played a key role in human’s history as it has been widely used as a store of value and medium of exchange. Currently, apart from its shine and usage for jewelry, the precious metal is widely seen as a safe-haven asset, meaning that it is considered a good investment during turbulent times. Gold is also widely seen as a hedge against inflation and against depreciating currencies as it doesn’t rely on any specific issuer or government.
Central banks are the biggest Gold holders. In their aim to support their currencies in turbulent times, central banks tend to diversify their reserves and buy Gold to improve the perceived strength of the economy and the currency. High Gold reserves can be a source of trust for a country’s solvency. Central banks added 1,136 tonnes of Gold worth around $70 billion to their reserves in 2022, according to data from the World Gold Council. This is the highest yearly purchase since records began. Central banks from emerging economies such as China, India and Turkey are quickly increasing their Gold reserves.
Gold has an inverse correlation with the US Dollar and US Treasuries, which are both major reserve and safe-haven assets. When the Dollar depreciates, Gold tends to rise, enabling investors and central banks to diversify their assets in turbulent times. Gold is also inversely correlated with risk assets. A rally in the stock market tends to weaken Gold price, while sell-offs in riskier markets tend to favor the precious metal.
The price can move due to a wide range of factors. Geopolitical instability or fears of a deep recession can quickly make Gold price escalate due to its safe-haven status. As a yield-less asset, Gold tends to rise with lower interest rates, while higher cost of money usually weighs down on the yellow metal. Still, most moves depend on how the US Dollar (USD) behaves as the asset is priced in dollars (XAU/USD). A strong Dollar tends to keep the price of Gold controlled, whereas a weaker Dollar is likely to push Gold prices up.
- AUD/JPY gains ground on encouraging Chinese PMI data.
- Japanese Yen struggles after the expansion in Chinese manufacturing activity.
- RBA Meeting Minutes will be released on Tuesday to offer insights into the central bank's future policy direction.
AUD/JPY appreciates to near 98.80 during the European session on Monday, potentially supported by positive Chinese Purchasing Managers Index (PMI) figures. The close trading relationship between China and Australia likely contributes to this correlation.
Moreover, the safe-haven Japanese Yen (JPY) may have encountered negative sentiment as investor confidence was buoyed by the first expansion in Chinese manufacturing activity in six months, observed in March.
China’s Caixin Manufacturing PMI was reported at 51.1 on Monday, surpassing expectations of 51.0 and exceeding the previous reading of 50.9. Before that, on Sunday, China's National Bureau of Statistics (NBS) released data showing that the Manufacturing PMI rose to 50.8 in March from 49.1 in the prior month. Additionally, the Non-Manufacturing PMI increased to 53.0 in March from 51.4 in February.
Former BOJ official Tsutomu Watanabe has indicated that the next rate hike in Japan might not materialize until October at the earliest. According to an assessment reported by Bloomberg (gated), Watanabe foresees the BoJ adopting a cautious, data-driven approach, primarily due to concerns surrounding Yen depreciation.
However, the Australian Dollar (AUD) might have struggled due to weaker Consumer Inflation Expectations, which could suggest expectations for interest rate cuts by the Reserve Bank of Australia (RBA) in late 2024. Investors are anticipated to closely scrutinize the release of the RBA Meeting Minutes scheduled for Tuesday to gain insights into the central bank's stance and future policy direction.
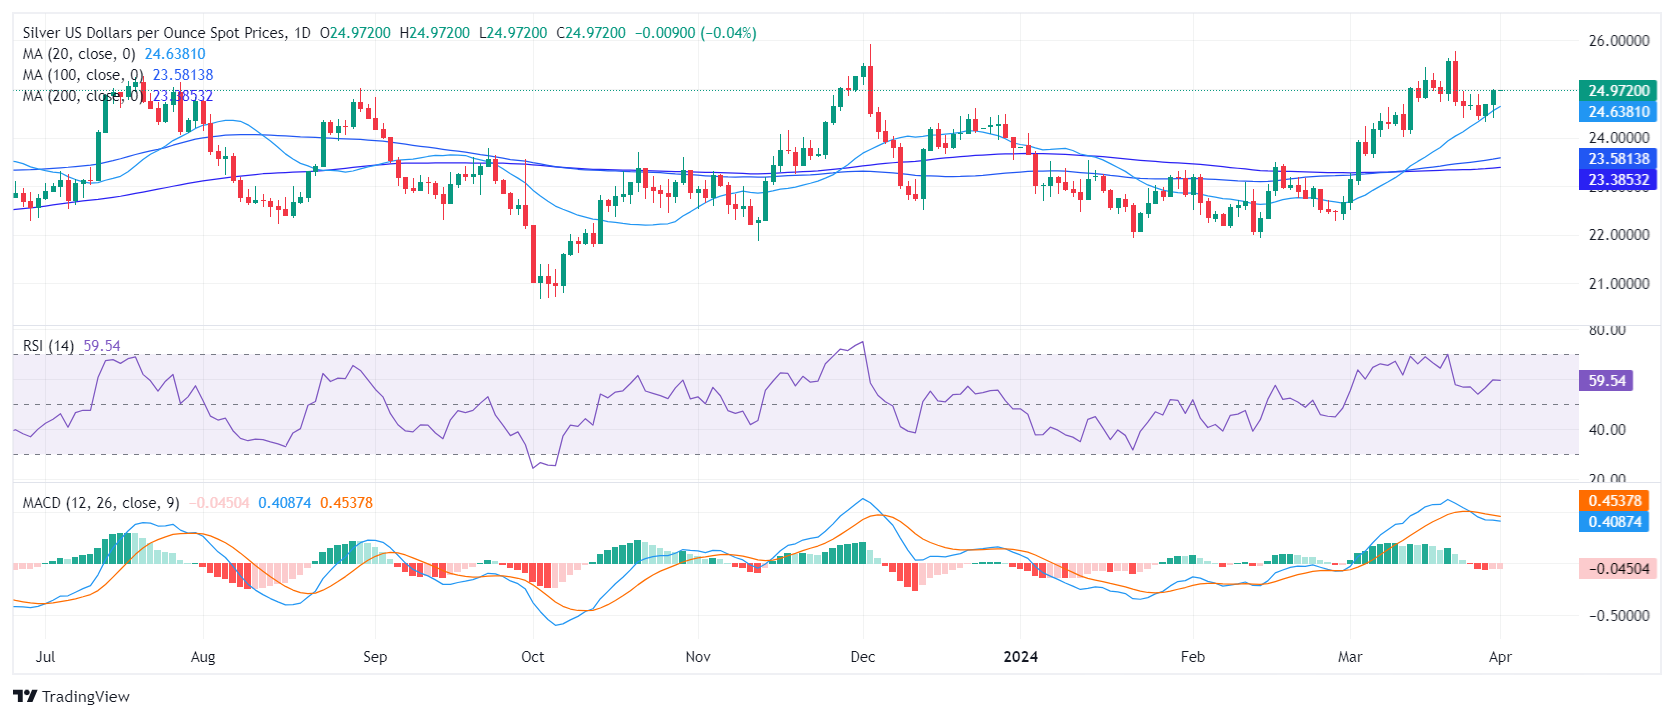
- Silver gains positive traction for the third straight day and climbs to over a one-week high.
- Mixed oscillators on the daily chart warrant some caution for aggressive bullish traders.
- Weakness below the $25.00 mark is more likely to get bought into and remain limited.
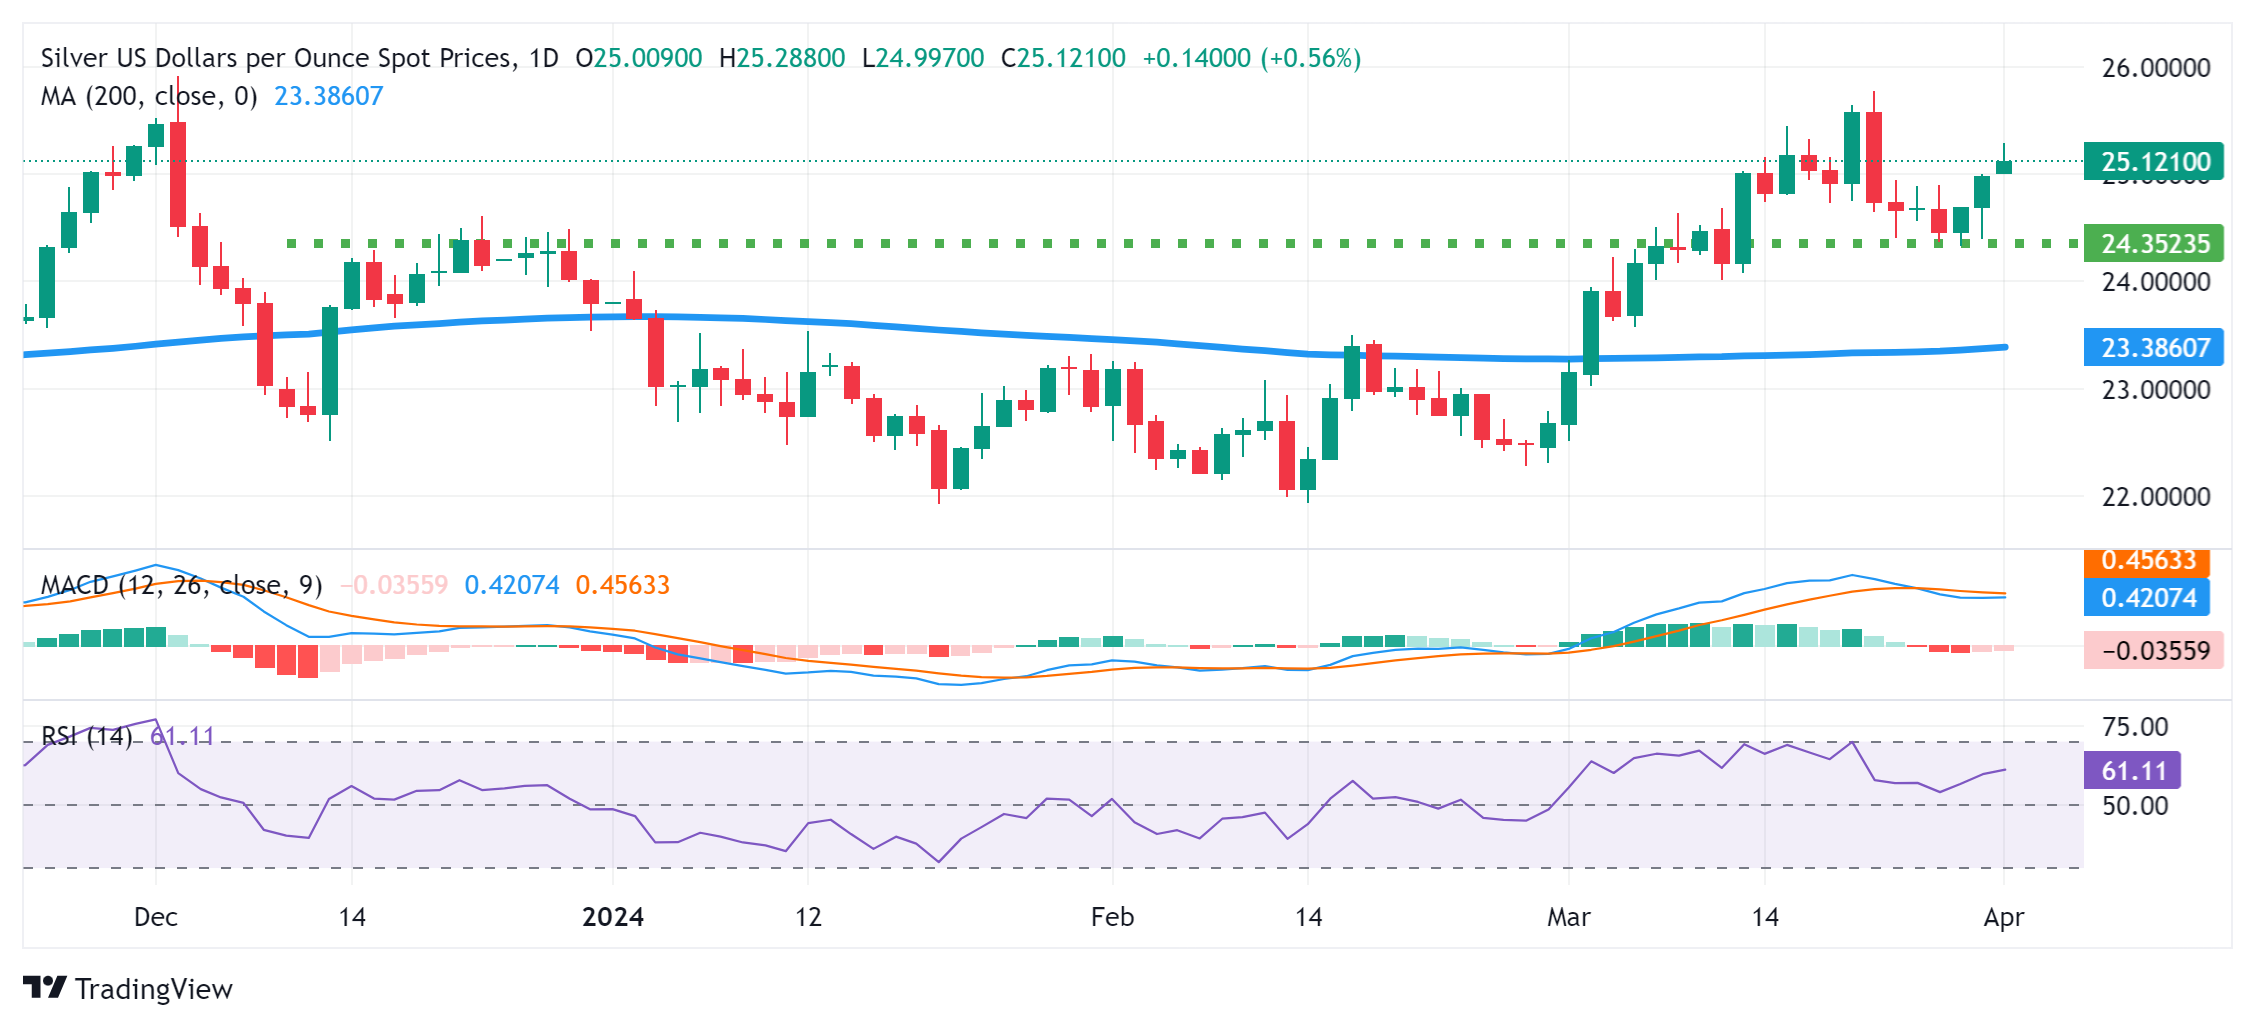
Silver (XAG/USD) builds on last week's bounce from the $24.35 resistance-turned-support zone and gains positive traction for the third successive day on Monday. The white metal sticks to its intraday gains through the first half of the European session and currently trades around the $25.15 region, just below a more than one-week top touched earlier today.
Meanwhile, mixed technical indicators on the daily chart warrant some caution for bullish traders. Hence, any subsequent move up is more likely to confront stiff resistance near the $25.65-$25.75 region, or the YTD peak touched in March. This is closely followed by the December 2023 swing high – levels just ahead of the $26.00 round figure. A sustained strength beyond the said handle should allow the XAG/USD to resume its recent strong uptrend witnessed since late February.
On the flip side, weakness back below the $25.00 psychological mark is likely to attract fresh buyers near the $24.65 region. This should help limit the downside for the XAG/USD near the aforementioned resistance-turned-support, around the $24.35 zone. The latter should act as a key pivotal point, which if broken decisively might shift the bias in favour of bearish traders and drag the white metal to the next relevant support near the $24.15-$24.10 region en route to the $24.00 mark.
Some follow-through selling would make the XAG/SUD vulnerable to accelerate the downward trajectory further towards the 200-day Simple Moving Average (SMA), currently pegged around the $23.35-$23.30 region.
Silver daily chart
- USD/MXN receives pressure following Fed Chair Powell's reaffirmation of the Fed's stance on rate cuts in 2024.
- The decline in Mexico’s Jobless Rate has enabled Banxico to uphold tight borrowing conditions to tackle inflation.
- US ISM Manufacturing PMI is anticipated to improve to 48.4 in March, from 47.8 prior.
USD/MXN maintains its position below 16.60, attempting to extend losses for the second successive session on Monday. The Mexican Peso (MXN) has strengthened as the domestic Jobless Rate unexpectedly declined to 2.5%, reaching an eleven-month low and surpassing expectations of 2.8%. This positive development has enabled the Bank of Mexico (Banxico) to uphold tight borrowing conditions in its efforts to tackle persistent inflation.
Inflation has risen to 0.27% and 0.33% for both headline and core measures, respectively, in the first half of March. Additionally, traders will eagerly await the release of Consumer Confidence data for March, scheduled for Thursday.
The US Dollar Index (DXY) encounters difficulties amid lower US Treasury yields, hovering around 104.50, with the 2-year and 10-year yields on US bond coupons standing at 4.59% and 4.19%, respectively, at the time of writing. The US Dollar (USD) is facing challenges following dovish remarks made by Federal Reserve (Fed) Chairman Jerome Powell on Friday.
Fed Chair Powell indicated that the recent Personal Consumption Expenditures Price Index (PCE) data from the United States (US) met expectations, reaffirming the Fed's stance on potential interest rate cuts for the year. Fed officials maintain projections of three rate cuts for the year, with market participants expecting the first of these cuts to occur at the June meeting.
Traders may adopt a cautious stance ahead of the release of the ISM Manufacturing Purchasing Managers Index (PMI) data from the United States (US) scheduled for later in the North American session.
- The Pound Sterling trades sideways amid uncertainty over the BoE’s interest-rate outlook.
- BoE officials see expectations of two or three rate cuts for this year as appropriate.
- Investors await the US and UK Manufacturing PMI for fresh guidance on the economic outlook.
The Pound Sterling (GBP) struggles to make a decisive move in Monday’s London session as investors are yet to return to the FX domain after a holiday-stretched weekend on account of Good Friday and Easter Monday. The GBP/USD pair consolidates slightly above the round-level support of 1.2600 as investors await fresh guidance on when the Bank of England (BoE) and the Federal Reserve (Fed) will pivot to rate cuts.
Earlier this year, the Fed was expected to start reducing interest rates sooner than the BoE, supporting the Pound Sterling’s valuation against the US Dollar. However, the BoE is currently anticipated to follow the Fed’s footprints and start rate cuts from June. Two BoE policymakers, Catherine Mann and Jonathan Haskel, who were described as hawks, see no need for more rate hikes as higher interest rates are impacting labor market conditions and consumer spending.
Catherine Mann said in an interview with Bloomberg last week that she dropped her rate hike call after observing that consumers are reluctant to pay higher prices on services such as travel and hospitality. Mann added that firms are cutting working hours in times when more employment is required. She further added that the number of workers in the labor market will increase due to the government's cuts to social security rates.
The Pound Sterling is expected to depreciate if the BoE reduces key borrowing rates earlier than expected after consistently raising them for more than two years.
Meanwhile, the US Dollar Index (DXY) is broadly sideways around 104.50 as investors await the crucial United States Nonfarm Payrolls (NFP) report for March, which will be published on Friday. The official labor market data is one of the main economic data releases that influences the Fed’s rate cut expectations.
Daily digest market movers: Pound Sterling follows US Dollar’s footprints
- The Pound Sterling trades in a tight range slightly above 1.2600 as investors look for fresh cues about when the Bank of England will start reducing interest rates. The market expectations for the BoE pivoting to rate cuts have come forward to the June meeting as the central bank was seen as slightly dovish in its latest monetary policy statement.
- The BoE sounded dovish as none of the policymakers voted for a rate hike. This indicates that BoE policymakers see current interest rates as restrictive. Policymakers do not see more interest rate hikes appropriate when they are worried that further policy tightening could dampen the economic outlook or they see progress in inflation declining to the 2% target.
- In addition, BoE Governor Andrew Bailey said in its latest monetary policy statement that market expectations for two or three rate cuts this year are “appropriate,” boosting expectations for the BoE to cut interest rates from June.
- On the economic front, investors will focus on the United Kingdom’s S&P Global/CIPS Manufacturing PMI final data for March, which will be published on Tuesday. The factory data is forecasted to have remained unchanged from its preliminary reading of 49.9, which came in marginally below the 50.0 threshold that separates expansion from contraction. Investors will keenly focus on the agency’s commentary on businesses’ expectations for the domestic and global demand outlook.
- Meanwhile, the appeal for risk-perceived assets is quite upbeat as S&P 500 futures are positive. Market sentiment has turned cheerful as expectations for the Federal Reserve to begin to reduce interest rates from the June meeting have recently increased.
- In today’s session, investors will focus on the United States ISM Manufacturing PMI for March, which will be published at 14:00 GMT. The PMI is estimated to increase to 48.4 from 47.8 in February.
Technical Analysis: Pound Sterling consolidates around 1.2600
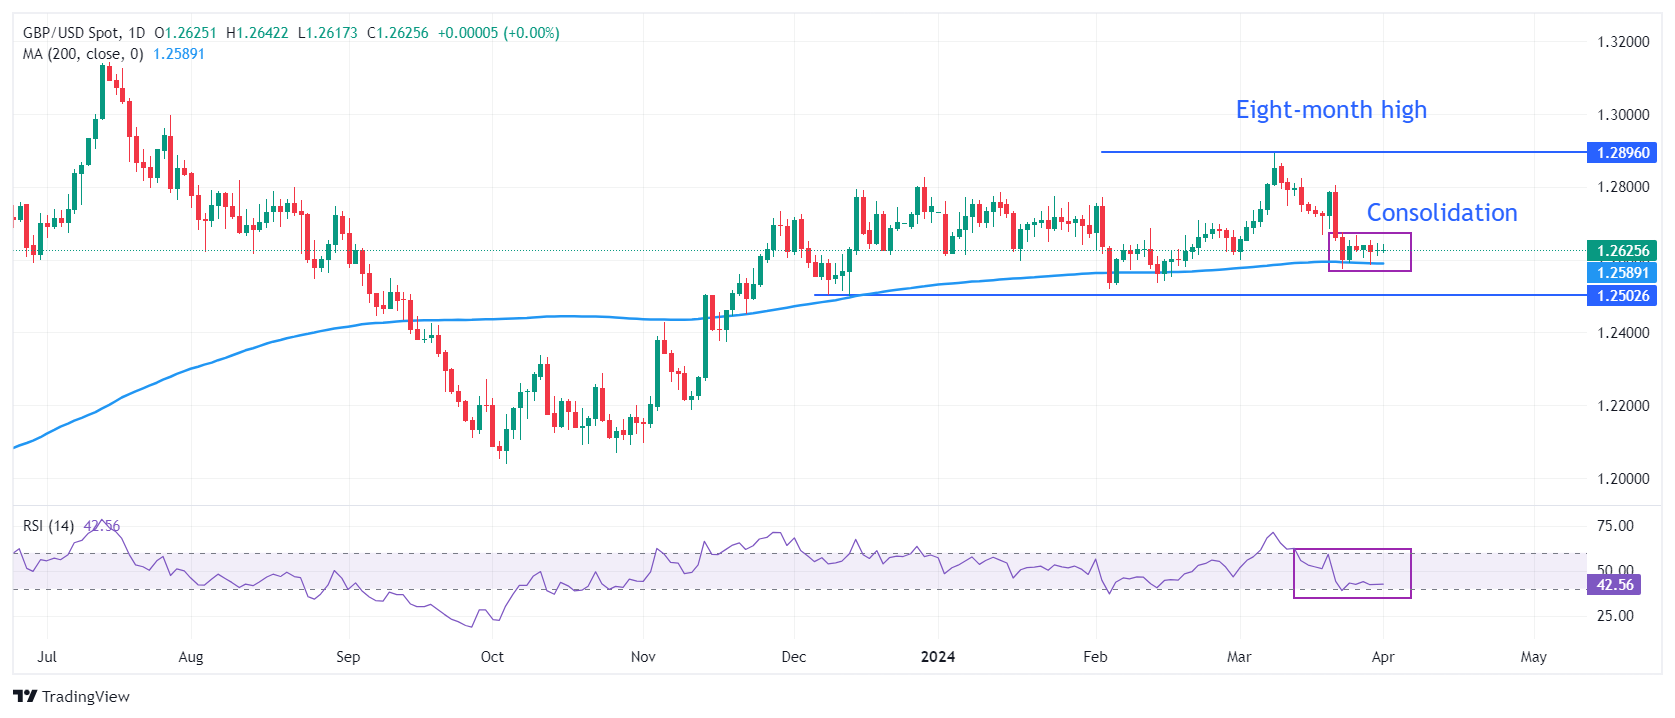
The Pound Sterling trades back and forth above 1.2600 against the US Dollar. The GBP/USD pair is expected to remain sideways as investors await a fresh trigger for the interest rate guidance. The Cable has been trading in the 1.2575-1.2675 range for the past six trading sessions. The 200-day Exponential Moving Average (EMA) near 1.2590 provides support to the Pound Sterling bulls.
On a broader time frame, the horizontal support from December 8 low at 1.2500 would provide further cushion to the Pound Sterling. Meanwhile, the upside is expected to remain limited near an eight-month high of around 1.2900.
The 14-period Relative Strength Index (RSI) hovers near 40.00. If it dips below this level, bearish momentum will trigger.
Pound Sterling FAQs
The Pound Sterling (GBP) is the oldest currency in the world (886 AD) and the official currency of the United Kingdom. It is the fourth most traded unit for foreign exchange (FX) in the world, accounting for 12% of all transactions, averaging $630 billion a day, according to 2022 data. Its key trading pairs are GBP/USD, aka ‘Cable’, which accounts for 11% of FX, GBP/JPY, or the ‘Dragon’ as it is known by traders (3%), and EUR/GBP (2%). The Pound Sterling is issued by the Bank of England (BoE).
The single most important factor influencing the value of the Pound Sterling is monetary policy decided by the Bank of England. The BoE bases its decisions on whether it has achieved its primary goal of “price stability” – a steady inflation rate of around 2%. Its primary tool for achieving this is the adjustment of interest rates. When inflation is too high, the BoE will try to rein it in by raising interest rates, making it more expensive for people and businesses to access credit. This is generally positive for GBP, as higher interest rates make the UK a more attractive place for global investors to park their money. When inflation falls too low it is a sign economic growth is slowing. In this scenario, the BoE will consider lowering interest rates to cheapen credit so businesses will borrow more to invest in growth-generating projects.
Data releases gauge the health of the economy and can impact the value of the Pound Sterling. Indicators such as GDP, Manufacturing and Services PMIs, and employment can all influence the direction of the GBP. A strong economy is good for Sterling. Not only does it attract more foreign investment but it may encourage the BoE to put up interest rates, which will directly strengthen GBP. Otherwise, if economic data is weak, the Pound Sterling is likely to fall.
Another significant data release for the Pound Sterling is the Trade Balance. This indicator measures the difference between what a country earns from its exports and what it spends on imports over a given period. If a country produces highly sought-after exports, its currency will benefit purely from the extra demand created from foreign buyers seeking to purchase these goods. Therefore, a positive net Trade Balance strengthens a currency and vice versa for a negative balance.
Here is what you need to know on Monday, April 1:
Although the action in foreign exchange markets remain subdued on Easter Monday, Gold gathers bullish momentum following the long weekend. The US economic docket will feature February Construction Spending data and the ISM Manufacturing PMI report for March later in the day. The Bank of Canada will publish its Business Outlook Survey.
The data published by the US Bureau of Economic Analysis on Easter Friday showed that the Personal Consumption Expenditures (PCE) Price Index and the core PCE Price Index both rose 0.3% on a monthly basis in February. While participating in a discussion at the Macroeconomics and Monetary Policy Conference in San Francisco late on Friday, Federal Reserve Chairman Jerome Powell said that the US economy was strong without question and added that the latest core inflation numbers showed "real progress." The US Dollar Index stays in a consolidation phase near 104.50 in the European morning after closing the previous week marginally higher.
US Dollar price in the last 7 days
The table below shows the percentage change of US Dollar (USD) against listed major currencies in the last 7 days. US Dollar was the strongest against the Swiss Franc.
| USD | EUR | GBP | CAD | AUD | JPY | NZD | CHF | |
| USD | 0.19% | -0.20% | -0.60% | -0.15% | 0.04% | 0.10% | 0.40% | |
| EUR | -0.18% | -0.39% | -0.79% | -0.33% | -0.16% | -0.04% | 0.21% | |
| GBP | 0.19% | 0.38% | -0.40% | 0.07% | 0.22% | 0.35% | 0.59% | |
| CAD | 0.59% | 0.78% | 0.39% | 0.46% | 0.62% | 0.75% | 0.98% | |
| AUD | 0.15% | 0.33% | -0.05% | -0.45% | 0.17% | 0.25% | 0.54% | |
| JPY | -0.03% | 0.17% | -0.14% | -0.62% | -0.16% | 0.09% | 0.37% | |
| NZD | -0.16% | 0.08% | -0.30% | -0.70% | -0.26% | -0.09% | 0.28% | |
| CHF | -0.40% | -0.21% | -0.60% | -1.00% | -0.53% | -0.36% | -0.24% |
The heat map shows percentage changes of major currencies against each other. The base currency is picked from the left column, while the quote currency is picked from the top row. For example, if you pick the Euro from the left column and move along the horizontal line to the Japanese Yen, the percentage change displayed in the box will represent EUR (base)/JPY (quote).
After rising nearly 3% in the previous week, Gold extended its rally at the beginning of the week and reached a new all-time high above $2,260. In the meantime, the benchmark 10-year US Treasury bond yield struggles to gain traction and stays near 4.2%, allowing XAU/USD to continue to stretch higher. Following Powell's comments and PCE inflation data, the CME FedWatch Tool shows that investors are pricing in a nearly 70% probability that the Fed will lower the policy rate by 25 basis points in June.
Gold price stands tall near record high as US PCE data reaffirms June Fed rate cut bets.
EUR/USD closed flat on Friday and started the new week in a quiet manner. The pair was last seen fluctuating in a narrow channel slightly below 1.0800.
GBP/USD fell about 1% for the second consecutive time last week but stabilized above 1.2600.
USD/JPY continues to move sideways below 151.50 early Monday. Japanese Finance Minister Shunichi Suzuki offered some verbal intervention earlier in the day, saying that the speculative moves are seen behind the recent weak Japanese Yen and added that he will not rule out any steps to respond to disorderly foreign exchange moves.
Gold FAQs
Gold has played a key role in human’s history as it has been widely used as a store of value and medium of exchange. Currently, apart from its shine and usage for jewelry, the precious metal is widely seen as a safe-haven asset, meaning that it is considered a good investment during turbulent times. Gold is also widely seen as a hedge against inflation and against depreciating currencies as it doesn’t rely on any specific issuer or government.
Central banks are the biggest Gold holders. In their aim to support their currencies in turbulent times, central banks tend to diversify their reserves and buy Gold to improve the perceived strength of the economy and the currency. High Gold reserves can be a source of trust for a country’s solvency. Central banks added 1,136 tonnes of Gold worth around $70 billion to their reserves in 2022, according to data from the World Gold Council. This is the highest yearly purchase since records began. Central banks from emerging economies such as China, India and Turkey are quickly increasing their Gold reserves.
Gold has an inverse correlation with the US Dollar and US Treasuries, which are both major reserve and safe-haven assets. When the Dollar depreciates, Gold tends to rise, enabling investors and central banks to diversify their assets in turbulent times. Gold is also inversely correlated with risk assets. A rally in the stock market tends to weaken Gold price, while sell-offs in riskier markets tend to favor the precious metal.
The price can move due to a wide range of factors. Geopolitical instability or fears of a deep recession can quickly make Gold price escalate due to its safe-haven status. As a yield-less asset, Gold tends to rise with lower interest rates, while higher cost of money usually weighs down on the yellow metal. Still, most moves depend on how the US Dollar (USD) behaves as the asset is priced in dollars (XAU/USD). A strong Dollar tends to keep the price of Gold controlled, whereas a weaker Dollar is likely to push Gold prices up.
- EUR/GBP edges lower on dovish comments made by ECB members.
- ECB’s Yannis Stournaras hinted four rate cuts, amounting to a reduction of 100 bps, could take place in 2024.
- The Bank of England could initiate three quarter-point rate reductions in 2024.
EUR/GBP retraces its gains registered in the previous session, hovering around 0.8550 during the early European hours on Monday. European Central Bank (ECB) Governing Council member Yannis Stournaras suggested on Sunday that a total of four interest rate cuts could occur in 2024, resulting in a total reduction of 100 basis points (bps) by year-end. This has added pressure to undermine the EUR/GBP cross.
However, the anticipation of the Bank of England (BoE) initiating three quarter-point rate reductions in 2024 could continue to exert pressure on the GBP. Weak economic data indicating that the UK economy slipped into recession in the second half of 2023 has contributed to limiting this retracement. BoE Governor Andrew Bailey's statement hinting at potential interest rate cuts in future policy meetings has further weighed on the Pound Sterling (GBP).
With a dearth of high-impact data expected from the United Kingdom (UK) throughout the week, traders are anticipated to assess the UK economic landscape by closely observing indicators such as Nationwide Housing Prices, S&P Global PMI, and Halifax House Prices data, which are scheduled for release during the week.
ECB policymaker Robert Holzmann stated that interest rate cuts are likely to come, but it will depend on what wage and price developments look like by June. Furthermore, attention will be drawn to the German Consumer Price Index (CPI) slated for release on Tuesday, and the Eurozone Harmonized Index of Consumer Prices data, which will be eyed on Wednesday.
- USD/CHF consolidates in a narrow trading range near 0.9015 on the softer USD on Monday.
- The US Core PCE figures, rose 2.8% YoY and 0.3% MoM in February, matching the market estimation.
- ING analysts expect two more rate cuts this year from the SNB, unless there is a surprise that causes inflation to grow rapidly again.
The USD/CHF pair trades with mild negative bias around 0.9015 during the early European session on Monday. The dovish comments from Federal Reserve (Fed) Chairman Jerome Powell on Friday weigh on the US Dollar (USD) and cap the upside of the USD/CHF pair. The attention is shifted to the US March ISM Manufacturing Purchasing Managers Index (PMI), due later on Monday. The market is likely to stay subdued amid the Easter Monday bank holiday in Switzerland,
The recent inflation data was in line with market expectations in February, potentially keeping the Fed on hold before it can begin cutting interest rates this year. Market pricing is in line with Fed projections for three rate cuts, according to the CME Group’s FedWatch Tool. On Friday, the US Bureau of Economic Analysis reported that the Personal Consumption Expenditures Price Index (PCE) rose 2.5% YoY in February, in line with the market consensus. Meanwhile, the monthly PCE figure increased by 0.4% MoM in the same month, softer than expected. The Fed’s preferred inflation measure, Core PCE, rose 2.8% YoY and 0.3% MoM in February, matching the market estimation.
On the Swiss front, the Swiss National Bank (SNB) decided to cut the benchmark interest rate by 25 basis points (bps) to 1.5% on March 21. The SNB statement noted that the easing of monetary policy has been made possible because the battle against inflation over the past two and a half years has been effective. ING analysts expect two more rate cuts this year from the SNB, unless there is a surprise in the international economic environment that causes inflationary pressures to grow rapidly again.
The Swiss Consumer Price Index will be due on Thursday, which is expected to show an increase of 1.4% in March. If the Swiss CPI inflation data came in softer than expected, this could exert some selling pressure on the Swiss Franc (CHF). On Friday, investors will turn their attention to the US employment data, including the Nonfarm Payrolls (NFP), Unemployment Rate, and Average Hourly Earnings for March.
- GBP/USD trades in positive territory around 1.2628 in Monday’s early European session.
- The pair keeps the bearish outlook below the key EMA; RSI indicator lies below the 50 midlines.
- The first upside barrier is seen in the 1.2640–1.2645 region; 1.2610 acts as an initial support level.
The GBP/USD pair holds positive ground near 1.2628, snapping the two-day losing streak on Monday. The modest recovery of the major pair is backed by the dovish comments from Federal Reserve (Fed) Chairman Jerome Powell. The Fed’s Powell stated on Friday that recent US inflation data was in line with expectations and that the Fed's goal for the interest rate this year remained unchanged. The US central bank maintains projections of three rate cuts this year, and traders anticipate the first rate cuts will begin in the June meeting.
According to the four-hour chart, GBP/USD maintains the bearish outlook unchanged as the major pair is below the key 50-period and 100-period Exponential Moving Average (EMA) on the four-hour chart. Additionally, the downward momentum is supported by the Relative Strength Index (RSI), which lies below the 50 midlines, suggesting the path of least resistance level is to the downside.
The first upside target for GBP/USD is seen near the confluence of the upper boundary of the Bollinger Band and the 50-period EMA at the 1.2640–1.2645 zone. A decisive break above the mentioned level will expose the 100-period EMA at 1.2671. Further north, the next hurdle is located at a high of March 18 at 1.2746, and finally the 1.2800 psychological level.
On the flip side, the lower limit of the Bollinger Band at 1.2610 acts as an initial support level for the major pair. Any follow-through selling will see a rally to a low of March 22 at 1.2575. The contention level to watch is a low of February 14 at 1.2535, and finally at the 1.2500 round figure.
GBP/USD four-hour chart
-638475480653976143.png)
- EUR/USD holds its position after trimming daily gains on Monday.
- Technical analysis suggests a possible confirmation of bearish momentum for the pair.
- A break above the 1.0800 level could lead the pair to test a 23.6% Fibonacci retracement level of 1.0818 and the nine-day EMA at 1.0820.
EUR/USD pares intraday gains, trading higher around 1.0780 during the Asian session on Monday. The pair could find the key resistance at the psychological mark of 1.0800.
A breakthrough above this barrier could lead the EUR/USD pair to explore the region around the 23.6% Fibonacci retracement level of 1.0818 and the nine-day Exponential Moving Average (EMA) at 1.0820. Further resistance lies at the major level of 1.0850, following the psychological resistance at 1.0900.
Technical analysis suggests a bearish sentiment for the EUR/USD pair. The 14-day Relative Strength Index (RSI) is positioned below the 50 mark, indicating weakness in buying momentum.
Additionally, the Moving Average Convergence Divergence (MACD) shows a divergence below the signal line and remains below the centerline. Although a lagging indicator, this alignment indicates a confirmation of the bearish momentum for the EUR/USD pair.
On the downside, immediate support appears at March’s low of 1.0767, followed by the major support at 1.0750. A break below this level could lead the EUR/USD pair to navigate the area around the psychological level of 1.0700.
EUR/USD: Daily Chart
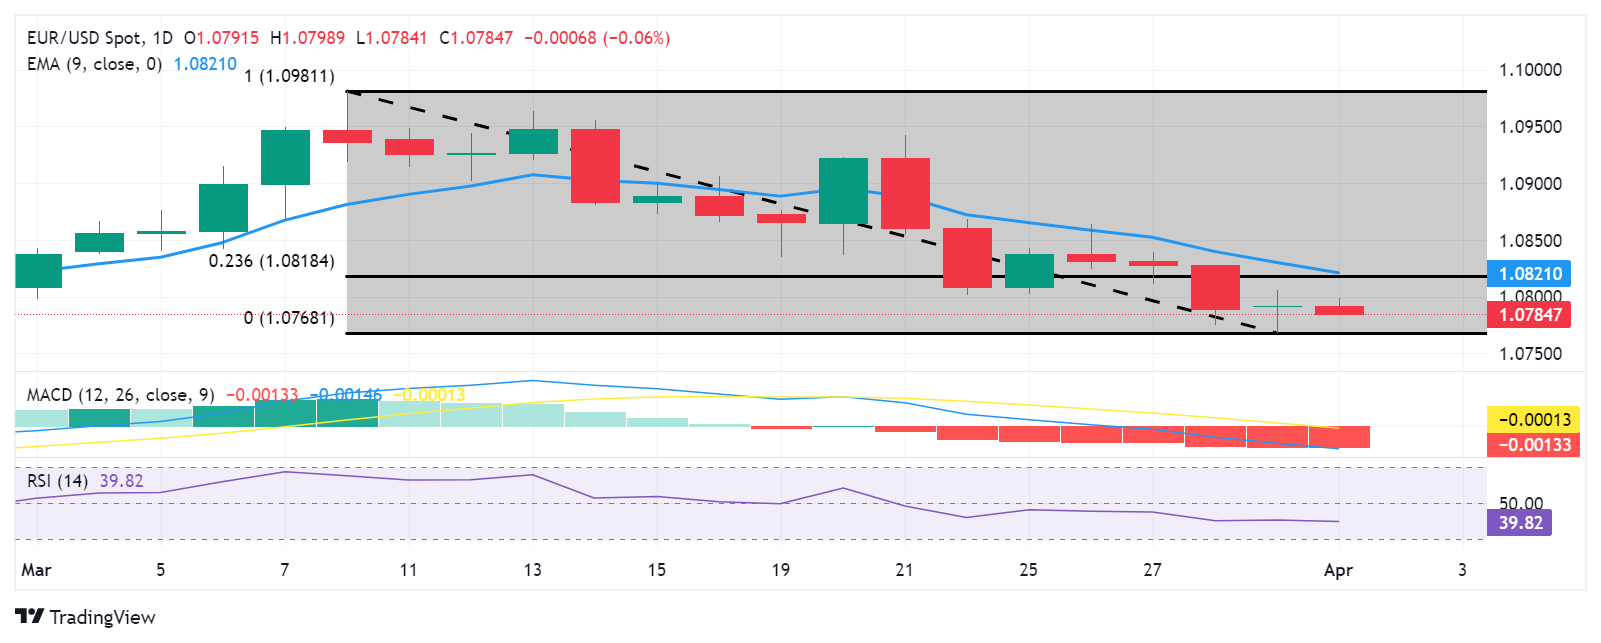
- EUR/JPY lacks any firm intraday direction and oscillates in a narrow trading band on Monday.
- The technical setup warrants some caution before positioning for a further depreciating move.
- A convincing break below the 162.75-162.70 confluence will be seen as a fresh trigger for bears.
The EUR/JPY cross struggles to capitalize on Friday's modest bounce from sub-163.00 levels or a one-and-half-week low and kicks off the new week on a subdued note. Spot prices oscillate in a narrow band through the Asian session and currently trade around the 163.25 region, nearly unchanged for the day.
Speculations that Japanese authorities will intervene in the market to address any excessive falls in the domestic currency turn out to be a key factor behind the Japanese Yen's (JPY) relative outperformance. The shared currency, on the other hand, is undermined by rising bets for a June rate cut, bolstered by recent dovish remarks by European Central Bank (ECB) officials. This, in turn, is seen acting as a headwind for the EUR/JPY cross.
From a technical perspective, the recent pullback from the highest level since August 2008 stalled last week ahead of the 163.000 mark. This is closely followed by the 162.75-162.70 confluence – comprising the 100-day and the 200-period Simple Moving Averages (SMA) on the 4-hour chart, and the 50% Fibonacci retracement level of the March rally. A convincing break below the latter will be seen as a fresh trigger for bearish traders and pave the way for deeper losses.
The EUR/JPY cross might then accelerate the slide towards the 162.20 region, or the 61.8% Fibo. level, before dropping below the 162.00 round-figure mark, towards testing the next relevant support near the 161.35-161.30 zone.
On the flip side, the immediate hurdle is pegged near the 163.75 area ahead of the 164.00 round figure. A sustained strength beyond will suggest that the corrective fall has run its course and lift the EUR/JPY cross beyond the 164.35 resistance, back towards reclaiming the 165.00 psychological mark. Some follow-through buying beyond the YTD peak, near the 165.25-165.30 region will then set the stage for the resumption of the uptrend witnessed since the beginning of this year.
EUR/JPY 4-hour chart
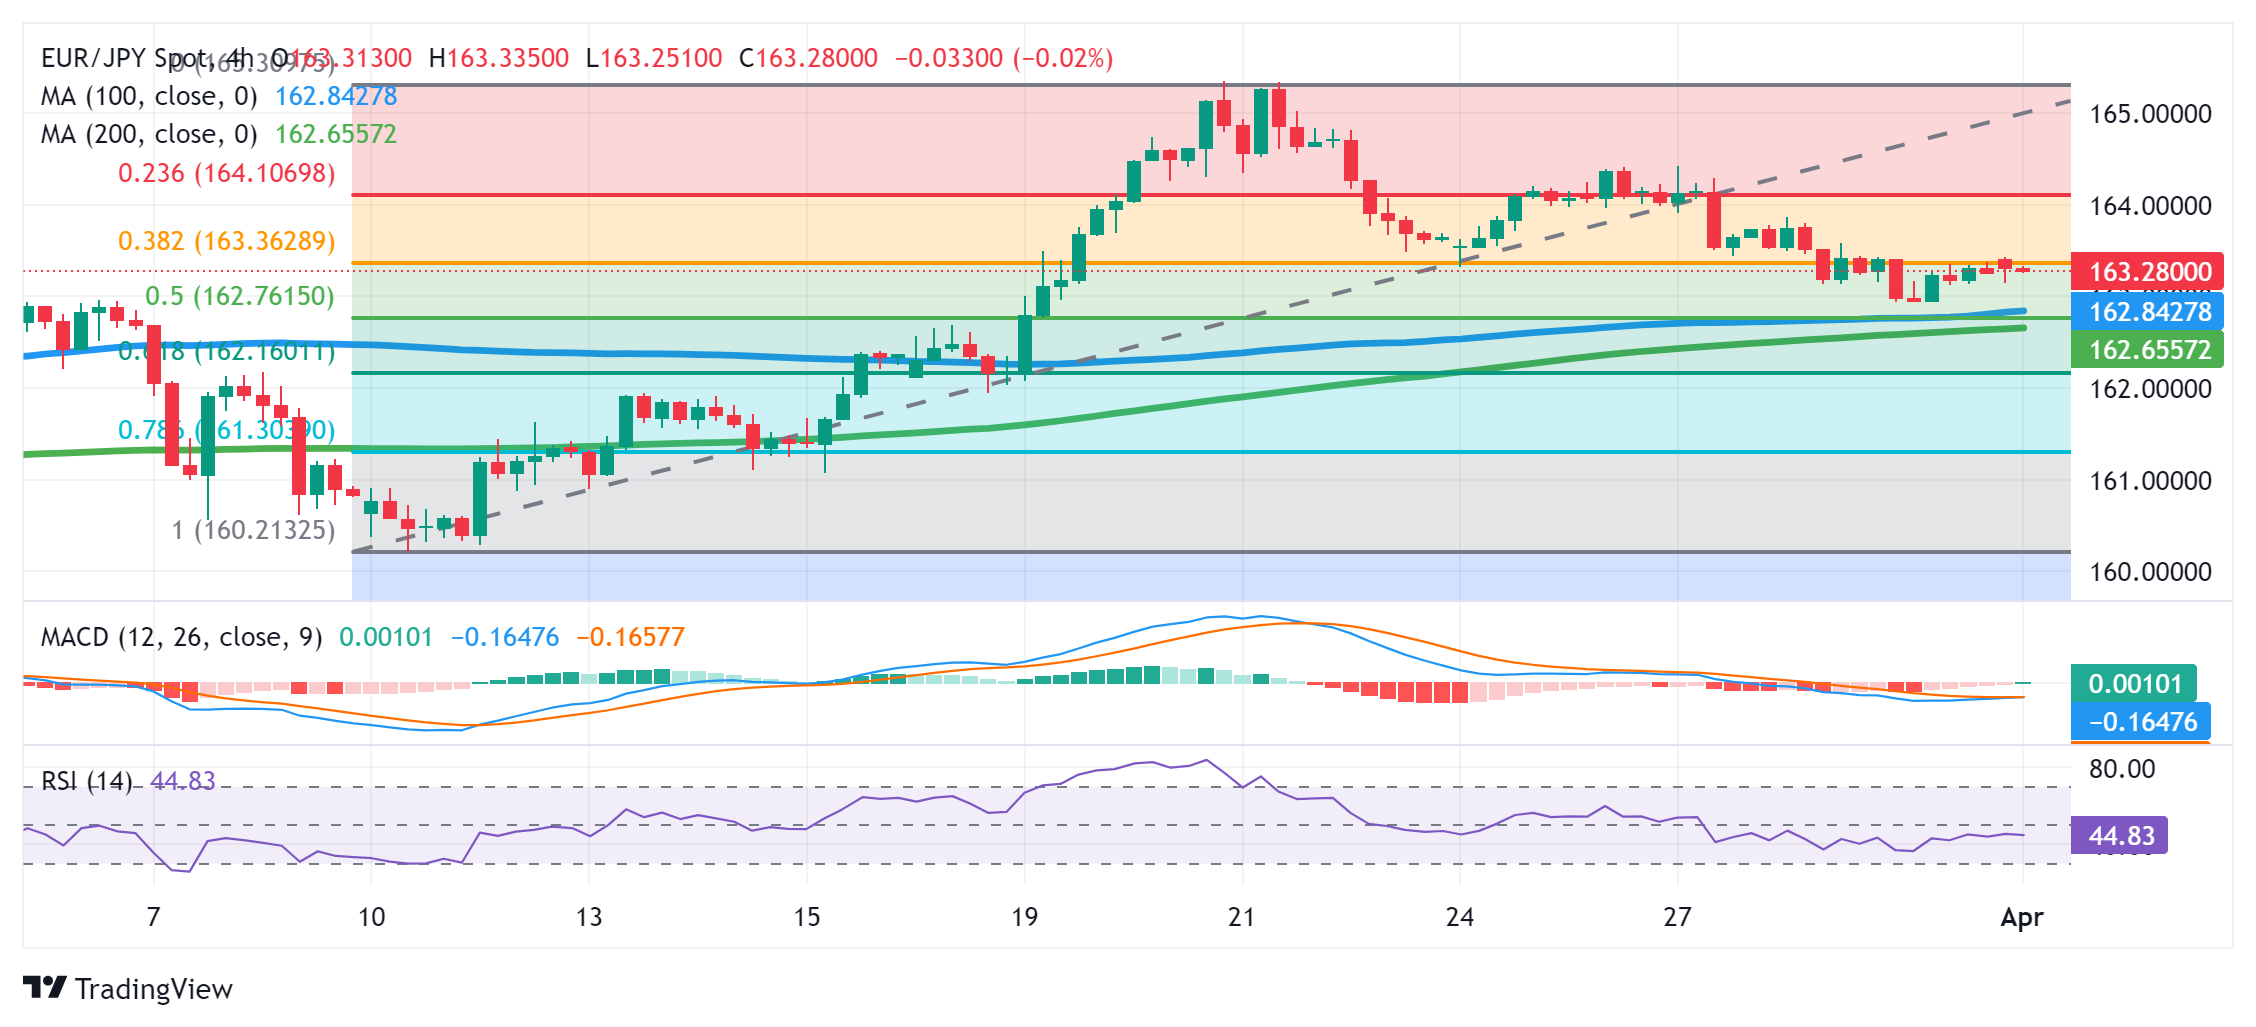
- NZD/USD gains ground as the Fed is expected to initiate rate cuts from June.
- Fed Chair Powell noted that the recent US inflation data confirms the Fed's position on rate cuts in 2024.
- NZD cheers encouraging Chinese Purchasing Managers Index PMI figures.
NZD/USD extends its gains for the second consecutive session on Monday, edging higher to near 0.5980 during the Asian trading hours. The NZD/USD pair responded positively to the dovish comments made by Federal Reserve (Fed) Chairman Jerome Powell on Friday. Powell noted that the recent Personal Consumption Expenditures Price Index (PCE) data from the United States (US) was in line with expectations, confirming the Fed's position on potential interest rate cuts for the year.
Federal Reserve Board Governor Christopher Waller has reiterated his stance that there is "no rush" to enact rate cuts, particularly in light of ongoing inflationary pressures. Furthermore, San Francisco Fed President Mary C. Daly has echoed this sentiment, emphasizing that while the Fed is prepared to adjust rates based on data, there is no immediate need to do so given the robustness of the US economy and the minimal risk of a downturn.
US Dollar Index (DXY) encounters challenges on lower US Treasury yields. DXY hovers around 104.50 with the 2-year and 10-year yields on US bond coupons standing at 4.60% and 4.19%, respectively, at the time of writing. Fed officials maintain projections of three rate cuts this year. Market participants anticipate the first of these cuts to materialize at the June meeting.
On the other side, the New Zealand Dollar (NZD) experiences downward pressure amid speculation that the Reserve Bank of New Zealand (RBNZ) may commence policy rate cuts starting from early next year.
Furthermore, RBNZ Governor Adrian Orr has indicated that the central bank is making progress towards bringing inflation back within the target range, while also suggesting that interest rates have reached their peak and rate cuts are becoming increasingly likely.
Additionally, the Kiwi Dollar (NZD) was bolstered by positive Chinese Purchasing Managers Index (PMI) figures, revealing that Chinese manufacturing activity witnessed its first expansion in six months in March.
On Monday, China’s Caixin Manufacturing PMI came in at 51.1, against the expected 51.0 and 50.9 prior. On Sunday, China's National Bureau of Statistics (NBS) Manufacturing PMI rose to 50.8 in March from 49.1 in the prior month. Additionally, the NBS Non-Manufacturing PMI increased to 53.0 in March from 51.4 in February.
Traders could turn cautious ahead of ISM Manufacturing Purchasing Managers Index (PMI) data from the United States (US) scheduled to be released later in the North American session. On Thursday, Building Permits will be released by Statistics New Zealand.
- Gold price advances to a fresh record peak amid rising bets for a June Fed rate cut.
- The risk-on mood and a modest USD uptick do little to hinder the strong move up.
- The overbought RSI on the daily chart warrants some caution for aggressive bulls.
Gold price (XAU/USD) scales higher for the fifth successive day on Monday and touches a fresh record high, beyond the $2,250 level during the Asian session. The US Personal Consumption Expenditures (PCE) Price Index released on Friday indicated that inflation increased moderately in February and reaffirmed bets that the Federal Reserve (Fed) will begin its rate-cutting cycle in June. This, in turn, is seen as a key factor benefitting the non-yielding yellow metal. Apart from this, geopolitical risks stemming from the protracted Russia-Ukraine war and conflicts in the Middle East lend additional support to the safe-haven commodity.
The aforementioned supporting factors, to a larger extent, overshadow the prevalent risk-on mood, which tends to undermine the Gold price. Even the emergence of some US Dollar (USD) dip buying does little to dent the underlying strong bullish tone surrounding the XAU/USD. This, in turn, validates Friday's breakout through the previous all-time peak, around the $2,223 area, and suggests that the path of least resistance for the precious metal is to the upside. Traders now look to the release of the US ISM Manufacturing PMI for some impetus, though the focus remains glued to the US monthly jobs data, or the NFP report on Friday.
Daily Digest Market Movers: Gold price continues to draw support from June Fed rate cut bets
- The crucial US inflation data released on Friday keeps the door open for a June interest rate cut from the Federal Reserve and continues to drive flows towards the non-yielding Gold price.
- The US Bureau of Economic Analysis reported on Friday that the Personal Consumption Expenditures (PCE) Price Index rose 0.3% in February, and the yearly rate edged up to 2.5% from 2.4%.
- Excluding volatile food and energy prices, the core PCE Price Index – the Fed's preferred inflation gauge – rose by the 2.8% YoY rate as compared to January's upwardly revised reading of 2.9%.
- Following the release, Fed Chair Jerome Powell noted that the latest US inflation data is along the lines of what we would like to see, reaffirming bets for an imminent shift in the Fed's policy stance.
- According to the CME Group's FedWatch Tool, market participants are now pricing in around a 70% probability that the Fed will begin its rate-cutting cycle at the June monetary policy meeting.
- Russia escalates attacks on Ukraine’s energy and other infrastructure in response to the recent Ukrainian long-range drone strikes on oil industry assets deep inside its territory.
- Hamas says the Israeli military is committing a war crime by establishing so-called kill zones across the Gaza Strip where any approaching Palestinian may be shot and killed.
- The global risk sentiment gets a boost from upbeat Chinese data released on Sunday, showing that business activity in the manufacturing sector expanded for the first time in six months.
- This, along with a modest US Dollar uptick, might cap gains for the safe-haven precious metal as traders now look to the US ISM Manufacturing PMI for short-term impetus.
Technical Analysis: Gold price needs to consolidate before the next leg up amid overbought RSI
From a technical perspective, last week’s sustained breakout through the $2,200 mark and a subsequent strength beyond the previous record high, around the $2,223 area, was seen as a fresh trigger for bulls. This, in turn, validates the near-term positive outlook and suggests that the path of least resistance for the Gold price is to the upside. That said, the Relative Strength Index (RSI) on the daily chart is flashing overbought conditions. This makes it prudent to wait for some near-term consolidation or a modest pullback before positioning for any further appreciating move.
Nevertheless, the Gold price seems poised to climb further towards claiming the $2,300 round-figure mark. Meanwhile, any corrective pullback is more likely to attract fresh buyers near the $2,223 region. This should help limit the downside for the XAU/USD near the $2,200 mark, which should now act as a key pivotal point. A convincing break below the latter might prompt some technical selling and pave the way for some meaningful downfall in the near term.
Gold FAQs
Gold has played a key role in human’s history as it has been widely used as a store of value and medium of exchange. Currently, apart from its shine and usage for jewelry, the precious metal is widely seen as a safe-haven asset, meaning that it is considered a good investment during turbulent times. Gold is also widely seen as a hedge against inflation and against depreciating currencies as it doesn’t rely on any specific issuer or government.
Central banks are the biggest Gold holders. In their aim to support their currencies in turbulent times, central banks tend to diversify their reserves and buy Gold to improve the perceived strength of the economy and the currency. High Gold reserves can be a source of trust for a country’s solvency. Central banks added 1,136 tonnes of Gold worth around $70 billion to their reserves in 2022, according to data from the World Gold Council. This is the highest yearly purchase since records began. Central banks from emerging economies such as China, India and Turkey are quickly increasing their Gold reserves.
Gold has an inverse correlation with the US Dollar and US Treasuries, which are both major reserve and safe-haven assets. When the Dollar depreciates, Gold tends to rise, enabling investors and central banks to diversify their assets in turbulent times. Gold is also inversely correlated with risk assets. A rally in the stock market tends to weaken Gold price, while sell-offs in riskier markets tend to favor the precious metal.
The price can move due to a wide range of factors. Geopolitical instability or fears of a deep recession can quickly make Gold price escalate due to its safe-haven status. As a yield-less asset, Gold tends to rise with lower interest rates, while higher cost of money usually weighs down on the yellow metal. Still, most moves depend on how the US Dollar (USD) behaves as the asset is priced in dollars (XAU/USD). A strong Dollar tends to keep the price of Gold controlled, whereas a weaker Dollar is likely to push Gold prices up.
- Indian Rupee recovers some lost ground on Monday, despite the firmer US Dollar.
- India's growth and inflation dynamics might convince the RBI to hold rates higher for longer.
- The Indian HSBC Manufacturing PMI and US ISM Manufacturing PMI will be due on Monday.
Indian Rupee (INR) trades on a stronger note on Monday despite the stronger US Dollar (USD). The Reserve Bank of India (RBI) is expected to maintain a status quo on the monetary policy stance this week and is unlikely to change before the August 2024 MPC review until there is visibility on the monsoon turnout, the sustenance of the growth momentum and the US Federal Reserve’s (Fed) rate decisions," said Aditi Nayar, chief economist, Icra.
India’s foreign capital inflows have been strong, and the country's economic momentum is estimated to continue. While Fed officials hinted that benchmark rates would be cut in the coming months, India's growth and inflation dynamics suggest that the RBI may hold rates high for longer. This, in turn, might provide some support to the INR and create a headwind for the USD/INR pair.
The Indian HSBC Manufacturing Purchasing Managers Index (PMI) data will be published on Monday, which is estimated to remain steady at 59.2 in March. Also, the US ISM Manufacturing PMI will be released later in the day. Moving on, the RBI interest rate decision and the US March Nonfarm Payrolls, due on Friday, will be the highlights for this week.
Daily digest market movers: Indian Rupee remains strong amid global factors
- The Reserve Bank of India (RBI) Monetary Policy Committee (MPC) is expected to keep the repo rate unchanged at 6.50% in the first policy review of 2024-25 on Friday, according to the ET poll.
- In FY25, the inclusion of India's sovereign bonds in JPMorgan's Government Bond Index-Emerging Markets (GBI-EM) index could bring in $30 billion in foreign inflows into India. This is expected to contribute to a rise in the Indian Rupee versus the US Dollar.
- The INR has depreciated 1.4% so far this financial year due to a weakening Chinese Yuan, excessive USD shortage in the system, higher US Dollar Index (DXY), and higher crude prices, as per Bloomberg data.
- The US Personal Consumption Expenditures Price Index (PCE) climbed 2.5% YoY in February, in line with the market consensus. The monthly PCE figure came in worse than expected, rising 0.4% MoM in the same month.
- The US Core PCE, the Fed’s preferred inflation measure, rose 2.8% YoY and 0.3% MoM in February, aligning with the market expectation.
- Investors have priced in nearly 68.5% odds of a first Fed rate cut in June, down from nearly 75% last week, according to the CME FedWatch Tool.
Technical analysis: USD/INR keeps the bullish vibe in the longer term
Indian Rupee trades firmly on the day. The positive outlook of USD/INR remains intact in the longer term since the pair rose above a nearly four-month-old descending trend channel last week.
In the near term, USD/INR holds above the key 100-day Exponential Moving Average (EMA) on the daily chart, with the 14-day Relative Strength Index lying above the 50 midline. This suggests the upward momentum of the pair and the further upside looks favorable.
The first upside barrier for USD/INR is seen at an all-time high of 83.49. A break above this level will see a rally to 84.00 (round figure). On the flip side, a high of March 21 at 83.20 acts as an initial support level for the pair, followed by 83.00 (psychological level, the 100-day EMA). Any follow-through selling below 83.00 could encourage Dollar bears to charge and see a drop to a low of March 14 at 82.80.
US Dollar price today
The table below shows the percentage change of US Dollar (USD) against listed major currencies today. US Dollar was the strongest against the Australian Dollar.
| USD | EUR | GBP | CAD | AUD | JPY | NZD | CHF | |
| USD | 0.03% | 0.02% | 0.03% | 0.12% | -0.05% | 0.07% | -0.02% | |
| EUR | -0.03% | -0.01% | 0.01% | 0.10% | -0.08% | 0.02% | -0.05% | |
| GBP | -0.02% | 0.01% | 0.01% | 0.11% | -0.08% | 0.05% | -0.05% | |
| CAD | -0.03% | 0.00% | -0.02% | 0.09% | -0.09% | 0.02% | -0.06% | |
| AUD | -0.12% | -0.09% | -0.10% | -0.10% | -0.18% | -0.07% | -0.13% | |
| JPY | 0.05% | 0.10% | 0.06% | 0.10% | 0.23% | 0.11% | 0.03% | |
| NZD | -0.08% | -0.03% | -0.04% | -0.01% | 0.08% | -0.11% | -0.09% | |
| CHF | 0.02% | 0.05% | 0.05% | 0.06% | 0.16% | -0.03% | 0.09% |
The heat map shows percentage changes of major currencies against each other. The base currency is picked from the left column, while the quote currency is picked from the top row. For example, if you pick the Euro from the left column and move along the horizontal line to the Japanese Yen, the percentage change displayed in the box will represent EUR (base)/JPY (quote).
Indian Rupee FAQs
The Indian Rupee (INR) is one of the most sensitive currencies to external factors. The price of Crude Oil (the country is highly dependent on imported Oil), the value of the US Dollar – most trade is conducted in USD – and the level of foreign investment, are all influential. Direct intervention by the Reserve Bank of India (RBI) in FX markets to keep the exchange rate stable, as well as the level of interest rates set by the RBI, are further major influencing factors on the Rupee.
The Reserve Bank of India (RBI) actively intervenes in forex markets to maintain a stable exchange rate, to help facilitate trade. In addition, the RBI tries to maintain the inflation rate at its 4% target by adjusting interest rates. Higher interest rates usually strengthen the Rupee. This is due to the role of the ‘carry trade’ in which investors borrow in countries with lower interest rates so as to place their money in countries’ offering relatively higher interest rates and profit from the difference.
Macroeconomic factors that influence the value of the Rupee include inflation, interest rates, the economic growth rate (GDP), the balance of trade, and inflows from foreign investment. A higher growth rate can lead to more overseas investment, pushing up demand for the Rupee. A less negative balance of trade will eventually lead to a stronger Rupee. Higher interest rates, especially real rates (interest rates less inflation) are also positive for the Rupee. A risk-on environment can lead to greater inflows of Foreign Direct and Indirect Investment (FDI and FII), which also benefit the Rupee.
Higher inflation, particularly, if it is comparatively higher than India’s peers, is generally negative for the currency as it reflects devaluation through oversupply. Inflation also increases the cost of exports, leading to more Rupees being sold to purchase foreign imports, which is Rupee-negative. At the same time, higher inflation usually leads to the Reserve Bank of India (RBI) raising interest rates and this can be positive for the Rupee, due to increased demand from international investors. The opposite effect is true of lower inflation.
- WTI oil price extends its winning streak due to the likelihood of OPEC+ retaining output policies.
- Ukrainian drone stacks have rendered offline nearly 1 million bpd of Russian Crude processing capacity.
- Crude oil demand could be enhanced due to the recent expansion in Chinese manufacturing activity.
West Texas Intermediate (WTI) oil price is on an upward trajectory for the third successive session, with the commodity trading around $83.10 per barrel during Asian trading hours on Monday. The sustained increase in Crude oil prices is attributed to anticipated supply constraints stemming from production cuts by the Organization of the Petroleum Exporting Countries and their allies (OPEC+).
Investors are eagerly awaiting the OPEC+’s joint ministerial meeting scheduled for this week. It is anticipated that during the meeting, OPEC+ will assess market fundamentals and members' adherence to production targets, with widespread expectations for the retention of current output policies.
Furthermore, Russian Deputy Prime Minister Alexander Novak emphasized on Friday that oil companies should prioritize reducing output over exports in the second quarter to align with OPEC+ production targets. He also stated that there is no necessity for Russia to impose export bans on diesel to address escalating prices and potential fuel shortages following drone attacks that disrupted refining capacity.
Ukrainian drone strikes have crippled numerous Russian refineries, leading to a decline in Russia's fuel exports. These attacks have rendered nearly 1 million barrels per day of Russian Crude processing capacity inactive.
Official data revealed that Chinese manufacturing activity witnessed its first expansion in six months in March, enhancing the outlook for Crude oil demand in the world’s leading Crude importer. Analysts at Goldman Sachs noted that oil demand in Europe exceeded expectations, with a year-on-year increase of 100,000 barrels per day (bpd) recorded in February, contrasting with their earlier projection of a 200,000 bpd decline for 2024.
- USD/CAD drops to over a one-week low and is pressured by a combination of factors.
- Bullish Oil prices underpin the Loonie and weigh on the pair amid a softer Greenback.
- The US PCE Price Index keeps the June Fed rate cut on the table and weighs on the buck.
The USD/CAD pair extends its recent pullback from the 1.3610-1.3615 supply zone, or the YTD peak and remains under some selling pressure for the sixth successive day on Monday. The downfall, however, stalls ahead of the 1.3500 psychological mark, allowing spot prices to recover a few pips from over a one-week low touched during the Asian session.
Crude Oil prices advance to a five-month peak in the wake of concerns about tighter global supply – fuelled by OPEC+ cuts, attacks on Russian refineries and upbeat Chinese manufacturing data. This, in turn, underpins the commodity-linked Loonie, which, along with a modest US Dollar (USD) weakness, is seen exerting some downward pressure on the USD/CAD pair. In fact, OPEC+ pledged to extend production cuts to the end of June.
Meanwhile, Russian Deputy Prime Minister Alexander Novak said on Friday that its Oil companies will focus on reducing output rather than exports in the second quarter. Moreover, Ukrainian drone attacks knocked out several Russian refineries, which is expected to reduce Russia's Oil exports. Furthermore, a pickup in China's manufacturing activity for the first time in six months adds to the optimism about a rise in fuel demand.
The US Dollar (USD), on the other hand, struggles to lure buyers amid expectations that the Federal Reserve (Fed) will begin its rate-cutting cycle in June, bolstered by the lack of any big surprises from the US Personal Consumption Expenditures (PCE) Price Index on Friday. This, along with the prevalent risk-on environment, is seen weighing on the safe-haven buck and contributing to the offered tone surrounding the USD/CAD pair.
Market participants now look forward to the release of the US ISM Manufacturing PMI for some impetus ahead of the Bank of Canada (BoC) Business Outlook Survey. This, along with Oil price dynamics, should contribute to producing short-term trading opportunities around the USD/CAD pair. The focus, however, will remain glued to the closely-watched monthly employment figures from the US and Canada, due on Friday.
- GBP/USD remains in the positive territory after trimming daily gains on Monday.
- US ISM Manufacturing PMI is expected to improve to 48.4 in March, from 47.8 prior.
- GBP could face a struggle due to the speculation of the BoE initiating three quarter-point rate cuts in 2024.
GBP/USD trims intraday gains, remaining higher around 1.2530 during the Asian hours on Monday. US Dollar (USD) recovers its daily losses on risk aversion ahead of ISM Manufacturing Purchasing Managers Index (PMI) data from the United States (US) scheduled to be released later in the North American session, capping the advance of the GBP/USD pair.
However, the US Dollar Index (DXY) encountered difficulties following dovish comments from Federal Reserve (Fed) Chairman Jerome Powell on Friday. Powell remarked that recent US inflation data was in line with expectations, supporting the Fed's position on potential interest rate cuts throughout 2024. Fed officials maintain projections of three rate cuts this year. Market participants anticipate the first of these cuts to materialize at the June meeting.
In February, US Core Personal Consumption Expenditures (PCE) increased by 0.3% month-over-month (MoM), aligning with market expectations and slightly lower than January's 0.5%. The annual index rose by 2.8%, meeting expectations and slightly lower than the previous increase of 2.9%. US Headline PCE (MoM) saw a 0.3% increase, slightly below expectations and lower than the previous month's 0.4% rise. Year-over-year PCE increased by 2.5%, meeting expectations.
On the other side, the anticipation of the Bank of England (BoE) initiating three quarter-point rate reductions in 2024 is putting pressure on the Pound Sterling (GBP). This pressure is further compounded by recent weaker economic data, indicating that the UK economy slipped into recession in the latter half of 2023. BoE Governor Andrew Bailey's statement suggesting that interest rate cuts will be considered in future policy meetings has added to this pressure.
With limited high-impact data forthcoming from the United Kingdom (UK), traders are likely to gauge the UK economic landscape by closely monitoring indicators such as Nationwide Housing Prices, S&P Global PMI, and Halifax House Prices data set to be released during the week.
- The Japanese Yen continues to be undermined by the BoJ’s cautious stance and the risk-on mood.
- Intervention fears limit further JPY losses and cap the USD/JPY pair amid a modest USD weakness.
- The US PCE Price Index keeps a June rate cut by the Fed on the table and weighs on the Greenback.
The Japanese Yen (JPY) kicks off the new week on a softer note against its American counterpart, albeit lacking follow-through and remains confined in a familiar range held over the past two weeks or so. The Bank of Japan's (BoJ) cautious approach towards further policy tightening, along with the prevalent risk-on mood, continues to undermine the safe-haven JPY. That said, signs of a potential government intervention in the market to address any excessive falls in the domestic currency hold back the JPY bears from placing aggressive bets.
Meanwhile, the US Personal Consumption Expenditures (PCE) Price Index released on Friday did little to alter expectations that the Federal Reserve (Fed) will begin cutting interest rates at the June policy meeting. This keeps the US Dollar (USD) bulls on the defensive and contributes to capping the upside for the USD/JPY pair. Traders now look to important US macro data scheduled at the beginning of a new week, starting with the ISM Manufacturing PMI for some impetus, though the focus remains on the Nonfarm Payrolls (NFP) on Friday.
Daily Digest Market Movers: Japanese Yen struggles for a firm near-term direction amid mixed fundamental cues
- The Bank of Japan struck a dovish tone at the end of the March meeting and stopped short of offering any guidance about future policy steps or the pace of policy normalization, which, in turn, is seen weighing on the Japanese Yen.
- An official survey showed that China's manufacturing activity expanded for the first time in six months in March, providing an additional boost to investors' confidence and contributing to the offered tone surrounding the safe-haven JPY.
- The National Bureau of Statistics reported on Sunday that China's Manufacturing PMI rose to 50.8 from 49.1 in February, while the gauge for the services sector climbed to 53, suggesting that the world’s second-largest economy is stabilizing.
- The BoJ's Tankan survey revealed on Monday that business optimism among large manufacturers eased to 11 during the first quarter from 12 in the last survey, while the index for large nonmanufacturers rose to 34 from the 30 previous.
- The au Jibun Bank Japan Manufacturing PMI contracted for the 10th consecutive month and was finalized at 48.2 in March, marking the highest level since November and indicating that the worst of the weakness had passed.
- Japan's Finance Minister Shunichi Suzuki said on Monday there were speculative moves behind the recent JPY fall, suggesting that authorities remained ready to intervene in the market to address any excessive falls in the domestic currency.
- Japanese monetary authorities reportedly made a last-minute decision to bring forward an emergency meeting to Wednesday, which was originally scheduled for Thursday, to maximise the impact of arresting sharp JPY decline.
- The US Bureau of Economic Analysis reported on Friday that the Personal Consumption Expenditures (PCE) Price Index rose 0.3% in February, slightly lower than the 0.4% estimated, while the yearly rate edged up to 2.5% from the 2.4%.
- The core PCE Price Index, which excludes volatile food and energy prices, rose 2.8% on a yearly basis as compared to January's upwardly revised reading of 2.9%, keeping a June interest rate cut from the Federal Reserve on the table.
- This, in turn, drags the US Dollar away from its highest level since February 16 touched last week and might further hold back traders from positioning for any meaningful near-term appreciating move for the USD/JPY pair.
- Traders now look forward to important US macro data scheduled for release at the start of a new month, starting with the ISM Manufacturing PMI on Monday for some impetus ahead of the key monthly jobs report on Friday.
Technical Analysis: USD/JPY seems poised to climb further; bulls await for move beyond 152.00 or multi-decade high
From a technical perspective, the range-bound price action witnessed over the past two weeks or so might still be categorized as a bullish consolidation phase against the backdrop of the recent rally from the March swing low. Moreover, oscillators on the daily chart are holding comfortably in the positive territory and have also eased from overbought conditions, suggesting that the path of least resistance for the USD/JPY pair is to the upside. That said, it will still be prudent to wait for a move beyond a multi-decade high, around the 152.00 mark set last week, before positioning for any further gains.
On the flip side, the 151.00 round figure now seems to have emerged as an immediate strong support. Some follow-through selling below the 150.85-150.80 horizontal resistance breakpoint could expose the next relevant support near the 150.25 area. This is closely followed by the 150.00 psychological mark, which, if broken decisively, might turn the USD/JPY pair vulnerable to accelerate the corrective decline further towards the 149.35-149.30 region en route to the 149.00 mark.
Japanese Yen FAQs
The Japanese Yen (JPY) is one of the world’s most traded currencies. Its value is broadly determined by the performance of the Japanese economy, but more specifically by the Bank of Japan’s policy, the differential between Japanese and US bond yields, or risk sentiment among traders, among other factors.
One of the Bank of Japan’s mandates is currency control, so its moves are key for the Yen. The BoJ has directly intervened in currency markets sometimes, generally to lower the value of the Yen, although it refrains from doing it often due to political concerns of its main trading partners. The current BoJ ultra-loose monetary policy, based on massive stimulus to the economy, has caused the Yen to depreciate against its main currency peers. This process has exacerbated more recently due to an increasing policy divergence between the Bank of Japan and other main central banks, which have opted to increase interest rates sharply to fight decades-high levels of inflation.
The BoJ’s stance of sticking to ultra-loose monetary policy has led to a widening policy divergence with other central banks, particularly with the US Federal Reserve. This supports a widening of the differential between the 10-year US and Japanese bonds, which favors the US Dollar against the Japanese Yen.
The Japanese Yen is often seen as a safe-haven investment. This means that in times of market stress, investors are more likely to put their money in the Japanese currency due to its supposed reliability and stability. Turbulent times are likely to strengthen the Yen’s value against other currencies seen as more risky to invest in.
- EUR/USD trades in negative territory around 1.0787 on the firmer USD.
- The US Core PCE was up 0.3% MoM and 2.8% YoY, matching the market estimation.
- ECB’s Stournaras said that a total of four interest rate cuts are possible in 2024.
The EUR/USD pair trades on a weaker note near 1.0787 on the renewed US dollar (USD) demand during the early Asian session on Monday. The higher-for-longer stance from the Federal Reserve (Fed) provides some support to the Greenback and weighs on the EUR/USD pair. Meanwhile, the US Dollar Index (DXY) currently trades around 104.52, gaining 0.03% on the day.
The Commerce Department's Bureau of Economic Analysis revealed on Friday that the US Personal Consumption Expenditures (PCE) Price Index rose 0.3% MoM in February, in line with expectations. On an annual basis, February PCE inflation advanced 2.5% YoY in February. The Core PCE, excluding the volatile food and energy components, rose 0.3% MoM and 2.8% YoY in February. The data revealed an ongoing trend of inflation, which might put the Federal Reserve (Fed) on hold until it can begin cutting interest rates this year.
The US Fed left interest rates unchanged in a range between 5.25% and 5.5% for the fifth consecutive time last week, and it still expects three quarter-percentage point cuts by the end of the year. According to the CME FedWatch Tool, traders are currently pricing in around 55% odds of a first Fed rate cut in June, down from nearly 70% last week. On Friday, Fed Chairman Jerome Powell said that recent US inflation data was in line with expectations and that the Fed's goal for the interest rate this year remained unchanged.
On the other hand, European Central Bank (ECB) Governing Council member Yannis Stournaras said on Sunday that a total of four interest rate cuts is possible in 2024, with a total rate reduction of 100 basis points (bps) by year-end. Meanwhile, ECB policymaker Robert Holzmann stated that Europe could cut interest rates before the US. Holzmann added that interest rate cuts are likely to come, but it will depend on what wage and price developments look like by June. Market players will monitor the US ISM Manufacturing PMI on Monday, which is forecast to rise to 48.4 in March from 47.8 in the previous reading. On Tuesday, the German Consumer Price Index (CPI) will be released.
- Australian Dollar gains ground on encouraging Chinese PMI data.
- RBA Meeting Minutes are awaited to be released on Tuesday.
- Chinese Manufacturing PMI came in at 51.1, against the expected 51.0 and 50.9 prior.
- US Dollar faces challenges after dovish remarks from Fed Chair Powell.
The Australian Dollar (AUD) retraces its recent losses on Monday, possibly bolstered by positive Chinese Purchasing Managers Index (PMI) figures. Moreover, the US Dollar (USD) faced downward pressure due to decreased US Treasury yields, lending support to the AUD/USD pair. Trading activity is anticipated to be subdued due to Easter Monday.
The Australian Dollar encountered challenges amidst weaker Consumer Inflation Expectations, possibly signaling expectations for interest rate cuts by the Reserve Bank of Australia (RBA) in late 2024. Investors are likely to closely monitor the release of the RBA Meeting Minutes scheduled for Tuesday.
The US Dollar Index (DXY) struggled on dovish remarks from the Federal Reserve (Fed) Chairman Jerome Powell on Friday. He stated that the recent US inflation data aligned with the desired trajectory, affirming the Federal Reserve's stance on interest rate cuts for the year. Personal Consumption Expenditures Price Index (PCE) data from the United States (US) met expectations in February.
Daily Digest Market Movers: Australian Dollar increases on positive Chinese PMI figures
- Australia's Consumer Inflation Expectations came in at 4.3% in March, a slight decrease from the previous increase of 4.5%.
- On Sunday, China's National Bureau of Statistics (NBS) announced that the monthly NBS Manufacturing PMI rose to 50.8 in March from 49.1 in the prior month. Additionally, the NBS Non-Manufacturing PMI increased to 53.0 in March from 51.4 in February.
- On Thursday, San Francisco Federal Reserve (Fed) President Mary C. Daly emphasized that although the Fed stands prepared to decrease rates when data supports such action, there's no need for haste as the US economy remains robust with minimal risk of weakening.
- Federal Reserve Board Governor Christopher Waller still sees 'no rush' to cut rates amid sticky inflation data.
- US Core PCE came at 0.3% (MoM) in February against January’s 0.5%, aligned with the market consensus. The annual index rose by 2.8% as expected, compared to the previous increase of 2.9%.
- US Headline PCE (MoM) increased by 0.3%, slightly lower than expected and a previous rise of 0.4%. The year-over-year PCE increased by 2.5%, as expected.
- US Gross Domestic Product Annualized expanded by 3.4% in the fourth quarter of 2023. The market expectation was to be unchanged at a 3.2% increase.
- The US Gross Domestic Product Price Index remained consistent at a 1.7% increase, as expected in Q4.
- Core Personal Consumption Expenditures (QoQ) came in at 2.0% in the fourth quarter, slightly below the expected and previous reading of 2.1%.
- US Initial Jobless Claims fell to 210K in the week ending on March 22, against the expected increase to 215K from 212K prior.
Technical Analysis: Australian Dollar rises to near 0.6530; next barrier at 21-day EMA
The Australian Dollar hovers near 0.6530 on Monday. Immediate resistance is observed near the 21-day Exponential Moving Average (EMA) at 0.6546, coinciding with a major barrier at 0.6550. A breach above this level could lead the AUD/USD pair to surpass the 38.2% Fibonacci retracement level of 0.6554, potentially leading towards the psychological level of 0.6600. On the downside, notable support lies at the psychological threshold of 0.6500, followed by March’s low at 0.6477.
AUD/USD: Daily Chart
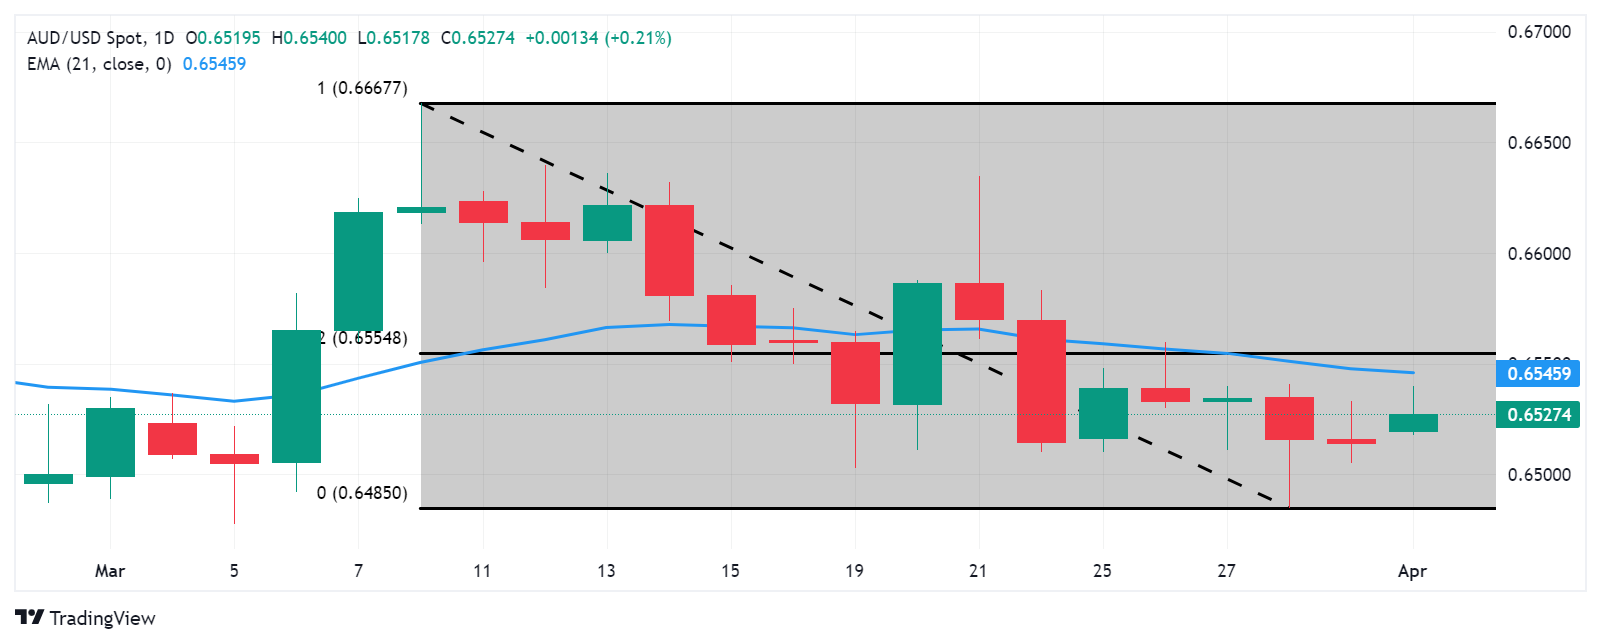
Australian Dollar price today
The table below shows the percentage change of Australian Dollar (AUD) against listed major currencies today. Australian Dollar was the strongest against the Pound Sterling.
| USD | EUR | GBP | CAD | AUD | JPY | NZD | CHF | |
| USD | 0.03% | 0.06% | 0.05% | 0.10% | -0.07% | -0.01% | 0.02% | |
| EUR | -0.01% | 0.03% | 0.04% | 0.08% | -0.06% | -0.05% | -0.02% | |
| GBP | -0.05% | -0.02% | 0.00% | 0.03% | -0.13% | -0.06% | -0.05% | |
| CAD | -0.05% | -0.02% | -0.01% | 0.05% | -0.12% | -0.07% | -0.04% | |
| AUD | -0.10% | -0.05% | -0.05% | -0.08% | -0.18% | -0.12% | -0.09% | |
| JPY | 0.06% | 0.12% | 0.10% | 0.11% | 0.17% | 0.03% | 0.08% | |
| NZD | 0.01% | 0.04% | 0.04% | 0.07% | 0.12% | -0.07% | 0.02% | |
| CHF | -0.01% | 0.03% | 0.06% | 0.05% | 0.10% | -0.08% | -0.01% |
The heat map shows percentage changes of major currencies against each other. The base currency is picked from the left column, while the quote currency is picked from the top row. For example, if you pick the Euro from the left column and move along the horizontal line to the Japanese Yen, the percentage change displayed in the box will represent EUR (base)/JPY (quote).
Australian Dollar FAQs
One of the most significant factors for the Australian Dollar (AUD) is the level of interest rates set by the Reserve Bank of Australia (RBA). Because Australia is a resource-rich country another key driver is the price of its biggest export, Iron Ore. The health of the Chinese economy, its largest trading partner, is a factor, as well as inflation in Australia, its growth rate, and Trade Balance. Market sentiment – whether investors are taking on more risky assets (risk-on) or seeking safe havens (risk-off) – is also a factor, with risk-on positive for AUD.
The Reserve Bank of Australia (RBA) influences the Australian Dollar (AUD) by setting the level of interest rates that Australian banks can lend to each other. This influences the level of interest rates in the economy as a whole. The main goal of the RBA is to maintain a stable inflation rate of 2-3% by adjusting interest rates up or down. Relatively high interest rates compared to other major central banks support the AUD, and the opposite for relatively low. The RBA can also use quantitative easing and tightening to influence credit conditions, with the former AUD-negative and the latter AUD-positive.
China is Australia’s largest trading partner so the health of the Chinese economy is a major influence on the value of the Australian Dollar (AUD). When the Chinese economy is doing well it purchases more raw materials, goods, and services from Australia, lifting demand for the AUD, and pushing up its value. The opposite is the case when the Chinese economy is not growing as fast as expected. Positive or negative surprises in Chinese growth data, therefore, often have a direct impact on the Australian Dollar and its pairs.
Iron Ore is Australia’s largest export, accounting for $118 billion a year according to data from 2021, with China as its primary destination. The price of Iron Ore, therefore, can be a driver of the Australian Dollar. Generally, if the price of Iron Ore rises, AUD also goes up, as aggregate demand for the currency increases. The opposite is the case if the price of Iron Ore falls. Higher Iron Ore prices also tend to result in a greater likelihood of a positive Trade Balance for Australia, which is also positive for the AUD.
The Trade Balance, which is the difference between what a country earns from its exports versus what it pays for its imports, is another factor that can influence the value of the Australian Dollar. If Australia produces highly sought-after exports, then its currency will gain in value purely from the surplus demand created by foreign buyers seeking to purchase its exports versus what it spends to purchase imports. Therefore, a positive net Trade Balance strengthens the AUD, with the opposite effect if the Trade Balance is negative.
China's Caixin Manufacturing Purchasing Managers' Index (PMI) edged higher to 51.1 in March, as against the expansion of 50.9 in February, according to the latest data released on Tuesday.
The reading beat the market forecast of 51.0 in the reported month.
Key highlights (via Caixin)
Production expands at most pronounced pace in ten months.
Business confidence rises to highest in just under a year.
Selling prices fall at fastest pace since last July amid lower costs.
"Both supply and demand expanded at a faster pace amid the market upturn. In March, growth in manufacturers’ output and total new orders accelerated, with the former hitting a 10-month high,” said Wang Zhe, an economist at Caixin Insight Group.
Wang added, “external demand also picked up pace thanks to the recovery in the global economy, pushing the gauge for new export orders to its highest level since February 2023.”
On Sunday, China’s National Bureau of Statistics (NBS) released the country’s official Manufacturing Purchasing Managers' Index (PMI), which jumped to 50.8 in March, compared with the 49.1 contraction reported in February and above the estimates of a 49.9 figure. The Non-Manufacturing PMI rose to 53.3 in the same period vs. February’s 51.4.
AUD/USD reaction to China’s PMI data
The uptick in the Chinese Manufacturing PMI fails to impress the Aussie Dollar, as AUD/USD clings to gains at 0.6525, at the time of writing, up 0.08% on the day.
Australian Dollar price today
The table below shows the percentage change of Australian Dollar (AUD) against listed major currencies today. Australian Dollar was the strongest against the Pound Sterling.
| USD | EUR | GBP | CAD | AUD | JPY | NZD | CHF | |
| USD | 0.03% | 0.06% | 0.05% | 0.10% | -0.06% | 0.00% | 0.02% | |
| EUR | -0.03% | 0.02% | 0.02% | 0.07% | -0.10% | -0.04% | -0.02% | |
| GBP | -0.06% | -0.03% | -0.01% | 0.04% | -0.13% | -0.06% | -0.05% | |
| CAD | -0.05% | -0.02% | 0.00% | 0.05% | -0.12% | -0.06% | -0.03% | |
| AUD | -0.10% | -0.07% | -0.04% | -0.06% | -0.17% | -0.11% | -0.09% | |
| JPY | 0.06% | 0.12% | 0.12% | 0.12% | 0.19% | 0.07% | 0.08% | |
| NZD | 0.00% | 0.03% | 0.06% | 0.06% | 0.10% | -0.07% | 0.01% | |
| CHF | -0.02% | 0.02% | 0.04% | 0.03% | 0.08% | -0.08% | -0.01% |
The heat map shows percentage changes of major currencies against each other. The base currency is picked from the left column, while the quote currency is picked from the top row. For example, if you pick the Euro from the left column and move along the horizontal line to the Japanese Yen, the percentage change displayed in the box will represent EUR (base)/JPY (quote).
On Monday, the People’s Bank of China (PBoC) set the USD/CNY central rate for the trading session ahead at 7.0938 as compared to Friday's fix of 7.0950 and 7.2191 Reuters estimates.
Japan's Prime Minister Fumio Kishida shared an understanding of foreign exchange moves with the top currency diplomat Masato Kanda. However, Kishida did not comment on specifics.
The above verbal intervention from Japanese authorities had little to no impact on the Japanese Yen's performance against its rivals. At the time of writing, USD/JPY is trading 0.02% higher on the day at 151.38.
Japanese Yen FAQs
The Japanese Yen (JPY) is one of the world’s most traded currencies. Its value is broadly determined by the performance of the Japanese economy, but more specifically by the Bank of Japan’s policy, the differential between Japanese and US bond yields, or risk sentiment among traders, among other factors.
One of the Bank of Japan’s mandates is currency control, so its moves are key for the Yen. The BoJ has directly intervened in currency markets sometimes, generally to lower the value of the Yen, although it refrains from doing it often due to political concerns of its main trading partners. The current BoJ ultra-loose monetary policy, based on massive stimulus to the economy, has caused the Yen to depreciate against its main currency peers. This process has exacerbated more recently due to an increasing policy divergence between the Bank of Japan and other main central banks, which have opted to increase interest rates sharply to fight decades-high levels of inflation.
The BoJ’s stance of sticking to ultra-loose monetary policy has led to a widening policy divergence with other central banks, particularly with the US Federal Reserve. This supports a widening of the differential between the 10-year US and Japanese bonds, which favors the US Dollar against the Japanese Yen.
The Japanese Yen is often seen as a safe-haven investment. This means that in times of market stress, investors are more likely to put their money in the Japanese currency due to its supposed reliability and stability. Turbulent times are likely to strengthen the Yen’s value against other currencies seen as more risky to invest in.
Japanese Finance Minister Shunichi Suzuki offered some verbal intervention on Monday. Suzuki said that the speculative moves are seen behind the recent weak Japanese Yen (JPY) and he will not rule out any steps to respond to disorderly foreign exchange moves.
Key quotes
“Won't comment on Forex levels.”
“Important for currencies to move in a stable manner, reflecting fundamentals.”
“Rapid FX moves are undesirable.”
“Speculative moves seen behind recent weak yen.”
“Won't rule out any steps to respond to disorderly FX moves.”
“Closely watching FX moves with a high sense of urgency.”
“Will respond fx moves appropriately.”
Market reaction
At the time of writing, USD/JPY is trading 0.01% higher on the day at 151.36.
Bank of Japan FAQs
The Bank of Japan (BoJ) is the Japanese central bank, which sets monetary policy in the country. Its mandate is to issue banknotes and carry out currency and monetary control to ensure price stability, which means an inflation target of around 2%.
The Bank of Japan has embarked in an ultra-loose monetary policy since 2013 in order to stimulate the economy and fuel inflation amid a low-inflationary environment. The bank’s policy is based on Quantitative and Qualitative Easing (QQE), or printing notes to buy assets such as government or corporate bonds to provide liquidity. In 2016, the bank doubled down on its strategy and further loosened policy by first introducing negative interest rates and then directly controlling the yield of its 10-year government bonds.
The Bank’s massive stimulus has caused the Yen to depreciate against its main currency peers. This process has exacerbated more recently due to an increasing policy divergence between the Bank of Japan and other main central banks, which have opted to increase interest rates sharply to fight decades-high levels of inflation. The BoJ’s policy of holding down rates has led to a widening differential with other currencies, dragging down the value of the Yen.
A weaker Yen and the spike in global energy prices have led to an increase in Japanese inflation, which has exceeded the BoJ’s 2% target. Still, the Bank judges that the sustainable and stable achievement of the 2% target has not yet come in sight, so any sudden change in the current policy looks unlikely.
- Gold price gains momentum for the fifth consecutive day around $2,250 in Monday’s early Asian session.
- The expectation of easing monetary policy from major central banks, and the Middle East geopolitical tension might boost the gold price.
- Investors will monitor China’s Caixin Manufacturing PMI and US ISM Manufacturing PMI on Monday.
Gold Price (XAU/USD) climbs to all-time highs of nearly $2,250 per troy ounce during the early Asian session on Monday. The yellow metal attracts some buyers amid the expectations of a Federal Reserve (Fed) pivot in the second half of 2024, the ongoing geopolitical tensions in the Middle East, and the hope for China's economic recovery.
The expectation of easing monetary policy from major central banks might boost gold prices. Financial markets have priced in 68.5% odds of a quarter-point rate cut from The US Fed by June, according to the CME Fedwatch Tool. The Fed Chairman Jerome Powell said on Friday that the recent US inflation data was "along the lines of what we would like to see," and it kept the Fed's baseline for interest rate cuts this year intact. It’s worth noting that the lower interest rates might lift the gold price as gold becomes a better investment, considering it is a non-interest-bearing asset.
On Friday, the US Personal Consumption Expenditures Price Index (PCE) rose 2.5% YoY in February, in line with expectations. The monthly figure increased by 0.4% MoM in the same month, slightly below the market consensus. Additionally, the Core PCE, which excludes volatile food and energy prices, climbed 2.8% YoY and 0.3% MoM, aligning with market expectations.
Furthermore, Hezbollah said on Sunday that it carried out seven attacks on Israeli troops and said one of its strikes targeted and destroyed newly developed spy equipment at al-Jardah near the Lebanese border. The rising tension in the Middle East might boost the safe-haven flows and benefit the gold price.
Apart from this, the upbeat Chinese Purchasing Managers Index (PMI) data for March provides some support to the gold price. The National Bureau of Statistics (NBS) showed on Sunday that Chinese Manufacturing PMI improved to 50.8 in March from the previous reading of 49.1, while Non-Manufacturing PMI climbed to 53.0 in March versus 51.4 in February.
Moving on, traders will focus on China’s Caixin Manufacturing PMI for March, due on Monday. Also, the US ISM Manufacturing PMI. If the US PMI report shows a stronger-than-expected outcome, this could boost the US Dollar (USD) and cap the upside of the gold price in the near term.
| Pare | Closed | Change, % |
|---|---|---|
| AUDUSD | 0.6508 | -0.1 |
| EURJPY | 163.21 | -0.04 |
| EURUSD | 1.07921 | 0.03 |
| GBPJPY | 190.955 | -0.04 |
| GBPUSD | 1.26236 | 0.01 |
| NZDUSD | 0.59765 | 0.03 |
| USDCAD | 1.35347 | -0.02 |
| USDCHF | 0.90113 | -0.03 |
| USDJPY | 151.326 | -0.03 |
Business confidence at large manufacturers in Japan improved and suggested that inflation expectations amongst firms steady in the first quarter (Q1) of 2024, according to the Bank of Japan's quarterly Tankan survey on Monday.
The headline large Manufacturers' Sentiment Index came in at 11.0 from the previous reading of 12.0, better than the market expectation of 10.0.
Further details unveil that the large Non-Manufacturing Outlook for the first quarter (Q1) arrived at 27.0 versus 24.0 prior, worse than the market consensus of 30.0.
The Japanese firms expect Consumer Prices to rise by 2.4% a year from now, from an increase of 2.4% in the previous survey.
Market reaction
At the time of press, the USD/JPY pair was up 0.02% on the day at 151.37.
Japanese Yen FAQs
The Japanese Yen (JPY) is one of the world’s most traded currencies. Its value is broadly determined by the performance of the Japanese economy, but more specifically by the Bank of Japan’s policy, the differential between Japanese and US bond yields, or risk sentiment among traders, among other factors.
One of the Bank of Japan’s mandates is currency control, so its moves are key for the Yen. The BoJ has directly intervened in currency markets sometimes, generally to lower the value of the Yen, although it refrains from doing it often due to political concerns of its main trading partners. The current BoJ ultra-loose monetary policy, based on massive stimulus to the economy, has caused the Yen to depreciate against its main currency peers. This process has exacerbated more recently due to an increasing policy divergence between the Bank of Japan and other main central banks, which have opted to increase interest rates sharply to fight decades-high levels of inflation.
The BoJ’s stance of sticking to ultra-loose monetary policy has led to a widening policy divergence with other central banks, particularly with the US Federal Reserve. This supports a widening of the differential between the 10-year US and Japanese bonds, which favors the US Dollar against the Japanese Yen.
The Japanese Yen is often seen as a safe-haven investment. This means that in times of market stress, investors are more likely to put their money in the Japanese currency due to its supposed reliability and stability. Turbulent times are likely to strengthen the Yen’s value against other currencies seen as more risky to invest in.


© 2000-2026. All rights reserved.
This site is managed by Teletrade D.J. LLC 2351 LLC 2022 (Euro House, Richmond Hill Road, Kingstown, VC0100, St. Vincent and the Grenadines).
The information on this website is for informational purposes only and does not constitute any investment advice.
The company does not serve or provide services to customers who are residents of the US, Canada, Iran, The Democratic People's Republic of Korea, Yemen and FATF blacklisted countries.
Making transactions on financial markets with marginal financial instruments opens up wide possibilities and allows investors who are willing to take risks to earn high profits, carrying a potentially high risk of losses at the same time. Therefore you should responsibly approach the issue of choosing the appropriate investment strategy, taking the available resources into account, before starting trading.
Use of the information: full or partial use of materials from this website must always be referenced to TeleTrade as the source of information. Use of the materials on the Internet must be accompanied by a hyperlink to teletrade.org. Automatic import of materials and information from this website is prohibited.
Please contact our PR department if you have any questions or need assistance at pr@teletrade.global.
transfers