- Analytics
- News and Tools
- Market News
Analytics, News, and Forecasts for CFD Markets: currency news — 27-03-2024.
- GBP/USD remains under pressure around 1.2614 following hawkish comments from Fed’s official on Thursday.
- Fed’s Waller said there is no rush to cut the rate and may need to maintain the current rate for longer than expected.
- The dovish comments from BoE’s Bailey about rate cuts weigh on GBP.
- Investors will focus on the BoE's Mann speech, final UK Q4 GDP, and US GDP annualized data, due on Thursday.
The GBP/USD pair attracts some sellers to 1.2614 after retreating from a daily high of 1.2640 during the early Asian session on Thursday. The sell-off of the major pair is backed by recent hawkish comments from US Federal Reserve (Fed) official, affirming the higher-for-longer stance and no need to rush the rate cuts.
Early Wednesday, Fed Governor Christopher Waller said that the US central bank is in no rush to cut the benchmark rate and may need to “maintain the current rate target for longer than expected.” Waller emphasized that the Fed is in no rush to cut the policy rate as it’s prudent to hold its restrictive stance for longer than previously expected to bring down inflation to the 2% target. His hawkish comments boost the Greenback higher to 104.45 and weigh on the major pair.
On the other hand, the Bank of England (BoE) held the interest rate unchanged at 5.25% for the fifth meeting in a row last week. The UK central bank turned dovish on the interest rate outlook, and this has exerted some selling pressure on the Pound Sterling (GBP). The BoE Governor Andrew Bailey said that interest rate cuts will be ‘in play’ at future BoE policy meetings.
Market players will monitor the speech by BoE's C. Mann and the final UK Gross Domestic Product (GDP) growth numbers for Q4 on Thursday. Any dovish comments from the BoE policymaker or the weaker-than-expected GDP number might extend the selling pressure on the GBP. On the US docket, the GDP annualized number, the weekly Initial Jobless Claims and the Michigan Consumer Sentiment Index will be due later in the day.
The Swiss National Bank (SNB) Vice President Martin Schlegel said late Wednesday, repeating the SNB’s longstanding position as regards the Swiss Franc (CHF). Schlegel stated that the central bank has no target for the exchange rate, per Bloomberg.
Key quotes
“Swiss National Bank has no target for the franc exchange rate.”
“The National Bank monitors the exchange rate closely and intervenes in the foreign-exchange market as necessary.”
Market reaction
At the time of press, the USD/CHF pair was up 0.15% on the day at 0.9050.
SNB FAQs
The Swiss National Bank (SNB) is the country’s central bank. As an independent central bank, its mandate is to ensure price stability in the medium and long term. To ensure price stability, the SNB aims to maintain appropriate monetary conditions, which are determined by the interest rate level and exchange rates. For the SNB, price stability means a rise in the Swiss Consumer Price Index (CPI) of less than 2% per year.
The Swiss National Bank (SNB) Governing Board decides the appropriate level of its policy rate according to its price stability objective. When inflation is above target or forecasted to be above target in the foreseeable future, the bank will attempt to tame excessive price growth by raising its policy rate. Higher interest rates are generally positive for the Swiss Franc (CHF) as they lead to higher yields, making the country a more attractive place for investors. On the contrary, lower interest rates tend to weaken CHF.
Yes. The Swiss National Bank (SNB) has regularly intervened in the foreign exchange market in order to avoid the Swiss Franc (CHF) appreciating too much against other currencies. A strong CHF hurts the competitiveness of the country’s powerful export sector. Between 2011 and 2015, the SNB implemented a peg to the Euro to limit the CHF advance against it. The bank intervenes in the market using its hefty foreign exchange reserves, usually by buying foreign currencies such as the US Dollar or the Euro. During episodes of high inflation, particularly due to energy, the SNB refrains from intervening markets as a strong CHF makes energy imports cheaper, cushioning the price shock for Swiss households and businesses.
The SNB meets once a quarter – in March, June, September and December – to conduct its monetary policy assessment. Each of these assessments results in a monetary policy decision and the publication of a medium-term inflation forecast.
- AUD/USD falls following Federal Reserve Governor Waller's hawkish remarks on interest rates.
- Australian inflation remains steady at 3.4% YoY as traders digest implications for RBA’s monetary policy.
- Upcoming Australian Housing Credit and Retail Sales data eyed for further insight into domestic economic conditions.
The Australian Dollar finished Wednesday’s session virtually unchanged against the US Dollar following the Aussie’s inflation report and a scarce economic docket in the United States (US). Nevertheless, hawkish comments by Federal Reserve Governor Christopher Waller tumbled the AUD/USD as the Asian session began and traded at 0.6524, down 0.14%.
Australian Dollar adjusts to Fed's rate expectations and domestic inflation figures
Waller commented at a speech that rates need to be higher for longer than expected and the need to see more inflation progress before supporting a rate cut. He sees the beginning of the easing cycle in 2024, though he suggests the need to see back-to-back months of inflation data heading to 2%.
Wall Street finished the session mixed, while US Treasury yields tumbled and the Greenback stood flat at 104.29.
The US economic docket was empty on Wednesday. Conversely, Australia’s economic calendar revealed that February’s inflation hit 3.4% YoY for the third straight month. Up next, Housing Credit data for February will be released following Januar’s print of 0.4% MoM. Alongside that, Retail Sales for the same period are expected to slow from 1.1% to 0.4% MoM.
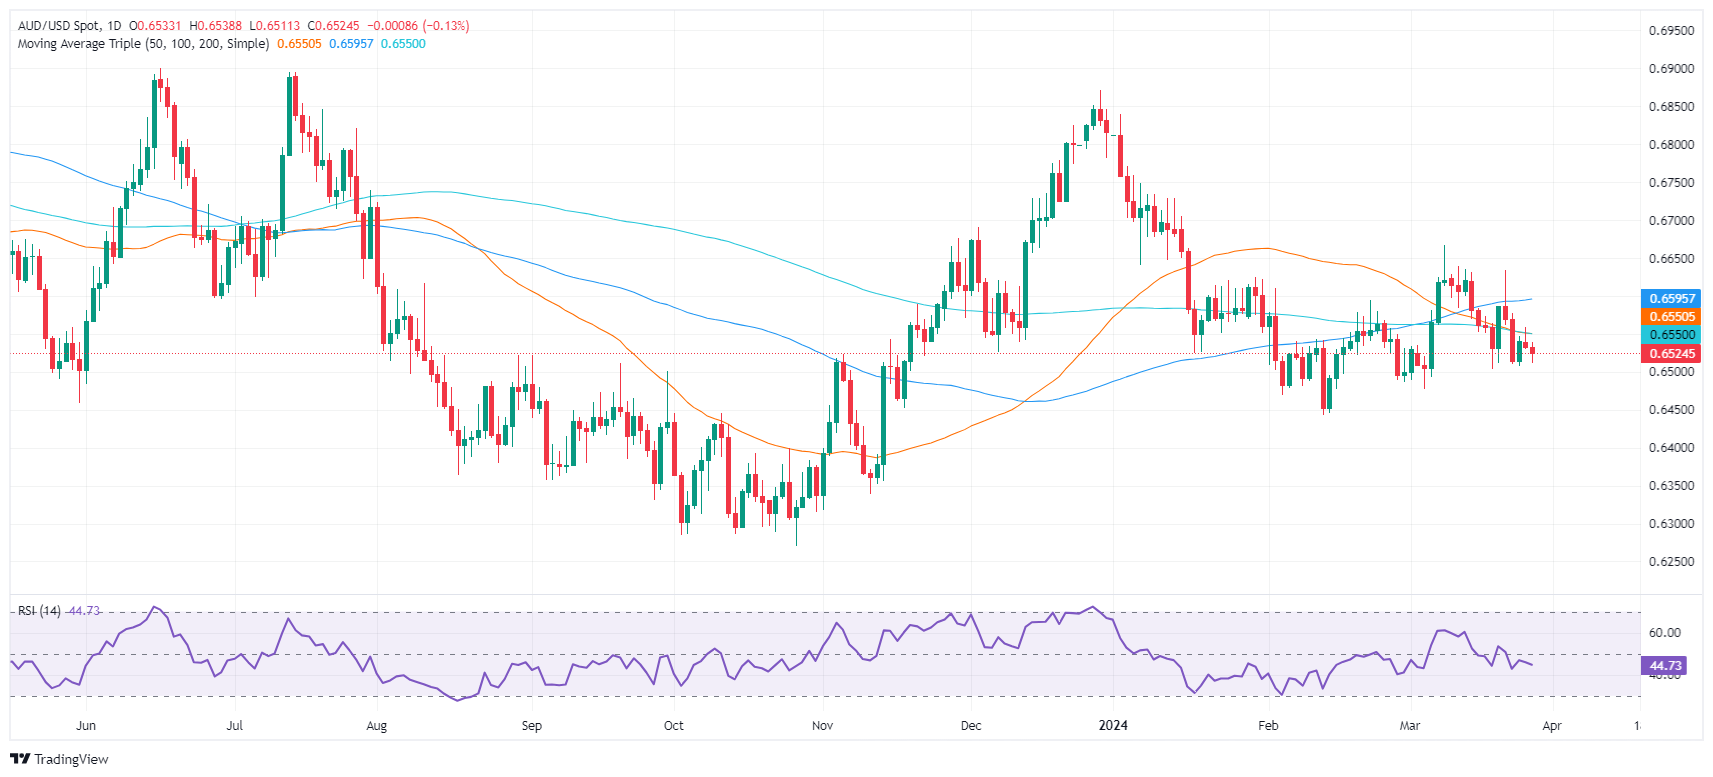
AUD/USD Price Analysis: Technical outlook
After Waller’s remarks, the AUD/USD pushed far below the 200-day moving average (DMA) of 0.6547, with the pair aiming to challenge Wednesday’s lows of 0.6511. Further weakness will drive the pair to test 0.6500, followed by the March 5 low of 0.6477, ahead of the February 13 low of 0.6442.
Otherwise if buyers reclaim the confluence of the 200-DMA and the 50-DMA, that could open the door to challenge the 100-DMA at 0.6592.
Federal Reserve Governor Christopher Waller said on Wednesday that recent weak inflation data supports the case for Fed holding off on cutting its short-term interest rate target, per Reuters.
Key quotes
"There is no rush to cut the policy rate.”
“Fed may need to maintain current rate target for longer than expected.”
“Needs to see more inflation progress before supporting rate cut.”
“Needs at least a couple of months of data to be sure inflation heading to 2%.”
“Still expects Fed to cut rates later this year.”
“Economy’s strength gives Fed space to take stock of data.”
“Data suggests fewer rate cuts possible this year.”
“Economy is growing at a healthy pace.”
“Despite progress on inflation, recent data has been disappointing.”
“Data has showed mixed messages on jobs front.”
“Fed has made a lot of progress lowering inflation.”
“Wage pressures have been easing.”
“Unsure productivity will keep at current strong pace.”
"Economy has supported Fed's cautious approach."
"Dollar is still the dominant currency by far."
"The economy is not giving the Fed a case to pursue big rate cuts."
"Supply chain issues have abated in positive inflation development."
"Baltimore port disaster is unlikely to cause big economic disruptions."
Market reaction
The US Dollar Index attracts some buyers following the above hawkish comments. The DXY is trading 0.11% higher on the day at 104.40, as of writing.
Fed FAQs
Monetary policy in the US is shaped by the Federal Reserve (Fed). The Fed has two mandates: to achieve price stability and foster full employment. Its primary tool to achieve these goals is by adjusting interest rates. When prices are rising too quickly and inflation is above the Fed’s 2% target, it raises interest rates, increasing borrowing costs throughout the economy. This results in a stronger US Dollar (USD) as it makes the US a more attractive place for international investors to park their money. When inflation falls below 2% or the Unemployment Rate is too high, the Fed may lower interest rates to encourage borrowing, which weighs on the Greenback.
The Federal Reserve (Fed) holds eight policy meetings a year, where the Federal Open Market Committee (FOMC) assesses economic conditions and makes monetary policy decisions. The FOMC is attended by twelve Fed officials – the seven members of the Board of Governors, the president of the Federal Reserve Bank of New York, and four of the remaining eleven regional Reserve Bank presidents, who serve one-year terms on a rotating basis.
In extreme situations, the Federal Reserve may resort to a policy named Quantitative Easing (QE). QE is the process by which the Fed substantially increases the flow of credit in a stuck financial system. It is a non-standard policy measure used during crises or when inflation is extremely low. It was the Fed’s weapon of choice during the Great Financial Crisis in 2008. It involves the Fed printing more Dollars and using them to buy high grade bonds from financial institutions. QE usually weakens the US Dollar.
Quantitative tightening (QT) is the reverse process of QE, whereby the Federal Reserve stops buying bonds from financial institutions and does not reinvest the principal from the bonds it holds maturing, to purchase new bonds. It is usually positive for the value of the US Dollar.
- Rising seller traction is prevalent in the daily chart with the RSI deep in the negative area.
- The hourly chart signals a potential shift toward short-term bullish correction.
- The overall trend continues to be tilted to the downside.
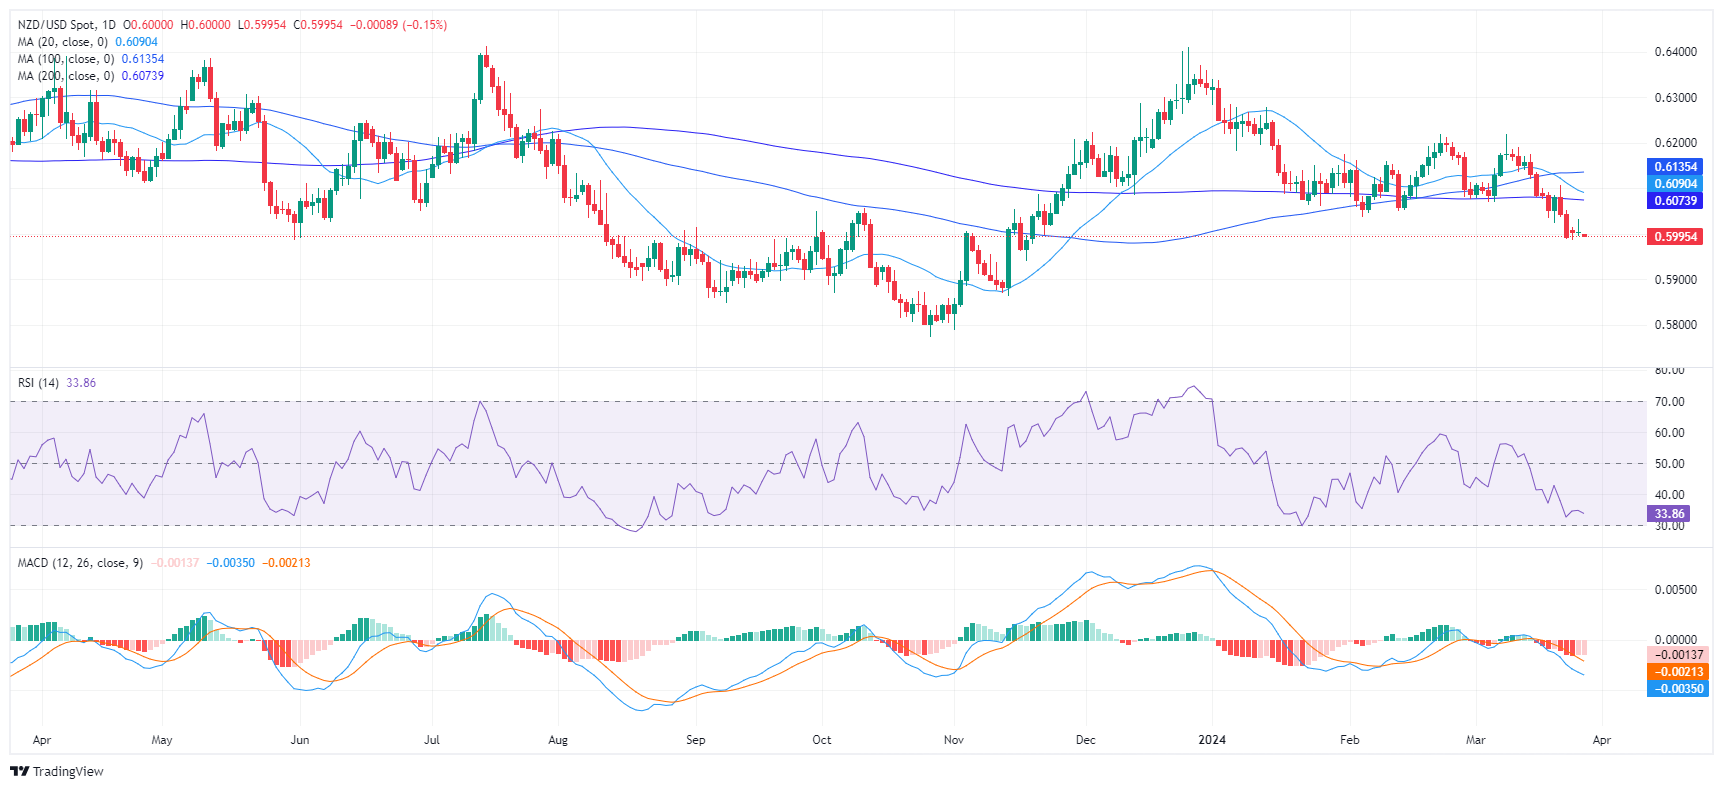
The NZD/USD pair is operating at around 0.6000 with losses, The market landscape is primarily dominated by sellers, underscored by a prevailing negative trend. The pair resides below the important 20, 100, and 200-day Simple Moving Averages (SMAs), emphasizing the strong presence of sellers. However, the hourly chart has clues for a potential short-term bullish reversal.
The Relative Strength Index (RSI) oscillates within the negative territory on the daily chart. at 35 near the oversold area, underscoring the prominence of sellers in the market. Concurrently, the predominance of flat red bars in the Moving Average Convergence Divergence (MACD) histogram affirms this negative momentum.
NZD/USD daily chart
Switching to the hourly chart, the RSI moved towards its middle point but then retreated towards 40, implying a modest bias towards the buyers. In addition, the MACD histogram prints green bars which offer additional evidence of buyers gathering momentum.
NZD/USD hourly chart
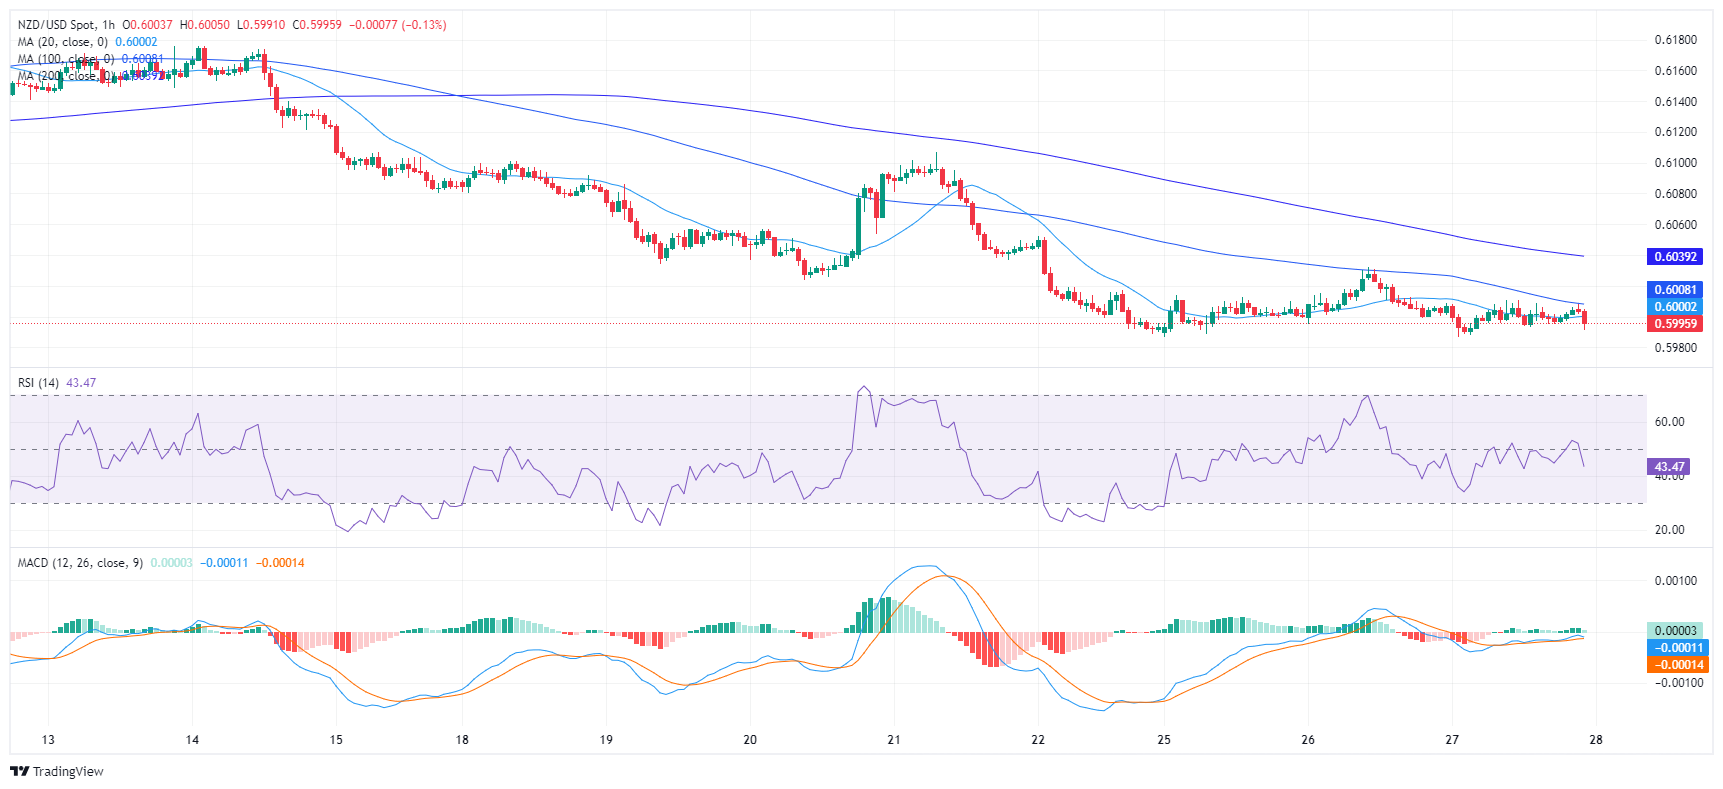
Overall, the current dynamics of the NZD/USD pair infer a predominantly negative momentum. Nevertheless, the recovering indicators in the hourly chart point to a possible bullish reversal in the short term. Zooming out, the buyers must make a stride to reclaim the 200-day SMA at 0.6070 to avoid additional losses.
- EUR/USD slightly down finding support despite ECB's dovish turn and mixed signals from Fed officials.
- ECB officials signal potential for June rate cut, adding a dovish tone to policy outlook amidst wage inflation discussions.
- Market awaits core PCE inflation data and GDP figures in the US, with Fed's divided stance on rate cuts in focus.
The Euro trims some of its earlier losses against the US Dollar but stays in the red, as the EUR/USD trades at 1.0227, down 0.03%. Recent European Central Bank (ECB) dovish comments contradict the division amongst US Federal Reserve policymakers, who remain looking for evidence of the evolution of the disinflation process.
EUR/USD steadies as central banks' contrasting stances
The DXY, which measures a basket of American currency against six others, is almost unchanged at 104.29. The fall of US Treasury bond yields kept the EUR/USD from diving below 1.0800, which could have opened the door for further losses.
In the meantime, ECB policymakers had turned dovish. On Tuesday, ECB official Yannis Stoumaras stated that there is a growing consensus for a June rate cut, while Madis Muller echoed some of his comments, indicating that the ECB is nearing the stage where it can lower rates.
ECB Chief Economist Philip Lane said on Tuesday that wage inflation—a metric the ECB is following very closely to inform its policy—was “on track” to return to normal levels.
Federal Reserve’s policymakers divided
On the US front, Fed officials continued to lay the groundwork for easing policy, but there’s division among the Federal Open Market Committee (FOMC) board. Atlanta’s Fed Raphael Bostic noted that he expects one rate cut instead of two in 2024. Meanwhile, Fed Governor Lisa Cook said that easing policy too soon increases the risk of inflation becoming entrenched.
Chicago Fed President Austan Goolsbee, leaning on the dovish side, expects three cuts, though he says he needs more evidence of inflation “coming down.”
Traders eye US PCE figures and further economic data
In the US economic docket, investors will eye the release of Gross Domestic Product (GDP) figures for the last quarter of 2023, unemployment claims, and the Fed’s preferred gauge for inflation, the core PCE.
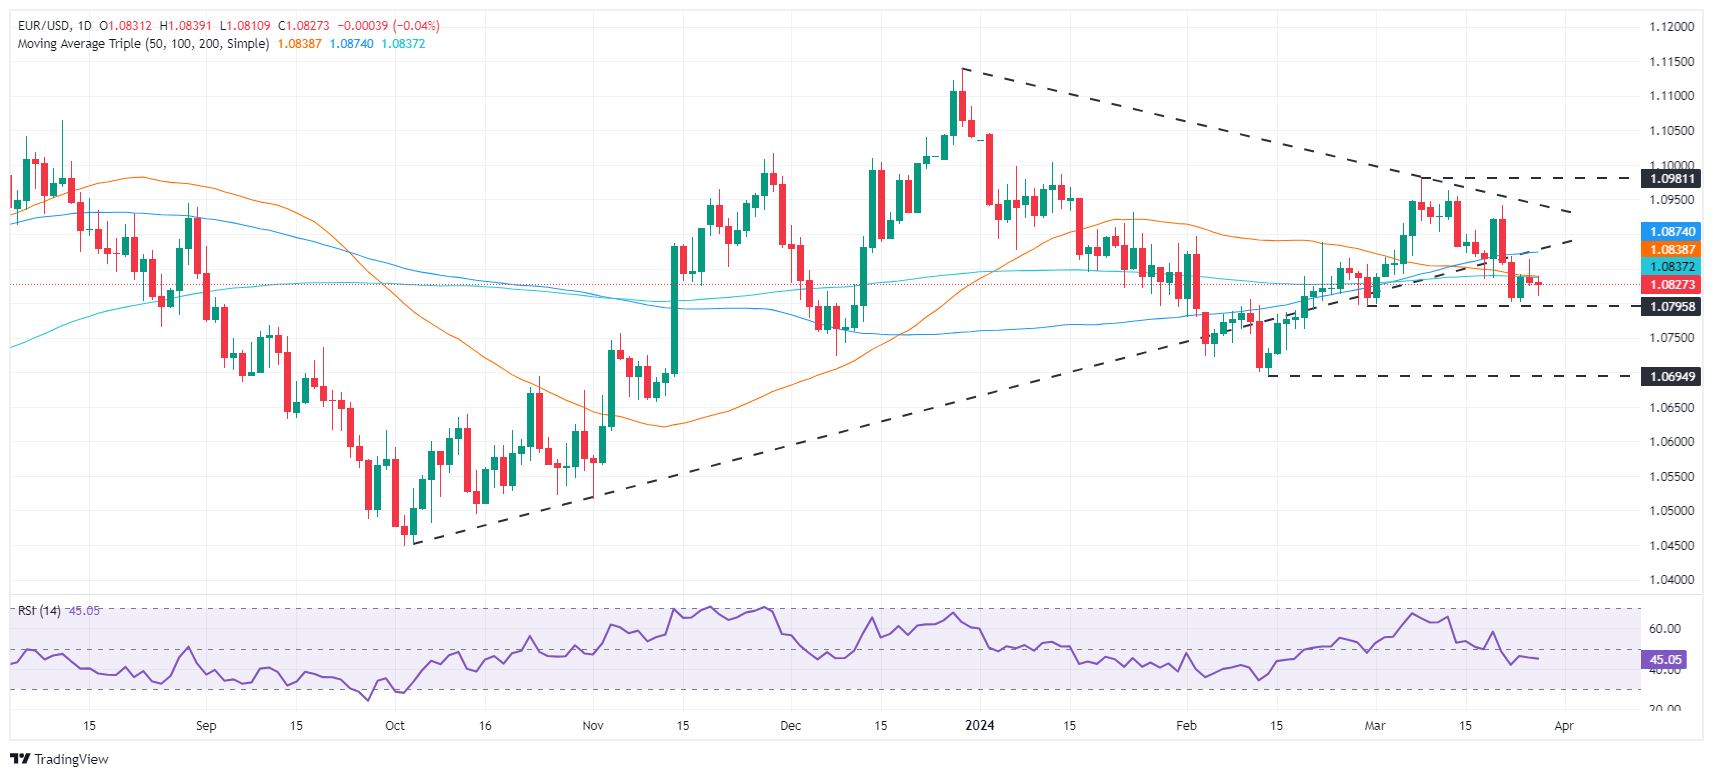
EUR/USD Price Analysis: Technical outlook
The EUR/USD break below the 200-day moving average (DMA) at 1.0836 cleared the path to challenge 1.0800, but thin volumes kept the exchange rate above 1.0810 the day’s low. Nevertheless, the Relative Strength Index (RSI) remains bearish and aims lower. That said, the pair bias remains bearish. If sellers drag prices below 1.0800, the pair could challenge the February 14 low of 1.0694.
On the flip side, buyers reclaiming 1.0836, the 200-DMA further upside is seen at the 100-DMA at 1.0873 ahead of 1.0900.
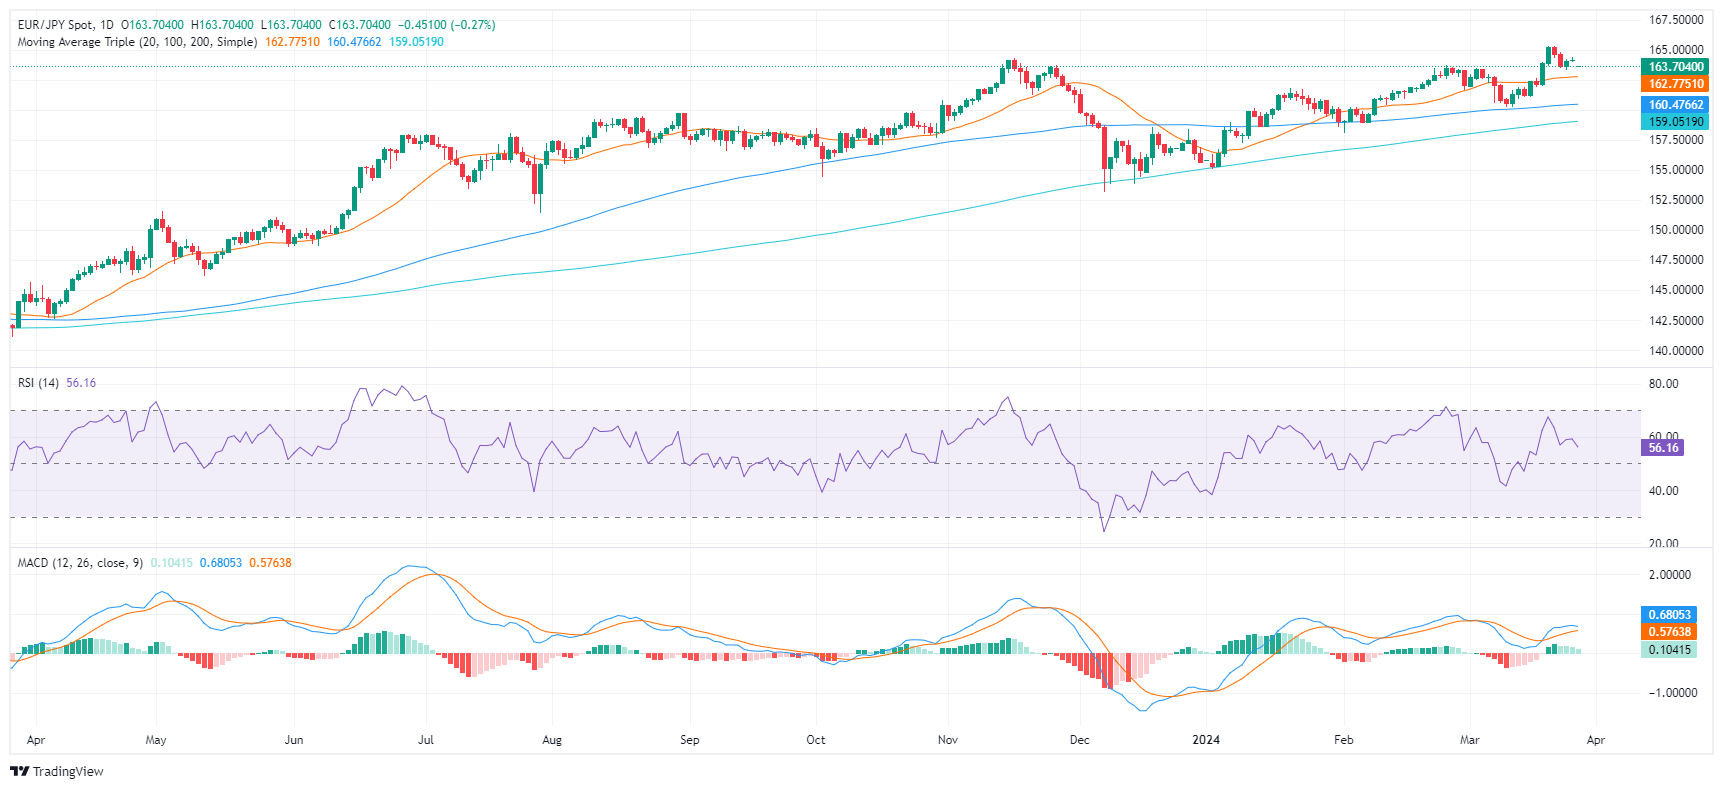
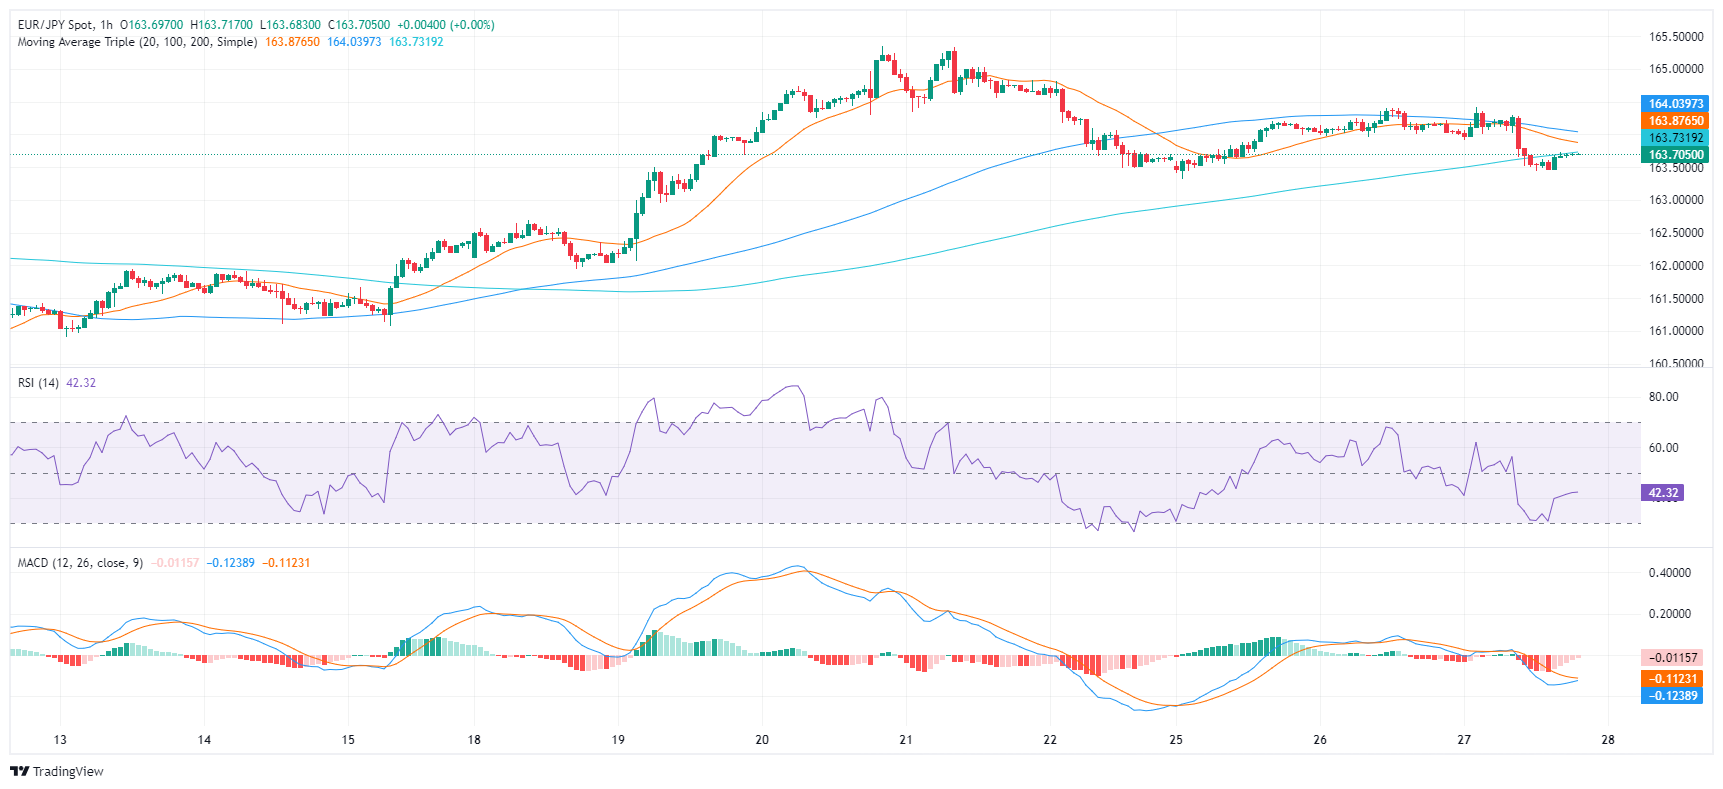
- Indicators on the daily chart signal a possible shift toward negative momentum.
- The hourly chart shows RSI and MACD somewhat recovering in negative territory.
- Bulls need to maintain the 20-day SMA securely to fend off further dips.
In Wednesday's session, EUR/JPY is trading with mild losses at 163.75. Despite uncertainties, the broader market sentiment appears to favor the buyers, given the pair's dominant position above its key Simple Moving Averages (SMAs) of 20,100 and 200 days. However, the Relative Strength Index (RSI) and Moving Average Convergence Divergence (MACD) indicators signal an upcoming shift in momentum, hinting at increased strength in selling pressure.
On the daily chart indicators for the RSI remain in positive territory, with a downward trend which may signal a potential shift towards a negative trend. The MACD on the other hand, prints decreasing green bars, further reinforcing the weakened bullish momentum.
EUR/JPY daily chart
Regarding the hourly chart, the RSI values display a positive slope, signaling increased buying momentum. The lowest peak at 31 clearly shows that market sentiment has shifted to a bearish stance on Wednesday but in the meantime, indicators seem to be consolidating. Furthermore, the MACD) histogram's red bars confirm the presence of negative momentum.
EUR/JPY hourly chart
- GBP/USD edges up to 1.2632, navigating through thin liquidity and a light economic calendar on both sides of the Atlantic.
- US Durable Goods Orders exceed expectations, while consumer concerns over inflation temper consumer confidence.
- Market focus on Fed Governor Waller's upcoming speech and core PCE inflation data for potential rate cut insights.
The Pound Sterling clings to gains of 0.05% against the US Dollar after hitting a daily low of 1.2605. Thin liquidity conditions prevail in the financial markets amid a shortened week in observance of Good Friday. At the time of writing, the GBP/USD trades at 1.2632.
GBP/USD maintains slight gains in subdued trading, with investors awaiting key speeches and inflation data
The economic docket on both sides of the Atlantic remains scarce, though the latest data from the United States (US) witnessed Durable Goods Orders rising 1.4% in February, above estimates of 1.1%. Other data showed that US consumer confidence missed estimates of 107, coming at 104.7 in March. Dana M. Peterson, Chief Economist at The Conference Board, commented, “Consumers remained concerned with elevated price levels, which predominated write-in responses.”
Later, the Fed Governor Christopher Waller is expected to cross newswires at around 22:00 GMT. In Waller’s last speech, he said the Fed is in no rush to cut rates, which has sponsored a repricing of a less dovish Fed, as shown by the CME FedWatch Tool. Money markets see 70% odds for a 25 basis points interest rate cut by the Fed in June.
Aside from this, GBP/USD traders are eyeing the release of the Fed’s preferred measure of inflation, the Core Personal Consumption Expenditure (PCE) price index. If inflation edges lower, that could fuel rate cut speculations of the Fed, but the figures must be taken with a pinch of salt as Fed Chair Jerome Powell would speak at 15:30 GMT.
Across the pond, traders are eyeing the release of the latest Gross Domestic Product (GDP) figures for Q4 on Thursday, along wth the Current Account numbers for the same period.
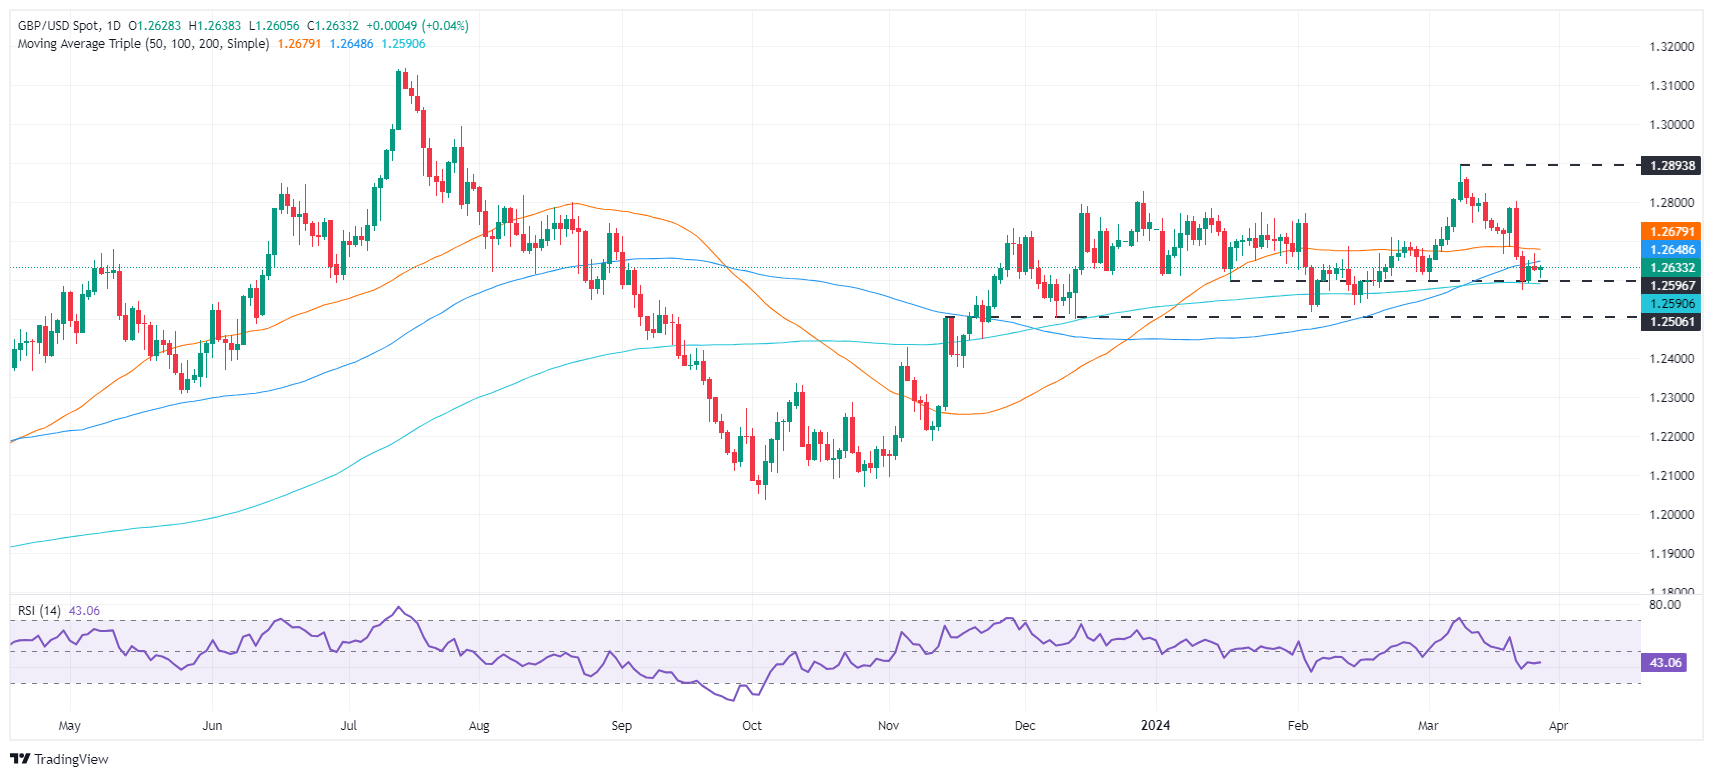
GBP/USD Price Analysis: Technical outlook
The GBP/USD pair has printed back-to-back spinning tops candles, suggesting indecision amongst investors. On the upside, the 100-day moving average (DMA) at 1.2639 caps the rallies of the Sterling, while the 200-DMA at 1.2589 acts as strong dynamic support for buyers. For a bullish resumption, a breach of the 100-DMA could expose the 50-DMA at 1.2678 before testing 1.2700. On the flip side, if sellers reclaim 1.2600 and the 200-DMA, look for a test of 1.2505, the November 14 high turned support.
The Greenback maintained its constructive stance and extended the consolidative mood around the upper end of the recent range, all against the backdrop of small retracements in risk-associated assets. Around USD/JPY, concerns over potential FX intervention remained on the rise as spot neared the 152.00 barrier.
Here is what you need to know on Thursday, March 28:
Extra gains kept the Greenback on the positive foot and lifted the USD Index (DXY) to the vicinity of 104.50. On March 28, the final Q4 GDP Growth Rate is due, seconded by the usual weekly Initial Jobless Claims, Pending Home Sales, and the final print of the Michigan Consumer Sentiment.
EUR/USD traded on the defensive and added to previous losses, leaving the door open to another potential visit to the 1.0800 region. Germany will be at the centre of the debate on March 28 with the release of Retail Sales, and the labour market report for the month of March.
GBP/USD navigated a tight range in the low 1.2600s amidst Dollar gains and further downside pressure in the risk-linked space. The speech by the BoE's C. Mann, the annualized Car Production results, and the final GDP Growth Rate figures are all due on March 28.
USD/JPY rose to a new YTD high within the boundaries of 152.00 before returning to the red zone. In the domestic calendar, the BoJ Summary of Opinions and the weekly Foreign Bond Investment figures are expected on March 28.
AUD/USD accelerated its losses and approached the key 0.6500 zone amidst further upside in the Greenback and the poor performance of the commodity complex. On March 28, Inflation Expectations by the Melbourne Institute are due, along with Retail Sales, Housing Credit, and Private Sector Credit.
WTI prices alternated gains with losses against the backdrop of larger-than-expected US crude oil inventories, geopolitics, and speculation of no news at the upcoming OPEC+ meeting (April 3).
Extra retracement in US yields prompted Gold prices to retest the $2,200 zone per troy ounce, while Silver prices reversed four consecutive sessions of losses.
- Gold prices ascend, aiming for the $2,200 mark, buoyed by expectations of a Fed rate cut.
- A dip in US Treasury yields to 4.19%, slight decrease in real yields enhance Gold's appeal as a safe-haven.
- Traders eyed Fed Governor Christopher Waller's speech and upcoming core PCE data for potential cues on monetary policy direction.
Gold prices climbed steadily during the North American session on Wednesday as buyers targeted the $2,200 figure. A scarce economic calendar in the United States (US) prompted investors to buy the yellow metal on the back of rising speculation of a rate cut in June by the Federal Reserve (Fed). At the time of writing, the XAU/USD trades at $2,192, posting gains of 0.63% or $13.
The fall of US Treasury yields underpins the price of the non-yielding metal. The US 10-year benchmark note rate sits at 4.19%, down four basis points. Consequently, US real yields edged lower from 1.914% on Tuesday to 1.87% as of the time of writing, a headwind for the Greenback.
The US Dollar Index (DXY), which measures the Greenback’s performance against the other six currencies, trades flat at 104.30, a headwind for the non-yielding metal.
The US economic docket is scarce, with just a speech by Fed Governor Christopher Waller at around 22:00 GMT. The highlight of the week will be the release of the Fed’s preferred gauge for inflation, the core Personal Consumption Expenditures (PCE) report, on Friday.
In addition, the current week’s economic calendar will feature University of Michigan Consumer Sentiment, Initial Jobless Claims, and the release of the final reading of the Gross Domestic Product (GDP) on Thursday.
Daily digest market movers: Gold advances as US real yields tumble
- Money market traders predict a 70% chance that the Federal Reserve will slash rates by a quarter of a percentage point in June, setting the federal funds rate (FFR) at 5.00% - 5.25%.
- Federal Reserve officials remain set to cut rates, but there’s division among the Federal Open Market Committee (FOMC) board. Atlanta Fed President Raphael Bostic noted that he expects one rate cut instead of two in 2024. Meanwhile, Fed Governor Lisa Cook echoed Bostic’s comments and added that easing policy too soon increases the risk of inflation becoming entrenched.
- Chicago Fed President Austan Goolsbee remains dovish, expecting three cuts, though he said he needs more evidence of inflation dropping.
- Gold traders await the release of the Federal Reserve’s preferred gauge for inflation, the Core Personal Consumption Expenditure (PCE) Price Index. The Index is estimated to grow 2.8% YoY in February, with monthly figures expected to slow from 0.4% to 0.3% MoM.
Technical analysis: Gold price pushes above $2,190 with buyers targeting all-time high
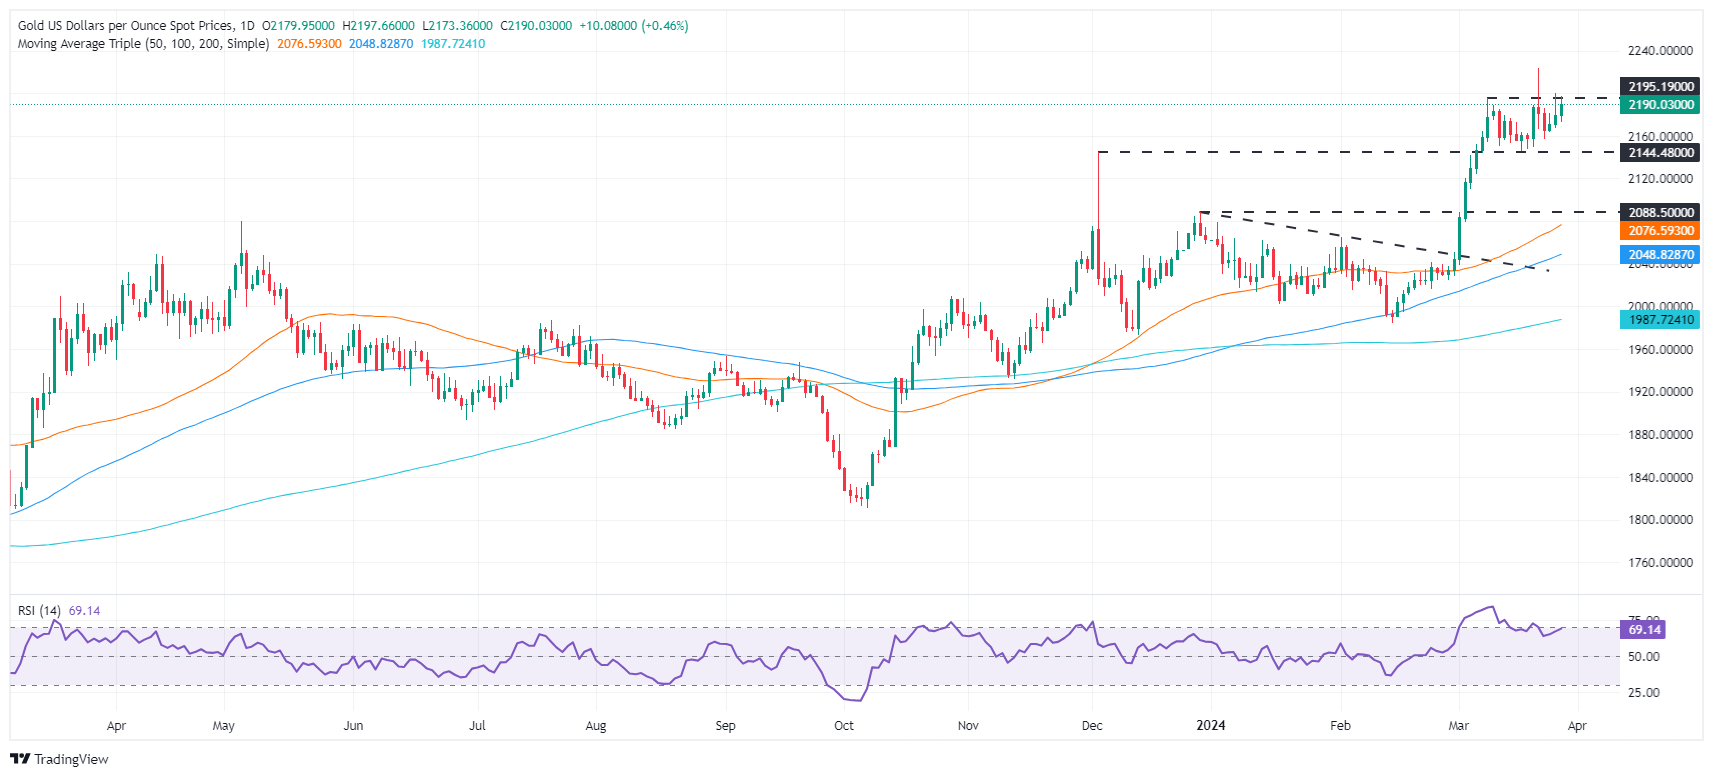
Gold price resumed its uptrend on Wednesday after diving to a weekly low of $2,163 on Monday, capitalized by buyers, which lifted the yellow metal prices near the $2,200 figure. The Relative Strength Index (RSI), aiming higher, suggests that bullish momentum builds, If traders clear the aforementioned level, a test of the all-time high at $2,223 is on the cards.
On the flip side, if sellers push prices below the December 4 high, which turned support at $2,146, that could exacerbate a sell-off and send XAU/USD prices diving toward $2,100. The next support would be the December 28 high, which is $2,088.
Gold FAQs
Gold has played a key role in human’s history as it has been widely used as a store of value and medium of exchange. Currently, apart from its shine and usage for jewelry, the precious metal is widely seen as a safe-haven asset, meaning that it is considered a good investment during turbulent times. Gold is also widely seen as a hedge against inflation and against depreciating currencies as it doesn’t rely on any specific issuer or government.
Central banks are the biggest Gold holders. In their aim to support their currencies in turbulent times, central banks tend to diversify their reserves and buy Gold to improve the perceived strength of the economy and the currency. High Gold reserves can be a source of trust for a country’s solvency. Central banks added 1,136 tonnes of Gold worth around $70 billion to their reserves in 2022, according to data from the World Gold Council. This is the highest yearly purchase since records began. Central banks from emerging economies such as China, India and Turkey are quickly increasing their Gold reserves.
Gold has an inverse correlation with the US Dollar and US Treasuries, which are both major reserve and safe-haven assets. When the Dollar depreciates, Gold tends to rise, enabling investors and central banks to diversify their assets in turbulent times. Gold is also inversely correlated with risk assets. A rally in the stock market tends to weaken Gold price, while sell-offs in riskier markets tend to favor the precious metal.
The price can move due to a wide range of factors. Geopolitical instability or fears of a deep recession can quickly make Gold price escalate due to its safe-haven status. As a yield-less asset, Gold tends to rise with lower interest rates, while higher cost of money usually weighs down on the yellow metal. Still, most moves depend on how the US Dollar (USD) behaves as the asset is priced in dollars (XAU/USD). A strong Dollar tends to keep the price of Gold controlled, whereas a weaker Dollar is likely to push Gold prices up.
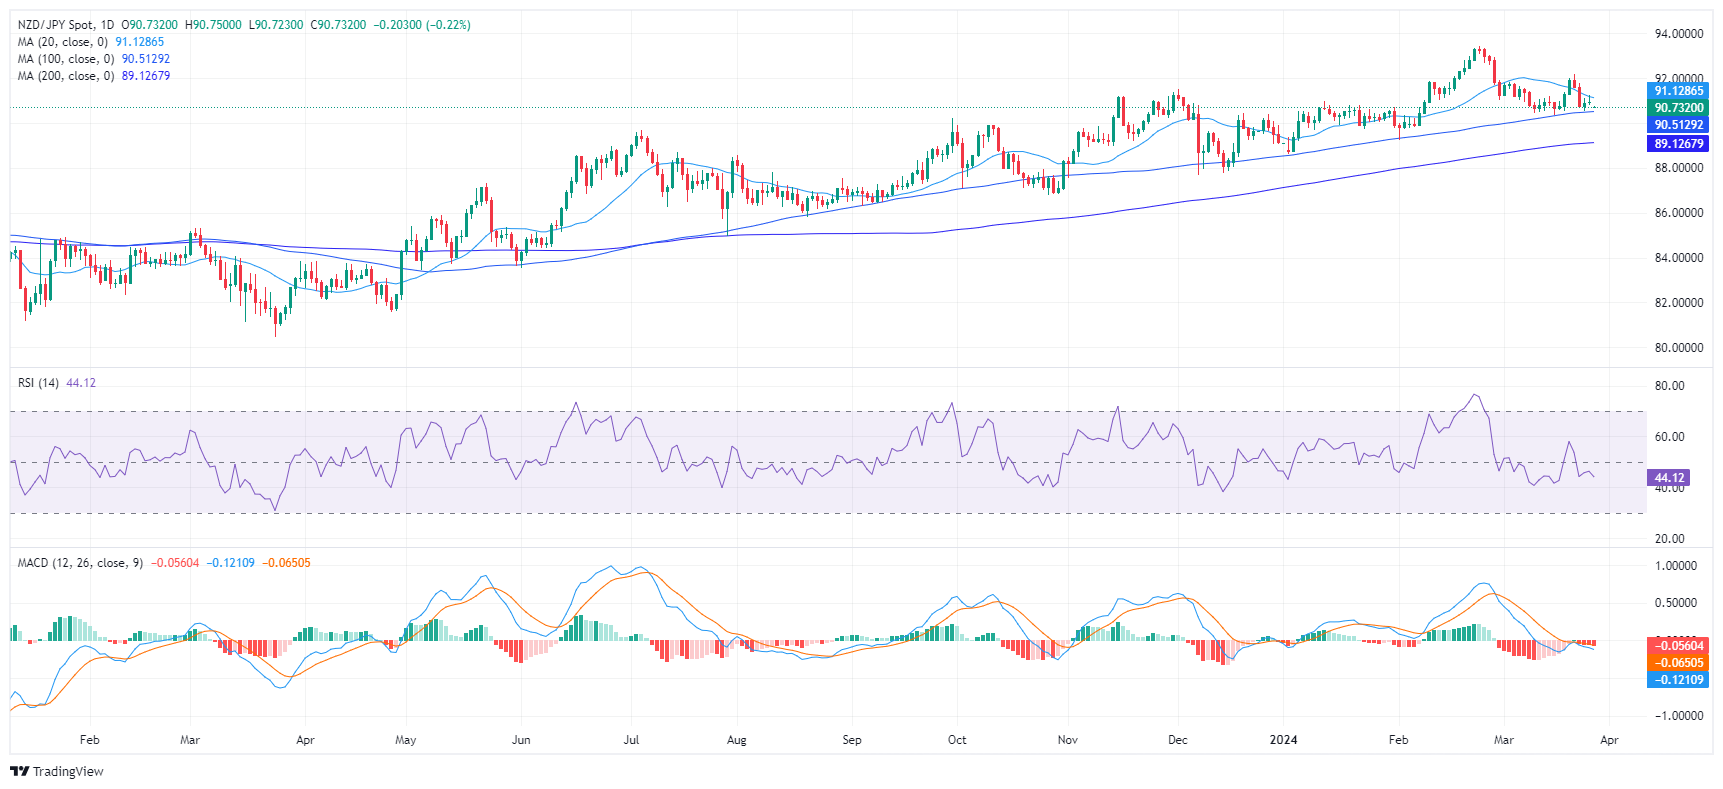
- The NZD/JPY trades neutral after getting rejected by the 20-day SMA.
- The daily chart shows that the RSI reveals weak buying traction.
- The hourly chart also showcases a similar situation with its RSI hinting at weak buying pressure.
The NZD/JPY is currently trading at 90.90, mostly neutral after trimming daily gains. From a broader perspective, the pair's position above the 100 and 200-day Simple Moving Averages (SMAs) suggests that despite the weakened buying momentum, the bulls continue to assert their control. Buyers must target the 20-day SMA to continue edging higher.
On the daily chart, the current market dynamics for the NZD/JPY pair reveal a neutral to negative trend as buyers are struggling to gather traction. The Relative Strength Index (RSI) presently resides in the negative territory. This trend is further emphasized by the red bars of the Moving Average Convergence Divergence (MACD), which reveals a steady selling momentum and weakened buying traction.
NZD/JPY daily chart
Switching to the hourly chart, the RSI recently read 41, which also positions it within negative territory. As with the daily chart, the MACD histogram on the hourly also illustrates flat red bars, further signifying weak market momentum.
NZD/JPY hourly chart
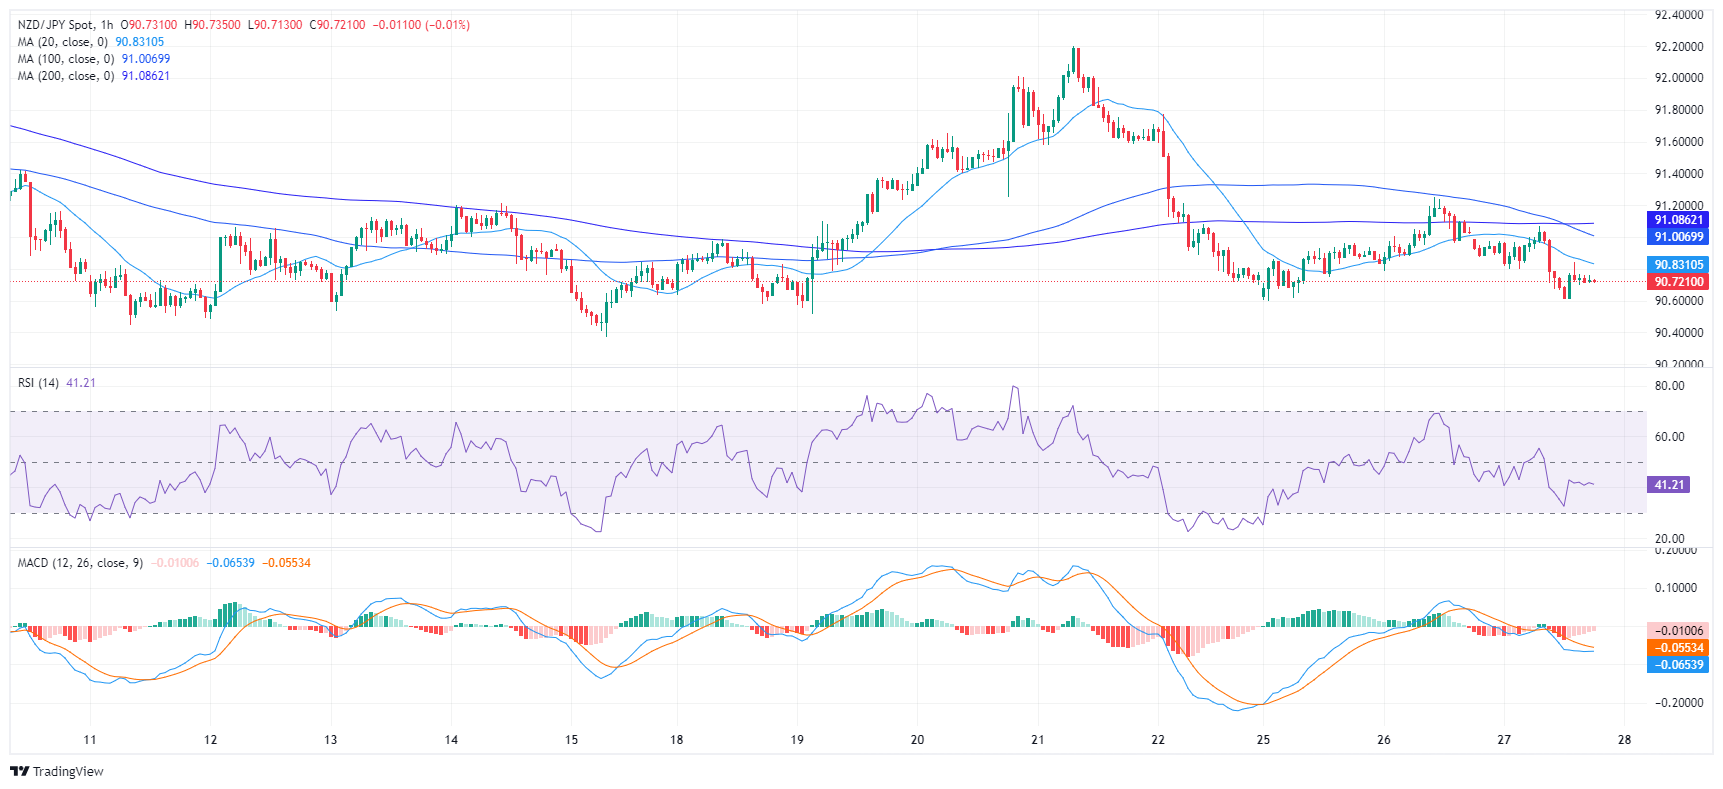
In conclusion, both the daily and hourly charts indicate a negative trend for NZD/JPY with weak buying pressure. Notwithstanding, on a larger scale, the pair remains above the 100 and 200-day Simple Moving Averages, hinting that bulls may still have broader control of the market. The negative market outlook could be further confirmed if the 20 and 100-day SMA complete a bearish crossover around the 91.00 area.
- Dow Jones is leading gains in pre-holiday session on Wednesday.
- Wall Street Indexes are mixed after a positive opening amid frail market sentiment.
- Investors are looking from the sidelines ahead of Friday’s PCE Prices Index data.
The Dow Jones Industrial Average (DJIA) is leading the major US stock indexes higher early in a calm trading session on Wednesday with some Fed speakers and US PCE Prices Index data in focus.
The Dow Jones Index is trading nearly 0.5% higher at 39,465 but still at a significant distance from the 39,900 historic high reached last week. The S&P 500 Index is 0.24% up, while the NASDAQ-100 Tech Index is trading with marginal losses following a positive opening.
Dow Jones news
Most of the sectors belonging to the Dow Jones index are posting gains on Wednesday, with Utilities and Real State outperforming with 1.91% and 1.61% respective advances. On the negative side, only the Technology sector and
Communication Services are in the red, down 0.5% each and giving away Tuesday’s gains.
The pharmaceutical company Merck & Co (MRK) is leading gains on Wednesday with a 3.96% rally, trading at $130.43, followed by Intel (INTC) with a 2.48% increase to $43.03. Among the few losers, Salesforce (CRM) is 2.22% lower on the day, trading at $299.03 and Visa (V) dropping 0.9% to $278.13.
The calendar is thin this week with only a Wednesday conference by Federal Reserve (Fed) Governor Christopher Waller worth mentioning. The highlight of the week is Friday’s Personal Consumption Prices Index, Which is expected to provide fresh cues into the bank’s monetary policy plans and Fed Chair Powell’s speech shortly afterward.
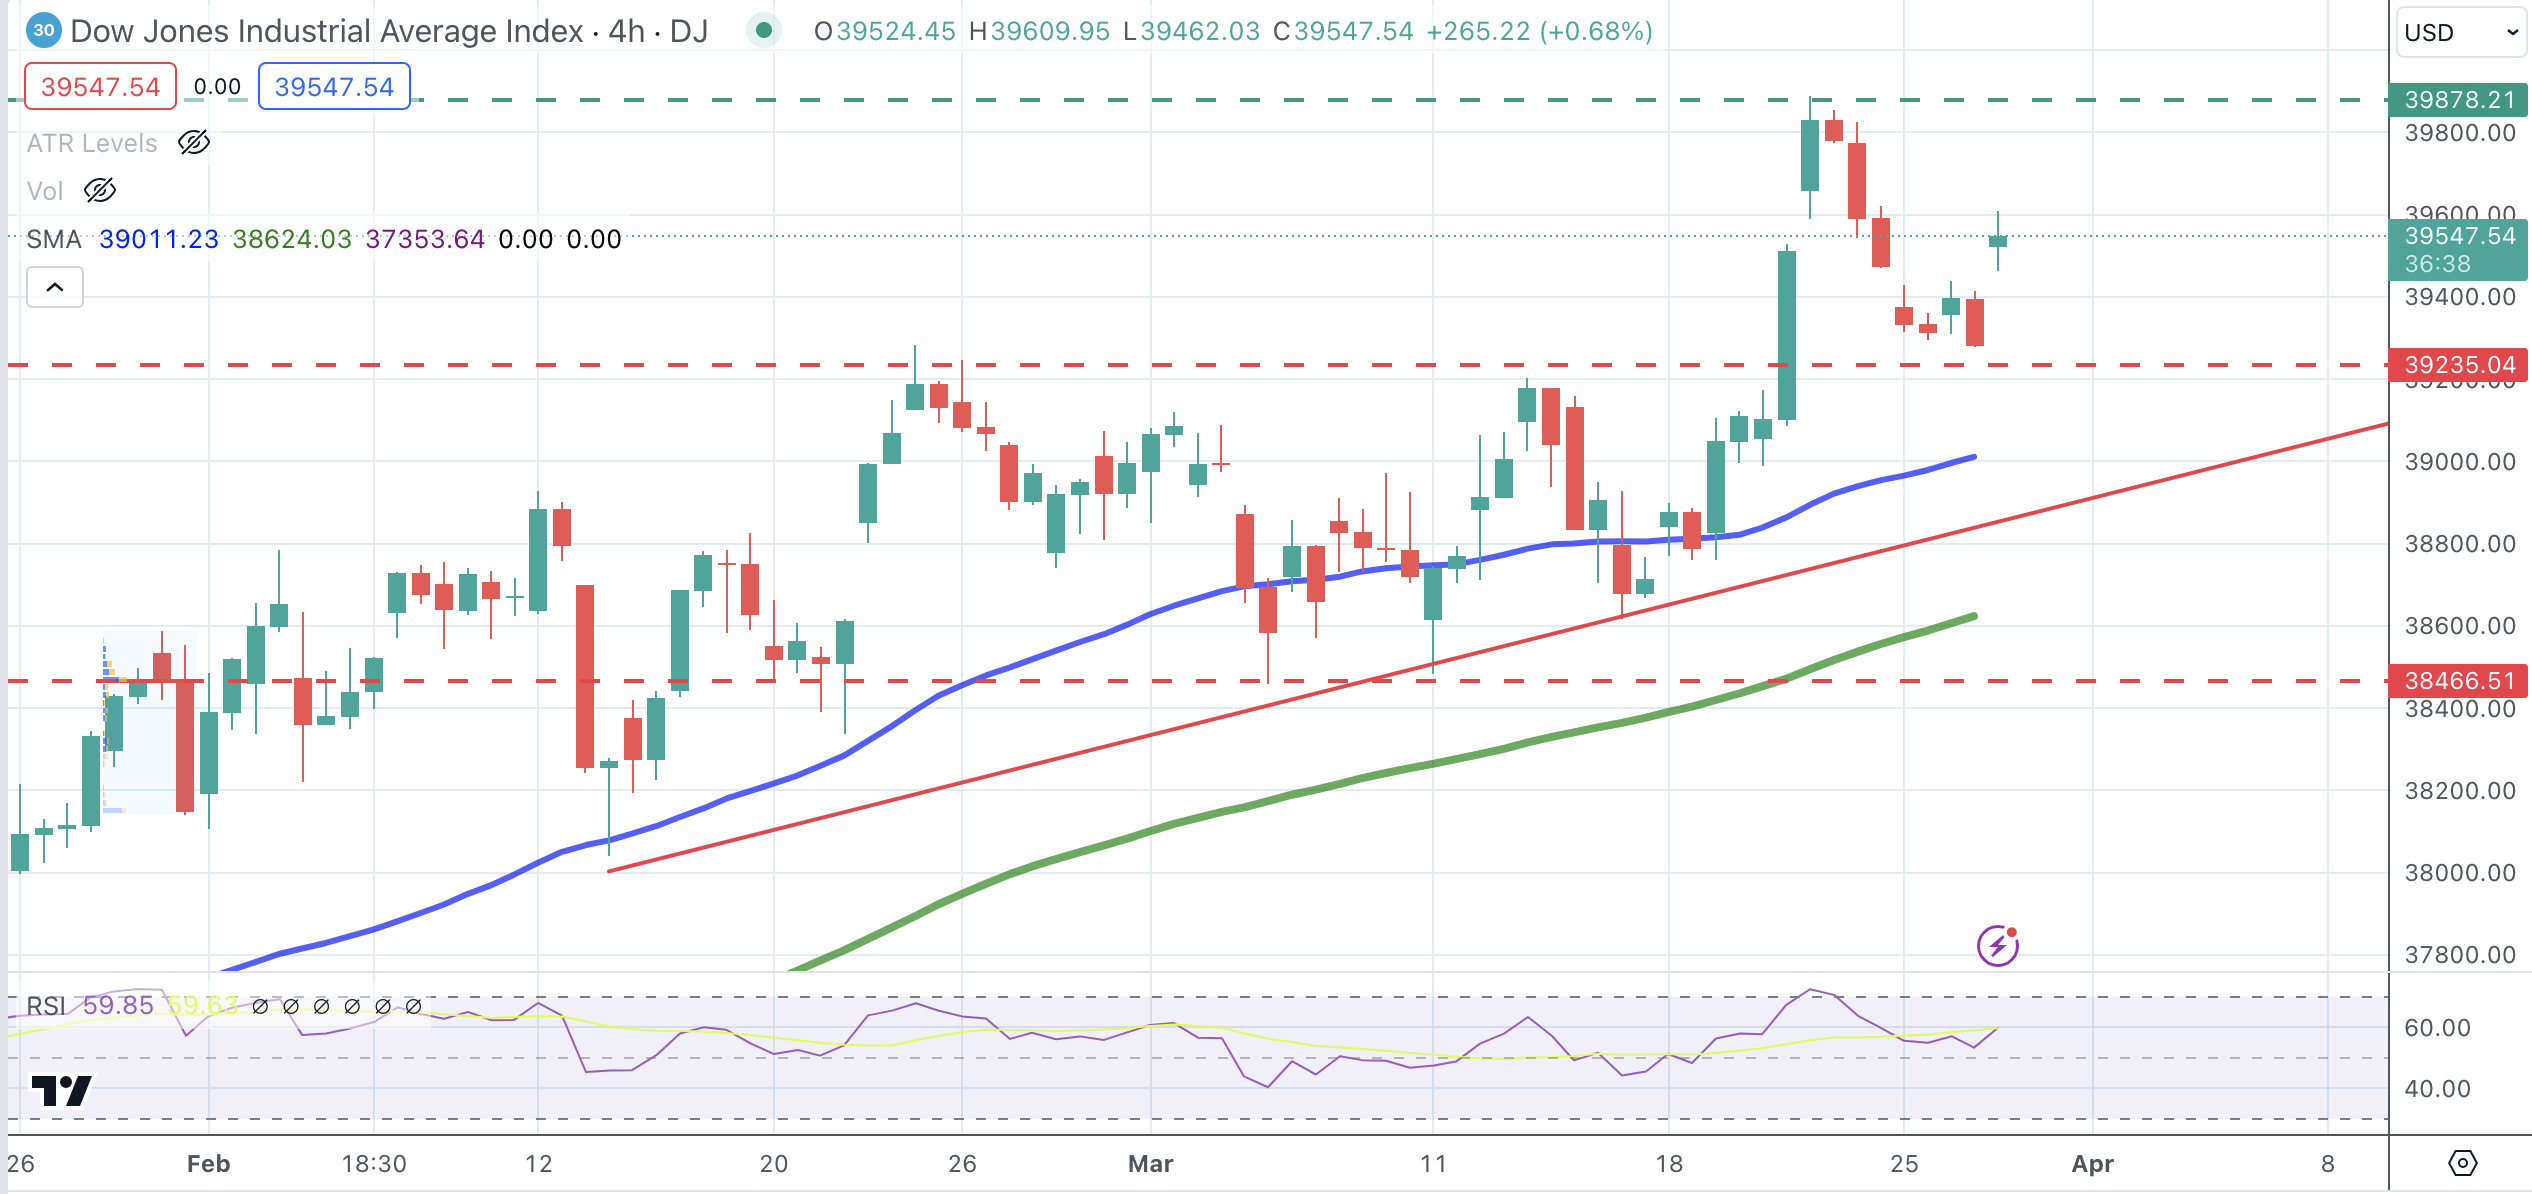
Dow Jones technical outlook
From a technical perspective, the broader bias for the Dow Jones Index remains bullish, with hopes of lower borrowing costs keeping bears at bay.
The previous resistance area, now turned into support, and the 4-hour 50 Simple Moving Average (SMA) converging at 39,250 are limiting downside attempts for now. Below here, the next downside targets lie at the 39,000 level and the trendline support at 38,775.
On the upside, resistances at the 39,900 previous high and the 40,000 psychological level are likely to offer significant pushback for bulls.
Dow Jones Index 4-Hour Chart
Dow Jones FAQs
The Dow Jones Industrial Average, one of the oldest stock market indices in the world, is compiled of the 30 most traded stocks in the US. The index is price-weighted rather than weighted by capitalization. It is calculated by summing the prices of the constituent stocks and dividing them by a factor, currently 0.152. The index was founded by Charles Dow, who also founded the Wall Street Journal. In later years it has been criticized for not being broadly representative enough because it only tracks 30 conglomerates, unlike broader indices such as the S&P 500.
Many different factors drive the Dow Jones Industrial Average (DJIA). The aggregate performance of the component companies revealed in quarterly company earnings reports is the main one. US and global macroeconomic data also contributes as it impacts on investor sentiment. The level of interest rates, set by the Federal Reserve (Fed), also influences the DJIA as it affects the cost of credit, on which many corporations are heavily reliant. Therefore, inflation can be a major driver as well as other metrics which impact the Fed decisions.
Dow Theory is a method for identifying the primary trend of the stock market developed by Charles Dow. A key step is to compare the direction of the Dow Jones Industrial Average (DJIA) and the Dow Jones Transportation Average (DJTA) and only follow trends where both are moving in the same direction. Volume is a confirmatory criteria. The theory uses elements of peak and trough analysis. Dow’s theory posits three trend phases: accumulation, when smart money starts buying or selling; public participation, when the wider public joins in; and distribution, when the smart money exits.
There are a number of ways to trade the DJIA. One is to use ETFs which allow investors to trade the DJIA as a single security, rather than having to buy shares in all 30 constituent companies. A leading example is the SPDR Dow Jones Industrial Average ETF (DIA). DJIA futures contracts enable traders to speculate on the future value of the index and Options provide the right, but not the obligation, to buy or sell the index at a predetermined price in the future. Mutual funds enable investors to buy a share of a diversified portfolio of DJIA stocks thus providing exposure to the overall index.
- Fed's stance over inflation signals caution, not panic, over higher inflation projections.
- Investors await incoming data to form further expectations on the timing of the easing cycle.
- PCE figures for February are due on Friday, and will be key to Greenback price action.
The US Dollar Index (DXY) is currently trading with mild gains at 104.3, a level close to Friday's peak of 104.50. Investors seem to be on the sidelines as they wait for fresh drivers to place their bets on the timing of the Federal Reserve’s (Fed) easing cycle.
That being said, the Federal Reserve appeared less aggressive last week, adopting a cautious approach toward the easing cycle that's anticipated to start in June. This stance comes after an upward revision of inflation projections and reassurances from Chair Jerome Powell that the bank will avoid overreacting to two months of high inflation figures. However, the US Dollar managed to clear all the post-Fed losses, mainly as the US economy holds resilient.
Daily digest market movers: DXY mildly higher as investors prepare for PCE data
- Statements from Fed speakers are under focus after the FOMC meeting, Waller will be on the wires later in the session.
- According to the CME FedWatch Tool, the odds of easing starting in June stand near 60%.
- The headline Personal Consumption Expenditures (PCE) is expected to have risen by 2.5% YoY, while the core measure is seen coming in at 2.8%. The outcome of the Fed’s preferred gauge of inflation will dictate the pace of the USD for the short term.
- US Treasury bond yields are falling, with the 2-year yield standing at 4.56%, the 5-year yield at 4.19%, and the 10-year yield at 4.20%.
DXY technical analysis: DXY is under bulls control while indicators flatten
The Relative Strength Index (RSI) is currently reflecting a flat position in positive territory, which indicates stable buying pressure. The Moving Average Convergence Divergence (MACD) shows flat green bars, suggesting that buying momentum remains intact. Furthermore, the placement of the index above its 20, 100 and 200-day Simple Moving Averages (SMAs) confirms the long-term bullish bias.
The flatness of the indicators comes after a 1% winning week, which may push the Index into a consolidation phase as investors await new fundamental drivers. In the meantime, if the Index holds above its main SMAs, the outlook will be bright.
US Dollar FAQs
What is the US Dollar?
The US Dollar (USD) is the official currency of the United States of America, and the ‘de facto’ currency of a significant number of other countries where it is found in circulation alongside local notes. It is the most heavily traded currency in the world, accounting for over 88% of all global foreign exchange turnover, or an average of $6.6 trillion in transactions per day, according to data from 2022.
Following the second world war, the USD took over from the British Pound as the world’s reserve currency. For most of its history, the US Dollar was backed by Gold, until the Bretton Woods Agreement in 1971 when the Gold Standard went away.
How do the decisions of the Federal Reserve impact the US Dollar?
The most important single factor impacting on the value of the US Dollar is monetary policy, which is shaped by the Federal Reserve (Fed). The Fed has two mandates: to achieve price stability (control inflation) and foster full employment. Its primary tool to achieve these two goals is by adjusting interest rates.
When prices are rising too quickly and inflation is above the Fed’s 2% target, the Fed will raise rates, which helps the USD value. When inflation falls below 2% or the Unemployment Rate is too high, the Fed may lower interest rates, which weighs on the Greenback.
What is Quantitative Easing and how does it influence the US Dollar?
In extreme situations, the Federal Reserve can also print more Dollars and enact quantitative easing (QE). QE is the process by which the Fed substantially increases the flow of credit in a stuck financial system.
It is a non-standard policy measure used when credit has dried up because banks will not lend to each other (out of the fear of counterparty default). It is a last resort when simply lowering interest rates is unlikely to achieve the necessary result. It was the Fed’s weapon of choice to combat the credit crunch that occurred during the Great Financial Crisis in 2008. It involves the Fed printing more Dollars and using them to buy US government bonds predominantly from financial institutions. QE usually leads to a weaker US Dollar.
What is Quantitative Tightening and how does it influence the US Dollar?
Quantitative tightening (QT) is the reverse process whereby the Federal Reserve stops buying bonds from financial institutions and does not reinvest the principal from the bonds it holds maturing in new purchases. It is usually positive for the US Dollar.
- Mexican Peso skyrockets sharply toward 16.53 against the US Dollar as USD/MXN contracts 0.65%.
- Mexico’s narrowed trade deficit and the tighter labor market in Mexico contributed to Peso's ascent, surpassing expectations.
- Attention turns to Federal Reserve Governor Christopher Waller's comments on Wednesday.
The Mexican Peso rallied to a new eight-year high against the US Dollar with the USD/MXN pair breaching last year’s low of 16.62, extending its losses to the 16.50s. Thin liquidity conditions amid a shortened week in the observance of Good Friday strengthened the Mexican currency, which hit 16.53. At the time of writing, the exotic pair trades at 16.53, down 0.64%.
Mexico’s economic schedule revealed that the Balance of Trade clocked a narrower deficit than January’s figures, but it exceeded the consensus. In the meantime, the labor market remains tight as the Unemployment Rate was below the previous month’s figures and estimates. The data was revealed before Wall Street opened on Wednesday, yet the USD/MXN dived below 16.60 at around 14:00 GMT.
Across the border, a scarce economic docket will feature comments from Federal Reserve (Fed) Governor Christopher Waller, one of the remaining “hawks” in the central bank’s Federal Open Market Committee (FOMC).
Daily digest market movers: Mexican Peso skyrockets on thin liquidity amid the lack of catalyst
- Banxico Governor Victoria Rodriguez Ceja remained dovish via an interview with El Financiero. Governor Rodriguez commented that the battle against inflation hasn’t been concluded, though adding that in upcoming meetings it would discuss further rate cuts to the main reference rate. She added, “When macroeconomic conditions and the inflationary outlook allow us to make additional adjustments to the reference rate to the one we already have, I consider that they would be gradual.”
- Banxico revealed international reserves grew to $216.9 billion, adding $411 million in US Dollars up to March 22, 2024.
- Mexico’s Balance of Trade in February printed a deficit of $-0.5 billion, lower than the $-4.31 billion in January but missed expectations of $-0.2 billion, according to the National Statistics Agency (INEGI). Other data showed that the Unemployment Rate in February dropped from 2.9% to 2.5%, which is below the consensus of 2.8%.
- Mexico’s Indicator of General Economic Activity flashed signs of contraction in January, justifying Banxico’s 25-basis-point rate cut on March 21. Despite that, traders must be aware that on March 22, the latest mid-month Consumer Price Index (CPI) report saw an increase of a tenth in three measures of inflation, witnessing a dip in headline CPI on a monthly basis.
- Federal Reserve policymakers had been crossing the wires. Atlanta Fed President Raphael Bostic remains hawkish by supporting just one rate cut in 2024. Fed Governor Lisa Cook echoed Bostic’s comments and added that cutting too soon increases the risk of inflation becoming entrenched.
- Chicago Fed President Austan Goolsbee remains dovish, expecting three cuts, though he said he needs more evidence of inflation “coming down.”
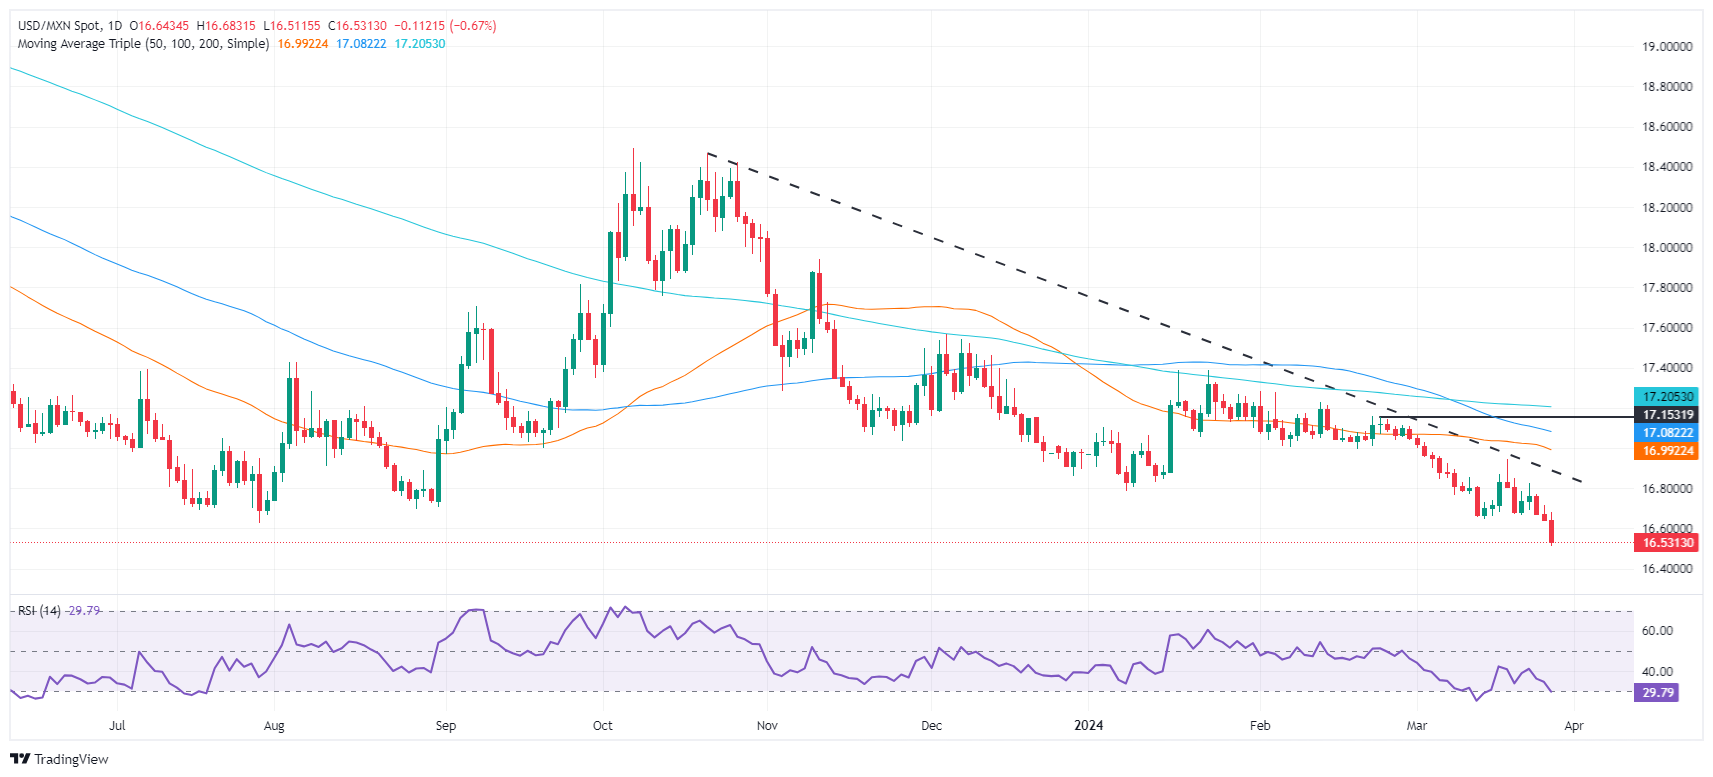
Technical analysis: Mexican Peso rally gathers steam as USD/MXN pushes below 16.60
The USD/MXN sellers gathered steam as the pair extended its losses toward the midpoint of the 16.50/16.60 area, while the Relative Strength Index (RSI) turned oversold. The next support level is the October 2015 cycle low at 16.32 before the pair plunges to the 16.00 figure.
On the other hand, USD buyers need to reclaim the 2023 low-turned-resistance at 16.62 if they would like to push prices toward the 50-day Simple Moving Average (SMA) at 16.98. further upside comes at 17.00, followed by the 100-day SMA at 17.08 and the 200-day SMA at 17.19.
USD/MXN Price Action – Daily Chart
Mexican Peso FAQs
The Mexican Peso (MXN) is the most traded currency among its Latin American peers. Its value is broadly determined by the performance of the Mexican economy, the country’s central bank’s policy, the amount of foreign investment in the country and even the levels of remittances sent by Mexicans who live abroad, particularly in the United States. Geopolitical trends can also move MXN: for example, the process of nearshoring – or the decision by some firms to relocate manufacturing capacity and supply chains closer to their home countries – is also seen as a catalyst for the Mexican currency as the country is considered a key manufacturing hub in the American continent. Another catalyst for MXN is Oil prices as Mexico is a key exporter of the commodity.
The main objective of Mexico’s central bank, also known as Banxico, is to maintain inflation at low and stable levels (at or close to its target of 3%, the midpoint in a tolerance band of between 2% and 4%). To this end, the bank sets an appropriate level of interest rates. When inflation is too high, Banxico will attempt to tame it by raising interest rates, making it more expensive for households and businesses to borrow money, thus cooling demand and the overall economy. Higher interest rates are generally positive for the Mexican Peso (MXN) as they lead to higher yields, making the country a more attractive place for investors. On the contrary, lower interest rates tend to weaken MXN.
Macroeconomic data releases are key to assess the state of the economy and can have an impact on the Mexican Peso (MXN) valuation. A strong Mexican economy, based on high economic growth, low unemployment and high confidence is good for MXN. Not only does it attract more foreign investment but it may encourage the Bank of Mexico (Banxico) to increase interest rates, particularly if this strength comes together with elevated inflation. However, if economic data is weak, MXN is likely to depreciate.
As an emerging-market currency, the Mexican Peso (MXN) tends to strive during risk-on periods, or when investors perceive that broader market risks are low and thus are eager to engage with investments that carry a higher risk. Conversely, MXN tends to weaken at times of market turbulence or economic uncertainty as investors tend to sell higher-risk assets and flee to the more-stable safe havens.
- Canadian Dollar is trading back and forth in pre-holiday trading session.
- A somewhat stronger US Dollar and BoC Rogers’ warnings about the country’s low productivity have weighed on the Loonie.
- The broader USD/CAD trend remains positive with 1.3615 capping bulls for now.
The Canadian Dollar (CAD) is trading back and forth, without a clear direction in Wednesday’s early US session, with the US Dollar having the upper hand in a thin trading session ahead of the Easter Holiday.
The Loonie opened the day on its back foot, following comments from the Bank Of Canada’s Senior Deputy Governor, Carolyn Rogers, complaining about the low productivity and poor levels of investment. The CAD, however, managed to pare some losses with Oil prices bouncing up during the European session and is now practically flat on the daily chart.
The US Energy Information Administration has reported an unexpected increase in Oil stockpiles during the week of March 22. These figures have capped the rebound on Crude prices and increased negative pressure on the Canadian Dollar.
In the absence of first-tier macroeconomic releases today, the focus is on Fed Governor Christopher Walles, who is expected to speak about monetary policy at the Economic Club of New York later on Wednesday.
Daily digest market movers: The USD/CAD treads water with investors awaiting US PCE Inflation data
- The Canadian Dollar is moving sideways with the US Dollar nudging higher in a quiet trading session.
- EIA Crude Oil stocks increased by 3,165 million Barrels in the week of March 22 against market expectations of a decline of above 1,275 million Barrels.
- Bank of Canada Senior Deputy Governor Rogers has warned that low productivity is going to be a hindrance to economic growth.
- On Tuesday, US macroeconomic releases showed mixed figures, with Durable Goods Orders increasing beyond expectations while the Conference Board’s Consumer Confidence contracted unexpectedly.
- According to the CME Group FedWatch Tool, markets are pricing more than a 60% chance that the Federal Reserve will start cutting rates in June, which is keeping USD bulls in check.
- The highlight of the week will be the US PCE Prices Index, the Fed’s inflation gauge of choice, which is expected to have accelerated at a 2.5% yearly pace in February from 2.4% in the previous month.
- The core PCE Prices Index is expected to have risen at a 2.8% yearly pace and 0.4% on the monthly rate in February, from 2.8% and 0.3%, respectively, in January.
Canadian Dollar price this week
The table below shows the percentage change of Canadian Dollar (CAD) against listed major currencies this week. Canadian Dollar was the weakest against the Pound Sterling.
| USD | EUR | GBP | CAD | AUD | JPY | NZD | CHF | |
| USD | -0.11% | -0.24% | -0.13% | -0.13% | 0.04% | -0.17% | 0.89% | |
| EUR | 0.12% | -0.13% | -0.01% | 0.00% | 0.15% | 0.00% | 1.00% | |
| GBP | 0.24% | 0.13% | 0.12% | 0.12% | 0.29% | 0.13% | 1.12% | |
| CAD | 0.15% | 0.04% | -0.09% | 0.03% | 0.14% | 0.03% | 1.03% | |
| AUD | 0.13% | -0.01% | -0.11% | 0.00% | 0.15% | -0.04% | 0.99% | |
| JPY | -0.05% | -0.15% | -0.19% | -0.15% | -0.16% | -0.19% | 0.85% | |
| NZD | 0.12% | 0.05% | -0.07% | 0.03% | 0.04% | 0.19% | 1.05% | |
| CHF | -0.87% | -1.01% | -1.13% | -1.01% | -1.00% | -0.93% | -1.00% |
The heat map shows percentage changes of major currencies against each other. The base currency is picked from the left column, while the quote currency is picked from the top row. For example, if you pick the Euro from the left column and move along the horizontal line to the Japanese Yen, the percentage change displayed in the box will represent EUR (base)/JPY (quote).
Technical analysis: The USD remains positive with 1.3615 resistance capping bulls for now
The USD/CAD keeps trading within an ascending channel, printing higher highs and higher lows, yet with price action limited below an important resistance area at 1.3615. The 50% Fibonacci retracement of the late 2023 sell-off and the trendline resistance are challenging bulls at this level.
On the downside, bearish attempts are limited at 1.3550 so far, with the next support areas at 1.3525 and the base of the channel at 1.3440.
USD/CAD 4-Hour Chart
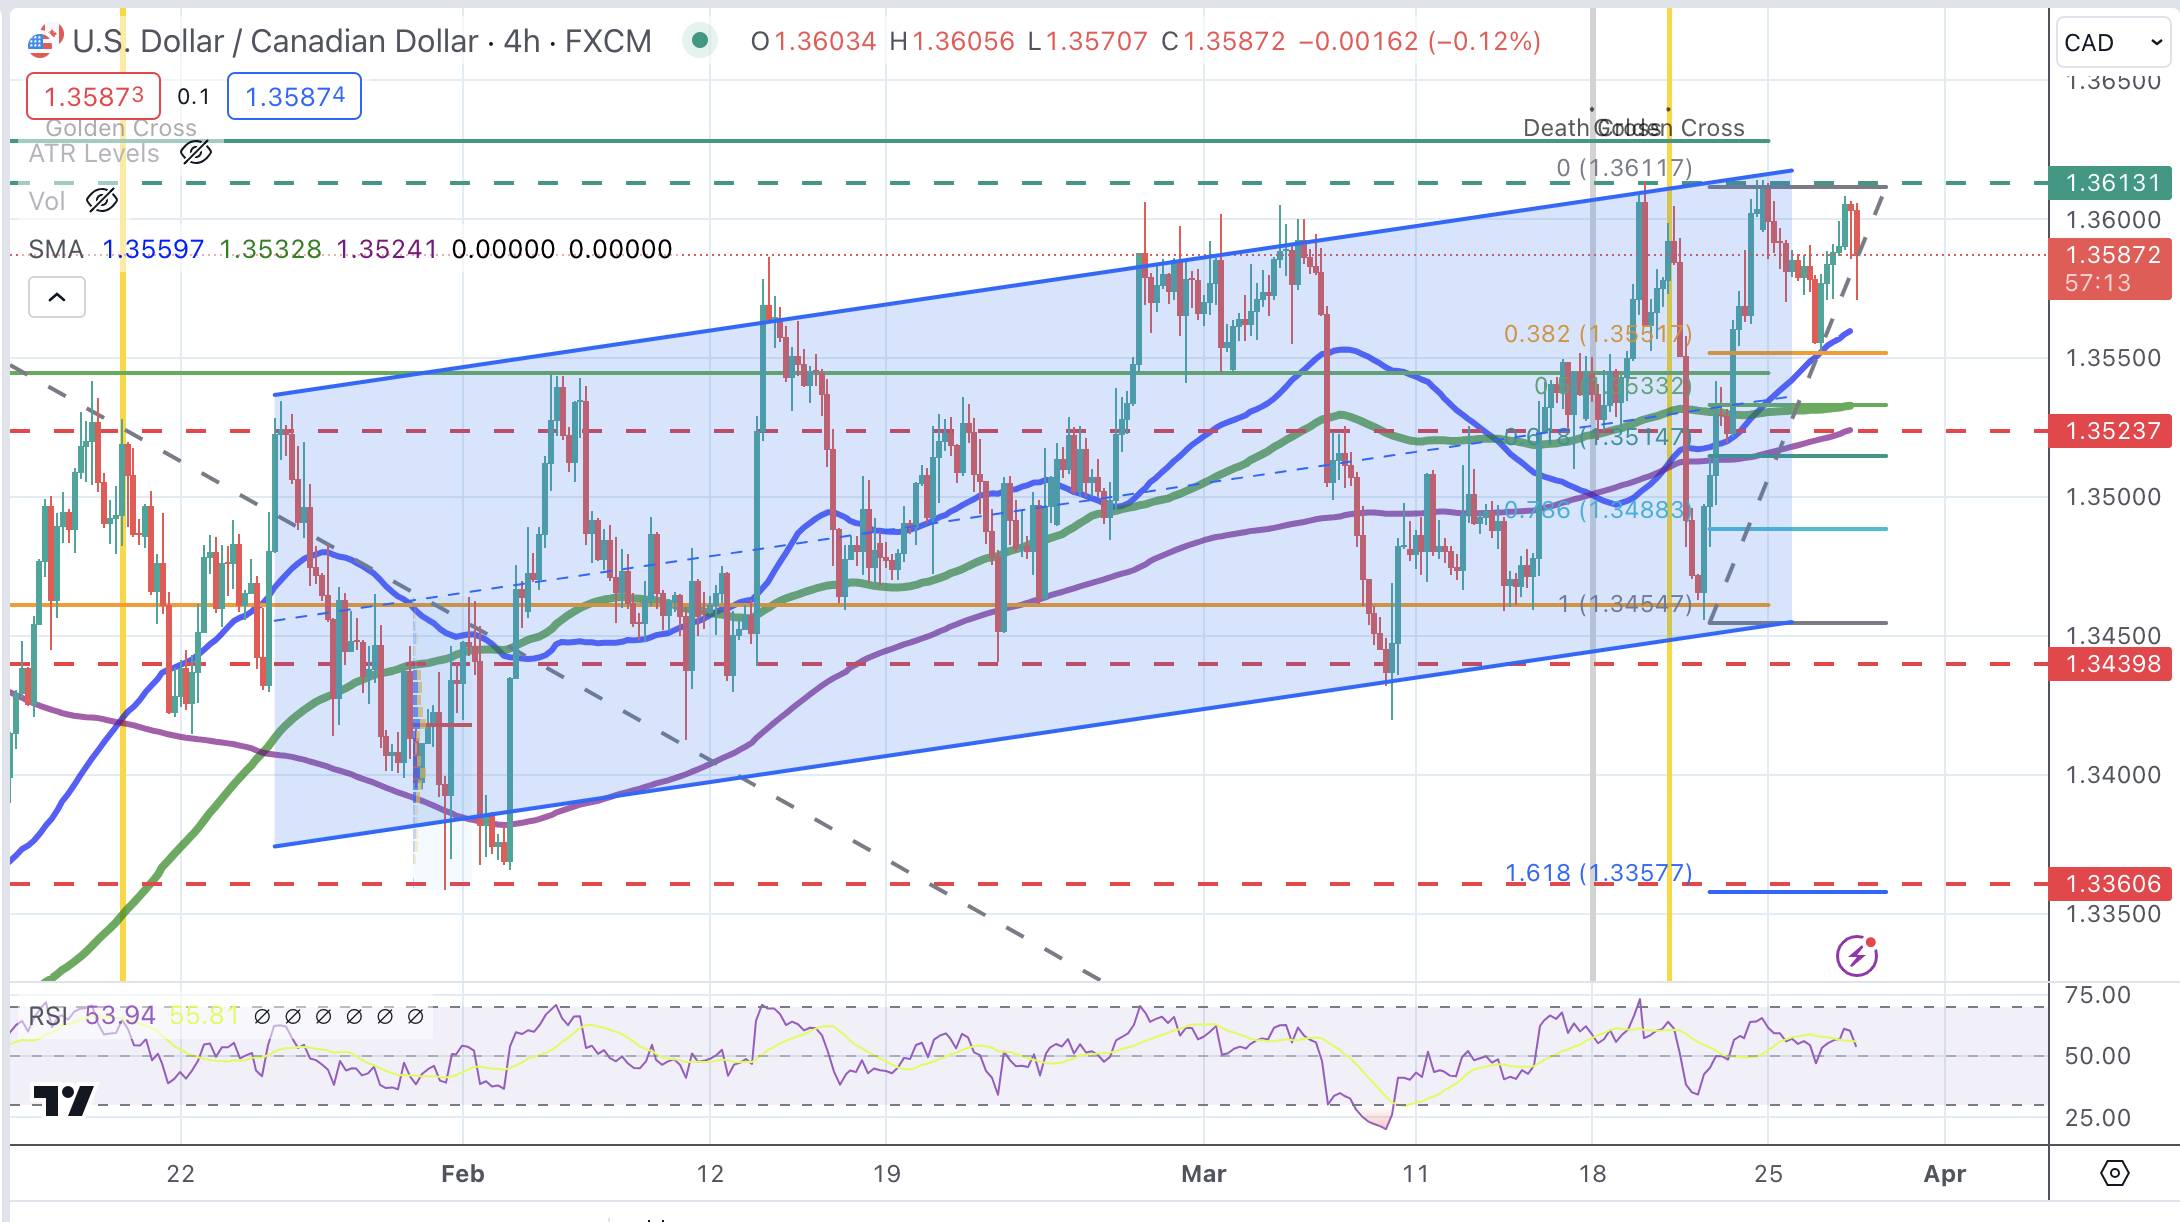
All in all, the Canadian Dollar remains biased higher, but it seems to need an extra boost to break above recent highs. The US PCE Prices Index and Fed Powell’s comments are due on Good Friday, and the low trading volumes might boost the impact of these events.
Inflation FAQs
Inflation measures the rise in the price of a representative basket of goods and services. Headline inflation is usually expressed as a percentage change on a month-on-month (MoM) and year-on-year (YoY) basis. Core inflation excludes more volatile elements such as food and fuel which can fluctuate because of geopolitical and seasonal factors. Core inflation is the figure economists focus on and is the level targeted by central banks, which are mandated to keep inflation at a manageable level, usually around 2%.
The Consumer Price Index (CPI) measures the change in prices of a basket of goods and services over a period of time. It is usually expressed as a percentage change on a month-on-month (MoM) and year-on-year (YoY) basis. Core CPI is the figure targeted by central banks as it excludes volatile food and fuel inputs. When Core CPI rises above 2% it usually results in higher interest rates and vice versa when it falls below 2%. Since higher interest rates are positive for a currency, higher inflation usually results in a stronger currency. The opposite is true when inflation falls.
Although it may seem counter-intuitive, high inflation in a country pushes up the value of its currency and vice versa for lower inflation. This is because the central bank will normally raise interest rates to combat the higher inflation, which attract more global capital inflows from investors looking for a lucrative place to park their money.
Formerly, Gold was the asset investors turned to in times of high inflation because it preserved its value, and whilst investors will often still buy Gold for its safe-haven properties in times of extreme market turmoil, this is not the case most of the time. This is because when inflation is high, central banks will put up interest rates to combat it. Higher interest rates are negative for Gold because they increase the opportunity-cost of holding Gold vis-a-vis an interest-bearing asset or placing the money in a cash deposit account. On the flipside, lower inflation tends to be positive for Gold as it brings interest rates down, making the bright metal a more viable investment alternative.
The timing and pace of the Fed’s rate cuts are long-term drivers for Gold, strategists at ANZ Bank say.
The FOMC needs more confidence that inflation is returning to 2% before considering cuts
Currently, the FOMC needs more confidence that inflation is returning to 2% before considering cuts.
We believe the cuts will commence from July 2024. Markets are pricing in cuts starting from H2 2024. That said, the push back in market expectations from March to June may cap the price rally.
The Japanese Yen (JPY) continues to languish. Economists at Scotiabank analyze USD/JPY outlook.
A rapid move higher in the JPY is possible
We forecast USD/JPY easing to 140.00 in H2. This is predicated primarily on the USD responding negatively to easier Fed monetary policy.
The onerous carry makes long JPY positions prohibitive unless market participants feel the JPY is poised to rally strongly and in quick order.
A rapid move higher in the JPY is possible – but perhaps only once traders are convinced that a Fed policy pivot is imminent.
Is inflation heating up again? Economists at ABN Amro think not.
Fed to begin lowering rates from June
The bottom line is that pipeline price pressures still point to significant disinflation to come, especially from housing rents, with rents for new leases growing at rates below the pre-pandemic trend already for the past half year. This takes time to feed through to inflation, with past relationships suggesting a lag of around one year. The other key pipeline pressure is wage growth, but this also looks relatively benign.
Inflation is forecast to be somewhat higher in the near term, but this largely reflects the earlier rise in oil prices than we anticipated; our year-end forecast for inflation is essentially unchanged.
With disinflation in our view very much on track, we therefore think the Fed remains on course to start lowering rates from June.
The price of Gold has reached a new record high following the Fed's meeting perceived as dovish. Economists at Scotiabank analyze the yellow metal’s outlook.
Gold rise remains a mystery
Due to the lack of a convincing explanation for the rise in the value of Gold, we are sceptical that the precious metal will be able to maintain its gains in the short term, let alone extend them further.
However, it is unlikely that prices will fall back to the levels seen at the end of February as the Fed is expected to cut interest rates from June, which should support Gold.
Nevertheless, further upside potential is likely to be limited in the medium to long term. This is because a pronounced cycle of interest rate cuts in the US is unlikely, given the persistent risks of inflation.
We have recently ‘only’ raised our Gold price forecast for the end of this year and the end of next year from $2,100 to $2,200.
- EUR/JPY continues declining and has formed a bearish pattern called a Measured Move.
- It is composed of three waves – wave C appears to be in mid development.
- The bearish 4-hour chart echoes weak technicals observed on the weekly chart.
EUR/JPY is down over a third of a percent, trading in the 163.70s on Wednesday, on the back of a mixture of probable intervention by the Japanese authorities to strengthen the Japanese Yen (JPY) and more dovish commentary from rate-setters at the European Central Bank (ECB).
The 4-hour chart is showing a bearish ABC Measured Move pattern forming which looks like it probably still has lower to go.
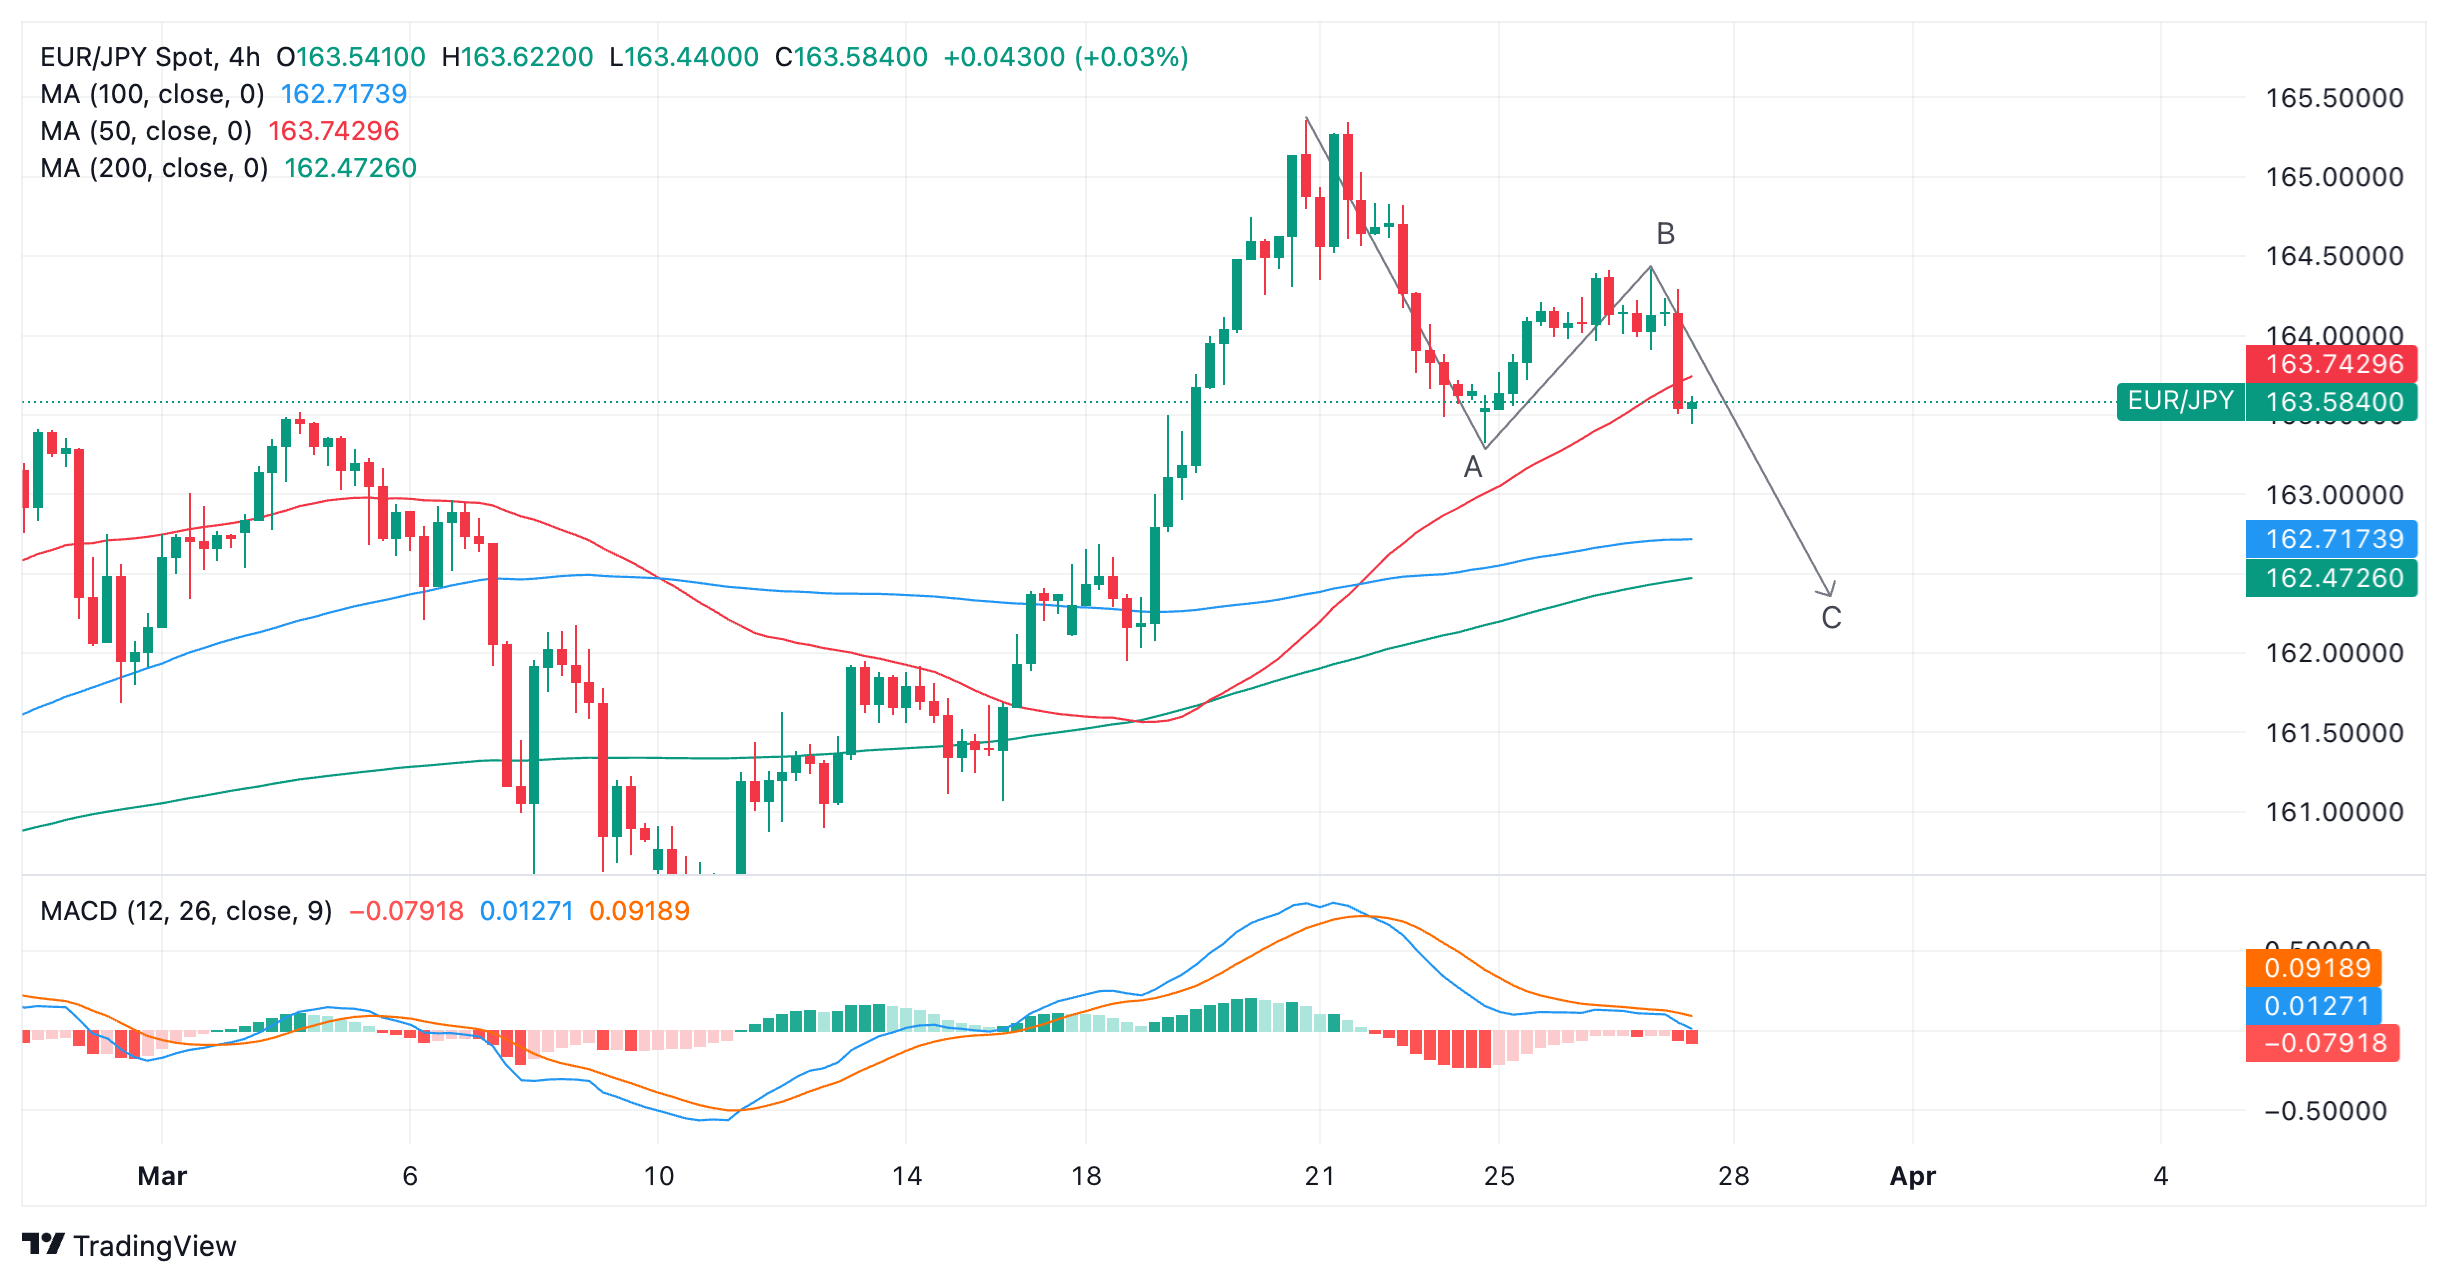
Euro versus Japanese Yen: 4-hour chart
If wave C is the same length as wave A, which is often the case, the Measured Move could stretch down to a target situated at about 162.40, just below the 200-4hr Simple Moving Average (SMA).
The pair has just completed a long red bearish Marubozu Japanese candlestick pattern which adds a further bearish tone to the chart. Even if there is a pullback after the sell-off it will probably only go as high as the midpoint of the Marubozu candle at 163.90 before probably continuing lower.
The short-term trend remains unclear but a break below the lows of wave A at 163.32 would provide confirmation shifting the odds in favor of a downtrend and a continuation of wave C.
The acute bearish divergence with the Relative Strength Indicator (RSI) on the Weekly chart as reported in a previous article, is further evidence supporting more downside.
EUR/USD holds a very narrow range in the low 1.0800s. Economists at Scotiabank analyze the world’s most popular currency pair outlook.
Resistance is seen at 1.0865/1.0875
Bargain hunters are still likely to look at dips to near 1.0800 as a buying opportunity for now.
Short-term trend dynamics are neutral while the daily and weekly DMIs still lean, if only moderately, EUR-bullish. That should limit downside pressure on spot in the near term at least.
Resistance is 1.0865/1.0875.
- USD/JPY drops from 152.00 as expectations for BoJ’s intervention deepen.
- The Japanese Yen remains weak despite BoJ exiting negative interest rates.
- The US Dollar exhibits strength ahead of the US core PCE Inflation data.
The USD/JPY pair finds intense selling pressure near historic highs of 152.00 in Wednesday’s late American session. The asset falls sharply after Japan’s Finance Ministry reported that The Bank of Japan, Ministry of Finance (MoF) and Financial Services Agency (FSA) are scheduled to hold a tri-party meeting.
This has deepened hopes of a stealth intervention by Japanese authorities into the FX domain to limit further downside in the Japanese Yen. Also, commentary from top currency diplomat Masato Kanda that he "won't rule out any steps to respond to disorderly FX moves" has reinforced expectations of Japan’s intervention against excessive currency moves.
The Japanese Yen has faced significant pressure in the last few trading sessions despite the BoJ exiting negative interest rates. It appears that investors are less confident about the BoJ’s move to policy normalization due to the absence of evidence about a wage growth spiral. Apart from that, investors hope that the BoJ’s move to further policy normalization will be very slow.
Meanwhile, the US Dollar is upbeat ahead of the United States core Personal Consumption Expenditure Price Index (PCE) data for February, which will be published on Good Friday. Trading volume is expected to remain low in that session as US equity and bond markets will remain closed.
The annual core PCE inflation is estimated to have grown steadily by 2.8%, with monthly growth declining to 0.3% from 0.4% in January. The US Dollar Index (DXY) is far from recapturing the monthly high of 104.50.
- AUD/USD sells off midweek after Australia prints lower-than-expected inflation in February.
- Another drop in Iron Ore prices, the country’s largest export, further weighs.
- The US Dollar sees broad-based gains after another strong show of US data.
AUD/USD is down by over two tenths of a percent in the 0.6610s on Wednesday after the release of Australian inflation data overnight weakened the Australian Dollar (AUD).
The pair was further undermined by broad based US Dollar (USD) strength, and an over two and a half percent decline in Iron Ore prices, Australia’s premier export.
The Australian Monthly Consumer Price Index showed inflation rose 3.4% in February compared to the previous year, missing expectations of 3.5% but equal to the 3.4% reported in January, according to data from the Australian Bureau of Statistics.
The lower-than-expected inflation data will have brought forward estimates of when the Reserve Bank of Australia (RBA) will likely cut interest rates. Previous expectations were for a cut in August, according to Reuters. Lower interest rates are negative for currencies as they reduce foreign capital inflows.
The US Dollar is up more broadly on Wednesday, however, with the Dollar Index (DXY) which tracks the currency against a trade-weighted basket, up a tenth of percent at the time of publication.
There appears to be no clear catalyst for the move higher although Tuesday’s US data was on the whole positive, showing a greater-than-expected rise in Durable Goods Orders in February. This adds to the tally of mostly positive data from the US and gives rate-setters at the Federal Reserve something to consider whether or not to begin cutting interest rates. As things stand, the data seems to be calling for a delay on too hasty cutting which is supporting the Buck.
Iron Ore sold off sharply on Wednesday further weighing on the AUD/USD given its importance in Aussie trade. Iron ore was trading at 107.50 a tonne at the time of publication, according to Tradingeconomics. The commodity was pulled down by a combination of continued negative China fundamentals, Australia’s largest export partner, and a fall in demand after restocking, according to Hellenic Shipping News.
On a positive note, the Westpac Leading Index in February showed a marginal 0.08% gain after declining 0.09% in the previous month.
USD/CAD’s rebound from the mid-1.3500s reached on Tuesday has extended to the low 1.3600s again. Economists at Scotiabank analyze the pair’s outlook.
Support remains at 1.3550
Spot gains from the intraday low on Tuesday have returned the USD to the recent range peaks around 1.3600/1.2610 but the lift in funds has given momentum a slightly more positive undertone on the intraday chart which tilts risks to the USD remaining firm or perhaps strengthening a bit more.
On the face of it, resistance around the figure has been solid but the CAD needs to do more work to remove the risk of the USD rebound extending (potentially towards the low 1.3700s).
Support remains 1.3550 and (firmer) 1.3450/1.3455.
GBP/USD trades flat on the day after failing to hold gains to the upper 1.2600s. Economists at Scotiabank analyze the pair’s outlook.
Support is 1.2600, resistance is 1.2665
The GBP/USD pair failed to generate much lift and Cable’s intraday peak around 1.2665/1.2770 on Tuesday morning may have set a short-term ceiling for Cable after Monday’s push higher.
More range trading looks likely in the short run.
Support is 1.2600/1.2610. Resistance is 1.2665/1.2675.
See: USD to remain resilient, downside risks to the GBP in the months ahead – HSBC
USD/JPY scratched the 152.00 level. Ulrich Leuchtmann, Head of FX and Commodity Research at Commerzbank, analyzes the pair’s outlook.
The MOF's firepower is in principle limited
Unlike in the 1990s and early 2000s, this time the direction of intervention (supporting the JPY) is one in which the MOF's firepower is in principle limited – by the stock of foreign exchange reserves. At this point, I should find out how much foreign exchange reserves the MOF has access to. All it takes is a few clicks on my screen. But I don't even need to do that. Because it must be absolutely clear that no currency reserves in the world will be sufficient if the foreign exchange market decides to bet against intervention.
But because a sufficient number of market participants have to agree on this, it is not certain that such market behavior will occur; it often requires a crystallization point, an occasion.
Friday's low inflation data from Tokyo could be such a crystallization point. This means that even though the market is currently reluctant to trade USD/JPY above 152.00, the Yen is far from being saved from further weakness.
- WTI Oil retreats below $82 on hefty increase in US crude stockpiles.
- Oil traders remain bullish, but the US stockpile build-up is difficult to ignore.
- The US Dollar Index trades above 104.00 and sees US Dollar bulls digging in their heels.
Oil prices are retreating on Wednesday, with traders gasping for air after seeing the overnight print from the American Petroleum Institute (API), which saw a massive 9.337 million build-up in US stockpiles. A number not to ignore as it means that current production cuts from OPEC could be proven insufficient to keep prices well supported. Meanwhile, commodity analyst Natasha Kaneva from JP Morgan said that Brent futures could jump to $100 after Russia recently asked producers to limit their production in order to comply with OPEC+ production cut agreements.
The US Dollar, meanwhile, is in calm water and steady above 104.00 when measured by the US Dollar Index (DXY). Traders are building a fortress above 104.00 in order to defend the level ahead of the US Gross Domestic Product numbers on Thursday and the Personal Consumption Expenditures (PCE) Price Index on Friday. With the market expectations building up towards an upbeat PCE print, markets could see the US Dollar rally into the weekend as investors tune down the number of interest-rate cuts for 2024.
Crude Oil (WTI) trades at $80.83 per barrel, and Brent Oil trades at $85.29 per barrel at the time of writing.
Oil news and market movers: Bullish sentiment gets crushed
- The US API reported a surprise build of 9.337 million barrels from a drawdown to 1.519 million barrels a week earlier.
- This Wednesday, at 14:30 GMT, the US Energy Information Administration will release its stockpile change, with expectations for a drawdown of 1.275 million barrels.
- Bloomberg reports that Libya has appointed Khalifa Abdul Sadiq as interim oil minister, replacing Mohamed Oun. Oun got suspended pending an investigation after possible violations that led to neglecting the rights of the Libyan State, circumventing the law and wasting public money.
- Oil could see further gains if OPEC+ prolongs current production cuts until possibly the end of 2024.
Oil Technical Analysis: Holding for now
Oil prices are retreating a touch after the staggering build-up in US stockpile numbers. This takes out the wind for Russia, which tried to push oil prices higher by limiting its oil production recently ahead of the OPEC+ meeting next week. The ball is in OPEC’s court now, with the possibility of prolonging current production cuts on the table.
Oil bulls will see $86 appearing as the next cap. Further up, $86.90 follows suit before targeting $89.64 and $93.98 as top levels.
On the downside, both $80.00 and $80.60 should be acting as support with the 200-day Simple Moving Average (SMA) as the level to catch any falling knives near $78.55. The 100-day and the 55-day SMA’s are near $75.64 and $77.15, respectively. Add the pivotal level near $75.27, and it looks like the downside is very limited and well-equipped to resist the selling pressure.
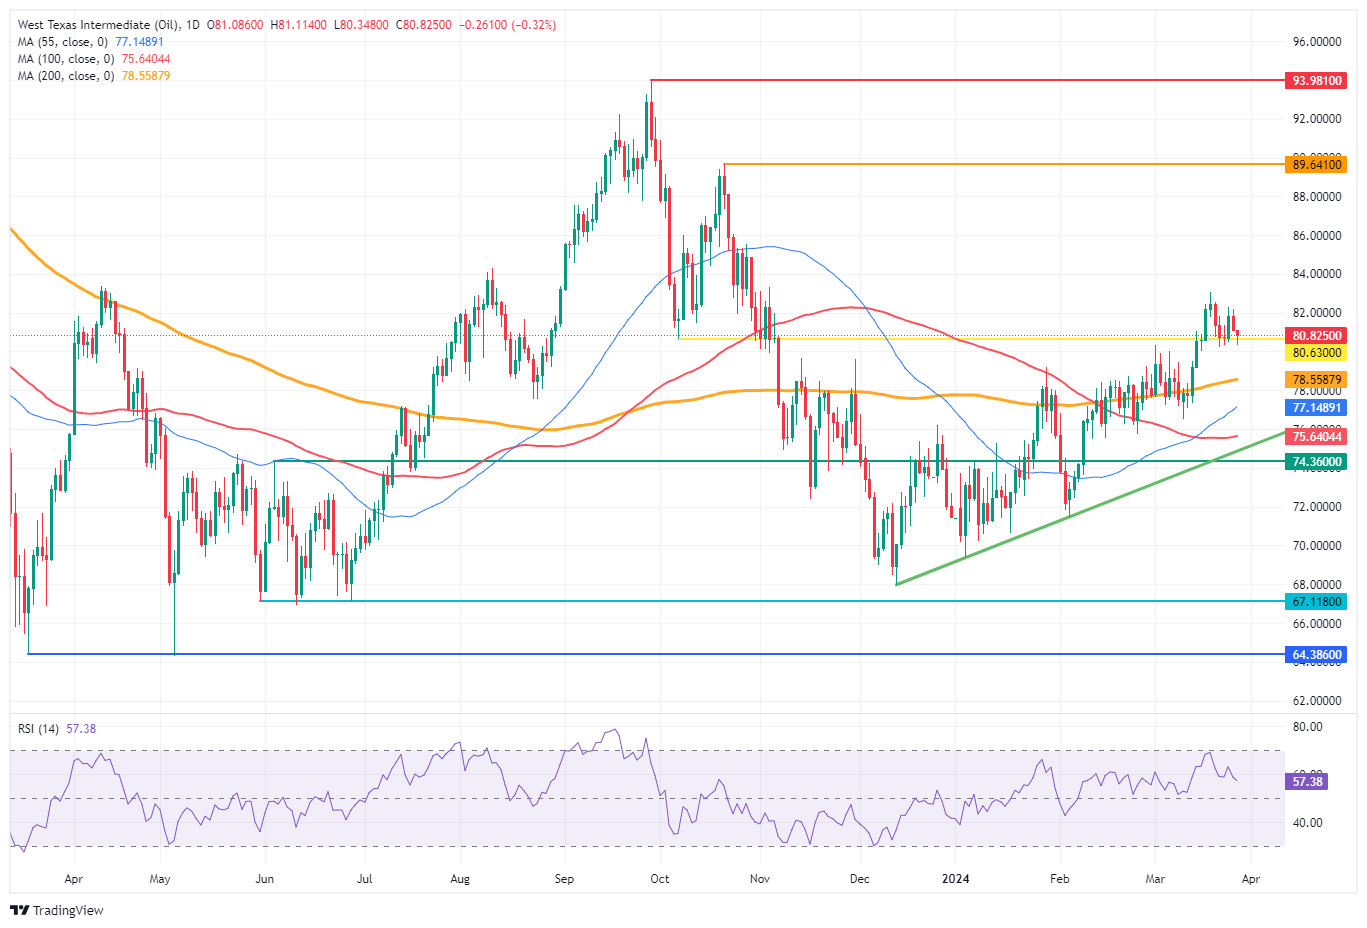
US WTI Crude Oil: Daily Chart
WTI Oil FAQs
WTI Oil is a type of Crude Oil sold on international markets. The WTI stands for West Texas Intermediate, one of three major types including Brent and Dubai Crude. WTI is also referred to as “light” and “sweet” because of its relatively low gravity and sulfur content respectively. It is considered a high quality Oil that is easily refined. It is sourced in the United States and distributed via the Cushing hub, which is considered “The Pipeline Crossroads of the World”. It is a benchmark for the Oil market and WTI price is frequently quoted in the media.
Like all assets, supply and demand are the key drivers of WTI Oil price. As such, global growth can be a driver of increased demand and vice versa for weak global growth. Political instability, wars, and sanctions can disrupt supply and impact prices. The decisions of OPEC, a group of major Oil-producing countries, is another key driver of price. The value of the US Dollar influences the price of WTI Crude Oil, since Oil is predominantly traded in US Dollars, thus a weaker US Dollar can make Oil more affordable and vice versa.
The weekly Oil inventory reports published by the American Petroleum Institute (API) and the Energy Information Agency (EIA) impact the price of WTI Oil. Changes in inventories reflect fluctuating supply and demand. If the data shows a drop in inventories it can indicate increased demand, pushing up Oil price. Higher inventories can reflect increased supply, pushing down prices. API’s report is published every Tuesday and EIA’s the day after. Their results are usually similar, falling within 1% of each other 75% of the time. The EIA data is considered more reliable, since it is a government agency.
OPEC (Organization of the Petroleum Exporting Countries) is a group of 13 Oil-producing nations who collectively decide production quotas for member countries at twice-yearly meetings. Their decisions often impact WTI Oil prices. When OPEC decides to lower quotas, it can tighten supply, pushing up Oil prices. When OPEC increases production, it has the opposite effect. OPEC+ refers to an expanded group that includes ten extra non-OPEC members, the most notable of which is Russia.
Economists at HSBC analyze the US Dollar (USD) and the Pound Sterling (GBP) outlook for the coming months.
USD is likely to remain resilient
Looking ahead, the broad USD is likely to remain determined by the interplay of risk appetite and rates. For now, the USD appears to be able to find a floor in the recent ‘risk-on’ environment.
Relative rates may offer some support to the USD if other central banks show more dovish momentum. The most recent example was from the BoE’s 21 March decision. The MPC members who voted for a hike in February decided to join the majority in March to keep the policy rate unchanged at 5.25%. With the BoE inching towards easing and cutting at least as much as its peers, the GBP will likely face downward pressures.
- The US Dollar snaps this week’s decline and jumps back up on Wednesday.
- Traders are sitting on their hands ahead of GDP and PCE inflation data later this week.
- The US Dollar Index locks in above 104.00 and is expected to defend this level ahead of the pivotal data.
The US Dollar (USD) broadly consolidates on Wednesday, holding to recent gains and ending the losing streak for this week so far. Markets are not really seeing a main driver for the turnaround, so this move should be taken with a pinch of salt. This could result in the Greenback trading in a tight range until the release of important economic data later this week, namely the US Gross Domestic Product (GDP) on Thursday and the Personal Consumption Expenditures (PCE) Price Index, the Fed’s preferred inflation gauge, on Friday.
A very light US calendar is ahead on Wednesday, with only the Mortgage Bankers Association delivering its weekly Mortgage Applications for this week. Markets will be able to hear from a Fed official as Fed Board Member Christopher Waller will deliver a speech about the US Economic Outlook at the Economic Club of New York. Known for being a hawk, any change in the number of interest-rate cuts or timing could be important for the Greenback’s valuation.
Daily digest market movers: Hawk Waller main event
- The Mortgage Bankers Association has released the weekly Mortgage Applications Index for this week at 11:00 GMT. The previous number showed a 1.6% contraction compared with a week earlier, and this week was no different with a contraction by 0.7%.
- The US Treasury is issuing another bond, this time in the 7-year tenor at 17:00 GMT.
- Fed Board Member Christopher Waller will speak about the US Economic Outlook at the Economic Club of New York around 22:00 GMT.
- Equities are overall in the green, except for China, where both the Hong Kong Hang Seng Index and the Shenzhen Index have retreated over 1%. European and US equities are in the green by 0.25% on average.
- According to the CME Group’s FedWatch Tool, expectations for the Fed’s May 1 meeting are at 88.3% for keeping the fed funds rate unchanged, while chances of a rate cut are at 11.7%.
- The benchmark 10-year US Treasury Note trades around 4.23%, a touch softer from Tuesday’s high at 4.27%.
US Dollar Index Technical Analysis: trenches at 104.00
The US Dollar Index (DXY) is entrenching itself (or at least the Dollar bulls are) above 104.00. Shovels and pitchforks are used by traders to make sure that the Greenback does not retreat below 104.00, with the idea that both US GDP and PCE data will beat expectations, favoring a stronger US Dollar. It appears some conviction is creeping in the markets that the US economy will keep soaring, together with a return of inflation. This, in turn, means that the Fed wouldn’t need to cut interest rates three times this year as the economy would be on a path for a soft landing.
That first pivotal level for the DXY is near 104.60, where last week’s rally peaked. Further up, 104.96 remains the level to beat in order to tackle 105.00. Once above there, 105.12 is the last resistance point for now before the Relative Strength Index (RSI) will trade in overbought levels.
Support from the 200-day Simple Moving Average (SMA) at 103.74, the 100-day SMA at 103.48, and the 55-day SMA at 103.64 are unable to show their importance as support because traders didn’t wait for a drop to those levels for a turnaround. The 103.00 big figure looks to remain unchallenged for longer, after the decline in the wake of the Fed meeting last week got turned around way before reaching it.
US Dollar FAQs
The US Dollar (USD) is the official currency of the United States of America, and the ‘de facto’ currency of a significant number of other countries where it is found in circulation alongside local notes. It is the most heavily traded currency in the world, accounting for over 88% of all global foreign exchange turnover, or an average of $6.6 trillion in transactions per day, according to data from 2022. Following the second world war, the USD took over from the British Pound as the world’s reserve currency. For most of its history, the US Dollar was backed by Gold, until the Bretton Woods Agreement in 1971 when the Gold Standard went away.
The most important single factor impacting on the value of the US Dollar is monetary policy, which is shaped by the Federal Reserve (Fed). The Fed has two mandates: to achieve price stability (control inflation) and foster full employment. Its primary tool to achieve these two goals is by adjusting interest rates. When prices are rising too quickly and inflation is above the Fed’s 2% target, the Fed will raise rates, which helps the USD value. When inflation falls below 2% or the Unemployment Rate is too high, the Fed may lower interest rates, which weighs on the Greenback.
In extreme situations, the Federal Reserve can also print more Dollars and enact quantitative easing (QE). QE is the process by which the Fed substantially increases the flow of credit in a stuck financial system. It is a non-standard policy measure used when credit has dried up because banks will not lend to each other (out of the fear of counterparty default). It is a last resort when simply lowering interest rates is unlikely to achieve the necessary result. It was the Fed’s weapon of choice to combat the credit crunch that occurred during the Great Financial Crisis in 2008. It involves the Fed printing more Dollars and using them to buy US government bonds predominantly from financial institutions. QE usually leads to a weaker US Dollar.
Quantitative tightening (QT) is the reverse process whereby the Federal Reserve stops buying bonds from financial institutions and does not reinvest the principal from the bonds it holds maturing in new purchases. It is usually positive for the US Dollar.
- Gold price jumps higher as expectations that the Fed will cut interest rates in June remain firm.
- The Fed appears to be confident that inflation is easing toward the 2% target.
- Investors await the US core PCE inflation for fresh guidance.
Gold price (XAU/USD) soars to $2,200 in Wednesday’s European session amid multiple tailwinds. The main driver is that expectations for the Federal Reserve (Fed) reducing interest rates from the June meeting remain firm. These expectations, which also price in two more cuts by the end of the year, have strengthened the appeal of Gold.
On Monday, Chicago Fed Bank President Austan Goolsbee cautioned that the inflation outlook is uncertain due to higher housing inflation. However, he remained confident that the fundamental story of inflation returning to the 2% target has not changed.
Firm market expectations for the Fed cutting rates in June have supported Gold prices as it lower the opportunity cost of investing in it. Meanwhile, 10-year US Treasury yields are slightly up at 4.24% but remain inside Tuesday’s trading range as investors await the crucial United States core Personal Consumption Expenditure (PCE) price index for February, which will be published on Friday. The underlying inflation data will significantly influence Gold prices as it will provide some clues over the time frame in which the Fed intends to start cutting interest rates.
The US Dollar Index (DXY), which measures Greenback’s value against six major currencies, retreats slightly from 104.40.
Daily digest market movers: Gold price advances while US Dollar falls back
- Gold price rises to $2,190, aiming to recapture all-time highs of $2,223. Investors remain gung-ho for Gold as expectations for the Federal Reserve to begin rate cuts from the June policy meeting have strengthened.
- The CME FedWatch tool shows that there is almost a 70% chance that a rate-cut cycle will get started in June. Last week, bets for the Fed lowering key borrowing rates from June were dashed by hot consumer price inflation readings. However, the release of the latest dot plot – which pointed out that officials still expect three rate cuts in 2024 – has renewed hopes of upcoming rate cuts.
- The Fed is confident that the underlying story of inflation easing to 2% has not changed despite back-to-back stubborn Consumer Price Index (CPI) data in the first two months of 2024. However, the Fed didn’t offer any cues about when it could start cutting rates.
- This week, the release of the United States core PCE price index data for February will provide fresh cues about Fed rate cut timing. Uncertainty over the timing of rate cuts could deepen if the inflation data turns out hotter than expected.
- Core PCE is estimated to have grown steadily by 2.8%, with monthly growth declining to 0.3% from 0.4% in January. A stubborn inflation data would dampen the Gold’s appeal as hot inflation figures could delay the Federal Reserve’s plans to reduce interest rates. On the contrary, soft inflation figures could hit the US Dollar and US bond yields, supporting demand for Gold.
- But before that, investors will focus on the speech from Fed Governor Christopher Waller, who will speak at 22:00 GMT about the US economic outlook before the Economic Club of New York. Investors will keenly focus on fresh guidance on interest rates.
Technical Analysis: Gold climbs above $2,190
Gold price jumps above $2,190 amid multiple tailwinds. The precious metal is aiming to recapture the all-time highs slightly above $2,220. The near-term demand is upbeat as all short-to-long term Exponential Moving Averages (EMAs) are sloping higher.
The Gold price could face a hurdle near $2,250, which coincides with the 161.8% Fibonacci extension level, after breaking above the resistance of $2,220. The Fibonacci tool is plotted from December 4 high at $2,144.48 to December 13 low at $1,973.13. On the downside, December 4 high at $2,144.48 will support the Gold price bulls.
The 14-period Relative Strength Index (RSI) rebounds after cooling down to 64.00 from an extremely overbought zone.
Gold FAQs
Gold has played a key role in human’s history as it has been widely used as a store of value and medium of exchange. Currently, apart from its shine and usage for jewelry, the precious metal is widely seen as a safe-haven asset, meaning that it is considered a good investment during turbulent times. Gold is also widely seen as a hedge against inflation and against depreciating currencies as it doesn’t rely on any specific issuer or government.
Central banks are the biggest Gold holders. In their aim to support their currencies in turbulent times, central banks tend to diversify their reserves and buy Gold to improve the perceived strength of the economy and the currency. High Gold reserves can be a source of trust for a country’s solvency. Central banks added 1,136 tonnes of Gold worth around $70 billion to their reserves in 2022, according to data from the World Gold Council. This is the highest yearly purchase since records began. Central banks from emerging economies such as China, India and Turkey are quickly increasing their Gold reserves.
Gold has an inverse correlation with the US Dollar and US Treasuries, which are both major reserve and safe-haven assets. When the Dollar depreciates, Gold tends to rise, enabling investors and central banks to diversify their assets in turbulent times. Gold is also inversely correlated with risk assets. A rally in the stock market tends to weaken Gold price, while sell-offs in riskier markets tend to favor the precious metal.
The price can move due to a wide range of factors. Geopolitical instability or fears of a deep recession can quickly make Gold price escalate due to its safe-haven status. As a yield-less asset, Gold tends to rise with lower interest rates, while higher cost of money usually weighs down on the yellow metal. Still, most moves depend on how the US Dollar (USD) behaves as the asset is priced in dollars (XAU/USD). A strong Dollar tends to keep the price of Gold controlled, whereas a weaker Dollar is likely to push Gold prices up.
- USD/JPY could be forming a bearish Key Reversal Day.
- A bearish close on Wednesday will validate the one-day pattern.
- It often signifies major peaks and occurred at the highs of the stock market in 2007 prior to the crisis.
USD/JPY is trading back in the lower 151.000s on Wednesday after rising up to a new high of 151.970 during the Asian session, its highest level for decades.
The rapid reversal has been put down to intervention by the Japanese authorities who do not wish to see the Japanese Yen (JPY) depreciate any further.
Such a strong reversal over the course of one day has a special term in technical analysis – it is called a “Key Reversal Day”.
Key Reversal Days are a sign a major reversal in price is on the horizon. It is defined as a day in which price rises up to a new long-term high before rolling over and closing below the low of the previous day (rectangled). The sudden shift in sentiment is indicative of a sea-change in the fundamental outlook for the asset’s price.
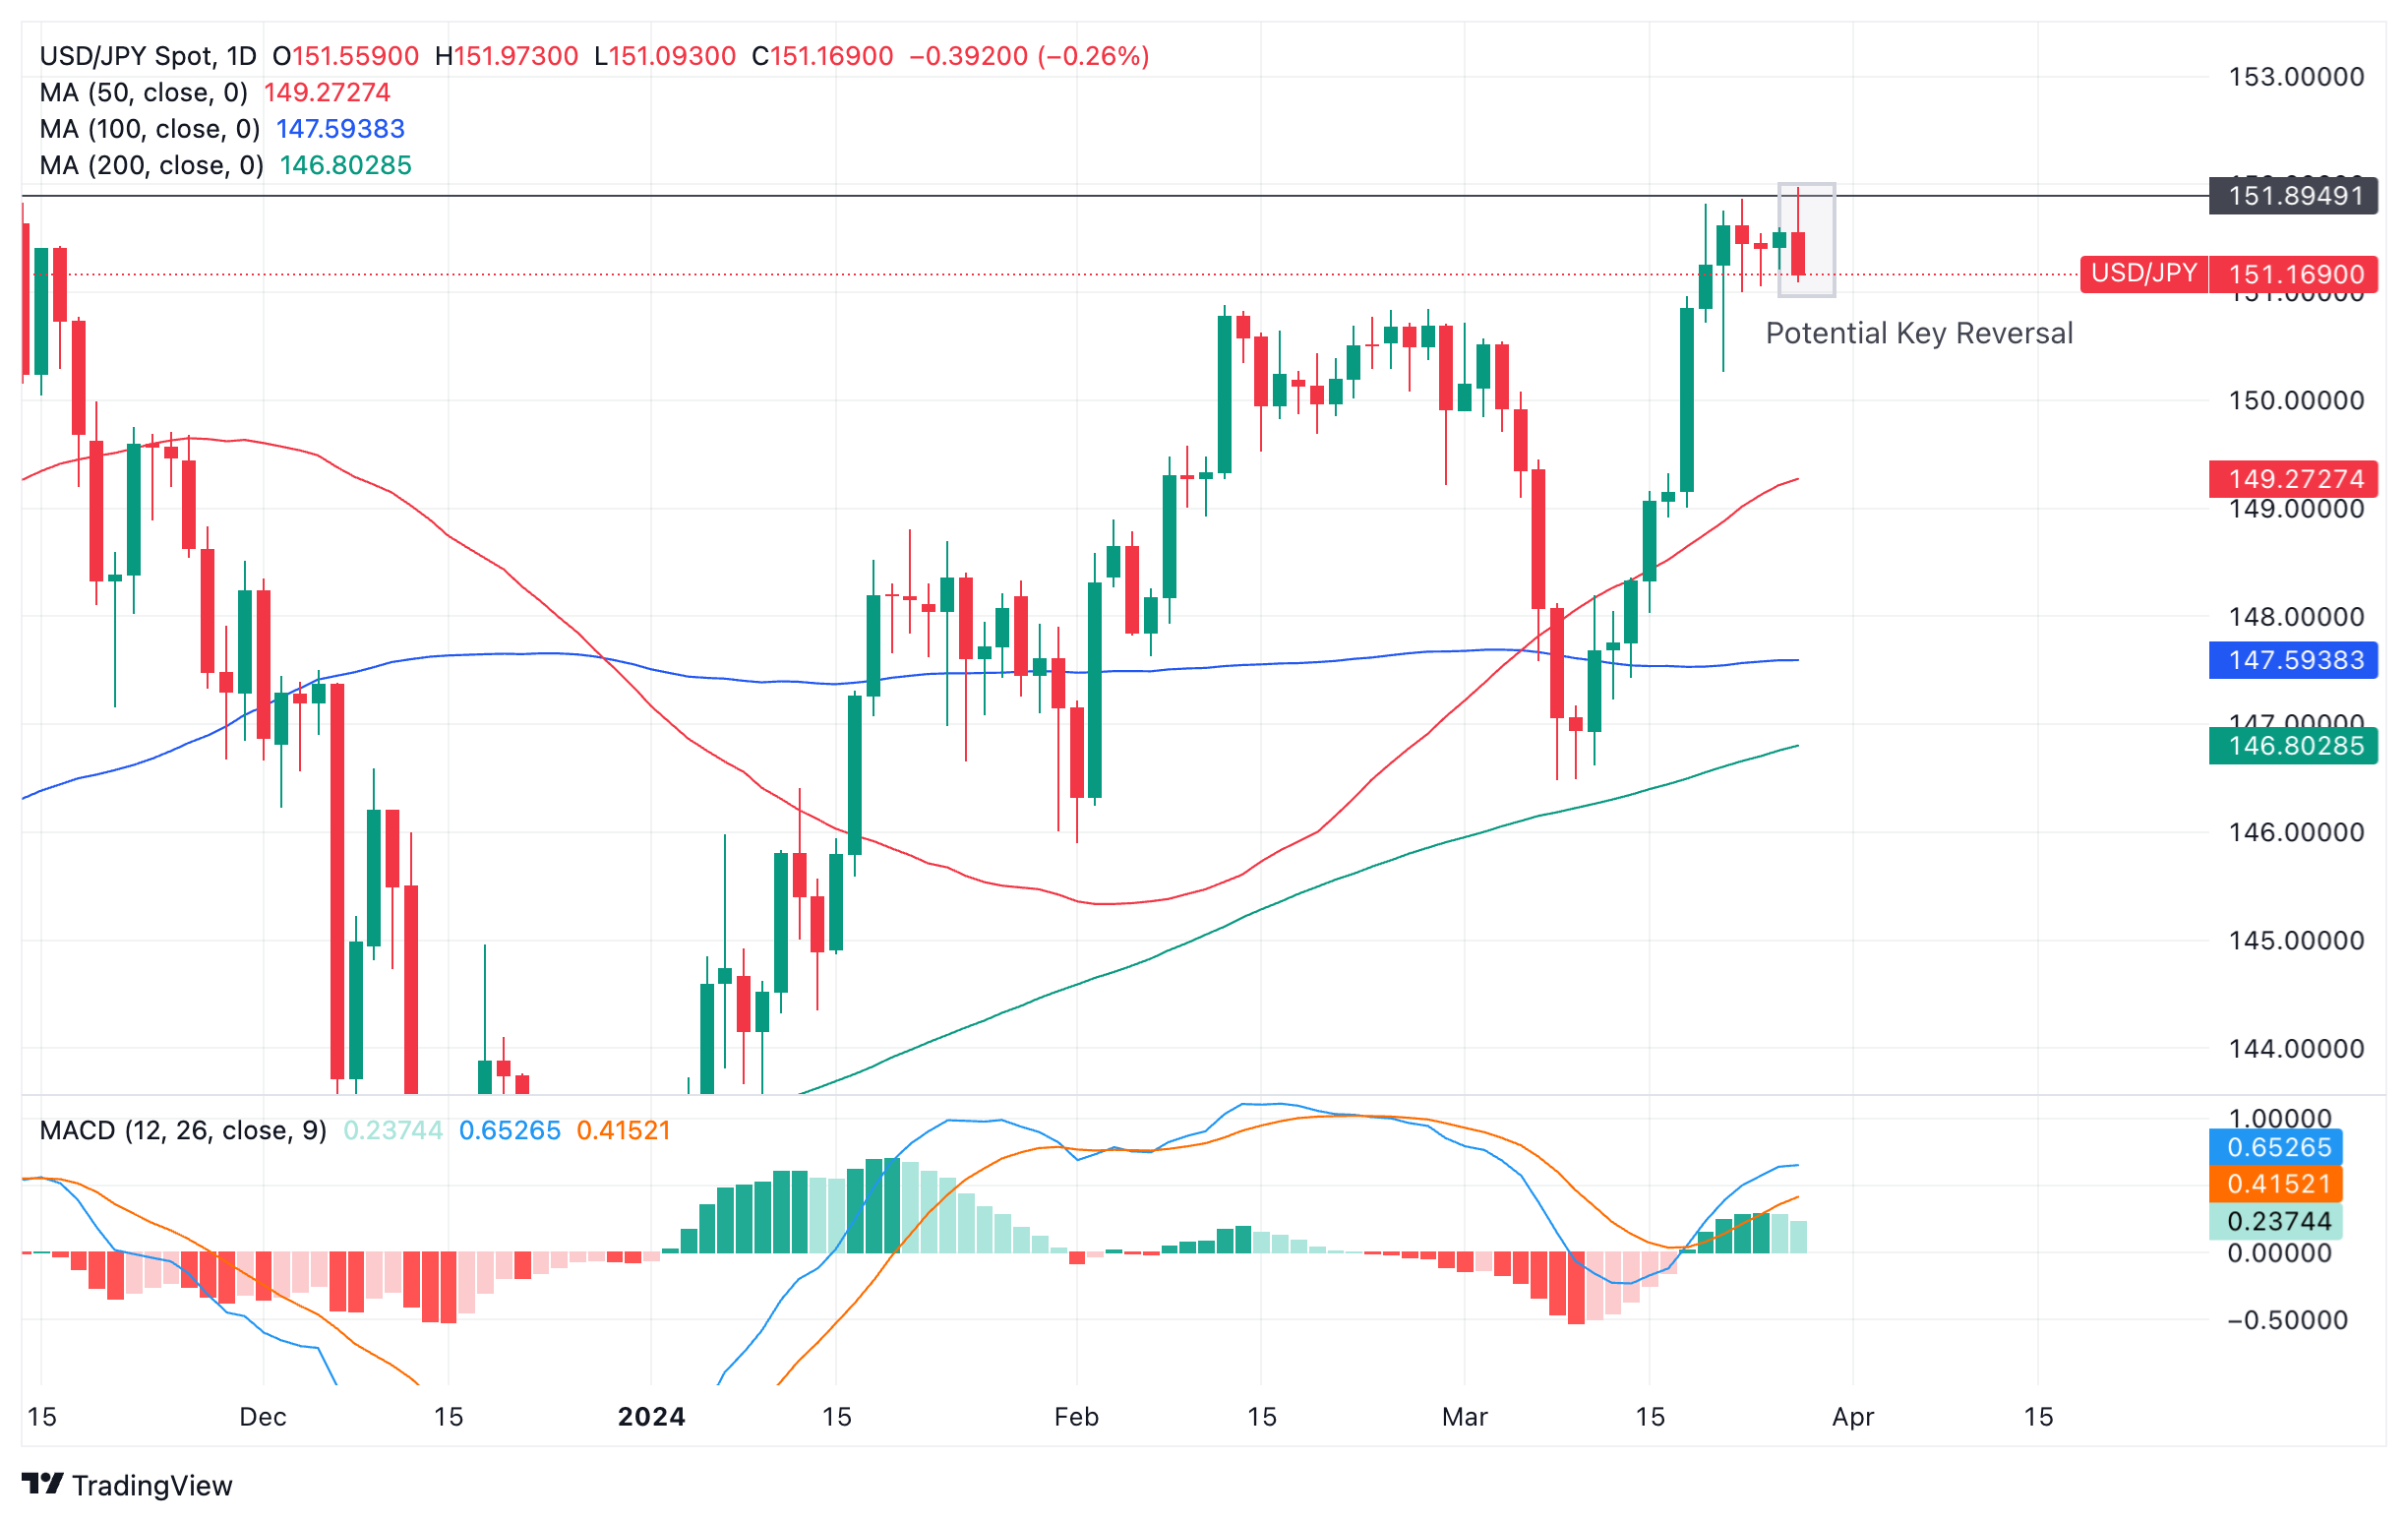
US Dollar versus Japanese Yen: Daily chart
If USD/JPY can maintain its current losses until the end of the day on Wednesday, it will have achieved a Key Reversal Day and may be in line for more losses to come. If it fails to close below Tuesday’s lows at 151.207 it will fail to meet the criteria for a key reversal.
A Key Reversal happened on the S&P 500 index on October 11, 2007 at the peak of the stock market rally just prior to the Great Financial Crisis.
It marked the peak price the S&P 500 achieved before the bear market that followed the banking crisis.
S&P500: Daily chart
Although this subtle though important clue of future weakness largely went unnoticed by most investors, a few technical analysts brought it to attention at the time!
Physical Gold demand has been showing a strong resilience to higher prices since 2021. However, any further increase in physical demand will be limited, strategists at ANZ Bank say.
Higher prices could temper physical offtake this year
Demand for Gold is still strong in China, as imports doubled to 153t in January from the previous month. This makes us think the motivation behind investment in Gold may mitigate affordability issues due to the sharp rise in Gold prices. This could keep demand steady, but a significant increase will be unlikely.
India’s Gold consumption fell marginally in 2023, though remained near the pre-pandemic average of 750t. Structural Gold demand looks strong due to the increasingly affluent population, but the recent price rally could weigh on physical offtake. We estimate Gold consumption to remain steady at 750t in 2024.
- The Swiss Franc gains after the ZEW survey shows Swiss investors are optimistic about the economic outlook.
- The survey showed an increase in sentiment for the second month in a row.
- USD/CHF hits a key upside target and rolls over – potentially initiating a pullback.
The Swiss Franc (CHF) is trading higher in most key pairs on Wednesday, after the release of a Swiss investor survey showed upbeat responses regarding the outlook for the Swiss economy for the second month in a row.
Swiss Franc gets boost after investor survey reflects optimism
The Swiss Franc is rising midweek after the release of the Swiss ZEW Survey – Expectations for March, which showed investors were, on balance, positive in their responses, by a margin of 11.5, up from 10.2 in February.
The result marks the second positive month in a row after results fell and remained below zero in March 2022. The survey is thought to reflect investors’ optimism following the 0.25% reduction in interest rates by the Swiss National Bank (SNB) at its March meeting, according to Tradingeconomics.com.
-638471314742002383.png)
Swiss ZEW Survey – Expectations: 5-year chart
Technical Analysis: Swiss Franc meets first target for breakout and pulls back
USD/CHF – the number of Swiss Francs that can be bought with one US Dollar (USD) – broke above the key 0.9000 level and reached a peak of 0.9063 on Wednesday, before rolling over.
The pair looks like it may be pulling back within an established short-term uptrend, which began after USD/CHF broke out of the range it had been trading in for most February and the first half of March.
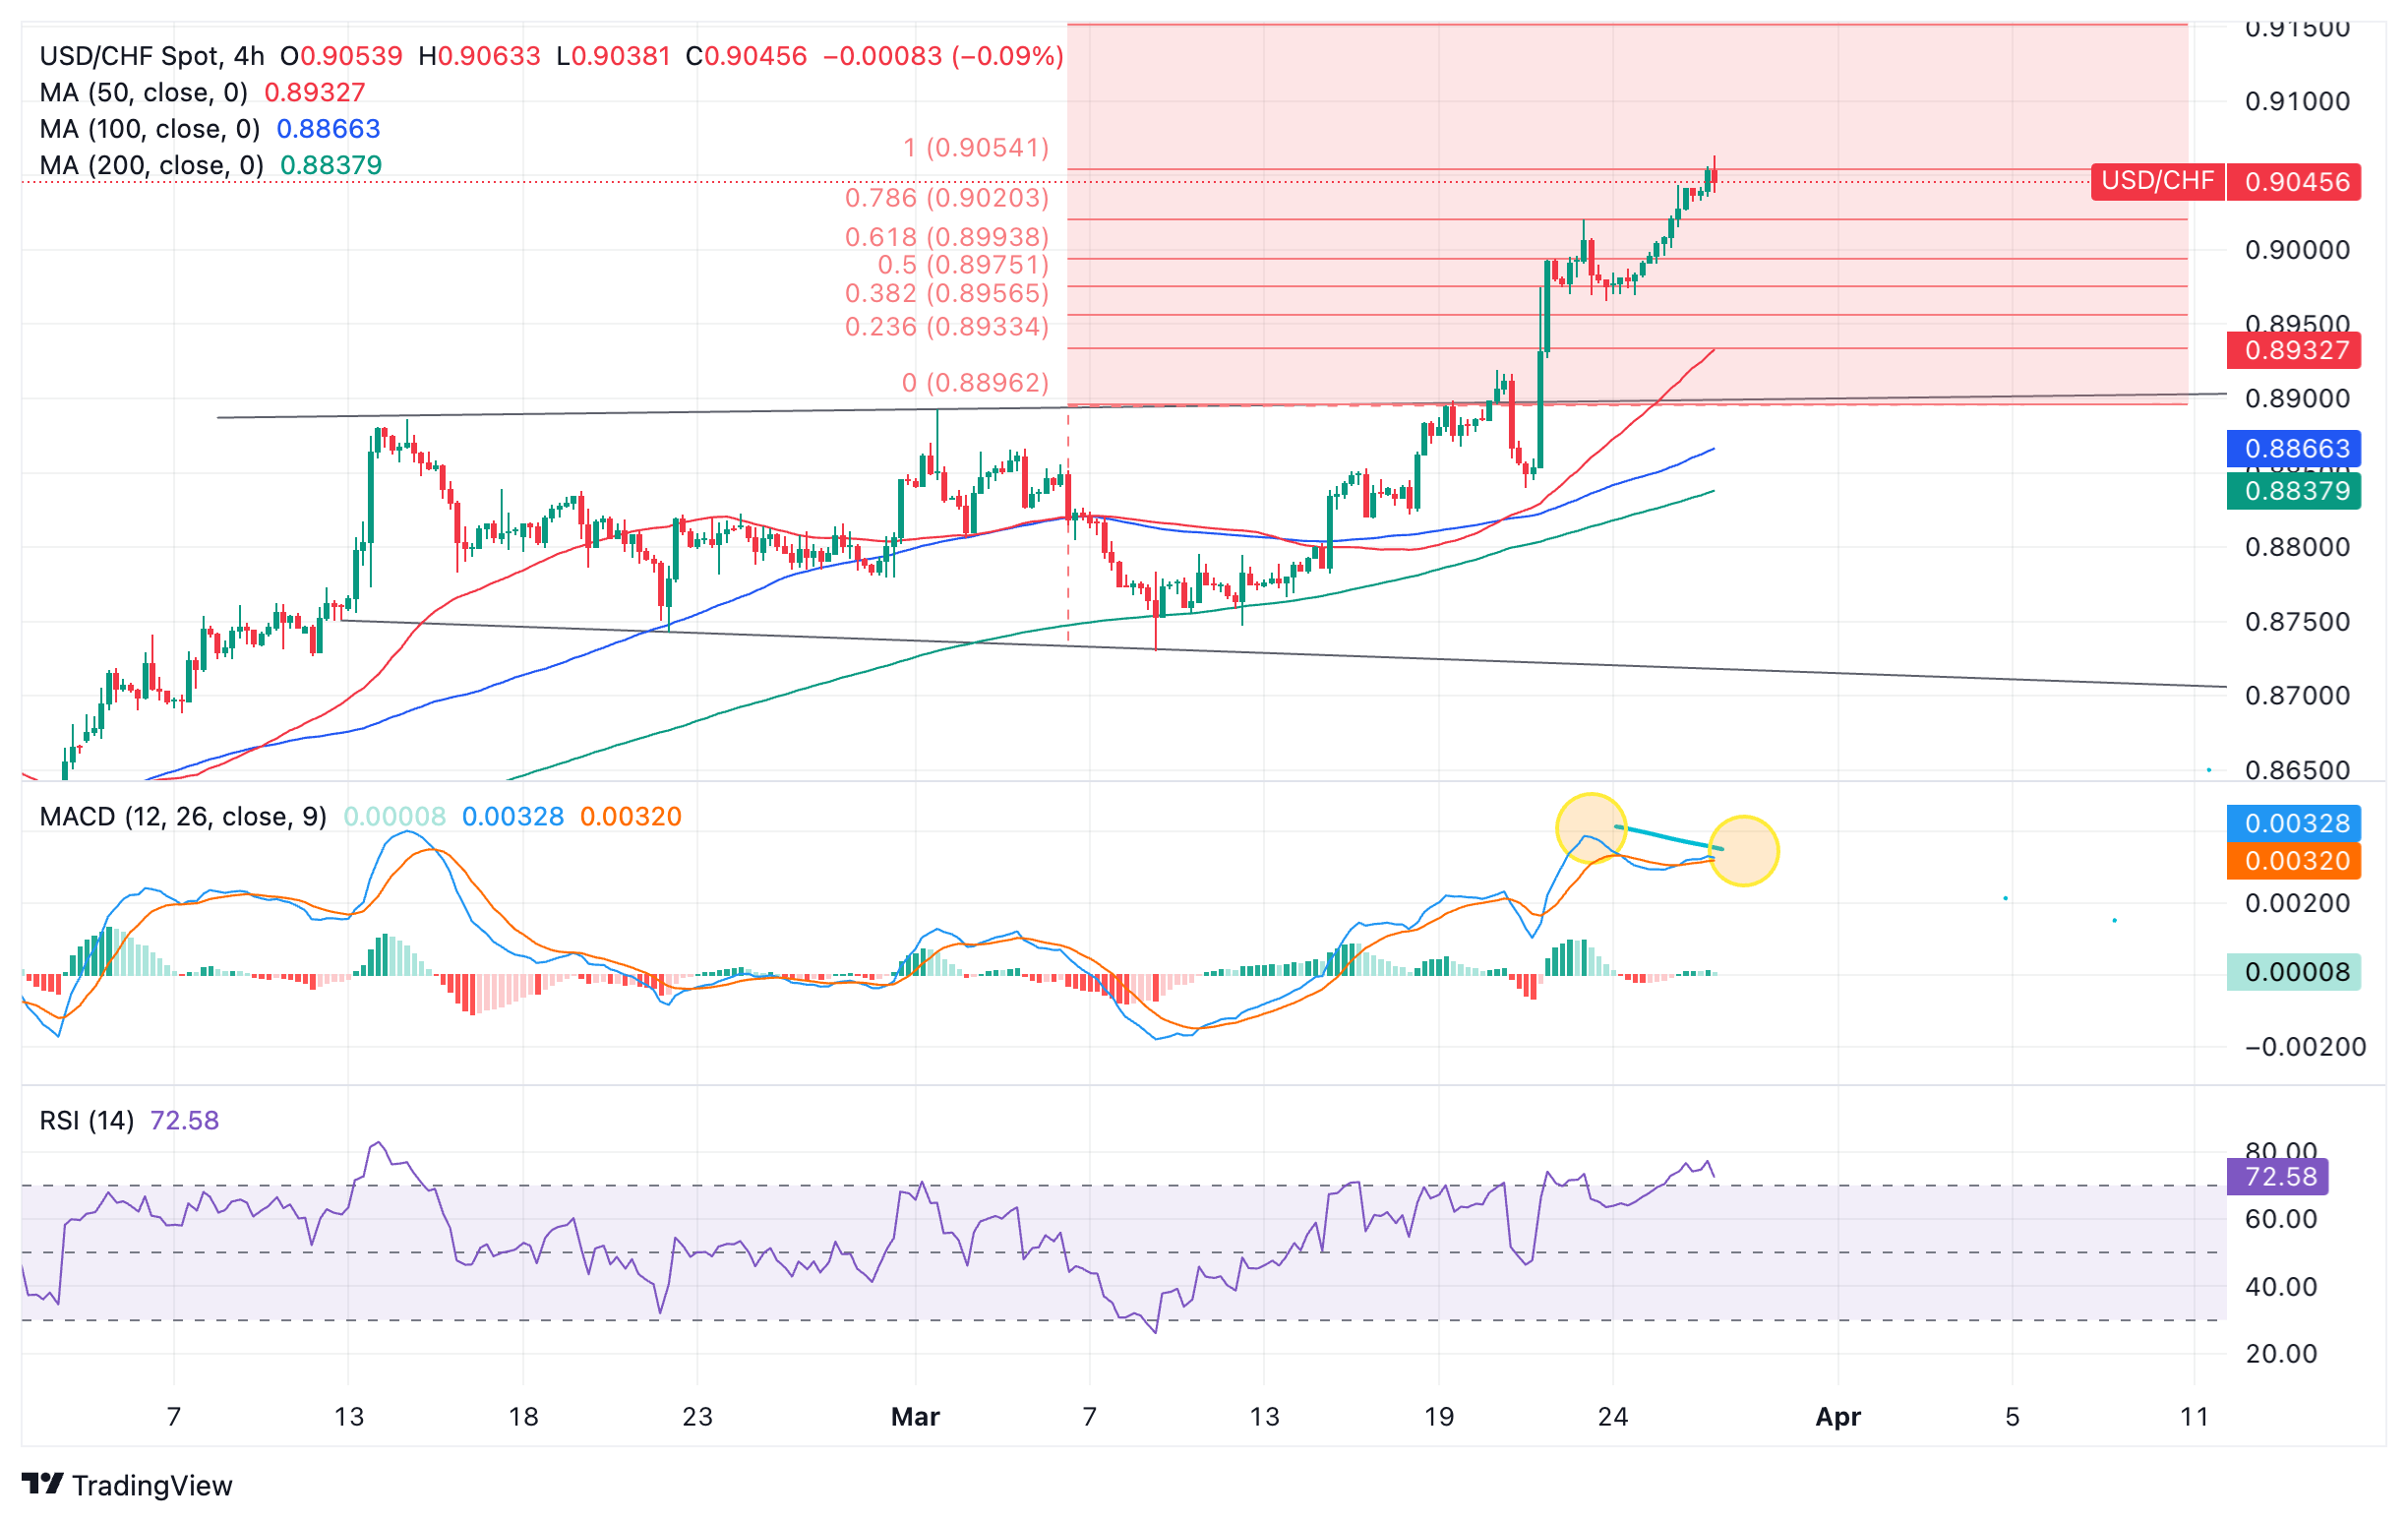
US Dollar versus Swiss Franc: 4-hour chart
The pair has just reached the target of the range breakout at around 0.9050, calculated by taking the full height of the range and extrapolating it higher.
Since achieving the price objective, there is a risk the pair could correct lower. The Moving Average Convergence/ Divergence (MACD) indicator is showing bearish divergence with price at the recent peak when compared with the March 22 peak.
Although price continued rising, the MACD failed to. This is a sign of underlying weakness (circled).
The Relative Strength Index (RSI), another indicator, is sitting in overbought which is a sign traders should not add to their bullish bets. If it comes down and exits overbought it will be a signal to close bullish bets and short the pair.
If a pullback extends lower, it will probably first fall to support at the March 22 highs and the last higher high at 0.9020.
Beyond that, the pair is overall seen continuing the short-term uptrend that formed prior to the range and its breakout higher.
It would take a deeper slide below 0.8960 to bring into question the dominance of the uptrend and suggest the possibility of a reversal.
A break back inside the range, confirmed by a move below 0.8890, would be required to mark a short-term trend reversal and the start of a deeper slide.
The first target for such a move would be the range lows at roughly 0.8715.
Swiss Franc FAQs
The Swiss Franc (CHF) is Switzerland’s official currency. It is among the top ten most traded currencies globally, reaching volumes that well exceed the size of the Swiss economy. Its value is determined by the broad market sentiment, the country’s economic health or action taken by the Swiss National Bank (SNB), among other factors. Between 2011 and 2015, the Swiss Franc was pegged to the Euro (EUR). The peg was abruptly removed, resulting in a more than 20% increase in the Franc’s value, causing a turmoil in markets. Even though the peg isn’t in force anymore, CHF fortunes tend to be highly correlated with the Euro ones due to the high dependency of the Swiss economy on the neighboring Eurozone.
The Swiss Franc (CHF) is considered a safe-haven asset, or a currency that investors tend to buy in times of market stress. This is due to the perceived status of Switzerland in the world: a stable economy, a strong export sector, big central bank reserves or a longstanding political stance towards neutrality in global conflicts make the country’s currency a good choice for investors fleeing from risks. Turbulent times are likely to strengthen CHF value against other currencies that are seen as more risky to invest in.
The Swiss National Bank (SNB) meets four times a year – once every quarter, less than other major central banks – to decide on monetary policy. The bank aims for an annual inflation rate of less than 2%. When inflation is above target or forecasted to be above target in the foreseeable future, the bank will attempt to tame price growth by raising its policy rate. Higher interest rates are generally positive for the Swiss Franc (CHF) as they lead to higher yields, making the country a more attractive place for investors. On the contrary, lower interest rates tend to weaken CHF.
Macroeconomic data releases in Switzerland are key to assessing the state of the economy and can impact the Swiss Franc’s (CHF) valuation. The Swiss economy is broadly stable, but any sudden change in economic growth, inflation, current account or the central bank’s currency reserves have the potential to trigger moves in CHF. Generally, high economic growth, low unemployment and high confidence are good for CHF. Conversely, if economic data points to weakening momentum, CHF is likely to depreciate.
As a small and open economy, Switzerland is heavily dependent on the health of the neighboring Eurozone economies. The broader European Union is Switzerland’s main economic partner and a key political ally, so macroeconomic and monetary policy stability in the Eurozone is essential for Switzerland and, thus, for the Swiss Franc (CHF). With such dependency, some models suggest that the correlation between the fortunes of the Euro (EUR) and the CHF is more than 90%, or close to perfect.
FX markets are still struggling to find direction. Economists at ING analyze Dollar’s outlook.
Keep an eye on a speech by the Fed’s Christopher Waller
Today, monthly wholesale sales and inventory revisions are the only data releases on the calendar along with the weekly MBA mortgage applications. It will be more interesting to hear what the Federal Reserve's Chris Waller has to say on the economic outlook. Waller is generally considered a hawk, so it will be interesting to see how he reacts to the latest data releases.
When it comes to Fed pricing, we doubt expectations for the June meeting will change much this week unless we see a surprise in Friday’s PCE. There is still 19 bps priced in for June and 78 bps by year-end, which pretty much mirrors the March median dot plot.
Some quarter-end flows may slightly mix up the FX picture today, but the Dollar appears in stabilisation mode.
European Central Bank (ECB) Executive Board member Piero Cipollone, in a scheduled speech on Wednesday, said that the ECB has room to cut interest rate swiftly despite wage rebound.
Additional quotes
A recovery in salaries is needed for Europe’s struggling economy to regain some momentum.
So far from neutral rate that there is room to adjust.
Market reaction
The Euro is unfazed by the above comments, as EUR/USD keeps its range at around 1.0830, as of writing.
- EUR/USD has resumed its short-term downtrend, perhaps due to diverging commentary from central bankers.
- European rate-setters are converging on June as the possible moment for a cut in interest rates as inflation slows.
- Their counterparts in the US are advocating caution in respect to lower interest rates.
EUR/USD edges lower, trading in the lower 1.0800s on Wednesday, shrugging off just-released Spanish inflation data for March which met economists’ estimates of 3.2% for the headline plot.
The pair’s tick lower follows through on the previous day’s bearish reversal from the mid 1.0800s and likely reflects the diverging commentary from rate-setters at the US Federal Reserve (Fed) and European Central Bank (ECB).
Commentary from ECB officials is now indicating a high likelihood it will cut interest rates in June, whilst a delay from the Fed is still possible. This is causing weakness for the Euro and depressing EUR/USD, since lower interest rates tends to reduce foreign capital inflows.
EUR/USD falls as ECB language gets more dovish
On Tuesday, ECB Governing Council member Madis Muller said that “we’re closer to a point where the ECB can start cutting rates.”
He added that “data may confirm the inflation trend for the ECB’s June meeting.”
Just prior to his speaking. ECB Governing Council Member Fabio Panetta said that inflation was quickly falling to target and therefore there was a "consensus emerging" for a rate cut. His views were similar to that of the Bank of Greece Governor Yannis Stournaras.
ECB Chief Economist Philip Lane said on Tuesday that wage inflation – a metric the ECB is following very closely to inform its policy – was “on track” to coming back down to normal levels.
These dovish comments follow those from the Bank of France President Francois Villeroy de Galhau, who said April could even be in the frame for a first cut. Taken together with ECB President Christine Lagarde’s comments at the last ECB policy meeting, when she said the ECB would be reviewing policy on interest rates in June, the evidence is building to a compelling conclusion.
Fed looks more split
By contrast, the Federal Reserve seems more split. Whilst Federal Reserve Chairman Jerome Powell seems to continue to advocate for a June rate cut, and the Fed’s official forecast is for three 0.25% cuts to its feds funds rate in 2024, some individual members have diverged from the official script.
On Tuesday, Federal Reserve Bank of Atlanta Governor Raphael Bostic said the Fed should take things slowly and that he now only expected one rate cut in 2024.
His view echoed those of his fellow Fed member of the board of governors Lisa Cook, who advocated for the Fed taking a “careful approach” to easing over time to “ensure inflation returns sustainably to 2.0%.”
She mentioned housing inflation, which remains quite high, though her view was that it would fall on lower rental demand.
On Monday, Chicago Fed President Austan Goolsbee said the persistence of housing inflation continued to surprise him, but that he felt it would ebb away over time.
"The main puzzle has been about housing," Goolsbee said, a major component in the consumer spending basket that has accounted for a large share of recent headline inflation readings, according to Reuters.
In terms of US inflation, Friday’s Core Personal Consumption Expenditures (PCE) Price Index data for February, considered the Fed’s preferred gauge of inflation, is being held up as the next oracular event for determining when the Fed could cut interest rates.
A higher-than-expected inflation reading in line with most recent gauges of inflation in the US could push back further the time when the Fed is expected to cut interest rates, with negative consequences for EUR/USD.
Technical Analysis: EUR/USD resuming downtrend
EUR/USD turned tail at Tuesday’s highs in the 1.0860s and plunged back down, falling in line with the dominant short-term downtrend.
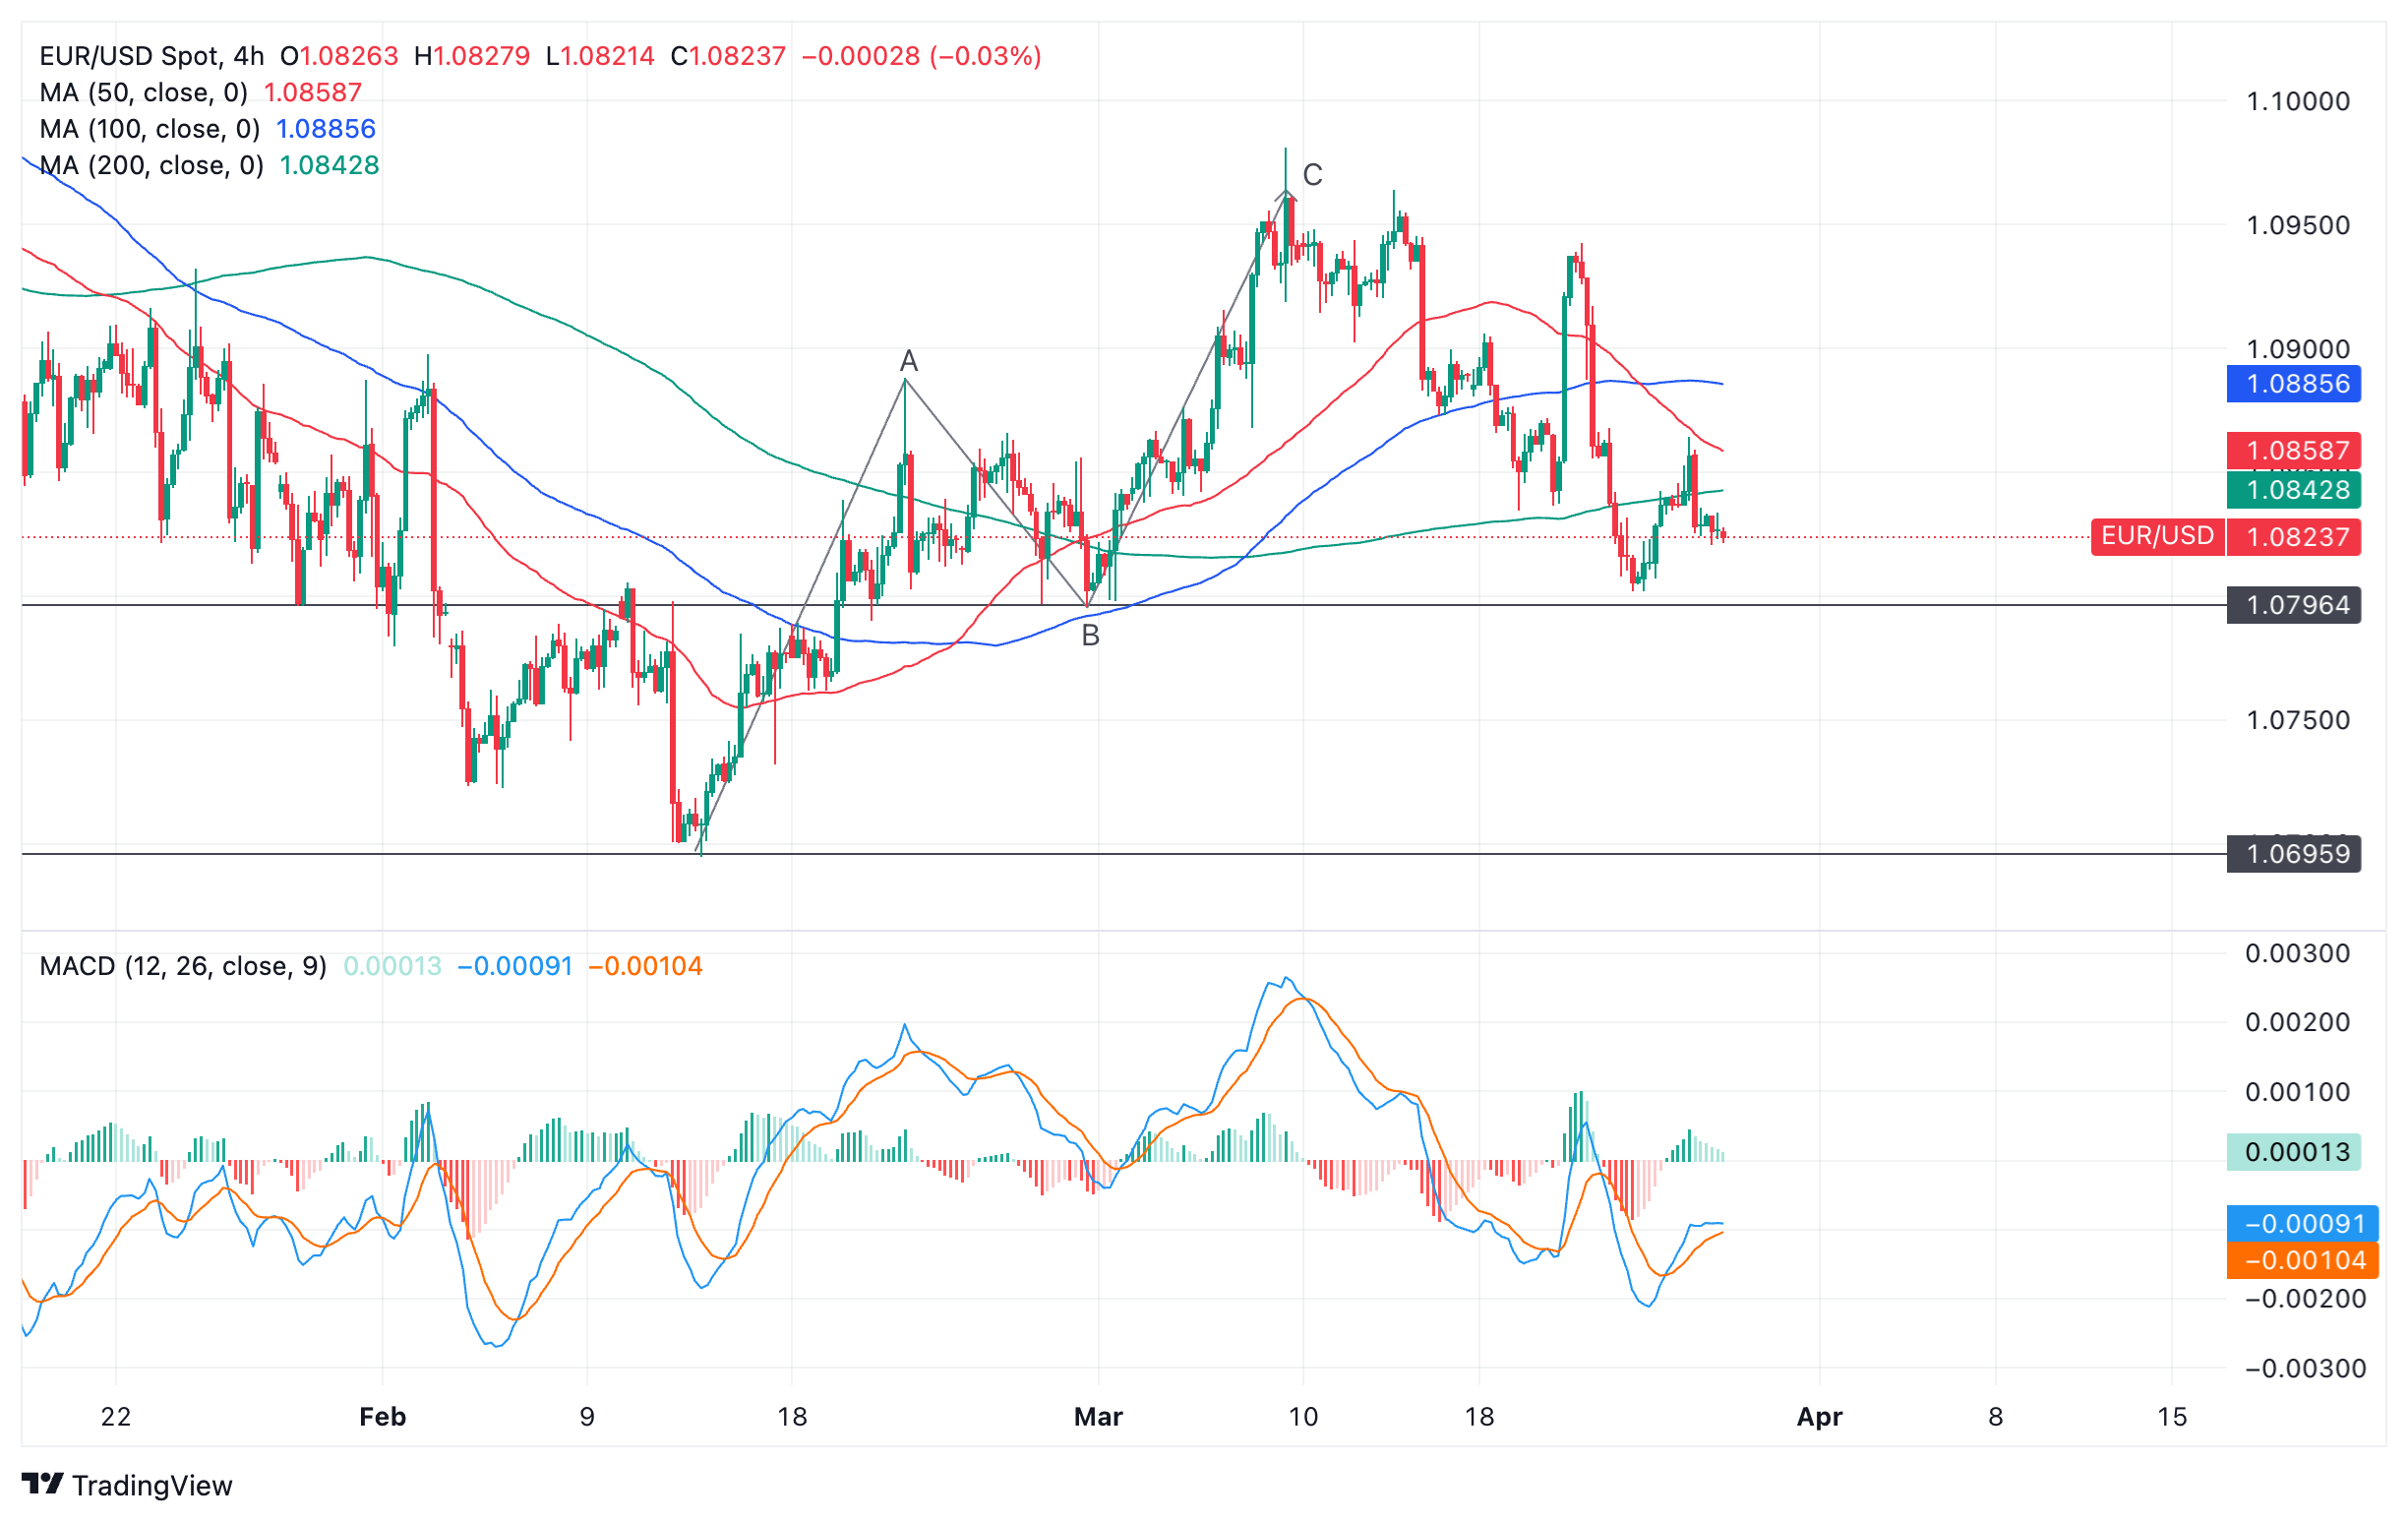
Euro versus US Dollar: 4-hour chart
A decisive break below the B-wave lows at roughly 1.0795 would signal a continuation of the downtrend to the next target at 1.0750 – then the February lows at roughly 1.0700.
A decisive break is one characterized by a long red bearish candle that breaks cleanly through the level and closes near its low, or three down candles in a row that breach the level.
Alternatively, a move above the 1.0950 level would bring into question the validity of the short-term downtrend.
Euro FAQs
The Euro is the currency for the 20 European Union countries that belong to the Eurozone. It is the second most heavily traded currency in the world behind the US Dollar. In 2022, it accounted for 31% of all foreign exchange transactions, with an average daily turnover of over $2.2 trillion a day. EUR/USD is the most heavily traded currency pair in the world, accounting for an estimated 30% off all transactions, followed by EUR/JPY (4%), EUR/GBP (3%) and EUR/AUD (2%).
The European Central Bank (ECB) in Frankfurt, Germany, is the reserve bank for the Eurozone. The ECB sets interest rates and manages monetary policy. The ECB’s primary mandate is to maintain price stability, which means either controlling inflation or stimulating growth. Its primary tool is the raising or lowering of interest rates. Relatively high interest rates – or the expectation of higher rates – will usually benefit the Euro and vice versa. The ECB Governing Council makes monetary policy decisions at meetings held eight times a year. Decisions are made by heads of the Eurozone national banks and six permanent members, including the President of the ECB, Christine Lagarde.
Eurozone inflation data, measured by the Harmonized Index of Consumer Prices (HICP), is an important econometric for the Euro. If inflation rises more than expected, especially if above the ECB’s 2% target, it obliges the ECB to raise interest rates to bring it back under control. Relatively high interest rates compared to its counterparts will usually benefit the Euro, as it makes the region more attractive as a place for global investors to park their money.
Data releases gauge the health of the economy and can impact on the Euro. Indicators such as GDP, Manufacturing and Services PMIs, employment, and consumer sentiment surveys can all influence the direction of the single currency. A strong economy is good for the Euro. Not only does it attract more foreign investment but it may encourage the ECB to put up interest rates, which will directly strengthen the Euro. Otherwise, if economic data is weak, the Euro is likely to fall. Economic data for the four largest economies in the euro area (Germany, France, Italy and Spain) are especially significant, as they account for 75% of the Eurozone’s economy.
Another significant data release for the Euro is the Trade Balance. This indicator measures the difference between what a country earns from its exports and what it spends on imports over a given period. If a country produces highly sought after exports then its currency will gain in value purely from the extra demand created from foreign buyers seeking to purchase these goods. Therefore, a positive net Trade Balance strengthens a currency and vice versa for a negative balance.
Following the tri-party meeting between the Bank of Japan, Ministry of Finance (MoF) and Financial Services Agency (FSA) on Wednesday, Japan’s top currency diplomat Masato Kanda said that he “won't rule out any steps to respond to disorderly FX moves.”
Additional comments
Recent Yen moves are not reflecting fundamentals
Speculative moves behind recent Yen moves.
Closely watching FX moves with a high sense of urgency.
I don't consider a 4% move in a span of 2 weeks a mild move.
BoJ official said that if forex market moves affect economy, price trends, central bank would respond through monetary policy.
Market reaction
USD/JPY is rebounding toward 151.50 after Kanda’s comments, still down 0.13% on the day.
The most notable moves in G10 since the start of the week have been the further sell-off in G10 low-yielders: Swiss Franc (CHF) and Japanese Yen (JPY). Economists at ING analyze CHF and JPY outlook.
Japanese authorities look at the rate of change more than levels
CHF has been a bigger underperformer, with a dovish Swiss National Bank that no longer targets a stronger CHF adding pressure on the currency, and we think it may be too early to pick a bottom.
USD/JPY touched 152.00, continuing to test Japan’s FX intervention tolerance. This may still be only a ‘verbal intervention’ range, with another USD/JPY leg higher needed for actual FX intervention to be deployed (perhaps closer to 155.00). Remember that Japanese authorities look at the rate of change more than levels.
- NZD/USD is expected to see more downside due to multiple headwinds.
- Investors remain uncertain ahead of the US core PCE inflation for February.
- A breakdown of the Double Top formation weakens the Kiwi asset.
The NZD/USD pair finds interim support near 0.5990 in the European session on Wednesday. The Kiwi asset is vulnerable in the broader term as the New Zealand economy has shifted into a technical recession. The economy was contracted in the last two quarters of 2023.
The Reserve Bank of New Zealand (RBNZ) is facing a balancing act between high inflation and a poor economic outlook. To maintain downward pressure on stubborn inflation, the RBNZ maintains the Official Cash Rate (OCR) at 5.5%. However, economic activities bear the consequences. Low liquidity flow in an economy dampens firms’ investment plans and consumer spending.
Meanwhile, asset-specific action is being observed in global markets as risk-perceived currencies face the heat of uncertainty ahead of the United States core Personal Consumption Expenditure price index (PCE) data for February, which will be published on Good Friday. S&P 500 futures have posted significant gains in the London session.
The US Dollar Index (DXY) rises to 104.40, an inch away from monthly high of 104.50. 10-year US Treasury yields remain unchanged at 4.23%.
NZD/USD sees a sharp downside move after a breakdown of the Double Top chart formation near 0.6069 on a four-hour timeframe. The asset has tested territory below the psychological support of 0.6000 and is expected to discover more downside. The 50-period Exponential Moving Average (EMA) near 0.6040 is a major barricade for the New Zealand Dollar bulls.
The 14-period Relative Strength Index (RSI) oscillates in the bearish range of 20.00-60.000. Investors would look for building fresh shorts whenever the RSI witnessed a pullback to 60.00.
If the asset breaks below the intraday low of 0.5987, more downside will appear. This would drag the asset toward the November 17 low at 0.5940, followed by the round-level support of 0.5900.
In an alternate scenario, a recovery move above March 6 low at 0.6069 will drive the pair toward March 18 high at 0.6100. A breach of the latter will drive the asset further to March 12 low at 0.6135.
NZD/USD four-hour chart
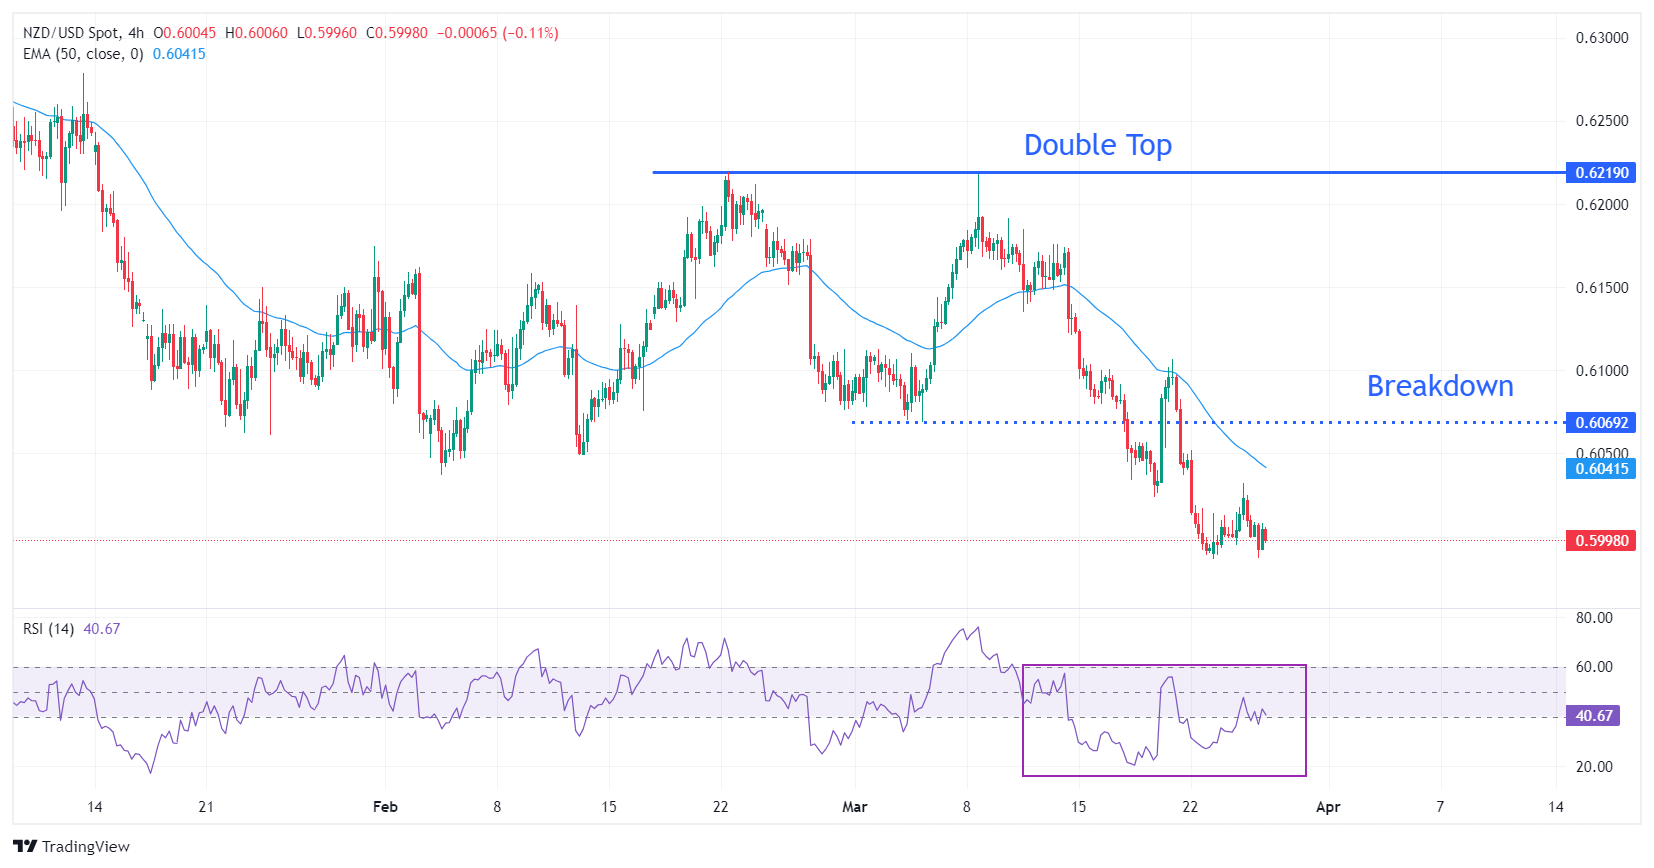
The Bank of Japan, Ministry of Finance (MoF) and Financial Services Agency (FSA) are scheduled to hold a tri-party meeting on Wednesday, the Finance Ministry said.
Vice Finance Minister for International Affairs, Masato Kanda, will brief reporters after the meeting.
The meeting is held as the Japanese Yen reaches the lowest level in 34 years against the US Dollar at 151.97.
In an immediate reaction to the above headlines, USD/JPY tumbled to a fresh intraday low near 151.25, down 0.20% on the day.
Japanese Yen FAQs
The Japanese Yen (JPY) is one of the world’s most traded currencies. Its value is broadly determined by the performance of the Japanese economy, but more specifically by the Bank of Japan’s policy, the differential between Japanese and US bond yields, or risk sentiment among traders, among other factors.
One of the Bank of Japan’s mandates is currency control, so its moves are key for the Yen. The BoJ has directly intervened in currency markets sometimes, generally to lower the value of the Yen, although it refrains from doing it often due to political concerns of its main trading partners. The current BoJ ultra-loose monetary policy, based on massive stimulus to the economy, has caused the Yen to depreciate against its main currency peers. This process has exacerbated more recently due to an increasing policy divergence between the Bank of Japan and other main central banks, which have opted to increase interest rates sharply to fight decades-high levels of inflation.
The BoJ’s stance of sticking to ultra-loose monetary policy has led to a widening policy divergence with other central banks, particularly with the US Federal Reserve. This supports a widening of the differential between the 10-year US and Japanese bonds, which favors the US Dollar against the Japanese Yen.
The Japanese Yen is often seen as a safe-haven investment. This means that in times of market stress, investors are more likely to put their money in the Japanese currency due to its supposed reliability and stability. Turbulent times are likely to strengthen the Yen’s value against other currencies seen as more risky to invest in.
Economists at ANZ Bank analyze Gold (XAU/USD) outlook amid the uncertainties around geopolitics and high levels in stock markets.
Volatility to pick up as we get closer to the US elections
A change in the governing party in the US would present risks around the future of policies. Amid these economic and geopolitical tensions, equity markets are hitting a record high. This could make investors more wary about the downside risk than upside potential.
Volatility is expected to pick up as we get closer to the US elections. A risk-off scenario in equity markets will lend support to Gold prices.
- EUR/GBP exhibits a sideways movement ahead of ECB members’ speeches on Wednesday.
- BoE MPC Member Catherine Mann thinks that the central bank is pricing in too many cuts.
- The Euro could face pressure on speculation of an ECB rate cut in June.
EUR/GBP consolidates around 0.8580 during the European session on Wednesday. Bank of England (BoE) Monetary Policy Committee (MPC) Member Catherine Mann cited softening labor market conditions and slowing services inflation as factors influencing her decision to vote in favor of holding interest rates on Thursday. This stance has buoyed hopes among investors for the implementation of a looser monetary policy by the BoE.
Mann cautioned that financial markets are anticipating an excessive number of interest rate cuts this year and suggested that the Bank of England (BoE) is unlikely to act before the US Federal Reserve. She stated, "I think they're pricing in too many cuts."
The EUR/GBP cross could have received upward support following the release of softer-than-expected inflation data for February in the United Kingdom. This development has reshaped market expectations for the Bank of England (BoE) to potentially lower interest rates starting from the June meeting.
The Euro could face downward pressure due to growing speculation of a rate cut by the European Central Bank (ECB) in June. ECB policymaker Madis Muller indicated on Tuesday that the central bank is approaching a juncture where rate cuts may begin. Furthermore, ECB official Yannis Stoumaras noted a consensus for a rate cut in June.
Traders are expected to closely monitor speeches from ECB Chief Economist Philip Lane and ECB Executive Board member Piero Cipollone on Wednesday, along with the release of the European Commission’s Business Climate and Consumer Confidence data for March. On the United Kingdom’s (UK) side, BoC Financial Policy Committee (FPC) Minutes and Statement will be released later in the day.
- Silver drops to a two-week low on Wednesday, albeit manages to hold above the 38.2% Fibo.
- The mixed technical setup warrants some caution before positioning for any further downfall.
- Any attempted recovery might confront a stiff barrier and remain capped near the $25.00 mark.
Silver (XAG/USD) oscillates in a narrow trading band through the first half of the European session and consolidates its recent losses to a two-week low touched earlier this Wednesday. The white metal currently trades just below the mid-$24.00s and seems vulnerable to prolonging its recent pullback from the YTD peak touched last week.
That said, mixed technical indicators on the daily chart and failure to break through the 38.2% Fibonacci retracement level of the February-March rally, warrant some caution for aggressive bearish traders. Hence, it will be prudent to wait for some follow-through selling below the $24.30 support zone before positioning for a further depreciating move. The XAG/USD might then weaken further below the $24.00 round-figure mark and test the 50% Fibo. level near the $23.85 zone.
The subsequent downfall has the potential to drag the white metal to the $23.40 confluence, comprising the 61.8% Fibo. and the very important 200-day Simple Moving Average (SMA), en route to the $23.00 round-figure mark. Failure to defend the latter might expose the next relevant support near the $22.45 region.
On the flip side, any attempted recovery is likely to attract fresh sellers and remain capped near the $25.00 psychological mark. That said, a sustained strength beyond the said handle might trigger a bout of a short-covering rally and lift the XAG/USD to the $25.50 region en route to the YTD peak, around the $25.75-$25.80 region. This is followed by the December 2023 swing high, just ahead of the $26.00 round figure, which if cleared will set the stage for additional near-term gains.
Silver daily chart
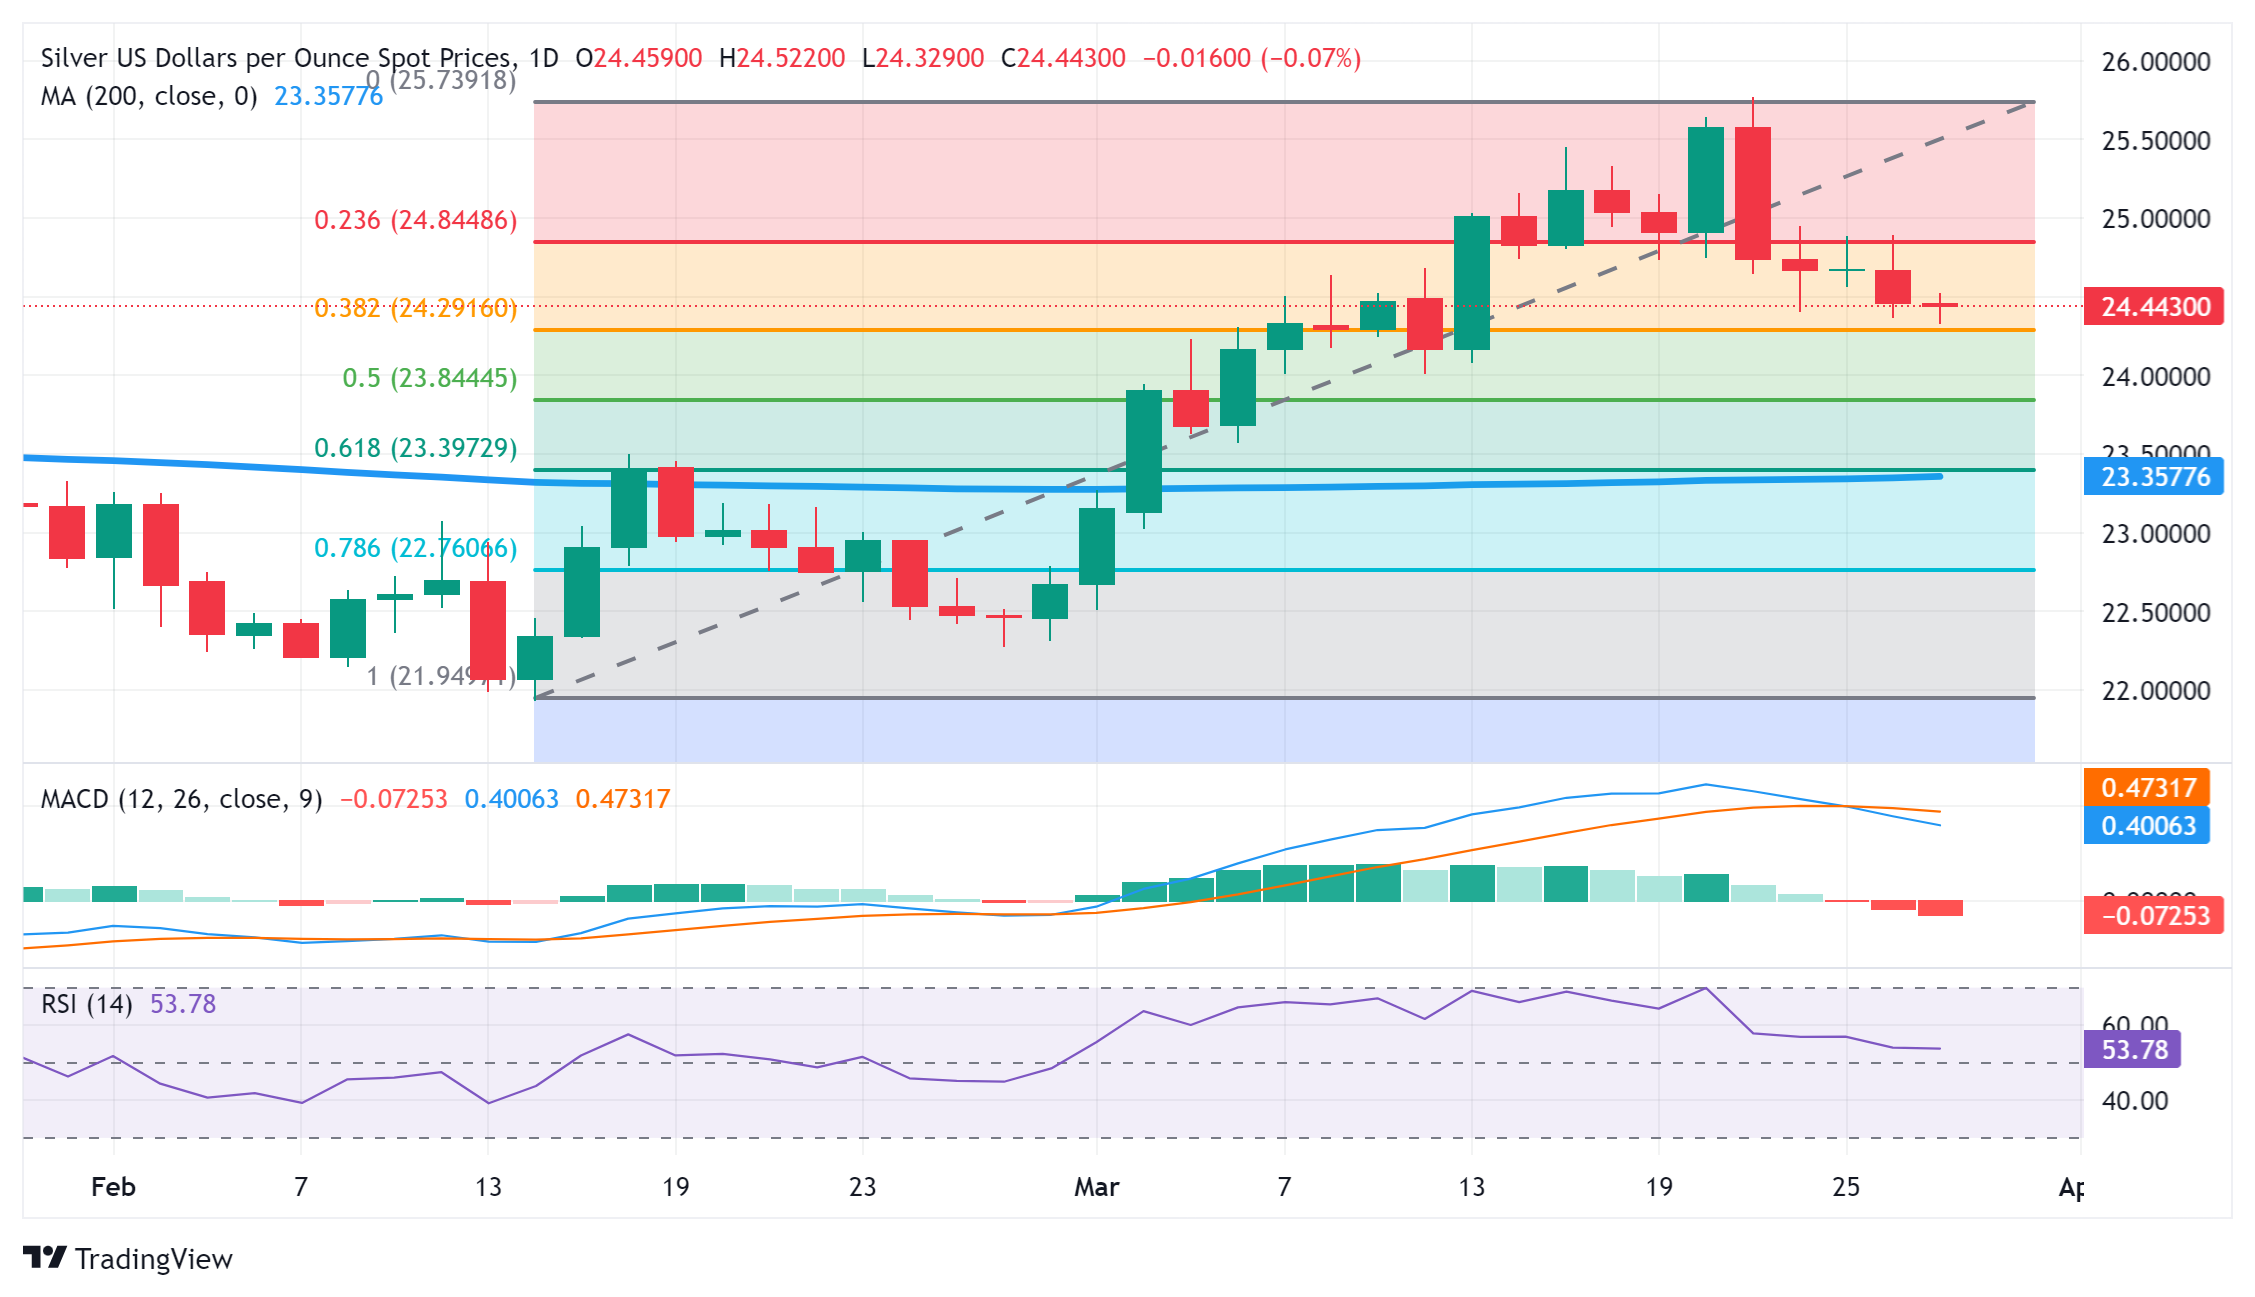
- The Pound Sterling dips as investors expect the BoE to cut rates sooner than expected.
- BoE Bailey said market expectations for two or three rate cuts this year are not unreasonable.
- The main event for this week will be the US core PCE price index data for February.
The Pound Sterling (GBP) falls to 1.2600 in Wednesday’s European session as investors expect that the Bank of England (BoE) will start reducing interest rates sooner than previously anticipated. To a certain extent, the BoE has turned dovish on the interest rate outlook as the United Kingdom’s inflation is softening.
In a recent interview with the Financial Times, BoE Governor Andrew Bailey said market expectations for rate cuts this year are not unreasonable. About the inflation outlook, Bailey said "We are not seeing a lot of sticky persistence."
The GBP/USD faces downside pressure from dismal market sentiment. Investors turn cautious ahead of the United States core Personal Consumption Expenditure price index (PCE) data for February, which will be published on Good Friday. The US Dollar Index (DXY), which values the Greenback against six foreign currencies, rises to 104.40.
Daily digest market movers: Pound Sterling is down as US Dollar rebounds
- The Pound Sterling falls further to the crucial support of 1.2600 as the US Dollar rebounds sharply amid uncertainty ahead of the United States core PCE price index data for February. The Federal Reserve’s (Fed) preferred inflation measure could provide some cues about when the central bank could start reducing interest rates.
- Stubborn inflation and a strong economic outlook in the US could allow the Fed to delay its rate cut plans. The Fed’s latest dot plot, released last week, pointed to three rate cuts for this year, but a slower progress in inflation declining to the 2% target could also result in fewer cuts.
- Apart from the risk-off mood, market expectations for the Bank of England’s interest rate outlook will drive the next move in the Pound Sterling. A sharp decline in the UK’s inflation data for February has uplifted expectations for the BoE to begin reducing interest rates early in the June policy meeting. Before the release of the soft inflation data and slightly dovish interest rate guidance from the BoE, rate cuts were majorly expected starting from the August meeting.
- In its last meeting, the BoE was observed as slightly dovish as no policymaker voted for a rate hike for the first time since September 2021. Catherine Mann, who remains a hawk, dropped her rate hike call as she observed that consumers are reluctant to pay higher prices on services such as travel and hospitality, she said in an interview with Bloomberg. Mann added that firms are cutting working hours in times when more employment is required. She further added that the number of workers in the labor market will increase due to the government's cuts to social security rates.
- This week, the UK’s economic calendar is light. Investors will look for revised Q4 2023 Gross Domestic Product (GDP) estimates. Any significant change from preliminary estimates will influence the Pound Sterling. The preliminary estimates showed that the UK economy entered a technical recession in the second half of 2023 after contracting by 0.3% in the October-December quarter.
Technical Analysis: Pound Sterling slips to 1.2600
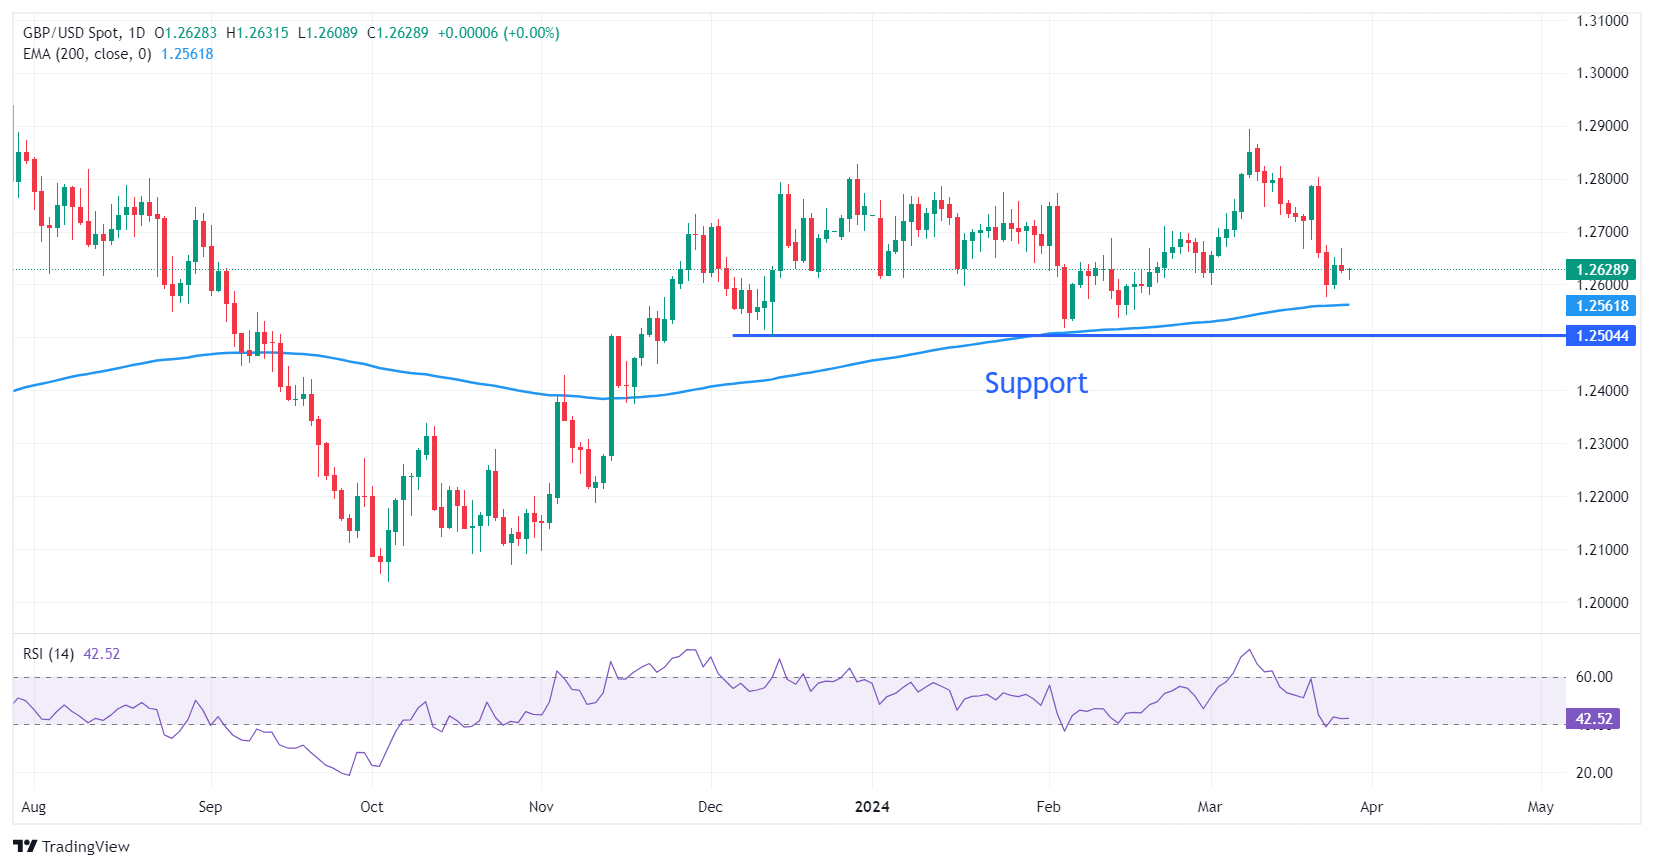
The Pound Sterling drops to near the round-level support of 1.2600. The GBP/USD pair falls after facing stiff resistance while extending the upside above the 1.2660 hurdle. The pair trades slightly higher than the 200-day Exponential Moving Average (EMA), placed around 1.2565. The asset would extend its downside if it drops below the 200-day EMA.
The 14-period Relative Strength Index (RSI) slips to near 40.00. If it dips below this level, a bearish momentum will trigger.
Pound Sterling FAQs
The Pound Sterling (GBP) is the oldest currency in the world (886 AD) and the official currency of the United Kingdom. It is the fourth most traded unit for foreign exchange (FX) in the world, accounting for 12% of all transactions, averaging $630 billion a day, according to 2022 data. Its key trading pairs are GBP/USD, aka ‘Cable’, which accounts for 11% of FX, GBP/JPY, or the ‘Dragon’ as it is known by traders (3%), and EUR/GBP (2%). The Pound Sterling is issued by the Bank of England (BoE).
The single most important factor influencing the value of the Pound Sterling is monetary policy decided by the Bank of England. The BoE bases its decisions on whether it has achieved its primary goal of “price stability” – a steady inflation rate of around 2%. Its primary tool for achieving this is the adjustment of interest rates. When inflation is too high, the BoE will try to rein it in by raising interest rates, making it more expensive for people and businesses to access credit. This is generally positive for GBP, as higher interest rates make the UK a more attractive place for global investors to park their money. When inflation falls too low it is a sign economic growth is slowing. In this scenario, the BoE will consider lowering interest rates to cheapen credit so businesses will borrow more to invest in growth-generating projects.
Data releases gauge the health of the economy and can impact the value of the Pound Sterling. Indicators such as GDP, Manufacturing and Services PMIs, and employment can all influence the direction of the GBP. A strong economy is good for Sterling. Not only does it attract more foreign investment but it may encourage the BoE to put up interest rates, which will directly strengthen GBP. Otherwise, if economic data is weak, the Pound Sterling is likely to fall.
Another significant data release for the Pound Sterling is the Trade Balance. This indicator measures the difference between what a country earns from its exports and what it spends on imports over a given period. If a country produces highly sought-after exports, its currency will benefit purely from the extra demand created from foreign buyers seeking to purchase these goods. Therefore, a positive net Trade Balance strengthens a currency and vice versa for a negative balance.
On Tuesday, EUR/USD temporarily moved above 1.0850 before ending the day at roughly unchanged levels. Economists at ING analyze the pair’s outlook.
Limited impact of France budget news
France hit the headlines on Tuesday as it reported the 2023 deficit at 5.5% of GDP, substantially above the 4.8% seen in 2022 and higher than the government target of 4.9%. We estimate that the deficit may well exceed 5% again in 2024.
The Euro has – however – remained shielded from the news as OAT spreads didn’t move much. Fiscal concerns should rise again as we head into the September budget in France, but we think the European Central Bank will be well into its monetary easing process, making the general environment for eurozone bonds quite favourable.
Looking again at this week, we do not see major catalysts for a break higher or lower in EUR/USD unless US core PCE surprises (consensus is clustered at 0.3% month-on-month). We think the pair can stabilise around 1.0850.
- USD/MXN appreciates ahead of Jobless Rate, Trade Balance from Mexico.
- The decline in the US Treasury yields could limit the advance of the US Dollar.
- Banxico Governor Victoria Rodriguez Ceja emphasized that the fight against inflation is not yet over.
USD/MXN retraces its recent losses registered in the previous two sessions. The Mexican Peso (MXN) gains ground ahead of the Jobless Rate and Trade Balance data from Mexico. The USD/MXN pair advances to near 16.60 during the European trading hours on Wednesday.
INEGI’s Mexican economic activity gauge expanded, rebounding from the two-year low but missing the estimated increase. Despite the slight rebound, the result aligned with the trend that the Mexican economy is losing its resilience to restrictive interest rates by Banxico.
Banxico Governor Victoria Rodriguez Ceja maintained a dovish stance during an interview. Rodriguez emphasized that the fight against inflation is not yet over, indicating that discussions regarding further rate cuts to the main reference rate would be on the agenda in upcoming meetings.
US Dollar Index (DXY) extends its gains for the second session, trading higher near 104.40 during the European hours on Wednesday. The 2-year and 10-year yields on US Treasury bonds stand at 4.59% and 4.22%, by the press time.
Atlanta Fed President Raphael Bostic anticipates only one rate cut this year, cautioning against premature reductions due to the potential for heightened disruption. Conversely, Chicago Fed President Austan Goolsbee aligns with the majority of the board, forecasting three cuts.
The US Dollar (USD) receives upward support from the prevailing market risk aversion ahead of the upcoming release of the US Gross Domestic Product Annualized on Thursday and Personal Consumption Expenditures (PCE) scheduled for Friday.
The Riksbank announces monetary policy today. Economists at ING analyze the Swedish Krona (SEK) outlook ahead of the decision.
Riksbank to resist dovish temptation
Consensus is firmly calling for a hold. We agree and markets are not pricing any move either.
Our view is that the Riksbank will revise the 2Q24 average rate projection to 3.95%, and have the year-end value around 3.50%. That would imply that a rate cut is possible in the first half of the year but is not a done deal.
We also expect the message to reiterate data dependency. Ultimately, that should sound like a moderate pushback against May/June cut pricing, although SEK is facing some rather soft momentum and the simple fact that the Riksbank would signal the chance of a cut in 1H could keep markets attached to some expectations of a May move.
EUR/SEK is, in turn, still facing some upside risks to 11.50-11.55 in the short term. But we like the chances of a sustainable move lower as early as April.
USD/JPY rallied briefly to a fresh high at 151.97. Economists at BBH analyze the pair’s outlook.
It is only a matter of time before USD/JPY breaks higher
Japan’s Finance Minister Shunichi Suzuki warned again ‘we are watching market moves with a high sense of urgency…We will take bold measures against excessive moves without ruling out any options’. The BoJ last officially intervened to stem JPY weakness between September and October 2022.
In our view, it’s only a matter of time before USD/JPY breaks higher because we anticipate a gradual BoJ tightening process and a more muted than currently priced-in Fed easing cycle.
The next major technical resistance for USD/JPY after the 151.95-152.00 zone is not before 160.00 (April 1990 high).
- USD/CHF appreciates due to risk aversion ahead of key data from the United States.
- The decline in the US Treasury yields could limit the advance of the US Dollar.
- Swiss Franc has depreciated as a result of contrasting monetary policies between the SNB and the Fed.
USD/CHF moves in the positive direction, driven by a stronger US Dollar (USD), possibly influenced by a risk-off sentiment. This sentiment is fueled by anticipation surrounding the upcoming release of the US Gross Domestic Product Annualized on Thursday and Personal Consumption Expenditures (PCE) scheduled for Friday. As a result, the USD/CHF pair rises to a four-month high near 0.9050 during the early European hours on Wednesday.
However, the decline in US Treasury yields may be attributed to expectations surrounding the US Federal Reserve (Fed) considering potential rate cuts in June. This sentiment could potentially limit the advances of the US Dollar, subsequently putting pressure on the USD/CHF pair.
The Swiss Franc (CHF) has depreciated due to differing monetary policies between the Swiss National Bank (SNB) and the Federal Reserve. In its March meeting, the SNB surprised markets by lowering its benchmark interest rate by 25 basis points to 1.5%, marking the first rate cut among major central banks since the onset of global disinflation in 2023. After the announcement, the CHF extended its year-to-date weakness. Being the first G10 central bank to cut is likely to undermine the currency.
The Swiss Franc could have gained strength due to risk aversion triggered by the European Union's (EU) launch of investigations into major tech firms such as Apple, Google, and Meta on Monday. Additionally, escalating geopolitical tensions between Ukraine and Russia may lead investors to seek refuge in safe-haven currencies like the CHF.
Economists at MUFG Bank look for Bank Indonesia (BI) to cut its policy rate only after the US Fed loosens its monetary policy to avoid unnecessary Rupiah (IDR) volatility.
Rupiah outlook holds the key to BI rate cuts
Indonesia’s economy will likely remain on a steady footing this year and inflation to stay within BI’s target, leaving the stability of the exchange rate as the key factor in determining the timing and pace of BI rate cuts.
We look for BI to cut its policy rate only after the US Fed loosens its monetary policy to avoid unnecessary Rupiah volatility. For now, we see the BI lowering its policy rate by 50 bps to 5.50% in H2 2024.
We see no catalyst yet for sustained gain in the Indonesian Rupiah versus the US Dollar in the near term.
Our three-month USD/IDR forecast stays at 15,850.
Japan’s Chief Cabinet Secretary Yoshimasa Hayashi said on Wednesday, he is “closely watching FX moves.”
Additional comments
Rapid FX moves undesirable.
Important for currencies to move in stable manner reflecting fundamentals.
Related reads
FX option expiries for Mar 27 NY cut at 10:00 Eastern Time, via DTCC, can be found below
- EUR/USD: EUR amounts
- 1.0760 713m
- 1.0800 1.9b
- 1.0840 1.5b
- 1.0850 700m
- 1.0880 4.7b
- GBP/USD: GBP amounts
- 1.26001.1b
- USD/JPY: USD amounts
- 150.00 529m
- 151.50 1.2b
- 152.00 665m
- AUD/USD: AUD amounts
- 0.6500 2.3b
- USD/CAD: USD amounts
- 1.3650 1.3b
- NZD/USD: NZD amounts
- 0.6000 959m
- 0.6085 500m
- EUR/USD loses traction around 1.0830 on the renewed USD demand on Wednesday.
- The pair maintains the bearish outlook above the key EMA; RSI lies below the 50-midline.
- The first upside barrier is seen near 1.0853; the potential support level is located at 1.0800.
The EUR/USD pair trades in negative territory for two straight days near 1.0830 on Wednesday during the early European trading hours. The encouraging US economic data and the high-for-longer rate narrative from the Federal Reserve (Fed) provide some support to the US Dollar (USD) and drag the EUR/USD lower.
Technically, EUR/USD keeps the bearish vibe unchanged on the four-hour chart. The major pair is below the key 50- and 100-period Exponential Moving Averages (EMA), with the Relative Strength Index (RSI) lying below the 50-midline. This indicates that the further downside looks favorable for the time being.
The key resistance level for EUR/USD will emerge near 1.0853, portraying the confluence of the upper boundary of the Bollinger Band and the 50-period EMA. A break above the mentioned level will pave the way to the 100-period and a high of March 26 at 1.0864. Further north, the next hurdle is seen near a high of March 18 at 1.0906.
On the flip side, the potential support level is located at the 1.0800 round mark, representing the lower limit of the Bollinger Band, a low of March 22, and a psychological round figure. Any follow-through selling below the latter will see a drop to a low of February 16 at 1.0732, followed by a low of February at 1.0700.
EUR/USD four-hour chart
-638471197911721212.png)
Here is what you need to know on Wednesday, March 27:
The Japanese Yen (JPY) continued to weaken against the US Dollar (USD), with USD/JPY reaching its highest level since 1990 near 152.00 early Wednesday. Investors will keep a close eye in the pair's action amid growing risk of a central bank intervention. The European Commission will release consumer and business sentiment data for March. The US economic docket will not feature any high-tier data releases. Federal Reserve (Fed) Governor Christopher Waller is scheduled to speak later in the American session.
Japanese Yen price this week
The table below shows the percentage change of Japanese Yen (JPY) against listed major currencies this week. Japanese Yen was the weakest against the Euro.
| USD | EUR | GBP | CAD | AUD | JPY | NZD | CHF | |
| USD | -0.21% | -0.17% | -0.13% | -0.22% | 0.23% | -0.22% | 0.69% | |
| EUR | 0.24% | 0.04% | 0.11% | 0.03% | 0.45% | 0.05% | 0.93% | |
| GBP | 0.17% | -0.04% | 0.04% | -0.03% | 0.40% | 0.00% | 0.86% | |
| CAD | 0.12% | -0.10% | -0.05% | -0.08% | 0.30% | -0.06% | 0.81% | |
| AUD | 0.23% | 0.01% | 0.06% | 0.10% | 0.44% | 0.01% | 0.92% | |
| JPY | -0.23% | -0.44% | -0.29% | -0.33% | -0.43% | -0.43% | 0.54% | |
| NZD | 0.16% | 0.00% | 0.06% | 0.09% | 0.01% | 0.43% | 0.91% | |
| CHF | -0.67% | -0.92% | -0.88% | -0.84% | -0.88% | -0.48% | -0.88% |
The heat map shows percentage changes of major currencies against each other. The base currency is picked from the left column, while the quote currency is picked from the top row. For example, if you pick the Euro from the left column and move along the horizontal line to the Japanese Yen, the percentage change displayed in the box will represent EUR (base)/JPY (quote).
Several Bank of Japan (BoJ) and Japanese government officials crossed the wires during the Asian trading hours on Wednesday, looking to limit the JPY weakness with verbal interventions. Japanese Finance Minister Shunichi Suzuki repeated that they won't rule out any steps, including decisive ones, to respond to disorderly moves in the foreign exchange market. After coming within a few pips of 152.00, USD/JPY edged slightly lower but stabilized above 151.50. Bank of Japan (BoJ) board member Naoki Tamura said that they may hike rates again if upside risks to trend inflation, price outlook heighten, or the likelihood of stably hitting price goal rises further.
The USD Index staged a rebound in the American session on Tuesday and registered marginal daily gains. The index hols steady above 140.00 early Wednesday. The benchmark 10-year US Treasury bond yield continues to fluctuate in a tight channel above 4.2% and US stock index futures trade in positive territory in the European morning.
EUR/USD lost its traction and retreated below 1.0850 in the American session on Tuesday to end the day virtually unchanged. The pair moves up and down in a narrow band above 1.0800 in the early European session.
GBP/USD failed to preserve its recovery momentum and Tuesday and closed in the red. The pair stays on the back foot early Wednesday and edges lower toward 1.2600. The Bank of England will release the Financial Policy Committee statement later in the session.
Gold reversed its direction after testing $2,200 on Tuesday and retreated below $2,180. XAU/USD stays in a consolidation phase early Wednesday.
Gold price remains confined in narrow band below $2,200 mark, bullish bias seems intact.
Japanese Yen FAQs
The Japanese Yen (JPY) is one of the world’s most traded currencies. Its value is broadly determined by the performance of the Japanese economy, but more specifically by the Bank of Japan’s policy, the differential between Japanese and US bond yields, or risk sentiment among traders, among other factors.
One of the Bank of Japan’s mandates is currency control, so its moves are key for the Yen. The BoJ has directly intervened in currency markets sometimes, generally to lower the value of the Yen, although it refrains from doing it often due to political concerns of its main trading partners. The current BoJ ultra-loose monetary policy, based on massive stimulus to the economy, has caused the Yen to depreciate against its main currency peers. This process has exacerbated more recently due to an increasing policy divergence between the Bank of Japan and other main central banks, which have opted to increase interest rates sharply to fight decades-high levels of inflation.
The BoJ’s stance of sticking to ultra-loose monetary policy has led to a widening policy divergence with other central banks, particularly with the US Federal Reserve. This supports a widening of the differential between the 10-year US and Japanese bonds, which favors the US Dollar against the Japanese Yen.
The Japanese Yen is often seen as a safe-haven investment. This means that in times of market stress, investors are more likely to put their money in the Japanese currency due to its supposed reliability and stability. Turbulent times are likely to strengthen the Yen’s value against other currencies seen as more risky to invest in.
Japan's top currency diplomat Masato Kanda said on Wednesday that the government has “no plan to issue statement on forex today.”
He add that there is “no need to hold three-party talks of government, the Bank of Japan (BoJ) and Financial Services Agency (FSA) on forex.”
Also read: Japanese Yen bounces off multi-decade low after Japan's verbal intervention
Market reaction
USD/JPY is holding its corrective downside intact at around 151.70, still gaining 0.10% on the day.
- GBP/JPY edges lower to 191.30 in Wednesday’s early European session.
- Japanese Finance Minister came with some verbal intervention, which lift the Japanese Yen.
- The dovish stance from the BoJ might exert some pressure on the JPY.
- Investors await the UK Q4 GDP growth numbers and Japan’s Tokyo Consumer Price Index (CPI), due later this week.
The GBP/JPY cross trades on a weaker note near 191.30 during the early European session on Wednesday, snapping the two-day winning streak. The Japanese Yen (JPY) recovers some lost ground against its rivals after the verbal intervention from Japanese authorities early Wednesday. Nonetheless, the dovish remarks from the Bank of Japan (BoJ) policymaker to maintain accommodative monetary conditions might limit the JPY and cap the downside of the GBP/JPY cross in the near term.
Japanese Finance Minister Shunichi Suzuki stated on Wednesday that he will not rule out any actions including "decisive steps" to respond to any excessive moves in the foreign exchange. This, in turn, boost the JPY against the Pound Sterling (GBP) on Wednesday. Furthermore, the cautious mood in the market or uncertainties ahead of the Good Friday holiday might boost safe-haven flows and benefit the JPY for the time being.
On the other hand, the recent dovish comments from the BoJ policymaker to maintain accommodative monetary conditions might limit the JPY and cap the downside of the GBP/JPY cross. The BoJ governor Kazuo Ueda said on Wednesday that “based on our current economic and price projections, accommodative financial conditions are expected to continue for the time being.”
On the GBP’s front, the Bank of England's (BoE) Catherine Mann, one of the BOE's most hawkish policymakers, said investors expect too many interest rate cuts this year. Money markets raise their bets on easing at its next monetary-policy decision, putting the chance of a rate cut at 20%.
Traders will take more cues from UK GDP growth numbers on Thursday, which are projected to contract 0.3% QoQ in the fourth quarter. In the scenario of stronger-than-expected GDP growth numbers, the Pound Sterling (GBP) could gain momentum and act as a tailwind for the GBP/JPY pair. On Friday, the Tokyo Consumer Price Index (CPI) for March will be the highlight.
Bank of Japan (BoJ) board member Naoki Tamura is back on the wires, via Reuters, on Wednesday, making some comments on the central bank’s interest rate outlook.
Key quotes
We will set short-term rates at appropriate level while scrutinising economic, price and financial developments.
Can't say decisively now how much BoJ wll hike rates.
Don't think we will be raising rates as fast as the US central bank.
If economy weakens, we will conduct appropriate monetary policy as needed including negative rate, YCC.
Can't say exactly when but direction is for boj to move toward reducing amount of bond purchases.
Won't hike rates solely for purpose of recovering market function.
Will focus on price, wages, consumption and corporate price-setting behaviour, when asked about future monetary policy guidance.
There is no set formula, when asked about additional rate hikes.
If upside risks to trend inflation, price outlook heighten, or likelihood of stably hitting price goal rises further, we may be able to hike rates again.
- GBP/USD could break the psychological support of the 1.2600 level to revisit March’s low at 1.2575.
- Technical analysis suggests the bearish sentiment to test the major support of the 1.2550 level.
- The resistance zone could be found around the 23.6% Fibonacci retracement level of 1.2650 level and the nine-day EMA at 1.2668.
GBP/USD extends its losses for the second consecutive day, depreciating to near 1.2620 during the Asian session on Wednesday. The pair could test the psychological support level of 1.2600. If this level is breached, it could prompt the pair to revisit March’s low at 1.2575.
The technical analysis of the GBP/USD pair suggests a bearish trend. The 14-day Relative Strength Index (RSI) is positioned below 50, indicating a bearish sentiment. Additionally, the Moving Average Convergence Divergence (MACD) confirms the bearish trend, as the MACD line is below the centerline and exhibits divergence below the signal line.
The bearish sentiment could influence the GBP/USD pair to test the major support of 1.2550 level, followed by February’s low of 1.2518.
On the upside, the GBP/USD pair could meet the major barrier at 23.6% Fibonacci retracement level of 1.2650 level. A breakthrough above this barrier could exert upward support for the pair to test the nine-day Exponential Moving Average (EMA) at 1.2668.
If the GBP/USD pair surpasses the latter, it could approach the psychological level of 1.2700.
GBP/USD: Daily Chart
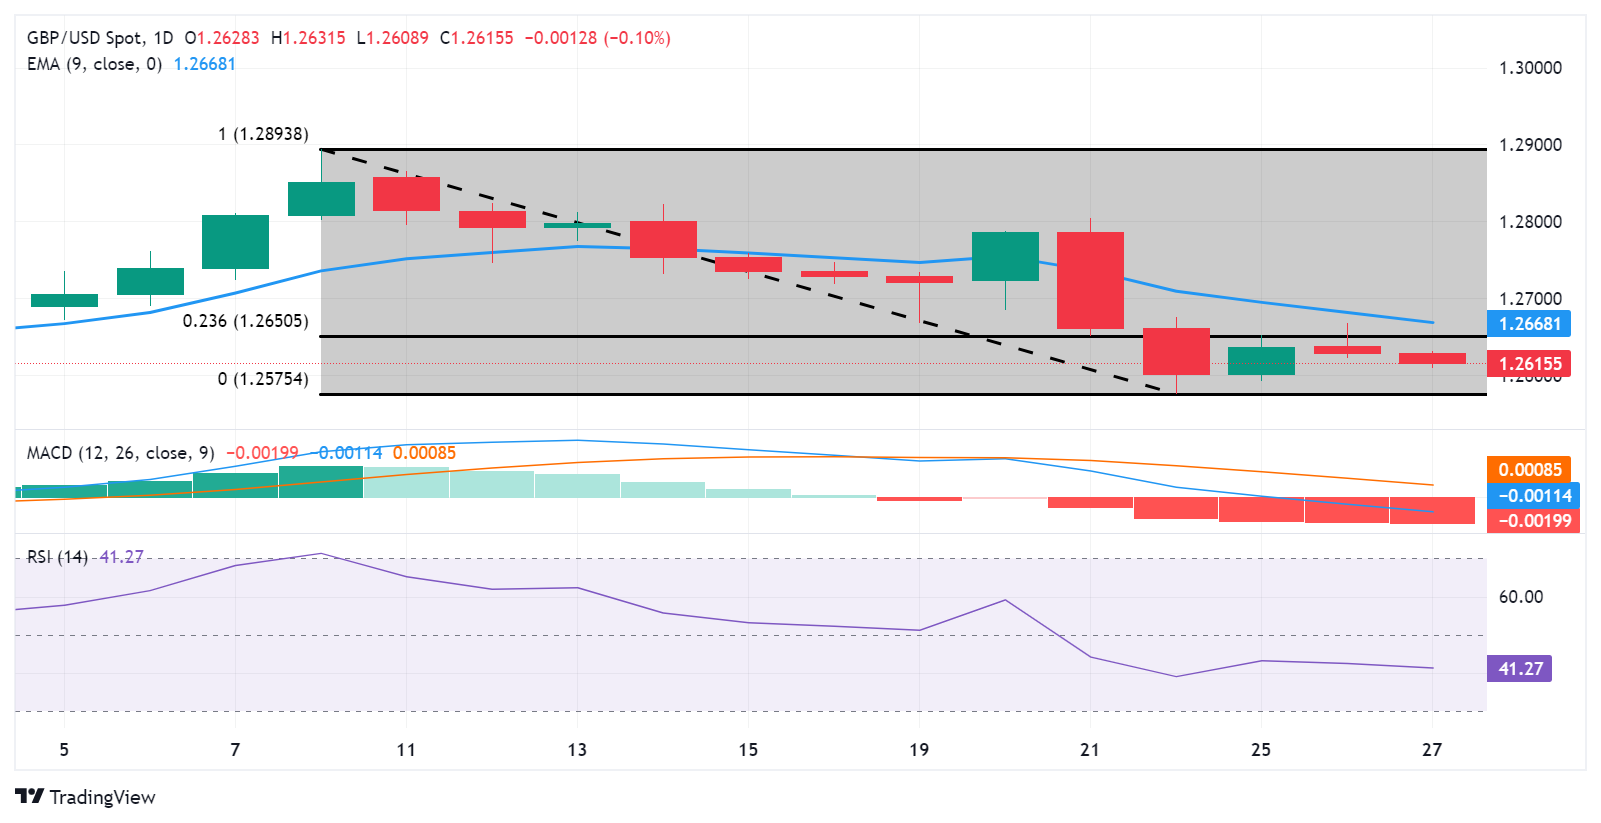
- AUD/JPY attracts some dip-buying amid the dovish BoJ-inspired selling around the JPY.
- The initial market reaction to softer Australian consumer inflation fades rather quickly.
- Intervention fears help limit losses for the JPY and should cap the upside for the cross.
The AUD/JPY cross manages to recover a few pips from the Asian session low and currently trades just below the 99.00 round-figure mark, nearly unchanged for the day.
The Australian Dollar (AUD) meets with some supply after the official data showed that domestic consumer inflation rose by the 3.4% YoY rate in February as compared to expectations for an uptick to 3.5%. The initial market reaction, however, turns out to be short-lived amid growing acceptance that any potential rate cuts by the Reserve Bank of Australia (RBA) will commence in the second half of the year. This, along with the prevalent selling bias surrounding the Japanese Yen (JPY), assists the AUD/JPY cross to attract some dip-buying near the 98.75-98.70 region.
Despite the historic move rate hike for the first time since 2007, the Bank of Japan (BoJ) struck a dovish tone at the end of the March meeting and stopped short of offering any guidance about future policy steps, or the pace of policy normalization. Adding to this, the BoJ indicated that it intends to maintain an accommodative monetary policy for an extended period, which continues to undermine the JPY and lends some support to the AUD/JPY cross. The upside, however, seems limited amid speculations that authorities will intervene in the markets to stem any further JPY weakness.
In fact, Japan's Finance Minister Shunichi Suzuki reiterated that he won't rule out any decisive steps to respond to disorderly FX moves. This comes after Japan's top currency diplomat Masato Kanda earlier this week labelled the recent moves as speculative and said that the current JPY weakness does not reflect fundamentals. This, in turn, warrants some caution for bullish traders and positioning for any further near-term appreciating move for the AUD/JPY cross.
Bank of Japan (BoJ) Governor Kazuo Ueda said on Wednesday that “based on our current economic and price projections, accommodative financial conditions are expected to continue for time being.”
Additional quotes
Accommodative financial conditions likely to underpin Japan's economy and prices.
If long-term rates rise sharply, we are ready to nimbly conduct bond buying operation.
Positive wage-inflation cycle strengthening, growth in real wages likely to gradually turn positive.
- Gold price struggles to gain traction and is influenced by a combination of diverging forces.
- Doubts about whether the Fed will cut rates three times this year lift the USD and cap gains.
- A softer risk tone, along with geopolitical risks, lends support to the safe-haven commodity.
Gold price (XAU/USD) attracts some dip-buying during the Asian session on Wednesday and, for now, seems to have stalled the previous day's late pullback from the $2,200 psychological mark. The Federal Reserve (Fed) indicated last week that it remains on track to cut interest rates by 75 basis points in 2024. This, along with a softer risk tone amid concerns about geopolitical risks stemming from the protracted Russia-Ukraine war and conflicts in the Middle East, turns out to be key factors lending some support to the safe-haven precious metal.
The upside for the Gold price, however, seems limited in the wake of some follow-through US Dollar (USD) buying, supported by Tuesday's better-than-expected release of US Durable Goods Orders. The data validated the view that the US economy is in good shape, which, along with sticky inflation, might force the Federal Reserve (Fed) to keep interest rates higher for longer. The outlook remains supportive of elevated US Treasury bond yields and lifts the USD closer to a multi-week top touched last Friday, which might cap gains for the non-yielding yellow metal.
Daily Digest Market Movers: Gold price consolidates as traders await more cues about the Fed’s rate-cut path
- The Federal Reserve last week projected a less restrictive monetary policy going forward and signaled three rate cuts by year-end, which act as a tailwind for the non-yielding Gold price.
- Russia ramped up its attacks on Ukrainian energy infrastructure in response to a spate of recent drone strikes on its oil refineries by the latter, raising the risk of a further escalation of tensions.
- Iran-backed Houthi militants on Tuesday said they had mounted six attacks on ships in the Gulf of Aden and the Red Sea over the past 72 hours, tempering investors' appetite for riskier assets.
- The US Dollar adds to the previous day's modest gains that followed data showing that US Durable Goods Orders data rose by 1.4% in February as compared to the 6.2% slump in the previous month.
- Separately, the Conference Board reported that the US Consumer Confidence Index dipped to 104.7 in March, little changed from the previous month's reading of 104.8 amid fading fears of a recession.
- Furthermore, consumers' inflation expectations ticked up to 5.3% during the reported month from 5.2% in February, which might force the Federal Reserve to keep interest rates higher for longer.
- The outlook keeps the yield on the benchmark 10-year US government bond afloat above the 4.0% threshold and continues to underpin the Greenback, warranting caution for the XAU/USD bulls.
- Traders might also prefer to wait for the release of the US Personal Consumption and Expenditure (PCE) Price Index for more cues about the Fed's policy path and before placing fresh directional bets.
Technical Analysis: Gold price seems poised to move back above the $2,200 mark and retest the record-high
From a technical perspective, the range-bound price action witnessed over the past two weeks or so might be categorized as a bullish consolidation phase against the backdrop of a blowout rally since the beginning of this month. Moreover, oscillators on the daily chart are holding comfortably in the positive territory and support prospects for an eventual breakout to the upside. Some follow-through buying back above the $2,200 mark will reaffirm the constructive setup and allow the Gold price to retest the record high, around the $2,223 region touched last week.
On the flip side, any corrective decline is likely to find some support near the $2,164-2,163 area ahead of the $2,156-2,155 zone and the $2,147-2,146 region. A convincing break below the latter might prompt aggressive technical selling and drag the Gold price further towards the next relevant support near the $2,128-2,127 region en route to the $2,100 round-figure mark. The said handle should act as a strong base for the XAU/USD, which, if broken decisively, will suggest that the XAU/USD has topped out in the near term and will pave the way for deeper losses.
Gold FAQs
Gold has played a key role in human’s history as it has been widely used as a store of value and medium of exchange. Currently, apart from its shine and usage for jewelry, the precious metal is widely seen as a safe-haven asset, meaning that it is considered a good investment during turbulent times. Gold is also widely seen as a hedge against inflation and against depreciating currencies as it doesn’t rely on any specific issuer or government.
Central banks are the biggest Gold holders. In their aim to support their currencies in turbulent times, central banks tend to diversify their reserves and buy Gold to improve the perceived strength of the economy and the currency. High Gold reserves can be a source of trust for a country’s solvency. Central banks added 1,136 tonnes of Gold worth around $70 billion to their reserves in 2022, according to data from the World Gold Council. This is the highest yearly purchase since records began. Central banks from emerging economies such as China, India and Turkey are quickly increasing their Gold reserves.
Gold has an inverse correlation with the US Dollar and US Treasuries, which are both major reserve and safe-haven assets. When the Dollar depreciates, Gold tends to rise, enabling investors and central banks to diversify their assets in turbulent times. Gold is also inversely correlated with risk assets. A rally in the stock market tends to weaken Gold price, while sell-offs in riskier markets tend to favor the precious metal.
The price can move due to a wide range of factors. Geopolitical instability or fears of a deep recession can quickly make Gold price escalate due to its safe-haven status. As a yield-less asset, Gold tends to rise with lower interest rates, while higher cost of money usually weighs down on the yellow metal. Still, most moves depend on how the US Dollar (USD) behaves as the asset is priced in dollars (XAU/USD). A strong Dollar tends to keep the price of Gold controlled, whereas a weaker Dollar is likely to push Gold prices up.
- EUR/JPY gains ground as a possibility of market intervention by Japanese authorities.
- Japan’s Suzuki does not rule out responding to disorderly FX movements.
- The Euro may encounter pressure on the expectation of the ECB’s rate cut in June.
EUR/JPY moves back and forth with a negative tone as the Japanese Yen (JPY) is under selling pressure following the dovish tone of the Bank of Japan (BoJ). The EUR/JPY cross recovers intraday losses and trades around 164.10 during the Asian trading hours on Wednesday.
However, the Japanese Yen has gained some ground after the comments made by the Japanese Finance Minister Shunichi Suzuki. Suzuki stated that he closely monitors foreign exchange (FX) movements with a high sense of urgency and is not ruling out any steps, including "decisive steps," to respond to disorderly FX movements. Additionally, BoJ Governor Kazuo Ueda mentioned on Wednesday that household sentiment is improving due to expectations of wage hikes.
The Euro may encounter downward pressure amid increasing speculation for a rate cut by the European Central Bank (ECB) in June. ECB policymaker Madis Muller stated on Tuesday that the central bank is nearing a point where rate cuts could commence. Additionally, ECB official Yannis Stoumaras remarked that there is consensus for a rate cut in June.
Traders will likely monitor speeches from ECB Chief Economist Philip Lane and ECB Executive Board member Piero Cipollone on Wednesday, in addition to the European Commission’s Business Climate and Consumer Confidence data for March.
- Indian Rupee recovers its recent losses despite the firmer US Dollar.
- The robust Indian economic outlook could strengthen the INR amid slowing global economy and multiple challenges.
- Investors will closely watch the US February PCE data on Friday, despite the markets are closed for Good Friday.
Indian Rupee (INR) extends its recovery on Wednesday despite renewed US Dollar demand (USD). The rebound of INR from its record low level is supported by the likely intervention from the Reserve Bank of India (RBI) to curb sharp swings in the Indian Rupee.
Against the backdrop of a slowing global economy and geopolitical headwinds, India's strong economic performance stands out. Foreign portfolio investors turning net buyers in February and Foreign Direct Investment (FDI) inflows are expected to accelerate, according to the monthly economic review report from the Ministry of Finance. The positive Indian economic outlook could boost the INR and limit the USD/INR’s upside.
The US Gross Domestic Product Annualized (Q4) will be due on Thursday. The growth rate is forecast to remain steady at 3.2%. Investors will closely watch the US February Personal Consumption Expenditures Price Index (PCE) data on Friday. The markets will be closed on Friday for Good Friday.
Daily Digest Market Movers: Indian Rupee remains strong amid geopolitical challenges
- India’s Current Account Deficit narrowed to $10.5 billion in the quarter that ended December 2023 (Q4) from $11.4 billion in the previous reading, 1.2% of Gross Domestic Product (GDP).
- S&P Global raised India's GDP growth forecast for FY25 to 6.8%, lower than the RBI’s projection of 7%. Additionally, S&P expects RBI to cut rates by 75 bps by the end of this fiscal year.
- The US Conference Board’s Consumer Confidence dropped to 104.7 from a downwardly revised 104.8 in February.
- The Durable Goods Orders for February rose to 1.4% in February from a 6.9% fall in January, better than estimated.
- Atlanta Fed President Raphael Bostic suggested that the US central bank should only cut rates once this year as the US economy and inflation slow gradually.
- Chicago Fed President Austan Goolsbee said that three cuts in 2024 were consistent with his views, but the Fed must see progress in inflation and strike a balance with its dual mandate.
Technical Analysis: Indian Rupee recovers, but upside potential seems limited
Indian Rupee trades firmly on the day. USD/INR maintains the bullish outlook in the longer term since the pair surged above a multi-month-old descending trend channel last week.
In the short term, USD/INR holds above the key 100-day Exponential Moving Average (EMA) on the daily chart, with the 14-day Relative Strength Index lying above the 50 midline. This suggests that the positive outlook of the pair remains intact and the path of least resistance level is to the upside.
An all-time high of 83.49 will be the key upside barrier for the pair. Any follow-through buying above this level will pave the way to the 84.00 psychological round mark. On the other hand, the first downside filter to watch is the resistance-turned-support level at 83.20. Further south, the next contention level is located at the confluence of the 100-day EMA and the round figure of the 83.00 mark.
US Dollar price today
The table below shows the percentage change of US Dollar (USD) against listed major currencies today. US Dollar was the weakest against the Swiss Franc.
| USD | EUR | GBP | CAD | AUD | JPY | NZD | CHF | |
| USD | 0.05% | 0.13% | 0.12% | 0.31% | 0.12% | 0.27% | 0.03% | |
| EUR | -0.05% | 0.06% | 0.08% | 0.25% | 0.11% | 0.23% | -0.03% | |
| GBP | -0.12% | -0.08% | 0.00% | 0.18% | 0.07% | 0.15% | -0.10% | |
| CAD | -0.12% | -0.07% | 0.02% | 0.18% | 0.04% | 0.16% | -0.10% | |
| AUD | -0.31% | -0.26% | -0.19% | -0.19% | -0.20% | -0.03% | -0.28% | |
| JPY | -0.12% | -0.07% | 0.01% | 0.00% | 0.18% | 0.10% | -0.14% | |
| NZD | -0.28% | -0.23% | -0.18% | -0.15% | 0.02% | -0.10% | -0.26% | |
| CHF | -0.03% | 0.03% | 0.10% | 0.10% | 0.29% | 0.07% | 0.26% |
The heat map shows percentage changes of major currencies against each other. The base currency is picked from the left column, while the quote currency is picked from the top row. For example, if you pick the Euro from the left column and move along the horizontal line to the Japanese Yen, the percentage change displayed in the box will represent EUR (base)/JPY (quote).
Indian Rupee FAQs
The Indian Rupee (INR) is one of the most sensitive currencies to external factors. The price of Crude Oil (the country is highly dependent on imported Oil), the value of the US Dollar – most trade is conducted in USD – and the level of foreign investment, are all influential. Direct intervention by the Reserve Bank of India (RBI) in FX markets to keep the exchange rate stable, as well as the level of interest rates set by the RBI, are further major influencing factors on the Rupee.
The Reserve Bank of India (RBI) actively intervenes in forex markets to maintain a stable exchange rate, to help facilitate trade. In addition, the RBI tries to maintain the inflation rate at its 4% target by adjusting interest rates. Higher interest rates usually strengthen the Rupee. This is due to the role of the ‘carry trade’ in which investors borrow in countries with lower interest rates so as to place their money in countries’ offering relatively higher interest rates and profit from the difference.
Macroeconomic factors that influence the value of the Rupee include inflation, interest rates, the economic growth rate (GDP), the balance of trade, and inflows from foreign investment. A higher growth rate can lead to more overseas investment, pushing up demand for the Rupee. A less negative balance of trade will eventually lead to a stronger Rupee. Higher interest rates, especially real rates (interest rates less inflation) are also positive for the Rupee. A risk-on environment can lead to greater inflows of Foreign Direct and Indirect Investment (FDI and FII), which also benefit the Rupee.
Higher inflation, particularly, if it is comparatively higher than India’s peers, is generally negative for the currency as it reflects devaluation through oversupply. Inflation also increases the cost of exports, leading to more Rupees being sold to purchase foreign imports, which is Rupee-negative. At the same time, higher inflation usually leads to the Reserve Bank of India (RBI) raising interest rates and this can be positive for the Rupee, due to increased demand from international investors. The opposite effect is true of lower inflation.
- USD/CAD could gain grounds on risk aversion ahead of US PCE due on Friday.
- WTI oil price depreciates as the API Weekly Crude Oil Stock increased.
- The expectations of the US Fed initiating rate cuts could weaken the US Dollar.
USD/CAD halts its two-day losing streak, edging higher to near 1.3590 during the Asian session on Wednesday. The US Dollar (USD) is exhibiting strength, while lower Crude oil prices are contributing to downward pressure on the Canadian Dollar (CAD). This dynamic is bolstering the USD/CAD pair.
Western Texas Intermediate (WTI) oil price edges lower to near $80.70, by the press time. This decline in WTI price is attributed to the increase in API Weekly Crude Oil Stock for the week ending on March 22, with 9.337 million barrels against the previous decrease of 1.519 million barrels.
Bank of Canada (BoC) Senior Deputy Governor Carolyn Rogers has cautioned about Canada's low productivity resulting from inadequate investment, competition, and the underutilization of skills among new Canadians. Additionally, Rogers has highlighted concerns that the current inflation situation could pose a more significant threat than it has in recent decades.
The US Dollar Index (DXY) experienced its second consecutive day of gains amid a risk-off sentiment, driven by anticipation surrounding the upcoming release of US Personal Consumption Expenditures (PCE) scheduled for Friday. However, the decline in US Treasury yields may be attributed to the expectations surrounding the US Federal Reserve (Fed) regarding potential rate cuts. This sentiment could potentially limit the advances of the US Dollar.
Atlanta Fed President Raphael Bostic has expressed his expectation for just one rate cut this year, cautioning against reducing rates prematurely due to the potential for increased disruption. On the other hand, Chicago Fed President Austan Goolsbee aligns with the majority of the board, anticipating three cuts.
“China is willing to deepen financial cooperation with other countries,” People’s Bank of China (PBOC) Governor Pan Gongsheng told the annual gathering of the Boao Forum for Asia on Wednesday.
Further comments
Asian countries should push forward reforms at the International Monetary Fund (IMF)
Bilateral currency swaps help enhance financial safety nets.
Market reaction
AUD/USD is currently trading close to intraday lows of 0.6511, down 0.17% on the day.
Japanese Finance Minister Shunichi Suzuki said on Wednesday that he “won't rule out any steps including "decisive steps" to respond to disorderly FX moves.”
Additional takeaways
Closely watching FX moves with a high sense of urgency.
Won't rule out any steps to respond to disorderly FX moves.
His reaction comes in response to the USD/JPY pair climbing to a fresh 34-year high of 151.97.
Following his comments, USD/JPY corrected sharply to near 151.70, still up 0.11% on the day.
Japanese Yen FAQs
The Japanese Yen (JPY) is one of the world’s most traded currencies. Its value is broadly determined by the performance of the Japanese economy, but more specifically by the Bank of Japan’s policy, the differential between Japanese and US bond yields, or risk sentiment among traders, among other factors.
One of the Bank of Japan’s mandates is currency control, so its moves are key for the Yen. The BoJ has directly intervened in currency markets sometimes, generally to lower the value of the Yen, although it refrains from doing it often due to political concerns of its main trading partners. The current BoJ ultra-loose monetary policy, based on massive stimulus to the economy, has caused the Yen to depreciate against its main currency peers. This process has exacerbated more recently due to an increasing policy divergence between the Bank of Japan and other main central banks, which have opted to increase interest rates sharply to fight decades-high levels of inflation.
The BoJ’s stance of sticking to ultra-loose monetary policy has led to a widening policy divergence with other central banks, particularly with the US Federal Reserve. This supports a widening of the differential between the 10-year US and Japanese bonds, which favors the US Dollar against the Japanese Yen.
The Japanese Yen is often seen as a safe-haven investment. This means that in times of market stress, investors are more likely to put their money in the Japanese currency due to its supposed reliability and stability. Turbulent times are likely to strengthen the Yen’s value against other currencies seen as more risky to invest in.
Bank of Japan (BoJ) Governor Kazuo Ueda said Wednesday that the “household sentiment is improving on expectations of wage hikes.”
Last week, the BoJ Governor said that he expects to maintain an accommodative monetary policy for the time being, fuelling a bout of intense selling in the Japanese Yen.
Market reaction
At the time of writing, USD/JPY is trading at the highest level since 1990, just shy of 152.00. The pair is up 0.21% on the day.
Bank of Japan FAQs
The Bank of Japan (BoJ) is the Japanese central bank, which sets monetary policy in the country. Its mandate is to issue banknotes and carry out currency and monetary control to ensure price stability, which means an inflation target of around 2%.
The Bank of Japan has embarked in an ultra-loose monetary policy since 2013 in order to stimulate the economy and fuel inflation amid a low-inflationary environment. The bank’s policy is based on Quantitative and Qualitative Easing (QQE), or printing notes to buy assets such as government or corporate bonds to provide liquidity. In 2016, the bank doubled down on its strategy and further loosened policy by first introducing negative interest rates and then directly controlling the yield of its 10-year government bonds.
The Bank’s massive stimulus has caused the Yen to depreciate against its main currency peers. This process has exacerbated more recently due to an increasing policy divergence between the Bank of Japan and other main central banks, which have opted to increase interest rates sharply to fight decades-high levels of inflation. The BoJ’s policy of holding down rates has led to a widening differential with other currencies, dragging down the value of the Yen.
A weaker Yen and the spike in global energy prices have led to an increase in Japanese inflation, which has exceeded the BoJ’s 2% target. Still, the Bank judges that the sustainable and stable achievement of the 2% target has not yet come in sight, so any sudden change in the current policy looks unlikely.
- Australian Dollar extends its losses following the softer-than-expected Aussie CPI.
- Australia’s Monthly Consumer Price Index (YoY) rose by 3.4%, slightly below the expected 3.5%.
- US Dollar gains ground on risk aversion ahead of Personal Consumption Expenditures.
The Australian Dollar (AUD) extends its losses for the second successive session on Wednesday. The AUD/USD pair experiences losses following softer-than-expected Aussie consumer prices, potentially prompting the Reserve Bank of Australia (RBA) to consider a dovish stance on the interest rate trajectory. This outlook is exerting downward pressure on the AUD.
Australia’s Monthly Consumer Price Index (YoY) rose by 3.4% in February, consistent with previous levels but slightly below the anticipated 3.5%. Still, the latest reading pointed to the lowest since November 2021. The AUD has faced downward pressure following the release of Westpac Consumer Confidence on Tuesday, which dipped 1.8% to 84.4 in March 2024 from February's 86.0, easing from 20-month highs.
The US Dollar Index (DXY) saw its second consecutive day of gains amid a risk-off sentiment, driven by anticipation surrounding the upcoming release of US Personal Consumption Expenditures (PCE) scheduled for Friday. However, the decline in US Treasury yields may be attributed to the expectations surrounding the US Federal Reserve (Fed) regarding potential rate cuts. This sentiment could potentially limit the advances of the US Dollar.
Daily Digest Market Movers: Australian Dollar depreciates on softer consumer prices
- Australia’s Westpac Leading Index (MoM) increased by 0.1% in February, against the previous decline of 0.09%.
- Australia's government has pledged to support a minimum wage increase aligned with inflation this year, recognizing the ongoing challenges low-income families face amid rising living costs.
- According to a Bloomberg survey of economists, the consensus expectation is for the People's Bank of China (PBoC) to implement two additional Reserve Requirement Ratio (RRR) cuts in 2024, amounting to a total reduction of 50 basis points.
- Chinese President Xi Jinping is scheduled to meet with US business leaders. This meeting serves as a follow-up to his November dinner with US investors in San Francisco.
- Atlanta Fed President Raphael Bostic expressed his expectation for just one rate cut this year, cautioning that reducing rates prematurely could lead to greater disruption.
- Chicago Fed President Austan Goolsbee aligns with the majority of the board, anticipating three cuts. However, Goolsbee mentioned the necessity for further evidence indicating a decrease in inflation before proceeding with rate cuts.
- US Durable Goods Orders increased by 1.4% in February, against the 1.3% expected and previous decline of 6.9%.
- US Durable Goods Orders ex Defense rose by 2.2% in February, compared to the expected 1.1% and 7.9% previous decline.
- US Housing Price Index (MoM) decreased by 0.1% in January, against the December’s increase of 0.1%.
Technical Analysis: Australian Dollar falls to near 0.6520 followed by March’s low
The Australian Dollar trades near 0.6520 on Wednesday. A notable support level is positioned at the psychological mark of 0.6500, followed by March’s low at 0.6477. If the AUD/USD pair breaks below this level, it could test the major support of the 0.6450 level. On the upside, immediate resistance may be encountered around the 23.6% Fibonacci retracement level of 0.6541. This area is aligned with the major barrier of 0.6550 and the 21-day Exponential Moving Average (EMA) at 0.6553.
AUD/USD: Daily Chart
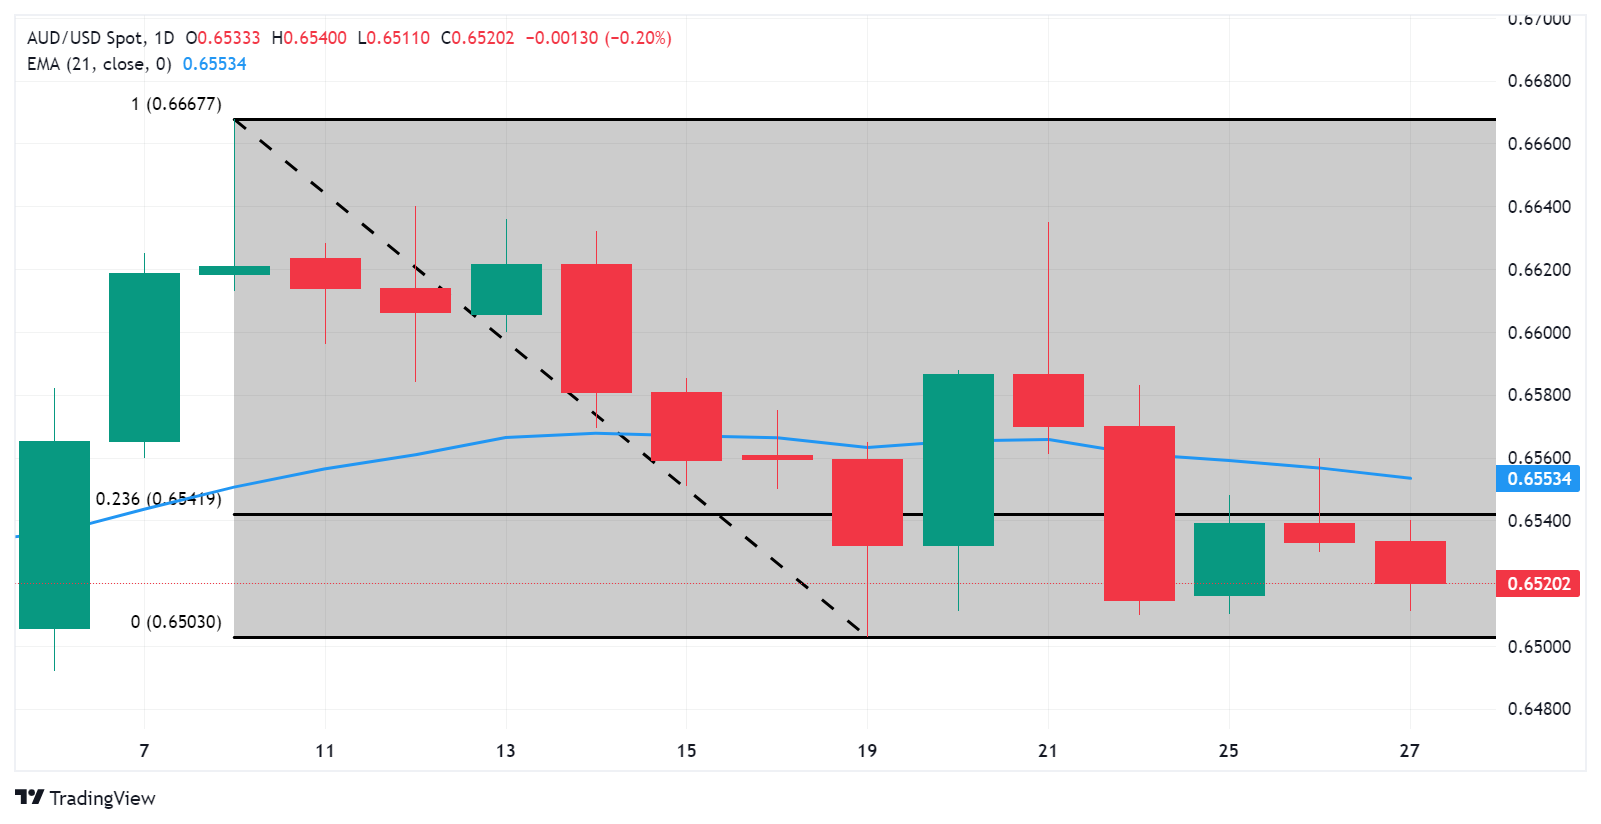
Australian Dollar price today
The table below shows the percentage change of Australian Dollar (AUD) against listed major currencies today. Australian Dollar was the weakest against the US Dollar.
| USD | EUR | GBP | CAD | AUD | JPY | NZD | CHF | |
| USD | 0.05% | 0.12% | 0.11% | 0.31% | 0.18% | 0.24% | 0.03% | |
| EUR | -0.05% | 0.05% | 0.07% | 0.26% | 0.18% | 0.20% | -0.02% | |
| GBP | -0.12% | -0.08% | -0.01% | 0.19% | 0.14% | 0.11% | -0.10% | |
| CAD | -0.11% | -0.06% | 0.02% | 0.20% | 0.07% | 0.13% | -0.09% | |
| AUD | -0.31% | -0.27% | -0.20% | -0.21% | -0.14% | -0.07% | -0.29% | |
| JPY | -0.18% | -0.14% | -0.07% | -0.08% | 0.12% | -0.01% | -0.21% | |
| NZD | -0.23% | -0.19% | -0.14% | -0.12% | 0.07% | 0.01% | -0.22% | |
| CHF | -0.02% | 0.02% | 0.09% | 0.09% | 0.28% | 0.21% | 0.22% |
The heat map shows percentage changes of major currencies against each other. The base currency is picked from the left column, while the quote currency is picked from the top row. For example, if you pick the Euro from the left column and move along the horizontal line to the Japanese Yen, the percentage change displayed in the box will represent EUR (base)/JPY (quote).
Australian Dollar FAQs
One of the most significant factors for the Australian Dollar (AUD) is the level of interest rates set by the Reserve Bank of Australia (RBA). Because Australia is a resource-rich country another key driver is the price of its biggest export, Iron Ore. The health of the Chinese economy, its largest trading partner, is a factor, as well as inflation in Australia, its growth rate, and Trade Balance. Market sentiment – whether investors are taking on more risky assets (risk-on) or seeking safe havens (risk-off) – is also a factor, with risk-on positive for AUD.
The Reserve Bank of Australia (RBA) influences the Australian Dollar (AUD) by setting the level of interest rates that Australian banks can lend to each other. This influences the level of interest rates in the economy as a whole. The main goal of the RBA is to maintain a stable inflation rate of 2-3% by adjusting interest rates up or down. Relatively high interest rates compared to other major central banks support the AUD, and the opposite for relatively low. The RBA can also use quantitative easing and tightening to influence credit conditions, with the former AUD-negative and the latter AUD-positive.
China is Australia’s largest trading partner so the health of the Chinese economy is a major influence on the value of the Australian Dollar (AUD). When the Chinese economy is doing well it purchases more raw materials, goods, and services from Australia, lifting demand for the AUD, and pushing up its value. The opposite is the case when the Chinese economy is not growing as fast as expected. Positive or negative surprises in Chinese growth data, therefore, often have a direct impact on the Australian Dollar and its pairs.
Iron Ore is Australia’s largest export, accounting for $118 billion a year according to data from 2021, with China as its primary destination. The price of Iron Ore, therefore, can be a driver of the Australian Dollar. Generally, if the price of Iron Ore rises, AUD also goes up, as aggregate demand for the currency increases. The opposite is the case if the price of Iron Ore falls. Higher Iron Ore prices also tend to result in a greater likelihood of a positive Trade Balance for Australia, which is also positive for the AUD.
The Trade Balance, which is the difference between what a country earns from its exports versus what it pays for its imports, is another factor that can influence the value of the Australian Dollar. If Australia produces highly sought-after exports, then its currency will gain in value purely from the surplus demand created by foreign buyers seeking to purchase its exports versus what it spends to purchase imports. Therefore, a positive net Trade Balance strengthens the AUD, with the opposite effect if the Trade Balance is negative.
- EUR/USD drifts lower for the second straight day amid some follow-through USD buying.
- Bets for a June ECB rate cut undermine the Euro and further contribute to the downfall.
- Traders might refrain from placing fresh bets ahead of the US PCE Price Index on Friday.
The EUR/USD pair extends the previous day's rejection slide from the 100-day Simple Moving Average (SMA) resistance near the 1.0865 region and remains under some selling pressure for the second straight day on Wednesday. Spot prices, however, manage to hold above the 1.0800 mark during the Asian session, though seem vulnerable to slide further amid some follow-through US Dollar (USD) buying.
The USD Index (DXY), which tracks the Greenback against a basket of currencies, climbs back closer to a multi-week high touched last Friday and remains well supported by the optimistic view for the US economy. The outlook was reinforced by the slightly better-than-expected release of US Durable Goods Orders data on Tuesday, which might force the Federal Reserve (Fed) to keep rates higher for longer amid still-sticky inflation. This, along with a softer risk tone, underpins the safe-haven buck and exerts some pressure on the EUR/USD pair.
The shared currency, on the other hand, is weighed down by rising bets for a June rate cut by the European Central Bank (ECB). In fact, ECB policymaker Madis Muller said on Tuesday that we are closer to a point where the central bank can start cutting rates. Adding to this, ECB official Yannis Stoumaras commented that there is a consensus for a June rate cut. This is seen as another factor that contributes to the offered tone surrounding the EUR/USD pair and supports prospects for an extension of over a two-week-old downtrend.
Moving ahead, Wednesday's economic docket features the release of the Spanish CPI report, which might influence the common currency and provide some impetus in the absence of any relevant data from the US. The focus, however, remains glued to the US Personal Consumption and Expenditure (PCE) Price Index on Friday. The crucial data will be looked for more cues about the Fed's policy path. This, in turn, should influence the near-term USD price dynamics and help determine the next leg of a directional move for the EUR/USD pair.
- The Japanese Yen continues losing ground for the third successive day on Wednesday.
- The uncertainty over the BoJ’s future policy steps continues to undermine the JPY.
- A modest USD uptick lends additional support to USD/JPY and favours bullish traders.
The Japanese Yen (JPY) drifts lower for the third straight day on Wednesday and drops back closer to its lowest level since November 2023 touched against its American counterpart last week. Despite raising interest rates for the first time since 2007, the Bank of Japan (BoJ) struck a dovish tone at the end of the March policy meeting and stopped short of offering any guidance about future policy steps, or the pace of policy normalization. This, in turn, keeps the JPY bulls on the defensive, though verbal interventions from Japanese authorities help limit any further losses.
The US Dollar (USD), on the other hand, continues to draw support from the optimistic outlook for the US economy and doubts whether the Federal Reserve (Fed) will cut interest rates three times this year as projected amid still-sticky inflation. This, in turn, is seen as another factor lending support to the USD/JPY pair and support prospects for further gains. Traders, however, might prefer to wait for the release of the US Personal Consumption and Expenditure (PCE) Price Index on Friday for more cues about the Fed's policy path and before placing fresh directional bets.
Daily Digest Market Movers: Japanese Yen remains depressed amid the divergent BoJ-Fed expectations
- The Bank of Japan indicated that it intends to maintain an accommodative monetary policy for an extended period at the end of the March meeting, which continues to undermine the Japanese Yen.
- The view was echoed by BoJ Board Member Tamura Naoki on Wednesday, who added that the bank will guide monetary policy appropriately in accordance with economic, price, and financial developments.
- Japan’s finance minister said on Tuesday that he would not rule out any measures to cope with the weakening currency and that excessive volatility is creating adverse conditions for business operations.
- Japan's top currency diplomat Masato Kanda said that the current JPY weakness does not reflect fundamentals and labelled the recent moves as speculative, showing readiness to respond to volatility.
- The US Dollar adds to the previous day's modest gains that followed the release of the upbeat Durable Goods Orders data, which registered a growth of 1.4%, slightly more than expected in February.
- Separately, the Conference Board reported that the US Consumer Confidence Index dipped to 104.7 in March, little changed from the previous month's reading of 104.8 amid fading fears of a recession.
- Furthermore, consumers' inflation expectations ticked up to 5.3% during the reported month from 5.2% in February, which might force the Federal Reserve to keep interest rates higher for longer.
- Traders, however, seem reluctant to place aggressive direction bets and prefer to wait for the release of the crucial US Personal Consumption and Expenditure (PCE) Price Index data on Friday.
Technical Analysis: USD/JPY bulls retain control, could aim to challenge the multi-decade high near the 152.00 mark
From a technical perspective, some follow-through buying, leading to a move beyond the YTD peak and the 152.00 mark, will be seen as a fresh trigger for bullish traders. Given that oscillators on the daily chart are holding comfortably in the positive territory, the USD/JPY pair might then prolong its well-established uptrend witnessed since January 2023 and climb further towards the 153.00 round figure.
Meanwhile, any corrective decline might now be seen as a buying opportunity and remain limited near the 151.00 mark. A convincing break below, however, might expose the next relevant support near the 150.25 region. This is closely followed by the 150.00 psychological mark, which if broken decisively could make the USD/JPY pair vulnerable to accelerate the corrective decline further towards the 149.35-149.30 region en route to the 149.00 mark.
Japanese Yen FAQs
The Japanese Yen (JPY) is one of the world’s most traded currencies. Its value is broadly determined by the performance of the Japanese economy, but more specifically by the Bank of Japan’s policy, the differential between Japanese and US bond yields, or risk sentiment among traders, among other factors.
One of the Bank of Japan’s mandates is currency control, so its moves are key for the Yen. The BoJ has directly intervened in currency markets sometimes, generally to lower the value of the Yen, although it refrains from doing it often due to political concerns of its main trading partners. The current BoJ ultra-loose monetary policy, based on massive stimulus to the economy, has caused the Yen to depreciate against its main currency peers. This process has exacerbated more recently due to an increasing policy divergence between the Bank of Japan and other main central banks, which have opted to increase interest rates sharply to fight decades-high levels of inflation.
The BoJ’s stance of sticking to ultra-loose monetary policy has led to a widening policy divergence with other central banks, particularly with the US Federal Reserve. This supports a widening of the differential between the 10-year US and Japanese bonds, which favors the US Dollar against the Japanese Yen.
The Japanese Yen is often seen as a safe-haven investment. This means that in times of market stress, investors are more likely to put their money in the Japanese currency due to its supposed reliability and stability. Turbulent times are likely to strengthen the Yen’s value against other currencies seen as more risky to invest in.
- WTI trades in negative territory near $80.85 amid the firmer USD.
- The prospect of ongoing geopolitical tensions could lift the WTI prices.
- OPEC+ set to affirm its production cuts policy amid tensions in the Middle East and Russia.
Western Texas Intermediate (WTI), the US crude oil benchmark, is trading around $80.85 on Wednesday. WTI prices edge lower amid the modest rebound of US Dollar (USD) and mixed reaction to the loss of Russian refinery capacity after recent Ukrainian n attacks.
Refinery disruptions in Russia caused by Ukrainian drone attacks raised concern over global oil supply. Analysts forecast that these disruptions affected around 12% of Russia's total oil processing capacity. The geopolitical factors are likely to play a key role in WTI prices and the escalating tension in both the Middle East and Russia-Ukraine might lift the black gold.
Furthermore, the Organisation of Petroleum Exporting Countries and its allies (OPEC+) are set to affirm its production cuts policy amid tensions in the Middle East and Russia. It’s worth noting that when OPEC+ lowers supply when demand falls, WTI prices tend to rise.
Additionally, the uptick of WTI prices is supported by the softer USD which typically makes oil cheaper for buyers holding other currencies. The expectation of interest rate cuts by the US Federal Reserve (Fed) this year provides some support to WTI prices. The Fed Chairman Jerome Powell reiterated last week that policymakers plan to cut rates before the end of this year, given economic growth continues.
Market players will closely watch the US February Personal Consumption Expenditures Price Index (PCE) data, due on Friday. If the report shows stronger-than-expected readings, this could delay the expectation of rate cuts from the Fed this year and cap the upside of the WTI prices. Federal Funds Futures have priced in a 74.5% chance that the Fed will cut rates in the June meeting, according to CME Group's FedWatch tool.
Bank of Japan (BoJ) board member Naoki Tamura said on Wednesday that, based on the current economic and price outlook, the Japanese central bank is anticipated to maintain accommodative monetary conditions for the time being.
Key quotes
“Based on current economic, price outlook, BOJ likely to maintain accommodative monetary conditions for time being.”
“Will guide monetary policy appropriately in accordance with economic, price, financial developments.”
“Not there yet to allow market forces to fully drive long-term interest rate moves.”
“Despite our tweak to monetary policy framework, there are side-effects remaining.”
“Our monetary easing had some effect in underpinning economic growth.”
“Japan's economy is showing some signs of weakness but is recovering moderately.”
“Rises in services prices pushing up overall inflation.”
“Positive wage-inflation cycle is likely to continue.”
Market reaction
Following the headline above, USD/JPY was down 0.01% on the day at 151.54.
- ASX 200 Index follows the top performing Health Care and Consumer Staples sectors.
- Wall Street experienced losses across all three US benchmarks due to profit booking and market revaluations.
- Barton Gold has initiated a $4 million capital-raising effort to progress its Tunkillia and Tarcoola projects.
The ASX 200 Index edges higher to near 7,800 on Wednesday, retracing its recent losses from the previous session. The Health Care and Consumer Staples sectors were the top performers, with notable gains seen in Aft Pharmaceuticals, Botanix Pharmaceuticals, Skin Elements, and Wingara AG. However, Australian shares experienced a slip at the open, mirroring modest losses across all three benchmarks in the United States (US). Investors opted to take some profits and reevaluate market valuations.
Furthermore, Australian consumer prices came in softer than expected, which could enhance market sentiment, thereby providing support to the domestic equity market. In February, the Monthly Consumer Price Index (YoY) rose by 3.4%, consistent with previous levels but slightly below the anticipated 3.5%. Still, the latest reading pointed to the lowest since November 2021.
The top performing stocks in the ASX 200 Index included Polynovo, which rose by 4.29% to 2.19; Johns Lyng Group, with a gain of 4.31% to 6.29; and Helia Group, up by 3.23% to 3.84. Conversely, the top losers were Incitec Pivot, declining by 2.40% to 2.85; Arcadium Lithium, down by 4.06% to 4.02; and Waypoint REIT, which fell by 0.55% to 2.50. The A-VIX experienced a significant decline, dropping by 0.51 points or 4.82% to reach 10.04. Meanwhile, the All Ordinaries Index is up, gaining 24.70 points or 0.31% to reach 8,061.40.
Global bank messaging network SWIFT has confirmed that a new interlinking solution could facilitate financial institutions in conducting various transactions using central bank digital currency (CBDC) and other types of digital tokens.
Barton Gold's $4 million capital raising initiative aimed at advancing its South Australian projects has garnered firm commitments from investors in Australia, Europe, and the US. The fundraising will comprise a $3 million placement at an issue price of $0.24 per share, along with a $1 million purchase plan for the issuance of 4.1 million new shares.
Australian Stock Market FAQs
Stock markets in Australia are managed by the Australian Securities Exchange (ASX), headquartered in Sydney. The main indices are the S&P/ASX 200 and the S&P/ASX 300, which track the performance of the 200 and 300 largest stocks by market capitalization listed on the exchange, respectively. The S&P/ASX 200 was launched in April 2000, and it is rebalanced every quarter.
Almost half of the index belongs to the financial sector, with major banks like the Commonwealth Bank of Australia, Westpac or National Australia Bank. The so-called materials sector is also relevant – comprising almost 20% of the weighting in the index – with mining giants such as BHP Group or Rio Tinto. Other important sectors are biotechnology, real estate, consumer staples, and industrials.
Many different factors drive the ASX 200, but mainly it is the aggregate performance of the component companies revealed in their quarterly and annual earnings reports the main factor behind its performance. Commodity prices can also affect the index given its significant share of mining companies. Macroeconomic data such as Gross Domestic Product (GDP) growth, inflation, or unemployment data from Australia is also important as they are indicators of the health of the country’s economy and thus the profitability of its largest companies. Global economic conditions may also play a role, particularly from China, as the Asian country is Australia’s largest trading partner.
The level of interest rates in Australia, set by the Reserve Bank of Australia (RBA), also influences the ASX 200 and ASX 300 indexes as it affects the cost of credit, on which many firms are heavily reliant. Generally, when the RBA cuts interest rates (or signals it is going to do it), it is positive for the Australian stock market as it means a lower cost of credit for companies and higher economic growth ahead, likely boosting sales. On the contrary, if the RBA signals that it will increase interest rates, this tends to weigh on the index. As always, there is a caveat: banks. Financial institutions tend to benefit from higher interest rates because they earn more from lending to other businesses, thus boosting their overall income.
The People’s Bank of China (PBoC) set the USD/CNY central rate for the trading session ahead on Wednesday at 7.0946 as compared to the previous day's fix of 7.0943 and 7.2250 Reuters estimates.
Australia’s monthly Consumer Price Index (CPI) rises 3.4% in the year to February 2024, compared to the annual increase of 3.4% seen in January, the Australian Bureau of Statistics reported on Wednesday.
The market had expected an increase of 3.5% in the reported period.
Market reaction
At the time of press, the AUD/USD pair was up 0.08% on the day at 0.6538.
Inflation FAQs
Inflation measures the rise in the price of a representative basket of goods and services. Headline inflation is usually expressed as a percentage change on a month-on-month (MoM) and year-on-year (YoY) basis. Core inflation excludes more volatile elements such as food and fuel which can fluctuate because of geopolitical and seasonal factors. Core inflation is the figure economists focus on and is the level targeted by central banks, which are mandated to keep inflation at a manageable level, usually around 2%.
The Consumer Price Index (CPI) measures the change in prices of a basket of goods and services over a period of time. It is usually expressed as a percentage change on a month-on-month (MoM) and year-on-year (YoY) basis. Core CPI is the figure targeted by central banks as it excludes volatile food and fuel inputs. When Core CPI rises above 2% it usually results in higher interest rates and vice versa when it falls below 2%. Since higher interest rates are positive for a currency, higher inflation usually results in a stronger currency. The opposite is true when inflation falls.
Although it may seem counter-intuitive, high inflation in a country pushes up the value of its currency and vice versa for lower inflation. This is because the central bank will normally raise interest rates to combat the higher inflation, which attract more global capital inflows from investors looking for a lucrative place to park their money.
Formerly, Gold was the asset investors turned to in times of high inflation because it preserved its value, and whilst investors will often still buy Gold for its safe-haven properties in times of extreme market turmoil, this is not the case most of the time. This is because when inflation is high, central banks will put up interest rates to combat it. Higher interest rates are negative for Gold because they increase the opportunity-cost of holding Gold vis-a-vis an interest-bearing asset or placing the money in a cash deposit account. On the flipside, lower inflation tends to be positive for Gold as it brings interest rates down, making the bright metal a more viable investment alternative.
- GBP/USD trades softer around 1.2630 in Wednesday’s early Asian session.
- The US Durable Goods Orders rose 1.4% in February against a 6.9% fall in January, better than expected.
- BoE’s Mann dampened expectations for large interest rate cuts this year.
The GBP/USD pair edges lower to 1.2620 during the early Asian trading hours on Wednesday. The major pair remains capped under the key 100-day Exponential Moving Average (EMA). Many Federal Reserve (Fed) policymakers stick to their path of interest-rate cuts amid the bumpy road to inflation and expect to cut rates three times in 2024, which might weigh on the Greenback. On Thursday, the US and UK Gross Domestic Product (GDP) data will be released.
Despite recent monthly inflation increases, Fed Chair Jerome Powell said last week that pricing pressures would continue to ease and that it may be appropriate to cut interest rates later this year. The majority of US central bank officials expect to cut rates three times in 2024. These remarks push the Fed's stance more dovish and drag the US Dollar (USD) lower in recent sessions.
About the data, the US Conference Board’s Consumer Confidence fell to 104.7 from a downwardly revised 104.8 in February. Meanwhile, the Durable Goods Orders for February came in better than market expectations, rising 1.4% in February from a 6.9% fall in January. The US Dollar Index (DXY) consolidates around 104.30 following the release of US economic data as traders await fresh clues from the US February Personal Consumption Expenditures Price Index (PCE) data on Friday.
On the other hand, the Bank of England's (BoE) Catherine Mann, one of the BOE's most hawkish policymakers, warned that financial markets are expecting too many interest rate cuts this year and that the BoE is unlikely to move before the US Fed. "I think they're pricing in too many cuts," Mann said. Traders will take more cues from UK GDP growth numbers on Thursday, which are estimated to contract 0.3% QoQ and 0.2% YoY in the fourth quarter. In the case of stronger-than-expected GDP growth number data, the Pound Sterling (GBP) could gain traction and act as a tailwind for the GBP/USD pair.
New Zealand Finance Minister Nicola Willis unveiled the nations’ Treasury half yearly update on Wednesday. New Zealand is expected to see annual CPI for FY24 at 3.3%, down from +4.1% forecast in previous reading.
Key quotes
“New Zealand to see slower growth than forecast in half yearly update.”
“Sees annual fy24 GDP at +0.1% down from +1.5% forecast in half yearly update.”
“Sees annual fy25 GDP at +2.1% up from +1.5% forecast in half yearly update.”
“Sees annual fy24 CPI at +3.3% down from +4.1% forecast in half yearly update.”
“Scenario is not a fiscal forecast as does not include all information from government entities.”
Market reaction
At the time of press, the NZD/USD pair was up 0.01% on the day at 0.6005.
New Zealand Dollar FAQs
The New Zealand Dollar (NZD), also known as the Kiwi, is a well-known traded currency among investors. Its value is broadly determined by the health of the New Zealand economy and the country’s central bank policy. Still, there are some unique particularities that also can make NZD move. The performance of the Chinese economy tends to move the Kiwi because China is New Zealand’s biggest trading partner. Bad news for the Chinese economy likely means less New Zealand exports to the country, hitting the economy and thus its currency. Another factor moving NZD is dairy prices as the dairy industry is New Zealand’s main export. High dairy prices boost export income, contributing positively to the economy and thus to the NZD.
The Reserve Bank of New Zealand (RBNZ) aims to achieve and maintain an inflation rate between 1% and 3% over the medium term, with a focus to keep it near the 2% mid-point. To this end, the bank sets an appropriate level of interest rates. When inflation is too high, the RBNZ will increase interest rates to cool the economy, but the move will also make bond yields higher, increasing investors’ appeal to invest in the country and thus boosting NZD. On the contrary, lower interest rates tend to weaken NZD. The so-called rate differential, or how rates in New Zealand are or are expected to be compared to the ones set by the US Federal Reserve, can also play a key role in moving the NZD/USD pair.
Macroeconomic data releases in New Zealand are key to assess the state of the economy and can impact the New Zealand Dollar’s (NZD) valuation. A strong economy, based on high economic growth, low unemployment and high confidence is good for NZD. High economic growth attracts foreign investment and may encourage the Reserve Bank of New Zealand to increase interest rates, if this economic strength comes together with elevated inflation. Conversely, if economic data is weak, NZD is likely to depreciate.
The New Zealand Dollar (NZD) tends to strengthen during risk-on periods, or when investors perceive that broader market risks are low and are optimistic about growth. This tends to lead to a more favorable outlook for commodities and so-called ‘commodity currencies’ such as the Kiwi. Conversely, NZD tends to weaken at times of market turbulence or economic uncertainty as investors tend to sell higher-risk assets and flee to the more-stable safe havens.
| Pare | Closed | Change, % |
|---|---|---|
| AUDUSD | 0.65329 | -0.1 |
| EURJPY | 164.013 | -0.03 |
| EURUSD | 1.0832 | -0.04 |
| GBPJPY | 191.22 | -0.04 |
| GBPUSD | 1.26288 | -0.06 |
| NZDUSD | 0.60039 | 0.04 |
| USDCAD | 1.35822 | -0.01 |
| USDCHF | 0.90355 | 0.46 |
| USDJPY | 151.521 | 0.09 |


© 2000-2026. All rights reserved.
This site is managed by Teletrade D.J. LLC 2351 LLC 2022 (Euro House, Richmond Hill Road, Kingstown, VC0100, St. Vincent and the Grenadines).
The information on this website is for informational purposes only and does not constitute any investment advice.
The company does not serve or provide services to customers who are residents of the US, Canada, Iran, The Democratic People's Republic of Korea, Yemen and FATF blacklisted countries.
Making transactions on financial markets with marginal financial instruments opens up wide possibilities and allows investors who are willing to take risks to earn high profits, carrying a potentially high risk of losses at the same time. Therefore you should responsibly approach the issue of choosing the appropriate investment strategy, taking the available resources into account, before starting trading.
Use of the information: full or partial use of materials from this website must always be referenced to TeleTrade as the source of information. Use of the materials on the Internet must be accompanied by a hyperlink to teletrade.org. Automatic import of materials and information from this website is prohibited.
Please contact our PR department if you have any questions or need assistance at pr@teletrade.global.
transfers