- Analytics
- News and Tools
- Market News
CFD Markets News and Forecasts — 09-08-2022
Analysts from Morgan Stanley (MS) conveyed their hopes from the US inflation ahead of the key US Consumer Price Index (CPI) figures for July. It’s worth noting that the MS signalled the risk of the EUR/USD pair’s fall towards the 0.9700 mark the previous day.
Also read: EUR/USD risks falling towards 0.9700 – Morgan Stanley
Important findings
We think the market is underestimating the stickiness of US inflation, the Fed's resolve in tackling it, and the necessary tightening required to achieve lower inflation.
US CPI on August 10 may be a critical market catalyst for the next leg of the USD rally should it exceed market expectations.
It should be noted that the the headline US CPI is expected to ease to 8.7% YoY from 9.1% market forecasts whereas the CPI ex Food & Energy (Core CPI) is likely to rise from 5.9% to 6.1%.
- A Double Top formation near 200-EMA bolstered the downside gestures.
- Greenback bulls are lacking confidence above the demand zone placed around 0.9500.
- A drop below 40.00 by the RSI (14) will trigger the downside momentum.
The USD/CHF pair is displaying topsy-turvy moves after dropping below the critical support of 0.9560 on Monday. Broadly, the asset is declining after failing to surpass the crucial hurdle of 0.9640. The major refreshed its weekly low at 0.9511 on Tuesday.
The formation of a Double Top on a four-hour scale has already underpinned the bearish mood. A failure in overstepping the critical hurdle of 0.9650 resulted in a steel fall in the asset. Also, the 200-period Exponential Moving Average (EMA) at 0.9650 acted as a roadblock for the greenback bulls.
The asset has surrendered the cushion of 50-EMA at 0.9572 and is declining towards the demand zone, which is placed in a 0.9470-0.9500 range.
Meanwhile, the Relative Strength Index (RSI) (14) is oscillating in the 40.00-60.00 range, which indicates a consolidation ahead. A drop below 40.00 by the RSI (14) will trigger the downside momentum.
Should the asset drop below the above-mentioned demand zone, the Swiss franc bulls will drag the asset towards the round-level support at 0.9400, followed by March 24 high at 0.9344.
On the flip side, the asset may display an upside move towards July 22 high at 0.9704 and July 7 high at 0.9743 after violating the double top resistance.
USD/CHF four-hour chart
-637956859051165835.png)
- WTI picks up bids to reverse the pullback from weekly high.
- Energy prices struggle to please bulls as softer weekly API oil inventories battle risk-aversion wave.
- Russia’s suspension of oil supplies through Druzhba pipeline, hopes of higher demand per US oil refiners, pipeline companies favor bulls.
- Official Oil Stocks Change from EIA, US/China CPI for July will be crucial for clear directions.
WTI remains sidelined around $90.00 during Wednesday’s Asian session, after failing to impress bulls the previous day despite Russia’s another blow to European energy demand. The oil buyers should have also cheered upbeat demand forecasts from the US refiners and pipeline companies. However, fears of recession and a cautious mood ahead of the headline inflation data from China and the US seem to challenge the energy buyers of late.
That said, the weekly prints of the American Petroleum Institute’s (API) Crude Oil Stock data for the period ended on August 05 flashed an increase of 2.156 million barrels versus the previous addition of 2.165M.
On the other hand, “US oil refiners and pipeline operators expect energy consumption to be strong for the second half of 2022, even though analysts and industry watchers have worried that demand could falter if the global economy enters a recession or high fuel prices deter travelers,” said Reuters.
Also bullish for the prices could be comments from Russian pipeline monopoly Transneft that said, per Reuters, “Ukraine has suspended Russian oil pipeline flows to parts of central Europe since early this month because Western sanctions prevented it from accepting transit fees from Moscow.”
Alternatively, firmer US data and hawkish Fedspeak renewed the US dollar strength and weighed on the prices of black gold. On Tuesday, US Nonfarm Productivity improved to -4.6% during the second quarter (Q2), -4.7% expected and -7.4% prior, whereas the Unit Labor Cost increased to 10.8% from 12.7% prior and 9.5% market consensus during the said period. It’s worth noting that Fed's St. Louis president James Bullard said on Tuesday, per Reuters, that he wants rates at 4% by the end of the year. This joins recently firmer interest rate futures suggesting nearly 70% odds favoring the 75 basis points (bps) of a Fed rate hike in September.
The risk-off mood could be witnessed in Wall Street’s downbeat performance and the rebound in the US Treasury yields, which in turn weighed on the WTI crude oil prices.
Moving on, China’s Consumer Price Index (CPI) and Producer Price Index (PPI) data for July will offer immediate directions but major attention will be given to the US CPI, expected to ease to 8.7% from 9.1% on YoY, as well as the CPI ex Food & Energy which is likely to rise from 5.9% to 6.1%. Following that, the official weekly oil inventory data from the Energy Information Administration (EIA) for the week ended on August 05, expected -0.4M versus 4.467M, will be important to watch for the oil prices forecast.
Technical analysis
Although a sustained break of the weekly resistance line, now support around $87.45, keeps WTI crude oil buyers hopeful, Tuesday’s Doji candlestick teases bears until the quote stays below the $92.00 immediate hurdle.
- AUD/USD extends Tuesday’s downbeat performance, stays pressured around intraday low.
- Fears of economic slowdown, pre-inflation anxiety weigh on the risk-barometer pair.
- Aussie NAB data failed to impress bulls amid downbeat equities, rebound in yields.
- Firmer China CPI may offer intermediate help but US inflation is crucial amid strong jobs report, hawkish Fedspeak.
AUD/USD remains depressed around the intraday low near 0.6955 as sellers keep reins for the second consecutive day ahead of the key US inflation data. In addition to the US Consumer Price Index (CPI), headline inflation numbers from Australia’s key customer China also adds to the pre-data caution. Additionally, fears of economic slowdown and the hawkish Fed bets are extra catalysts that weigh on the Aussie pair during the early Asian session on Wednesday.
Market sentiment turned sour after the firmer US data joined Russia’s further tightening of energy supplies, which in turn weighed on the AUD/USD prices during the European session on Tuesday.
That said, US Nonfarm Productivity improved to -4.6% during the second quarter (Q2), -4.7% expected and -7.4% prior, whereas the Unit Labor Cost increased to 10.8% from 12.7% prior and 9.5% market consensus during the said period. On Tuesday, Russia reportedly suspended oil flows via the southern leg of the Druzhba pipeline, amid transit payment issues.
It’s worth noting that Fed's St. Louis president James Bullard said on Tuesday, per Reuters, that he wants rates at 4% by the end of the year. This joins recently firmer interest rate futures suggesting nearly 70% odds favoring the 75 basis points (bps) of a Fed rate hike in September.
Against this backdrop, the US 10-year Treasury yields regained upside momentum while closing the day around 2.779% while the Wall Street benchmarks also posted losses by the day’s end.
Earlier on Tuesday, National Australia Bank’s Business Conditions and Business Confidence data for July printed upbeat results as the former rose to 20, versus 15 market consensus and 13 prior. Further, Business Confidence matched 7 forecasts while rising past 1 prior. On the contrary, Australia’s Westpac Consumer Confidence Index for August eased to 81.2, below 83.8 prior. Also, China marked a 20.1% YoY gain in passenger car sales during July, per china auto industry body CPCA.
Looking forward, AUD/USD may witness an intermediate rebound should China’s CPI and Producer Price Index (PPI) data for July match upbeat forecasts. However, major attention will be given to the US CPI, expected to ease to 8.7% from 9.1% on YoY, as well as the CPI ex Food & Energy which is likely to rise from 5.9% to 6.1%. Given the hawkish expectations from the Core CPI, the US dollar may witness further upside in case of the firmer inflation print.
Also read: US CPI Preview: It is the hard core that counts, five scenarios for critical inflation data
Technical analysis
AUD/USD holds onto the pullback from a downward sloping resistance line from April 20, close to 0.7015 by the press time. The same joins the impending bear cross of the MACD and steady RSI to direct sellers towards the 50-DMA retest, around 0.6850 at the latest.
- GBP/USD is juggling in a 28-pip range as investors await UK GDP data.
- The BOE is worried over soaring consensus for price pressures.
- Japan’s administration is eyeing measures to paddle up the labor cost index.
The GBP/JPY pair is displaying back and forth moves in a narrow range of 163.00-163.28 from the New York session as investors are shifting their focus toward the UK economic data, which will release on Friday.
The UK economy is facing various headwinds for the past few months. Right from the soaring price pressures to the lower Labor Cost Index and now to political instability after the resignation of UK PM Boris Johnson. Broadly, the cross is facing barricades around 163.50 and is likely to remain vulnerable ahead.
The Bank of England (BOE) is going through the tedious task of handling the roaring price rise index. The inflation rate is 9.4% in the pound zone on an annual basis and BOE Governor Andrew Bailey in his commentary on monetary policy announcement cleared that the inflation rate could go to 13%. So, a consensus of galloping inflation is sufficient to scare out the market participants. In addition to that, de-growth in paychecks by the UK households is an additional mess for the BOE.
On the economic data front, a preliminary estimate for the UK GDP is 2.8% vs. 8.7% the former release on an annual basis. While the quarterly data is expected to report a shrink in economic activities by 0.2% against the expansion of 0.8%.
Meanwhile, the yen bulls are dancing to the tunes of Japan’s cabinet re-shuffle. Japanese Prime Minister Fumio Kishida is set to retain Finance Minister Shunichi Suzuki in a cabinet reshuffle this week. Now, eyes will remain on measures to be taken by the Japanese administration to step up the labor cost index, which is critical to keep the inflation rate above 2%.
- DXY, on the 4-hour time frame, the price is consolidated along a rising support line as markets await US CPI, July.
- 105.05 is a key structure that guards a significant correction to the downside.
- On the upside, an area of price imbalance between 106.40 and near 108 the figure could be targetted.
Financial markets retreated, but so did the US dollar and US yields remain around lower levels of late ahead of the release of the day's US July Consumer Price Index data in the New York open. The greenback was just above holding onto the 106 level overnight and is flat for the day so far in Asia.
US CPI eyed
The US inflation data could be pivotal for the US dollar, although there will be another report before the next Federal Reserve meeting. Nevertheless, officials to pay close attention to core inflation this time around. ''A continuation of recent trends would be unwelcomed and likely tilt the Fed toward another substantive rate increase at the 20‑21 September FOMC meeting,'' analysts at ANZ Bank said:
''The consensus expectation anticipates headline inflation slowed to 0.2% MoM vs 1.3% Mom in June owing largely to weaker energy and food prices. That would see the annual rate of inflation ease slightly to 8.7% from 9.1% in June. Core inflation, however, is expected to remain sticky at 6.1% YoY (vs 5.9% in June) – still way in excess of the Fed’s 2.0% target. Core inflation, in particular, core services inflation which accounts for almost 60% of the CPI, must demonstrate signs of moderating before inflation can return sustainably to target.''
The data will follow recent job data in last week's Nonfarm Payrolls blockbuster outcome. This was highlighting solid wage growth and combined with the US productivity data that is highlighting another surge in labour costs, investors fear that this will complicate the Federal Reserve's efforts to control inflation.
nevertheless, WIRP is now showing over 75% odds of a 75 bp hike at the September 20-21 FOMC meeting which would be expected to keep the greenback in the hands of the bulls. However, markets are still pricing in a quick turnaround by the Fed into an easing cycle in H1 2023, as analysts at Brown Brothers Harriman explained. ''It's pretty clear that the Fed doesn't see it that way and the data bear that out, at least for now.''
Beyond the CPI data and ahead of the September 20-21 FOMC meeting, the next big Fed event will be its Jackson Hole Economic Symposium scheduled for August 25-27. Fed Chairs often use this symposium in August to announce or hint at policy shifts ahead of the September FOMC meetings and the analysts at BBH explained that ''by late August, we will have seen all the major July data and some of the early August surveys such as the preliminary S&P Global PMI readings and regional Fed surveys. The Fed will also have a good idea of how the economy is doing in Q3. That said, we do not think the Fed will make any major policy announcements or paint itself into a corner ahead of next month’s FOMC meeting.''
US dollar technical analysis
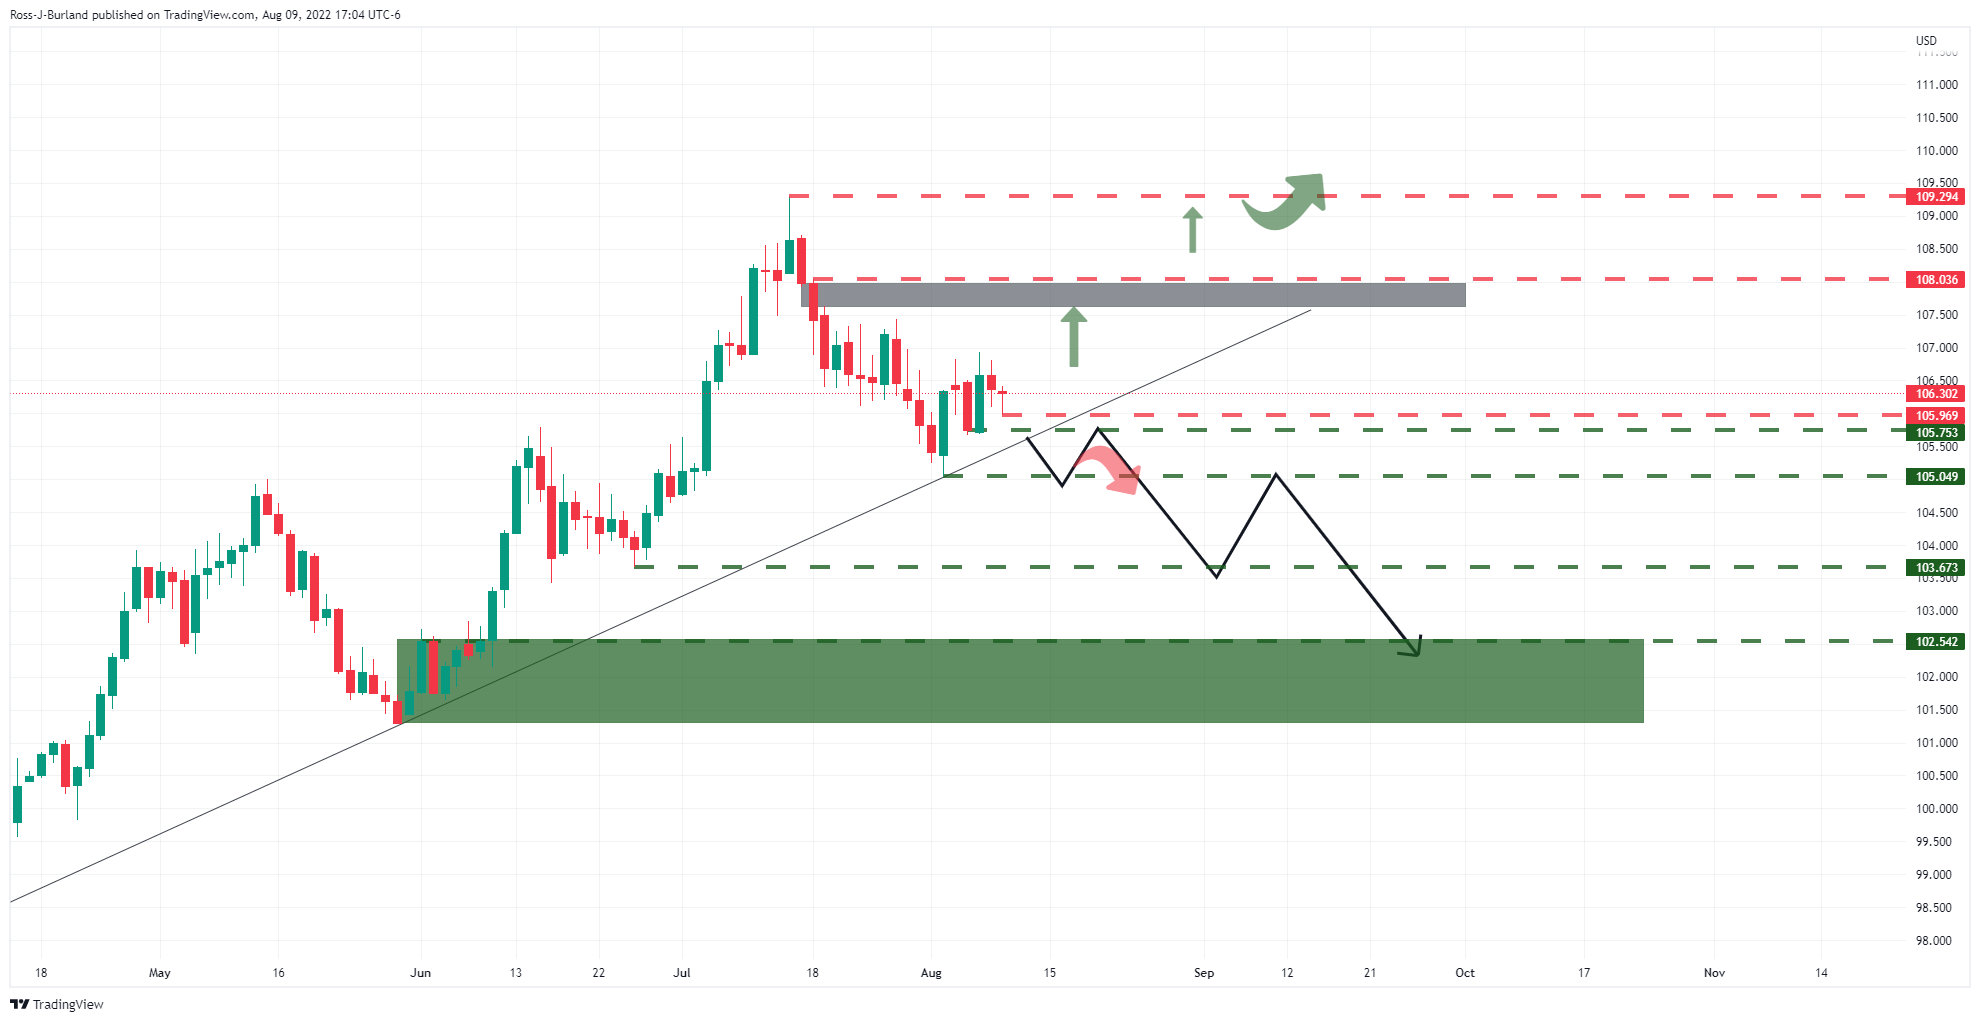
This brings us to the technical picture for the US dollar. On the 4-hour time frame, the price is consolidated along a rising support line. If this were to break, then 105.05 is a key structure that guards a significant correction to the downside. On the upside, we have a greyed-out area of price imbalance as illustrated on the chart between 106.40 and near 108 the figure. Beyond there, 109.294 highs couldbe targetted and a break thereof could be blue skies for the greenback.
- Silver price drops as US bond yields escalate while the US dollar weakens.
- Sentiment remains fragile, shifting sour since the European equities close.
- Silver’s price action to remain choppy ahead of the US CPI report.
Silver price retreats from weekly highs reached on Monday at $20.74 but is exchanging hands near the August 9 lows at $20.42 as the Asian Pacific session starts. At the time of writing, XAGUSD is trading at $20.52, slightly up 0.15%.
Silver drops albeit a soft US dollar
Wall Street ended Tuesday’s session in the red, while Asian equities point to a lower open. The greenback weakens, as shown by the US Dollar Index at 106.302, down 0.07%, while the US 10-year bond yield rises two bps at 2.783%.
Sentiment shifted sour due to several reasons. Firstly, last Friday’s strong US jobs report remains in traders’ minds, putting recession fears away, as shown by money market futures STIRs, portraying a 88% chance of a Federal Reserve 75 bps rate hike. That said, alongside hawkish Fed commentary, policymakers have reiterated the Fed’s commitment to bringing inflation down. Most members have been vocal about going 75 bps in the next meeting, while Cleveland’s Fed Mester and Chicago’s Fed Evans remain open to 50 or 75 bps.
Furthermore, the US inflation figures looming keeps investors uneasy. The US Consumer Price Index (CPI) for July is expected at 8.7% YoY, less than June’s 9.1%, while core CPI figures are foreseen at 6.1% YoY vs. 6.2% in the previous reading.
After Wednesday’s main event, XAGUSD traders should expect feedback from the Chicago Fed President Charles Evans and Minnesota Fed’s Neil Kashkari, which would cross the wires after the release. By Thursday, the San Francisco Fed President, Mary Daly, will cross wires on Bloomberg.
Silver (XAGUSD) scenarios for Wednesday’s US CPI
Therefore, XAGUSD traders should be aware of important US economic data. If the CPI tops expectations, we could see a reaction of US bond yields rising, underpinning the greenback higher, consequently precious metals prices falling. Otherwise, if US inflation shows signs of tempering, silver and commodity prices could increase, while US bond yields and the greenback fall.
Silver (XAGUSD) Key Technical Levels
Late on Tuesday, Bloomberg conveyed comments from JPMorgan Chase & Co. economists suggesting that the Inflation Reduction Act will have “almost no effect” on price growth that’s currently running at the fastest pace in four decades.
Key quotes
The landmark tax, climate and health-care bill, which passed the Senate on Sunday and is headed for the House on Friday, puts a slimmed-down version of President Joe Biden’s domestic agenda on a path to becoming law after a year of Democratic infighting that the White House was unable to control.
The nonpartisan Congressional Budget Office, the Committee for a Responsible Federal Budget and the Penn Wharton Budget Model all found that the legislation will have a minimal influence on inflation, which climbed an annual 9.1% in June.
‘The aggregate demand impulse is trivial,’ Michael Feroli, JPMorgan’s chief US economist, wrote in a note Tuesday. ‘Moreover, we believe the drug-pricing provisions will have little near-term impact on the CPI,’ he said, referring to the consumer price index.
‘If there are longer-run beneficial effects for the supply side of the economy -- as its backers claim -- that’s a growth issue, not an inflation issue: in the long-run inflation is determined by Fed policy,’ Feroli wrote.
The law is estimated to reduce the federal budget deficit by about $300 billion over the next decade. For the fiscal year that starts Oct. 1, the narrowing in the gap is seen at $18 billion, or less than 0.1% of gross domestic product, Feroli said.
Also read: Forex Today: Market players on their toes ahead of US inflation data
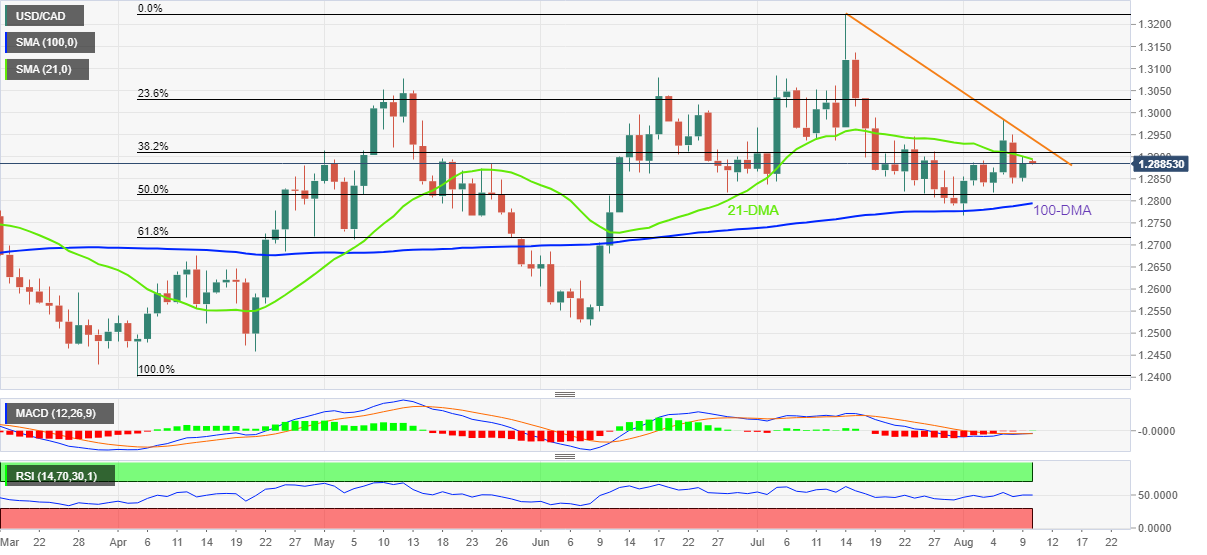
- USD/CAD retreats from 21-DMA, reverses the previous day’s corrective bounce.
- Sluggish MACD, steady RSI hint at further grind towards the south.
- Monthly resistance line adds to the upside filters, key Fibonacci retracement levels offer extra challenges to bears.
USD/CAD remains pressured around 1.2885 as it steps back from the 21-DMA hurdle during Wednesday’s Asian session. In doing so, the Loonie pair portrays the failure to keep the bounce off the 100-DMA, marked during the last week.
Given the sluggish MACD and the steady RSI supporting the recent grinding towards the south, the USD/CAD Price are likely to remain softer.
However, the 50% Fibonacci retracement level of April-July upside, near 1.2815, could challenge short-term sellers of the Loonie pair before directing them to the 100-DMA re-test, at 1.2795 by the press time.
In case of the USD/CAD remains pressured below 1.2795, the monthly low and the 61.8% Fibonacci retracement, respectively around 1.2767 and 1.2717, might lure the pair bears.
Alternatively, the 21-DMA level near 1.2895 and the 1.2900 threshold guard the quote’s recovery moves.
Following that, the one-month-old descending resistance line, close to 1.2940 at the latest, appears important for the USD/CAD buyers to watch.
If the quote manages to successfully cross the 1.2940 hurdle, the odd of witnessing a run-up towards the 1.3000 round figure and then to the multiple highs marked around 1.3080 since May can’t be ruled out.
USD/CAD: Daily chart
Trend: Pullback expected
- GBP/USD is expecting a downside below 1.2060 as the Fed will keep a hawkish stance intact.
- Pessimism in UK economic data has weakened the pound bulls.
- The UK Industrial Production is seldom expected to display an improvement.
The GBP/USD pair has faced selling pressure around 1.2080 and is likely to display more losses on dropping below the major cushion of 1.2060. On a broader note, the cable has auctioned in a 1.2063-1.2138 range for the previous two trading sessions after a modest rebound from a low near the psychological support of 1.2000.
Investors are not finding optimism in the sterling as the preliminary estimate for quarterly Gross Domestic Product (GDP) displays that the economy shrunk in July. The economic data is expected to land at -0.2% vs. 0.8% in the prior release. Also, the annual data is indicating a downward shift to 2.8% against the prior release of 8.7%.
Also, the estimates for Manufacturing Production data are not displaying a rosy picture. The economic data is likely to tumble to 1.3% from the former print of 2.3%. Whereas, Industrial Production is expected to improve to 1.6% in comparison with the former release of 1.4%. Therefore, a broader pessimism in the consensus for UK economic data is keeping the pound bulls on the back foot.
Meanwhile, the US dollar index (DXY) has sensed barricades at around 106.40, however, the upside looks favorable ahead of US Inflation. Despite, a lower consensus for the price pressures at 8.7%, investors believe that a single downward shift is not sufficient for prosperity. A spree of downward print in the US Consumer Price Index (CPI) will scale down troubles for Federal Reserve (Fed) policymakers.
- EUR/USD remains pressured towards 1.0200 after a two-day uptrend.
- Firmer US data, fears of more pain for Europe due to the Russian energy crisis join pre-CPI anxiety to tease sellers.
- Final readings of Germany’s HICP inflation data for July are also important to watch.
- July month China CPI, PPI could offer immediate directions.
EUR/USD fades the corrective pullback from 1.0202 around 1.0215 as traders turn cautious ahead of the key US Consumer Price Index (CPI) during the initial hour of Wednesday’s Asian session. Also exerting downside pressure on the major currency pair are the economic fears surrounding the Eurozone.
US Dollar Index (DXY) recovered late Tuesday after the firmer US data joined downbeat equities and mildly positive US Treasury yields. Also keeping the greenback positive were fears of the bloc’s recession after Russia’s extra tightening of oil flow.
On Tuesday, US Nonfarm Productivity improved to -4.6% during the second quarter (Q2), -4.7% expected and -7.4% prior, whereas the Unit Labor Cost increased to 10.8% from 12.7% prior and 9.5% market consensus during the said period.
Additionally, Fed's St. Louis president James Bullard said on Tuesday that he wants rates at 4% by the end of the year. This joins nearly recently firmer interest rate futures suggesting nearly 70% odds favoring the 75 basis points (bps) of Fed rate hike in September.
Elsewhere, Russia reportedly suspended oil flows via the southern leg of the Druzhba pipeline, amid transit payment issues.
Amid these plays, the US 10-year Treasury yields regained upside momentum while closing the day around 2.779% while the Wall Street benchmarks also posted losses by the day’s end.
Moving on, China’s CPI and Producer Price Index (PPI) data for July will offer immediate directions to the markets ahead of the final readings of Germany’s Harmonized Index of Consumer Prices (HICP) Inflation data for the said month. However, major attention will be given to the US CPI, expected to ease to 8.7% from 9.1% on YoY, as well as the CPI ex Food & Energy which is likely to rise from 5.9% to 6.1%. Given the hawkish expectations from the Core CPI, the US dollar may witness further upside in case of the firmer inflation print.
Also read: US July CPI Preview: What is the base effect and why it matters
Technical analysis
Despite the latest softness, EUR/USD remains above the 21-DMA and a two-week-old support line, respectively around 1.0175 and 1.0150, which in turn keeps buyers hopeful of refreshing the monthly high near 1.0300. However, a downward sloping resistance line from March, close to 1.0330 at the latest, appears a tough nut to crack for the bulls.
- The AUD/JPY advanced on Tuesday, despite a pessimistic market sentiment.
- From a daily chart perspective, the AUD/JPY is neutral biased, in a narrow range.
- AUD/JPY Price Analysis: Favors bulls above 94.40; otherwise, a break below 93.90 keeps bears in charge.
The AUD/JPY edges lower as the Asian Pacific session begins, spurred by a risk-off impulse spurred by a US inflation data release on Wednesday. That alongside recession fears reignited by Micron, a US semiconductor company, says company profits would be at the low end or below its guidance. At the time of writing, the AUD/JPY is trading at 94.07, slightly down 0.08%.
AUD/JPY Tuesday’s price action opened near the day’s highs, reached at 94.39 after the cross-currency hit 93.90, its daily low.
AUD/JPY Price Analysis: Technical outlook
Analyzing the AUD/JPY daily chart, the pair’s bias is still neutral-to-upwards, even though all the daily EMAs are below the spot price. Nevertheless, the AUD/JPY market structure indicates the cross-currency as downward biased, as successive series of lower highs and lows emerged after reaching its YTD high at 96.88. Therefore, the AUD/JPY is neutral biased, with neither buyers nor sellers being in total control.
Zooming into the 1-hour scale, the AUD/JPY is range-bound, within the boundaries of 93.90-94.40. Meanwhile, the Relative Strength Index (RSI) is pushing towards the 50-midline, meaning it has no clear bias.
If the AUD/JPY breaks the top of the range at 94.40, its first resistance would be the 95.00 figure. Once cleared, the next resistance would be the July 27 daily high at 95.70, followed by 96.00. On the flip side, a breach of 93.90 would send the pair sliding towards the 100-hour EMA at 93.50. A decisive break will expose the 200-hour EMA at 93.05.
 AUD/JPY Hourly chart
AUD/JPY Key Technical Levels
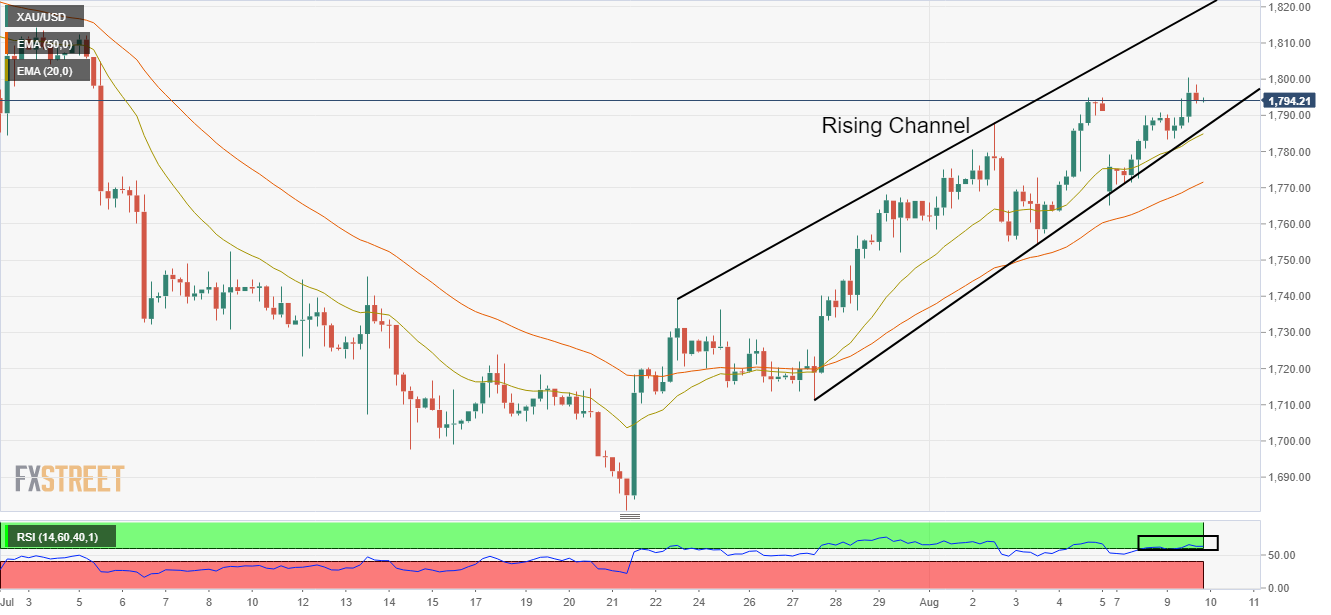
- Gold price is aiming to recapture its fresh monthly high at $1,800.00 on lower consensus for US CPI.
- Vulnerable oil prices are responsible for US CPI's downward consensus.
- The precious metal is set for a smooth ride as RSI (14) has shifted into a 60.00-80.00 range.
Gold price (XAU/USD) is displaying a volatility contraction after printing a fresh monthly high at around $1,800.00 on Tuesday. The precious metal witnessed a decent north-side move on Tuesday and later on turned sideways ahead of US Consumer Price Index (CPI). The street estimates are indicating a decent drop in the inflation rate by 40 basis points (bps) to 8.7% from the prior release. However, a surprise move by the price rise index is highly expected.
The investing community is aware of the fact that soaring oil prices remained responsible for driving the price pressures to the sky. Now, fixed supply worries and a gloomy demand outlook on the oil front resulted in a steeper fall in oil prices. And, its multiplier effect will be witnessed in the inflation rate.
Also, the upbeat US Nonfarm Payrolls (NFP) revealed last week indicates that the inflation rate could surprise on the higher side. The US economy has created 528k fresh jobs in July against the print of 372k recorded in June. Well, the troublesome job for Federal Reserve (Fed) policymakers will continue to remain until the dust settles for a longer period.
Gold technical analysis
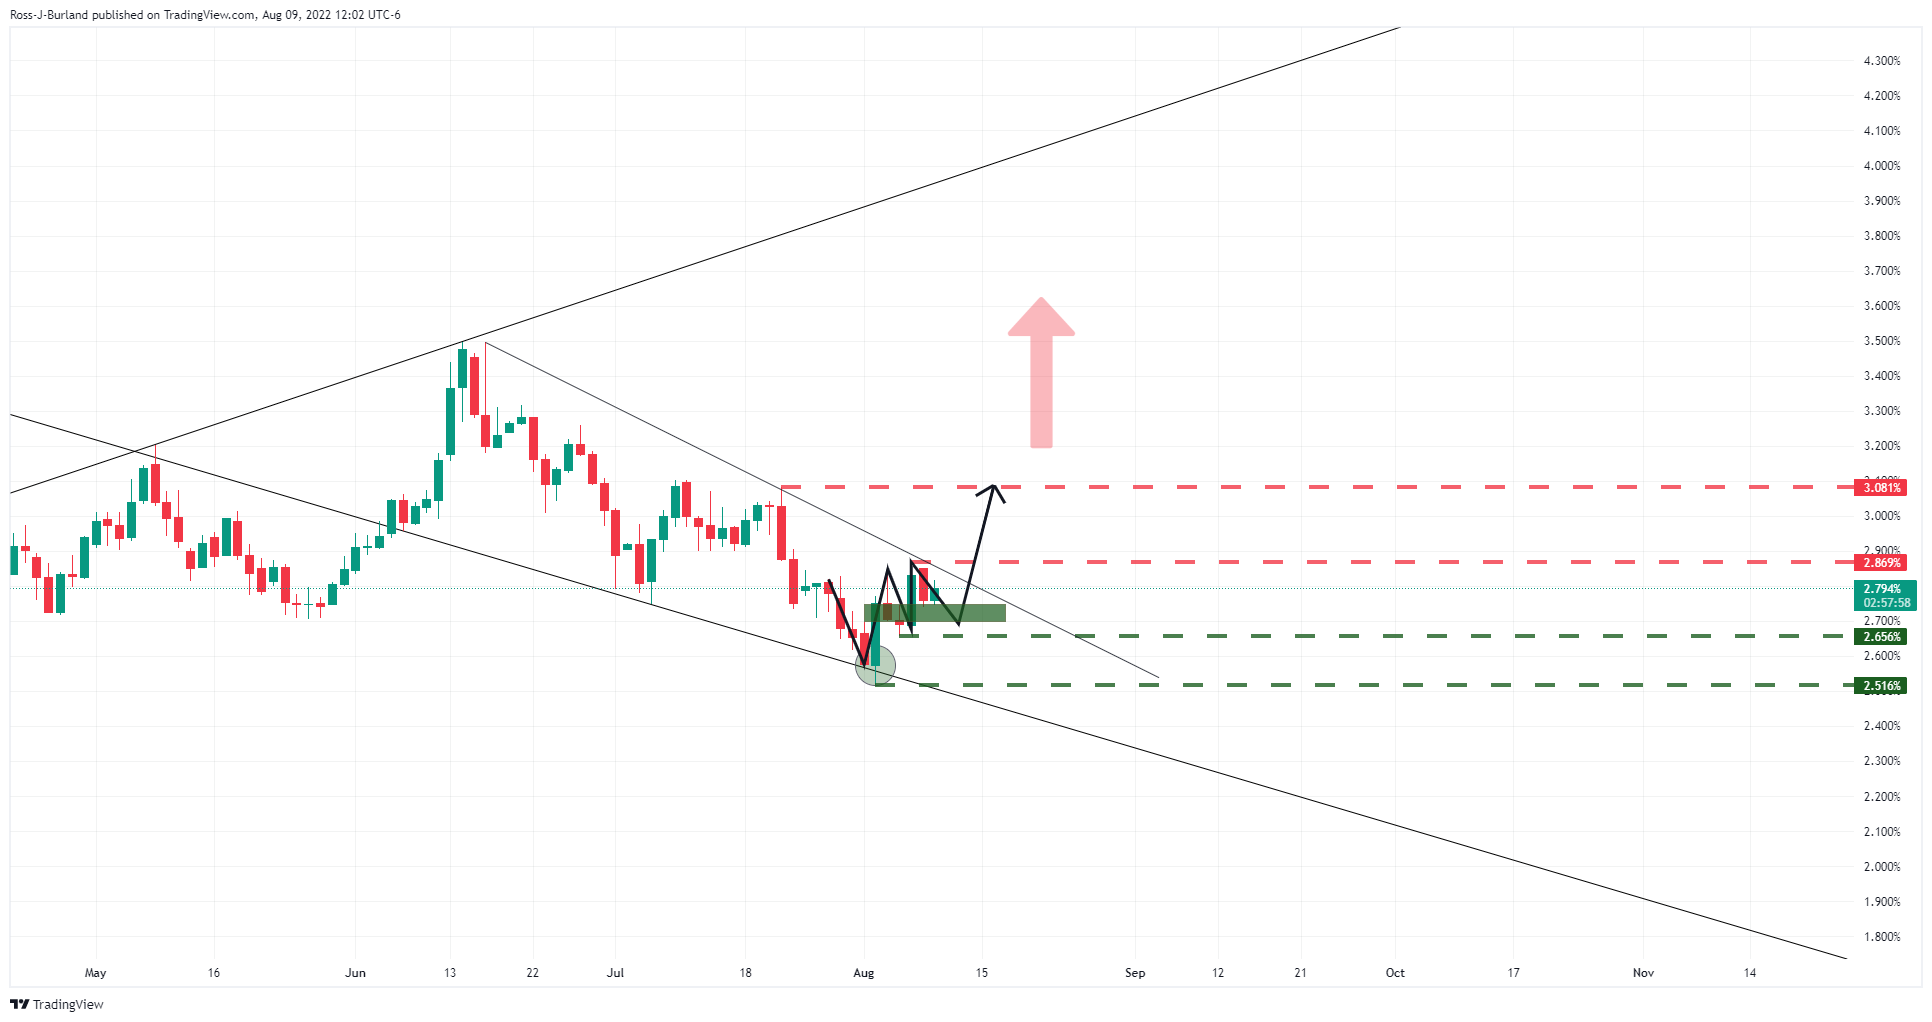
Gold prices are advancing sharply after a strong rebound from the lower portion of the Rising Channel at around $1,765.00. The upper portion of the above-mentioned chart pattern is placed from July 22 high at $1,739.37 while the lower portion is plotted from July 27 low at $1,711.55.
The 20-and 50-period Exponential Moving Averages (EMAs) at $1,785.15 and $1,772.00 respectively are scaling higher, which adds to the upside filters.
Also, the Relative Strength Index (RSI) (14) has shifted into the bullish range of 60.00-80.00, which indicates more upside ahead.
Gold four-hour chart
- The EUR/JPY daily chart illustrates the pair as neutral-to-downwards biased.
- In the short term, the EUR/JPY might test the 20-day EMA at 138.20 before tumbling to 137.00.
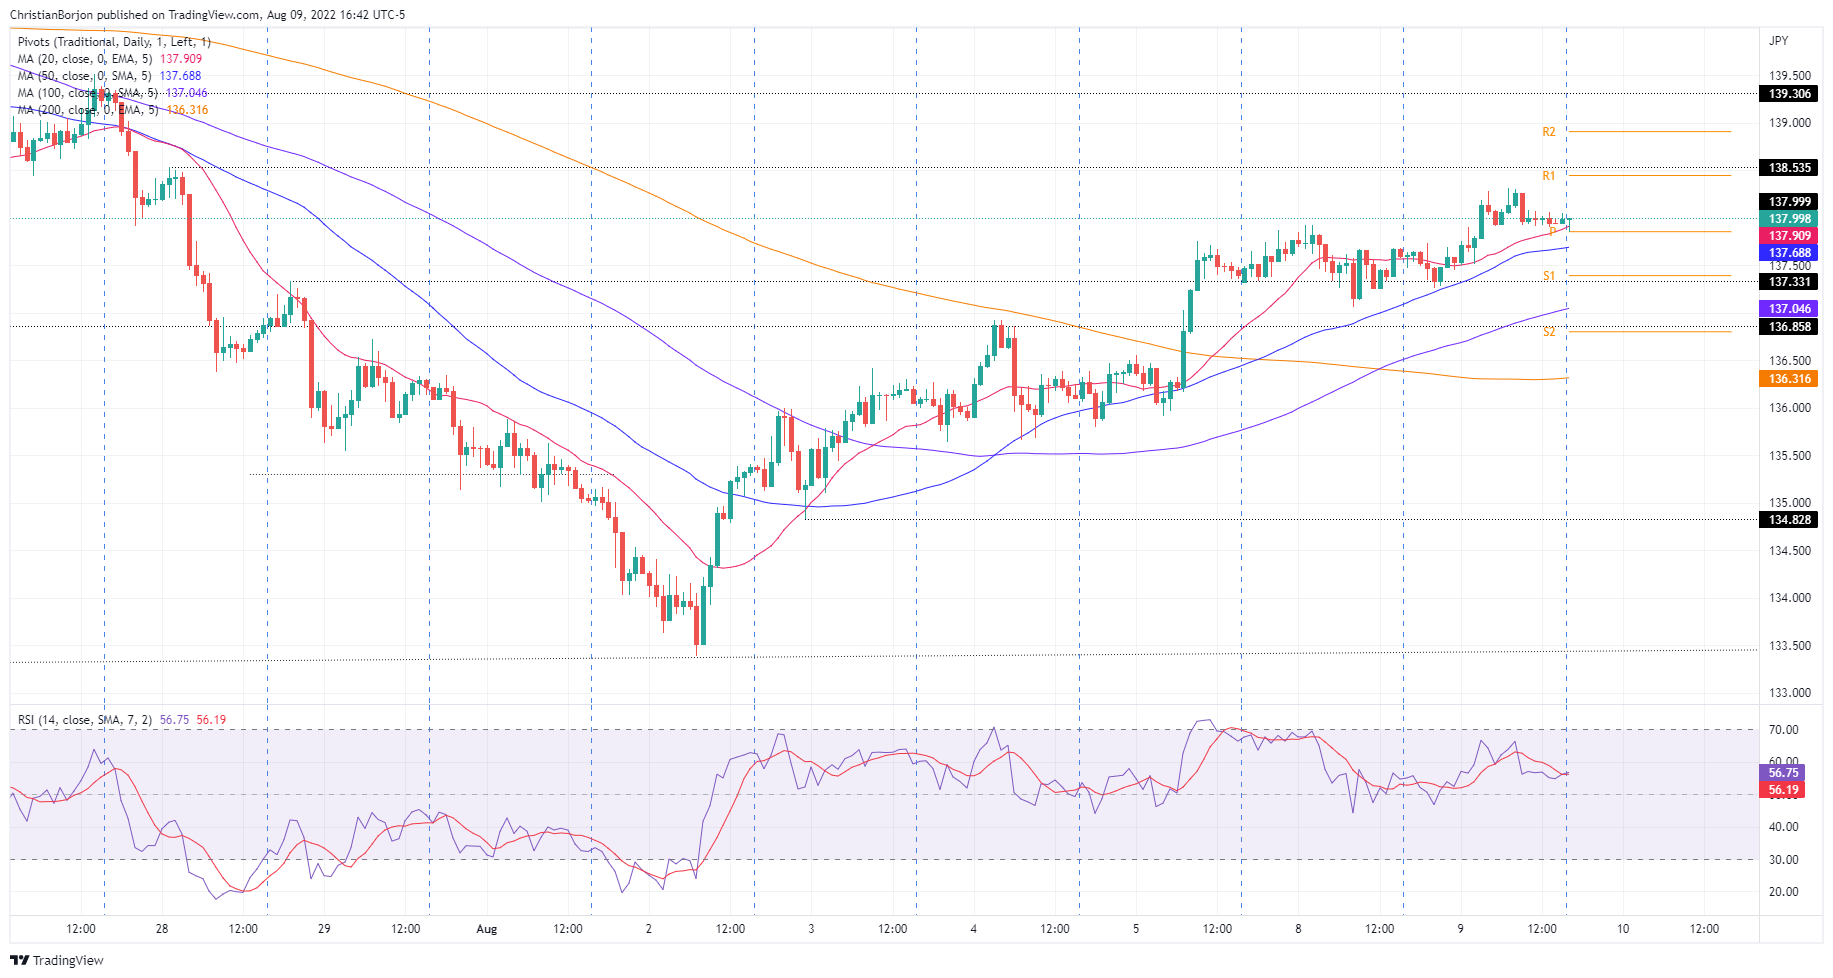
On Tuesday, the EUR/JPY finished the session with minimal gains of 0.28%. However, as the Wednesday Asian session begins, the JPY appreciates while Asian stocks are set for a lower open. At the time of writing, the EUR/JPY is trading at 137.96.
The financial markets narrative remains the same. A US company reported that its economic outlook looks worse than estimated, adding to recession fears. The US bond market shows signs of an impending recession, with the yield curve inversion between the 2s-10s year bond yields further deepening. Despite the previously mentioned factors, the euro stood tall and edged higher vs. the yen.
EUR/JPY Price Analysis: Technical outlook
From a daily chart perspective, the cross-currency is neutral-to-downward biased. A series of successively lower highs/lows confirms the latter. Meanwhile, the 20, 50, and 100-day EMAs above the exchange rate further cement the bias. Therefore, EUR/JPY traders should be aware that unless buyers reclaim the 100-day EMA at 139.84, further selling pressure is on the cards.
The 1-hour EUR/JPY chart portrays the pair advancing steadily, with the hourly Mas below the spot price, while the RSI, albeit below its 7-RSI SMA, signals that buyers are in control. Therefore, don’t discount a leg-up before the one-hour chart aligns with the daily chart’s overall bias.
Therefore, the EUR/JPY first resistance would be the 138.00 figure. A breach of the latter will send the EUR/JPY towards the August 9 high at 138.31, followed by the R2 daily pivot point at 138.92.
 EUR/JPY Hourly chart
EUR/JPY Key Technical Levels
- Bears remain below the counter-trendline resistance which leaves the focus on the downside.
- AUD/USD bears could be about to move in for a run to 0.6800.
AUD/USD bulls have so far committed but the counter trendline resistance is keeping them in check. The following illustrates the price structures on a 4-hour time frame and the prospects of a breakdown of the same for the coming sessions.
AUD/USD H4 chart
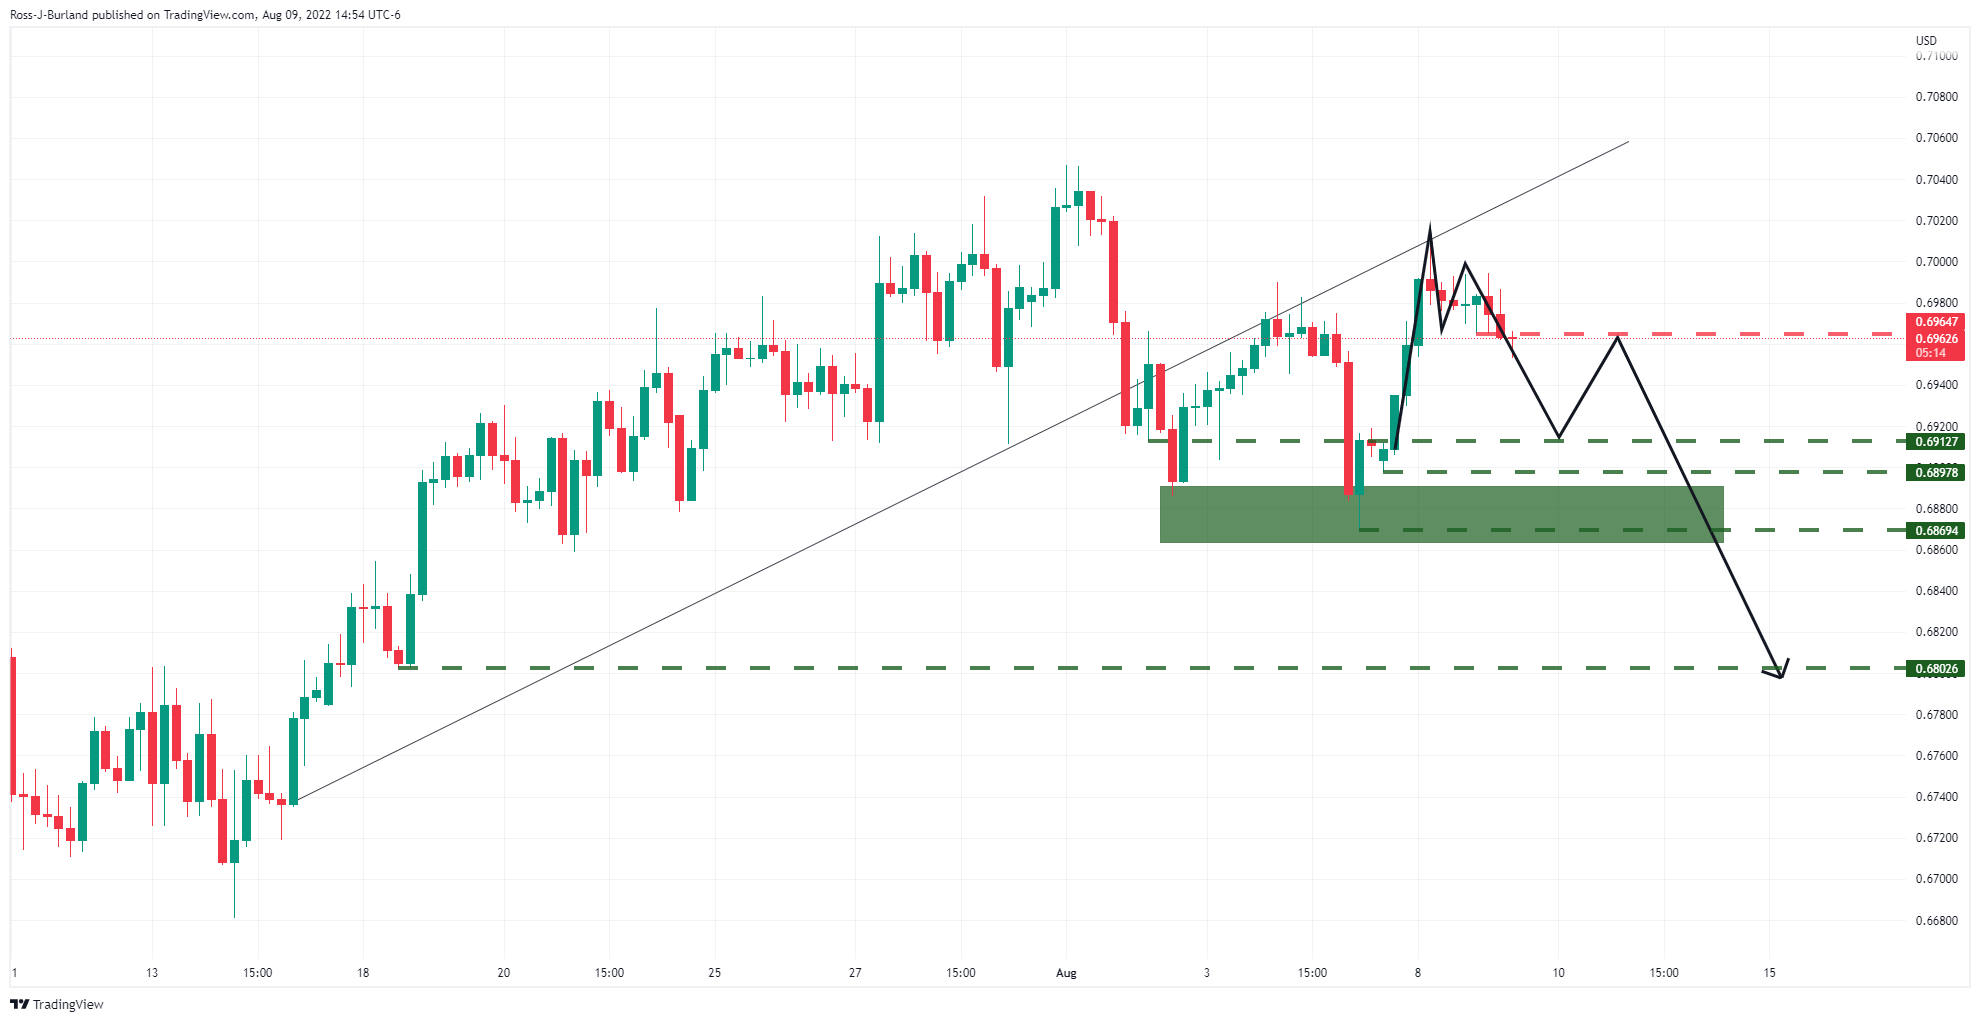
As illustrated, the price is being rejected by the counter trendline resistance and is forking the makings of an M-formation in the process. A break to the downside will open the risk of a test to 0.6920/10 which could leave the price trapped between there and the neckline of the M-pattern around 0.6965. A break of 0.6900, on the other hand, opens the risk of a continuation of the bearish breakout towards 0.68 the figure for the days ahead.
The Federal Reserve will be prepared to hold interest rates "higher for longer" should inflation continue to surprise to the upside, and market pricing will need to adjust accordingly, Fed's St. Louis president James Bullard said on Tuesday who wants rates at 4% by the end of the year.
US CPI in focus
Meanwhile, investors will be fixated on the US inflation data coming out in the \us session later today. Prices likely rose by a level that will prompt further interest rate hikes from the Federal Reserve. Combined with last week's NFP report, the Fed is expected to hike interest rates by another 75 basis points at the next Fed meeting in September.
''While a slowing headline reading could lead some investors to believe the Fed can stop hiking, we expect the Fed to take rates to 3.75% by December,'' analysts at TD Securities argued, given that the consensus is that CPI will have risen less in July by comparison to what June's reading showed, 9.1% vs. 8.8% expected whereas tomorrow's data is expected to come below 9%.
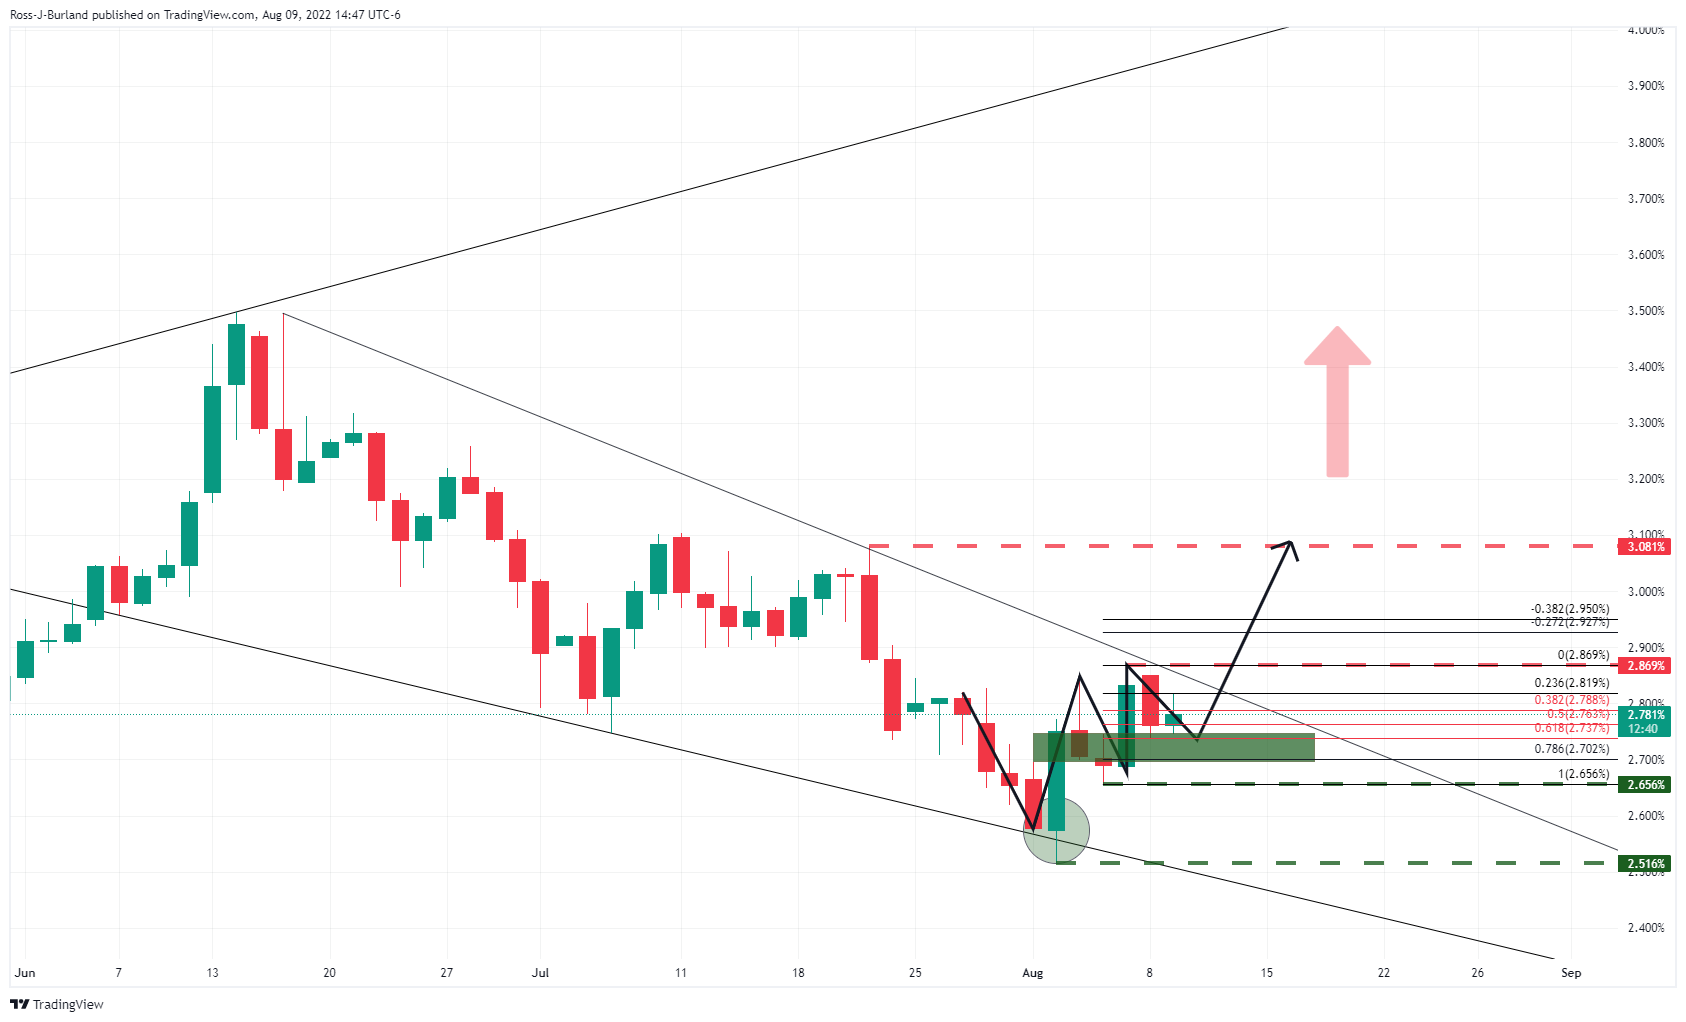
The US 10-year yield, illustrated on the daily chart above, has corrected towards the neckline of the W-formation on the daily chart within the lower boundary of the broadening formation.
In turn, should the price hold above the flagged levels on the chart above, then a break of the trendline resistance could result in a rally in yields
- NZD/USD sits tight in a range ahead of today's key US CPI data.
- 0.6350 is key to the upside while the bears need to get below 0.6190.
NZD/USD is flat on the day, trapped between a familiar support and resistance range on the daily chart as markets await in anticipation of the next major catalyst being the US inflation data. Ahead of the forex roll-over, NZD/USD is trading at 0.6280 and has stuck to a 0.6270 and 0.6302 range so far.
''The Kiwi starts the day a tad softer amid a lukewarm rebound in the USD DXY, with slightly higher US bond yields denting risk appetite across many bellwether markets,'' analysts at ANZ bank said in the early Asian open note on Wednesday.
US CPI data will be key
''US unit labour cost data doesn’t usually rate much of a mention, but such was the upside surprise (up 2.6% q/q to be up 9.5% YoY) that it put a bit more inflation fear into US short-end bonds, with the 2-year bond yield back above Friday’s post-job data levels. But the next 24 hours will be all about US Consumer Price Index.''
''It’ll be bad in level terms, we know that, so it’s a case of how bad, and whether there are signs of persistence (elevated monthly core measures) or signs of moderation (excluding fuel, which we know softened). It all speaks to a period of potentially higher volatility after what has been a period of relative calm.''
prices likely rose by a level that will prompt further interest rate hikes from the Federal Reserve. Combined with last week's NFP report, the Fed is expected to hike interest rates by another 75 basis points at the next Fed meeting in September.
''While a slowing headline reading could lead some investors to believe the Fed can stop hiking, we expect the Fed to take rates to 3.75% by December,'' analysts at TD Securities argued, given that the consensus is that CPI will have risen less in July by comparison to what June's reading showed, 9.1% vs. 8.8% expected whereas tomorrow's data is expected to come below 9%.
-637956636349656826.png)
Historical data chart
'The market needs to decide whether the slowing headline is more important than the sticky and strong core,'' analysts at TD Securities said. ''The USD remains sensitive to US data surprises. ''We will be short-term focused on whether this number shakes resilient risk sentiment, as that will also help inform near-term USD price action.''
NZD/USD technical analysis
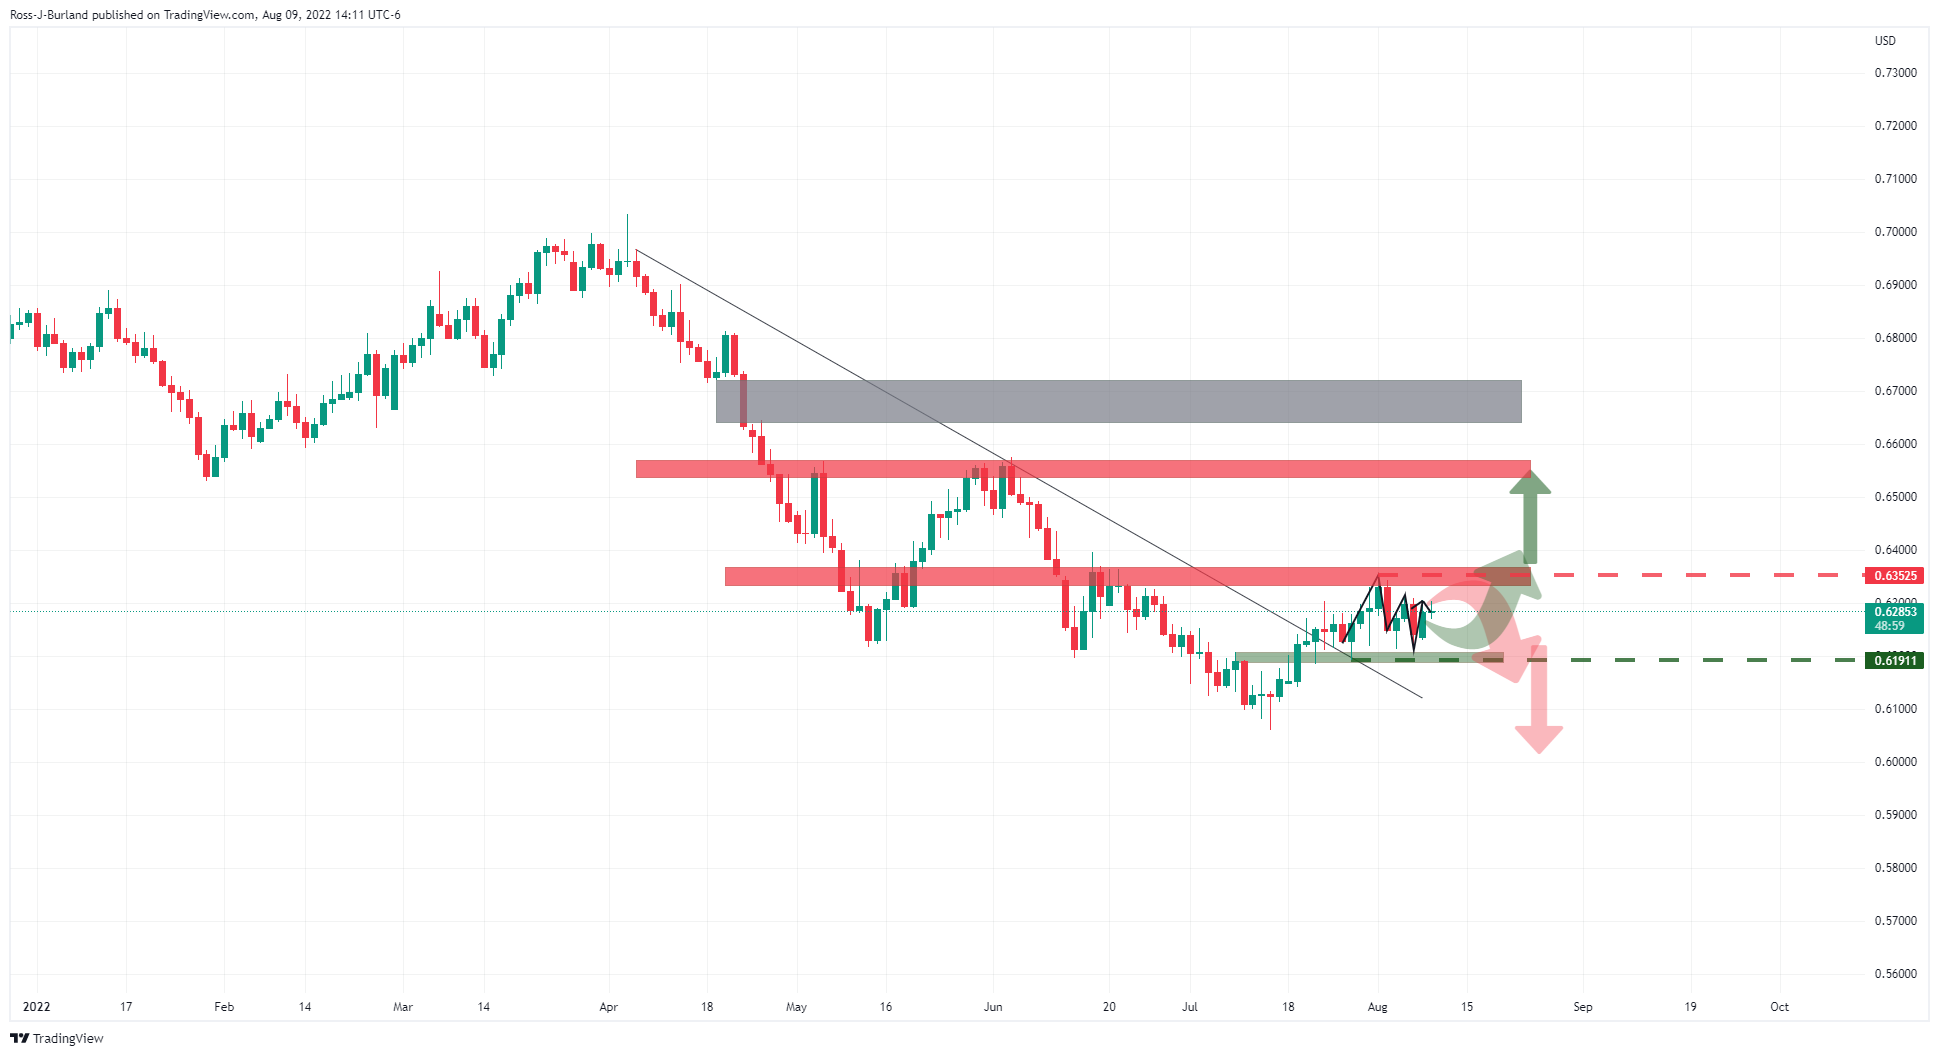
NZD/YSD remains stuck between key resistance and support on the daily chart and has not managed to break the seal of 0.63 the figure so far this week.
0.6350 is key to the upside while the bears need to get below 0.6190. On a break higher, here is an area of price imbalance that could well be targetted once 0.6550 resistance is overcome. That area is between 0.6645 and 0.6720.
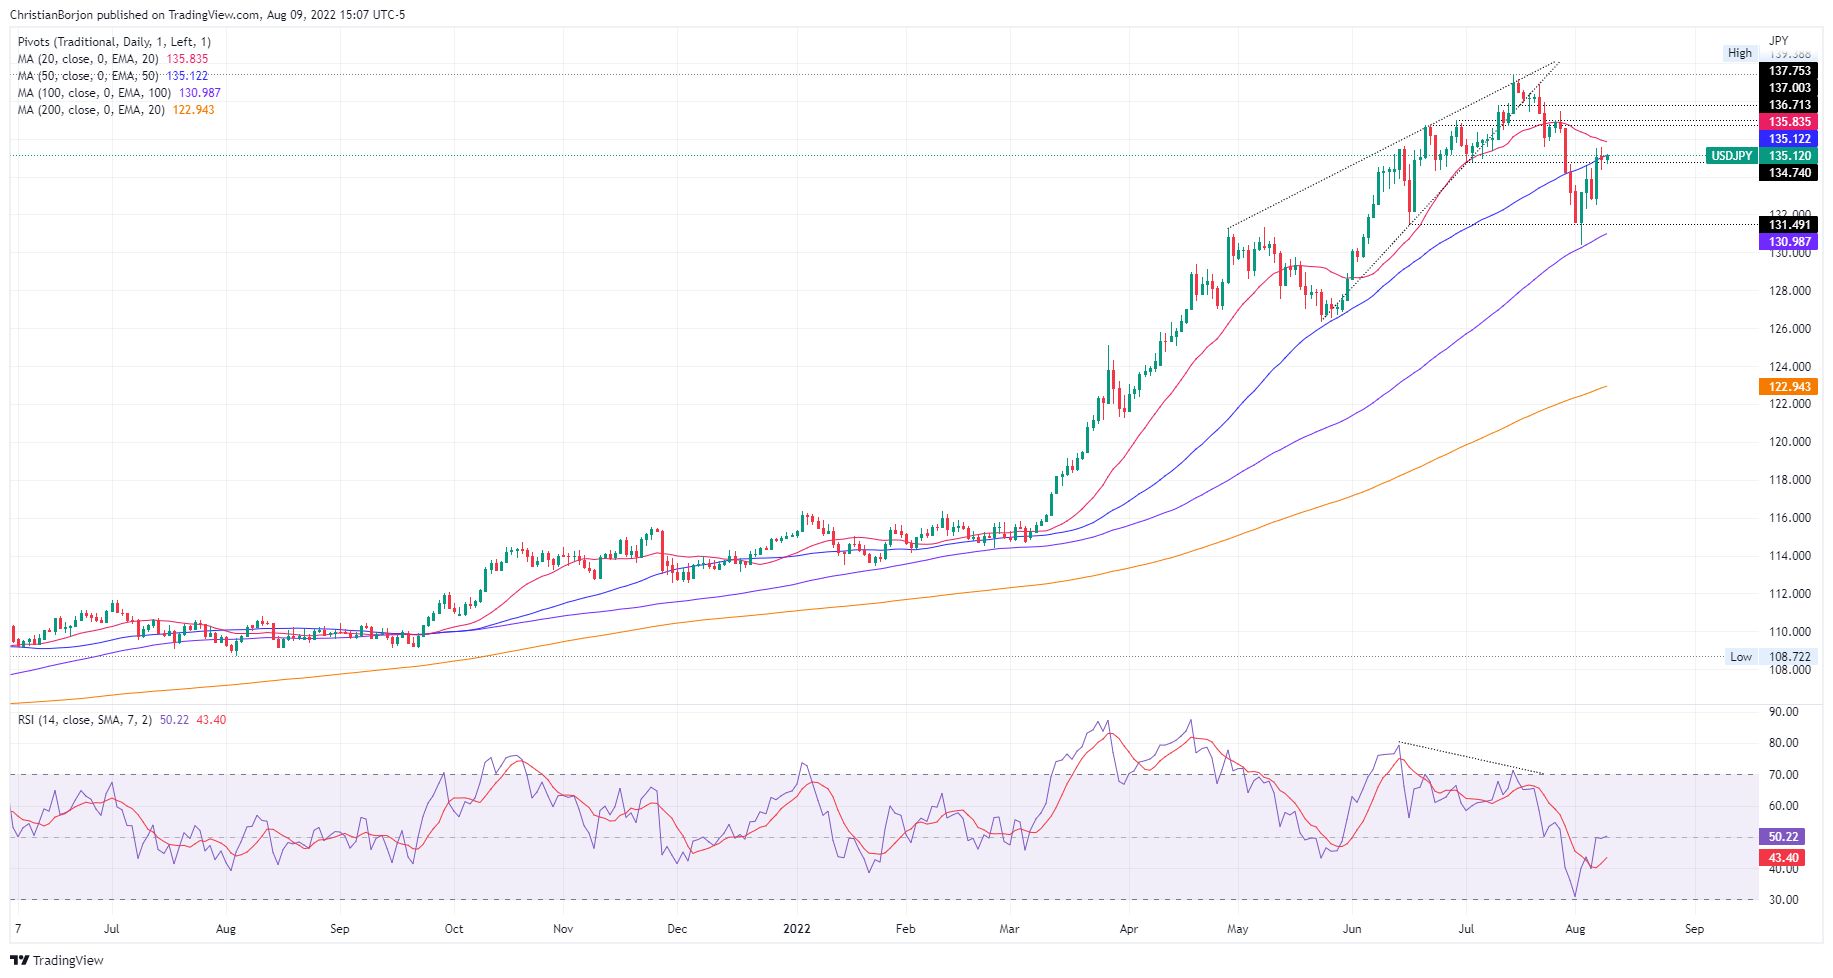
- Long-term, the USD/JPY is neutral-to-upward biased, facing solid resistance at 135.50.
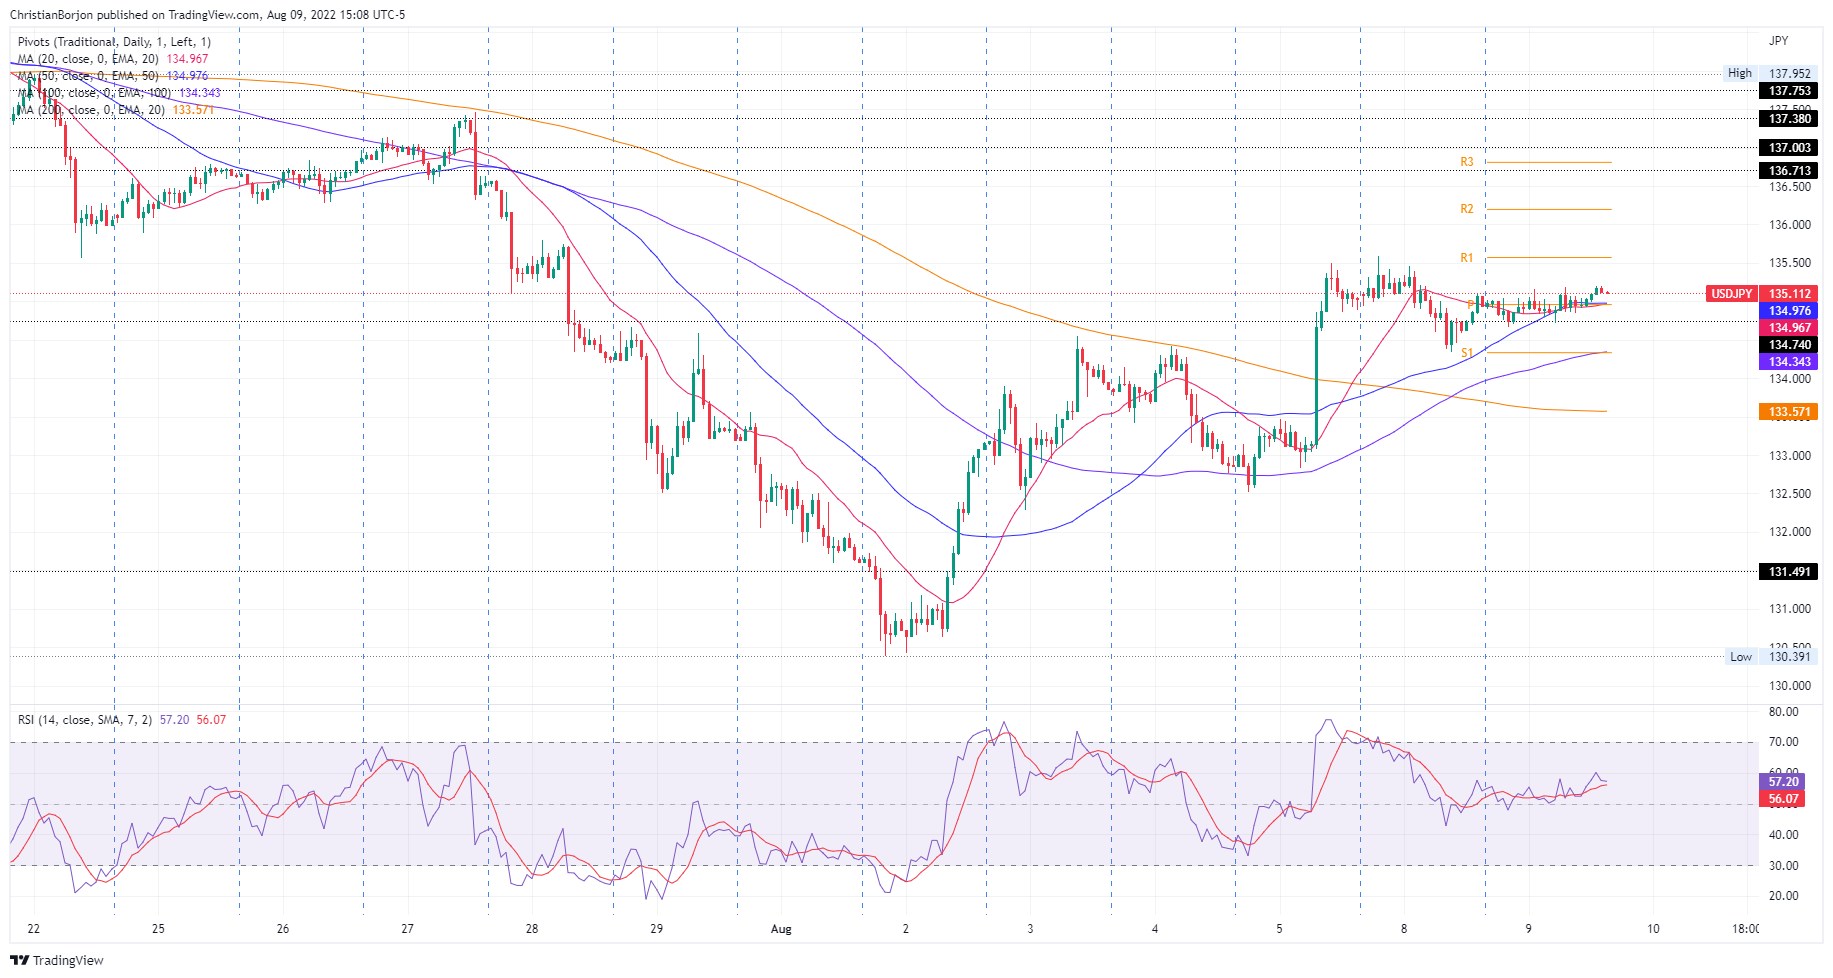
- The USD/JPY hourly chart portrays a 40 pip narrow trading range ahead of Wednesday’s US CPI report.
The USD/JPY is almost flat amidst a calmed North American session ahead of July’s US inflation report, which could shed light on further Federal Reserve tightening in the September meeting. At the time of writing, the USD/JPY is trading at 135.12, slightly up 0.14%.
USD/JPY Price Analysis: Technical outlook
The USD/JPY daily chart portrays the pair as neutral-to-upward biased. In the last couple of days, the pair’s price action faced solid resistance around the 135.50 area, putting a lid on the USD/JPY, while the Relative Strength Index (RSI) at 50.32 sideways illustrates the consolidation in the pair.
If the USD/JPY breaks above 135.50, the next resistance would be the 20-day EMA at 135.83. Once cleared, the next resistance would be the July 28 high at 136.57, followed by 137.00. On the flip side, the USD/JPY first support would be the 50-day EMA at 135.12. Break below will expose the 135.00 figure, followed by the August 5 daily low at 132.52.
 USD/JPY Daily chart
From a near-term perspective, the one-hour USD/JPY chart illustrates Tuesday’s price action’s narrow 40 pip range. The 20 and 50-hour EMAs around the 134.95-97 area cement the previously mentioned, signaling that USD/JPY traders remain at bay, waiting for fresh US economic data, namely inflation. Therefore, a break above/below that range would determine the faith of the major.
Upwards, the USD/JPY’s first resistance would be the 135.50 mark. A breach of the latter will expose the July 27 daily high at 136.58, followed by 137.00. Downwards, the USD/JPY’s first support will be the August 8 daily low at 134.75. Once cleared, the next support will be the 200-hour EMA at 133.57.
 USD/JPY Hourly chart
USD/JPY Key Technical Levels
What you need to take care of on Wednesday, August 10:
The American currency extended its weekly decline throughout the first half of the day but managed to recover some ground during the US session. Nevertheless, volatility across financial markets was limited amid lingering US inflation figures.
Market players await the US Consumer Price Index, hoping prices pressure have started receding in July. Still, the core annual reading is foreseen advancing to 6.1% from the current 5.9% level. At the end of the day, speculative interest will rush to price in whatever they believe the Federal Reserve will do with the monetary policy. China and Germany will also publish inflation data ahead of the US figures.
The EUR/USD pair flirted with the 1.0250 level but shed some 50 pips ahead of the close. The shared currency was weighed by headlines indicating that Russia reportedly suspended oil flows via the southern leg of the Druzhba pipeline, amid transit payment issues.
The energy crisis affecting Europe has led to the UK government planning potential organised energy blackouts this winter for industry and households as a worst-case scenario. GBP/USD eased and trades at around 1.2060 ahead of the Asian opening.
Commodity-linked currencies turned red against the greenback by the end of the day, although losses are limited. AUD/USD trades around 0.6950 while USD/CAD hovers around 1.2890.
Gold was among the best performers, hitting an intraday high of $1,800.49 a troy ounce. It finished the day at $1,795. Crude oil prices were up at the beginning of the day but finished the day with modest gains. WTI trades at $90.70 a barrel.
Wall Street edged lower, following the lead of its European counterparts, although losses were moderated. US Treasury yields, on the other hand, ticked higher with that on the 10-year note, currently at 2.79%.
Ethereum Price Prediction: Get ready for a Wall Street discount
Like this article? Help us with some feedback by answering this survey:
- WTI is correcting the day's supply and is meeting daily resistance.
- US CPI data will come on Wednesday and could be pivotal for oil.
- The wild card in the energy sector is the Iran Nuclear Deal.
Oil prices have pared back gains that were made early on Tuesday despite the news that Russia has halted exports on a pipeline to Europe. Markets lack a directional bias ahead of tomorrow's US inflation report due to mixed sentiment surrounding the health of the global economy. At the time of writing, WTI spot is trading at $90.43bbls and has been stuck in a relatively narrow range of between $89.06 and $92.62.
Oil was initially benefitting from supply concerns. The news that Russia halted oil shipments on the southern leg Druzhba pipeline on Aug.4 lifted prices. cutting 250,000 barrels per day of oil supply to Czechia, Hungary and Slovakia were reported to be taken offline after sanctions prevented transit payments, as Bloomberg reported. The suspension of Russian shipments on the line has been regarded as the country's weaponization of energy exports to the continent in retaliation for the coming European embargo on some oil shipments from Russia.
Meanwhile, traders are going to be glued to the screens for the US Consumer Price Index data on Wednesday as they assess the prospects of a recession in the United States and the wider global economy. Analysts are looking for inflation to have risen less than it had done in July, at around 8.7% or lower on an annualized basis. Nevertheless, such a number would be expected to shore up expectations for the Federal Reserve to hike by 75 basis points next month.
Nevertheless, recessions or not, the Energy Information Administration on Tuesday said it expects US oil production to rise to a record next year while expecting a rise in global oil demand next year. The agency said it expects US oil production to rise to an average 12.7-million barrels per day in 2023, down from its July forecast of 12.77-milion bpd but up from 11.9-million bpd this year and topping the record 12.4-million bpd set in 2019.
The great uncertainty in the energy sector comes with the Iranian Nuclear Deal. Analysts at TD Securities explained that ''the bull market in oil is facing its most significant challenge yet, as negotiators are putting together a final draft for a potential Iranian Nuclear deal agreement in front of Washington and Tehran.
''This is a wildcard for oil markets, given that a resumption of Iranian flows would add a substantial amount of spare capacity to the world, effectively buying some time for other producers to potential catch-up in terms of capital expenditures over the medium-term.''
''In this context, our return decomposition framework highlights that our gauge of supply risk has tumbled in the last week amid the latest round of negotiations. This pins the weakness in oil prices primarily on the supply side amidst fears that a potential deal could change the game in oil markets.''
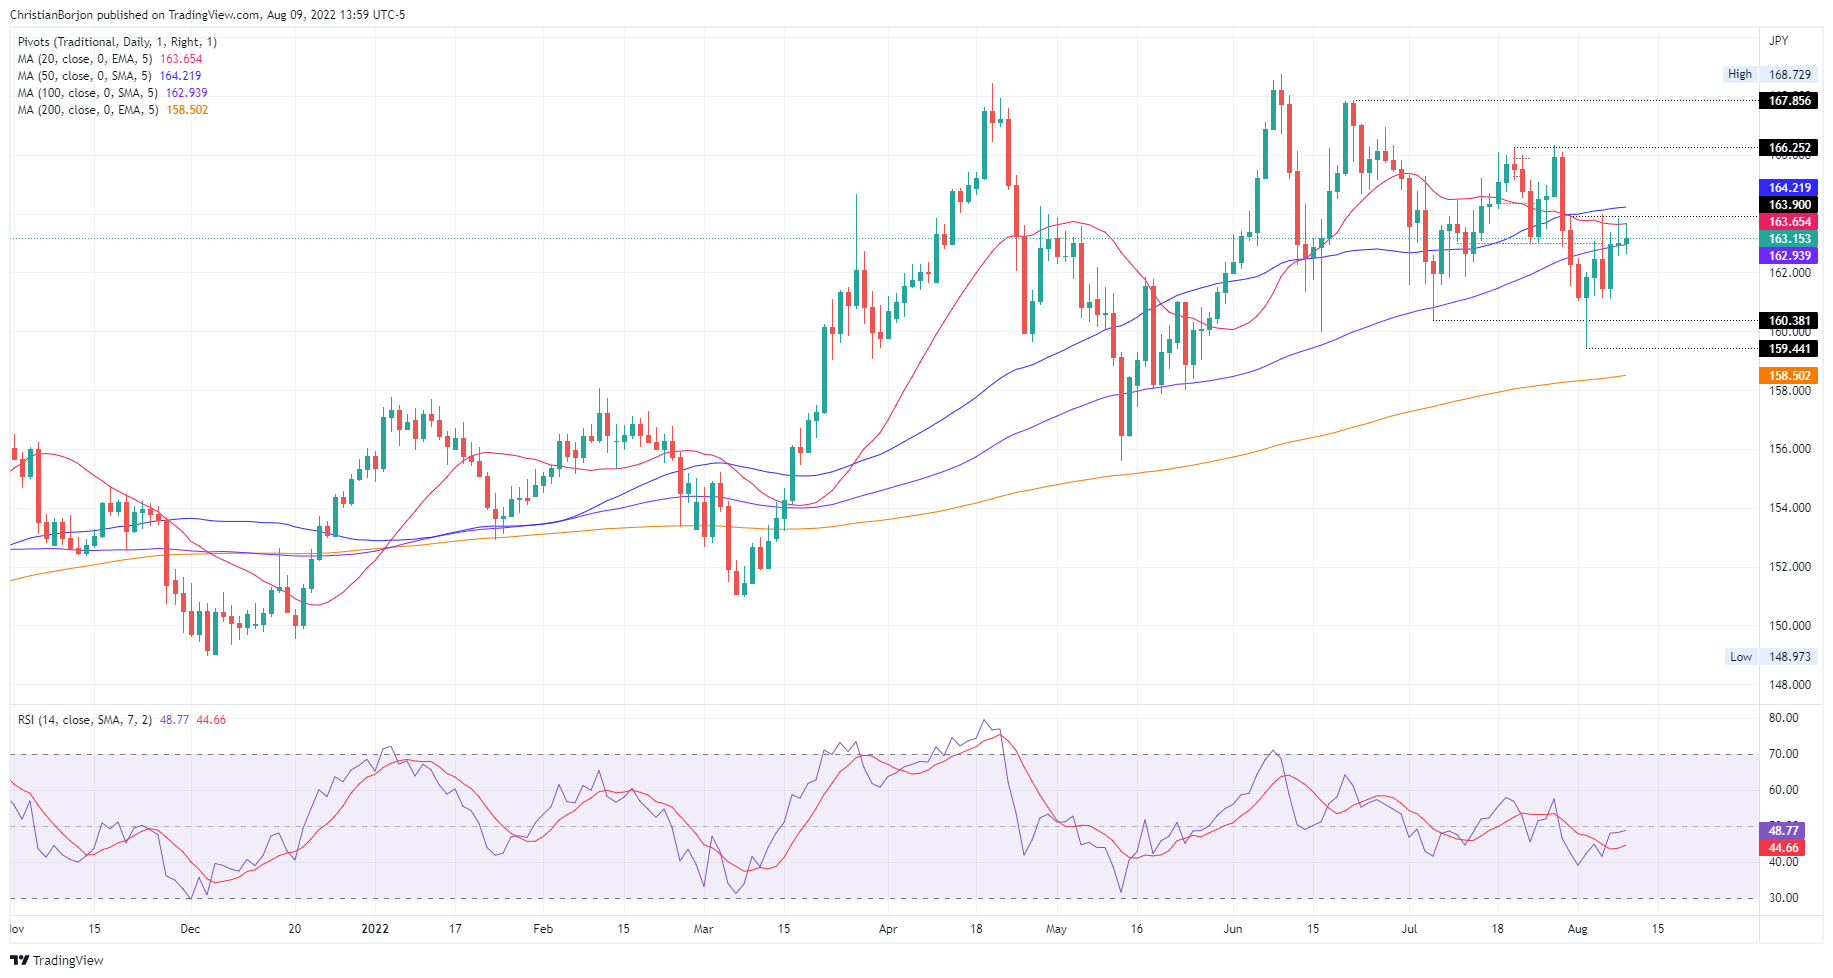
- GBP/JPY exchanges hands around familiar levels, above 163.00.
- From a long-term perspective, the cross is neutrally biased, waiting for a catalyst.
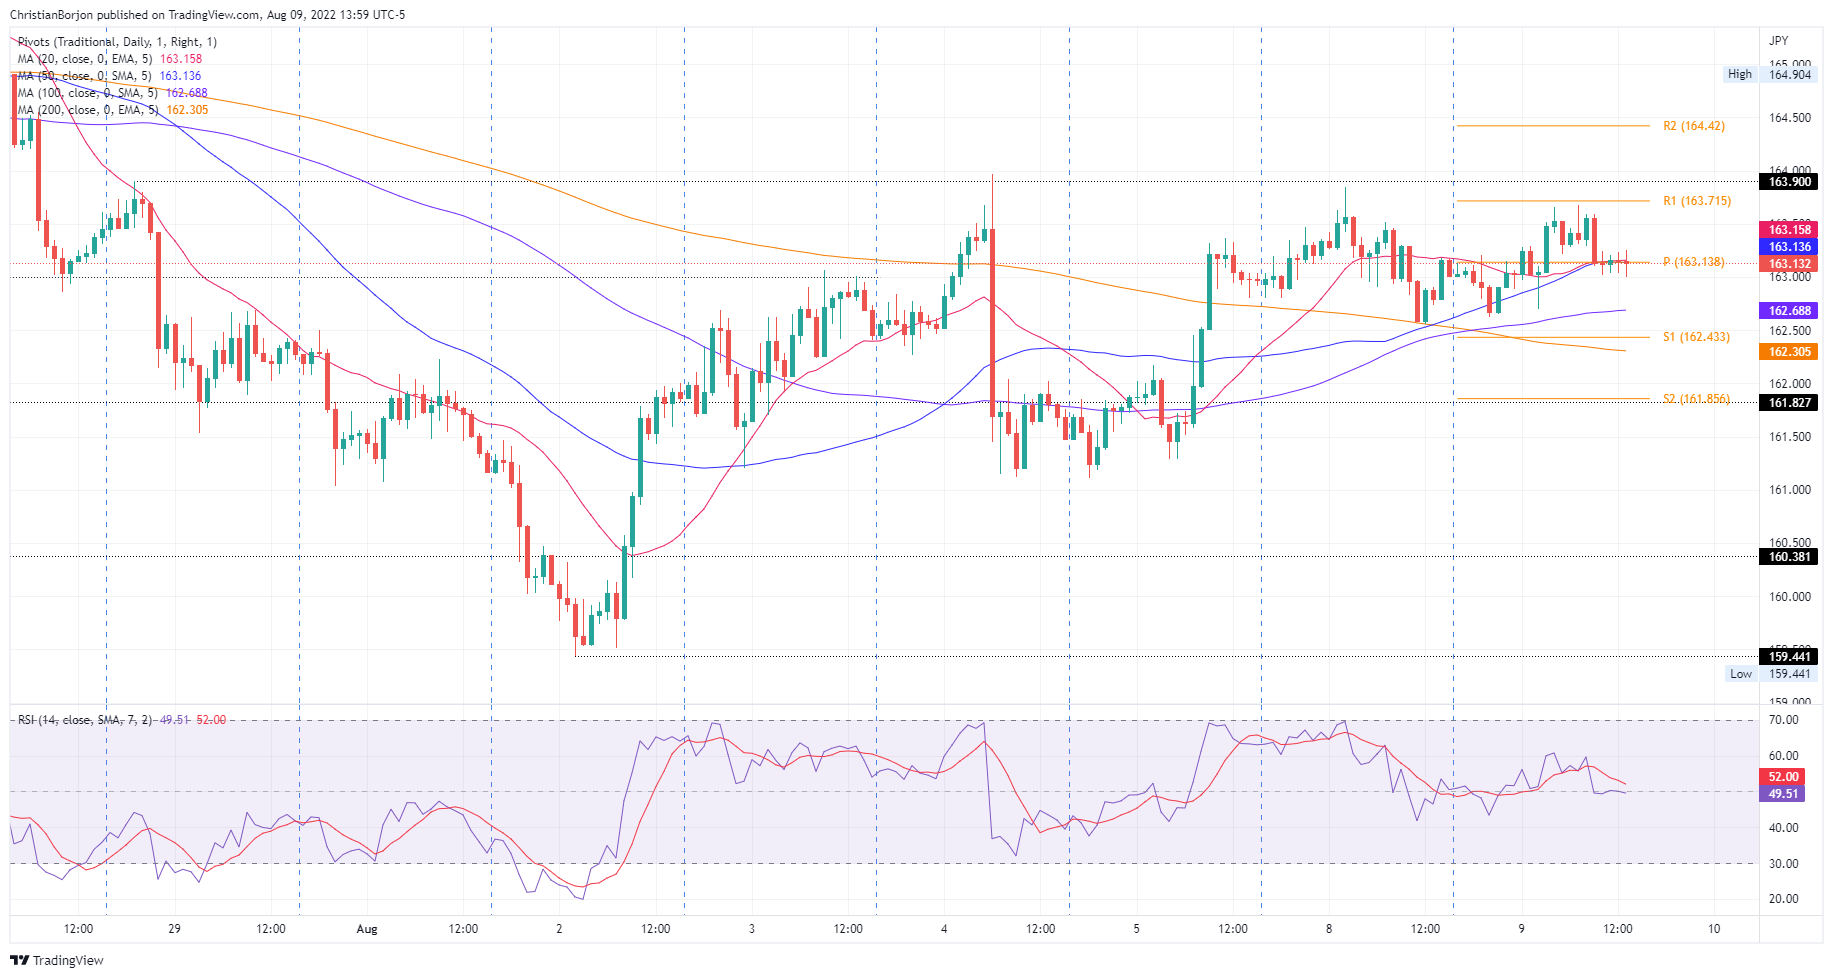
- The GBP/JPY hourly chart is neutral-biased but tilted downwards as sellers gather momentum, as shown by the RSI.
The GBP/JPY seesaws during the North American session amidst a dull trading day. Investors are bracing for the release of US inflation data, which would be scrutinized by them, aiming to predict the next move of the FOMC in the September meeting. At the time of writing, the GBP/JPY is trading at 163.15.
The market sentiment is downbeat. US equities are trading with losses, while in the FX space, safe-haven peers begin to recover some ground, except for the US dollar. The GBP/JPY is trading near its opening price, after bouncing from daily lows at 162.62, before hitting the daily high at 163.67. However, risk aversion weighed on the pound, so the cross dived.
GBP/JPY Price Analysis: Technical outlook
From a daily chart perspective, the GBP/JPY is neutral-biased. For the second straight day, buyers’ inability to breach the 20-day EMA at 136.64 increased selling pressure in the cross, with bears piling around the 163.60 area, pushing the exchange rate towards the 163.00 figure.
Hence, the GBP/JPY’s first support would be the August 8 low at 162.56. The break below will expose the August 5 low at 161.11, followed by the August 2 swing low at 159.44. Otherwise, if buyers reclaim the 20-day EMA at 163.64, that would open the door for a test of the 50-day EMA at 164.21.
 GBP/JPY Daily chart
In the one-hour scale, the GBP/JPY is neutral biased, trapped within the 161.11-163.84 area. However, the Relative Strength Index (RSI) shows that sellers are gathering momentum, with the RSI at 47.26 and crossing below the 7-RSI SMA, meaning that bears are in control. Therefore, the GBP/JPY first support would be the 100-hour EMA at 162.68. Once cleared, the next support would be the S2 pivot point at 162.43, followed by the S1 daily pivot at 161.85. On the flip side, a break above 163.84 could send the pair towards the August 4 high at 163.97, which, once cleared, could open the door for further gains
 GBP/JPY Hourly chart
GBP/JPY Key Technical Levels
- Gold could depend on the outcome of Wednesday's US CPI data.
- The current price is a few bucks shy of the golden ratio, 61.8% level.
- If CPI were to disappoint, then a subsequent break of $1,815 would be significant.
The gold price is higher on Tuesday by some 0.35% at the time of writing in the afternoon of the New York session. Gold is trading at $1,795.55, just below the highs of the day. Gold has moved higher from a low of $1,783.31 and reached the psychological $1,800 mark at the start of Wall Street.
Gold is firm due to a softer US dollar at the start of the week. The greenback, as measured by the DXY index fell to a low of 105.97, reversing all of the gains made on the blockbuster Nonfarm Payrolls report when it rallied to a high of 106.93.
Additionally, gold is enjoying some relief in lower US yields. Waining yields are bullish for gold since it offers no interest. The US 10-year note made a fresh corrective low of 2.746% on Tuesday but they have since recovered to a high of 2.816%. Nevertheless, yields are way off their 52-week range high of 3.497% printed in mid-June 2022.
US CPI data will be key
Markets are fixated on the US inflation data coming on Wednesday where prices likely rose by a level that will prompt further interest rate hikes from the Federal Reserve. Combined with last week's NFP report, the Fed is expected to hike interest rates by another 75 basis points at the next Fed meeting in September.
''While a slowing headline reading could lead some investors to believe the Fed can stop hiking, we expect the Fed to take rates to 3.75% by December,'' analysts at TD Securities argued, given that the consensus is that CPI will have risen less in July by comparison to what June's reading showed, 9.1% vs. 8.8% expected whereas tomorrow's data is expected to come below 9%.
-637956636349656826.png)
Historical data chart
''The market needs to decide whether the slowing headline is more important than the sticky and strong core,'' analysts at TD Securities said. ''The USD remains sensitive to US data surprises. ''We will be short-term focused on whether this number shakes resilient risk sentiment, as that will also help inform near-term USD price action.''
Consequently, for gold, the data will be a driver. A stronger-than-expected reading could be the catalyst for a final shake-out of stubborn and stale shorts within the volatility ahead of the next significant move to the downside. On the other hand, if the US dollar were to sell off on a lower reading, then a deeper bullish correcting in gold prices would be expected.
Analysts at TD Securities note that gold prices are ''flirting with the threshold for CTA short covering, but have thus far failed to sustainably break through key trigger levels associated with a significant buying program, which could point to informed participants on the offer.''
''Meanwhile, prop traders are still holding a massive amount of complacent length, suggesting we have yet to see capitulation in gold, which argues that the pain trade remains to the downside.''
Gold technical analysis
As per this week's pre-market open analysis Gold, Chart of the Week: The bulls are up against strong headwinds, and yesterday's New York session commentary, Gold Price Forecast: XAU/USD bulls stay the course but bears are lurking, the weekly gold chart and the daily 10-year yields remain as compelling features in the overall picture for gold.
The yield has corrected towards the neckline of the W-formation on the daily chart within the lower boundary of the broadening formation.
In turn, should the price hold above the flagged levels on the chart above, then a break of the trendline resistance could result in a rally in yields, a weight for gold prices.
On the other hand, the weekly chart's correction is yet to reach a 61.8% golden ratio as follows:
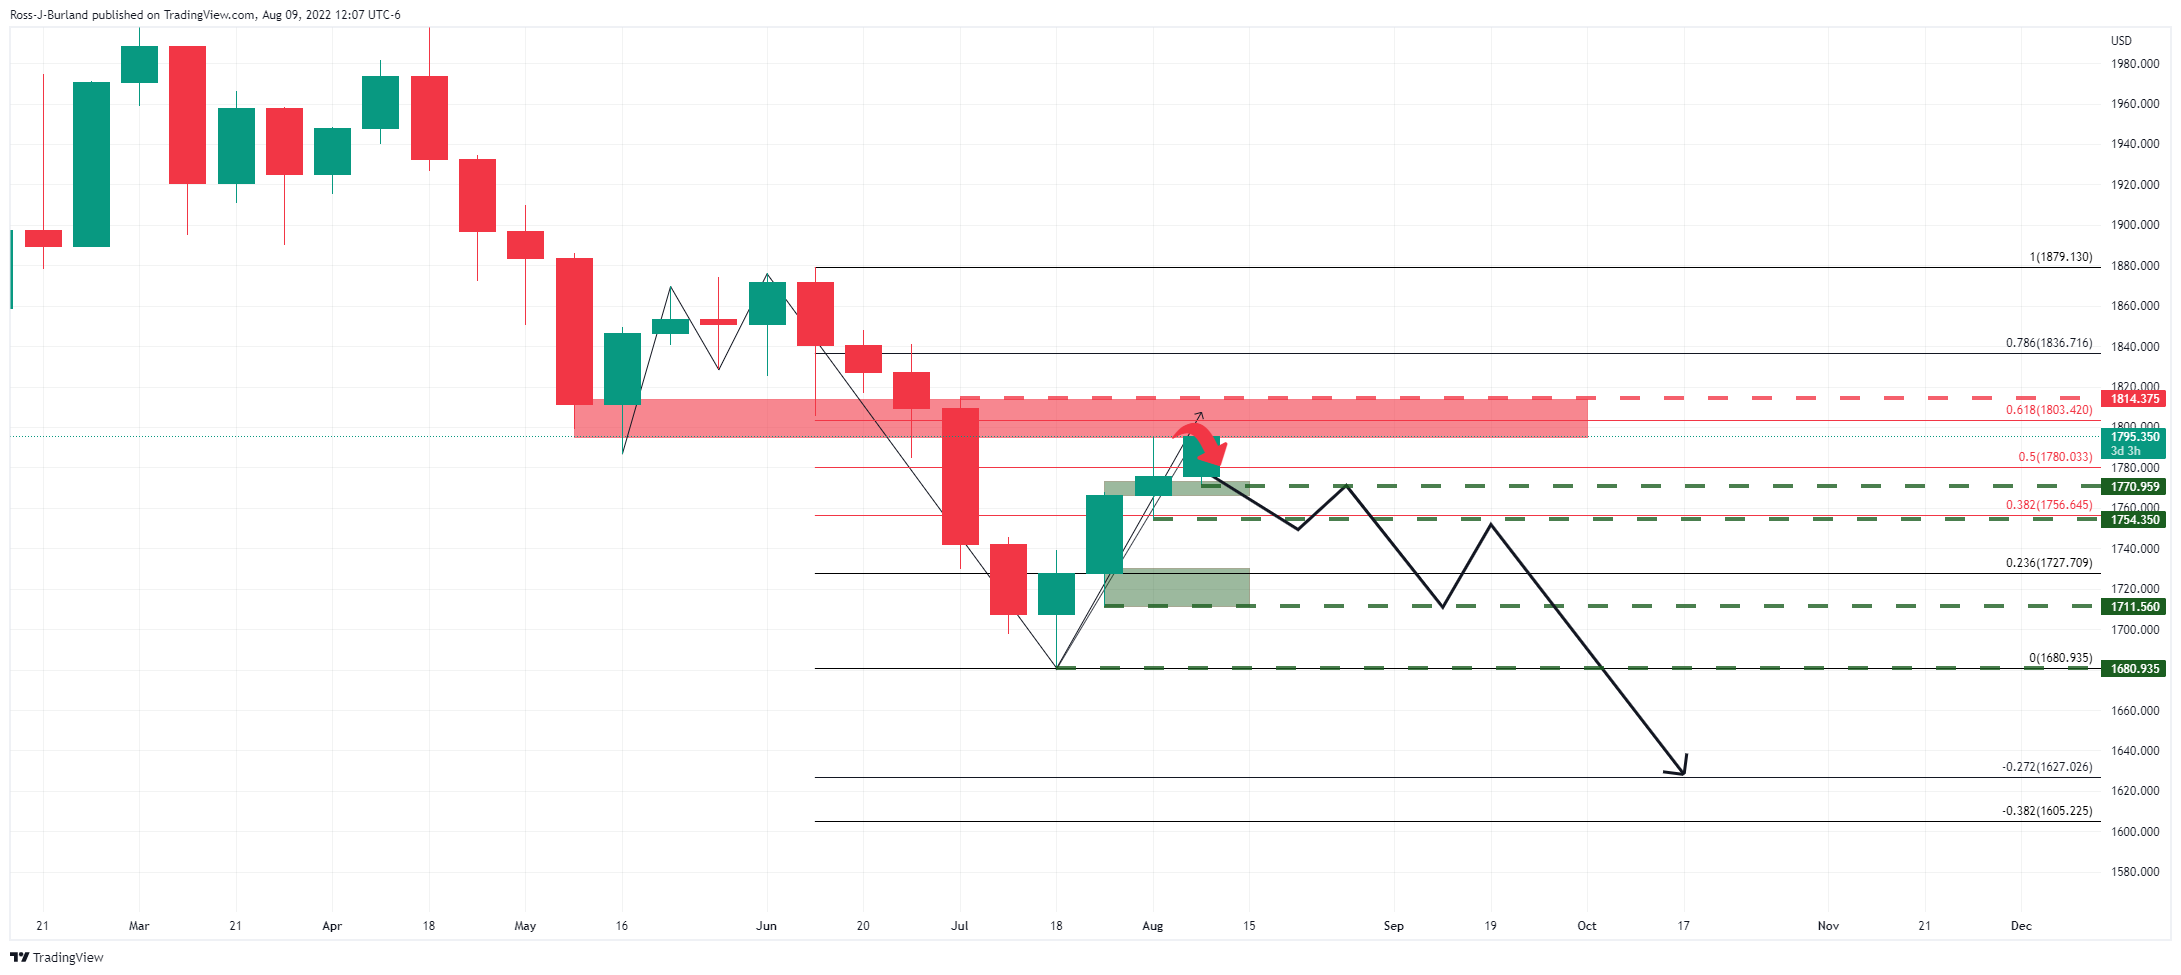
The current price is a few bucks shy of the level, but should the data reconfirm the sentiment in the market, then gold would be expected to come under pressure as illustrated in the weekly chart above.
If the price were to move higher, however, then a break of $1,815 would be significant and likely lead to a deeper correction of the weekly bearish impulse with the 78.6% Fibonacci eyed near $1,836 that has a confluence with the neckline resistance of the M-formation.
- Despite a dismal market mood, EUR/USD edges higher in a choppy trading session.
- US, Germany, and Italy’s inflation data are eyed on Wednesday.
- EUR/USD Price Analysis: Range-bound, but US economic data might rock the boat.
The shared currency advances during the New York session, taking advantage of a soft US dollar, which is falling despite US bond yields rising, ahead of the release of July’s US inflation figures. Alongside the aforementioned, risk-aversion keeps safe-haven peers in the driver’s seat, except for the greenbacks vs. the euro.
EUR/USD unable to capitalize on overall greenback weakness
The EUR/USD is trading at 1.0216, above its opening price but below its daily high, reached during the day at 1.0247. Nevertheless, buyers could not hold the fort or booked profits with US economic data looming.
US equities are trading with minimal losses. A light US calendar keeps investors reassessing last week’s US jobs report, with the US Nonfarm payrolls doubling expectations, increasing by 528K. Nevertheless, traders’ focus has shifted towards the Consumer Price Index (CPI). Estimations of headline inflation lie at 8.7% YoY, less than June’s 9%, while core-CPI, which excludes food and energy, is expected to rise by 6.1% YoY, vs. 6.2% in last month’s reading.
Across the pond, headlines that Russia’s halted oil pumping through the Druzbha pipeline since Thursday added to an already negative mood, weighing on the EUR/USD. The Russian oil company Transneft blamed problems with payment to UkrTransNafta, the operator of the Ukrainian side.
What to watch
The EU economic calendar will feature inflation figures for Germany and Italy. On the US docket, the US Consumer Price Index (CPI), core CPI, and Fed commentary after inflation data’s release will give further forward guidance of the Fed’s tightening path.
EUR/USD Price Analysis: Technical outlook
From a daily chart perspective, the EUR/USD is neutral-biased. It has been trading since July 28, above the 20-day EMA, which has been solid support, with sellers unable to break the moving average (MA) decisively. On the flip side, EUR/USD buying pressure remains constrained, with the major exchanging hands within the 1.0096-1.0293 range for at least 21-days.
However, with US data looming, investors should expect some volatility, on Wednesday’s session. Break above the top of the range will expose resistance levels at 1.0300, followed by the 50-day EMA at 1.0350 and 1.0400. On the other hand, the EUR/USD first support would be 1.0200. Once cleared, the next support would be the August 3 low at 1.0122, followed by July 27 low at 1.0096.
 EUR/USD Daily chart
- The Australian dollar remains heavy and exchanges hands amidst a narrow range.
- Investors brace for the US Consumer Price Index for July.
- Better-than-expected Australian business confidence data capped further downside pressures.
The AUD/USD retraces from weekly highs, but trades in a choppy trading range as traders prepare for the US inflation report. That, alongside geopolitical tussles between China-Taiwan, after the visit of US House Speaker Pelosi and expectations of further Fed tightening, weighed on the mood.
At the time of writing, the AUD/USD is trading at 0.6965, below its opening price, after hitting a daily high at 0.6994. Nevertheless, buyers’ failure to pierce the 0.7000 figure exposed the major to selling pressure.
AUD/USD slides on risk-aversion
EU and US equities are registering losses. Last Friday’s solid US job report fueled expectations of a 75 bps Federal Reserve rate hike, which could happen if confirmed by inflation data. Estimations of headline inflation are at 8.7% YoY vs. 9% in June. The so-called core CPI, which excludes volatile items like food and energy, is foreseen at 6.1% YoY, a tick lower than June’s 6.2%.
Nevertheless, the greenback has been unable to capitalize on risk aversion. The US Dollar Index, a gauge of the buck’s value vs. a basket of rivals, sits at 106.189, down 0.18%. Contrarily, US bond yields are rising ahead of the US inflation report.
The Australian dollar remains bolstered by a better-than-expected China exports report. That, alongside Iron ore prices pushing to the upside, capped the AUD/USD from further losses. Meanwhile, the Australian NAB Business Confidence rebounded in July, bolstered by sales and profits. However, businesses reported rising costs in purchases and labor.
Geopolitics-wise could be harmful to the AUD/USD. With China’s military drills extending beyond their due date and breaching international waters, risks surrounding Taiwan keep investors uneasy. Further escalation might be positive for the US dollar and negative for the Australian dollar.
What to watch
The Australian economic calendar will feature Private House Approvals and Building Permits. On the US front, inflation readings, alongside further Fed-speaking after US CPI, will shed some light on the Fed’s next move.
AUD/USD Key Technical Levels
- Quiet session on Tuesday ahead of US CPI.
- DXY drops modestly, remains above 106.00.
- GBP/USD flat for the day, holding above the 20-day SMA.
The GBP/USD is hovering slightly below 1.2100, in a quiet session. The pair peaked at 1.2130 and then pulled back to 1.2077. The US dollar is mixed as market participants await the July print of the US CPI.
Quiet session, inflation data on the radar
Stocks in Wall Street are falling on Tuesday, with the Dow Jones down by 0.09% and the Nasdaq by 1.44%. Treasuries are modestly lower. The US 10-year yield rose to 2.81% and then retreated to 2.78%, and the 30-year peaked at 3.03% and is back below 3.0%.
In the currency market pairs move sideways, in small ranges. The US Dollar Index is falling by 0.19%; it remains above 106.00.
On Wednesday, the July US CPI index will be released. Market consensus is for a decline from 9.1% to 8.7% in the annual rate. An upside surprise could trigger a rally of the US dollar considering it would favor expectations about an aggressive Federal Reserve, particularly following the upbeat July employment report.
In the UK, attention remains on the Tory race to succeed Boris Johnson. The favorite is Liz Truss. She said she does not want to give handouts to families and prefers to prioritize tax cuts. The rise in energy bills continues to pressure the government.
Regarding the Bank of England, the deputy governor, Dave Ramsden said they would probably have to hike interest rates again to help curb inflation. The question is how much it will raise it: 25 or 50 basis points.
From a technical perspective, GBP/USD failed to hold above 1.2100, showing a lack of strength. A break above 1.2130 should point to more gains, targeting 1.2180. The bias for the next hours appears titled to downside while under 1.2110. The critical support may be seen at 1.2065.
Technical levels
The world oil demand is expected to rise by 2.08 million barrels per day (bpd), down from 2.23 million in the previous forecast, to 99.43 million bpd in 2022, the US Energy Information Administration said in its latest monthly report, as reported by Reuters.
Additional takeaways
"World oil demand to rise 2.06 million bpd to 101.49 million bpd in 2023 (vs rise of 2.00 million bpd forecast last month)."
"US crude output to rise 610,000 bpd to 11.86 million bpd in 2022 (vs rise of 720,000 bpd forecast last month)."
"US crude output to rise 840,000 bpd to 12.70 mln bpd in 2023 (vs rise of 860,000 bpd forecast last month)."
"US total petroleum consumption to rise 560,000 bpd to 20.34 million bpd in 2022 (vs rise of 700,000 bpd last month)."
"US petroleum demand to rise 410,000 bpd to 20.75 million bpd in 2023 (vs rise of 320,000 bpd last month)."
Market reaction
Crude oil prices continue to push lower after this report. As of writing, the barrel of West Texas Intermediate was down 0.45% on a daily basis at $90.10.
- USD/CAD erases some of Monday’s losses and gains some 0.24%.
- A dampened market mood keeps safe-haven currencies like the greenback in the driver’s seat.
- Investors brace for US Consumer Price Index for July, with headline inflation estimated to fall.
The USD/CAD slightly advances from around Monday’s lows amidst a downbeat market sentiment due to traders preparing for July’s US inflation report. Also, geopolitical jitters, spurred by US House Speaker Pelosi’s trip to Taiwan, caused an aggressive reaction from China, extending its military drills beyond the due date.
The USD/CAD is trading at 1.2884 above its opening price after hitting a daily low at 1.2843 early in the North American session.
USD/CAD climbs on dismal sentiment
USD/CAD Tuesday’s price action is driven by investors preparing for US CPI. Last Friday’s US jobs report poured cold water on recession fears after creating 528K new jobs in the economy, consequently driving down the unemployment rate to 3.5%.
Meanwhile, investors quickly reacted to the US Department of Labor data, with money market futures odds of a 75 bps rate hike by the Fed sitting at 88%. Nevertheless, odds could be diminished if inflation numbers come lower than estimated, could influence the Fed to tighten at a slower rate.
In the meantime, according to analysts, a dismal Canada job report, slashing 30.6K jobs from the economy, is not seen as a factor to deter the Bank of Canada from hiking rates. Given that the BoC surprised markets by raising rates by 100 bps last month, analysts at Scotiabank commented that although July’s employment report disappointed, the BoC would continue tightening policy.
What to watch
An absent Canadian economic docket will leave USD/CAD traders adrift to US dollar dynamics. Meanwhile, the US docket will reveal July’s US Consumer Price Index, alongside a tranche of Fed speakers, led by Chicago’s Fed President Charles Evans and Minneapolis Fed Neil Kashkari, after the US inflation report.
USD/CAD Key Technical Levels
- NZD/USD keeps moving in a familiar range.
- US Dollar posts mixed results on Tuesday ahead of US CPI data.
- Stocks decline in Wall Street, US yields pullback.
The NZD/USD pair is hovering around 0.6275, within the 0.6300-0.6270 range. It continues to move sideways with a modest upside bias, without momentum.
A mixed US Dollar, market participants await CPI
The greenback is posting mixed results on Tuesdays. Prices across financial markets are moving sideways, ahead of key data. On Wednesday, the July US CPI is due. The annual rate is expected to drop from 9.1% to 8.7%. The numbers will be critical for expectations about Fed’s monetary policy.
“The market needs to decide whether slowing headline is more important than sticky and strong core. The USD remains sensitive to US data surprises”, explained analysts at TD Securities.
The DXY is falling 0.15% on Tuesday. It managed to remain above 106.00. At the same time US yields are modestly higher. The US 10-year yield peaked at 2.81% and returned to 2.79%.
The NZD/USD is moving sideways with immediate support at 0.6270. A break lower would expose 0.6250 and then the last week's low at 0.6210, which if broken should change the short-term bias from modestly bullish to neutral/bearish.
On the upside, a consolidation above 0.6300 should strengthen the kiwi. The next strong resistance is seen at 0.6350 (Aug high).
The USD continues to show a high correlation to US data surprises, so the Consumer Price Index (CPI) report should signal the direction. Economists at TD Securities will be short-term focused on whether this number shakes resilient risk sentiment, as that will also help inform near-term USD price action.
EUR/USD to remain in its broad 1.0150/1.0290 range
“A stronger CPI print, particularly in the details, could alter pricing (in a hawkish direction) beyond September, while a downside surprise will likely shake pricing for next month.”
“We are inclined to see EUR/USD remain in its broad 1.0150/1.0290 range though a break of that is more likely on the downside than the upside.”
“USD/JPY should trade closer to 136 based on spreads, and we think a positive surprise should get it there.”
“We are focused on the impact on risk sentiment as that should also inform near-term pricing for FX markets in what otherwise is thinner liquidity at this time of year.”
See – US CPI Preview: Forecasts from nine major banks, soaring inflation to ease off in July
The US Bureau of Labor Statistics will release the July Consumer Price Index (CPI) data on Wednesday, August 10 at 12:30 GMT and as we get closer to the release time, here are the forecasts by the economists and researchers of nine major banks regarding the upcoming US inflation print.
Economists expect inflation to have decelerated from 9.1% to 8.7% YoY. Monthly, a modest increase of 0.2% is projected after a leap of 1.3% in June. What’s more, Core CPI is expected to have accelerated from 5.9% to 6.1% YoY, owing to a more modest increase of 0.5% in monthly underlying inflation, down from 0.7% recorded in June.
Deutsche Bank
“We expect the headline YoY rate to finally dip after energy prices have fallen of late. We are looking for 8.8% (from 9.1%) with consensus a tenth lower. Core however is expected to increase two-tenths to 6.1% YoY. If we see such an outcome it’ll be interesting if the market cheers what could be the start of a decline from the peak in the headline rate or remains concerned that core continues to edge up. Core should be more important to the Fed but the market has been known to take the dovish interpretation to events of late, payrolls notwithstanding.”
NBF
“The food component likely remained very strong given severe supply constraints globally, but this increase should have been partially compensated by lower gasoline prices. As a result, headline prices could have increased 0.2% MoM, the least since January 2021. If we’re right, the year-on-year rate should come down to 8.7% from a 40-year high of 9.1%. Core prices, meanwhile, may have continued to be supported by rising rent prices and advanced 0.5%. This would translate into a one-tick increase of the 12-month rate to 6.0%.”
TDS
“Core prices likely stayed strong in July, with the series registering a 0.5% MoM gain. Shelter inflation likely maintained strong momentum, though we look for airfares to retreat for a second straight month. Importantly, gasoline prices likely brought notable relief for the headline series, declining a sharp 8% MoM. Our MoM forecasts imply 8.7%/6.1% YoY for total/core prices.”
RBC Economics
“US inflation numbers are expected to edge lower, dropping to 8.8% in July. There are reasons to believe that inflation will continue to slow. Global supply chain pressures have eased more sustainably since late spring, as shipping times and costs fall. Commodity prices, though very high, have also been trending lower. And with high inflation and rising borrowing costs squeezing consumers’ real buying power, there are already early signs of slowing domestic consumer demand. Still, a bigger pullback in consumer demand will likely be necessary to get inflation moving back toward the Federal Reserve’s 2% target rate. Overall, we look for the Fed to hike rates to 3.25%-3.5% range by end of this year.”
Commerzbank
“We expect consumer prices excluding energy and food (‘core rate’) to have risen by 0.6% month-on-month in July, only slightly less than in June (0.7%). On balance, we expect consumer prices to rise by 0.3% month-on-month, significantly less than in June (1.1%). The year-on-year rate would then fall from 9.1% to 8.8%. If the price of gasoline remains at the current level, the headline inflation rate is likely to remain at about this level for the next few months. After that, inflation is likely to fall but remain very high for a long time. After all, the core inflation rate has probably not yet reached its peak. It is likely to rise from 5.9% in June to 6.2% in July and reach 6.8% in September. A slight decline in headline inflation in July could fuel speculation that the Fed will raise rates by only 50 basis points at its next meeting in September, less than the last two decisions (75 bps each). However, we caution against underestimating medium and longer-term inflation risks because of the persistence of core inflation.”
CIBC
“Consumers saw some relief from lower prices at the pump in the US in July, which will help total annual inflation decelerate to 8.8% YoY, along with base effects. Although global food price indices have softened lately as wheat harvests in the northern hemisphere have begun, that will take some months to feed through to consumer prices. Another strong increase in categories outside of energy and food likely resulted in an acceleration in core inflation to 6.2% YoY, magnified by base effects. Indeed, higher rents are still feeding through to the CPI’s shelter index. We are slightly above the consensus which could lift bond yields and the USD.”
Citibank
“US July CPI MoM – Citi: 0.2%, prior: 1.3%; CPI YoY – Citi: 8.8%, prior: 9.1%; CPI ex Food, Energy MoM – Citi: 0.5%, prior: 0.7%; CPI ex Food, Energy YoY – Citi: 6.1%, prior: 5.9%. We expect a 0.52% MoM increase in core CPI in July, a softer increase than 0.7% in June but with still-strong underlying details, in particular shelter prices. Services prices may also pick up, largely reflecting months of consistently strong wage gains amidst a still-tight labor market. Meanwhile, the pullback in headline CPI from 9.1% YoY in June could suggest a ‘peak’ of inflation is reached.”
ING
“The headline rate of CPI may rise just 0.2% month-on-month, which would be the smallest monthly increase since January 2021 and result in the annual rate of inflation slowing to 8.7% from 9.1%. However, the core rate is still expected to post a 0.4% MoM gain with housing costs continuing to boost the index. This would mean the ex-food and energy annual rate of inflation rises to 6% from 5.9%, reinforcing the message that it is still a long battle to get inflation back to the 2% target.”
ANZ
“We expect US core CPI to rise by 0.5% MoM in July and headline to rise by 0.1%, as sharply lower energy and food prices drag headline below core. Our supply-side dashboard suggests cost pressures and bottlenecks continued to ease in July. This development along with weaker commodity prices and a stronger USD should see core goods inflation ease relative to June. Wages as measured by the Employment Cost Index are running at record pace and are well above a level consistent with 2% inflation. As wages comprise a significant chunk of the cost of service-based industries, core services inflation is expected to continue to be elevated. We expect Fed officials to pay close attention to core inflation. A continuation of recent trends would be unwelcomed and likely tilt the Fed toward another substantive rate increase at the 20‑21 September FOMC meeting.”
Cable is trading on a firm note. Nonetheless, economists at Scotiabank expect GBP/USD to turn back lower towards the daily low at 1.2065.
The broader downtrend remains intact
“With markets generally consolidating, gains through 1.2135/40 will be a stretch for the GBP and we rather look for prices to edge back towards the intraday low for spot around 1.2065.”
“The broader downtrend in place since the start of the year remains intact which should serve to reinforce resistance in the 1.2175/00 zone.”
EUR/NOK is trading slightly below the 10 level. Economists at Rabobank expect the pair to tick down towards the 9.40 mark over the coming months.
Strong demand for Norway’s energy products to keep NOK well supported
“We favour selling EUR/NOK into rallies and expect the currency pair to trend moderately lower towards the 9.40 area on a 12-month view.”
“Strong demand for Norway’s energy products is likely to keep the NOK well supported. The absence of an energy crisis of the sort facing the eurozone should also allow for a moderate downward trend in EUR/NOK.”
USD/CAD has traded sideways over the past 24 hours essentially. Economists at Scotiabank expect the pair to stage another leg lower.
Break below 1.2835/40 to trigger more losses through the 1.28 area
“After falling sharply from the Friday peak just under 1.30, the consolidation could be seen as a technical pause ahead of another leg lower – a bear flag pattern, in other words.”
“USD losses below 1.2835/40 should trigger more USD losses through the 1.28 area.”
“Resistance on the session is 1.2875/80.”
Is the Chinese bid in gold running on fumes? Economists at TD Securities expect the yellow metal’s rally to run out of steam.
Global macro points to potential exhaustion of the rally
“Shanghai traders have contributed to the rally in precious metals, adding nearly 12.3k SHFE lots of gold and 11.2k SHFE lots of silver in the last two weeks alone. This has likely exacerbated price action amid a short covering rally. Notwithstanding, price action across global macro points to potential exhaustion of this move, with duration-sensitive assets approaching their trendline resistance once again.”
“We see signs that the Chinese bid in gold is exhausted, with Shanghai traders starting to liquidate some of their recently added length. In this context, gold prices are flirting with the threshold for CTA short covering, but have thus far failed to sustainably break through key trigger levels associated with a significant buying program, which could point to informed participants on the offer.”
EUR/USD pushes higher in quiet and rather featureless dealing. Economists at Scotiabank expect the world’s most popular currency pair to remain confined within its recent range.
Resistance aligns at 1.0285/95
“EUR/USD has been trading in a sideways range since the middle of Jul and, despite the EUR’s intraday gains, there is little sign of that range breaking down any time soon.”
“Short-term support is 1.0135/40.”
“Resistance is 1.0285/95.”
- USD/TRY adds to Monday’s gains near the 18.00 mark.
- The lira sheds more than 25% so far this year.
- Türkiye Unemployment Rate will come next in the docket.
The Turkish lira depreciates for the second session in a row and encourages USD/TRY to flirts once again with the key 1800 hurdle on Tuesday.
USD/TRY remains focused on 18.00
USD/TRY records gains for the second consecutive session on Tuesday, extending the auspicious start of the week at the same time.
The move higher in the pair comes in contrast with the prevailing selling pressure in the greenback and the generalized upbeat mood in the risk complex ahead of the release of key US inflation figures on Wednesday.
The lira, in the meantime, sheds further ground following gains recorded in the second half of last week, particularly in response to Friday’s news that the country’s FX reserves increased to 2-month highs around $9.12 billion in the week to July 29.
In the domestic calendar, the focus of attention remains on the publication of the jobless rate and the End Year CPI Forecast on Wednesday and Friday, respectively.
What to look for around TRY
The upside bias in USD/TRY remains unchanged and stays on course to revisit the key 18.00 zone.
In the meantime, the lira’s price action is expected to keep gyrating around the performance of energy and commodity prices - which are directly correlated to developments from the war in Ukraine - the broad risk appetite trends and the Fed’s rate path in the next months.
Extra risks facing the Turkish currency also come from the domestic backyard, as inflation gives no signs of abating (despite rising less than forecast in July), real interest rates remain entrenched in negative figures and the political pressure to keep the CBRT biased towards low interest rates remains omnipresent. In addition, there seems to be no Plan B to attract foreign currency in a context where the country’s FX reserves dwindle by the day.
Key events in Türkiye this week: Unemployment Rate (Wednesday) – Current Account (Thursday) – End year CPI Forecast, Industrial Production, Retail Sales (Friday).
Eminent issues on the back boiler: FX intervention by the CBRT. Progress (or lack of it) of the government’s new scheme oriented to support the lira via protected time deposits. Constant government pressure on the CBRT vs. bank’s credibility/independence. Bouts of geopolitical concerns. Structural reforms. Presidential/Parliamentary elections in June 23.
USD/TRY key levels
So far, the pair is gaining 0.16% at 17.9302 and faces the immediate target at 17.9874 (2022 high August 3) seconded by 18.2582 (all-time high December 20) and then 19.00 (round level). On the other hand, a breach of 17.1903 (weekly low July 15) would pave the way for 16.1867 (100-day SMA) and finally 16.0365 (monthly low June 27).
- Gold regains positive traction on Tuesday and climbs to a fresh multi-week high.
- The USD edges lower for the second straight day and offers support to the metal.
- Recession fears weigh on investors’ sentiment and benefit the safe-haven XAU/USD.
- Hawkish Fed expectations could cap gains ahead of the US CPI report on Wednesday.
Gold attracts some dip-buying near the $1,783 area on Tuesday and climbs to a five-week high during the early North American session.
Bulls now await sustained strength beyond the $1,800 mark amid modest US dollar weakness, which tends to underpin the dollar-denominated commodity. The New York Fed's monthly survey on Monday showed that the outlook for US inflation fell sharply in July. This, in turn, suggests that inflation in the US may have peaked last month, which turns out to be a key factor exerting pressure on the buck for the second straight day.
Apart from this, the prevalent cautious mood offers additional support to the safe-haven gold. The market sentiment remains fragile amid growing worries about a global economic downturn. Furthermore, the US-China tensions over Taiwan keep investors on edge. This is evident from a generally weaker tone around the equity markets, which further benefits the precious metal, though hawkish Fed expectations could cap any further gains.
Against the backdrop of the recent hawkish remarks by several FOMC officials, Friday's upbeat US jobs data fueled speculations that the Fed would retain its aggressive policy tightening path. In fact, the current market pricing points to a 70% chance for a larger, 75 bps Fed rate hike move at the September meeting. This, along with a goodish pickup in the US Treasury bond yields, could cap the upside for the non-yielding yellow metal.
Investors might also refrain from placing aggressive bets and prefer to move on the sidelines ahead of the crucial US consumer inflation figures, due on Wednesday. The US CPI report would provide fresh clues about the Fed's policy outlook, which should influence the USD and gold prices in the near term. This, in turn, warrants caution before positioning for any further gains amid absent relevant market-moving US economic data on Tuesday.
Technical levels to watch
- EUR/USD advances further north of the 1.0200 hurdle on Tuesday.
- The continuation of the uptrend could see 1.0300 retested near term.
EUR/USD flirts with the area of multi-day highs around 1.0250, posting gains for the second straight session on Tuesday.
The so far August high at 1.0293 (August 2) emerges as the magnet for bulls for the time being. Above this level, spot is expected to see its uptrend reinvigorated and could challenge the temporary 55-day SMA in the near term, today at 1.0386.
In the longer run, the pair’s bearish view is expected to prevail as long as it trades below the 200-day SMA at 1.0913.
EUR/USD daily chart
- USD/JPY struggles to gain any meaningful traction and remains confined in a narrow band.
- The Fed-BoJ policy divergence acts as a tailwind amid a goodish pickup in the US bond yields.
- Recession fears offer support to the safe-haven JPY and cap gains amid modest USD weakness.
The USD/JPY pair refreshes its daily high during the early North American session, though the uptick seems lacking any strong follow-through buying. The pair quickly retreats a few pips and slips back below the 135.00 psychological mark in the last hour.
A big divergence in the monetary policy stance adopted by the Federal Reserve and the Bank of Japan continues to weigh on the Japanese yen, which, in turn, offers some support to the USD/JPY pair. Against the backdrop of the recent hawkish remarks by several FOMC officials, Friday's upbeat US jobs data fueled speculations that the US central bank would stick to its aggressive policy tightening path. In contrast, the BoJ has repeatedly said that it will stick to its ultra-easy policy settings and its commitment to keep the 10-year Japanese government bond yield around 0%.
Apart from this, a goodish pickup in the US Treasury bond yields widens the US-Japan yield differential and undermines the JPY, offering additional support to the USD/JPY pair. That said, a modest US dollar weakness is holding back bulls from placing aggressive bets and capping gains for the major. The New York Fed's monthly Survey showed that inflation in the US may have peaked last month. This turns out to be a key factor dragging the USD lower for the second successive day amid some repositioning trade ahead of the crucial US CPI report, scheduled for release on Wednesday.
In the meantime, the prevalent cautious market mood is offering some support to the safe-haven JPY and further contributing to capping gains for the USD/JPY pair. The market sentiment remains fragile amid growing worries about a global economic downturn. This, along with US-China tensions over Taiwan, keep investors on edge. Given that there isn't any major market-moving economic data due for release from the US, the USD/JPY pair seems more likely to prolong its sideways consolidative price moves.
Technical levels to watch
- Unit Labor Costs rose at a stronger pace than expected in Q2.
- US Dollar Index stays in the negative territory but holds above 106.00.
The data published by the US Bureau of Labor Statistics showed on Tuesday that Unit Labor Costs rose by 10.8% in the second quarter. This reading followed the 12.7% increase recorded in the first quarter and came in higher than the market expectation of 9.5%.
Further details of the publication revealed that the Nonfarm Productivity decreased 4.6% in the same period, slightly better than analysts' forecast for a decline of 4.7%.
Market reaction
The greenback lost some strength after this data and the US Dollar Index was last seen losing 0.28% on a daily basis at 106.08.
- DXY adds to the recent weakness and challenges 106.00.
- Another move to the 105.00 region remains well on the cards.
DXY extends the weekly corrective downside and briefly breaches the 106.00 neighbourhood on turnaround Tuesday.
The continuation of the selling pressure should expose a deeper pullback to, initially, the August low near 105.00 (August 2). This area of initial contention appears reinforced by the 55-day SMA.
The short-term constructive stance is expected to remain supported by the 6-month support line, today near 104.40.
Furthermore, the broader bullish view in the dollar remains in place while above the 200-day SMA at 99.87.
DXY daily chart
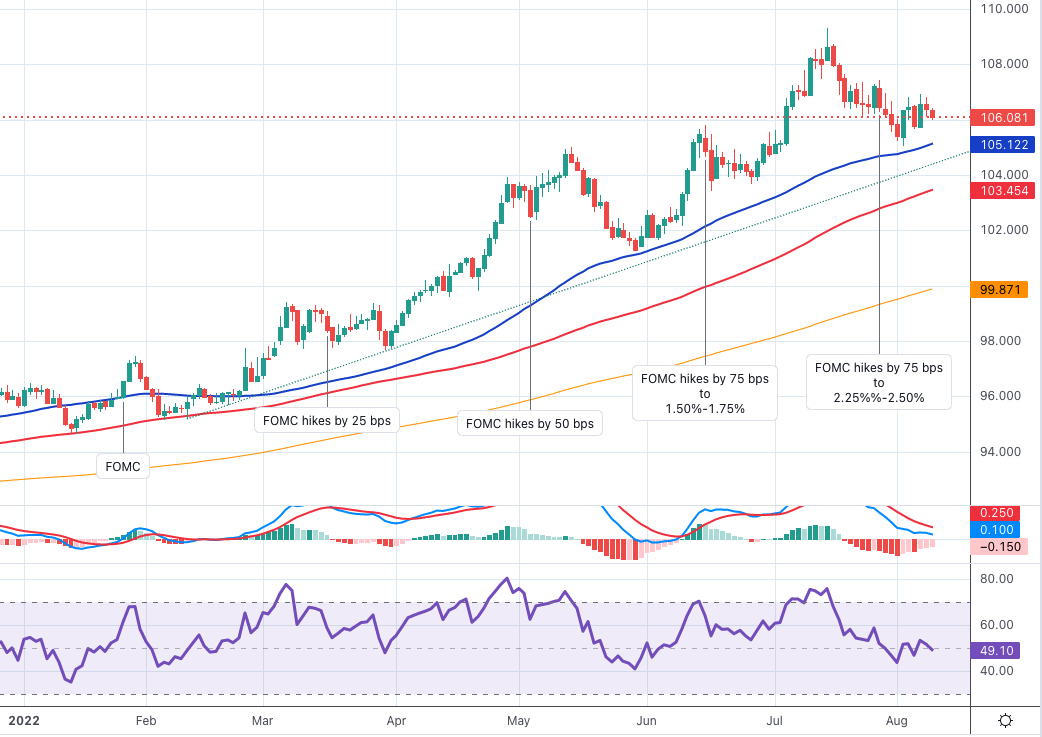
- Silver oscillates in a narrow band and consolidates its recent gains to a multi-week high.
- The overnight breakout through the 50-DMA/50$ Fibo. confluence favours bullish traders.
- Any meaningful dips could now be seen as a buying opportunity and remain short-lived.
Silver consolidates the previous day's strong gains to a six-week high and remains confined in a range above mid-$20.00s heading into the North American session.
The overnight breakout through the $20.30-$20.35 confluence - comprising the 50-day SMA and the 50% Fibonacci retracement level of the $22.52-$18.15 downfall - favours bullish traders. Positive technical indicators on the daily chart add credence to the constructive set-up and support prospects for a further near-term appreciating move.
Hence, a subsequent move up towards the 61.8% Fibo. level, around the $20.85 area, now looks like a distinct possibility. Some follow-through buying beyond the $21.00 mark would be seen as a fresh trigger for bulls and lift the XAG/USD towards the $21.40-$21.50 intermediate resistance en-route the $22.00 round-figure mark.
The latter coincides with the 100-day SMA and should keep a lid on any further gains for the XAG/USD, at least for the time being. That said, a convincing break above should pave the way for an extension of the recent recovery move from a two-year low, around the $18.15 region touched on July 14.
On the flip side, the $20.35-$20.30 confluence resistance breakpoint now seems to protect the immediate downside ahead of the $20.00 psychological mark. This is closely followed by the $19.80-$19.75 region (38.2% Fibo. level), Friday's swing low around the $19.55 area, and the 23.6% Fibo. level support, around the $19.20 zone.
Failure to defend the aforementioned support levels would negate any near-term positive bias and shift the bias back in favour of bearish traders. The XAG/USD would then turn vulnerable to weaken further below the $19.00 mark, towards the next relevant support near the $18.40 area en route to the YTD low, around the $18.15 region.
Silver daily chart
-637956435228212406.png)
Key levels to watch
Citing two sources familiar with the operation, Reuters reported on Tuesday that Russia suspended oil exports via the southern leg of the Druzhba pipeline from early August due to issues relating to transit fees.
"According to the sources, the payment from Russia's pipeline monopoly Transneft to Ukraine's pipeline operator Ukrtransnafta did not go through," Reuters explained.
Market reaction
Crude oil prices rose sharply with the initial reaction to this development. As of writing, the barrel of West Texas Intermediate was trading at $91.85, where it was up 1.55% on a daily basis.
The dollar is softer as markets await fresh drivers. Economists at BBH maintain a strong dollar call but profess disappointment that it has not been able to move higher this week.
Dollar soft as markets await fresh drivers
“Last week was an eventful one, one filled with hawkish Fed comments that were backed up by strong US data. Yet the dollar’s bounce has already run out of steam.”
“For now, we are maintaining our strong dollar call and are chalking up recent price action to the start of the summer doldrums.”
“Tomorrow’s CPI data could shake things up, but we don’t see much risk of the readings impacting Fed policy.”
- EUR/JPY extends the recovery to the vicinity of 138.00 on Tuesday.
- Further up now emerges the interim 55-day SMA around 139.50.
EUR/JPY keeps pushing higher and already surpasses the 138.00 mark on Tuesday, up for the sixth consecutive session.
Considering the ongoing price action, further upside in the cross appears likely for the time being. That said, the next temporary target aligns at the 55-day SMAs, today at 139.57. If the cross clears the latter, the door could then open to a probable visit to the July top at 142.32 (July 21).
While above the 200-day SMA at 133.82, the outlook for the cross is expected to remain constructive.
EUR/JPY daily chart
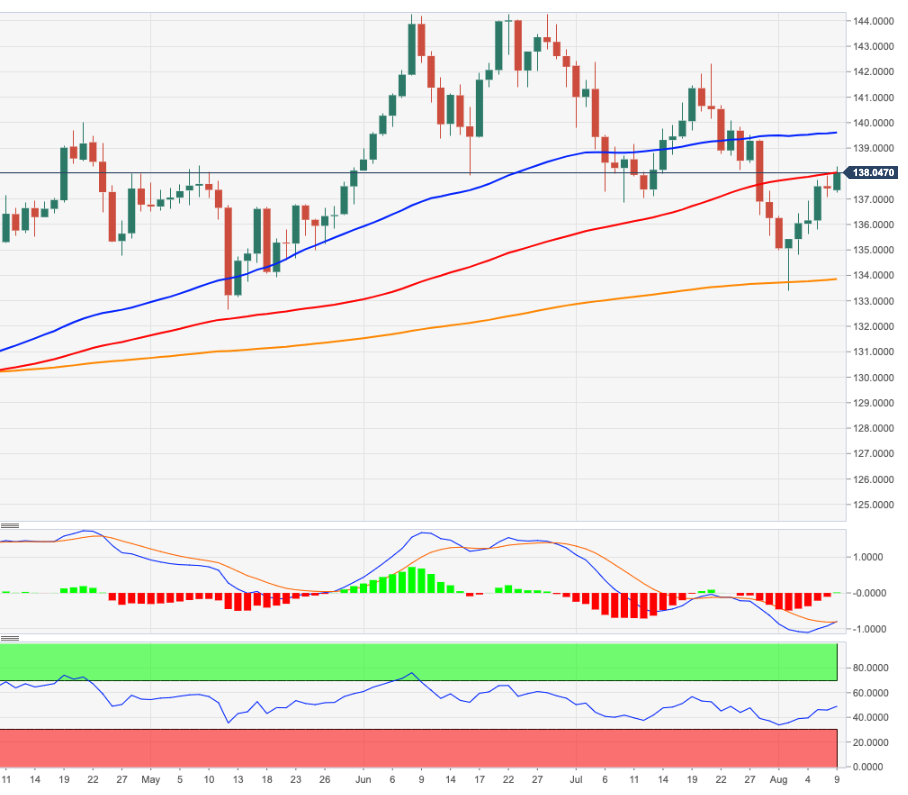
- USD/CHF edges lower for the second successive day and drops to a one-week low on Tuesday.
- A sharp fall in inflation expectations weighs on the greenback and exerts downward pressure.
- Hawkish Fed expectations to lend support to the USD and limit losses amid a positive risk tone.
The USD/CHF pair adds to the previous day's heavy losses and remains under some selling pressure for the second successive day on Tuesday. The downward trajectory drags spot prices to a one-week low, around the 0.9515 region during the first half of the European session and was sponsored by modest US dollar weakness.
The New York Fed's monthly Survey showed that the inflation outlook fell sharply in July and prompted some selling around the USD ahead of the US CPI report on Wednesday. This turns out to be a key factor exerting downward pressure on the USD/CHF pair, though the fundamental backdrops warrant some caution for aggressive bearish traders.
Friday's blockbuster US monthly jobs report fueled speculations that the Fed would stick to its policy tightening path and hike interest rates by 75 bps at the September policy meeting. Adding to this, Fed Governor Michelle Bowman said that the US central bank should consider more 75 bps hikes at coming meetings to bring inflation back down.
Apart from this, a goodish pickup in the US Treasury bond yields should lend some support to the buck. Furthermore, a generally positive tone around the equity markets could undermine the safe-haven Swiss franc, which, along with nervousness heading into the crucial US CPI report, might contribute to limiting losses for the USD/CHF pair.
There isn't any major market-moving economic data due for release from the US on Tuesday, leaving the USD at the mercy of the USD price dynamics. Nevertheless, it would still be prudent to wait for a convincing break below the 0.9500 psychological mark before positioning for any further depreciating move for the USD/CHF pair.
Technical levels to watch
Streategists at Commerzbank note that demand concerns still predominate on the oil market amid reduced demand in China.
Oil demand weakening noticeably in China
“Unless demand picks up noticeably in China or more fuel exports are allowed, refineries are hardly likely to want to import more crude oil.
“If this does not change in the remaining months of the year, Chinese crude oil imports are set to decrease for the second year in a row, resulting in the lowest annual import volume since 2018.”
“For now, the days when China served as the engine of global oil demand are a thing of the past. And this will do nothing to ease concerns about demand on the oil market.”
- Gold Price trades listlessly amid investors' caution ahead of US inflation.
- The US dollar weakness offsets the rebound in Treasury yields.
- XAU/USD bulls remain hopeful so long as the 50 DMA holds fort.
Gold Price is lacking a clear directional bias while hovering below the $1,800 mark, with bulls struggling to gain a footing amid a cautious market mood.
Investors refrain from placing any big positional bet on the yellow metal ahead of the all-important US inflation data due this Wednesday. Last Friday’s bumper US employment data stoked up 75 bps Fed rate hike expectations for September, triggering a sharp sell-off in the non-interest-bearing gold.
Therefore, the US Consumer Price Index (CPI) data remains extremely critical for the Fed to decide on the size of the next rate lift-off, eventually shaping up the next direction for the bullion.
The annualized US Consumer Price Index (CPI) for July is expected to show inflation to have eased to 8.7% from 9.1% in June. The expectations of a softer inflation reading are weighing negatively on the US dollar while keeping the sentiment around the metal buoyed.
The upside in the bright metal, however, appears capped, as the US Treasury yields stage a decent comeback even though risk sentiment remains in a weaker spot in Tuesday’s European trading.
Looking forward, the broader market sentiment and the dynamics of the dollar will continue impacting the precious metal, in absence of top-tier US economic data due for release later on Tuesday.
Gold Price: Daily chart
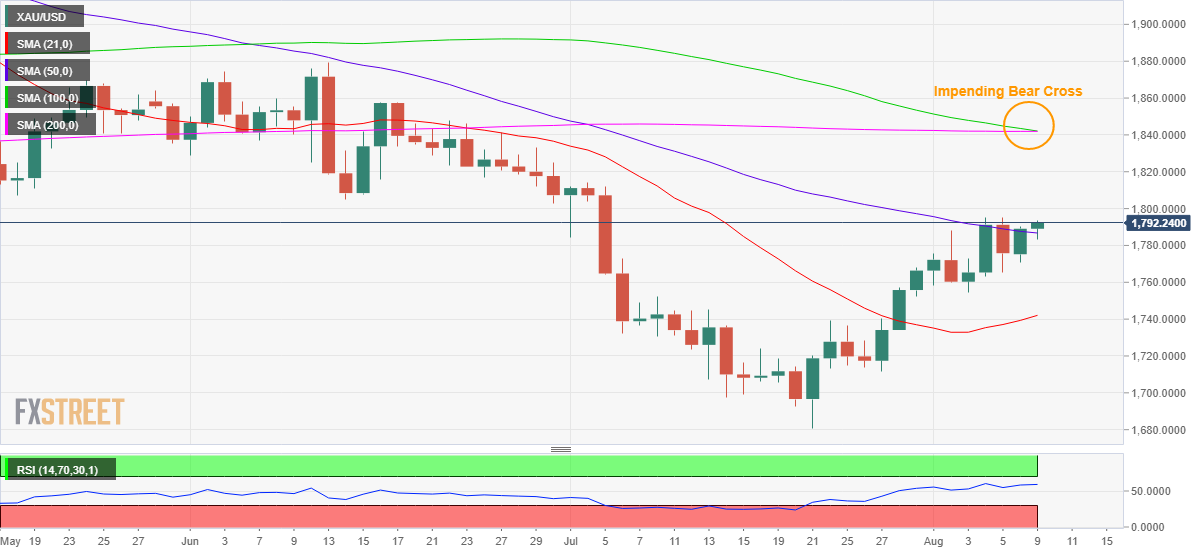
Technically, nothing seems to have changed for the bullion even though it recaptured the critical downward-sloping 50-Daily Moving Average (DMA), now at $1,787.
A failure to sustain above the latter will open up a renewed downside towards the previous day’s low of $1,771, below which the $1,765 demand area will come into play.
Also read: Gold Price: Struggle with 50 DMA set to continue ahead of US inflation
The risk appears skewed to the downside as the 100 DMA is probing the 200 DMA for a break lower, which if materializes could confirm a bear cross.
But the 14-day Relative Strength Index (RSI) remains above the midline, keeping XAU bullish interests still underpinned.
Buyers need acceptance above the $1,800 mark to continue with its recovery momentum.
Gold Price: Additional levels to consider
- GBP/USD regains traction on Tuesday amid some USD selling for the second straight day.
- A generally positive risk tone seems to be a key factor weighing on the safe-haven greenback.
- The BoE’s bleak economic outlook could act as a headwind for the GBP and cap the upside.
The GBP/USD pair attracts fresh buying on Tuesday and moves back above the 1.2100 mark during the first half of the European session. The pair is currently trading around the 1.2120 region, just a few pips below the overnight swing high.
The US dollar edges lower for the second successive day and turns out to be a key factor lending some support to the GBP/USD pair. The initial market reaction to Friday's blockbuster US monthly jobs data fades rather quickly amid a generally positive risk tone, which is seen weighing on the safe-haven greenback.
That said, speculations that the Fed would stick to its aggressive policy tightening path, along with a goodish pickup in the US Treasury bond yields, should limit losses for the USD. In fact, the current market pricing points to a 70% chance that the Fed would hike interest rates by 75 bps at its September meeting.
The bets were reaffirmed by Fed Governor Michelle Bowman's hawkish remarks on Saturday, saying that the US central bank should consider more 75 bps hikes at coming meetings to bring inflation back down. Hence, the market focus would remain glued to the latest US consumer inflation figures, due for release on Wednesday.
In the meantime, the Bank of England's bleak outlook for the UK economy could hold back traders from placing aggressive bullish bets around the British pound. It is worth recalling that the UK central bank warned last week that a prolonged UK recession would start in the fourth quarter and last five quarters.
This, in turn, warrants some caution before positioning for any further appreciating move amid absent relevant market-moving economic releases, either from the UK or the US. That said, the US bond yields, along with the broader market risk sentiment, might still influence the USD and provide some impetus to the GBP/USD pair.
Technical levels to watch
GBP/USD has climbed above 1.2100. Nonetheless, the pound remains fragile despite the latest recovery attempt, FXStreet’s Eren Sengezer reports.
Cable could hold its ground in case market mood improves
“Second-quarter Nonfarm Productivity and Unit Labor Costs from the US will be looked upon for fresh impetus. The IBD/TIPP Economic Optimism Index and the NFIB Business Optimism Index will also be featured in the US economic docket. In case safe-haven flows return on disappointing prints, safe-haven flows could provide a boost to the dollar and weigh on GBP/USD.”
“1.2150 (50-period SMA on the four-hour chart) aligns as first resistance ahead of 1.2175 (Fibonacci 23.6% retracement of the latest uptrend). In case GBP/USD breaks above the latter, it could stretch higher toward 1.2200 (psychological level, static level).”
“On the downside, sellers could show interest if the pair falls back below 1.2100 (Fibonacci 38.2% retracement). In that case, additional losses toward 1.2070 (200-period SMA) and 1.2050 (Fibonacci 50% retracement) could be witnessed.”
Markets remain calm ahead of Wednesday's US inflation data. A big downside surprise would be required to fuel a more meaningful reversal of US dollar strength, in the opinion of economists at MUFG Bank.
Inflation relief ahead of key inflation data tomorrow
“The New York Fed’s Survey of Consumer Expectations revealed a drop in the 3-year measure from 3.6% to 3.2% while over a 1-year period, the measure dropped from 6.8% to 6.2%. The 3-year drop certainly looks more compelling at this stage.”
“Today could well be a day of consolidation ahead of the CPI data tomorrow.”
“Given the Fed comments over the weekend and the rally in equities and some tentative signs of commodities recovering, we feel a big downside surprise would be required tomorrow to fuel a more meaningful reversal of US dollar strength – something that seems very unlikely at this juncture.”
- AUD/USD remains on the backfoot amid looming China-Taiwan risks.
- Higher copper and iron-ore prices combined with softer USD cap aussie’s losses.
- Bulls remain hopeful while above 100 DMA ahead of the key US inflation data.
AUD/USD is trading modestly flat below 0.7000, struggling for a clear directional move amid a cautious risk tone, broad US dollar weakness and rising industrial metals prices.
The implications of these varied factors have left the aussie wavering in a 30-pips narrow range. The quiet trading around the currency pair could be also associated with the pre-US inflation caution. Investors turn on the sidelines ahead of the key event risk of this week, which will lead the Fed to decide on a potential 75 bps rate hike next month.
The US dollar, however, extends the previous decline, in anticipation of a softer annualized US inflation print even as the Treasury yields attempt a minor bounce in European trading. The downside in the aussie, therefore, remains cushioned by a broadly weaker greenback.
Further, impressive Chinese exports data-led strength in copper and iron-ore prices is also helping the aussie stay afloat while investors assess the upbeat National Australia Bank (NAB) survey of business for July.
On the downside, the main risk for the aussie dollar remains the brewing conflict between China and Taiwan over US House Speaker Nancy Pelosi’s visit last week. China continues military drills close to the Taiwan strait, prompting the latter to believe that Beijing is preparing to invade Taipei. Markets now remain focused on Wednesday’s US inflation data while playing along the supportive daily structure on the aussie’s technical chart.
AUD/USD has managed to defend the flattish 100-Daily Moving Average (DMA) support at 0.6966 so far this Tuesday, which has revived the bullish interest.
Bulls now yearn for acceptance above 0.7000 to kick off any meaningful upside attempt.
The next target for AUD buyers is aligned near $0.7050, the confluence of the psychological support and the previous week’s high.
The 14-day Relative Strength Index (RSI) is trading flat above the midline, suggesting that there could be more room for the upside.
On the flip side, a sustained move below the 100 DMA will put the bullish 21 DMA at 0.6930 at risk. Additional declines will challenge bullish commitments around the 0.6900 round number.
AUD/USD: Daily chart
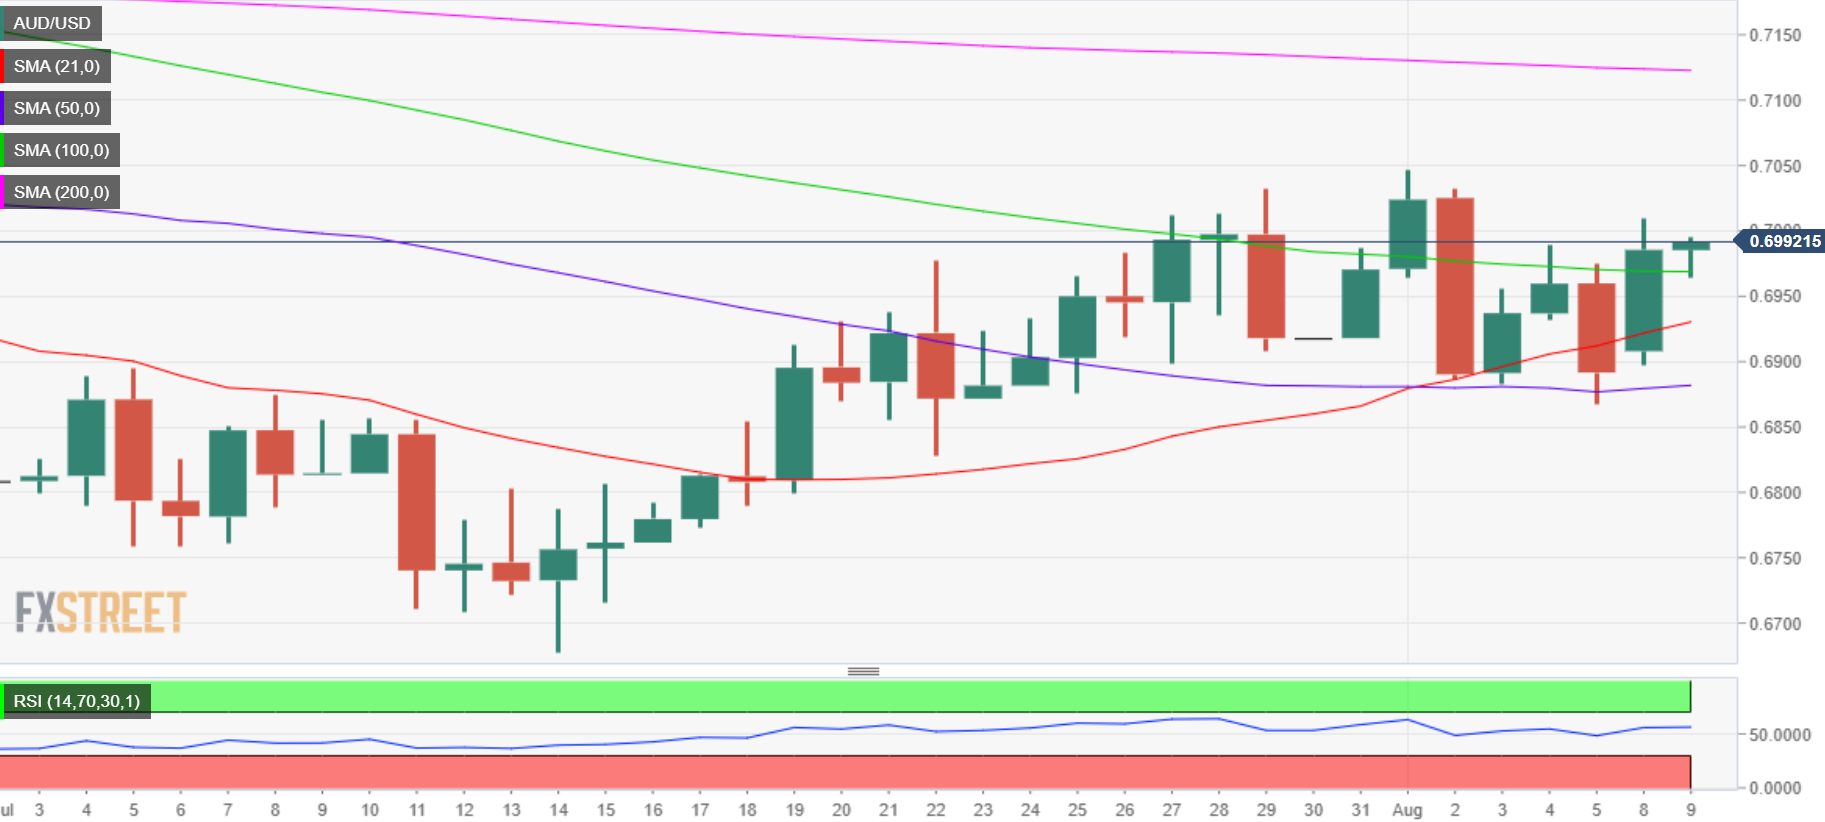
AUD/USD: Additional levels to consider
GBP/USD has gathered recovery momentum and climbed above 1.2100. Nonetheless, cable remains fragile and is set to drop below 1.20, economists at MUFG Bank report.
Sales lifted by weather but weakness persists
“The hot dry weather that boosted nominal sales growth in July will have potentially negative consequences as well. Natural gas supply uncertainty is likely to be reinforced by hydro-powered electricity supply as well. The government in Norway is now prioritising refilling its reservoirs and could limit exports of electricity if the situation worsens.”
“The outlook for consumer spending remains grim with the potential for much greater public sector strike action than on the continent. The nursing union RCN – is recommending strike action by its 465K members which would be the first-ever strike by nurses in the UK.”
“GBP/USD will be unable to hold levels above 1.2000 as downside risks persist.”
- USD/CAD attracts some buying on Tuesday, though the uptick lacks bullish conviction.
- Weaker crude oil prices undermine the loonie and extend some support to the major.
- The risk-on mood weighs on the safe-haven USD and keeps a lid on any further gains.
The USD/CAD pair regains some positive traction on Tuesday and reverses a part of the previous day's sharp decline. The pair maintains its bid tone around the 1.2860 region through the first half of the European session, though the uptick lacks bullish conviction.
The emergence of fresh selling around crude oil prices undermines the commodity-linked loonie, which, in turn, offers some support to the USD/CAD pair. Investors remain worried that a global economic slowdown could hit fuel demand. Furthermore, the latest progress to revive the Iran nuclear accord might clear the way to boost crude supply in a tight market and exerts some downward pressure on the black liquid. That said, a softer tone surrounding the US dollar keeps a lid on any meaningful upside for the major.
A generally positive risk tone continues to weigh on the safe-haven greenback, though expectations that the Fed would stick to its aggressive policy tightening path should help limit losses. In fact, the market pricing indicates a 70% chance of a 75 bps Fed rate hike at the September meeting, bolstered by Friday's blockbuster US jobs report. Adding to this, Fed Governor Michelle Bowman said on Saturday that the US central bank should consider more 75 bps hikes at coming meetings to bring inflation back down.
Hence, the market focus would remain glued to the US consumer inflation figures, due for release on Wednesday. The US CPI report will provide fresh clues about the Fed's near-term policy outlook, which will play a key role in driving the near-term USD demand. In the meantime, traders might refrain from placing aggressive bets amid absent relevant market-moving economic releases on Tuesday, either from the US or Canada. This warrants caution before placing aggressive bullish bets around the USD/CAD pair.
Technical levels to watch
- EUR/USD adds to Monday’s gains north of the 1.0200 mark.
- The dollar remains offered in the first half of the week.
- Further prudence is likely ahead of US CPI (Wednesday).
The buying pressure around the European currency remains well and sound and now lifts EUR/USD to 2-day highs above 1.0220 on Tuesday.
EUR/USD bid on USD-selling
EUR/USD advances for the second session in a row and extends the optimism seen at the beginning of the week, as the greenback continues to give away its post-NFP gains on Tuesday.
The pair’s recovery, however, stays so far within the broader 1.0100-1.0300 consolidative range that has been in place since mid-July, always against the backdrop of recession talk on both sides of the Atlantic as well as speculations over the next steps regarding an interest rate hike by both the Fed and the ECB.
Nothing scheduled data wise in Euroland on Tuesday, whereas minor releases are expected across the pond, namely, the NFIB Business Optimism Index and the IBD/TIPP Economic Optimism Index.
What to look for around EUR
EUR/USD so far keeps the 1.0100-1.0300 range unchanged against the backdrop alternating risk appetite trends.
Price action around the European currency, in the meantime, is expected to closely follow dollar dynamics, geopolitical concerns, fragmentation worries and the Fed-ECB divergence.
On the negatives for the single currency emerges the so far increasing speculation of a potential recession in the region, which looks propped up by dwindling sentiment gauges and the incipient slowdown in some fundamentals.
Key events in the euro area this week: Germany Final Inflation Rate (Wednesday) – EMU Industrial Production (Friday).
Eminent issues on the back boiler: Continuation of the ECB hiking cycle. Italian elections in late September. Fragmentation risks amidst the ECB’s normalization of monetary conditions. Impact of the war in Ukraine on the region’s growth prospects and inflation.
EUR/USD levels to watch
So far, spot is gaining 0.47% at 1.0238 and faces the next up barrier at 1.0293 (monthly high August 2) seconded by 1.0385 (55-day SMA) and finally 1.0615 (weekly high June 27). On the flip side, a break below 1.0096 (weekly low July 26) would target 1.0000 (psychological level) en route to 0.9952 (2022 low July 14).
After having registered modest gains on Monday, EUR/USD has stretched higher and climbed above 1.0200. Nevertheless, euro recovery is set to remain limited ahead of Wednesday's key data releases, FXStreet’s Eren Sengezer reports.
Investors might remain on the sidelines ahead of key data
“Ahead of the inflation data from Germany and the US on Wednesday, market participants could refrain from betting on further euro strength.”
“EUR/USD is closing in on 1.0230, where the Fibonacci 38.2% retracement of the latest downtrend is located. Even if the pair manages to rise above that level, it could meet strong resistance at 1.0250 (200-period SMA on the four-hour chart). Only a four-hour close above that level could be seen as a bullish development and open the door for an extended recovery toward 1.0300 (psychological level, Fibonacci 50% retracement).”
“Initial support is located at 1.0200 (100-period SMA, 50-period SMA). If sellers flip that level into resistance, 1.0150 (Fibonacci 23.6% retracement) and 1.0100 (psychological level, static level) could be seen as the next bearish targets.”
“The Bank of Japan (BOJ) expects prices to rise more quickly than officials had anticipated at their July meeting,” MNI reports, citing people familiar with the central bank's thinking.
But the sources added that the jump in inflation to 3% or higher later this year, however, will not be enough to prompt any shift in its easy policy stance unless it feeds into an acceleration of wages next spring.
Key quotes
“Higher food prices, supply side constraints and the failure of government subsidies to curb an increase in petrol prices are set to push inflation well above the BOJ's 2% price stability target.”
“But without significant wage hikes, BOJ officials will maintain the view that annual CPI increases are likely to slow or decline in fiscal 2023.”
“Retailers are becoming more willing to raise prices as leading brands lead the way. Retail prices, particularly in services, tend to be revised in April and October, with more than 6,300 items set to see increases in October, up from 2,431 in August.”
“Subsidies aimed at capping higher petrol prices have had only limited effect at a retailer level, particularly outside bigger cities, and are set to end on Sept. 30.“
“Wholesale prices for durable goods, mostly imported, are also rising, putting pressure on retailers to up their own prices.”
Market reaction
USD/JPY is posting small losses amid a broadly weaker US dollar and a minor bounce in the Treasury yields. The US inflation data holds the key.
The spot was last seen trading at 134.88, down 0.09% so far.
According to a study by the Institute for Employment Research (IAB), Germany’s economy will lose more than EUR260 billion ($265 billion) in added value by 2030 due to the Russia-Ukraine war and high energy prices, Reuters reported on Tuesday.
Additional takeaways
“In comparison with expectations for a peaceful Europe, Germany’s price-adjusted gross domestic product (GDP) will be 1.7% lower next year and there will be about 240,000 fewer people in employment.”
“The employment level is expected to stay at around this level until 2026.”
“One of the big losers will be the hospitality industry.”
“If energy prices, which have so far shot up by 160%, were to double again, Germany’s 2023 economic output would be almost 4% lower than it would have been without the war.”
Market reaction
The shared currency is little affected by the above findings of the study, with EUR/USD trading at daily highs of 1.0238, adding 0.40% on the day.
- USD/JPY is seen oscillating in a narrow trading band around the 135.00 mark on Tuesday.
- Recession fears, US-China tensions underpin the safe-haven JPY and seem to cap the pair.
- The Fed-BoJ policy divergence acts as a tailwind ahead of the US CPI report on Wednesday.
The USD/JPY pair extends its sideways consolidative price move through the first half of the European session and remains confined in a narrow range near the 135.00 mark on Tuesday.
Worries about a global economic downturn, along with the US-China tensions over Taiwan, continues to lend some support to the safe-haven Japanese yen. The flight to safety is reinforced by the ongoing slide in the US Treasury bond yields. This, in turn, narrows the US-Japan rate differential and further benefits the JPY. Apart from this, a modest US dollar weakness is acting as a headwind for the USD/JPY pair.
The downside, however, remains cushioned amid a big divergence in the monetary policy stance adopted by the Bank of Japan and the Federal Reserve. In fact, the BoJ has repeatedly reiterated it will stick to its ultra-easy policy settings and its commitment to keep the 10-year Japanese government bond yield around 0%. In contrast, the US central bank is expected to retain and stick to its aggressive policy tightening path.
Friday's blockbuster US monthly jobs report eased fears that the economy was in recession and revived bets for a larger Fed rate hike move at the September policy meeting. Adding to this, Fed Governor Michelle Bowman said on Saturday that the US central bank should consider more 75 bps hikes at coming meetings to bring inflation back down. Hawkish Fed expectations help limit the USD losses and lend support to the USD/JPY pair.
Investors also seem reluctant to place aggressive bets and prefer to wait for the latest US consumer inflation figures, scheduled for release on Wednesday. The US CPI report would provide fresh clues about the Fed's monetary policy outlook and play a key role in influencing the near-term USD price dynamics. This, in turn, should assist investors to determine the next leg of a directional move for the USD/JPY pair.
In the meantime, the USD remains at the mercy of the US bond yields amid absent relevant market-moving economic releases on Tuesday. Apart from this, the broader market risk sentiment would be looked upon for short-term trading opportunities around the USD/JPY pair. The fundamental backdrop, however, suggests that the USD/JPY pair is more likely to prolong the subdued/range-bound price action ahead of the key data risk.
Technical levels to watch
- The index adds to the pessimism in the first half of the week.
- US yields remain apathetic ahead of key CPI release.
- NFIB Index, IBD/TIPP Index next on tap in the docket.
The US Dollar Index (DXY), which gauges the greenback vs. a bundle of its main rivals, keeps trading without clear direction in the 106.30 region so far on Tuesday.
US Dollar Index remains cautious ahead of US CPI
The index remains on the defensive in the first half of the week, always amidst the broader consolidation theme with the upside clearly capped around the vicinity of the 107.00 mark and the lower bound limited near the 105.00 region.
The dollar, in the meantime, trades in a prudent fashion ahead of the publication of the key US inflation figures for the month of July due on Wednesday, while market chatter around a potential 75 bps rate hike at the Fed’s September meeting seems to have lost presence among investors in past hours.
In the US data space, the NFIB Business Optimism Index and the IBD/TIPP Economic Optimism Index are due later ahead of the weekly report on US crude oil supplies by the American Petroleum Institute (API).
What to look for around USD
The index remains under pressure after advancing to the boundaries of the 107.00 mark soon after solid results from US Nonfarm Payrolls more than doubled its initial estimates in July.
The dollar, in the meantime, is poised to extend the current range bound theme amidst persistent cautiousness pre-US CPI and prospects for the continuation of the aggressive normalization by the Federal Reserve.
Looking at the macro scenario, the dollar appears propped up by the Fed’s divergence vs. most of its G10 peers (especially the ECB) in combination with bouts of geopolitical effervescence and occasional re-emergence of risk aversion.
Key events in the US this week: MBA Mortgage Applications, Inflation Rate, Wholesale Inventories (Wednesday) Initial Claims, Producer Prices (Thursday) – Flash Consumer Sentiment (Friday).
Eminent issues on the back boiler: Hard/soft/softish? landing of the US economy. Escalating geopolitical effervescence vs. Russia and China. Fed’s more aggressive rate path this year and 2023. US-China trade conflict. Future of Biden’s Build Back Better plan.
US Dollar Index relevant levels
Now, the index is losing 0.10% at 106.26 and a breach of 105.04 (monthly low August 2) would expose 103.67 (weekly low June 27) and finally 103.45 (100-day SMA). On the upside, a breakout of 107.42 (weekly high post-FOMC July 27) would expose 109.29 (2022 high July 15) and then 109.77 (monthly high September 2002).
Here is what you need to know on Tuesday, August 9:
The market action remains relatively subdued on Tuesday as investors refrain from making large bets ahead of Wednesday's Consumer Price Index (CPI) data. The US Dollar Index (DXY) fluctuates in a narrow range above 106.00, US stock index futures stay flat in the European morning and the benchmark 10-year US Treasury bond yield moves sideways slightly below 2.8%. There won't be any high-impact data releases from the euro area and the US economic docket will feature the NFIB Business Optimism Index, Unit Labor Costs for the second quarter and the IBD/TIPP Economic Optimism Index data later in the day.
US CPI Preview: It is the hard core that counts, five scenarios for critical inflation data.
Meanwhile, the Chinese military said that it will continue its drills around Taiwan on Tuesday. This development, however, doesn't seem to be having an impact on risk mood.
Following Monday's modest rebound, EUR/USD moves up and down in a tight range near 1.0200 early Tuesday. Citing a study by the Institute for Employment Research (IAB), Reuters reported that the German economy was expected to lose more than $260 billion in added value by 2030 because of high energy prices and the ongoing war in Ukraine.
GBP/USD climbed above 1.2100 on Monday but erased a large portion of its daily gains. As of writing, the pair was trading near 1.2080. Bank of England (BOE) Deputy Governor Dave Ramsden said on Tuesday that he would not rule out the scenario that the recession forecast by the BOE could force it to reverse course on rates next year.
USD/JPY failed to make a decisive move in either direction at the beginning of the week and closed the day flat near 135.00. The pair continues to trade near that level in the early European morning.
Gold took advantage of falling US T-bond yields and climbed to the $1,790 area before losing its traction on Tuesday. XAU/USD was last seen trading with modest losses near mid-$1,780s.
Bitcoin gained nearly 3% on Monday and seems to have gone into a consolidation phase near $24,000 on Tuesday. Ethereum climbed above $1,800 on Monday and touched its highest level since early June. ETH/USD was last seen trading flat on the day at $1,775.
- Gold witnesses some selling on Tuesday and reverses a part of the previous day’s positive move.
- A generally positive tone around the equity markets acts as a headwind for the safe-haven metal.
- Sliding US bond yields keep the USD on the defensive and seem to offer support to the XAU/USD.
Gold edges lower on Tuesday and erodes a part of the previous day's strong positive move back closer to a one-month high touched last week. The XAU/USD remains on the defensive through the early European session and is currently trading around the $1,785 region, down over 0.15% for the day.
Signs of stability in the equity markets seem to undermine the safe-haven gold, though a combination of factors should help limit the downside. Growing recession fears, along with US-China tensions over Taiwan, keep a lid on any optimistic move in the markets. Apart from this, a further decline in the US Treasury bond yields continues to weigh on the US dollar, which, in turn, is seen lending some support to the dollar-denominated commodity. Bulls, however, seem reluctant to place aggressive bets amid speculations that the Fed would retain its aggressive policy tightening path.
In fact, the markets are pricing in around 70% chances that the Fed would hike interest rates by 75 bps at its September meeting. The bets were reaffirmed by Fed Governor Michelle Bowman's remarks on Saturday, saying that the US central bank should consider more 75 bps hikes at coming meetings to bring inflation back down. This, in turn, is seen acting as a headwind for the non-yielding gold. Investors might also refrain from placing aggressive bets and prefer to move on the sidelines ahead of the latest US consumer inflation figures, scheduled for release on Wednesday.
The US CPI report would be looked upon for fresh clues about the Fed's near-term policy outlook. This would play a key role in influencing the near-term USD price dynamics and help determine the next leg of a directional move for the precious metal. In the meantime, the US bond yields will drive the USD demand amid absent relevant market-moving economic releases. Apart from this, the broader market risk sentiment should produce short-term trading opportunities around gold. The recent range-bound price action, however, points to indecision among traders and warrants caution.
Technical levels to watch
EUR/USD remains listless in the middle of a 1.01-1.03 range. Economists at ING expect the world’s most popular currency pair to trade down near the 1.00-1.02 area for the rest of 2022.
On vacation
“The European data calendar is exceptionally light this week and this pair will instead be driven by geopolitical factors and US data/Fed speak.”
“Our baseline for the remainder of this year is EUR/USD continuing to trade down near the 1.00-1.02 area.”
In the United Kingdom, attention should be paid to the Conservative Party leadership race, set to run until September. A victory of Foreign Minister Liz Truss would weigh on the British pound, in the opinion of economists at Mizuho Bank.
GBP/USD to move in a narrow range around 1.20 in August
“The GBP/USD pair will move in a narrow range around 1.20 in August.”
“Recent polls suggest Foreign Minister Liz Truss is in the driving seat. However, there are lots of question marks about her ability to run the economy. She has called for tax cuts (and an end to tax rises) without saying how they would be paid for, for example, and she also said the UK could learn from Japan when it came to tackling inflation.”
“Market participants will need to monitor opinion polls going forward, but it seems likely the pound will strengthen if a Sunak victory looks likely or weaken if Truss looks likely to become the next prime minister.”
A very quiet Monday and what looks the same again today has seen the dollar soften slightly across the board. Dollar stability can allow some interest in high yield emerging markets (EM) FX, economists at ING report.
Window of carry sees renewed interest in EMFX
“Even though we think the dollar can stay quite well bid for the rest of the year as the Fed takes the funds rate to 3.25/3.50%, dollar stability at the highs could see renewed interest in this high-yield EM local currency bond space.”
“Quiet summer markets could see investors starting to position at the long end of the EM local currency bond market for EM easing cycles coming through next year.
“Back to DXY, expect another range-bound day as the market awaits the US July CPI release tomorrow – a release expected to cement expectations that the Fed Funds rate will be taken to the 3.25/3.50% area by year-end.”
EUR/GBP is pressing resistance at 0.8450. Although not their base case, economists at ING note that the pair could reach the 0.8485/0.8500 area on a break above here.
0.8450 might prove the top of a near-term trading range
“We had felt that 0.8450 might prove the top of a near-term trading range – despite the Bank of England's bleak prognosis last week.”
“There still does not seem a compelling case for EUR/GBP to trade substantially higher, but we acknowledge that a break of 0.8450 can carry EUR/GBP to the 0.8485/8500 area.”
- EUR/JPY picks up bids to reverse the week-start pullback, grinds higher around daily top.
- Yields consolidate previous day’s losses amid a sluggish session.
- Japan Machine Tool Orders, fewer challenges for BOJ appear to favor the pair buyers.
EUR/JPY remains firmer, following a softer start to the week, despite the latest pullback from the intraday high of 137.89. That said, the cross-currency pair benefits from the rebound in the US Treasury yields, as well as the broad weakness in the Japanese yen (JPY).
The US 10-year Treasury yields added one basis point (bp) to 2.77% after losing seven bps to 2.76% the previous day and marking a jump of the 14-bps on Friday. It’s worth noting that the yields recently tracked hawkish Fed bets and firmer US jobs reports to print gains.
The Fed funds futures price in a 69% chance of another 75 bps rate hike in September, per Reuters. On the other hand, US employment numbers for July marked upbeat figures and allowed Fed policymakers to retain their hawkish bias.
Elsewhere, the political uncertainty, suggesting that Japanese Prime Minister Fumio Kishida is up for shuffling the cabinet, appears to weigh on the JPY. That said, Finance Minister Shunichi Suzuki is likely to retain his position, which in turn flashes no major challenges for the Bank of Japan’s (BOJ) easy money policies. The same should keep the JPY bears hopeful.
It should be noted that firmer prints of the Eurozone Sentix Investor Confidence Index also seem to help the EUR/JPY buyers. The key sentiment gauge improved to -25.2 for August versus -24.7 expected and -26.4 prior. Details suggest that the current situation in the eurozone recovered from the lowest since March 2021, to -16.3 versus -16.5 marked in the previous month. An expectations index, however, remains near the lowest since December 2008 while improving a bit to -33.8 at the latest. On the other hand, the US Dollar Index (DXY) registered a 0.19% daily loss to 106.37.
A downbeat print of the Japanese Machine Tool Orders for July, 5.5% YoY versus 17.1% prior, also helps the EUR/JPY to remain firmer.
However, fears of economic slowdown due to the energy crisis and Italy’s political chaos ahead of September’s election seem to challenge the EUR/JPY bulls.
Moving on, yields and the risk catalysts are crucial for the EUR/JPY traders to watch for short-term directions.
Technical analysis
100-DMA level near 138.00 challenges EUR/JPY bulls inside a six-week-old descending trend channel, between 140.90 and 134.25 at the latest. The pair sellers, however, need validation from the 200-DMA support surrounding 133.85 for conviction.
The Bank of England (BoE) delivered a dovish 50 bps hike, as widely expected and the GBP weakened. An inverted curve amid increasingly worrying signs about future growth points to further GBP underperformance, in the view of economists at HSBC.
GBP to weaken against the USD over the short to medium term
“Markets have priced in BoE hikes. This is still the case, with 100bp priced into the rates market for the remaining three meetings this year. The BoE would, at best, meet market expectations for hikes, with a higher chance of under-delivering than over-delivering, thereby weighing on the GBP.”
“The inversion of the UK yield curve suggests markets are worried about a recession and see this tightening cycle as short-lived, making it harder for the GBP to sustain gains on the near-term hikes that are priced in.”
“We still believe that the GBP continues to face both cyclical and structural challenges and the balance of risks remains to the downside through the rest of 2022 and into next year.”
- NZD/USD edges lower on Tuesday, though the downside remains cushioned amid softer USD.
- Recession fears and US-China tensions seem to act as a headwind for the risk-sensitive kiwi.
- Sliding US bond yields keep the USD bulls on the defensive and should help limit deeper losses.
The NZD/USD pair struggles to capitalize on the previous day's positive move and attracts some selling in the vicinity of the 0.6300 mark on Tuesday. The pair edges lower through the early European session and drops to a fresh daily low, around the 0.6270 region in the last hour.
Growing worries about a global economic downturn, along with US-China tensions over Taiwan, keep a lid on the recent optimistic move in the markets and act as a headwind for the risk-sensitive kiwi. That said, a softer tone surrounding the US dollar offers some support to the NZD/USD pair and should help limit any deeper losses.
The flight to safety continues to exert downward pressure on the US Treasury bond yields, which, in turn, is seen undermining the greenback. That said, speculations that the Fed would stick to its aggressive policy tightening path, bolstered by Friday's upbeat US jobs report, support prospects for the emergence of some USD dip-buying.
In fact, the markets are pricing in around 70% chances that the Fed would hike interest rates by 75 bps at its September meeting. The bets were reaffirmed by Fed Governor Michelle Bowman's remarks on Saturday, saying that the US central bank should consider more 75 bps hikes at coming meetings to bring inflation back down.
Hence, the market focus would remain glued to the latest US consumer inflation figures, due for release on Wednesday. The US CPI report would be looked upon for fresh clues about the Fed's policy path. This, in turn, would play a key role in influencing the near-term USD price dynamics and determining the near-term trajectory for the NZD/USD pair.
In the meantime, traders might prefer to move on the sidelines amid absent relevant market-moving US economic releases from the US. Even from a technical perspective, the recent range-bound price action witnessed over the past two weeks or so points to indecision among traders and warrants some caution before placing aggressive bets around the NZD/USD pair.
Technical levels to watch
Analysts at Morgan Stanley lean bearish on EUR/USD, projecting a move towards 0.9700.
Key quotes
"Regional challenges continue to grow. Risks to Eurozone gas shutoff continue to rise, which should weigh on local growth, while Covid-19 policies in Asia may continue to restrict the recovery.... This should be positive for the USD. Indeed, for investors increasingly looking for safety, the "King Dollar" may indeed still be king. This could even be true across asset classes.”
"Say an investor is looking for a safe haven and she is choosing between the USD in FX or a Treasury note. Both are often viewed as safe havens, but it's worth remembering that the USD has positive returns relative to Treasuries in a world where rates keep rising."
In the view of economists at Mizuho Bank, the markets are now focusing on the possibility of a recession, so investors will need to monitor global economic trends going forward. They expect the USD/CAD pair to trade in a range from 1.27-1.32 in August.
Drop to 1.26/27 to be short-lived
“If recessionary concerns grow from here on, crude oil prices will probably fall and there is unlikely to be a strong appetite for Canadian-dollar buying.”
“With the greenback being sold after the July FOMC meeting, the USD/CAD pair might drop to 1.26-1.27 for a time. This trend will be short-lived, though, with the pair set to trade in a range from 1.27-1.32 in August.”
Considering advanced prints for natural gas futures markets from CME Group, open interest shrank for the third session in a row on Monday, now by nearly 11K contracts. On the other hand, volume clinched the second consecutive daily build and this time increased by around 21.8K contracts.
Natural Gas: The $7.50 region holds the downside so far
Prices of natural gas started the week on the defensive and added to the recent weakness amidst shrinking open interest, which is indicative that the downside looks contained for the time being. That said, there is quite decent contention in the $7.50 region per MMBtu in the very near term.
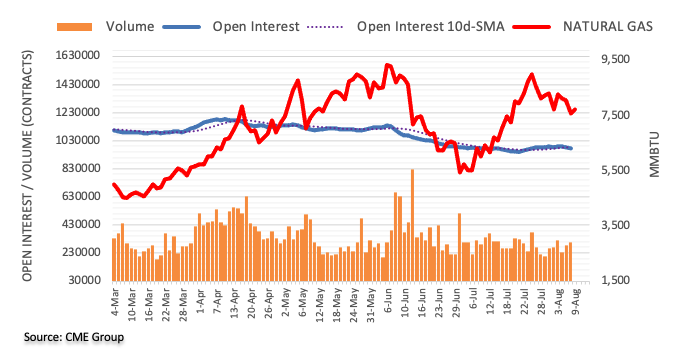
Inflation in OECD countries is expected to be structurally higher in the future due to the combination of several factors. If inflation is structurally higher, it will be necessary to consider raising central banks’ inflation targets to prevent them from having to conduct a perpetually restrictive monetary policy, in the view of analysts at Natixis
Inflation is expected to be structurally higher in the future
“Inflation in OECD countries is expected to be structurally higher in the future for several reasons: Population ageing; Reshoring from emerging countries, rising production costs in these countries and geopolitical tensions; The energy transition (higher cost of renewable energy, strong demand for commodities, etc.) and the costs of climate disruption; Greater bargaining power for wage earners and unions.”
“If inflation is spontaneously significantly higher on average, then retaining an inflation target of 2% would require central banks to constantly keep real interest rates abnormally high and therefore to constantly and needlessly weaken the economy. It is important to understand that this is not about changing the inflation target because of a short-term inflation shock, but because of the transition to permanently higher inflation for multiple reasons.”
July was a roller coaster ride for the Canadian dollar. Economists at the National Bank of Canada still see USD/CAD converging to 1.22 in the coming quarters.
WTI oil prices should stabilize around $90
“With the unemployment rate remaining historically low and with labour shortages continuing to persist according to the latest figures by the CFIB, we still see enough resilience in the Canadian domestic economy to justify higher interest rates.”
“Given our expectation that WTI oil prices should stabilize around $90 per barrel, we still see USD/CAD converging to 1.22 in the coming quarters as the oil/loonie correlation turns positive again.”
EUR/USD treads water around 1.02. Economists at Commerzbank expect the world’s most popular currency pair to remain confined within its current 1.00-1.04 range.
Summer lull
“I can’t think of any good reasons why EUR/USD should break out of its current 1.00-1.04 range at present. The US labour market report did not manage to do that. The US CPI data due for publication tomorrow is unlikely to succeed either.”
“There is uncertainty as to the extent to which the ECB will continue tightening its key rate. At present the market expects rates to peak at 1.25%, there is no convincing reason to change this expectation at present.”
“It seems that EUR/USD is starting its summer break, even though it no doubt makes sense to keep an eye on the geopolitical and energy situation. However, while there is no surprise news on that front (the central banks are unlikely to provide any right now) the market can no doubt get used to EUR/USD trading sideways.”
- GBP/USD remains sluggish inside a one-week-old bearish megaphone bearish chart pattern.
- RSI backs lower high on prices to keep sellers hopeful.
- More volatility likely ahead of directing bears to yearly low.
- 200-HMA adds to the upside filters, taming bull’s chances of entry.
GBP/USD fades upside momentum as the quote retreats to 1.2082 heading into Tuesday’s London open. Even so, the cable pair remains inside the weekly megaphone trend widening formation.
That said, the bearish move since the previous Monday joins lower high of RSI and prices to keep sellers hopeful.
With this, the GBP/USD sellers could drop to 61.8% Fibonacci retracement of July 21 to August 01 upside, near 1.2045.
However, the stated megaphone’s lower line and July 21 low, respectively near 1.1940 and 1.1890 in that order, could challenge the pair bears before directing them to the yearly low near 1.1760.
Alternatively, recovery moves need to defy the bearish continuation pattern by crossing the 1.2115 hurdle.
Even so, the 200-HMA hurdle near 1.2155 acts as an extra challenge for the GBP/USD bulls before targeting the monthly peak of 1.2293.
To sum up, GBP/USD weakness is likely to continue but the odds favoring more volatility are high.
GBP/USD: Hourly chart
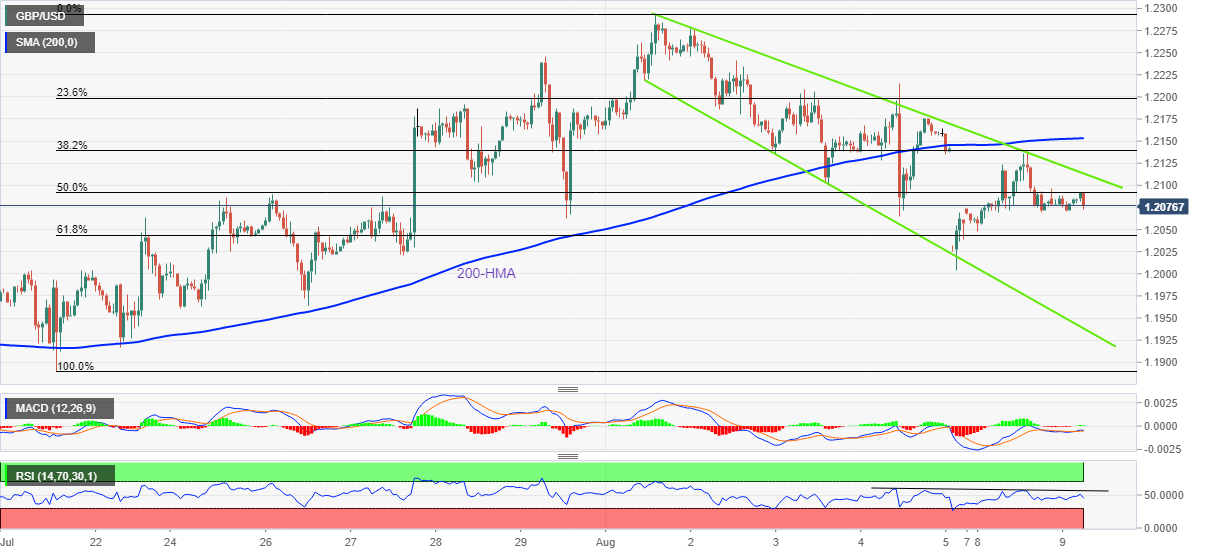
Trend: Further weakness expected
The British pound was little changed on the announcement of a larger-than-usual rate hike by the Bank of England (BOE) as economic projections were significantly downgraded. Economists at the National Bank of Canada expect the GBP to struggle in the near-term.
BoE warns of bleak outlook
“The BoE now expects inflation to reach 13% by year-end and remain at elevated levels for the entirety of 2023 only to fall back to 2% in 2024. The Bank’s baseline scenario is for the economy to slide into a 15-month recession, during which time GDP should contract by more than 2%. Moreover, the unemployment rate is projected to rise in the middle of 2023 and could exceed 6% by the middle of 2025.”
“We see limited upside potential for the pound in the short-term and will require some of the storm clouds to dissipate in order to make some gains later in our forecast horizon.”
FX option expiries for August 9 NY cut at 10:00 Eastern Time, via DTCC, can be found below.
- EUR/USD: EUR amounts
- 1.0000 1.06b
- 1.0100 799m
- 1.0145-50 926m
- 1.0185-90 1.69b
- 1.0200-10 1.69b
- 1.0225-30 380m
- 1.0260-65 320m
- 1.0300 1.27b
- GBP/USD: GBP amounts
- 1.1900 670m
- 1.2250 510m
- USD/JPY: USD amounts
- 133.00 570m
- 133.40 679m
- 134.50 210m
- 135.00-05 975m
- 135.30-40 1.43b
- USD/CAD: USD amounts
- 1.2750 325m
- 1.2875 470m
- 1.2900 1.17b
- 1.2920 223m
- EUR/GBP: EUR amounts
- 0.8350 210m
The Swedish krona has retraced most of the last month's losses again. However, economists at Commerzbank do not expect the EUR/SEK to trade sustainably below the 10.30 level.
Losses retraced, but only little more potential
“The market has now priced in the restrictive monetary policy – a reason why SEK has retraced its losses and has recovered once again. But also, a reason why SEK does not have much more upside potential against the euro.”
“If we really were to see a recession in the eurozone due to the energy crisis the Swedish economy is unlikely to be able to decouple from that due to the close ties with the eurozone and would also have to expect negative effects, which in turn might affect Riksbank’s monetary policy.”
“I consider EUR/SEK levels below the 10.30 mark to be unlikely and not justified at present.”
The euro traded below the US dollar on the 14th of July, a first in nearly 20 years. Economists at the National Bank of Canada continue to see some lingering euro weakness in the short term with the potential for a little appreciation of the common-area currency further out on the forecast horizon.
Growth to moderate in the second half of the year
“The current situation in Europe is precarious and will require material improvements on both the geopolitical and inflation fronts.”
“Growth is likely to moderate in the second half of the year.”
“We continue to see some lingering euro weakness in the short term with the potential for a little appreciation of the common-area currency further out on the forecast horizon as the USD weakens.”
Lee Sue Ann, Economist at UOB Group, suggests the Bank of Thailand (BoT) could hike its policy rate at any time in the next three meetings.
Key Quotes
“The BOT still has three more MPC meetings scheduled for 2022 (Aug, Sep, Nov), and we are of the view that it will hike only in Nov by 25bps to continue entrenching the negative real rates in support of the economic recovery.”
“However, we are not ruling out a rate hike in Aug or Sep, should economic growth continue to show steady momentum and especially if inflationary pressure remains stubbornly high.”
- EUR/GBP is eyeing an establishment above 0.8440 ahead of German inflation.
- As per the estimates, the UK economy shrunk by 0.2% in July.
- The odds of a rate hike by the ECB will remain elevated.
The EUR/GBP pair is continuously facing barricades around 0.8440 for the last week. A stretched consolidation in a 0.8401-0.8453 range indicates that the market participants are awaiting a potential trigger for further guidance. This week, the German Harmonized Index of Consumer Prices (HICP) will be a major driver for the cross.
Considering the street expectations, Germany's HICP is likely to remain unchanged at 8.5%, similar to its prior close on an annual basis. Also, the monthly inflation data is seen unchanged at 0.8%. Investors should be aware of the fact that Germany is a core member of the European Union (EU) and its inflation data carries a significant impact on the shared currency bulls.
There is no denying the fact that the Germany HICP is displaying some peak signals, however, this doesn’t warrant that the European Central Bank (ECB) won’t go for a rate hike announcement or sound less hawkish. The ECB remained slowest in elevating interest rates among its Western peers due to regional imbalance after Russia’s invasion of Ukraine. Therefore, the odds of a rate hike are sky-rocketing as the inflation rate is beyond the desired rate.
On the pound front, lower consensus for the Gross Domestic Product (GDP) data has started displaying its consequences. A preliminary estimate for the UK GDP is 2.8% vs. 8.7% the former release on an annual basis. While the quarterly data is expected to report a shrink in economic activities by 0.2% against the expansion of 0.8%.
CME Group’s flash data for crude oil futures markets noted traders trimmed their open interest positions by almost 15K contracts at the beginning of the week, reaching the third consecutive daily drop. Volume followed suit and reversed the previous daily build, shrinking by around 61.5K contracts.
WTI: The 200-day SMA caps the upside so far
Monday’s advance to the area above the $90.00 mark was, however, amidst declining open interest and volume, hinting at the idea that the continuation of the uptrend in WTI appears unlikely in the very near term. On this, the 200-day SMA at $95.29 continues to cap occasional bullish attempts for the time being.
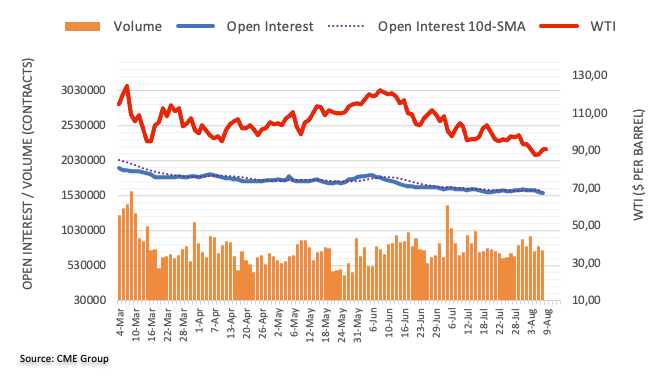
Bank of England (BOE) Deputy Governor Dave Ramsden said in Reuters interview on Tuesday, “more likely than not that we will have to raise bank rate further.”
Additional quotes
I'm going to look at the indicators, look at the evidence as we approach each upcoming meeting.
Not ruling out need to start lowering bank rate quite quickly at some point.
Inflation expectations remain anchored.
We had to act forcefully last week to ensure inflation doesn't become embedded.
We're in extraordinary period where a lot is changing. So, I wouldn't want to make any predictions about where Bank Rate is going to end up.
I'm certainly not ruling out a situation where when we look at the risk to the economy, having been raising Bank Rate, at some point we then have to start lowering it quite quickly.
I can imagine situations, yes, where we'll carry on... with a pace of QT in the background.
Market reaction
At the time of writing, GBP/USD is trading at 1.2085, up 0.12% on the day, little affected by the above comments.
- USD/TRY grinds higher around yearly top, mildly bid of late.
- Inflation woes are stronger in Turkey as CBRT resists rate hike.
- Sluggish session, light calendar limit immediate moves ahead of US CPI.
USD/TRY stays mildly bullish around the intraday high of 17.96 heading into Tuesday’s European session. In doing so, the Turkish lira (TRY) pair remains firmer for the second consecutive day after losing heavily on Friday, as traders brace for Wednesday’s US Consumer Price Index (CPI).
It should be noted, however, that the market’s cautious mood ahead of the key data and a light calendar, restricts the USD/TRY moves of late.
That said, the US 10-year Treasury yields remain inactive at around 2.76%, following nearly seven basis points (bps) of the downside on Monday and a 14-bps run-up on Friday.
With this, the US Dollar Index (DXY) remains inactive near the intraday low surrounding 106.32 ahead of the US Nonfarm Productivity and Unit Labor Costs for the second quarter (Q2). Forecasts suggest that the US Nonfarm Productivity could improve to -4.6% from -7.3% prior while Unit Labor Costs may ease to 9.5% versus 12.6% in previous readings.
However, the comparatively less rate action by the Central Bank of the Republic of Türkiye (CBRT) versus the Fed keeps the USD/TRY bulls hopeful. Hence, the latest Fed fund futures price is nearly 70% odds of another 75 bps rate hike in September. On the other hand, Turkish President Tayyip Erdogan’s preference for no rate hikes appears to keep CBRT adhered to more qualitative means of taming the record inflation, which in turn keeps USD/TRY buyers hopeful.
Technical analysis
An ascending triangle bearish formation joins overbought RSI conditions to tease USD/TRY bears. However, the successful break of $17.875 appears necessary for the bears to retake control. In absence of which the stated triangle’s resistance line near 18.05 could test the bulls ahead of directing them to the late 2021 peak near 18.35.
Gold price clings to the critical downward-sloping 50-Daily Moving Average (DMA) at $1,787 amid pre-US inflation cautious trading. XAUUSD buyers need softer US CPI for a big break above the $1,800 mark, FXStreet’s Dhwani Mehta reports.
Bullion traders to remain non-committal below the $1,800 mark
“A softer US inflation reading could offer the much-needed impetus to gold bulls for crossing the $1,800 threshold, as it would pour cold water on super-sized Fed rate hike expectations.”
“A failure to sustain above the 50 DMA at $1,787 will open up a renewed downside towards the previous day’s low of $1,771, below which the $1,765 demand area will come into play. The August 3 high of $1,754 and the $1,750 psychological level will be on sellers’ radars.”
“Buyers need acceptance above the $1,800 mark to continue with its recovery momentum. Bulls will then guard the July 5 high at $1,812 should the upbeat momentum pick up steam.”
- Oil prices are aiming for a break above $90.00 to trigger a bullish reversal.
- An upbeat US NFP has infused fresh blood into the oil bulls.
- The demand for oil is recovering in China as Covid-19 concerns fade.
West Texas Intermediate (WTI), futures on NYMEX, is attempting to overstep the psychological resistance of $90.00 as investors are expecting a recovery in the demand for oil after the upbeat US Nonfarm Payrolls (NFP). The oil prices are displaying topsy-turvy moves in a tad wider range of $86.37-90.06 from the past week. Now, the black gold is looking to deliver an upside break of the consolidation.
Fresh blood has been infused in the oil prices after the US Bureau of Labor Statistics reported more than double job additions in the labor market against expectations. The street was expecting an increment in the labor market by 250k. However, an uptick by 528k also raised the demand outlook for oil. Higher employment opportunities indicate that the extent of investment by the US corporate players is extremely high, which will eventually improve the oil demand ahead.
Meanwhile, the Chinese economy is recovering from the headwinds of the resurgence of Covid-19. Earlier, the announcement of the zero Covid-19 policy by the Chinese administration had restricted the movement of men, materials, and machines, which resulted in a slump in the oil demand. Now, the normalcy in China has triggered the oil demand forecasts to restoration.
Also, the dragon economy has surprised markets with faster-than-expected growth in oil purchases for July. The world's top crude importer took in 8.79 million barrels per day in July, up from a four-year low in June, but still 9.5% less than a year earlier, as reported by Reuters.
On the supply front, a promise of pumping more oil into the global supply by the OPEC+ is losing its impact. Last week, the oil cartel promised the addition of 100,000 barrels per day (bpd) from September. Considering the oil-producing countries, many players are already failing to cater to the promised output. However, Saudi Arabia and United Arab Emirates (UAE) are carrying the potential to add up production capacity.
- EUR/USD remains sidelined inside one-week-old symmetrical triangle, slowly pares Friday’s losses.
- 200-SMA, monthly horizontal support add to the trading filters.
- Steady RSI hints at further grinding, monthly peak appears last defense for bears.
EUR/USD treads water around 1.0200 heading into Tuesday’s European session, keeping Monday’s mildly positive outlook amid sluggish markets.
However, a one-week-old symmetrical triangle restricts immediate EUR/USD moves amid steady RSI.
Other than the stated triangle’s extremes around 1.0225 and 1.0160, the 200-SMA and a horizontal area including multiple levels marked since July 13 will also challenge EUR/USD moves around 1.0250 and 1.0100-0095.
That said, the monthly peak near the 1.0300 psychological magnet and the 61.8% Fibonacci retracement of July 14 to August 02 upside, near 1.0080, are extra filters for trading the major currency pair.
It’s worth noting that the market’s indecision ahead of the US Consumer Price Index (CPI), up for publishing on Wednesday, also appears to challenge the EUR/USD pair traders. Even so, the recent increase in the hawkish Fed bets and the recently firmer US jobs report, keeps sellers hopeful.
Also read: EUR/USD Forecast: In wait-and-see mode ahead of US CPI
In that case, the parity level and the latest multi-month bottom surrounding 0.9950 should gain major attention.
Meanwhile, recovery moves remain elusive until cross June’s low near 1.0360.
EUR/USD: Four-hour chart
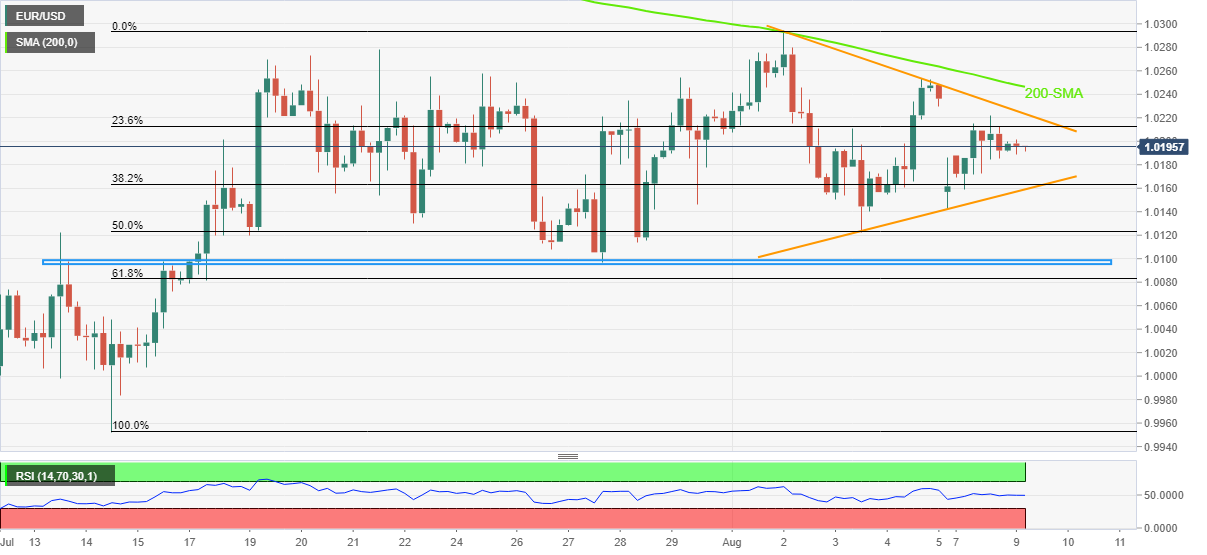
Trend: Sideways
Economist at UOB Group Enrico Tanuwidjaja reviews the latest GDP releases in Indonesia.
Key Takeaways
“Indonesia’s economy expanded by 5.4% y/y in 2Q22, the fastest increase in a year compared to the previous quarter which grew by 5.0%. This is due to further loosening of COVID-19 curbs, amid rising exports boosted by higher commodity prices. On a sequential basis, Indonesia’s economy advanced by 3.7% q/q in 2Q22, beating market consensus of 3.4%, marking the strongest quarterly rebound since 3Q20.”
“Household consumption and investment spending continued to grow, with household consumption in particular registering accelerated growth of 5.5% y/y in 2Q22 vs 4.3% 1Q22. On the other hand, government expenditure sustained its contractionary momentum seen since 1Q22, continuing to shrink in line with fiscal consolidation policies, albeit at a slower rate. Both exports and imports continued their double-digit growth, with exports rising at an increased rate compared to Q1.”
“With headwinds remaining in place on the back of elevated global uncertainty, especially rising inflationary pressures, and expected interest rate hikes by the central bank may dampen the speed of growth trajectory in the near future. As such, we maintain our GDP growth forecasts of 4.8% for 2022 and 5.0% for 2023.”
Open interest in gold futures markets remained choppy and went up by nearly 1.1K contracts on Monday according to preliminary readings from CME Group. Volume, instead, shrank by around 69.7K contracts, reversing the previous day’s build.
Gold remains capped near $1,800
Prices of the ounce troy of gold faltered once again just below the key $1,800 mark at the beginning of the week. The daily uptick was on the back of rising open interest, which is supportive of further upside in the very near term. Hence, extra challenges of this key resistance region should remain well in place for the time being.
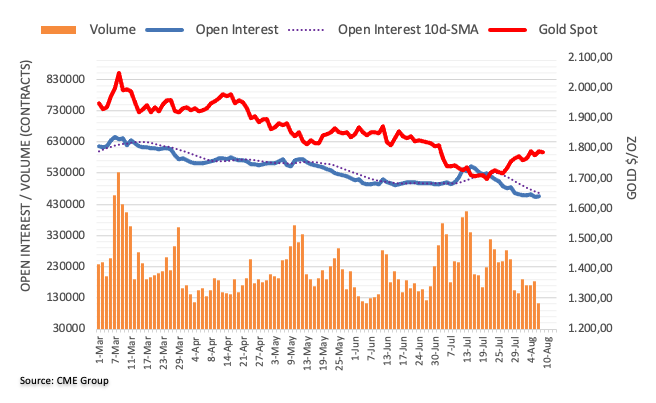
- A Bullish Flag formation is hinting a continuation of the upside journey.
- The asset has entered into a time correction after facing long liquidations around 0.7000.
- Aussie bulls have established above the 200-EMA firmly.
The AUD/USD pair is displaying a time correction after a perpendicular upside move to near the psychological resistance of 0.7000. Earlier, the aussie bulls witnessed a juggernaut rally after defending the weekly lows of 0.6886 on Friday.
On an hourly scale, the asset is forming a Bullish Flag chart pattern that signals a consolidation after an upside move. A typical inventory distribution phase in a bull flag is used for the initiation of longs by those investors, which prefer to enter an auction after an establishment of a bullish bias.
The antipodean is defending the 20-period Exponential Moving Average (EMA) at 0.6974. Also, the asset has managed to establish above the 200-EMA at 0.6954 confidently, which adds to the upside filters.
Meanwhile, the Relative Strength Index (RSI) (14) has shifted back into the 40.00-60.00 range after failing to sustain in the bullish range of 60.00-80.00. The upside still looks favored and a breach above 60.00 will strengthen the aussie bulls further.
A decisive move above the six-week high at 0.7047 will send the major towards the round-level resistance of 0.7100, followed by May 31 high at 0.7204.
Alternatively, a downside break below Wednesday’s low at 0.6885 will drag the asset towards July 15 high at 0.6806. A slippage below July 15 low will trigger the downside risk to July 5 low at 0.6761.
AUD/USD hourly chart
-637956189388903440.png)
- USD/IDR pares Monday’s heavy losses even after strong Indonesia Retail Sales growth for June.
- Indonesia cuts export tax threshold for crude palm oil, government expected 5.00-5.2% GDP growth for 2022.
- Sluggish yields, cautious mood keeps the US dollar on the front foot ahead of Wednesday’s US inflation data.
USD/IDR grinds higher around 14,860, paring the week-start slump, as traders ignore positive catalysts from Indonesia amid anxiety ahead of the US Consumer Price Index (CPI) for July, up for publishing on Wednesday. It’s worth noting that the Indonesia rupiah (IDR) prints 0.20% intraday gains during the early Tuesday morning in Europe.
Among the latest factors, Indonesia's Retail Sales for June and the government’s announcements of the 2022 Gross Domestic Product (GDP) forecast gain major attention. On the same line was news surrounding the cut in export tax threshold for crude palm oil, the nation’s key export item.
Indonesia's Retail Sales rose 4.1% YoY in June versus 2.9% prior readings, per the latest data from the Bank Indonesia (BI).
Elsewhere, “Indonesia's government expects 2022 GDP growth to be in a range of 5% to 5.2%, its deputy finance minister said on Tuesday, after data showed earlier this month that second-quarter growth accelerated to 5.44%, above market expectations,” said Reuters. Furthermore, Indonesia on Tuesday lowered its threshold for applying the export tax on crude palm oil to a reference price of $680 per tonne, down from $750 per tonne previously, according to a finance ministry regulation, Reuters news said.
Alternatively, the US 10-year Treasury yields remain inactive at around 2.75%, following nearly seven basis points (bps) of the downside on Monday and a 14-bps run-up on Friday. The same challenges the US Dollar Index (DXY) ahead of the US Nonfarm Productivity and Unit Labor Costs for the second quarter (Q2). Forecasts suggest that the US Nonfarm Productivity could improve to -4.6% from -7.3% prior while Unit Labor Costs may ease to 9.5% versus 12.6% in previous readings.
Although the second-tier US data may entertain USD/IDR traders, major attention will be on Wednesday’s US CPI as the latest Fed fund futures and Friday’s US jobs report propel the odds of the 75 basis points (bps) rate hike in September, which in turn teases US dollar buyers.
Technical analysis
Despite the latest rebound, USD/IDR remains below the 50-DMA hurdle surrounding 14,930, as well as a downward sloping resistance line from early July near 14,945, which in turn keeps sellers hopeful.
- GBP/JPY remains depressed amid mixed clues, inactive markets.
- Yields seek fresh clues to consolidate Friday’s rally ahead of US inflation.
- UK politics, Brexit woes exert downside pressure amid dormant session.
- Hopes that Japan’s cabinet reshuffle won’t affect BOJ monetary policy test bears.
GBP/JPY remains mildly offered around 163.00 heading into Tuesday’s London open. Even so, the sluggish yields and a light calendar restrict the cross-currency pair’s latest moves.
That said, the US 10-year Treasury yields remain inactive at around 2.75%, following nearly seven basis points (bps) of the downside on Monday and a 14-bps run-up on Friday.
However, nearly 70% odds suggest the Fed’s 75 bps rate hike in September, per Fed fund futures, join Friday’s strong US jobs report and the hawkish Fedspeak to challenge the gold buyers. On the same line could the US-China tussles over Taiwan and recession woes.
Additionally, UK PM Boris Johnson’s refusal of the new cost of living measures until the successor takes office and the news suggesting Brexit pessimism, shared by Reuters, also weigh on the GBP/JPY prices. “Portugal's border agency SEF has faced criticism for delays in issuing post-Brexit ID cards to thousands of British nationals in the country, putting the spotlight on a structural problem that has affected various other migrant communities for years,” said Reuters.
It should be noted that the political uncertainty isn’t limited to the UK as Japanese Prime Minister Fumio Kishida is also up for shuffling the cabinet. However, Finance Minister Shunichi Suzuki is likely to retain his position, which in turn flashes no major challenges for the Bank of Japan’s (BOJ) easy money policies. The same should keep the JPY buyers hopeful.
Against this backdrop, S&P 500 Future print mild gains around 4,150 by the press time, following the mixed performance of Wall Street.
Moving on, Japan’s Machine Tool Orders for July, prior 17.1% will be important for immediate moves. Though, major attention should be given to risk catalysts for clear directions.
Technical analysis
A convergence of the 21-day EMA and the 50-day EMA, around 163.40 by the press time, restricts short-term GBP/JPY advances. The pullback, however, remains elusive until staying beyond the 200-day EMA level surrounding 159.45.
- Asian indices are mixed as investors await US/China inflation data.
- Indian markets are closed on account of Muharram.
- Higher US NFP could conclude the downside pressure on the oil prices.
Markets in the Asian domain are displayed a mixed performance as Chinese indices are performing well ahead of inflation data while Japanese markets have declined. Asian equities are not displaying any decisive signals as investors are expecting persistent cost pressures globally.
At the press time, Japan’s Nikkei225 surrendered 1%, China A50 added 0.30%, and Hang Seng jumped 1%. Indian markets are closed on account of Muharram.
Chinese equities are aiming higher despite higher consensus for the Inflation rate. China’s Consumer Price Index (CPI) is expected to elevate to 2.9% vs. 2.5% released earlier. The Chinese economy is still trying to establish its foot after the resurgence of Covid-19 hit growth forecasts. Now, a higher consensus for price pressures may impact the overall demand and compel the People’s Bank of China (PBOC) to sound neutral on Lending Prime Rate (LPR).
This week, the show stopper event will be the US inflation, which is seen lower at 8.7%, from the prior release of 9.1%. No doubt, an occurrence of the same will be a sigh of relief for the Federal Reserve (Fed) as it will be a crucial exhaustion signal for the soaring inflation rate. Last week’s, upbeat US Nonfarm Payrolls (NFP) improved the stakes for the continuation of a higher inflation rate as a higher release of paychecks will accelerate the overall demand.
Meanwhile, oil prices are attempting to surpass the psychological resistance of $90.00 after remaining balance in the $86.37-90.00 range. Solid employment growth in the US warrants a continuation of investments by the US corporate players, which will bolster demand for oil ahead. This may conclude the downside risk in the oil prices and the asset may find its mojo.
- USD/CAD licks its wound near daily low after Monday’s biggest fall in three weeks.
- RSI divergence, sustained trading below 200-SMA favor bears.
- Bulls need validation from seven-week-old horizontal area to retake control.
USD/CAD holds lower grounds near the intraday bottom, poking a one-week-old support line around 1.2850 during early Tuesday morning in Europe.
In doing so, the Loonie pair justifies the downbeat MACD signals and the bearish divergence portrayed by the RSI (14), the condition where the RSI doesn’t validate the higher high in prices.
With this, the quote is likely to break the immediate support line near 1.2850, which in turn could direct the USD/CAD bears towards the monthly low marked in the last week around 1.2765. However, the 1.2800 threshold may offer an intermediate halt during the fall.
In a case where the pair prices remain weak past 1.2765, the 61.8% Fibonacci Expansion (FE) of July 14 to August 05 moves, near 1.2700, will be in focus.
On the contrary, recovery moves may initially aim for the 200-SMA level surrounding 1.2915 ahead of eying the 1.3000 round figure. It’s worth noting that the recent peak of 1.2985 could also challenge the USD/CAD pair buyers.
It should be observed, however, that the quote’s run-up beyond the 1.3000 threshold needs to cross a horizontal area comprising multiple levels marked since mid-June, around 1.3080-90 to keep the reins.
USD/CAD: Four-hour chart
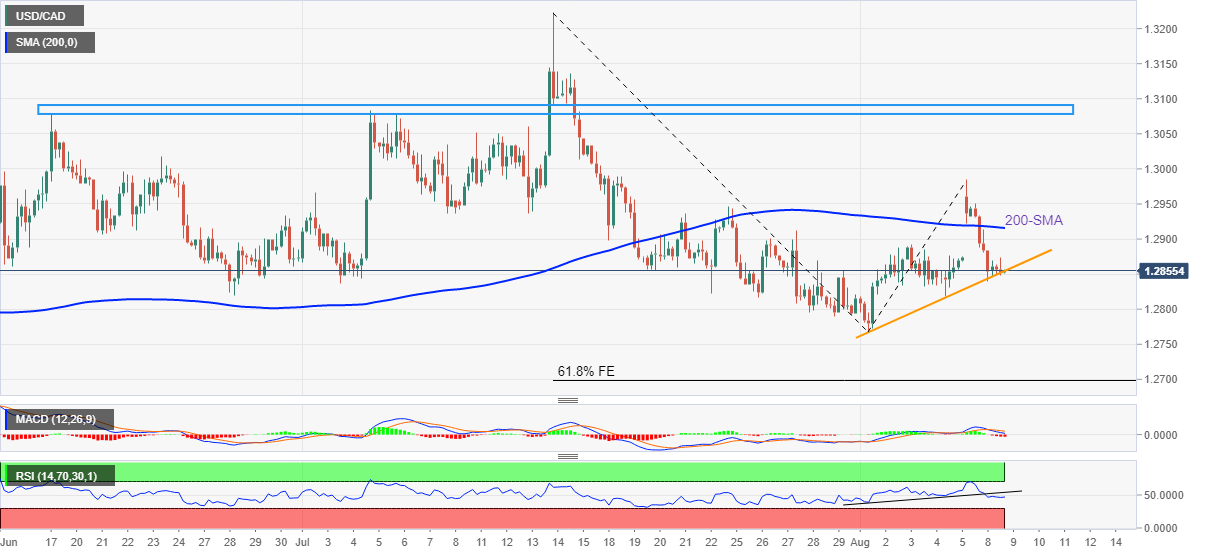
Trend: Further weakness expected
- USD/JPY is likely to contain the immediate hurdle of 135.00 despite a subdued DXY.
- A spree of decline in the US inflation is desired to conclude policy tightening.
- BOJ policymakers are focusing on elevating Labor Cost to keep the inflation rate above 2%.
The USD/JPY pair is eyeing a break above the immediate hurdle of 135.00 despite a lackluster performance by the US dollar index in the Asian session. On a wider note, the asset is displaying topsy-turvy moves in a range of 134.35-135.58 after a vertical upside move from a low near 133.00. It is worth noting that the USD/JPY pair is displaying upside momentum despite a subdued performance by the DXY in the Tokyo session. This indicates that the yen bulls are extremely weaker.
The DXY has auctioned in a narrow range of 106.33-106.41 from the opening. This indicates an inventory distribution, which will be followed by a sheer movement on either side. Considering the upcoming event of Wednesday’s US inflation, an upside break carries more bets. The estimates for price pressures in the US economy have trimmed to 8.7% vs. 9.1% reported in July.
A downside shift in the US Consumer Price Index (CPI) might bring a sigh of relief for US households and the Federal Reserve (Fed). Exhaustion signs in US inflation will infuse fresh blood into the DXY bears. However, for a neutral stance by Fed chair Jerome Powell, a spree of the declining inflation rate is desired.
On the Tokyo front, the Bank of Japan (BOJ) policymakers are worried over the subdued Labor Cost Index as higher wage prices are critical to keeping the inflation rate above 2%. The cumbersome task of keeping the inflation rate above the desired levels despite the prolonged monetary policy easing will keep the yen bulls on the back foot. This week, the spotlight will entirely remain on the US CPI and a higher print than the prior one may force the USD/JPY pair to recapture its all-time high near 139.40.
- Gold price fades bounce off intraday low, pressured below seven-week-old resistance line.
- Cautious optimism fails to impress XAU/USD buyers amid hawkish Fed bets.
- US Q2 Nonfarm Productivity, Unit Labor Costs will decorate calendar ahead of CPI, risk catalysts could direct intraday moves.
Gold price (XAU/USD) struggles to overcome daily losses with the latest bounce to $1,786 during early Tuesday morning in Europe. The metal’s corrective pullback could be linked to the market’s cautious optimism and the recently sluggish yields. However, the hawkish Fed bets and cautious mood ahead of Wednesday’s US Consumer Price Index (CPI) appear to challenge the yellow metal buyers of late.
The recent mild positivity in the markets could be linked to China’s upbeat car sales data for July. The dragon nation marked a 20.1% YoY gain in passenger car sales during July, per china auto industry body CPCA. Considering Beijing’s status as one of the world’s largest gold consumers the data had a double impact on the XAU/USD price.
Additionally, the US 10-year Treasury yields remain inactive at around 2.75%, following nearly seven basis points (bps) of the downside on Monday and a 14-bps run-up on Friday. The same challenges the US Dollar Index (DXY) ahead of the US Nonfarm Productivity and Unit Labor Costs for the second quarter (Q2). Forecasts suggest that the US Nonfarm Productivity could improve to -4.6% from -7.3% prior while Unit Labor Costs may ease to 9.5% versus 12.6% in previous readings.
However, nearly 70% odds suggest the Fed’s 75 bps rate hike in September, per Fed fund futures, join Friday’s strong US jobs report and the hawkish Fedspeak to challenge the gold buyers. On the same line could the US-China tussles over Taiwan and recession woes.
Amid these plays, S&P 500 Future print mild gains around 4,150 by the press time, following the mixed performance of Wall Street.
Given the presence of the second-tier US job numbers, the XAU/USD prices may remain lackluster ahead of the data. However, major attention will be given to the US CPI, as well as the aforementioned risk catalysts for clear directions.
Technical analysis
Gold price retreated from a downward sloping resistance line from mid-June as the RSI (14) diverges with the price moves, suggesting further weakness of the XAU/USD.
However, a convergence of the two-week-old support line and the 50% Fibonacci retracement of the June-July downside, around $1,780, challenges the metal’s short-term downside.
Even if the quote drops below $1,780, the 50-SMA and an upward sloping trend line from July 21, close to $1,767, will be crucial to watch for further downside.
Alternatively, an upside clearance of the seven-week-old descending resistance line, around $1,792 by the press time, needs validation from the 61.8% Fibonacci retracement level of $1,803 to recall the buyers.
Overall, gold price remains weak but the downside room appears limited.
Gold: Four-hour chart
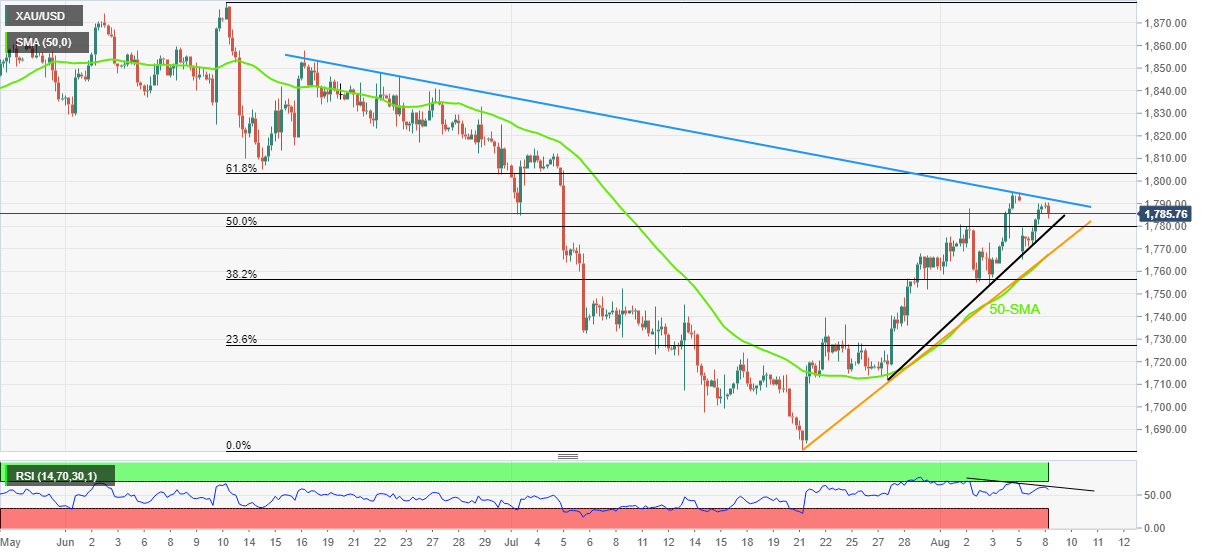
Trend: Limited downside expected
Analysts at Goldman Sachs offer a bullish outlook on USD/JPY, with a target set close to 140.00 again.
Key quotes
"After last week's rates rally, we see upside risks to USD/JPY on a tactical horizon, as our rates strategists think risks to real yields are still skewed to the upside, which should continue to exert more influence over the Yen than recession risks, and our models suggest USD/JPY could rise close to 140 again under our baseline scenario of 10y yields rising to 3.3% by the end of the year."
"Over the longer run, we still think there is a case for JPY appreciation resulting from a significant slowdown in the US that drives yields lower or a change in the BOJ's monetary policy, which is currently holding JPY at deeply undervalued levels on our models."
- GBP/USD fades the previous day’s corrective pullback, recently bounces off daily low.
- Impending concerns over UK economic conditions amid political vacuum, Brexit-led red tape weighs on cable.
- US dollar struggles as yields fail to recover ahead of the US inflation.
- Second-tier US data, UK’s political and Brexit headlines will be crucial for near-term directions.
GBP/USD picks up bids to 1.2085 to reverse the early Asian session losses during the initial European morning on Tuesday. The cable pair’s latest previous weakness could be linked to the political and Brexit-linked worries in the UK. However, the US dollar’s failure to rebound, amid sluggish yields, joins the firmer UK data to favor the quotes’ recent bounce.
Earlier in the day, the UK’s BRC Like-for-Like Retail Sales for July rose 1.6% YoY versus -8.4% expected and -1.3% prior. Even so, the Financial Times (FT) said, “UK consumer spending defied talk of recession in July, data from industry bodies showed on Tuesday, but it still failed to match the pace of overall inflation.”
On the other hand, UK Prime Minister’s (PM) race appears to pose bigger challenges to the British economy as Reuters mentioned, “Prime Minister Boris Johnson came under heavy criticism on Monday for allowing a political vacuum at the heart of his government to threaten an even deeper economic crisis in Britain before his successor takes office in September.” The reason could be linked to the UK PM Boris Johnson’s refusal of the new cost of living measures until the successor takes office.
Elsewhere, Brexit woes and the Bank of England’s (BOE) gloomy economic outlook weigh on the GBP/USD prices. “Portugal's border agency SEF has faced criticism for delays in issuing post-Brexit ID cards to thousands of British nationals in the country, putting the spotlight on a structural problem that has affected various other migrant communities for years,” said Reuters.
It should be noted that the US 10-year Treasury yields remain inactive at around 2.75%, following nearly seven basis points (bps) of the downside on Monday and a 14-bps run-up on Friday. The same challenges the US Dollar Index (DXY) ahead of the US Nonfarm Productivity and Unit Labor Costs for the second quarter (Q2). Forecasts suggest that the US Nonfarm Productivity could improve to -4.6% from -7.3% prior while Unit Labor Costs may ease to 9.5% versus 12.6% in previous readings.
Other than the US data, headlines surrounding UK politics, Brexit and the US-China tussles over Taiwan should be watched carefully ahead of the US Consumer Price Index (CPI) for July, up for publishing on Wednesday.
Technical analysis
GBP/USD pokes the 200-SMA support while fading the bounce off the 38.2% Fibonacci retracement of the June 16 to July 14 downturn. Given the bearish MACD signals and the recently downward sloping RSI (14), the pair is likely to remain pressured.
However, the aforementioned key SMA and the Fibonacci retracement levels, respectively neat 1.2060 and 1.2000, will be tough nuts to crack for the bears before retaking control.
- EUR/USD is displaying back and forth moves in a 1.0188-1.0194 range as investors await US CPI.
- Fed policymakers need a series of declines in inflation rates rather than a one-time slowdown.
- The German HICP is expected to remain unchanged at 8.5%.
The EUR/USD pair is juggling in a narrow range of 1.0188-1.0194 in the Asian session. The asset has declined marginally after attempting a break above the psychological hurdle of 1.0200. On a broader note, the asset is advancing modestly after printing a low of 1.0146 last week.
Investors are preferring to remain on the sidelines as the release of the US Consumer Price Index (CPI) on Wednesday will unfold a decisive move for the major. Due to declining oil prices amid a temporary fix in supply worries and recession fears, the market participants have trimmed the US inflation forecasts.
The annual US CPI is seen lower at 8.7% than the prior release of 9.1%. Soaring oil prices after the Russia-Ukraine war was a major reason behind a steep rise in price pressures. Now, softer oil prices in July are bound to display a temporary slowdown in the inflation rate. A one-time decline in the price rise index is not going to delight the Federal Reserve (Fed) as a series of drops is necessary to conclude policy tightening measures.
On the Eurozone front, the entire focus will remain on German inflation data. Being, a core member of the European Union, the German Harmonized Index of Consumer Prices (HICP) holds significant importance. As per the market consensus, the economic data is likely to remain unchanged at 8.5%. However, this doesn’t trim the odds of a rate hike by the European Central Bank (ECB) in the September monetary policy meeting.
Taiwan's Foreign Minister said in a statement on Tuesday, China's military exercises near the country have hindered one of the busiest routes shipping routes in the world.
Additional quotes
The Chinese drills are preparation for an invasion of Taiwan.
Drills a gross violation of international law.
Taiwan has the right to maintain relationships with other countries.
Taiwan has the right to participate in the international community.
Chin is targeting Taiwan at present but its ambitions go beyond Taiwan.
These comments come after the Eastern Theater Command of China's People's Liberation Army said on social media Weibo that it is continuing drills in the seas and skies around Taiwan on Monday.
Market reaction
At the time of writing, AUD/USD is fluctuating between gains and losses below 0.7000 amid a mixed market mood, as all eyes remain on Wednesday’s US inflation report.
- Steel prices are eyeing more recovery in prices as demand rebounds.
- China’s decarbonization goals are likely to trim in the second half of CY2022.
- This week, China’s inflation data will be of utmost importance.
Steel prices have rebounded sharply after bottoming out in July as demand forecasts have improved after robust iron ore purchases in July. China’s iron ore purchases have risen by 3.1% in July from a year earlier and by 3% on monthly basis. The conclusion of the monsoon season in various provinces of China and other parts of Asia has compelled the think tanks in the market to step up their forecasts for steel demand.
Earlier, steel prices were declining abruptly on China’s ailing real estate sector and decarbonization goals. Construction activities for domestic real estate and infrastructure were halted whose consequences were faced by steel mill owners. The steel mill owners were facing losses due to a pile-up of steel stockpiles. Therefore, a halt in production was relevant for them rather than continue operating the furnace.
Also, the market participants are hoping that decarbonization goals in China will decline and the steel mill owners would be able to accelerate productivity.
On the economic data front, investors are awaiting the release of China’s Consumer Price Index (CPI), which is due on Wednesday. As per the market consensus, China’s inflation is expected to shift higher to 2.9% from the prior release of 2.5%. An increment by 40 basis points (bps) could force the People’s Bank of China to sound neutral rather than featuring a dovish stance. This might have a significant on the steel prices ahead.
Citigroup strategists led by Andrew Hollenhorst said in their latest client note, doors are open for a full percentage point rate hike after the US Nonfarm Payrolls blowout.
Key quotes
“The surprisingly strong jobs report, coupled with faster-than-expected wage growth, could "make a 75 basis-point hike in September very likely and raise the potential for further super-sized increases."
"Our base case remains for a 75 basis-point hike in September, but we would not be too surprised by a 100 basis-point hike if core inflation comes in stronger than expected."
The People's Bank of China is unlikely to lower interest rates or the Reserve Requirement Ration (RRR), China’s state media reported on Tuesday.
Separately, citing analysts, the Securities Daily reported, “China is expected to further increase its use of pro-growth policies, with fiscal and monetary policy becoming fully coordinated in the second half of 2022.”
Meanwhile, China Daily carried a story, citing that the country’s “electricity consumption, a key barometer of economic activity, has been rising in recent periods, indicating the continuous recovery of production and economic operations.”
The recovery in the growth rate of electricity consumption in June reflected the positive effects of the current resumption of work and production, said Wang Yixuan, an official with the China Electricity Council.
Related reads
- AUD/USD slides towards 0.6950 despite firmer Aussie NAB data, US inflation eyed
- Sino-US interest rate gap to remain inverted for a long time, cut to RRR unlikely
| Raw materials | Closed | Change, % |
|---|---|---|
| Silver | 20.663 | 4.04 |
| Gold | 1789.43 | 0.91 |
| Palladium | 2231.85 | 4.95 |
- AUD/USD pares the biggest daily gains, holds lower ground near intraday low of late.
- Aussie NAB data came in firmer for July but August month Westpac Consumer Sentiment was softer.
- Risk-on mood fades amid hawkish Fed bets, pause in yields’ downside.
- Second-tier US employment data, risk catalysts will be important for fresh impulse.
AUD/USD holds remains depressed at around 0.6980, fading the bounce off intraday low near 0.6970, amid mixed Aussie data and sluggish markets during Tuesday’s Asian session. It’s worth noting, however, that the US dollar rebound and the cautious mood ahead of the US inflation data keep the pair sellers hopeful.
National Australia Bank’s Business Conditions and Business Confidence data for July printed upbeat results as the former rose to 20, versus 15 market consensus and 13 prior. That said, Business Confidence matched 7 forecasts while rising past 1 prior. On the contrary, Westpac Consumer Confidence Index for August eased to 81.2, below 83.8 prior.
Elsewhere, China marked a 20.1% YoY gain in passenger car sales during July, per china auto industry body CPCA.
It’s worth noting that the firmer odds favoring the Fed’s 0.75% rate hike in September join the Sino-American tussles over Taiwan to weigh on the market sentiment and exert additional downside pressure on the AUD/USD prices. Recently, US President Joe Biden’s dislike for China’s aggression towards recapturing Taiwan and criticism of House Speaker Nancy Pelosi’s visit to Taipei seemed to have probed the market optimists.
Amid these plays, the US 10-year Treasury yields remain inactive at around 2.75%, following nearly seven basis points (bps) of the downside on Monday and a 14-bps run-up on Friday. Also, S&P 500 Future trim early Asian session gains around 4,145 by the press time.
Looking forward, the US Nonfarm Productivity and Unit Labor Costs for the second quarter (Q2) could entertain AUD/USD traders. Forecasts suggest that the US Nonfarm Productivity could improve to -4.6% from -7.3% prior while Unit Labor Costs may ease to 9.5% versus 12.6% in previous readings.
Also read: US CPI Preview: It is the hard core that counts, five scenarios for critical inflation data
Technical analysis
AUD/USD seesaws between the 50-DMA and the downward sloping resistance line from late April. Given the firmer RSI and the lack of bearish MACD signals, the recent upside momentum of the pair is likely to extend.
However, a daily closing beyond the aforementioned resistance line, at 0.7025 by the press time, appears necessary for the bulls to keep reins. On the flip side, a break of the 50-DMA support near 0.6880 isn’t an open invitation to the AUD/USD bears as the resistance-turned-support from early April, at 0.6855 at the latest, will challenge the downside moves.
- AUD/JPY bears are on the prowl but the bulls are moving in.
- The price action could be dictated by the reversion patterns across multi time frames.
AUD/JPY is correcting following the two-day rally. The following illustrates the prospects of a reversion into the 92.50 area based upon a reversion pattern that is taking shape on the daily candlesticks.
AUD/JPY daily chart
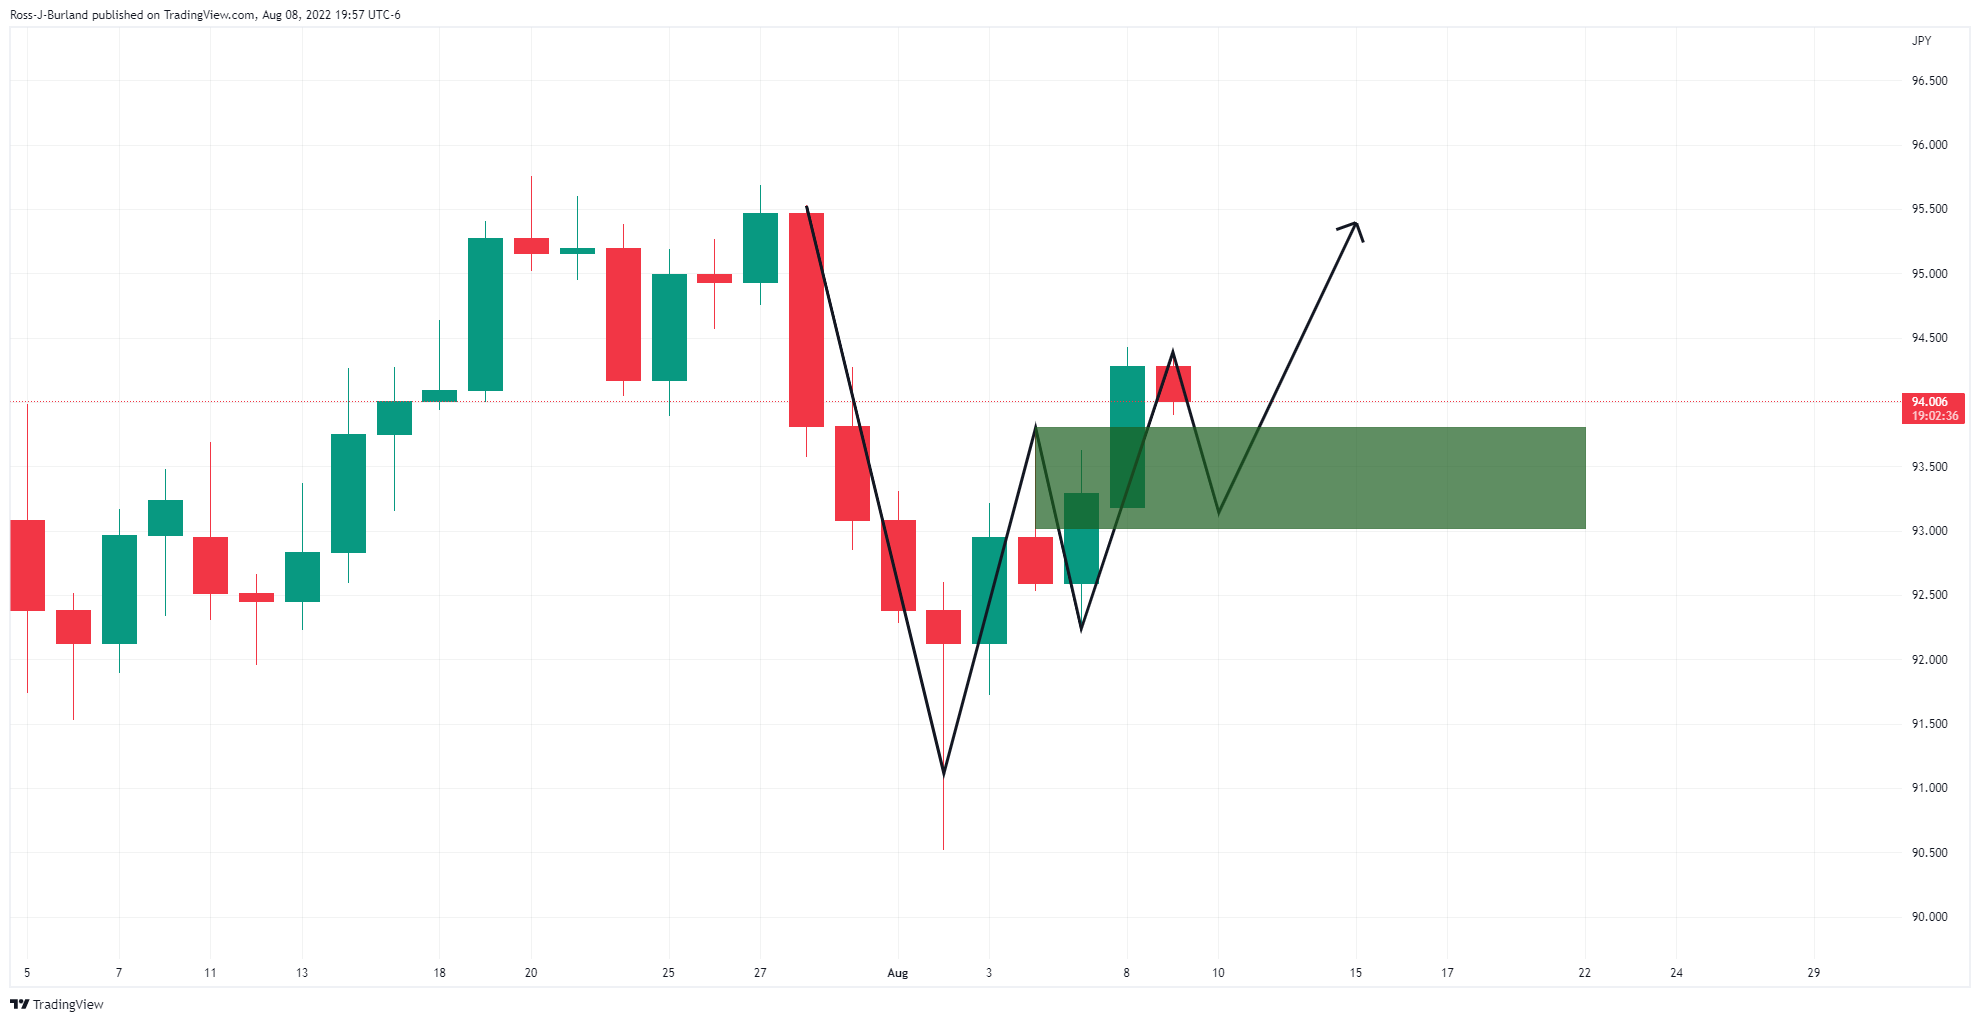
As illustrated above, we have a W-formation. The price is headed to the 23.6% Fibonacci level, which is not quite as significant as the cluster of the 38.2%, 50% mean reversion and the golden 61.8% below there:
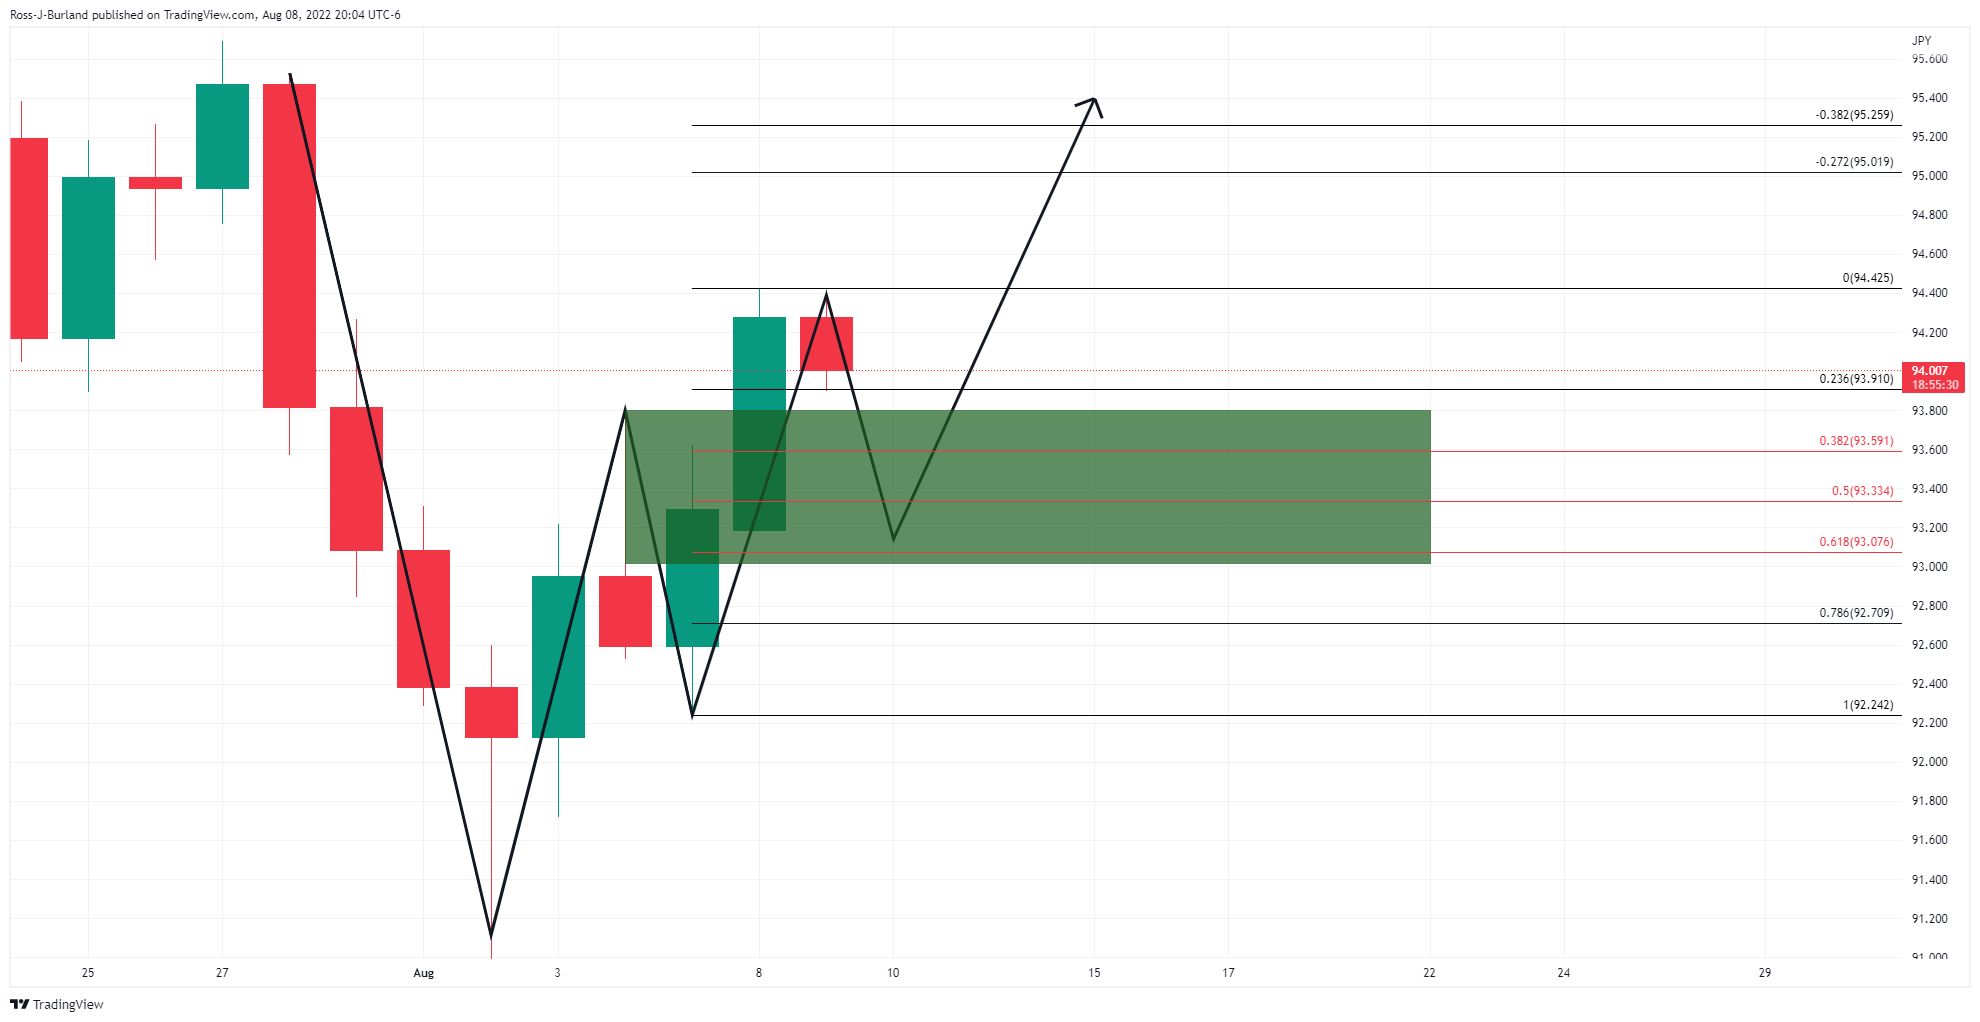
AUD/JPY H1 chart
The hourly chart's M-formation is just as compelling:
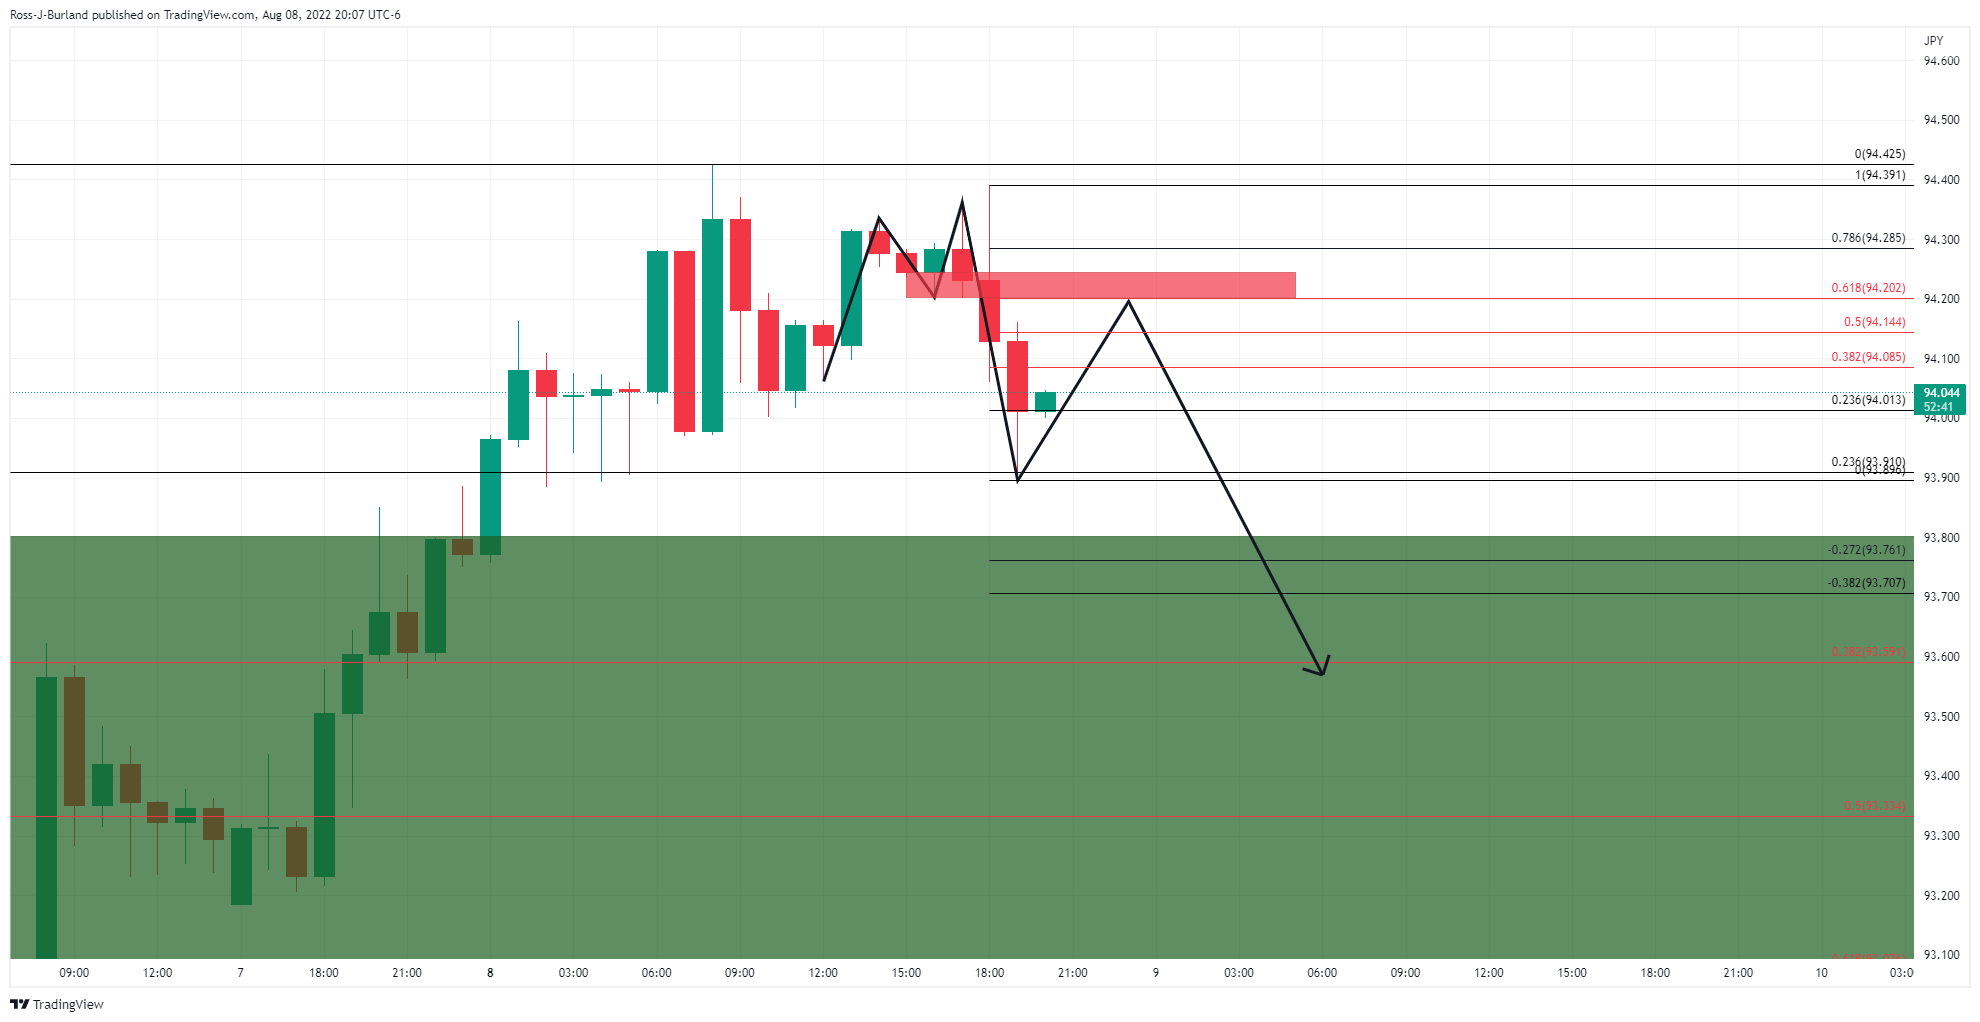
The price would be expected to now move into the neckline which could act as a resistance that would encourage the bears in at a discount.
- USD/CHF fades corrective pullback from one-week bottom marked the previous day.
- Sustained break of short-term ascending trend line, bearish MACD signals favor sellers.
- Bulls need validation from the 200-SMA to retake control.
USD/CHF remains depressed around 0.9550 amid a sluggish Asian session on Tuesday. Even so, the sellers remain hopeful while tracing a downside break of a one-week-old ascending trend line.
In addition to the weekly support break, the bearish MACD signals and the pair’s sustained trading below the 200-SMA also favor USD/CHF sellers.
That said, the pair is all set to challenge the yearly low surrounding 0.9470, with the 0.9500 threshold likely acting as an intermediate halt.
In a case where USD/CHF bears dominate past 0.9470, the 61.8% Fibonacci Expansion (FE) of July 14 to August 03 moves, near 0.9390, will be in focus.
Alternatively, the previous support line from August 02, close to 0.9565 at the latest, guards the quote’s recovery moves.
However, major attention will be given to the 200-SMA level of 0.9650 as a successful break above the same could enable USD/CHF bulls to aim for the late July swing high around 0.9740.
Overall, USD/CHF is likely to remain on the bear’s radar despite the latest inaction.
USD/CHF: Four-hour chart

Trend: Further downside expected
- USD/CAD renews intraday high to consolidate the biggest daily loss in three weeks.
- Geopolitical fears, US dollar retreat enabled oil’s rebound from multi-day low.
- Sluggish session, light calendar allows traders to pare recent moves.
- US CPI for July is the key, second-tier data, risk catalysts may entertain intraday traders.
USD/CAD licks its wounds as it renews daily tops near 1.2870 while paring the biggest loss since July 19 during Tuesday’s Asian session.
The loonie pair dropped the most in three weeks the previous as a recovery in prices of Canada’s main export, WTI crude oil, joined a pullback in the US dollar. Also exerting downside pressure on the USD/CAD prices was the cautious optimism in the markets ahead of the US Consumer Price Index (CPI) for July, up for publishing on Wednesday.
That said, the WTI crude oil rose by near 2.0% to $89.70 the previous day, around $90.20 by the press time. The black gold prices might have cheered firmer China trade numbers and cautious optimism in the markets to recover while ignoring hopes of more output from Iran.
On the other hand, US Dollar Index (DXY) traced Treasury yields to consolidate Friday’s heavy gains that offered the greenback gauge the first weekly positive in three. That said, the DXY registered a 0.19% daily loss to 106.37 by the end of Monday whereas the US 10-year Treasury yields dropped nearly seven basis points (bps) to 2.75% at the latest, following a 14-bps run-up the previous day.
It’s worth noting that the market’s previous risk-on mood appears to have faded of late as US President Joe Biden raised concerns over China’s actions near the Taiwan border. On the same line were fears of the Fed’s aggression and economic slowdown. Considering Friday’s strong US jobs report, versus mixed employment data from Canada, the Fed funds futures price in a 69% chance of another 75 bps rate hike in September, per Reuters.
While portraying the mood, S&P 500 Future trim early Asian session gains around 4,145 by the press time.
Moving on, the US Nonfarm Productivity and Unit Labor Costs for the second quarter (Q2) could entertain USD/JPY traders. Forecasts suggest that the US Nonfarm Productivity could improve to -4.6% from -7.3% prior while Unit Labor Costs may ease to 9.5% versus 12.6% previous readings.
Also read: US CPI Preview: It is the hard core that counts, five scenarios for critical inflation data
Technical analysis
An impending bull cross on the MACD joins steady RSI (14) to support the USD/CAD buyers unless the quote breaks an upward sloping trend line from early June, close to 1.2835. That said, recovery remains limited as the five-week-old horizontal area near 1.2930-35 challenges the upside momentum.
In recent trade today, the People’s Bank of China (PBOC) set the yuan (CNY) at 6.7584 vs. the last close of 6.7508.
About the fix
China maintains strict control of the yuan’s rate on the mainland.
The onshore yuan (CNY) differs from the offshore one (CNH) in trading restrictions, this last one is not as tightly controlled.
Each morning, the People’s Bank of China (PBOC) sets a so-called daily midpoint fix, based on the yuan’s previous day's closing level and quotations taken from the inter-bank dealer.
- NZD/USD bulls eye 0.6550 resistance and between 0.6645 and 0.6720 higher up.
- The bears target a break below 0.6190.
While NZD/USD recovered from Friday's collapse, it remains bound by key resistance and support on the daily chart and has not managed to break the seal of 0.63 the figure so far this week. The following illustrates the sideways range and prospects of breaks of key structure levels.
NZD/USD Price Analysis
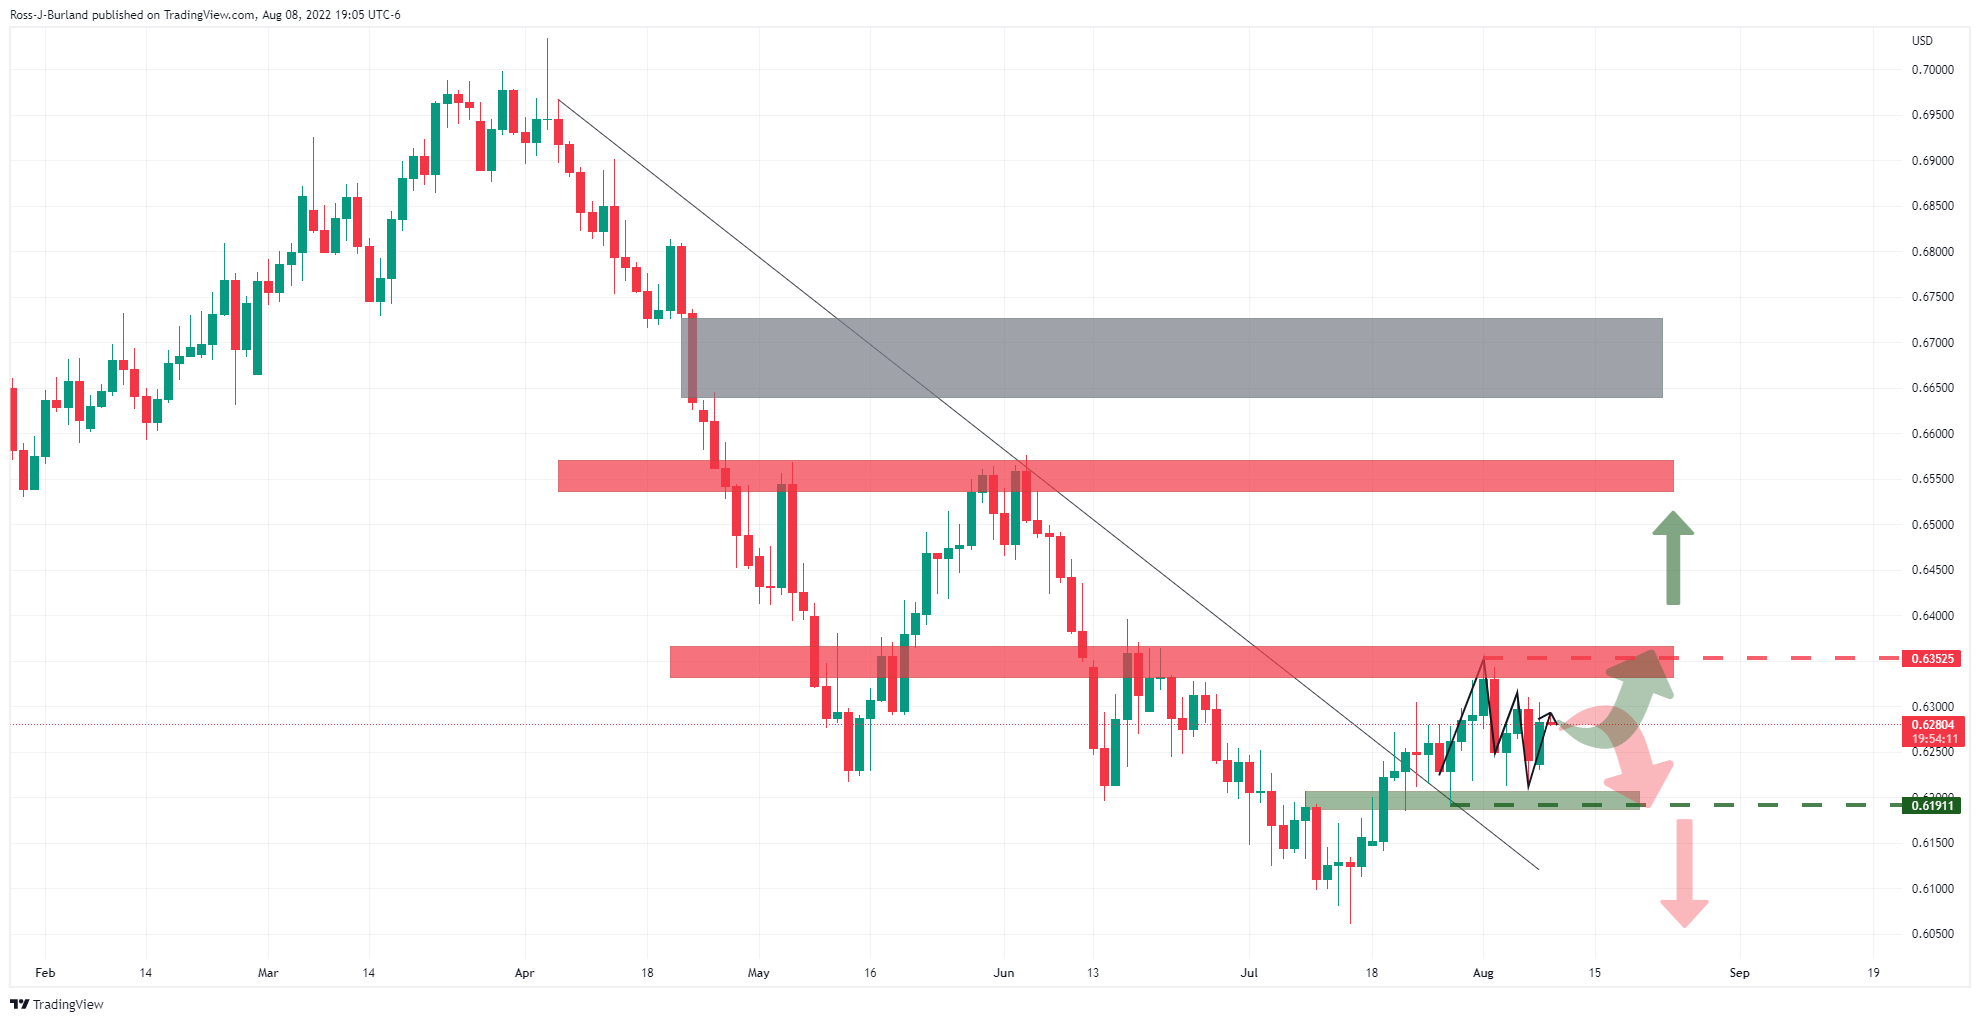
The bulls need to get above 0.6350 and the bears below 0.6190. 0.6280, meanwhile guards the upside of that range following the reversion to the neckline of the M-formation.
To the upside, in a full-on breakout of the trendline resistance that the price is accumulating outside of, there is an area of price imbalance that could well be targetted once 0.6550 resistance is overcome. That area is between 0.6645 and 0.6720.
- Gold price is advancing towards $1,800 as the US CPI is seen lower at 8.7%.
- The inflation rate is required to display a series of downward shifts to claim exhaustion.
- Gold price as defended the 20-EMA while the 50-EMA has remained untouched in a corrective move.
Gold price (XAU/USD) has slowed down its upside momentum after printing a high above $1,790.00 in the Asian session. The upside momentum has not been exhausted yet and the precious metal is balancing in a higher market profile after a sheer rally. The bright metal is advancing towards the psychological resistance of $1,800.00 on lower estimates for the US Consumer Price Index (CPI).
As per the market consensus, the US Consumer Price Index (CPI) is likely to trim to 8.7% from the prior release of 9.1%. A drop by 40 basis points in the consensus is backed by declining oil prices over the past few weeks. The black gold lost its mojo on accelerating recession fears and trimming supply worries. This may delight the Federal Reserve (Fed) to head a little soft this time on interest rates.
Investors should be aware of the fact that a one-time decline in the price pressures doesn’t warrant that the laborious job for the Federal Reserve (Fed) is over. The inflation rate is required to display a series of downward shifts to claim that the price pressures have exhausted.
Gold technical analysis
The gold prices have rebounded sharply after sensing bids around the lower portion of the Rising Channel formed on a four-hour scale. The upper portion of the above-mentioned chart pattern is placed from July 22 high at $1,739.37 while the lower portion is plotted from July 27 low at $1,711.55.
The gold bulls have defended the 20-period Exponential Moving Average (EMA) at $1,775.50. While, the 50-EMA at $1,767.11 has remained untouched despite a corrective move, which indicates that the short-term trend is extremely bullish.
Adding to that, the Relative Strength Index (RSI) (14) has attempted a break above 60.00 and an establishment above the same will strengthen the gold bulls further.
Gold four-hour chart
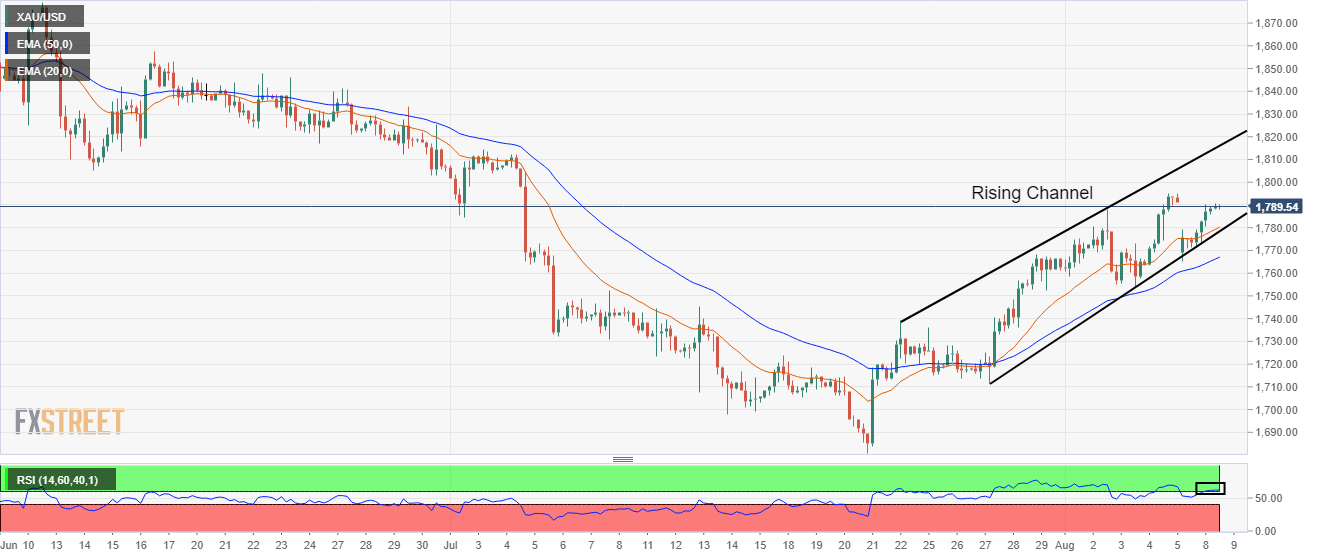
- USD/JPY remains depressed after rising to one-week high on Friday, mildly offered of late.
- Yields pare post-NFP gains as traders brace for Wednesday’s US CPI.
- Fears surrounding Russia, Taiwan join mixed Japan data to also cap the upside.
- Japan Machine Tool Orders, second-tier US employment data will decorate the calendar.
USD/JPY struggles for clear directions, after beginning the week on a mildly negative footing, as it bounces off an intraday low near 134.75 during the initial hours of Tuesday’s Tokyo open.
The yen pair’s latest inaction could be linked to the sluggish markets, a light calendar in Asia and the cautious mood ahead of the US Consumer Price Index (CPI) for July, up for publishing on Wednesday. Also challenging the USD/JPY moves are the recently sidelined US Treasury yields, after the previous day’s fall.
That said, the US 10-year Treasury yields dropped nearly seven basis points (bps) to 2.75% at the latest, following a 14-bps run-up on Friday. The pullback in yields can be attributed to the market’s positioning ahead of the key US inflation data.
Even so, the Fed funds futures price in 69% chance of another 75 bps rate hike in September, per Reuters, which in turn keeps the USD/JPY bulls hopeful. It should be noted that the recent increase in the US inflation expectations, per the 10-year breakeven inflation rate per the St. Louis Federal Reserve (FRED) data, also underpins the cautious optimism of the USD/JPY buyers.
It should be noted that Japan’s first current account deficit in five months joined the downbeat Trade Balance for June to weigh on the USD/JPY prices.
Amid these plays, Wall Street began Monday’s trading on a firmer footing before closing mixed whereas the S&P 500 Futures print mild gains by the press time.
Given the market’s inaction and a light calendar, USD/JPY prices may witness inaction ahead of Japan’s Machine Tool Orders for July, prior 17.1%. Following that, the US Nonfarm Productivity and Unit Labor Costs for the second quarter (Q2) could entertain USD/JPY traders. Forecasts suggest that the US Nonfarm Productivity could improve to -4.6% from -7.3% prior while Unit Labor Costs may ease to 9.5% versus 12.6% previous readings.
Above all, chatters surrounding China, Taiwan and the US CPI, as well as the Fed’s rate hike in September, will be important to track for clear directions.
Also read: US CPI Preview: It is the hard core that counts, five scenarios for critical inflation data
Technical analysis
USD/JPY sellers await a clear downside break of the weekly support line, around 133.90 by the press time, to retake control. On the contrary, the 50-DMA and a three-week-old resistance line, respectively around 135.15 and 135.50, restrict the short-term upside of the pair. It’s worth noting that the pair buyers remain hopeful until the quote stays beyond the 100-DMA support of 131.00.
- AUD/USD remains sidelined between 50-DMA and downward sloping resistance line from late April.
- Sustained break of four-month-old previous resistance joins firmer RSI to keep buyers hopeful.
- Successful trading beyond 200-DMA becomes necessary to reverse the downtrend from April.
AUD/USD remains idle around d 0.7000 as traders await fresh signals during Tuesday’s Asian session, after the upbeat start of the week.
In doing so, the Aussie pair seesaws between the 50-DMA and the downward sloping resistance line from late April. Given the firmer RSI and the lack of bearish MACD signals, the recent upside momentum of the pair is likely to extend.
However, a daily closing beyond the aforementioned resistance line, at 0.7025 by the press time, appears necessary for the AUD/USD bulls to keep reins.
Following that, the 38.2% Fibonacci retracement of the April-July downturn and the 200-DMA, respectively near 0.7060 and 0.7125 will gain the market’s attention.
On the flip side, a break of the 50-DMA support near 0.6880 isn’t an open invitation to the AUD/USD bears as the resistance-turned-support from early April, at 0.6855 at the latest, will challenge the downside moves.
In a case where the AUD/USD prices remain weak past 0.6885, the odds of witnessing a south-run towards the yearly low marked in July around 0.6680 can’t be ruled out.
AUD/USD: Daily chart
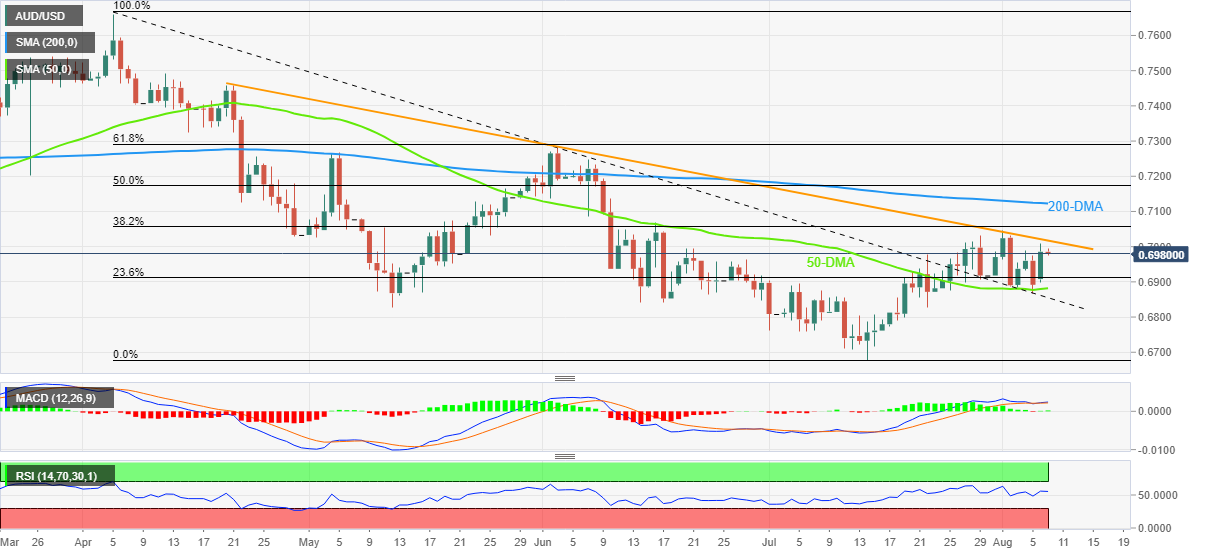
Trend: Limited upside expected
- Pre-anxiety for Wednesday’s US CPI is supporting the DXY bulls.
- Softer oil prices have trimmed the consensus for the US Inflation rate.
- Higher US NFP has delighted the Fed for handling a higher inflation rate.
The US dollar index (DXY) is expected to conclude its pullback move sooner and may continue its upside journey if it manages to surpass the critical hurdle of 106.50 confidently. On Monday, the asset was corrected after printing a high of 106.45. The DXY defended the crucial support of 106.000 and picked bids significantly.
Lower consensus for US CPI
Considering the preliminary estimates for US Inflation, the price rise index will slip to 8.7% from the former figure of 9.1%. July’s softer oil prices are responsible for a downward shift in inflation consensus. The investing community is aware of the fact that the volatile oil prices were driving the price rise index higher. Now, downbeat oil prices are clearly diminishing the inflation forecasts Whereas the core CPI that doesn’t inculcate volatile oil and food products is expected to elevate to 6.1% from the prior release of 5.9%.
Winter may over for the Fed
The US Nonfarm Payrolls (NFP) remained upbeat last week despite lower investment by the US corporate players due to costly dollars after higher borrowing rates and a halt in the recruitment process by the same. Federal Reserve (Fed) policymakers were worried that the unavailability of support from the US labor data will escalate troubles in an already troublesome job. Now, the upbeat labor data along with exhaustion signals in the inflation rate will trim the concerns about handling a higher inflation rate.
The Securities Daily reported on an interview with In an interview with a reporter from Securities Daily, Wu Chaoming, deputy dean of the Financial and Information Research Institute
Wu Chaoming believes that while there is a low possibility of lowering the reserve ratio and interest rate in the future due to the influence of factors such as the Sino-US interest rate gap that will remain inverted for a long time, the pressure of domestic price stabilization and the lack of demand restricting the effect of monetary easing.
"Considering that inflation pressure is likely to pick up in the third and fourth quarters, and other major economies may continue to maintain the basic policy stance of raising interest rates, the possibility of a comprehensive rate cut and RRR cut in the second half of the year is low, but the loan market quoted rate (LPR) remains unchanged.
There may be asymmetric downward adjustments, and the trend of 'quantity easing and price parity' with loose funds and a steady decline in real loan interest rates can be expected." Pang Ming, Chief Economist and Head of Research Department of Jones Lang LaSalle Greater China said.
| Index | Change, points | Closed | Change, % |
|---|---|---|---|
| NIKKEI 225 | 73.37 | 28249.24 | 0.26 |
| Hang Seng | -156.17 | 20045.77 | -0.77 |
| KOSPI | 2.3 | 2493.1 | 0.09 |
| ASX 200 | 5 | 7020.6 | 0.07 |
| FTSE 100 | 42.67 | 7482.37 | 0.57 |
| DAX | 113.76 | 13687.69 | 0.84 |
| CAC 40 | 52.09 | 6524.44 | 0.8 |
| Dow Jones | 29.07 | 32832.54 | 0.09 |
| S&P 500 | -5.13 | 4140.06 | -0.12 |
| NASDAQ Composite | -13.09 | 12644.46 | -0.1 |
- AUD/NZD bounded by key daily swing lows, price imbalance between 1.1080 and 1.1091 eyed.
- RBNZ is expected to hike by 50bps at the next meeting.
AUD/NZD is flat in the Tokyo open and has ranged between 1.1091 and 1.1115 on the day so far following the Reserve Bank of New Zealand's inflation expectations at the start of the week and solid Chinese data.
Analysts at Westpac explained that the easing in inflation expectations will leave the RBNZ feeling more comfortable that the risks of high inflation becoming embedded in the economy are easing off. ''That is particularly important given the current multi-decade high in actual inflation and related risks of a wage-price spiral,'' the analysts said.
However, the analysts also explained that the survey ''still points to strong inflation pressures in the New Zealand economy and reinforces the case for rate rises. We’re forecasting another 50bp rise at next week’s RBNZ policy meeting.''
Meanwhile, the Kiwi recovered and has fully erased snap losses seen in the wake of strong US Nonfarm Payrolls data from Frida. US bond yields have moderated, enabling risk to recover and resulting in softness in the greenback. Analysts at ANZ Bank said that the latest bout of NZD strength looks to be on the back of the stronger AUD, which is back on the front foot as markets digest solid Chinese trade data.
''Looking ahead, it seems a stretch to expect the NZD to go too far ahead of key US July Consumer Price data out tomorrow night. This data is set to be complicated as while we may see a moderation in headline annual inflation, monthly core readings are expected to remain elevated, and this is the Fed (and US bond market’s) real issue. Whether that sees a return of USD strength will depend on the detail.''
AUD/NZD technical analysis
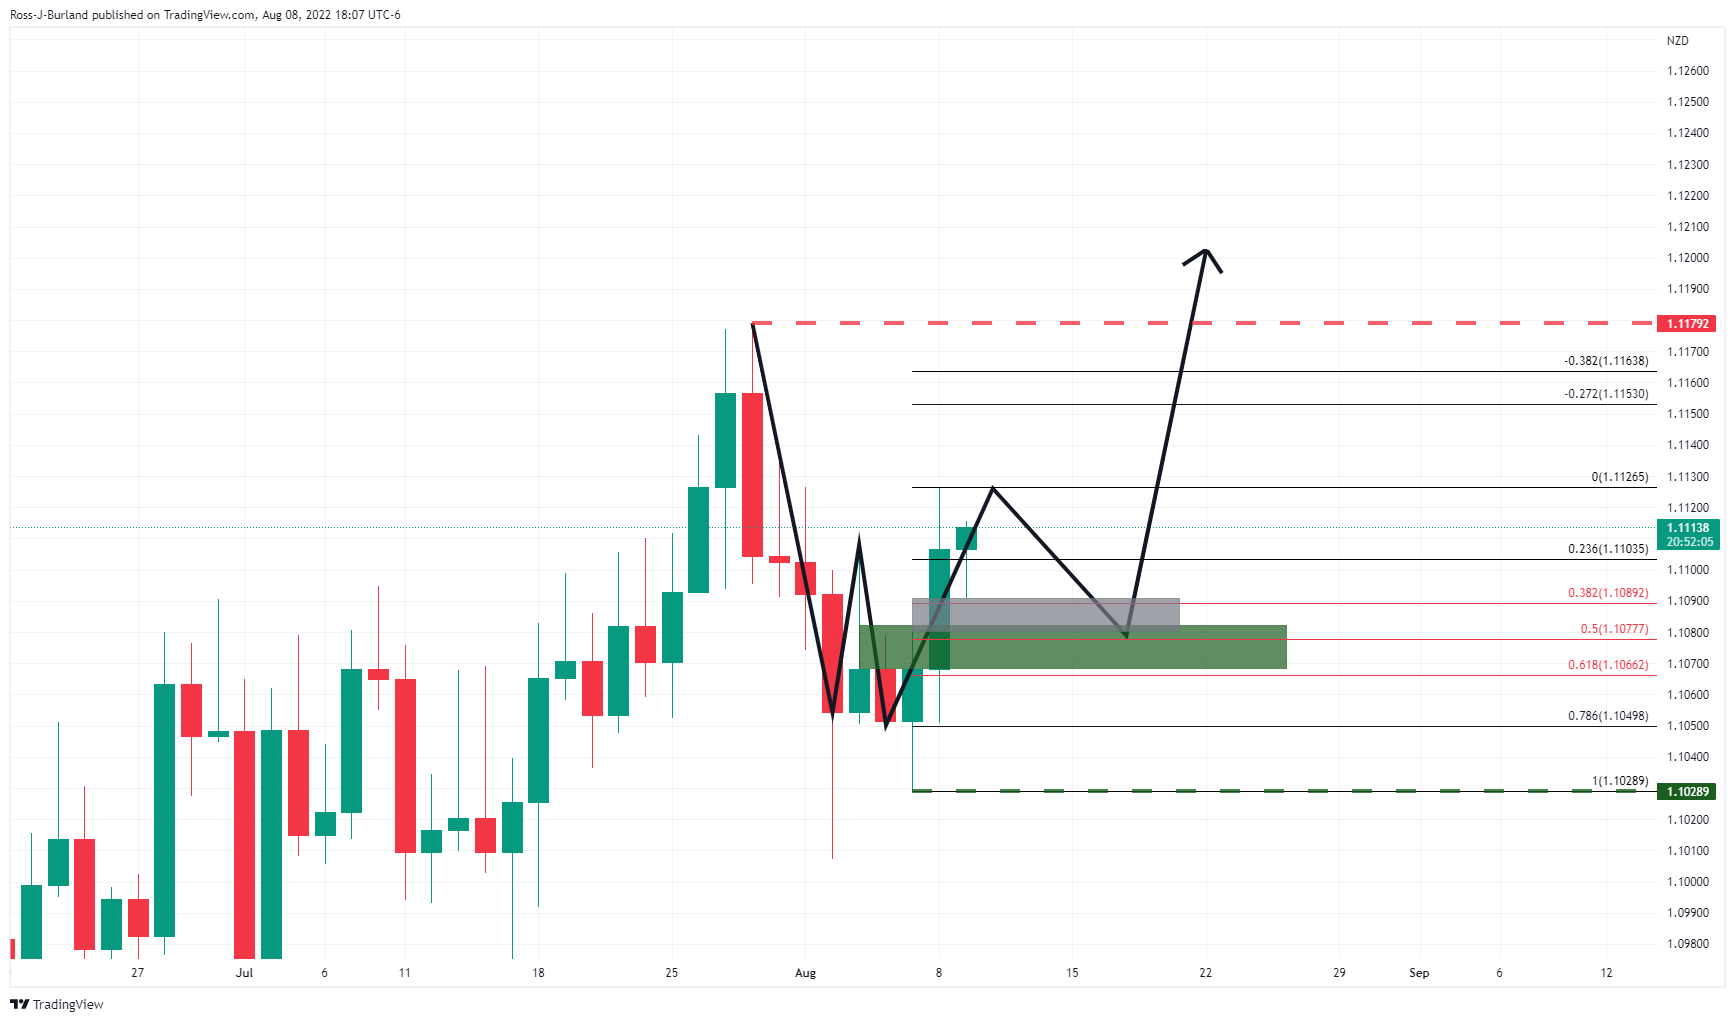
The price is bounded by key daily swing lows and highs but the W-formation is a meanwhile reversion pattern that would be expected to pull the price into the neckline for a restest and in order to mitigate, at least in part, the price imbalance between 1.1080 and 1.1091 and into the cluster of key Fibonaccis.
- EUR/USD remains sidelined after trimming the week-start gains.
- Italian politics, German gas crisis and US-China tussles over Taiwan seem to challenge bulls.
- Firmer EU Sentiment data, downbeat yields restrict downside momentum.
- Second-tier employment-related US data will join risk catalysts to direct short-term moves.
EUR/USD seesaws around 1.0200, after retreating from 1.0221, as traders seek fresh clues during Tuesday’s Asian session. The major currency pair began the week on a positive front before paring some of the gains by the end of Monday. However, a lack of major data/events, as well as cautious sentiment ahead of the US Consumer Price Index (CPI) for July, up for publishing on Wednesday, seems to restrict the latest moves.
Firmer prints of the Eurozone Sentix Investor Confidence Index join a retreat of the US Treasury yields to portray the EUR/USD gains the previous day. That said, the key sentiment gauge Index improved to -25.2 for August versus -24.7 expected and -26.4 prior. Details suggest that the current situation in the eurozone recovered from the lowest since March 2021, to -16.3 versus -16.5 marked in the previous month. An expectations index, however, remains near the lowest since December 2008 while improving a bit to -33.8 at the latest. On the other hand, the US Dollar Index (DXY) registered a 0.19% daily loss to 106.37.
Elsewhere, jitters in Italian politics due to the centrist Azione’s pullback from the newly formed alliance ahead of the September elections appear to have exerted downside pressure on the Euro. “Having agreed to form an alliance with the Democratic Party and the +Europe party just last week, the centrist Azione has now pulled out with party head Carlo Calendar starting that "the pieces just didn't fit together". The alliance was formed in an attempt to prevent a more right-wing government coming to power following the September 25 vote,” said Reuters while saying the Market News Publishing US.
It should be noted that US President Joe Biden’s dislike for China’s aggression towards recapturing Taiwan and criticism of House Speaker Nancy Pelosi’s visit to Taipei appeared to have also restricted the EUR/USD gains the previous day.
Amid these plays, the US 10-year Treasury yields dropped nearly seven basis points (bps) to 2.75% at the latest, following a 14-bps run-up the previous day. Further, Wall Street began Monday’s trading on a firmer footing before closing mixed whereas the S&P 500 Futures print mild gains by the press time.
Looking forward, the US Nonfarm Productivity and Unit Labor Costs for the second quarter (Q2) could entertain EUR/USD traders. Forecasts suggest that the US Nonfarm Productivity could improve to -4.6% from -7.3% prior while Unit Labor Costs may ease to 9.5% versus 12.6% previous readings. Other than that, headlines surrounding Taiwan and Russia will also be important for clear directions.
Also read: US CPI Preview: It is the hard core that counts, five scenarios for critical inflation data
Technical analysis
EUR/USD remains sidelined between the 21-DMA level of 1.0170 and a two-month-old resistance line near 1.0280.
| Pare | Closed | Change, % |
|---|---|---|
| AUDUSD | 0.69813 | 1.1 |
| EURJPY | 137.602 | 0.02 |
| EURUSD | 1.0193 | 0.2 |
| GBPJPY | 162.996 | -0.08 |
| GBPUSD | 1.20756 | 0.12 |
| NZDUSD | 0.6281 | 0.68 |
| USDCAD | 1.28605 | -0.63 |
| USDCHF | 0.955 | -0.76 |
| USDJPY | 134.97 | -0.2 |
- EUR/GBP is facing hurdles around 0.8440 as investors await Wednesday’s Germany HICP.
- The German inflation data is likely to remain unchanged at 8.5% annually.
- A vulnerable UK GDP data may weaken the pound bulls ahead.
The EUR/GBP pair is struggling to cross the immediate hurdle of 0.8440 in the early Tokyo session. The asset is broadly auctioning in a range of 0.8410-0.8452 for the past three trading sessions as investors have shifted their focus towards the Germany Harmonized Index of Consumer Prices (HICP) data, which will release on Wednesday. The cross has continued its four-day winning streak on Tuesday and is likely to extend gains ahead.
A preliminary estimate for the Germany HICP is 8.5%, similar to its prior close on an annual basis. Also, the monthly inflation data is seen unchanged at 0.8%. It is worth noting that Germany is a core member of the European Union (EU) and its inflation data holds significant importance for the eurozone.
No doubt, the Germany HICP is displaying some peak signals, however, this doesn't warrant that the European Central Bank (ECB) won’t go for a rate hike announcement. The ECB has been slowest in elevating interest rates among its Western peers due to regional imbalance after Russia’s invasion of Ukraine. Therefore, the odds of a rate hike are sky-rocketing as the inflation rate is beyond the desired rate.
On the pound front, the release of the Gross Domestic Product (GDP) holds significant importance. The economic data is expected to plummet to 2.8% vs. 8.7% reported earlier on an annual basis. Apart from that, the UK Office for National Statistics will also report the Industrial Production and Manufacturing Production data and their estimates don’t seem lucrative at all.


© 2000-2026. All rights reserved.
This site is managed by Teletrade D.J. LLC 2351 LLC 2022 (Euro House, Richmond Hill Road, Kingstown, VC0100, St. Vincent and the Grenadines).
The information on this website is for informational purposes only and does not constitute any investment advice.
The company does not serve or provide services to customers who are residents of the US, Canada, Iran, The Democratic People's Republic of Korea, Yemen and FATF blacklisted countries.
Making transactions on financial markets with marginal financial instruments opens up wide possibilities and allows investors who are willing to take risks to earn high profits, carrying a potentially high risk of losses at the same time. Therefore you should responsibly approach the issue of choosing the appropriate investment strategy, taking the available resources into account, before starting trading.
Use of the information: full or partial use of materials from this website must always be referenced to TeleTrade as the source of information. Use of the materials on the Internet must be accompanied by a hyperlink to teletrade.org. Automatic import of materials and information from this website is prohibited.
Please contact our PR department if you have any questions or need assistance at pr@teletrade.global.
transfers