- Analytics
- News and Tools
- Market News
CFD Markets News and Forecasts — 12-08-2022
- Based on a softer US inflation report, USD/JPY climbs during the week by 1.14%, after a volatile last three days.
- USD/JPY is neutral biased, but a doji emerging in the daily chart could pave the way for further upside.
- In the near term, the major is sideways, though oscillators point upwards, so it is slightly skewed to the upside.
The USD/JPY slightly climbed on Thursday following the release of the University of Michigan Consumer Sentiment for August, which exceeded estimations, but consumer expectations of inflation remained mixed. Nevertheless, it was not an excuse for investors seeking return, shifting toward riskier assets, to the detriment of safe-haven assets. At the time of writing, the USD/JPY is trading at 133.48 above its opening price by 0.39%.
USD/JPY Price Analysis: Technical outlook
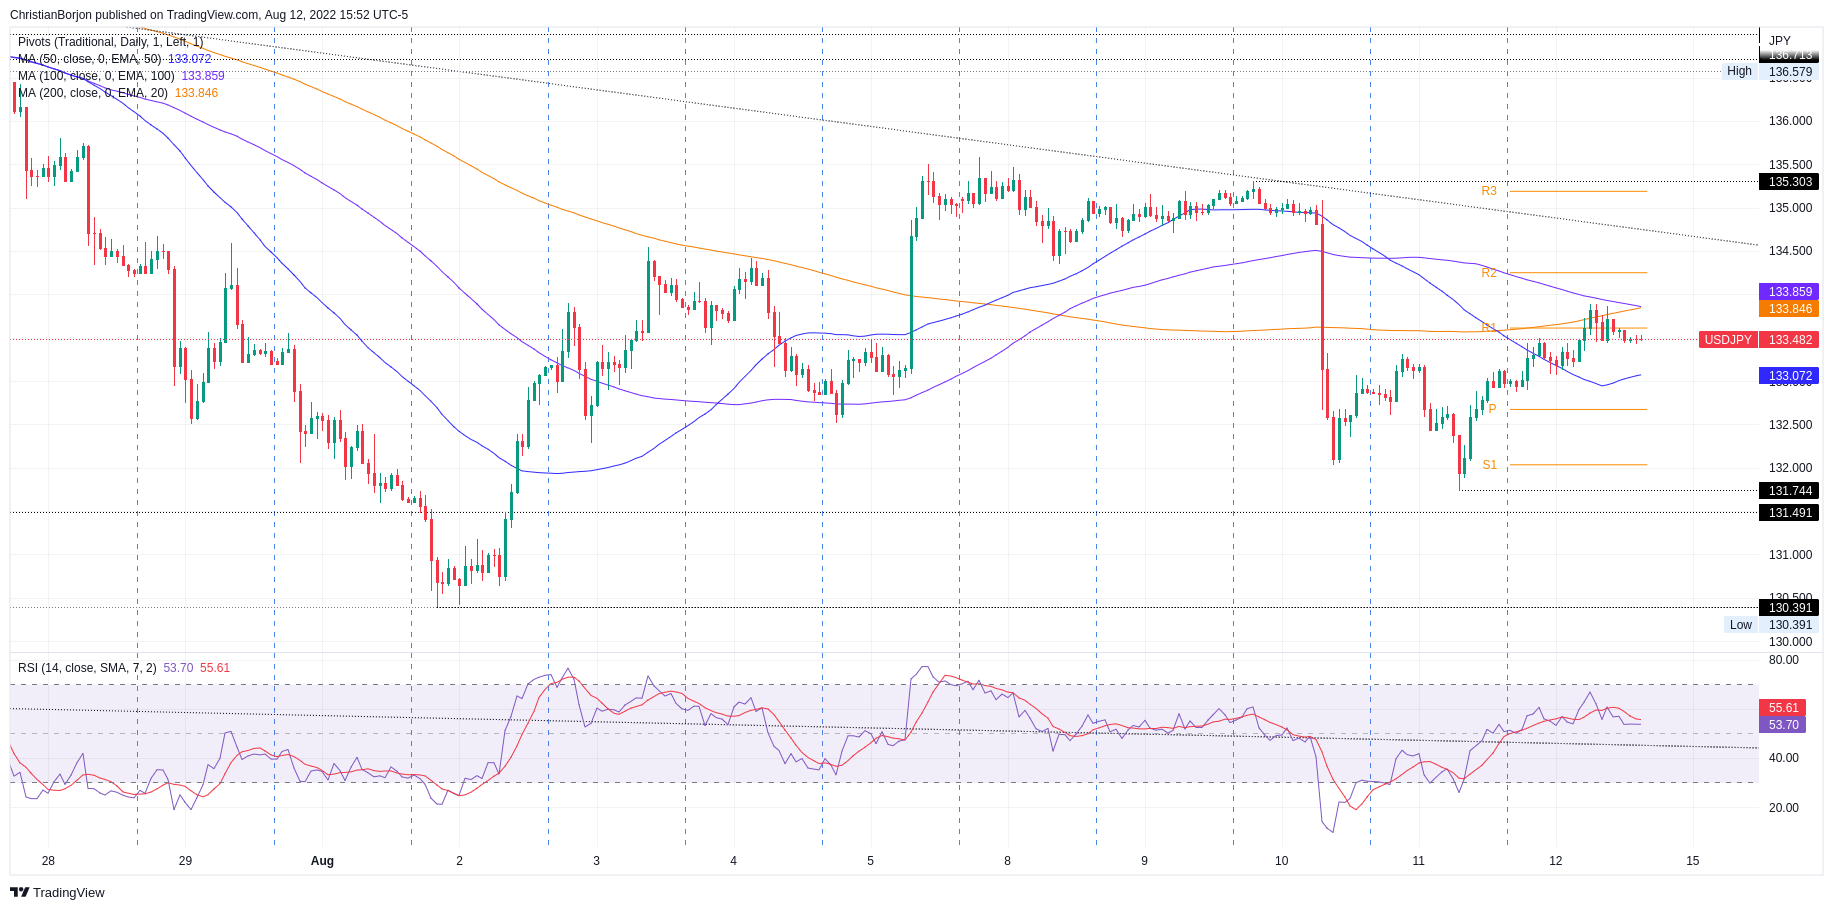
The USD/JPY daily chart portrays Thursday’s price action formed a doji, preceded by a downtrend, indicating that the downtrend is losing steam. Worth noticing the Relative Strength Index accelerated its uptrend to the 50-midline, showing that buying pressure is picking up. Nevertheless, the major remains sideways unless buyers reclaim the 50-day EMA at 135.29.
In the near term, the USD/JPY hourly chart the pair as neutral. However, price action since late Wednesday shows that the pair has begun trading upwards, but at a steady pace, as shown by the Relative Strenght Index (RSI), which could mean some things: USD/JPY shorts booking profits, after a stellar run of 700 pips downwards, and buyers slowly beginning to add to their longs, in speculation of higher US 10-year bond yield rates.
Therefore, the USD/JPY is sideways. Upwards, the major’s first resistance would be the confluence of the 100 and 200-hour EMAs at 133.84-85, followed by the 135.00 figure, followed by the August 10 high at 135.30.
On the flip side, the USD/JPY first support would e the 50-hour EMA at 133.07. The break below exposes crucial demand zones, the August 11 pivot low at 131.73, followed by the August 2 low at 130.39.
 USD/JPY Hourly chart
USD/JPY Key Technical Levels
- USD/CAD is set to finish the week with losses of 1.22%.
- The University of Michigan Consumer Sentiment for August surprises the upside and boosts the greenback.
- US Fed officials are still committed to tackle inflation and reiterated their job is not done.
USD/CAD advances on Friday, erasing Thursday’s losses, after a positive US consumer sentiment report boosted investors’ appetite, propelling US equities higher while the greenback rose. At the time of writing, the USD/CAD is trading at 1.2773.
The USD/CAD exchanges hands above its opening price, but earlier in the European session, it tumbled to the daily low at 1.2739, but buyers moved in and lifted the pair above the 100-day EMA at 1.2795. Nevertheless, once the dust settled, the pair stabilized around current prices.
US data revealed during the morning lifted the USD/CAD above its 100-DMA when the University of Michigan showed that the US Consumer Sentiment improved from 52.5 foreseen to 55.1, reaching a three-month high. That is good news for the Federal Reserve; however, inflation expectations for a 5-year horizon jumped above the 3% threshold, while in the short-term, one year, decreased to 5% from 5.2% estimated.
Nevertheless, during the week, US inflation data pointed downwards, led by CPI down at 8.5%, while the PPI decelerated to 8.5%. However, Fed officials reiterated that even though data is welcomed, inflation still is “too high,” so the US central bank emphasized its commitment to tackling inflation.
On Thursday, San Francisco’s Fed Mary Daly said that inflation remains high and that she favors a 50 bps rate hike. However, she does not discount a 75 rate hike, but it would depend on data. On Friday, Richmond’s Fed Thomas Barkin said that inflation data is welcome, but he wants to see a sustained period of inflation under control. Barkin added he’s undecided about September’s FOMC monetary policy meeting.
In the meantime, the US Dollar Index is recovering some ground in the day, is up 0.56%, at 105.676, set to finish below the 106.000 mark.
What to watch
The Canadian economic docket will feature the Consumer Price Index for July, alongside Housing Starts and Retail Sales. On the US side, the calendar will feature the NY Fed Manufacturing, Housing data, Industrial Production, and Retail Sales.
USD/CAD Key Technical Levels
- The USD/CHF is set to finish the week with losses of 2.05%.
- From a daily chart perspective, the major is downwards, as sellers target March’s 31 low below 0.9200.
- Despite a positive divergence in the hourly chart, the USD/CHF pierced the 200-DMA, but sellers piling at the 200-DMA dragged the pair lower.
The USD/CHF trims Thursday’s losses yet remains below the 200-day EMA, after hitting a daily high at 0.9450, but retraced towards the current price level, but still above the opening price. At the time of writing, the USD/CHF is trading at 0.9418, up by 0.13%.
Traders’ sentiment is upbeat, with US equities rallying sharply. The greenback recovers some ground, as shown by the US Dollar Index up 0.54%, at 105.662, after an improvement in US consumer sentiment eases the US Federal Reserve pressures.
USDCHF Price Analysis: Technical outlook
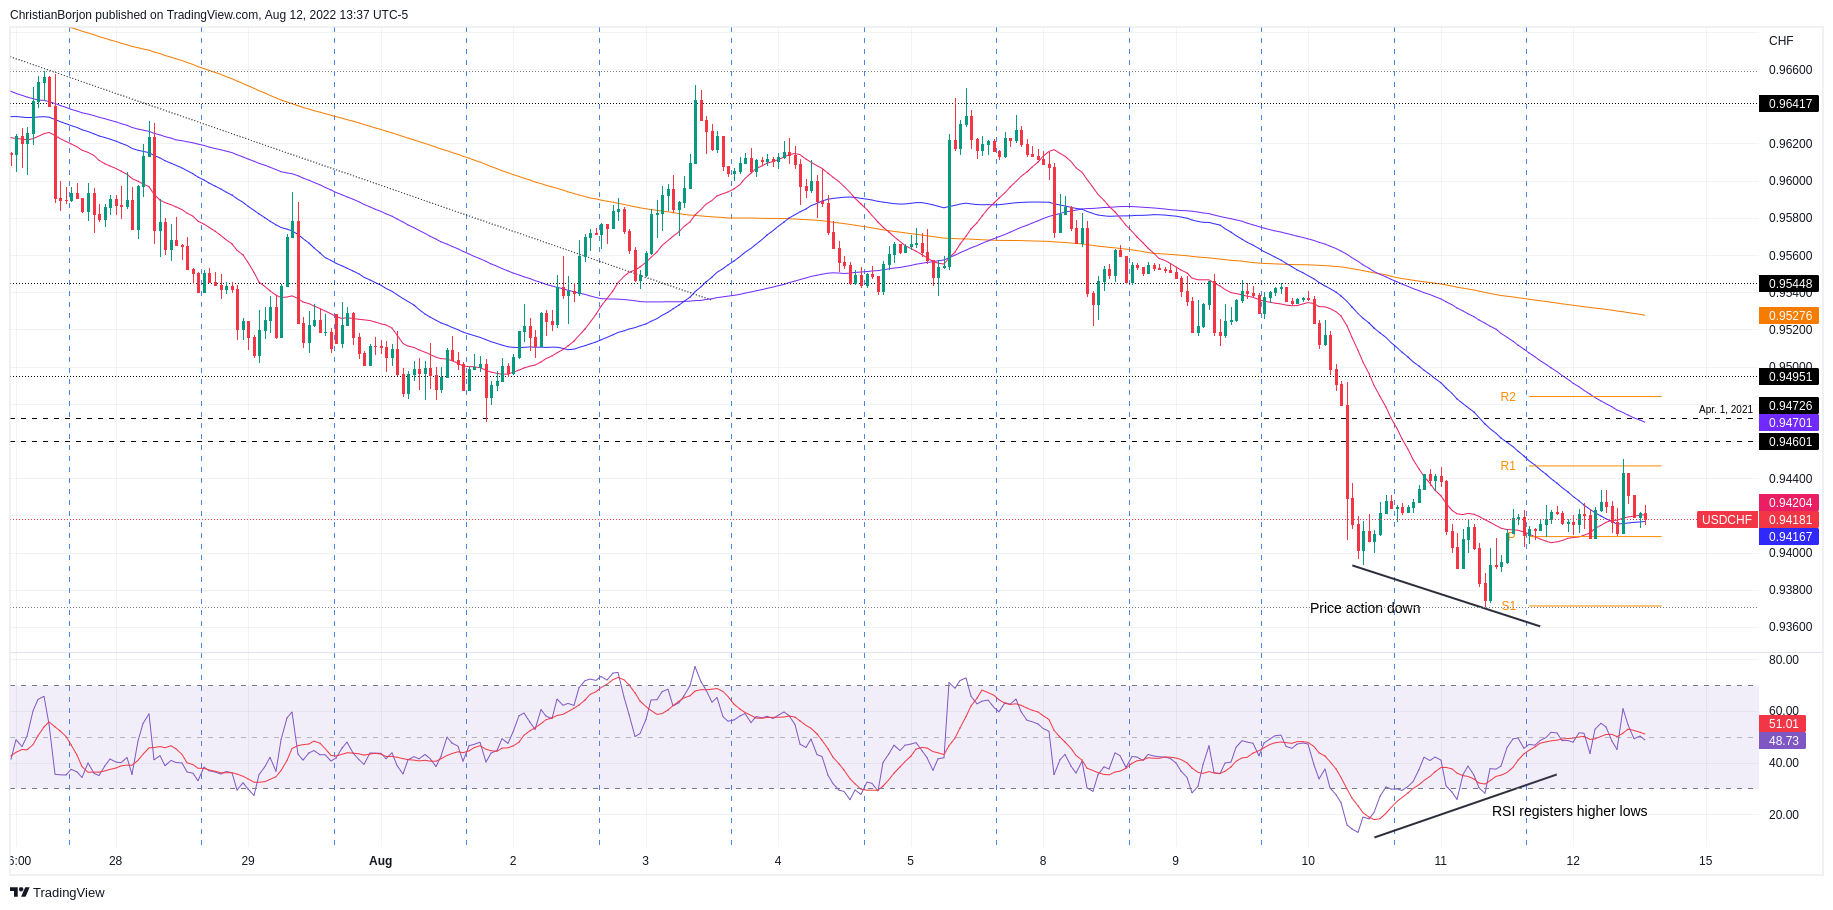
From a daily chart perspective, the USD/CHF daily chart illustrates the pair as downward biased, with sellers remaining in control, despite buyers lifting the major towards its daily high. Nevertheless, backed by the Relative Strength Index (RSI) at 35.91, well below the 50 midlines, a dip towards the March 31 swing low at 0.9194 is on the cards.
In the one-hour scale, the USD/CHF portrays a positive divergence with price action aiming lower, while the RSI records successive series of higher lows. Nevertheless, as the RSI already crossed its 50-midline, upwards and lately downwards, the uptrend is in question, but unless sellers break below the August 11 low at 0.9370, the major might remain range-bound.
The USD/CHF first resistance will be the R1 daily pivot at 0.9447. Break above could pave the way towards 0.9500. On the flip side, if the pair breaks below 0.9400, it could dip towards 0.9370.
 USD/CHF Hourly chart
USDCHF Key Technical Levels
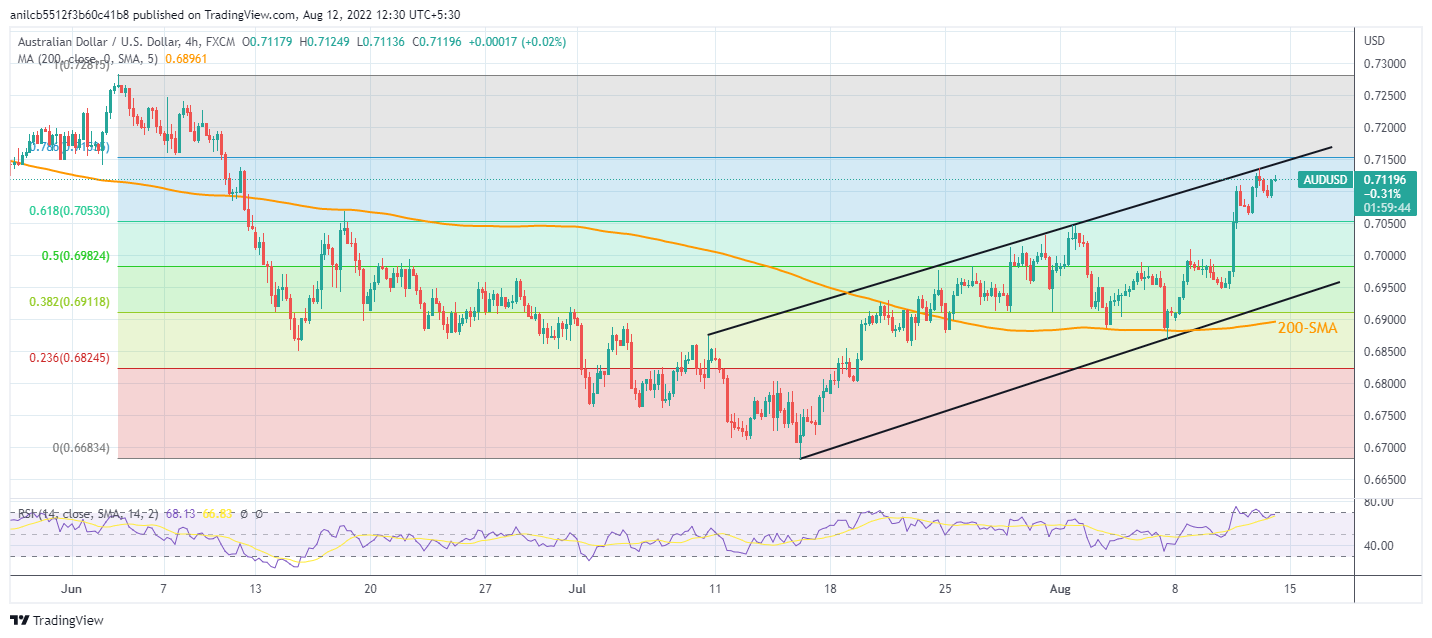
- The AUD/USD is set to finish at fresh nine-week highs, propelled by an improved risk appetite.
- An inverted head-and-shoulders in the daily chart targets the 0.7440 area as its profit target.
- AUD/USD buyers eye a break above the 200-DMA as they aim towards 0.7440.
The AUD/USD advances for the third straight day, but retraces from the two-month high, reached at 0.7136, so far clinging above the 0.7100 mark, which could open the door for further gains. Therefore, the AUD/USD is trading at 0.7121, bolstered by a risk-on impulse, after US consumer sentiment data exceeded estimates during a week that US inflation cooled down.
AUD/USD Price Analysis: Technical outlook
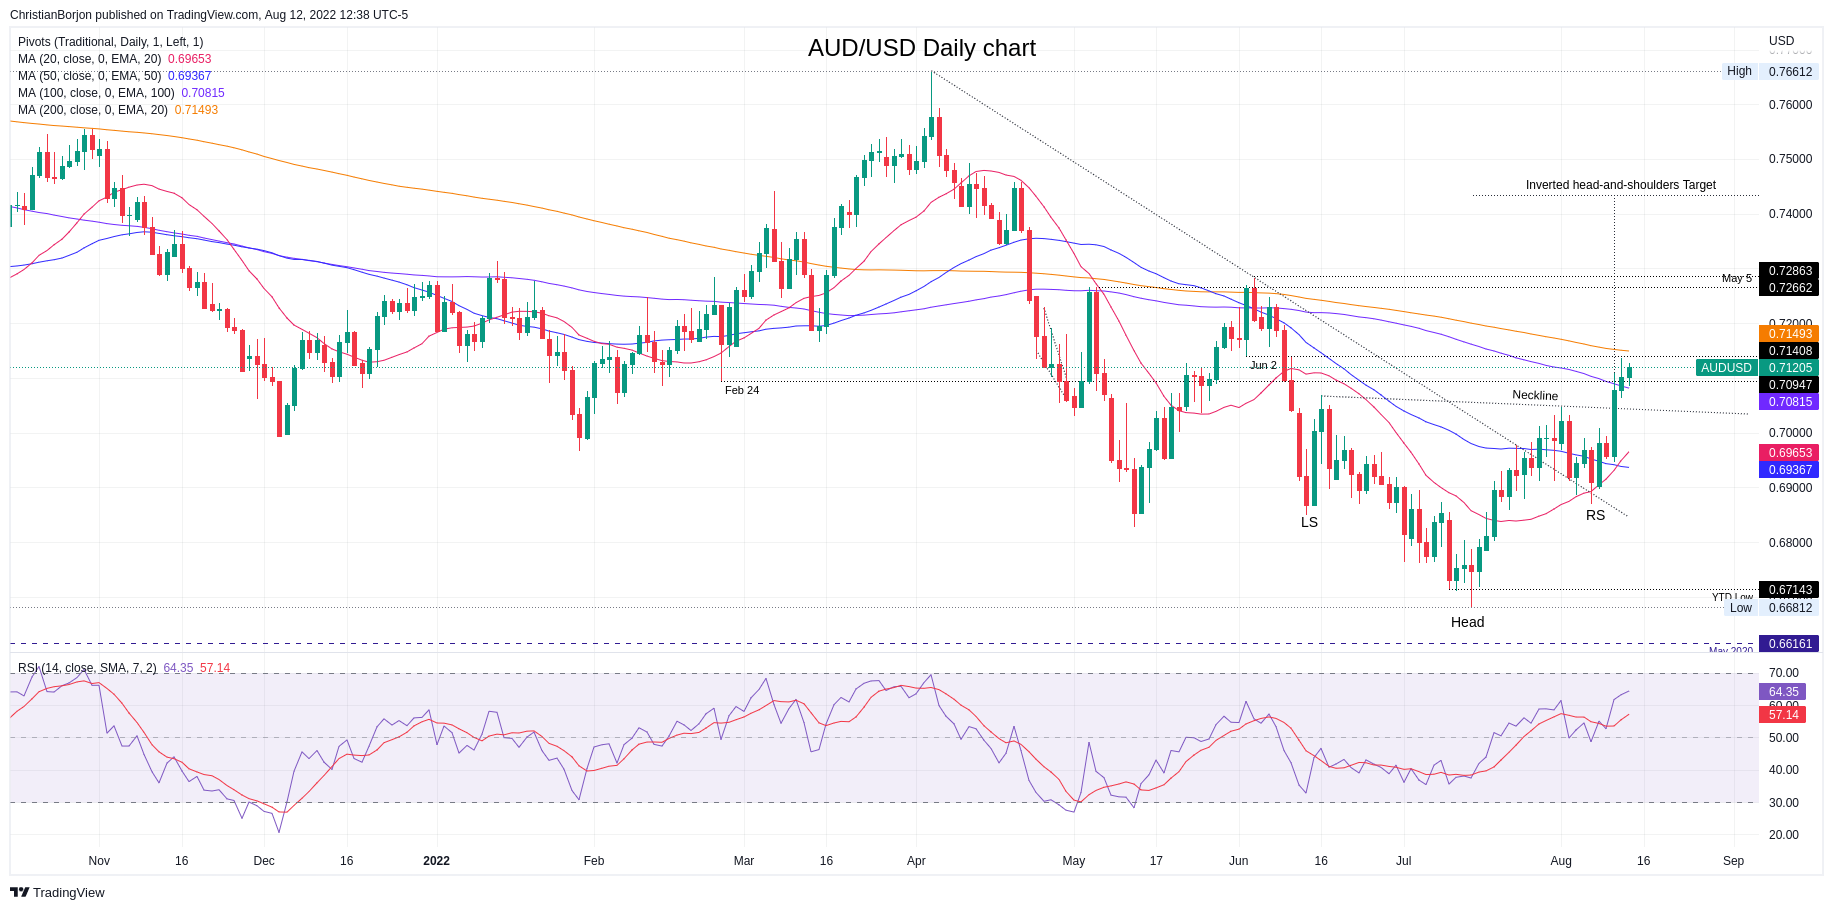
During the week, the Aussie cleared the 100-day EMA at 0.7081 and now exchanges hands between the latter and the 200-day EMA at 0-7149, shifting the major’s bias to neutral-upwards. Worth noting that once the AUD/USD cleared above 0.7067, the inverted head-and-shoulders neckline confirmed the chart pattern, which has as its first profit target, 0.7440.
However, on its way up, the AUD/USD’s first resistance would be the August 11 high at 0.7136. Once cleared, the next stop would be the 200-day EMA, followed by the May 5 high at 0.7266.
 AUD/USD Daily chart
AUD/USD Key Technical Levels
- The EUR/USD falters to hold above 1.0300, preparing to finish the week with gains of just 0.21%.
- US Consumer Sentiment rises to a three-month high, while inflation expectations remain mixed.
- Fed’s Daly: Far from declaring victory, supports a 50 bps hike as the baseline for September’s FOMC.
- EU’s Industrial Production surprised to the upside, but recession is still looming.
EUR/USD could not hold to its two-day gains, drops from five-month highs, back below the 1.0300 mark amidst a positive market mood, after a week where US inflation reports indicate that prices are cooling down, so the Fed might take a more “dovish” approach, regarding tightening.
The EUR/USD is trading at 1.0255 after hitting a daily high at 1.0321, but overall US dollar strength sent the shared currency diving below the 1.03000 figure, towards a fresh two-day low at 1.0238.
EUR/USD falls despite positive EU data after US Consumer sentiment improvement
In the meantime, investors’ mood is positive, further underpinned by the University of Michigan’s Consumer Sentiment. The August reading exceeded estimates, at 55.1, higher than the 52.5 forecasted by the street. Meanwhile, consumer inflation expectations for 1-year decreased from 5.2% to 5%, while 5-year rose above 3%, from 2.9%.
Aside from macroeconomic data, further Fedspeaking keeps the hawks in charge. On Thursday, San Francisco’s Fed Mary Daly said that inflation remains high and that she favors a 50 bps rate hike. However, she does not discount a 75 rate hike, but it would depend on data. On Friday, Richmond’s Fed Thomas Barkin said that inflation data is welcome, but he wants to see a sustained period of inflation under control. Barkin added he’s undecided about September’s FOMC monetary policy meeting.
The US Dollar Index is recovering some ground in the day, is up 0.60%, at 105.723, ahead into the weekend.
Across the pond, the Euro area reported Industrial Production, which came better than expected, at 0.7% MoM vs. 0.2%, and May’s reading was upward revised to 2.1%. The annual basis figures rose by 2.4%, vs. 1.0% foreseen. Nevertheless, the ongoing EU energy crisis and fragmentation risks lingering keep the EU economic outlook aiming towards a recession.
Additionally, the Rhine River in Germany fell below its critical level, around 40 cm, aiming to disrupt deliveries of raw materials, mainly coal. Contargo, a german container operator, said that it would discontinue large operations in the mid-upper Rhine River, according to Reuters.
Analysts at BBH reported that ECB tightening expectations suggest a 50 bps hike is 80% priced in for September 8, while the swaps market is pricing 150 bps over the next 12 months, eyeing to see the deposit rate around 1.5%, up from 1.25%.
What to watch
The EU calendar will feature the German Zew for August, EU employment and GDP data, alongside the HICP for July and the EU current account. Across the pond, the US economic docket will feature the NY Fed Manufacturing, Housing data, Industrial Production, and Retail Sales.
EUR/USD Key Technical Levels
The outlook for the USD/CAD pair remains bullish in the short-term according to analysts at MUFG Bank. They see risks in the loonie and consider dollar’s sell-off will reverse its course. They warn that a continued rally in equity markets could help the Canadina dollar.
Key Quotes:
“The USD will reverse course going forward after the broad-based sell-off this week. Market expectations for dovish policy pivot are unlikely to intensify over the short-term despite the weaker than expected inflation data from the US. Fed comments since the data make that clear.”
“The near-term outlook for crude oil remains poor with the slowdown in global growth weighing more heavily on the price of oil. In addition, there have been numerous reports indicating Russia ability to remain a key supplier of crude oil which has left the supply-demand balance globally less supportive for crude oil prices.”
“We believe both of these developments should help to lift USD/CAD back towards the year to date high from last month at 1.3224. Unlike the US labour market, there have been clearer signs of a slowdown in hiring in Canada as well.”
“While we do not expect a sharp reversal in equity markets over the short-term, the scope for further gains is more limited now.”
Analysts at MUFG Bank, have the idea of a shorting the EUR/USD pair around 1.0290 with a target at 0.9900 and a stop-loss at 1.0540. They consider that European circumstances create uncertainty for the euro and market participants could start pricing in more tightening from the Federal Reserve.
Key Quotes:
“We are sceptical of the scope to move further to the upside in circumstances of still high levels of uncertainty over the near-term outlook for growth in Europe due to the declining supply of natural gas.”
“For the US dollar generally, the sell-off this week in our view will not be sustained. It is much too early for the Fed to pivot and comments from Fed officials since the CPI data suggests a determined Fed that want to tighten a lot further before signalling to the market any sense of a change in stance. The rebound in the equity markets will likely make the Fed more determined to hike aggressively.”
“The Jackson Hole gathering will likely be used to signal the Fed’s determination and with another jobs report and CPI report before the FOMC meeting in September, the market could soon start to price in more tightening over the course of the remainder of this year.”
Data released on Friday showed a rebound in Consumer Confidence in August according to the University of Michigan’s preliminary report. Analysts at Wells Fargo point out the relief comes amid a modest bounce in consumer sentiment from what was an all-time low in June. They take little solace in the slightly better sentiment figures.
Key Quotes:
“On the surface the University of Michigan's latest survey of consumer sentiment was largely positive, though the details are arguably less encouraging. Overall sentiment rose for the second month in a row and came in just above consensus expectations. To some extent, this modest improvement may say more about relief at the pump amid a trend decline in gas prices than it does about a fundamental change in consumer psyche.”
“This is not so much a sign of things getting better as it is an indication that things are less awful as gas prices retreat from all-time highs. It's not good out there for consumers right now, it's just less bad.”
“Earlier this week the July consumer price data came in softer-than-expected and caused some analysts to anticipate less Fed tightening. But taken in the context of some upward surprises to the prior two months of data, the July reprieve in price growth has not left inflation on materially lower footing. The Fed likely will interpret this uptick in expectations as a further indication inflation has yet to indicate the start of a sustained cooling, and thus further supports our view that the FOMC will opt to raise the federal funds rate by 75 bps at its next meeting in September.”
- US dollar gains momentum at the end of the week.
- USD/JPY still down for the week but above critical support.
- US Consumer Confidence rises above expectations in August.
The USD/JPY pair is up on Friday, supported by a stronger US dollar against G10 currencies – it is about to end the week moving in a range between 133.90 and 133.45.
The yen gained momentum during the American session amid a mixed performance in Wall Street. The dollar remained in positive, after Thursday’s surge in Treasury yields and also supported by economic data.
Data released on Friday showed US Consumer Confidence recovered in August and this supported USD/JPY. University of Michigan’s main index rose to 55.1, above the 51.1 of July and surpassing the 52.5 of market consensus. The report also showed a decline in 1-year inflation expectations.
Down for the week but off lows
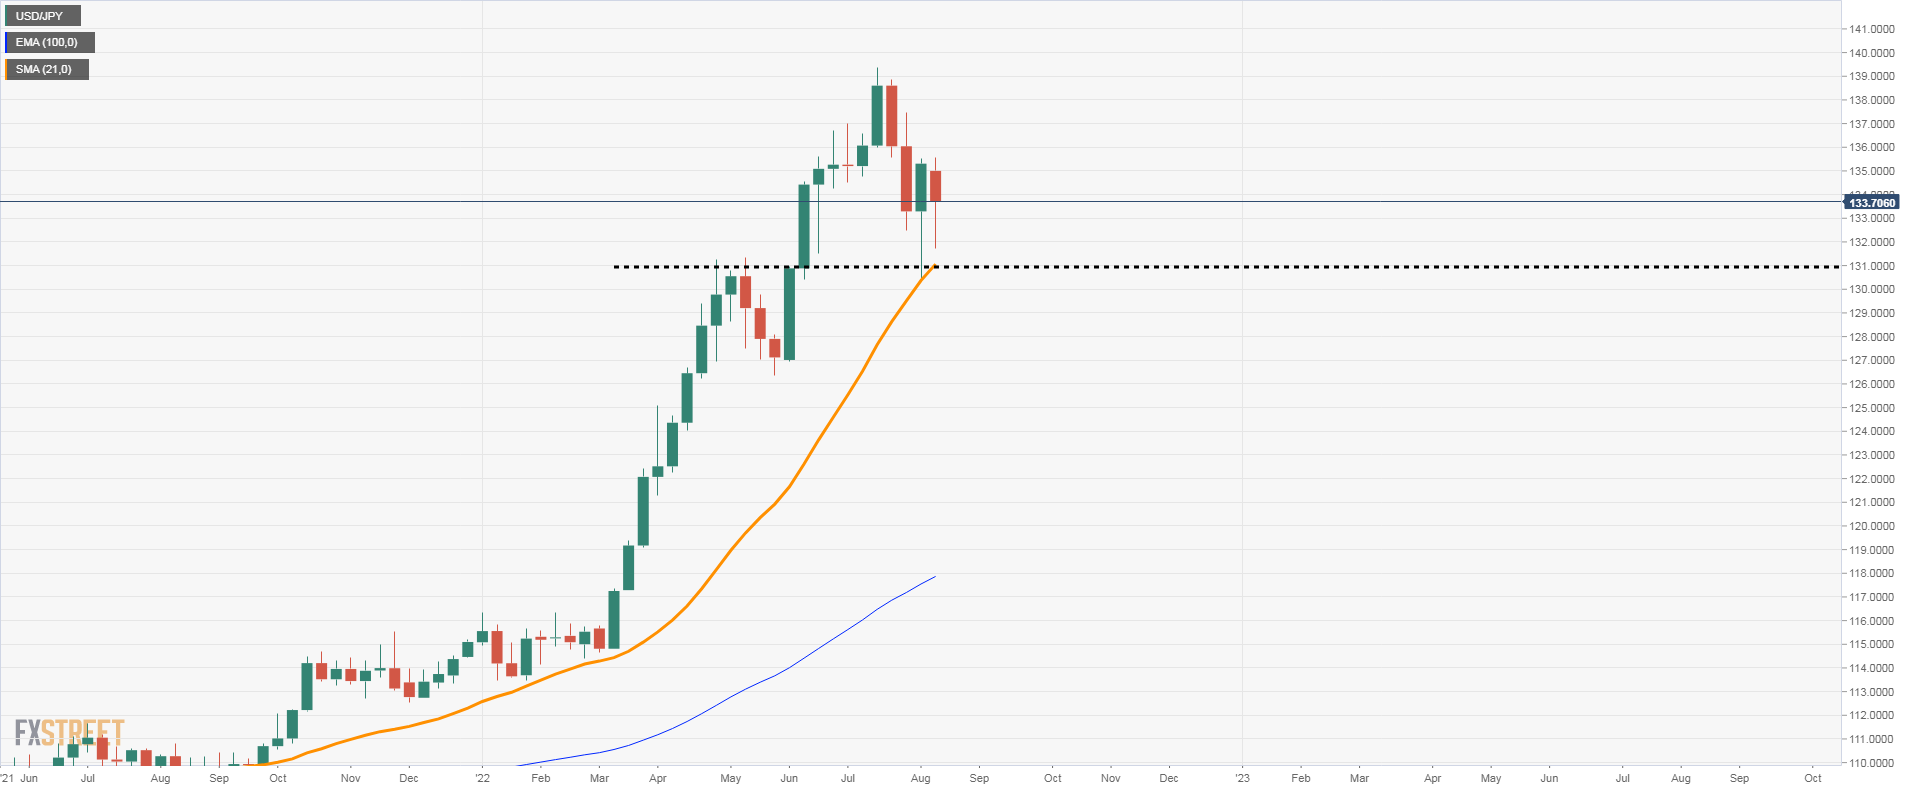
Despite Friday’s gains, USD/JPY is about to end the week in negative territory, although far from the low. The weekly chart shows the uptrend still in place, but with no momentum.
The correction from the multi-decade high near 140.00, reached about a month ago, continues to find support around 131.00. The 131.00 zone is a critical horizontal support area and also contains the 21-day Simple Moving Average. A weekly close below would open the doors do more losses.
USD/JPY weekly chart
- Gold price records gains for four consecutive weeks, up 1.08%.
- Lower US inflation data during the week keeps investors cheerful and hopeful that the Fed will tighten “less” aggressive.
- The UoM Consumer Sentiment report for August exceeded expectations.
- Gold Price Forecast: Range-bound despite broad US dollar weakness throughout the week.
Gold price erases some of Thursday’s gains, though stays below $1800 due to falling US bond yields, spurred by earlier US inflation data revealed during the week. That consumer and wholesale prices are showing signs of easing could deter the US Federal Reserve from tightening aggressively. At the time of writing, the XAU/USD is trading at $1794.49 a troy ounce.
US Consumer Sentiment rises, while US inflation expectations are mixed
Global equities are recording gains, portraying an improved risk appetite. At the time of typing, the University of Michigan Consumer Sentiment for August came better-than-estimated, at 55.1 vs. 52.5 expected, while inflation expectations for one year, easied to 5% from 5.2%, while for a five-year horizon uptick from 2.9% to 3.0%.
Joanne Hsu, director of the survey, said, “In spite of this strength in the labor market and some signs of improvement in inflation, consumer sentiment remains very low by historical standards.”
In the meantime, Fed speakers continued its campaign that they’re not done tackling inflation, led by San Francisco’s Fed Mary Daly. During an interview with Bloomberg on Thursday, she said that inflation is too high, despite consumer and producer prices indicating inflation is slowing. She favors a 50 bps rate hike for the September meeting as a base case, but she does not take off a 75 bps out of the table and would depend on data. She downplayed recession fears and foresaw the Federal funds rate (FFR) to end at 3.4% by the end of the year.
Meanwhile, Richmond’s Fed Thomas Barkin said that inflation data this week is “welcome,” but he wants to see a sustained period under control. He added that more hikes are coming while saying that he’s undecided about the size of the rate increase.
The US Dollar Index, a gauge of the buck’s value against a basket of peers, is up 0.57% at 105.687, while the US 10-year bond yield drops three basis points to 2.857%, a tailwind for gold prices.
Apart from this, tensions between the US and China regarding Taiwan calmed throughout the day. However, Europe’s economic crisis may encounter another factor to consider, with the Rhine River in Germany breached its 40 cms level, which would halt navigation through it
What to watch
Next week, the US economic docket will feature the NY Fed Manufacturing, Housing data, Industrial Production, and Retail Sales.
Gold Price Forecast (XAU/USD): Technical outlook
During the last week, XAU/USD prices consolidated in the $1783-$1807 range. It’s worth noting that despite lower US inflation data reported, which propelled lower US bond yields, gold could not break the range and push towards the confluence of the 100 and 200-day EMA, around the $1837-$1842 area.
If XAU/USD breaks above $1807, traders could expect gold to test the latter. Otherwise, if the gold price continues below $1800, a move towards the 20-day EMA at $1753.49 is on the cards.
-637959141672310212.png)
Richmond Fed President Thomas Barkin said on Friday that there is more to come to get rates into the restrictive territory and noted that he would like to see PCE inflation running at target for some time, as reported by Reuters.
Additional takeaways
"Economy weathering rate hikes well."
"Economy is fundamentally sound."
"Inflation is being driven by commodity prices, supply chain issues, demand."
"Raising rates would not be inconsistent with a tight labor market."
"On financial conditions, I look at real rates, I want them to be positive."
"We are on brink of moving real rates to positive territory."
"We need to sustain them there and follow through with expectations on rate hikes."
"Demand is definitely softening."
"Demand for higher-end services is still robust."
"You need to get inflation down on a sustained basis, then talk about what you do with rates."
"If you can get inflation to target for a number of months, that's what we'd like to see."
"Not every recession is like the great recession."
"There have been a lot of modest recessions."
"We've got a lot of time before the September meeting."
"Will keep eyes on economic data and make up mind closer to meeting."
"We'll see how much demand will need to soften to get inflation under control."
Market reaction
The dollar continues to outperform its rivals after these comments and the US Dollar Index was last seen rising 0.55% on the day at 105.65.
Gold’s downtrend signals are firm despite the recent short covering rally. Economists at TD Securities expect the yellow metal to remain in a bear market regime.
Gold distrust Fed pivot
“Trend signals in the yellow metal are pointing to a strengthening downtrend, which clash against market hopes of a Fed pivot amid cooling inflation.”
“As long as gold remains below $1,890 before year-end, participants should distrust a regime change in gold prices associated with a pivot in Fed policy.”
- Consumer confidence in the US improved modestly in August.
- UOM's long-run inflation outlook edged higher to 3% from 2.9%.
Consumer sentiment in the US improved slightly in early August with the University of Michigan's Consumer Confidence Index edging higher to 55.1 (flash) from 51.5 in July. This print came in slightly better than the market expectation of 52.5.
The Current Conditions Index declined to 55.5 from 58.1 and the Expectations Index rose to 54.9 from 47.3.
The long-run inflation expectation ticked up to 3% from 2.9% while the 1-year inflation outlook fell to 5% from 5.2%.
Market reaction
The US Dollar Index showed no immediate reaction to these data and was last seen rising 0.55% on the day at 105.66.
- GBP/USD witnessed heavy selling on Friday amid a strong pickup in the USD demand.
- The uncertainty over the size of the Fed rate hike prompts some USD short-covering.
- The BoE’s gloomy economic outlook undermines the GBP and contributes to the slide.
The GBP/USD pair comes under renewed selling pressure on Friday and drops to the 1.2100 neighbourhood during the early North American session.
The US dollar makes a solid comeback on the last day of the week and moves away from its lowest level since late June touched the previous day. This turns out to be a key factor exerting downward pressure on the GBP/USD pair, which fails to benefit from mostly better-than-expected UK macroeconomic releases.
The Preliminary GDP report, however, showed that the UK economy contracted by 0.1% in Q2 as compared to the 0.8% rise in the previous quarter. The dismal figure validates the Bank of England's outlook that a prolonged recession would start in the fourth quarter and acts as a headwind for the British pound.
The USD, on the other hand, witnesses a short-covering move amid the uncertainty over the size of the next rate hike by the Federal Reserve. Data released this week showed signs of easing inflationary pressures in the US and forced investors to trim bets for a 75 bps Fed rate hike move in the September meeting.
That said, the recent hawkish comments by several Fed officials suggest that the US central bank would stick to its policy tightening path. This, in turn, prompts traders to lighten their USD bearish bets, though a combination of factors could cap gains and help limit the downside for the GBP/USD pair.
Nevertheless, spot prices reverse a major part of the weekly gains and remain at the mercy of the USD price dynamics. Next on tap would be the release of the Preliminary Michigan US Consumer Sentiment Index, which might influence the buck and produce some trading opportunities around the GBP/USD pair.
Technical levels to watch
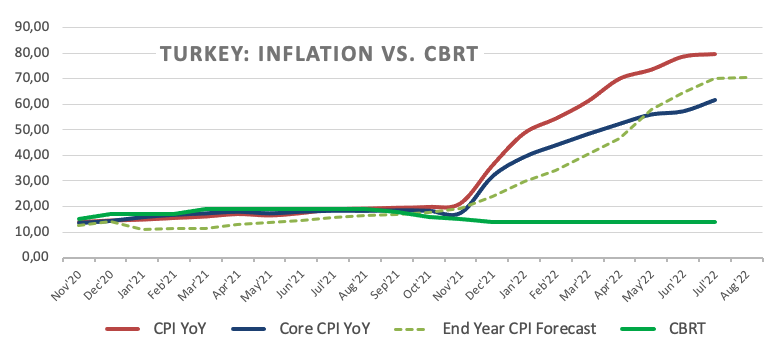
- USD/TRY adds to recent gains near the 18.00 barrier.
- Türkiye Industrial Production expanded 8.5% YoY in June.
- CBRT’s sees inflation around 70% by year end.
The Turkish lira remains on the defensive in the second half of the week and lifts USD/TRY back to the boundaries of the 18.00 mark on Friday.
USD/TRY up on USD-buying
USD/TRY advances for the second session in a row and keeps the trade at shouting distance from the key hurdle at 18.00 the figure for yet another session at the end of the week.
Friday’s uptick in spot comes on the back of renewed strength in the buck, as the recovery in the risk complex seems to be taking a breather following the persistent rebound in past sessions.
In Türkiye, Industrial Production surprised to the upside and expanded 8.5% in the year to June, while Retail Sales contracted 0.7% MoM and expanded 5.5% over the last twelve months.
In addition, the Turkish central bank (CBRT) released its End Year CPI Forecast, and now sees consumer prices rising 70.60% by end of 2022 (from 69.94%).
What to look for around TRY
The upside bias in USD/TRY remains unchanged and stays on course to revisit the key 18.00 zone.
In the meantime, the lira’s price action is expected to keep gyrating around the performance of energy and commodity prices - which are directly correlated to developments from the war in Ukraine - the broad risk appetite trends and the Fed’s rate path in the next months.
Extra risks facing the Turkish currency also come from the domestic backyard, as inflation gives no signs of abating (despite rising less than forecast in July), real interest rates remain entrenched in negative figures and the political pressure to keep the CBRT biased towards low interest rates remains omnipresent. In addition, there seems to be no Plan B to attract foreign currency in a context where the country’s FX reserves dwindle by the day.
Key events in Türkiye this week: End year CPI Forecast, Industrial Production, Retail Sales (Friday).
Eminent issues on the back boiler: FX intervention by the CBRT. Progress (or lack of it) of the government’s new scheme oriented to support the lira via protected time deposits. Constant government pressure on the CBRT vs. bank’s credibility/independence. Bouts of geopolitical concerns. Structural reforms. Presidential/Parliamentary elections in June 23.
USD/TRY key levels
So far, the pair is gaining 0.12% at 17.9556 and faces the immediate target at 17.9874 (2022 high August 3) seconded by 18.2582 (all-time high December 20) and then 19.00 (round level). On the other hand, a breach of 17.1903 (weekly low July 15) would pave the way for 16.2788 (100-day SMA) and finally 16.0365 (monthly low June 27).
Intraday losses in the GBP suggest the mid-week gains in cable have peaked. Economists at Scotiabank expect the GBP/USD pair to return toward the 1.20 area.
Key support seen at 1.2080 in the short run
“The energy crunch and cost-of-living crisis suggest significant economic headwinds lie ahead for the UK economy and that will restrain the GBP’s ability to advance against a softer USD.”
“The top of the range this week coincided with a test of key resistance at 1.2275 and failure here suggests cable risks heading back to the 1.20 zone.”
“We spot key support at 1.2080 in the short run.”
EUR/USD slips on profit-taking. As economists at Scotiabank note, growth/energy challenges remain.
Growth/recession/energy supply concerns remain a threat to the EUR
“The EUR’s mid-week gains are easing somewhat into the end of the week, perhaps reflecting profit-taking after the market failed to extend through the 1.0360/70 zone.”
“We look for EUR/USD to find support in the upper 1.02s in the near-term.”
“Growth/recession/energy supply concerns remain a threat to the EUR outlook.”
- Silver attracts fresh buying near the 50 DMA and reverses a major part of the overnight losses.
- The technical set-up remains tilted in favour of bulls and supports prospects for further gains.
- A sustained break below the $20.00 mark is needed to negate the near-term positive outlook.
Silver shows some resilience below the 50% Fibonacci retracement level of the $22.52-$18.15 downfall and catches fresh bids near the $20.25 area, or the 50-day SMA support on Friday. The white metal jumps to a fresh daily high, around mid-$20.00s during the early North American session, reversing a major part of the previous day's decline.
The emergence of fresh buying near a technically significant moving average suggests this week's pullback from the 61.8% Fibo. level has run its course and favours bullish traders. The constructive outlook is reinforced by bullish technical indicators on the daily chart, which are still far from being in the overbought territory.
Hence, a subsequent strength towards retesting the weekly high, around the $20.85 region, now looks likely a distinct possibility. Some follow-through buying, leading to a move beyond the $21.00 round-figure mark, would be seen as a fresh trigger for bullish traders and pave the way for a further near-term appreciating move for the XAG/USD.
Spot prices could then accelerate the momentum towards the $21.40-$21.50 intermediate resistance, above which the XAG/USD could challenge the 100-day SMA, currently around the $21.85 region. This is closely followed by the $22.00 mark and should act as a strong hurdle.
On the flip side, the $20.35-$20.25 confluence comprises the 50% Fibo. level and the 50 DMA, which, in turn, should continue to protect the immediate downside. The next relevant support is pegged near the $20.00 psychological mark. The latter should now act as a key pivotal point, which if broken decisively would shift the bias in favour of bearish traders.
Silver daily chart
-637959062604392911.png)
Key levels to watch
In a report published on Friday, Fitch Ratings noted that easing supply-chain pressures should help reduce core goods inflation, as reported by Reuters.
Additional takeaways
"Recent improvements to global supply chain pressures are encouraging."
"Risks to global supply chain remain given China's zero Covid-19 policy, while gas rationing in Europe may affect industrial supply chains."
"Global supply-chain disruptions are beginning to unwind as shipping rates decline, time taken to deliver goods falls quickly."
"Global supply-chain disruptions are beginning to unwind as port congestion eases and the backlog of orders is cleared."
Market reaction
This report doesn't seem to be having a significant impact on the dollar's performance against its rivals. As of writing, the US Dollar Index was up 0.5% on the day at 105.60.
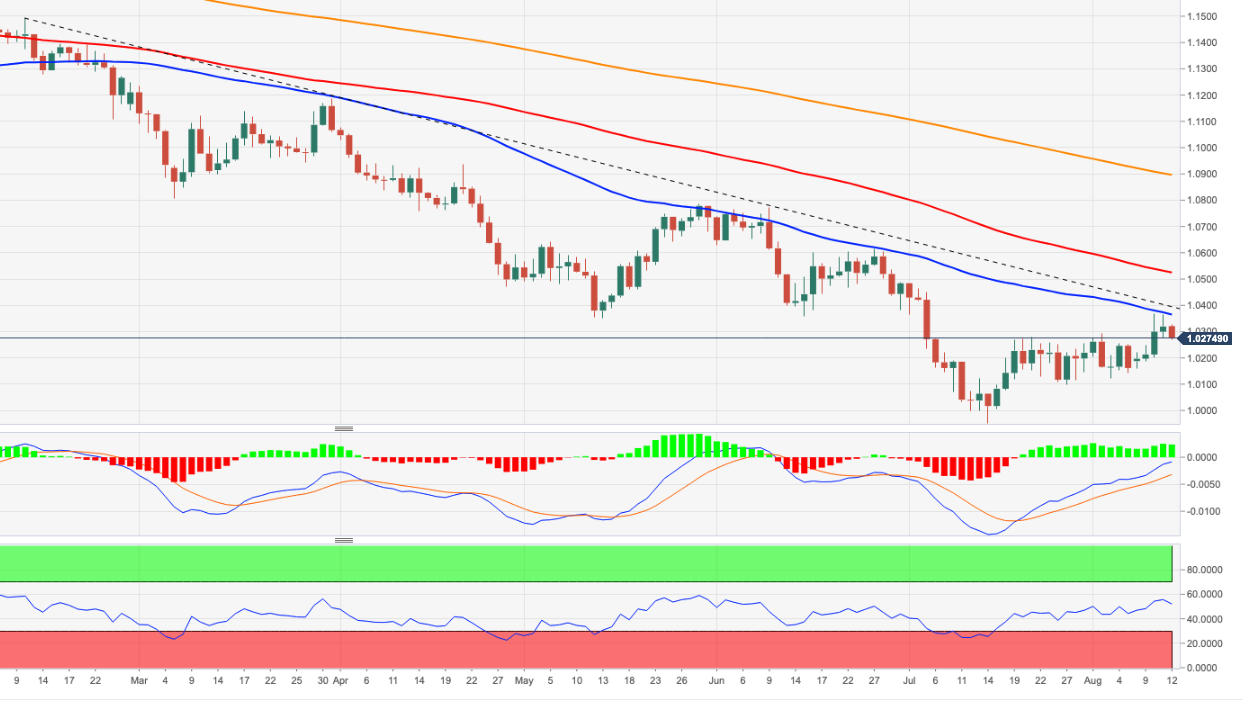
- EUR/USD corrects lower and tumbles to 1.0270.
- Further upside is expected beyond 1.0370/80.
EUR/USD comes under pressure and breaks below 1.0300 after four daily gains in a row on Friday.
Despite the knee-jerk, the continuation of the uptrend looks favoured in the very short term. That said, the pair needs to clear the August high at 1.0368 (August 10) as well as the 6-month resistance line around 1.0380 to open the door to a probable move to the 100-day SMA, today at 1.0522.
In the longer run, the pair’s bearish view is expected to prevail as long as it trades below the 200-day SMA at 1.0894.
EUR/USD daily chart
Economist at UOB Group Ho Woei Chen, CFA, reviews the latest Monetary Policy Report by the PBoC.
Key Takeaways
“People’s Bank of China’s (PBoC) 2Q22 Monetary Policy Implementation Report released on Wed (10 Aug) said that its monetary policy continues to be focused on maintaining stability in the economy and the broader market.”
“There is an emphasis on using targeted tools including the relending programmes and guiding banks to increase credit rather than large reductions to the banks’ RRR or the MLF, coming against a backdrop of flushed domestic banking liquidity, increasing caution over domestic inflation and tightening monetary policy at global central banks.”
“The PBoC said China should be alert to structural inflation pressure which may increase in the short term. As we noted earlier, this may limit its scope to cut interest rates in 2H22 even as it said that recovery in domestic economic foundation has yet to stabilise.”
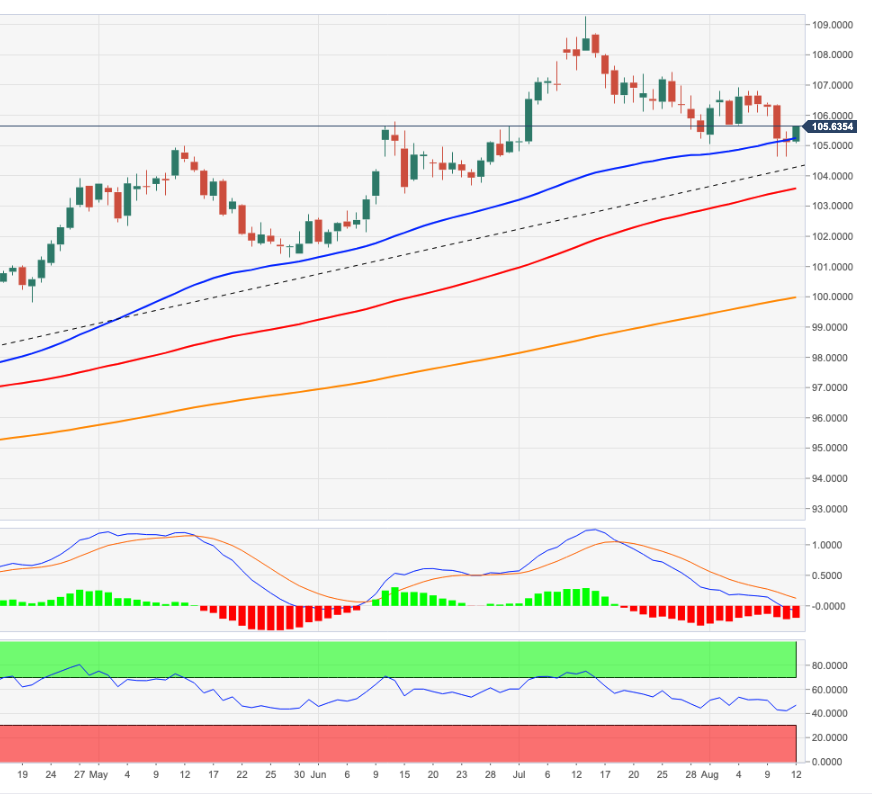
- DXY posts gains for the first time in the week.
- The 104.60 region offers solid contention so far.
DXY regains buying interest and reclaims the area above the 105.00 mark at the end of the week.
The index remains well supported by recent lows in the 104.60 region, an area also reinforced by the 6-month line. Above this zone, the dollar is expected to keep the constructive view in the near term at least.
Looking at the broader scenario, the bullish view in the dollar remains in place while above the 200-day SMA at 100.04.
DXY daily chart
- AUD/USD witnesses a modest pullback from the vicinity of a two-month high set on Thursday.
- The USD short-covering move is seen as a key factor exerting downward pressure on the pair.
- The risk-on impulse offers some support to the risk-sensitive aussie and limits the downside.
The AUD/USD pair faces rejection near a technically significant 200-day SMA on Friday and witnessed a modest pullback from the vicinity of a two-month high touched the previous day. The pair, however, manages to bounce a few pips from the daily low and now seems to have stabilized around the 0.7100 round-figure mark.
The US dollar gains some positive traction and stalls its recent decline to the lowest level since late June, which, in turn, exerts some downward pressure on the AUD/USD pair. Despite signs of easing inflationary pressures in the US, the recent hawkish comments by several Fed officials indicated that the US central bank would stick to its policy tightening path. This is seen as a key factor that prompted traders to lighten their USD bearish bets on the last day of the week.
That said, a combination of factors might hold back the USD bulls from placing aggressive bets and help limit losses for the AUD/USD pair, at least for the time being. A modest pullback in the US Treasury bond yields could act as a headwind for the buck. Apart from this, a generally positive tone around the equity markets could further contribute to cap gains for the safe-haven greenback and lend some support to the risk-sensitive aussie. This, in turn, warrants some caution for bearish traders.
Nevertheless, the AUD/USD pair remains on track to post strong weekly gains, marking the third in the previous four, and register its highest weekly close since May. Traders now look forward to the US economic docket, featuring the release of the Preliminary Michigan US Consumer Sentiment Index. This, along with the US bond yields and the broader risk sentiment, might influence the USD price dynamics during the early North American session and provide some impetus to the AUD/USD pair.
Technical levels to watch
UOB Group’s Senior Economist Alvin Liew comments on the revised Q2 GDP figures in Singapore.
Key Takeaways
“Singapore’s final 2Q 2022 GDP was revised lower sequentially to a contraction of 0.2% q/q SA (versus prelim print of 0.0% q/q SA) after recording a downwardly revised 0.8% expansion in 1Q (from 0.9% previously). Compared to a year ago, GDP grew by 4.4% y/y in 2Q (down from prelim estimate of 4.8% y/y), from a downwardly revised 3.8% in 1Q (from 4.0% previously).”
“The momentum in services was revised to -0.1% q/q (from +0.2%) while the construction sector showed momentum being revised slower to +0.9% q/q (from +1.9%). Only manufacturing sector saw a slight pickup in momentum, to +0.4% q/q (from +0.3%).”
“In addition to the 2Q GDP downward revision, the message from the MTI was one of greater caution as external outlook has deteriorated materially compared to three months ago and it highlighted four well-telegraphed external risks: 1) the Russia-Ukraine conflict, 2) monetary policy tightening stance in the advanced economies, 3) geopolitical risks, and 4) COVID-19 risk of potential new variants.”
“Taking into account of the external outlook and these risk factors, the MTI has now narrowed the GDP growth forecast for 2022 to 3.0-4.0%, from the previous range of 3.0-5.0% while the Enterprise Singapore (ESG) upgraded Singapore’s non-oil domestic exports growth forecast to 5.0-6.0% for 2022 from the previous forecast range of 3.0-5.0%. We are comfortable to keep our GDP growth outlook for Singapore unchanged at 3.5% for 2022, before easing to 2% for 2023 to reflect the uncertain external outlook next year. Our full-year NODX growth and manufacturing growth forecasts for 2022 also remain unchanged at 5% and 4.5% respectively.”
“MAS Outlook – The latest 2Q GDP revision and narrower official GDP growth forecast range does not change our view on Singapore’s monetary policy, which we believe has entered into a restrictive setting after four rounds of tightening since Oct 2021. We think Oct 2022 MPS tightening is still on the cards but we believe off-cycles are likely done for 2022 unless core inflation surprises well above 4% in the next few months.”
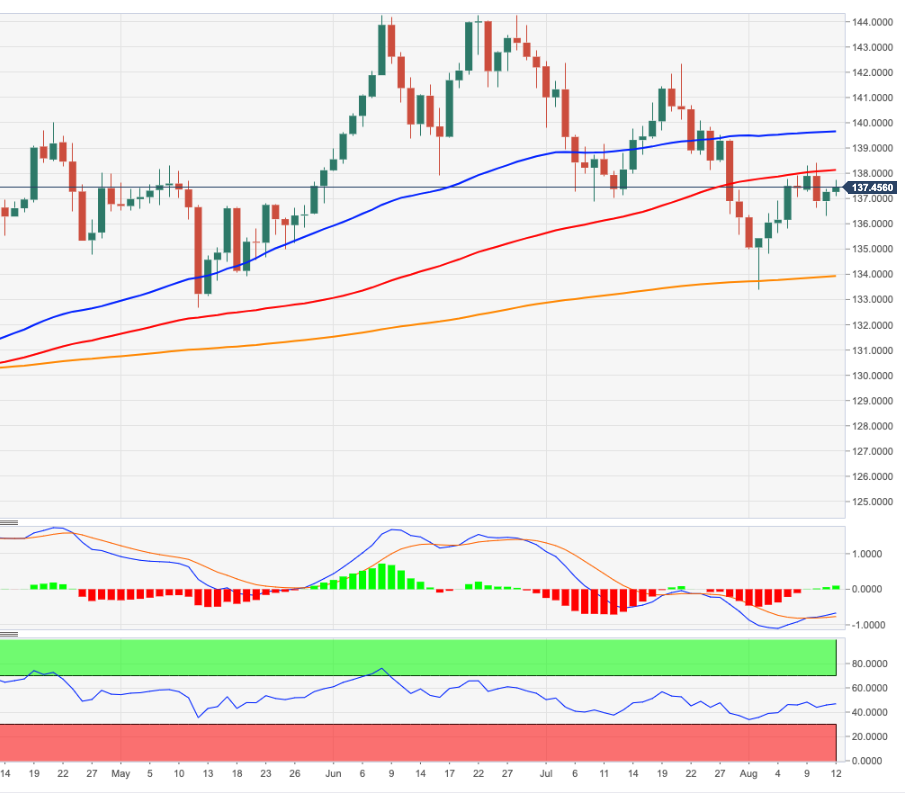
- EUR/JPY adds to Thursday’s bounce and approaches 138.00.
- Further gains appear likely on a close above the 138.40 region.
EUR/JPY bounces further in the second half of the week and looks to reclaim the 138.00 barrier and above in the near term.
The continuation of the upside momentum is expected to meet an interim hurdle at the 100-day SMA at 138.09 prior to the August top at 138.39 (August 10). The surpass of this level should allow for extra gains to, initially, the 55-day SMA at 139.63.
While above the 200-day SMA at 133.90, the outlook for the cross is expected to remain constructive. This contention zone also appears underpinned by the proximity of the August low at 133.39 (August 2).
EUR/JPY daily chart
Sterling is underperforming despite better-than-expected data and is currently trading near 1.2125. The GBP/USD pair could tumble to the 1.20 level, economists at BBH report.
A recession is a foregone conclusion
“A break below 1.2110 would set up a test of the August 5 low near 1.20.”
“Q2 GDP came in at -0.1% QoQ vs. -0.2% expected and 0.8% in Q1, while the YoY rate came in at 2.9% vs. 2.8% expected and 8.7% in Q1. Looking at the monthly data, GDP came in at -0.6% m/m vs. -1.2% expected and a revised 0.4% (was 0.5%) in May. While the data were modestly better than expected, a recession is a foregone conclusion and the only questions are how long and how deep.”
The challenges for the gold market are still in place. A peak in US inflation suggests a downside risk to the gold price. Still, increasing recessionary pressure and geopolitical risks could protect the downside, economists at ANZ Bank report.
Geopolitical and economic growth risks could protect the downside
“In 1980 when inflation peaked at 14.7%, gold prices started retreating from a high of $631/oz. Something similar happened in 2011, when inflation hit a high of 3.9% in September, triggering a fall from $1,900. With inflation peaking at 9% in June, we could see a similar fall in XAU/USD. The winding down of the Fed’s balance sheet also does not bode well.”
“Rising geopolitical tensions and economic risks could lend some support. The Russia-Ukraine war and China-US relations are issues that could trigger haven buying.”
Senior Economist at UOB Group Alvin Liew reviews the latest US inflation figures and the impact on the Fed’s rate path in the near term.
Key Takeaways
“Both key measures of US inflation came in below expectations for Jul. US headline consumer price inflation was still elevated but came off from recent highs, to 8.5% y/y in Jul (from 9.1% y/y in Jun), below Bloomberg estimates of 8.7%. On a m/m basis, the headline CPI was flat at 0% in Jul (versus 1.3% in Jun, and 1.0% in May), below Bloomberg estimates of 0.2% m/m.”
“Core CPI inflation (which excludes food and energy) remained elevated, holding at 5.9% y/y in Jul, unchanged from Jun, but it was nevertheless below Bloomberg estimate for a higher 6.1% print. On a sequential basis, core inflation rose by 0.3% m/m in Jul (easing from 0.7% m/m in Jun, and below Bloomberg estimate of 0.5%).”
“While US headline inflation has retreated below 9% in Jul, this reflected mainly the decline in gasoline prices but the cost of living is still painfully high as shown by the persistent rise of food and shelter costs. We maintain our headline CPI inflation forecast to average 8.5% and our core CPI inflation forecast at 6.5% for 2022. Subsequently, we still expect both headline and core inflation to ease in 2023 to average 2.5%. The balance of risk on inflation remains on the upside.”
“Our FOMC Outlook: We still expect a 50 bps rate hikes in Sep, followed by another 50bps in Nov FOMC before ending the year with a 25bps hike in Dec. Including the rate hikes of 25bps in Mar, 50bps in May and the latest hikes of 75bps in Jun and Jul, this implies a cumulative 350bps of increases in 2022, bringing the FFTR higher to the range of 3.50-3.75% by end of 2022. We note that there will be quite a few events along the way to Sep that may still sway the Fed decision/shape Fed expectations, including another jobs report (2 Sep) and the Aug CPI inflation report (13 Sep) as well as Jackson Hole Symposium (25-27 Aug).”
Recession fears topping the agenda but yields are still set to edge further up in the coming months. Economists at Danske Bank have now incorporated a peak in yields in three to six months’ time. But on a six to twelve-month horizon, they estimate markets will seriously begin to price short rates at close to peaking and the next movement to be downwards.
Long yields still likely to tick up again
“We consider the fall in yields over the past one and a half month, which has taken yields back to their April levels, to be an overreaction, given the high inflation. Hence, we see upside risks to long yields over the next three to six months.”
“We continue to expect long yields to edge down slightly in 2023 as economic weakness materialises and inflationary pressures ease, which would likely see markets really starting to price lower short rates.”
“We now expect the 10Y US Treasury yield to rise by around 50bp to 3.25% in the coming three to six months. On a 12M horizon, we now expect the 10Y US yield to be 2.75%.”
- USD/CAD attracts some dip-buying on Friday amid a modest pickup in the USD demand.
- The prospects for additional Fed rate hikes, elevated US bond yields benefit the greenback.
- The recent rally in oil prices could underpin the loonie and keep a lid on any further gains.
The USD/CAD pair rebounds a few pips from the daily low and climbs to a fresh intraday peak during the first half of the European session. The pair is seen trading around the 1.2770 region and looking to recover further from a two-month low touched the previous day.
The US dollar builds on the overnight bounce from the lowest level since June and gains some positive traction on the last day of the week, which, in turn, offers some support to the USD/CAD pair. The recent comments by several Fed officials indicate that the US central bank would continue to tighten its monetary policy further. The hawkish Fed expectations allow the US Treasury bond yields to hold steady near a multi-week high and provide a modest lift to the greenback. That said, a combination of factors might hold back bulls from placing aggressive bets and keep a lid on any meaningful upside for the USD/CAD pair.
Market participants remain divided over the size of the next rate hike by the Fed amid signs of easing inflationary pressure in the US. The US CPI report showed that consumer prices were unchanged in July, while the US Producer Price Index unexpectedly fell in July for the first time in two years. The incoming data suggests that US inflation may have peaked, which, along with the risk-on impulse, might act as a headwind for the safe-haven greenback. Apart from this, this week's rally in crude oil prices could underpin the commodity-linked loonie and further contribute to capping gains for the USD/CAD pair, at least for now.
Even from a technical perspective, the post-US CPI fall and acceptance below the 100-day SMA pivotal support favours bearish traders. This makes it prudent to wait for strong follow-through buying before confirming that the USD/CAD pair has formed a bottom and positioning for any further appreciating move. Moving ahead, Friday's US economic docket features the release of the Preliminary Michigan US Consumer Sentiment Index. Apart from this, the US bond yields and the broader risk sentiment would drive the USD demand. This, along with oil price dynamics, should produce short-term opportunities around the USD/CAD pair.
Technical levels to watch
- Gold edges down for the third straight day amid a modest pickup in the USD demand.
- The risk-on impulse further exerts some downward pressure on the safe-haven metal.
- The uncertainty over the size of further rate hikes caps the USD and extends support.
Gold slips into negative territory for the third straight day on Friday and remains below the $1,800 mark through the first half of the European session. The XAU/USD is currently trading around the $1,787 area and the fundamental backdrop supports prospects for a further intraday depreciating move.
The US dollar gains some positive traction and moves away from its lowest level since late June touched the previous day, which, in turn, exerts some downward pressure on the dollar-denominated gold. The recent comments by several Fed officials indicate that the US central bank will continue to tighten its monetary policy further. In fact, San Francisco Fed President Mary Daly said that a 50 bps interest rate hike in September makes sense, though she is open to a bigger rate hike if data warrants it.
Earlier this week, St. Louis Fed President James Bullard, Chicago Fed President Charles Evans and Minneapolis Fed President Neel Kashkari also backed the case for additional rate hikes. The hawkish outlook allows the US Treasury bond yields to remain elevated near a multi-week high. This continues to act as a tailwind for the greenback and further act as a headwind for the non-yielding yellow metal. Apart from this, the risk-on mood further dents demand for safe-haven assets and weigh on gold.
Market participants, however, remain divided over the size of the next rate hike by the Fed amid signs of easing inflationary pressure in the US. The US CPI report released on Wednesday revealed that consumer prices were unchanged in July. Furthermore, the US Producer Price Index unexpectedly fell in July for the first time in two years, suggesting that inflation may have peaked. This could cap gains for the USD and help limit losses for gold, warranting some caution for aggressive bearish traders.
Moving ahead, Friday's US economic docket, featuring the Preliminary Michigan US Consumer Sentiment Index, might provide some impetus to gold later during the early North American session. Apart from this, the US bond yields will influence the USD price dynamics. Traders would further take cues from the broader market risk sentiment to grab short-term opportunities on the last day of the week.
Technical levels to watch
Following last week’s massive setback, the latest recovery of oil prices is likely to falter. In the view of strategists at Commerzbank, oil prices should continue to decline until the end of the year.
Market will be amply supplied in the coming months
“The oil market should be more than amply supplied for the time being.”
“We now envisage a Brent price of only $90 by year-end.”
“The EU oil embargo that will come into force at the end of the year will probably prevent any further price slide.”
Gold price has not managed to lastingly overcome the $1,800 mark this week. In the opinion of strategists at Commerzbank, it is too early to expect gold to make any real comeback.
Gold to continue battling with the $1,800 mark
“Though prices on the gold market have embarked on an upward trajectory because the massive appreciation of the US dollar has ended, at least for now, it is still too early to expect gold to make any real comeback.”
“The gold price is likely to continue battling with the $1,800 mark for the time being.”
“We are confident that the US dollar will appreciate again, especially vis-à-vis the euro, which is likely to weigh on the gold price in the medium term.”
Economist at UOB Group Enrico Tanuwidjaja assesses the latest interest rate decision by the Bank of Thailand (BoT).
Key Takeaways
“BOT voted 6 to 1 to raise its benchmark rate by 25bps to 0.75%, while 1 member preferred a larger 50bps hike.”
“BOT is of the view that given expectation of sustained growth recovery and higher inflation expectations ahead, the policy rate should start being normalized.”
“We keep our view for another 25bps back-to-back rate hike to 1.00% in Sep MPC meeting and to stay there for the rest of 2022, before possibly resuming hike in 2023.”
- EUR/USD loses the grip and returns below 1.0300.
- EMU Industrial Production expanded 2.4% YoY in June.
- US flash Consumer Sentiment next of note in the docket.
The single currency loses some shine and forces EUR/USD to retreat to the sub-1.0300 region on at the end of the week.
EUR/USD weaker on USD-reovery
EUR/USD gives away part of the recent advance - including fresh multi-week peaks near 1.0370 recorded in the wake of the lower-than-expected US inflation figures (August 10) - on the back of some profit taking in the risk complex along with fresh demand for the greenback.
The move lower in spot comes amidst a mild rebound in the German 10y Bund yields vs. modest losses in their American peers, all against the backdrop of a downbeat mood in the risk complex.
In the docket, Industrial Production in the broader Euroland expanded 2.4% in the year to June, surpassing initial consensus.
Later in the NA session, all the attention is expected to be on the release of the preliminary prints for the U-Mich index for the current month, which gauges the Consumer Sentiment.
What to look for around EUR
EUR/USD recedes from recent 5-week tops near 1.0370, as the greenback looks bid and some investors cash up part of the recent gains in the risk-associated universe.
Price action around the European currency, in the meantime, is expected to closely follow dollar dynamics, geopolitical concerns, fragmentation worries and the Fed-ECB divergence.
On the negatives for the single currency emerges the so far increasing speculation of a potential recession in the region, which looks propped up by dwindling sentiment gauges and the incipient slowdown in some fundamentals.
Key events in the euro area this week: EMU Industrial Production (Friday).
Eminent issues on the back boiler: Continuation of the ECB hiking cycle. Italian elections in late September. Fragmentation risks amidst the ECB’s normalization of monetary conditions. Impact of the war in Ukraine on the region’s growth prospects and inflation.
EUR/USD levels to watch
So far, spot is losing 0.17% at 1.0301 and a break below 1.0096 (weekly low July 26) would target 1.0000 (psychological level) en route to 0.9952 (2022 low July 14). On the other hand, the next up barrier comes at 1.0368 (monthly high August 10) seconded by 1.0523 (100-day SMA) and finally 1.0615 (weekly high June 27).
- EUR/GBP gains traction for the second straight day and climbs to over a two-week high on Friday.
- The BoE’s bleak outlook offsets mostly better-than-expected UK data and undermines the GBP.
- Upbeat Eurozone Industrial Production figures further provide a lift to the cross in the last hour.
- Concerns about the energy crisis in Europe could act as a headwind for the euro and cap the cross
The EUR/GBP cross attracts some buying for the second straight session on Friday and climbs to a two-and-half-week high during the first half of the European session. The cross is currently trading around the 0.8475-0.8480 region, up over 0.25% for the day.
The British pound continues with its underperformance amid the Bank of England's gloomy outlook, which, in turn, acts as a tailwind for the EUR/GBP cross. It is worth recalling that the UK central bank last week painted a particularly bleak picture and warned that a prolonged recession would start in the fourth quarter. This, to a larger extent, offsets Friday's mostly better-than-expected UK macroeconomic releases, which does little to impress the GBP bulls or hinder the pair's intraday positive move.
Meanwhile, the latest leg of a sharp spike witnessed over the past hour or so follows the release of Eurozone Industrial Production, which surpassed estimates and increased 0.7% MoM in June. That said, the emergence of some US dollar buying could act as a headwind for the shared currency. Apart from this, Europe's energy supply concerns, which could drag the Eurozone economy faster and deeper into recession, could cap gains for the EUR/GBP cross and warrant some caution for aggressive bulls.
In the latest development, the supply of Russian oil to three European countries through Ukraine was suspended as Western sanctions prevented the latter from accepting transit fees. This makes it prudent to wait for strong follow-through selling before confirming that the EUR/GBP cross has formed a near-term bottom and positioning for an extension of the recent recovery move from a four-month low.
Technical levels to watch
GBP/USD has come under fresh bearish pressure and declined below 1.2200 on Friday. The pair stays within a touching distance of the key support that aligns at 1.2175 and a failure of this level could bring in additional sellers, FXStreet’s Eren Sengezer reports.
Sellers look to take action as pound tests key support
“In case GBP/USD falls below 1.2175 (Fibonacci 23.6% retracement of the latest uptrend) and starts using that level as resistance, sellers could take action and trigger an extended downward correction toward 1.2150 (50-period SMA on the four-hour chart) and 1.2100 (Fibonacci 38.2% retracement, 100-period SMA).”
“On the upside, 1.2200 (psychological level) forms interim resistance before 1.2275 (the end-point of the uptrend) and 1.2300 (psychological level).”
The USD fell across the board after US inflation data for July came in lower than expected. Nonetheless, economists at UBS still expect the greenback to enjoy further gains against both the euro and the pound.
Worries about energy supply shortages and political uncertainty in the EU and the UK
“We still think the potential for USD strength versus the euro and British pound remains intact.”
“Our forecast for a weaker euro and sterling is based on worries about energy supply shortages and political uncertainty in the eurozone and the UK, which will remain an issue in the coming months.”
Eurozone’s Industrial Production increased more than expected in June, the official data published by Eurostat showed on Friday, suggesting that the bloc’s manufacturing sector activity recovery is back on track.
The industrial output in the old continent increased 0.7% MoM vs. a 0.2% rise expected and 2.1% last.
On an annualized basis, the industrial output rose by 2.4% in June versus a 0.8% rise expected and May’s 1.6%.
FX implications
The shared currency remains unfazed by the upbeat Eurozone industrial figures. At the time of writing, EUR/USD is trading -0.16% on the day at 1.0300.
About Eurozone Industrial Production
Industrial Production is released by Eurostat. It shows the volume of production of Industries such as factories and manufacturing. Uptrend is regarded as inflationary which may anticipate interest rates to rise. Usually, if high industrial production growth comes out, this may generate a positive sentiment (or bullish) for the EUR, while low industrial production is seen as a negative sentiment (or bearish).
The UK GDP data has just been released for both the month of June and for Q2. The June contraction has come in smaller than expected at -0.6%, which has resulted in a Q2 contraction of -0.1% Q/Q rather than the expected -0.2%. But in the view of economists at MUFG Bank, better UK GDP is less important for GBP than broader risk sentiment.
Smaller than expected June GDP contraction not to alter BoE’s outlook
“The better June GDP data will certainly come as a relief and could well provide some near-term support for the pound. But in reality, the better June print doesn’t change the overall backdrop and won’t alter at all the BoE’s outlook and hence its policy outlook.”
“The BoE was forecasting a rebound in Q3 GDP before we enter the five-quarter period of GDP contraction and today’s data doesn’t change that.”
“The good news for the pound is the risk sentiment is positive and we have seen a notable rebound in equities – if that sentiment is maintained it will help provide GBP support despite the poor economic outlook.”
- GBP/USD meets with a fresh supply on Friday and retreats further from the post-US CPI swing high.
- The BoE’s bleak outlook undermines the GBP and acts as a headwind amid a modest USD strength.
- The better-than-expected UK macro data does little to impress bulls or lend support to the major.
The GBP/USD pair turns lower for the second successive day on Friday and moves further away from the weekly high, around the 1.2275 area touched in the aftermath of the softer US CPI report. The steady intraday descent drags spot prices to a two-day low, around the 1.2170-1.2165 region during the first half of the European session.
The US dollar gains some positive traction on the last day of the week, which, in turn, attracts fresh selling around the GBP/USD pair. Despite the latest signs of easing US inflation, the recent hawkish comments by several Fed officials suggest that the US central bank would tighten its monetary policy further. The prospects for additional rate hikes by the Fed push the US Treasury bond yields to a multi-week high and offers some support to the greenback.
The British pound, on the other hand, continues to be undermined by the Bank of England's gloomy economic outlook. It is worth recalling that the UK central bank last week painted a particularly bleak picture and indicated that a prolonged recession in Britain would start in the fourth quarter. This, to a larger extent, offsets Friday's mostly better-than-expected UK macroeconomic releases and does little to impress bullish traders or lend any support to the GBP/USD pair.
Market participants, however, remain divided over the size of the next rate hike by the Fed. This, along with the risk-on impulse, seems to cap gains for the safe-haven USD and offers some support to the GBP/USD pair. Nevertheless, the fundamental backdrop favours bearish traders and supports prospects for a further depreciating move. Traders now eye the Preliminary Michigan US Consumer Sentiment Index for a fresh impetus later during the early North American session.
Technical levels to watch
Extra weakness carries the potential to drag USD/CNH to the 6.7100 region in the next weeks, say FX Strategists at UOB Group Lee Sue Ann and Quek Ser Leang.
Key Quotes
24-hour view: “Yesterday, we expected USD to ‘trade between 6.7200 and 6.7500’. USD subsequently dropped to 6.7216, rebounded to 6.7442 before closing at 6.7442 (+0.31%). We expect USD to trade sideways for today, likely within a range of 6.7350/6.7550.”
Next 1-3 weeks: “Our narrative from yesterday (11 Aug, spot at 6.7290) still stands. As highlighted, the rapid build-up in downward momentum suggests USD could weaken further to 6.7100. Only a break of 6.7650 (no change in ‘strong resistance’ level from yesterday) would indicate that USD is unlikely to weaken further.”
Germany’s Economy Ministry said in its monthly report on Friday, the economy faces "significantly poorer prospects" in the second half of the year due to reduced gas deliveries, increases in energy prices, supply chain issues and general uncertainty.
Despite, the dire economic outlook, Germany's 10-year yield, the benchmark for the euro area, rose above 1% for the first time since July 28.
Meanwhile, money markets continue to price in a full probability of a 50 bp hike in September.
At the time of writing, EUR/USD is trading at 1.0296, down 0.19% on the day.
EUR/USD has failed to clear the stiff resistance that sits at 1.0370 and has gone into a consolidation phase early Friday. The pair could extend correction if the 1.0300 resistance holds, FXStreet’s Eren Sengezer reports.
Euro could continue to edge lower toward the end of the week
“In case the pair starts using 1.0300, where the Fibonacci 50% retracement of the latest downtrend is located, as resistance, additional losses toward 1.0230 (Fibonacci 38.2% retracement, 200-period SMA on the four-hour chart) and 1.0200 (psychological level, 100-period SMA) could be witnessed.”
“On the flip side, 1.0370 (Fibonacci 61.8% retracement of the latest downtrend, Aug. 10 high) aligns as key resistance ahead of 1.0400 (psychological level) and 1.0450 (static level).”
- USD/JPY gains traction on Friday and moves away from over a one-week low set the previous day.
- The Fed-BoJ policy divergence and a positive risk tone undermine the JPY and act as a tailwind.
- The recent hawkish remarks by Fed officials help revive the USD demand and remain supportive.
The USD/JPY pair builds on the previous day's goodish recovery move from the 131.75-131.70 area, or a one-and-half-week low and gains some positive traction on Friday. The pair maintains its bid tone through the early part of the European session and is currently placed just below mid-133.00s.
A combination of factors undermine the Japanese yen and act as a tailwind for the USD/JPY pair amid a modest pickup in the US dollar demand. The overnight sharp spike in the US Treasury bond yields widens the US-Japan rate differential, which, along with a positive risk tone, weighs on the safe-haven JPY. Apart from this, a big divergence in the monetary policy stance adopted by the Bank of Japan and the Federal Reserve offers additional support to the major.
In fact, the BoJ has repeatedly said that it will stick to its ultra-easy policy settings. In contrast, the recent hawkish comments by several Fed officials indicated that the US central bank remains on track to tighten its monetary policy further. San Francisco Fed President Mary Daly, St. Louis Fed President James Bullard, Chicago Fed President Charles Evans and Minneapolis Fed President Neel Kashkari this week backed the case for additional interest rate hikes.
That said, signs of easing inflationary pressures in the US might have forced investors to trim bets for a 75 Fed rate hike at the September policy meeting. The US CPI report on Wednesday revealed that consumer prices were unchanged in July. Furthermore, the US Producer Price Index unexpectedly fell in July for the first time in two years, suggesting that inflation may have peaked. This, in turn, raises uncertainty over the size of the next rate hike by the Fed.
Nevertheless, the US central bank is still expected to raise its benchmark interest rates by at least 50 bps in September. Adding to this, the emergence of fresh buying on Thuesday supports prospects for a further near-term appreciating move for the USD/JPY pair. Market participants now look forward to the Preliminary Michigan US Consumer Sentiment Index. This, along with the US bond yields and the broader risk sentiment might provide some impetus to the major.
Technical levels to watch
Here is what you need to know on Friday, August 12:
The risk rally that was fueled by the soft US inflation data mid-week lost its steam and the market action turned choppy ahead of the weekend. The US Dollar Index moves sideways in a narrow channel above 105.00, the 10-year US T-bond yield holds above 2.8% and the US stock index futures post small daily gains following Wall Street's mixed performance on Thursday. June Industrial Production data will be featured in the European economic docket. Later in the day, investors will pay close attention to the University of Michigan's preliminary Consumer Sentiment Survey for August. The long-run inflation expectations component of the survey could trigger a market reaction during the American trading hours.
Although the data from the US showed on Thursday that producer inflation rose at a softer pace than expected in July, the greenback managed to stay resilient against its rivals amid a cautious market mood. Meanwhile, San Francisco Fed President Mary Daly told Bloomberg that she has an open mind on the possibility of a 75 basis points rate hike in September.
EUR/USD registered small daily gains on Thursday and seems to have gone into a consolidation slightly above 1.0300 on Friday.
GBP/USD continues to fluctuate in a narrow channel near 1.2200 in the early European morning as investors assess the latest data releases. The UK's Office for National Statistics reported on Friday that the Gross Domestic Product contracted by 0.1% on a quarterly basis in the second quarter. Moreover, Industrial Production and Manufacturing Production fell by 0.9% and 1.6%, respectively, on a monthly basis in July.
Gold closed flat on Thursday and stays on the backfoot near $1,790 early Friday with US Treasury bond yields holding steady during the European session.
USD/JPY staged a rebound after having dropped below 132.00 on Thursday but struggled to gather momentum. The pair clings to modest daily gains as it tries to stretch higher toward 133.50 on Friday.
Rising crude oil prices provide a boost to the commodity-sensitive loonie and USD/CAD continues to push lower toward 1.2700 on Friday. The barrel of West Texas Intermediate is up more than 6% this week.
Bitcoin touched its highest level since mid-June at around $25,000 but erased all of its daily gains to close at $24,000 on Thursday. BTC/USD stays calm near that level during the European morning. Ethereum lost its bullish momentum before reaching $2,000 and returned below $1,900. Nevertheless, ETH/USD is up more than 10% this week and remains on track to post sixth straight weekly gains.
- NZD/USD continues scaling higher on Friday and climbs to over a two-month high
- The uncertainty over the next Fed rate hike keeps the USD bulls on the defensive.
- A positive risk tone also seems to cap the USD and benefits the risk-sensitive kiwi.
The NZD/USD pair prolongs this week's strong move up and gains traction for the fifth successive day on Friday. The momentum lifts spot prices to over a two-month high, around the 0.6465-0.6470 region during the early European session.
The US dollar struggles to capitalize on the overnight bounce from its lowest level since late June and oscillated in a range on the last day of the week, which, in turn, lends support to the NZD/USD pair. The uncertainty over the size of the next rate hike by the US central bank seems to act as a headwind for the greenback.
The recent hawkish remarks by several Fed officials indicated that the Fed would stick to its policy tightening path. In fact, San Francisco Fed President Mary Daly, St. Louis Fed President James Bullard, Chicago Fed President Charles Evans and Minneapolis Fed President Neel Kashkari have backed the case for further interest rate hikes.
Furthermore, the markets are still pricing in at least a 50 bps Fed rate hike at the September meeting. This remains supportive of elevated US Treasury bond yields and offers some support to the USD. That said, signs of easing inflationary pressures in the US forced investors to trim bets for a 75 Fed rate hike at the September policy meeting.
The US CPI report on Wednesday revealed that consumer prices were unchanged in July. Adding to this, the US Producer Price Index unexpectedly fell in July for the first time in two years, suggesting that inflation may have peaked. This, along with a positive risk tone, undermines the safe-haven buck and benefits the risk-sensitive kiwi.
The latest leg has managed to find acceptance above the 100-day SMA. This could be seen as a fresh trigger for bulls and supports prospects for a further near-term appreciating move. Nevertheless, the NZD/USD pair remains on track to end the week with strong gains and record its highest weekly close since late May.
Market participants now look forward to the release of the Michigan US Consumer Sentiment Index, due later during the early North American session. Apart from this, the US bond yields would drive the USD demand. Traders would further take cues from the broader risk sentiment to grab short-term opportunities around the NZD/USD pair.
Technical levels to watch
UK’s second quarter (Q2) Gross Domestic Product (GDP) shrank less than expected. The EUR/GBP is trading around the 0.8450 mark and could edge higher to the 0.8485 area, according to economists at ING.
2Q22 UK GDP data not quite as bad as expected
“UK 2Q22 GDP data came in marginally better than expected. The data can probably keep expectations alive that the Bank of England (BoE) will hike 50 bps on 15 September.”
“And ever-rising expectations for how much higher the UK energy price cap will be adjusted (and what it means for the peak of UK inflation) will probably mean the BoE stays hawkish all year.”
“EUR/GBP is slightly stronger than we thought and could edge up to the 0.8485 area. But given the challenges faced on the continent, we would not chase EUR/GBP higher.”
Gold still faces a determined Fed tightening policy and a strong USD. If market sentiment shifts to a 50 bps rate hike as opposed to 75 bps, this may act to limit the near-term downside for the yellow metal, in the view of analysts at HSBC.
Near-term upside for gold is limited
“As the Fed is still committed to raising rates, so as to fight escalating prices, this is negative for gold, especially when the USD looks firm. The outlook for Fed policy and global growth is likely to prove USD supportive over the short to medium term, even though the path to this further USD strengthening over the coming months is unlikely to be a straight line upwards.”
“The combination of rising yields, strong USD, quantitative tightening and the end of significant fiscal spending in most economies argue against any sustained gold rally over the medium term. However, this may change, if confidence in monetary authorities wanes.”
“Gold prices are sensitive to real yields (the nominal yield of a bond minus the rate of inflation), notably the US 10-year real yields. A limit on how high the real yield may rise could act to curb the negative impact on gold of tighter monetary policies. Geopolitical risks would also provide some support for gold.”
- AUD/USD braces for the biggest weekly gain since November 2020 inside one-month-old ascending trend channel.
- Overbought RSI conditions suggest pullback from the stated channel’s resistance.
- 200-SMA holds the key for bear’s entry, bulls can aim for June’s peak beyond 0.7150 nearby hurdle.
AUD/USD grinds higher around intraday top surrounding 0.7125 heading into Friday’s European session. In doing so, the Aussie pair remains inside a one-month-old upward sloping bullish trend channel while rising for the third consecutive day.
It’s worth noting that the quote is near the upper end of the stated channel amid the nearly overbought RSI, which in turn suggests that the bulls are running out of steam while bracing for the biggest weekly gains since November 2020. This highlights the 0.7150 level for the bears.
However, the 50% Fibonacci retracement level of the June-July downside, near 0.6980, precedes the aforementioned channel’s support line, close to 0.6930, to challenge the AUD/USD downside.
Also acting as important support is the 200-SMA level surrounding 0.6895.
Alternatively, the AUD/USD pair’s successful run-up beyond the 0.7150 hurdle will have to cross the 78.6% Fibonacci retracement level of 0.7155 to direct the bulls towards June’s peak of 0.7282.
Overall, AUD/USD is on the bull’s radar but may witness a pullback.
AUD/USD: Four-hour chart
Trend: Limited upside expected
EUR/USD struggles near 1.03. Economists at ING expect the pair to trade back lower toward the 1.0275 mark.
Gas developments remain worrying
“This week's move in gas prices has sent eurozone terms of trade towards the worst levels of the year and is a clean euro negative.”
“Given that we are slightly bullish on the dollar today, we think that the recent EUR/USD correction has stalled in the 1.0350/0400 resistance area and would favour a move back to 1.0275 today.”
The highlight of today's relatively quiet session will be US August consumer sentiment data. In the view of economists at ING, cheaper gasoline should help US confidence and the dollar.
Rising consumer confidence should be good news all around
“We look for an upside surprise in consumer sentiment after US gasoline's fall to $4 from $5/gallon over the last month. We also get fresh inflation expectations data. How will markets read the data? A drop in inflation expectations may suggest the Fed can be more relaxed on inflation. But there are no signs of that coming through in its rhetoric. Instead, the bigger impact may be the bounce in consumer sentiment, reduced fears of a 2023 recession, and the pricing out of some of the 50 bps of easing expected in 2H23. This should be a dollar-positive development.”
“Heavily weighted to the low yielders, DXY should be able to edge a little higher today. A break above 105.50 would go a long way to stabilising it after the heavy losses suffered on Wednesday's US CPI release.”
- GBP/JPY gains some positive traction on Friday and recovers further from the weekly low.
- Mostly better-than-expected UK macro data benefits the British pound and offers support.
- The offered tone surrounding the safe-haven JPY remains supportive of the positive move.
The GBP/JPY cross builds on the overnight goodish bounce from the 161.25 area, or the weekly low and gains some positive traction on Friday. Spot prices hold steady above mid-162.00s following the release of mostly better-than-expected UK macro data, though lack bullish conviction.
The British pound draws some support from the Preliminary UK GDP report, which showed that the economy shrank 0.1% during the second quarter of 2022 as compared to the 0.2% fall estimated. On an annualized basis, the UK GDP growth stood at 2.9% against the 2.8% anticipated. Furthermore, the UK Manufacturing and Industrial Production figures surpassed expectations, which, in turn, acted as a tailwind for the GBP/JPY cross.
The Index of services, however, declined by -0.4% 3M/3M in June and missed consensus for a 0.9% rise. Adding to this, the negative monthly readings validate the Bank of England's gloomy economic outlook and act as a headwind for the GBP/JPY cross. It is worth recalling that the UK central bank last week painted a particularly bleak picture and indicated that a prolonged recession would start in the fourth quarter.
The downside, however, remains cushioned amid the offered tone surrounding the Japanese yen. A big divergence in the monetary policy stance adopted by the Bank of Japan and other major central banks, along with signs of stability in the financial markets, turn out to be key factors undermining the safe-haven JPY.
The mixed fundamental backdrop warrants some caution for aggressive bullish traders. Moreover, the recent range-bound price action witnessed over the past two weeks or so points to indecision among trades. This further makes it prudent to wait for strong follow-through buying before positioning for any further gains.
Technical levels to watch
Economists at Westpac believe that the current level of USD/JPY could be justified. Furthermore, they expect the pair to trade at 123 by the end of 2023.
Recent move in USD/JPY to 132 could prove unsustainable in the near term
“While we suspect the recent move in USD/JPY from almost 140 to 132 could prove unsustainable in the near term, as Japan benefits from Asian growth and the downtrend in energy prices persists, fundamentals will justify the current level of yen by end-2022.”
“Additional gains are then likely in 2023 as US interest rate expectations reprice, narrowing the differential, and as growth in Japan largely keeps pace with the US. By end-2023, we see USD/JPY at 123.”
The recent US dollar decline is just the start. Economists at Westpac expect the greenback to lose ground against the euro, sterling and Canadian dollar.
Canadian economy seems more resilient to current headwinds than the US
“EUR/USD is seen appreciating to 1.09 end-2022 and 1.15 end-2023.”
“A robust gain is anticipated for the UK’s sterling to 1.26 end-2022 and 1.34 by end-2023.”
“Modest additional support for the US dollar downtrend should also come from Canada’s dollar, with their economy seemingly more resilient to current headwinds than the US. To our forecast move in USD/CAD from 1.29 currently to 1.25 end-2023, risks are skewed downward given the anticipated broad-based US dollar decline over the period.”
FX option expiries for August 12 NY cut at 10:00 Eastern Time, via DTCC, can be found below.
- EUR/USD: EUR amounts
- 1.0050-55 2.1
- 1.0200-05 1.2b
- 1.0225-30 675m
- 1.0265 326m
- 1.0300-10 2.8b
- 1.0325 814m
- 1.0350 841m
- 1.0400 410m
- GBP/USD: GBP amounts
- 1.2100 462m
- 1.2300 576m
- USD/JPY: USD amounts
- 134.00 1.6b
- 135.00 266m
- 135.45 300m
- USD/CHF: USD amounts
- 0.9400 325m
- 0.9550 260m
- 0.9700 300m
- AUD/USD: AUD amounts
- 0.6950 358m
- 0.7100 689m
- USD/CAD: USD amounts
- 1.2700 1.45b
- 1.2795-00 1.1b
- 1.2850 311m
- 1.2975 425m
- The index manages to leave behind part of the recent drop.
- US yields come under some mild downside pressure.
- Preliminary Consumer Sentiment next on tap in the docket.
The greenback attempts a tepid rebound and revisits the low-105.00s when tracked by the US Dollar Index (DXY) at the end of the week.
US Dollar Index now looks to data
The index trades with marginal gains just above the 105.00 yardstick after four consecutive daily pullbacks ahead of the opening bell in the old continent on Friday.
The better mood in the dollar comes amidst a small decline in US yields across the curve, which give away part of Thursday’s advance, and some profit taking sentiment in the risk complex.
In the meantime, the greenback continues to navigate in a context favourable to the riskier assets, particularly after July’s lower-than-expected US inflation figures removed traction from a potential 75 bps rate hike at the Fed gathering next month.
On the latter, San Francisco Fed M.Daly (2024 voter, hawk) said late on Thursday that the baseline case is a 50 bps rate hike in September, although she could favour a larger raise if necessary.
According to CME Group’s FedWatch Tool, the probability of a half point increase in the Fed Funds Target Range in September is more than 62%.
In the US data space, the advanced Consumer Sentiment gauged by the U-Mich Index will be the salient event later in the NA session.
What to look for around USD
The index remains under pressure in the 105.00 zone amidst the recent improvement in the risk-associated universe and rising speculation of a 50 bps rate hike by the Fed next month.
The dollar, in the meantime, is poised to suffer some extra volatility amidst investors’ repricing of the next move by the Federal Reserve.
Looking at the macro scenario, the dollar appears propped up by the Fed’s divergence vs. most of its G10 peers (especially the ECB) in combination with bouts of geopolitical effervescence and occasional re-emergence of risk aversion.
Key events in the US this week: Flash Consumer Sentiment (Friday).
Eminent issues on the back boiler: Hard/soft/softish? landing of the US economy. Escalating geopolitical effervescence vs. Russia and China. Fed’s more aggressive rate path this year and 2023. US-China trade conflict. Future of Biden’s Build Back Better plan.
US Dollar Index relevant levels
Now, the index is gaining 0.10% at 105.19 and the breakout of 107.42 (weekly high post-FOMC July 27) would expose 109.29 (2022 high July 15) and then 109.77 (monthly high September 2002). On the other hand, a break below 104.63 (monthly low August 10) would expose 103.67 (weekly low June 27) and finally 103.65 (100-day SMA).
- EUR/GBP renews intraday high, before ticking lower, while staying inside a trend widening chart pattern.
- UK Q2 GDP shrank 0.1% QoQ versus -0.2% expected, monthly statistics came out softer on MoM, firmer on YoY.
- Double top around 0.8470 tests bulls, bears need validation from 200-HMA.
EUR/GBP remains pressured around 0.8460-55 area after an initial wick to 0.8447 on the UK’s firmer-than-expected growth numbers. However, the actual figures are way low under the previous readings and hence keep buyers hopeful despite the initial pullback.
That said, the headline UK Q2 GDP flashed -0.1% QoQ figures versus -0.2% forecast and 0.8% previous readings, per the first estimations from the UK’s National Statistics. Additionally details suggest that the monthly GDP contracted 0.6% MoM versus -1.3% expected and 0.5% prior. Further, the Industrial Production and Manufacturing Production readings marked upbeat YoY figures while reporting the softer monthly data, which are better than forecast disappointed.
Also read: GBP/USD seesaws 30-pip around 1.2200 on better-than-expected Q2 UK GDP
It should be noted that the trend widening megaphone formation restricts the EUR/GBP moves between 0.8480 and 0.8420.
However, the latest bearish signals from the MACD hint at the quote’s weakness towards the support. Also acting as the downside filter is the 200-HMA level of 0.8415.
Meanwhile, the double tops around 0.8470 guard immediate recovery moves of the EUR/GBP ahead of the 0.8480 hurdle comprising the stated megaphone’s upper line.
In a case where the quote rises past 0.8480, the odds of witnessing the 0.8500 threshold on the chart can’t be ruled out.
EUR/GBP: Hourly chart
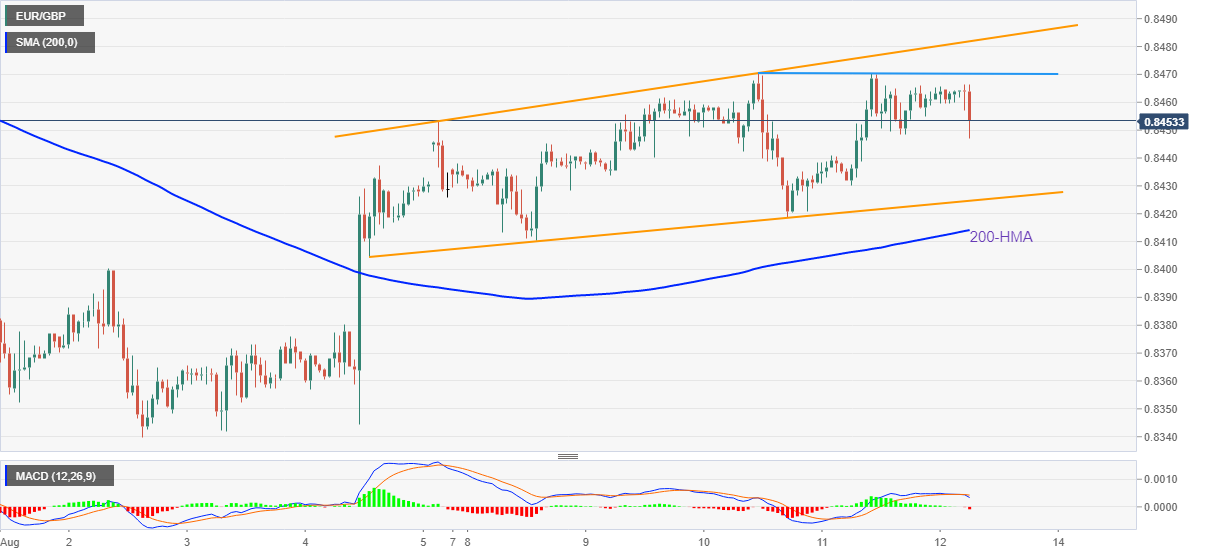
Trend: Gradual upside expected
The failure to hold above $1,800 could renew downward pressure in XAU/USD. If gold price slips below $1,770, support may not be found until $1,700, analysts at ANZ Bank report.
Gold could come under increasing pressure
“The candlestick formation on Wednesday showed a bearish signal, as the price opened and closed near the day’s low. Prices are near the 50-day moving average. Settling below that would suggest that the price could again fall to the $1,750 range.”
“Should prices fall in the downward channel, the market could come under increasing pressure. A print back in the range of downtrend could see the price heading below $1,700.”
The Turkish lira has regained some footing after veering dangerously close to the 18.00 mark versus the US dollar. Economists at Commerzbank believe that there is no real protection against the next big move in the USD/TRY pair.
Efforts to attract foreign capital have had little impact
“The seasonally-adjusted current-account deficit narrowed slightly month-on-month (although it is still recording a wide $3.3bn deficit in absolute terms). What is more significant for the exchange rate is the continued net outflow on portfolio as well as banking sector sides.”
“Efforts to attract foreign capital by promising FX-protected instruments or opening up the local bond market further have had little impact. And this very likely reflects a lack of policy credibility and central bank credibility at the broader level among investors. Which in turn means that there is no real protection against the next big move in USD/TRY.”
- GBP/USD initially spiked up before retreating on the UK data-dump.
- UK Q2 GDP contracted 0.1%, monthly statistics remained fairly mixed for June.
- US dollar weakness initially helped cable bulls but Fed’s resistance to welcome inflation probed upside momentum.
- First impressions of the US Michigan Consumer Sentiment Index for August will be eyed to confirm inflation-linked optimism.
GBP/USD takes rounds to 1.2200, paring intraday losses, as the UK’s second quarter (Q2) Gross Domestic Product (GDP) shrank less than expected. It’s worth noting that the rest of the data-dump statistics, mainly monthly, marked better-than-expected figures but the actual readings are way too low than their priors.
That said, the headline UK Q2 GDP flashed -0.1% QoQ figures versus -0.2% forecast and 0.8% previous readings, per the first estimations from the UK’s National Statistics. Additionally details suggest that the monthly GDP contracted 0.6% MoM versus -1.3% expected and 0.5% prior. Further, the Industrial Production and Manufacturing Production readings marked upbeat YoY figures while reporting the softer monthly data, which are better than forecast disappointed. The figures couldn’t renew optimism for the GBP/USD traders as the Bank of England (BOE) has already conveyed fears of economic weakness. Hence, the quote remains pressured despite the latest rebound.
Also read: UK Manufacturing Production drops 1.6% MoM in June vs. -1.8% expected
On the other hand, the US Dollar Index (DXY) struggles to defend the bounce off a six-week low after declining for the last five consecutive days. The greenback’s previous losses could be linked to the downbeat prints of the US inflation data and firmer employment figures. However, the Fed policymakers’ resistance to welcoming the much-awaited change in price pressure seems to challenge the market’s optimism.
It should be noted that the UK’s political uncertainty, after Boris Johnson’s readiness to step down, joins the Brexit-linked pessimism to exert additional downside pressure on the GBP/USD prices. Recently, the final two candidates for the UK Prime Minister’s (PM) post, namely ex-Chancellor Rishi Sunak and Foreign Minister Liz Truss, are likely head-to-head as the former lauds his strategies while the latter pushes for diplomatic conditions.
Having witnessed the initial reaction to the UK data dump, the GBP/USD traders should wait for the preliminary reading of the US US Michigan Consumer Sentiment Index for August, expected at 52.5 versus 51.5 prior, for clear directions. Also important will be the chatters surrounding inflation and the Fed’s next move.
Technical analysis
The GBP/USD pair’s further weakness aims for the 21-DMA support around 1.2090. However, a clear downside break of the previous resistance line from mid-June, around 1.1940 at the latest, could challenge the bears afterward. Meanwhile, recovery moves remain limited until crossing an 11-week-old downward sloping resistance line, at 1.2245 by the press time.
Economists at Commerzbank have changed their EUR/USD forecast. They expect levels only slightly below parity and continued recovery of the EUR/USD exchange rate in 2023.
Recession and weak euro
“Because we now expect a recession in the euro area in our base scenario, we anticipate EUR/USD exchange rates around and below parity by the end of the year.”
“For 2023, we continue to expect a recovery of the EUR/USD exchange rate but have become more cautious. Our EUR/USD price target for 2023 is now only 1.10.”
USD/JPY remains poised for some near-term side-lined trading prior to a potential drop to the 131.65 area, note FX Strategists at UOB Group Lee Sue Ann and Quek Ser Leang.
Key Quotes
24-hour view: “Our view for USD to ‘consolidate and trade between 132.30 and 133.60’ was incorrect as it dropped sharply to 131.72 before rebounding strongly to end the day slightly higher at 133.00 (+0.10%). The strong rebound amidst slowing downward momentum suggests USD is unlikely to weaken further. For today, USD is more likely to trade sideways between 132.30 and 133.80.”
Next 1-3 weeks: “We highlighted yesterday (11 Aug, spot at 132.85) that USD could consolidate for a couple of days first before declining to 131.65. USD subsequently dropped to 131.72 before rebounding strongly. We continue to see room for USD to decline to 131.65. A break of this level would shift the focus to 130.40. On the upside, a breach of 134.40 (no change in ‘strong resistance’ from yesterday) would indicate that USD is unlikely to weaken further.”
Open interest in natural gas futures markets rose by around 6.1K contracts after five consecutive daily drops on Thursday, according to preliminary readings from CME Group. In the same line, volume went up for the second session in a row, this time by around 92.5K contracts.
Natural Gas: On its way to the 2022 high
Prices of natural gas rose sharply on Thursday, reaching the third daily advance in a row. The marked improvement in prices was accompanied by rising open interest and volume, exposing the continuation of the uptrend in the very near term. That said, the next target of note emerges at the 2022 peak at $9.75 per MMBtu (July 26).
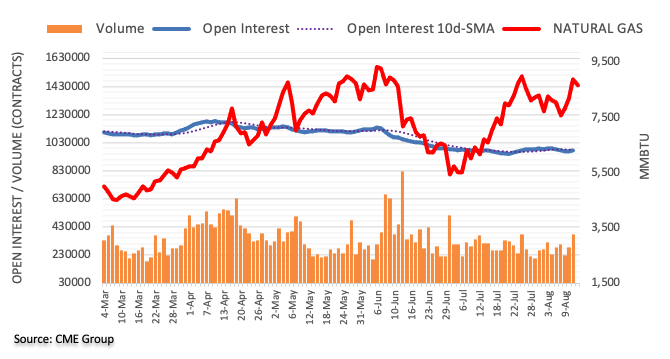
The industrial sector recovery dwindled in June, the latest UK industrial and manufacturing production data published by Office for National Statistics (ONS) showed on Friday.
Manufacturing output arrived at -1.6% MoM in June versus -1.8% expectations and 1.7% booked in May while total industrial output came in at -0.9% vs. -1.3% expected and 2.6% last.
On an annualized basis, the UK manufacturing production figures came in at 1.3.% in June, beating expectations of 0.9%. Total industrial output rose by 2.4% in the sixth month of the year against a 1.6% reading expected and the previous 1.8% print.
Separately, the UK goods trade balance numbers were published, which arrived at GBP-22.847 billion in June versus GBP-22.3 billion expectations and GBP-20.666 billion last. The total trade balance (non-EU) came in at GBP-12.29 billion in June versus GBP-9.603 billion previous.
Related reads
- UK Preliminary GDP shrinks 0.1% QoQ in Q2 vs. -0.2% expected
- GBP/USD seesaws 30-pip around 1.2200 on better-than-expected Q2 UK GDP
- Oil prices are likely to rebound firmly as IEA has stepped up demand forecasts.
- Substitution of natural gas to oil ahead of Winters is strengthening the black gold.
- Trimmed odds for Fed’s hawkish guidance are also supporting oil prices.
West Texas Intermediate (WTI), futures on NYMEX, has witnessed a minor pullback to near $93.00 after printing a weekly high of $94.20. The black gold is expected to extend its pullback move towards $92.00 but will confidently end the week on a promising note.
Oil prices have recovered sharply this week after the International Energy Agency (IEA) stepped up the demand forecasts dramatically. Energy prices are soaring worldwide as winter is coming and the demand for natural gas is likely to remain on the rooftop. Natural Gas consumers tend to shift to oil to cater to the bulk demand of energy for winters.
Apart from that, the demand for gasoline is accelerating as prices remained on the back foot lately. Therefore, the market participants are discounting the anticipation of a rebound in gasoline prices into oil prices.
Meanwhile, plummeted US dollar index (DXY) after the release of the US Consumer Price Index (CPI) also supported the oil prices. A downward shift in the annual plain-vanilla CPI has triggered inflation exhaustion signals, which have failed to trim the Federal Reserve (Fed) rate hike forecast but will surely trim the extent of hawkish guidance.
Going forward, investors will focus on China’s Retail Sales data, which is due next week. The economic data is expected to improve to 5% from the prior release of 3.1%. It is worth noting that China is the leading consumer of oil in the world and an improvement in China’s Retail Sales may have a positive impact on oil prices.
- Quarterly GDP for the UK contracted by 0.1% in Q2 vs. -0.2% expected.
- UK GDP arrived at -0.6% MoM in June vs. -1.3% expected.
- GBP/USD recaptures 1.2200 on upbeat UK GDP.
The British economy contracted 0.1% QoQ in the three months to June when compared with a 0.8% growth booked in Q1 and -0.2% expectations.
On an annualized basis, the UK GDP grew 2.9% in Q2 vs. 2.8% expected and an 8.7% expansion seen in the previous quarter.
The UK GDP monthly release showed that the economy shrank in June, coming in at -0.6% vs. -1.3% expected and 0.5% previous.
Meanwhile, the Index of services (June) arrived at -0.4% 3M/3M and 0% prior and 0.9% anticipated.
Citing ONS, MNI reported that “there were positive contributions from consumer-facing services, including accommodation and food service activities, and arts, entertainment and recreation activities. There was a 0.2% decrease in real household consumption.”
Market reaction
The cable picked up fresh bids and briefly recaptured 1.2200 on the upbeat UK growth numbers. The spot is down 0.19% on the day, currently trading at 1.2191.
About UK GDP
The Gross Domestic Product released by the National Statistics is a measure of the total value of all goods and services produced by the UK. The GDP is considered as a broad measure of the UK economic activity. Generally speaking, a rising trend has a positive effect on the GBP, while a falling trend is seen as negative (or bearish).
Gold has struggled to find acceptance above the $1,800 mark. But in the view of FXStreet’s Haresh Mengani, XAU/USD bulls have the upper hand.
Sustained move beyond $1,800 awaited
“Given the recent strong rebound from a 16-month low touched in July, the set-up still seems tilted in favour of bullish traders.”
“A subsequent move beyond the $1,800 mark, towards testing the post-US CPI swing high near the $1,808 region, remains a distinct possibility. Some follow-through buying would set the stage for a rise towards the next relevant hurdle near the $1,824-$1,825 region.”
“Any meaningful slide now seems to find decent support near the $1,774 area. Sustained weakness below would expose the $1,754-$1,752 strong resistance breakpoint, now turned support, which should now act as a key pivotal point. A convincing breakthrough would shift the bias in favour of bearish traders and drag gold towards the $1,728 intermediate support en route to the $1,715 zone.”
According to FX Strategists at UOB Group Lee Sue Ann and Quek Ser Leang, AUD/USD could extend the upside to the 0.7170 region near term.
Key Quotes
24-hour view: “Yesterday, we held the view that ‘the overbought advance in AUD could test 0.7120 first before a more sustained pullback is likely’. The anticipated advance exceeded our expectations as AUD rose to 0.7136 before pulling back. The pullback amidst overbought conditions suggests AUD is unlikely to advance further. For today, AUD is more likely to trade sideways, expected to be within a range of 0.7060/0.7130.”
Next 1-3 weeks: “Our update from yesterday (11 Aug, spot at 0.7080) still stands. As highlighted, AUD is likely to strengthen further and the level to monitor is at 0.7170. Overall, the current AUD strength is intact as long as it does not move below 0.7015 (strong support’ level was at 0.6990 yesterday).”
- USD/CAD takes offers to refresh intraday low, prints three-day downtrend at two-month bottom.
- Oversold RSI conditions, short-term key support line challenge bears.
- Recovery remains elusive until staying below 61.8% Fibonacci retracement level.
USD/CAD bears keep reins for the third consecutive day around the lowest levels since June 10. That said, the Loonie pair refreshes its intraday low near 1.2745 heading into Friday’s European session.
With this, the quote pokes a 1.5-month-old downward sloping support line, around 1.2750-45 by the press time.
However, the receding bearish bias of MACD and the oversold RSI conditions challenge the sellers’ further dominance.
Also acting as a downside filter is the latest bottom surrounding 1.2730-25 and the 1.2700 threshold.
In a case where USD/CAD prices remain bearish past 1.2700, the 78.6% Fibonacci retracement level of June-July upside, near 1.2665, should return to the charts.
Meanwhile, recovery moves need to cross the 61.8% Fibonacci retracement, around 1.2790, as well as the 1.2800 round figure to convince buyers.
Even so, the upside momentum remains doubtful until the quote stays firmer above the 200-SMA, surrounding 1.2910 at the latest.
Overall, USD/CAD remains on the bear’s radar but the immediate downside appears limited.
USD/CAD: Four-hour chart
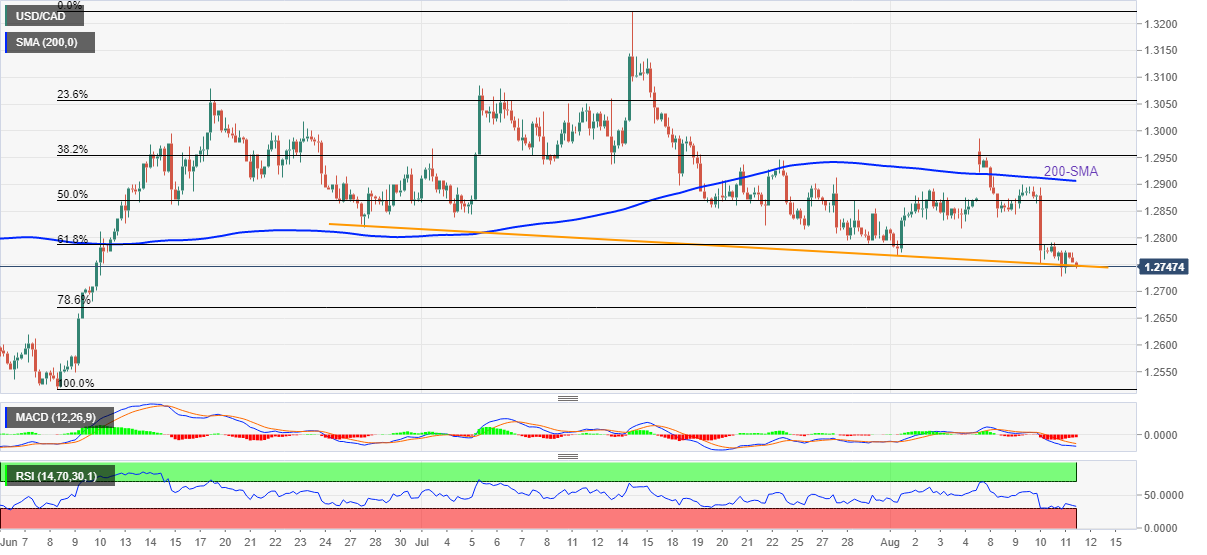
Trend: Corrective pullback expected
CME Group’s flash data for crude oil futures markets noted open interest rose by nearly 6K contracts on Thursday. Volume followed suit and rose for the third session in a row, this time by around 11.5K contracts.
WTI: Further upside above the 200-day SMA
Prices of the barrel of the WTI extended the weekly recovery on Thursday. The uptick was on the back of rising open interest and volume and leaves the door open to further upside in the near term. If the commodity clears the 200-day SMA, today at $95.45, it could allow for extra uptrend to, initially the $100.00 mark per barrel.
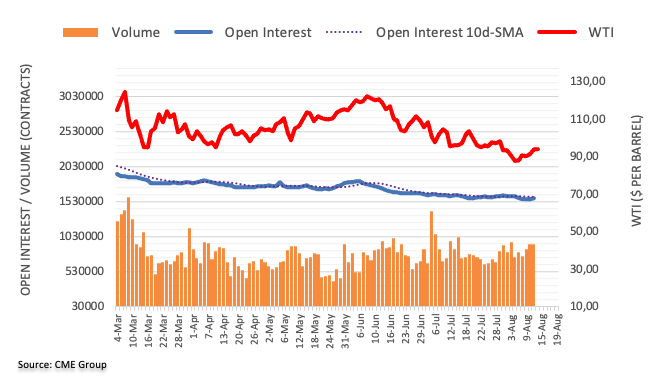
GBP/USD needs to clear the 1.2300 level to allow for sustained gains in the short-term horizon, suggest FX Strategists at UOB Group Lee Sue Ann and Quek Ser Leang.
Key Quotes
24-hour view: “We highlighted yesterday that GBP ‘is unlikely to advance further’ and we expected GBP to ‘trade between 1.2160 and 1.2260’. GBP subsequently traded within a narrower range than expected (1.2185/1.2250) before closing largely unchanged at 1.2215 (-0.02%). The current movement appears to be part of a consolidation phase and GBP is likely to trade sideways for today. That said, the slightly softened underlying tone suggests a lower range of 1.2160/1.2240.”
Next 1-3 weeks: “Yesterday (11 Aug, spot at 1.2215), we highlighted that while the risk for GBP has shifted to the upside, it has to crack major resistance at 1.2300 before further sustained advance is likely. There is no change in our view. The upside risk is intact as long as GBP does not move below 1.2125 (no change in ‘strong support’ level).”
Considering advanced prints from CME Group for gold futures markets, traders increased their open interest positions for the second session in a row on Thursday, this time by around 2.4K contracts. On the other hand, volume reversed two consecutive daily builds and shrank by around 40.4K contracts.
Gold: Gains appear limited just above $1,800
Gold prices edged lower for the second session in a row on Thursday amidst rising open interest, which is indicative that extra weakness could be in store in the very near term. In the meantime, the $1,800 region continues to emerge as the immediate magnet for gold bulls.
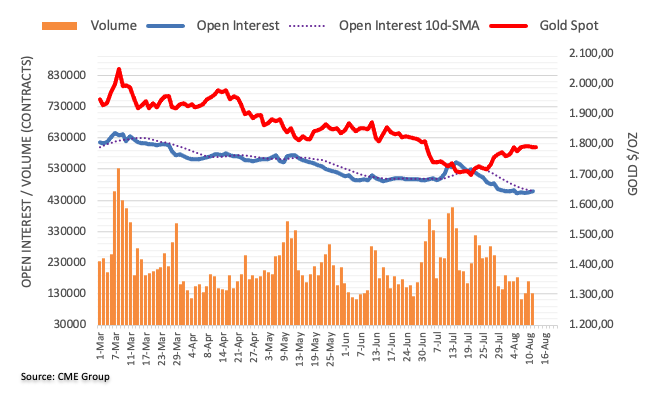
- Gold price remains sidelined while keeping the previous day’s bounce off 50-DMA.
- US dollar struggles to regain traction even as Fed policymakers resist welcoming easy CPI/PPI.
- Yields retreat from three-week high to print the first daily loss in four.
- US Michigan Consumer Sentiment Index eyed to confirm receding fears of inflation.
Gold price (XAU/USD) remains sidelined at around $1,790 heading into Friday’s European session as traders seek fresh clues to overcome the dilemma surrounding US inflation and the Fed’s next moves.
Recently, President and Chief Executive Officer of the Federal Reserve Bank of San Francisco Mary Daly mentioned that she is open to a 75bps rate hike in September. Previously, Minneapolis Fed President Neel Kashkari favored higher rates and Chicago Fed President Charles Evans sounded grim over the economic transition.
In doing so, the Fed policymakers fail to welcome the latest weakness in the inflation data. On Thursday, the US Producer Price Index (PPI) for July tracked the headline Consumer Price Index (CPI) while easing to 9.8% YoY versus 11.3% prior and 10.4% market forecasts, the data published by the US Bureau of Labor Statistics revealed. Details suggest that the monthly PPI dropped to the lowest levels since May 2020, to -0.5% compared to 1.0% expected and 0.2% prior, which in turn signaled more easing of inflation fears. Elsewhere, US Initial Jobless Claims eased to 262K for the week ending August 6 versus 263K expected and downwardly revised 248K prior.
Amid these plays, the US 10-year Treasury yields retreat from a three-week high, also snapping a three-day uptrend, amid recession fears. However, Wall Street closed mixed and Asia-Pacific shares outside Japan grind lower.
It should be noted that the pessimism surrounding the US-China tension over Taiwan and covid woes in Beijing also negatively affect gold prices due to the dragon nation’s status as the world’s largest commodity user. Recently, Fitch ratings mentioned that they anticipate a recovery in China's tourism spending in 2h22 as pandemic-related controls are relaxed.
Moving on, the first reading of the US Michigan Consumer Sentiment Index (CSI) for August, expected at 52.5 versus 51.5 prior, is important for the XAU/USD traders to overcome the latest indecision.
Technical analysis
Gold price floats above the 50-DMA support near $1,780, despite closing below a three-week-old ascending trend line the previous. The upside momentum also takes clues from the firmer RSI.
However, the receding bullish bias of the MACD signals challenges the XAU/USD bulls.
Also raising doubts about the metal’s further upside is the convergence of the previous support line from July 21 and the 61.8% Fibonacci retracement level of the June-July downtrend, around $1,805.
Should the metal prices stay successfully beyond $1,805, the run-up towards the 100-DMA level surrounding $1,838 can’t be ruled out.
On the contrary, a daily closing below the 50-DMA support of around $1,780 could open the doors for the bullion’s south-run towards the monthly low surrounding $1,754.
Gold: Daily chart
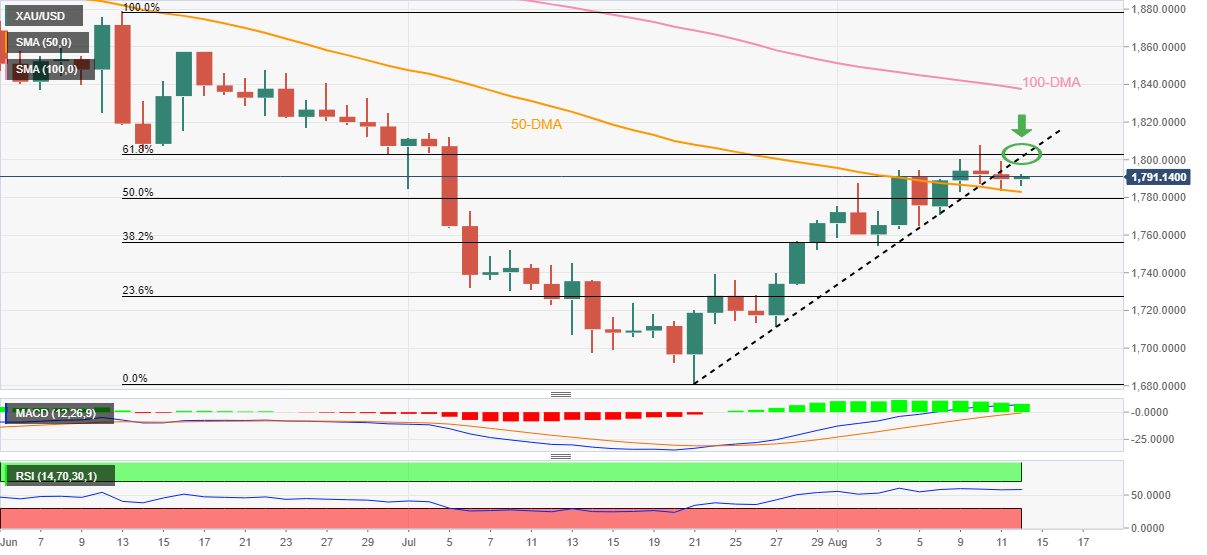
Trend: Sideways
The UK Economic Data Overview
The British economic calendar is all set to entertain the cable traders in early Friday, at 06:00 GMT, with the preliminary GDP figures for Q2 2022. Also increasing the importance of that time are monthly GDP figures for March, Trade Balance, Manufacturing Production, and Industrial Production details for the stated period.
Having witnessed an 8.7% YoY jump in economic activities during the previous quarter, market players might not get delighted with the first estimation of the Q1 GDP figures, expected 2.8% YoY, as it is insufficient to back the BOE’s rate hikes. More interestingly, the QoQ figures are expected to display a de-growth of 0.2% against the expansion of 0.3%.
On the other hand, the GBP/USD traders also eye the Index of Services (3M/3M) for the same period, bearing forecasts of 0.9% versus 0.1% prior, for further insight.
Meanwhile, Manufacturing Production, which makes up around 80% of total industrial production, is expected to contract to 1.8% MoM in June versus 1.4% in May. Further, the total Industrial Production is also expecting a contraction of 1.3% against a positive reading of 0.9% MoM.
Considering the yearly figures, the Industrial Production for June is expected to improve to 1.6% versus 1.4% previous whereas the Manufacturing Production is anticipated to have weakened to 0.9% in the reported month versus 2.3% last.
Separately, the UK Goods Trade Balance will be reported at the same time and is expected to show a deficit of £22.3 billion versus a £21.44 billion deficit reported in the last month.
Deviation impact on GBP/USD
Readers can find FX Street's proprietary deviation impact map of the event below. As observed the reaction is likely to remain confined around 20-pips in deviations up to + or -2, although in some cases, if notable enough, a deviation can fuel movements over 30-40 pips.
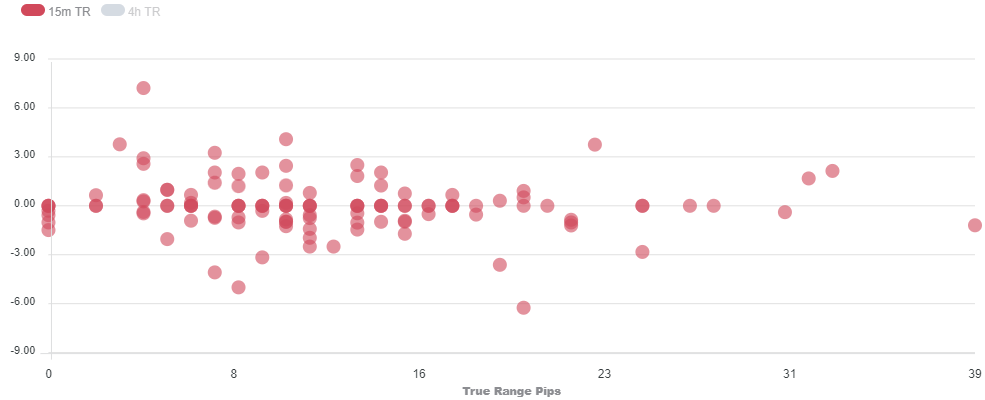
How could affect GBP/USD?
GBP/USD is hovering around the immediate hurdle of 1.2200 after a modest rebound from 1.2185. The asset defended Wednesday’s low at around 1.2180 but is now displaying a torpid rebound, which could be fragilized effortlessly by the market participants.
Cable’s upside momentum is backed by a significant decline in the US dollar index (DXY). After displaying a downward print in the US Consumer Price Index (CPI), a sense of optimism in the FX domain that the Federal Reserve (Fed) won’t hike rates now vigorously underpinned the risk-sensitive assets.
However, any headline over UK’s political domain could bring wild swings in the GBP/USD pair. The pound bulls still fear the UK’s political instability. After the resignation of UK PM Boris Johnson, a sense of high volatility is engaged with the sterling.
Apart from that, an underperformance by the UK economic data will create more troubles for the Bank of England (BOE). The central bank is already stuck in the laborious job of dealing with ramping up inflation and over that, a slump in growth rates will restrict the BOE to combat price pressures with full power.
The UK households are forced to higher payouts due to ramping inflation and subdued Average Hourly Earnings, which is hurting their sentiment and the overall demand. Over that, the release of weak GDP data will cripple the pound bulls.
While considering this, FXStreet’s Anil Panchal said,
The BOE has already revealed its grim outlook and hence today's UK GDP are less likely to surprise the markets even after avoiding technical recession.
Key Notes
GBP/USD slides below 1.2200 with eyes on UK GDP, US Michigan Consumer Sentiment Index
GBP/USD struggles around 1.2200 ahead of UK GDP data
GBP/USD retraces from weekly highs, approaches 1.2200
About the UK Economic Data
The Gross Domestic Product released by the Office for National Statistics (ONS) is a measure of the total value of all goods and services produced by the UK. The GDP is considered as a broad measure of the UK economic activity. Generally speaking, a rising trend has a positive effect on the GBP, while a falling trend is seen as negative (or bearish).
The Manufacturing Production released by the Office for National Statistics (ONS) measures the manufacturing output. Manufacturing Production is significant as a short-term indicator of the strength of UK manufacturing activity that dominates a large part of total GDP. A high reading is seen as positive (or bullish) for the GBP, while a low reading is seen as negative (or bearish).
The trade balance released by the Office for National Statistics (ONS) is a balance between exports and imports of goods. A positive value shows trade surplus, while a negative value shows trade deficit. It is an event that generates some volatility for the GBP.
In the opinion of FX Strategists at UOB Group Lee Sue Ann and Quek Ser Leang, EUR/USD is expected to meet a decent hurlde around the 1.0400 region in the next weeks.
Key Quotes
24-hour view: “We expected EUR to ‘trade sideways between 1.0260 and 1.0350’ yesterday. EUR subsequently dipped to 1.0274, rose to 1.0365 before easing off to close at 1.0317 (+0.19%). We continue to expect EUR to trade sideways, likely between 1.0280 and 1.0360.”
Next 1-3 weeks: “We continue to hold the same view as from yesterday (11 Aug, spot at 1.0300). As highlighted, further EUR strength appears likely even though overbought shorter-term conditions suggest a slower pace of advance. The next resistance level of note is at 1.0400. On the downside, a break of 1.0230 (no change in ‘strong support’ level from yesterday) would indicate that the current upward pressure has eased.”
- Steel price prints mild gains on the way to fourth weekly uptrend.
- China real-estate market’s conditions, restart of steel manufacturing units challenge bulls.
- Fedspeak, US-China tussles and firmer yields are an extra burden on the metal prices.
- Increased prices of iron ore, recently easy inflation data add to the bullish catalysts.
Steel price grinds higher during the early Friday as metal buyers struggle amid mixed concerns. Even so, the industrial metal braces for the fourth consecutive weekly gain as recently softer US dollar and increased prices of iron ore favor commodity bulls.
That said, steel rebar futures on the Shanghai Futures Exchange rise 0.9%, while hot-rolled coil climbs 0.6% heading into the European session.
On the other hand, Reuters mentioned that the most-traded iron ore contract, for delivery in January next year, on China's Dalian Commodity Exchange dropped as much as 2.5% to 716 yuan ($106.16) a tonne. The contract, however, was still on track for a weekly gain of more than 1% driven by a rebound in margins at mills.
China’s decarbonization goals and a sector-wide consolidation plan to eliminate overcapacity have been the major catalysts for controlling the steel output in the dragon nation.
Elsewhere, US President Joe Biden’s pause in announcing tariff relaxations to China, actually the removal of the Trump-era tariffs, gained major attention and renewed the Sino-US tussles to weigh on the market sentiment, as well as weigh on the steel price. Additionally, a jump in the coronavirus cases from China and Taiwan’s criticism of the “One China” policy, as well as US House Speaker Nancy Pelosi’s support for Taipei, act as an extra burden on the metal prices.
On a broader front, the recently easy US Consumer Price Index (CPI) and Producer Price Index (PPI) data eased the market’s fears of the Fed’s heavy rate hikes. However, the recently hawkish comments from the policymakers have been challenging the optimism amid a light calendar.
Looking forward, the US Michigan Consumer Sentiment Index (CSI) for August, expected at 52.5 versus 51.5 prior, will be important for fresh impulse.
- USD/JPY is sensing exhaustion signals after hitting a high of 133.50.
- The impact of lower US CPI has faded away and hawkish Fed bets are hogging the limelight.
- The US Michigan CSI is expected to improve to 52.2 from the prior release of 51.5.
The USD/JPY pair has slipped minutely after printing an intraday high of 133.50. On a broader note, the asset has displayed a pullback move after a perpendicular fall on Wednesday. Now, the pullback move is likely to get exhausted amid the unavailability of a potential trigger.
The US dollar index (DXY) is declining gradually but is managing to sustain above the crucial hurdle of 105.00. After a massive decline on the softer release of the US Consumer Price Index (CPI), investors are shifting their focus again on the likely hawkish stance of the Federal Reserve (Fed) in the September monetary policy meeting.
Markets cheered the downward shift in the US Consumer Price Index (CPI), which landed at 8.5% lower than the expectations of 8.7% and the prior release of 9.1%. A one-time slowdown in the US inflation is not sufficient to have a ball as price pressures are still extremely deviated from the desired levels. Therefore, the Fed will continue on its path of accelerating interest rates. For the record, the extent of hawkish guidance will trim abruptly.
In today’s session, the entire focus will remain on the US Michigan Consumer Sentiment Index (CSI). The data is likely to improve to 52.2 from the prior release of 51.5.
On the Tokyo front, the ongoing cabinet reshuffle is expected to result in a dramatic change in the situation of the Japanese yen on a broader basis. Finance Minister Shunichi Suzuki said that Japan’s financial position is still severe. He added that “it's critical to continue reacting to covid and inflation.”
- Asian equities remained pressured while tracking Wall Street’s pattern.
- Fed policymakers’ resistance in welcoming easy inflation weigh on sentiment.
- Sino-American tussles, light calendar also act as extra trading filters.
- Japan’s Nikkei 225 appears the outlier while refreshing seven-month high.
Asia-Pacific shares remain mostly inactive, trending lower, outside Japan as traders seek fresh clues while tracking Wall Street’s moves during early Friday.
While portraying the mood, MSCI's broadest index of Asia-Pacific shares outside Japan fell 0.10% intraday and Australia’s ASX 200 0.80%. Japan’s Nikkei 225, however, appears to outshine the others while printing 2.80% daily gains by the press time.
The return of Japanese traders after Thursday’s national holidays appeared to have propelled the Nikkei 225 equity gauge, especially after the receding odds of the Fed’s aggression due to the easy inflation numbers.
However, the Fed policymakers continue to defend the hawkish moves. Among them, San Francisco Fed President Mary Day was the recent one who backed opportunities of witnessing another 75 basis points (bps) of a rate hike in September, while also suggesting an upfront 0.50% rate hike to be sure. Previously, Minneapolis Fed President Neel Kashkari and Chicago Fed President Charles Evans sounded grim. That said, Fed’s Kashkari mentioned that he hasn't "seen anything that changes" the need to raise the Fed's policy rate to 3.9% by year-end and to 4.4% by the end of 2023. Further, Fed policymaker Evens stated, “The economy is almost surely a little more fragile, but would take something adverse to trigger a recession.” Fed’s Evans also called inflation "unacceptably" high.
It’s worth noting that the US Producer Price Index (PPI) for July tracked the headline Consumer Price Index (CPI) while easing to 9.8% YoY versus 11.3% prior and 10.4% market forecasts, the data published by the US Bureau of Labor Statistics revealed on Thursday. Details suggest that the monthly PPI dropped to the lowest levels since May 2020, to -0.5% compared to 1.0% expected and 0.2% prior, which in turn signaled more easing of inflation fears. Elsewhere, US Initial Jobless Claims eased to 262K for the week ending August 6 versus 263K expected and downwardly revised 248K prior.
Alternatively, US President Joe Biden’s pause in announcing tariff relaxations to China, actually the removal of the Trump-era tariffs, gained major attention and renewed the Sino-US tussles to weigh on the market sentiment in China. Additionally, a jump in the coronavirus cases from China also propels the risk-off mood. Furthermore, Taiwan’s criticism of the “One China” policy and US House Speaker Nancy Pelosi’s support for Taipei acts as an extra burden on the equities in China, Australia and New Zealand.
It should be noted that the increased odds of the 50 basis points (bps) rate hike by the Reserve Bank of New Zealand (RBNZ) exert additional downside pressure on New Zealand’s NZX 50, down 0.65% intraday by the press time.
Elsewhere, stocks in India, South Korea and Indonesia trade mixed while S&P 500 Futures also remain indecisive by the press time.
Moving on, traders should pay attention to the key data from the UK and India before preparing for the first impressions of the US Michigan Consumer Sentiment Index (CSI) for August, expected at 52.5 versus 51.5 prior.
Also read: Michigan Consumer Sentiment Index Preview: Good news for the dollar but not for households
- AUD/USD fails to capitalize on the early upside amid a souring mood.
- Falling Treasury yields cap USD recovery, offering aussie some support.
- Acceptance above 200 DMA is critical for AUD bulls after recent gains.
AUD/USD is defending minor bids just above 0.7100, helped by a pause in the US dollar recovery ahead of the Consumer Sentiment data.
Risk sentiment remains in a weaker spot amid fresh covid concerns in China, hawkish Fed commentary and looming recession risks. The risk-off flows revive the demand for the safe-haven US government bonds, which trigger a sell-off in the Treasury yields, in turn, acting as a drag on the American dollar.
Reuters reported that Shanghai recorded a single coronavirus case on Friday while several towns and cities are already under lockdowns over the past week. Renewed China’s covid lockdowns concerns re-ignite growth fears, adding to the sour market mood.
Meanwhile, the hawkish comments from Fed policymakers continue to suggest that the US central bank will continue with its rate hike plan to curb inflation, as a one-time softening in the US CPI and PPI figures is not enough to dissuade the Fed’s commitment to fighting inflation.
Aggressive Fed tightening expectations also sap investors’ confidence in riskier assets such as equities, aussie dollar etc. Markets now await the US Preliminary Michigan Consumer Sentiment data for fresh trading opportunities in the pair.
Technically, AUD/USD has eased after running into the critical flattish 200-Daily Moving Average (DMA) resistance at 0.7121.
Acceptance above the latter is needed to extend the ongoing recovery towards 0.7150, the psychological barrier.
The 14-day Relative Strength Index (RSI) is trading flat above the midline, keeping buyers hopeful. The 21 DMA is set to cut the 100 DMA for the upside, adding credence to the upside in the spot.
However, rejection once again at the 200 DMA will prompt the aussie to revisit the daily lows of 0.7088, below which the 0.7050 level will come into play.
AUD/USD: Daily chart
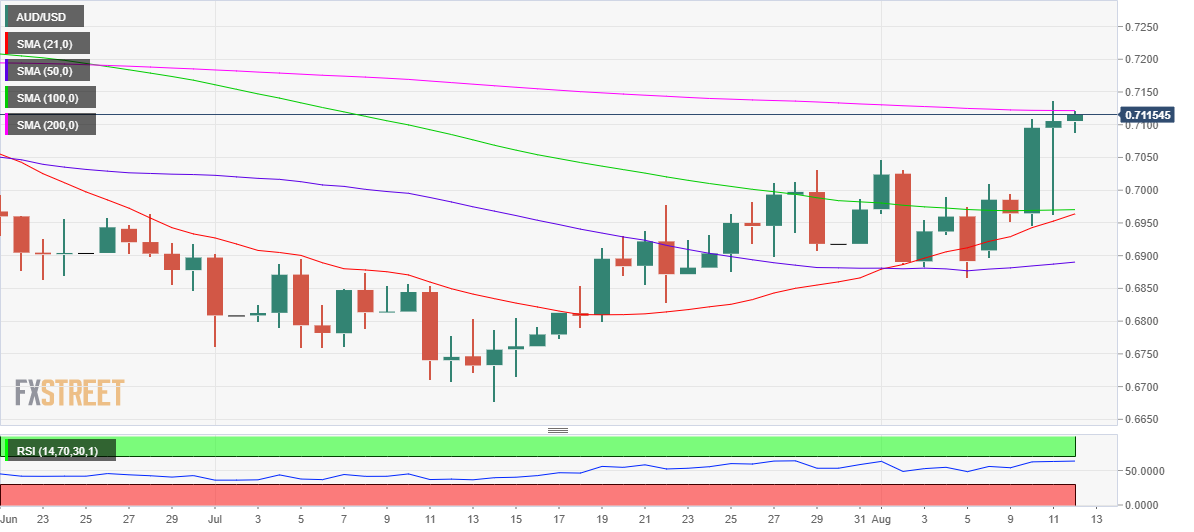
AUD/USD: Additional levels to consider
- USD/INR grinds higher after rising the most in six weeks the previous day.
- Hawkish Fedspeak, fears surrounding China challenge traders ahead of long weekend in India.
- Indian CPI is likely to have eased in July but the distance from RBI’s target will be the key to watch.
USD/INR braces for Indian inflation around 79.65-70 during Friday’s Asian session, after rising the most since late June the previous day.
The market’s risk-aversion wave and no major positives at home propelled the USD/INR prices the previous day. However, cautious sentiment ahead of the Indian Consumer Price Index (CPI) for July and the first impressions of the US Michigan Consumer Sentiment Index (CSI) for August seems to restrict the quote’s latest moves.
Hawkish Fedspeak, despite the downbeat US inflation numbers, propelled the US Treasury yields and favored the USD/INR buyers the previous day.
On Thursday, the US Producer Price Index (PPI) for July tracked the headline Consumer Price Index (CPI) while easing to 9.8% YoY versus 11.3% prior and 10.4% market forecasts, the data published by the US Bureau of Labor Statistics revealed. Details suggest that the monthly PPI dropped to the lowest levels since May 2020, to -0.5% compared to 1.0% expected and 0.2% prior, which in turn signaled more easing of inflation fears. Elsewhere, US Initial Jobless Claims eased to 262K for the week ending August 6 versus 263K expected and downwardly revised 248K prior.
However, the Fed policymakers resist cheering the latest weakness in price pressure as San Francisco Fed President Mary Day recently backed opportunities of witnessing another 75 basis points (bps) of a rate hike in September, while also suggesting an upfront 0.50% rate hike to be sure. Previously, Minneapolis Fed President Neel Kashkari and Chicago Fed President Charles Evans sounded grim. That said, Fed’s Kashkari mentioned that he hasn't "seen anything that changes" the need to raise the Fed's policy rate to 3.9% by year-end and to 4.4% by the end of 2023. Further, Fed policymaker Evens stated, “The economy is almost surely a little more fragile, but would take something adverse to trigger a recession.” Fed’s Evans also called inflation "unacceptably" high.
Elsewhere, firmer oil prices also weighed on the USD/INR prices, due to India’s reliance on energy imports and record high Current Account Deficit (CAD). WTI crude oil prints a 0.30% intraday loss at around $93.00, snapping a three-day uptrend, amid downbeat demand forecasts for 2022 by the Organization of the Petroleum Exporting Countries (OPEC) and the International Energy Agency (IEA), published on Thursday, appear to weigh on the quote. Before that, a softer US dollar appeared to have helped the black gold prices.
On a different page, US President Joe Biden’s pause in announcing tariff relaxations to China, actually the removal of the Trump-era tariffs, gain major attention and renew the Sino-US tussles to weigh on the market sentiment. Additionally, a jump in the coronavirus cases from China also propels the USD/INR pair. Furthermore, Taiwan’s criticism of the “One China” policy and US House Speaker Nancy Pelosi’s support for Taipei acts as an extra flavor to the pair buyers.
Amid these plays, Wall Street began Thursday on a positive side before closing mixed while the US 10-year Treasury yields rallied 10 basis points (bps) to 2.88% at the latest. It’s worth noting that the S&P 500 Futures remains indecisive at around 4,215 and the US Treasury yields remain firmer by the press time.
Moving on, USD/INR traders should pay attention to the Indian CPI data for July, expected 6.78% versus 7.01% prior, for fresh impulse. India's retail inflation likely eased in July due to a fall in food and fuel prices yet stayed well above the Reserve Bank of India's upper tolerance limit for a seventh consecutive month, a Reuters poll found ahead of the data release.
Following that, US Michigan Consumer Sentiment Index (CSI) for August, expected at 52.5 versus 51.5 prior, will be important to watch for clear directions.
Also read: Michigan Consumer Sentiment Index Preview: Good news for the dollar but not for households
Technical analysis
A daily closing beyond the monthly resistance line, now support around 79.50, keeps USD/INR buyers hopeful of reaching the 80.00 threshold one more time.
- EUR/USD is back in the red as the US dollar extends the overnight recovery.
- US Treasury yields hold near multi-week top amid hawkish Fed commentary.
- US Preliminary UoM Consumer Sentiment data eyed for fresh Fed rate hike pricing.
EUR/USD is trading close to the 1.0300 mark, struggling to find demand amid an extended recovery in the US dollar across the board.
The market mood remains mixed so far this Friday, as investors reassess the Fed rate hike expectations amid easing US consumer and factory-gate inflation while officials at the world’s most powerful central bank continue to back big rate increases to tame stubbornly high inflation.
Fed expectations and US data in focus
San Francisco Fed Mary Daly said early Friday, a 50 bps rate hike in September "makes sense" given the recent economic data including on inflation but added that she is open to a bigger rate hike if data warrants. Money markets are now pricing in a 65% chance of a 50 bps hike in September and a 35% chance of a 75 bps lift-off.
Investors are quick to buy into the dips in the US dollar amid hopes that the Fed will continue on its rate hike journey, limiting the upside attempts in the pair. The US Treasury yields also hold onto the recent upswing, with the benchmark 10-year rates hovering near three-week highs of 2.902%.
Meanwhile, markets fully price in a 50 bps ECB rate hike in September but increasing odds of a recession in the euro area, in the wake of the deepening gas crisis, keep hurting EUR bulls.
Attention now turns towards the Eurozone Industrial Production and Current Account data for fresh trading impetus. The main event risk, however, remains the US UoM Preliminary Consumer Sentiment Index due later in the NA for fresh re-pricing of the Fed rate hike odds and its eventual impact on the dollar valuations.
EUR/USD technical levels to consider
- Gold price is looking to defend the key support yet again amid listless trading.
- Treasury yields, US dollar heal post-soft US CPI-led wounds ahead of Fed minutes.
- XAU/USD battle lines are well-defined near the $1,800 mark, where next?
Gold price is moving back and forth in a familiar range while trading close to the $1,800 mark, as the rebound in the US dollar and the Treasury yields keep bears in control. Markets don’t seem to be convinced that the Fed will alter its tightening cycle, in the face of the first signs of peak inflation, exerting downward pressure on the non-interest-bearing bullion. However, bulls continue to find comfort from growing recession fears amid renewed Chinese lockdown concerns and the deepening European gas crisis. Despite the listless trading over the past few days, XAU/USD remains on track to book the fourth weekly gain. Attention now turns towards the Fed July meeting’s minutes due for release next week for a fresh direction in the bright metal. In the meantime, the Fed rate hike expectations, growth fears and Fedspeak will continue to influence the metal price.
Also read: Gold Price Forecast: Losing bullish potential below $1,800
Gold Price: Key levels to watch
The Technical Confluence Detector shows that the gold price is defending the crucial support at $1,784, which is the convergence of the SMA50 one-day and the Fibonacci 23.6% one-week.
Should sellers find acceptance below the latter, the next downside cap at $1,780 will come into play. At that level, the Fibonacci 38.2% one-week and SMA10 one-day intersect.
The last line of defense for gold bulls is seen at the pivot point one-day S2 at $1,775.
Alternatively, sellers are aligned near $1,792 to guard the upside, the meeting point of the SMA10 four-hour and the Fibonacci 38.2% one-day.
Further up, the confluence of the previous week’s high and the pivot point one-week R1 at $1,796 will challenge the bearish commitments.
The $1,800 round figure and the monthly high of $1,808 will be next on buyers’ radars.
Here is how it looks on the tool
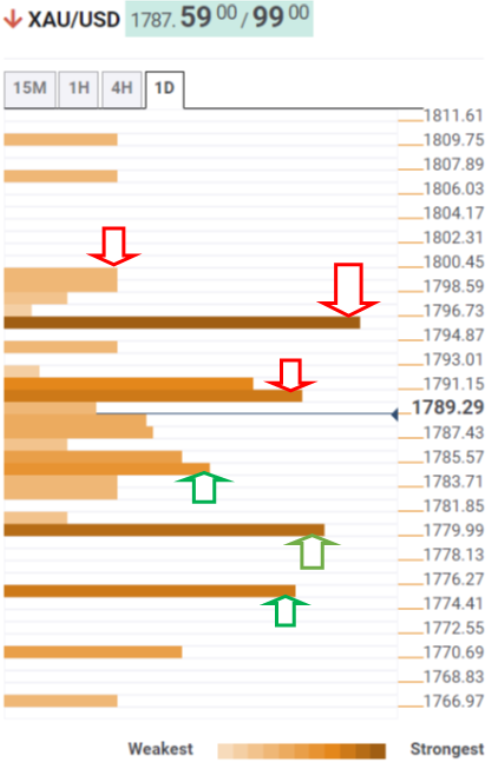
About Technical Confluences Detector
The TCD (Technical Confluences Detector) is a tool to locate and point out those price levels where there is a congestion of indicators, moving averages, Fibonacci levels, Pivot Points, etc. If you are a short-term trader, you will find entry points for counter-trend strategies and hunt a few points at a time. If you are a medium-to-long-term trader, this tool will allow you to know in advance the price levels where a medium-to-long-term trend may stop and rest, where to unwind positions, or where to increase your position size.
| Raw materials | Closed | Change, % |
|---|---|---|
| Silver | 20.31 | -1.43 |
| Gold | 1789.67 | -0.16 |
| Palladium | 2274.07 | 1.5 |
- USD/CAD treads water around the lowest levels in two months.
- Global markets jitter as Fed policymakers resist cheering easy inflation figures.
- OPEC, IEA oil demand forecasts join cautious mood to weigh on energy prices.
- Flash forecasts for August month Michigan Consumer Sentiment Index will be crucial for fresh impulse.
USD/CAD dribbles inside a choppy range between 1.2760 and 1.2770 during Friday’s sluggish Asian session. In doing so, the Loonie pair traces the market’s inaction even as the sour sentiment underpins the US dollar's rebound from the lowest levels in six weeks.
That said, the US Dollar Index (DXY) picks up bids to consolidate the weekly losses around 105.25 by the press time.
The greenback’s latest gains could be linked to the comments from San Francisco Fed President Mary Day who backed opportunities of witnessing another 75 basis points (bps) of a rate hike in September, while also suggesting an upfront 0.50% rate hike to be sure. Previously, Minneapolis Fed President Neel Kashkari and Chicago Fed President Charles Evans sounded grim. That said, Fed’s Kashkari mentioned that he hasn't "seen anything that changes" the need to raise the Fed's policy rate to 3.9% by year-end and to 4.4% by the end of 2023. Further, Fed policymaker Evens stated, “The economy is almost surely a little more fragile, but would take something adverse to trigger a recession.” Fed’s Evans also called inflation "unacceptably" high.
It should be noted that the Fed policymakers’ latest comments contrast with the recent easing in the US inflation data and firmer employment numbers.
On Thursday, the US Producer Price Index (PPI) for July tracked the headline Consumer Price Index (CPI) while easing to 9.8% YoY versus 11.3% prior and 10.4% market forecasts, the data published by the US Bureau of Labor Statistics revealed on Thursday. Details suggest that the monthly PPI dropped to the lowest levels since May 2020, to -0.5% compared to 1.0% expected and 0.2% prior, which in turn signaled more easing of inflation fears. Elsewhere, US Initial Jobless Claims eased to 262K for the week ending August 6 versus 263K expected and downwardly revised 248K prior.
On a different page, softer prices of Canada’s main export item WTI crude oil also put a floor under the USD/CAD pair. That said, WTI crude oil prints a 0.30% intraday loss at around $93.00, snapping a three-day uptrend, amid downbeat demand forecasts for 2022 by the Organization of the Petroleum Exporting Countries (OPEC) and the International Energy Agency (IEA), published on Thursday, appear to weigh on the quote.
Also read: WTI eases towards $93.00 on OPEC/EIA demand forecasts, USD rebound
Against this backdrop, Wall Street began Thursday on a positive side before closing mixed while the US 10-year Treasury yields rallied 10 basis points (bps) to 2.88% at the latest. It’s worth noting that the S&P 500 Futures remains indecisive at around 4,215 and the US Treasury yields remain firmer by the press time.
Looking forward, the first impressions of the US Michigan Consumer Sentiment Index (CSI) for August, expected at 52.5 versus 51.5 prior, will be important to watch for clear directions.
Also read: Michigan Consumer Sentiment Index Preview: Good news for the dollar but not for households
Technical analysis
Although the 200-DMA level surrounding 1.2745 challenges the USD/CAD bears, recovery moves need validation from the 1.2800 resistance, comprising the 100-DMA, to convince the buyers.
USD/CHF snaps four-day downtrend, grinds higher around the intraday top of 0.9426 as sellers retreat from the lowest levels since April, marked the previous day. In doing so, the Swiss currency (CHF) pair ignores recently positive options market signals ahead of the preliminary readings of the US Michigan Consumer Sentiment Index (CSI) for August.
That said, one-month USD/CHF risk reversal (RR), a difference between the call options and the put options, prints the strongest negative figures since July 29.
With this, the daily options market gauge turned out to be -0.015 while the weekly RR prints the -0.010 mark. It should be noted that the USD/CHF RR for the week jumped the most in five weeks by the end of last Friday.
Also read: USD/CHF Price Analysis: Surrenders the 200-DMA as sellers eye 0.9200
- US dollar bulls are moving in following a significant sell-off in the greenback.
- US yields perked up towards the end of the week as hawkish Fed sentiment overrides softer US inflation data.
The US dollar, DXY, was set for its third weekly loss in four against its rivals, but the bulls are moving in on the final day of the week in a turnaround in US yields and mix sentiment surroufing the outlook for the Federal Reserve. At the time of writing, DXY is trading at 105.2810, up 0.18% on the day so far.
Benchmark US 10-year Treasury yields were oscillating near a three-week peak, recovering on Thursday as San Francisco Federal Reserve Bank President Mary Daly said a 50-basis-point interest rate hike in September "makes sense" given the recent economic data including inflation. Crucially, she also said that she is still open to a bigger rate hike if data warrants.
Earlier this week, US Fed policymakers noted that they would continue to tighten monetary policy until price pressures were fully broken. Following yesterday's CPI, Neel Kashkari unleashed his inner hawk and said the July CPI data did not change his expected rate path, though he was happy to see inflation surprise to the downside. Kashkari stressed that the Fed is far from declaring victory over inflation and stressed that recession “will not deter me” from getting to the 2% target.
Fed funds futures traders are now pricing in a 61.5% chance of a 50-basis-point hike in September and a 38.5% chance of a 75-basis-point increase. Analysts at Brown Brothers Harriman explained that WIRP is now showing only 45% odds of a 75 bp hike at the September 20-21 FOMC meeting vs. 80% before the CPI data.
''Looking ahead, the swaps market is now pricing in a 3.5% terminal rate vs. 3.75% at the start of this week. We think the markets are once again overreacting to one data point. The battle to lower inflation is likely to be long and protracted, with most Fed policymakers looking at an extended tightening cycle. Yes, we may have seen the worst in terms of inflation, but we are a long way from the Fed’s 2% target. Markets should also reprice the more dovish expectations in the coming days and weeks.''
Meanwhile, analysts at TD Securities argued that ''a potential inflation peak (and associated end to Fed terminal rate price discovery) is an important ingredient to call the top in the USD.''
''The other key (and arguably) more important ingredient is the outlook for global growth. On that factor, we don't think it is time to completely fade the USD, though the recent backdrop reductions convictions on USD long exposure,'' the analysts explained.
- Market sentiment remains divided amid a light calendar, mixed clues.
- S&P 500 Futures extend pullback from three-month high, yields snap three-day uptrend at 12-day peak.
- Softer PPI, CPI fail to reject Fed hawks, China headlines, recession also test optimism.
After an upbeat mid-week, global markets remain sluggish as they await the final dossier of the key data during Friday’s Asian session. Also keeping the traders on their toes are the mixed feelings surrounding inflation and growth, not to forget fears of geopolitical and trade tussles.
While portraying the mood, Wall Street began Thursday on a positive side before closing mixed while the US 10-year Treasury yields rallied 10 basis points (bps) to 2.88% at the latest. It’s worth noting that the S&P 500 Futures remains indecisive around 4,215 and the US Treasury yields remain firmer by the press time.
Starting with the inflation, US Producer Price Index (PPI) for July tracked the headline Consumer Price Index (CPI) while easing to 9.8% YoY versus 11.3% prior and 10.4% market forecasts, the data published by the US Bureau of Labor Statistics revealed on Thursday. That said, the monthly PPI dropped to the lowest levels since May 2020, to -0.5% compared to 1.0% expected and 0.2% prior, which in turn signaled more easing of inflation fears.
In addition to the receding inflation woes, the softer prints of the US Weekly Jobless Claims also portrayed improvement in the employment scenario, tracking the recent job numbers from the world’s largest economy, which in turn helped to build the risk-on mood. That said, US Initial Jobless Claims eased to 262K for the week ending August 6 versus 263K expected and downwardly revised 248K prior.
Even so, President and Chief Executive Officer of the Federal Reserve Bank of San Francisco Mary Daly mentioned that she is open to a 75bps rate hike in September. Previously, Minneapolis Fed President Neel Kashkari and Chicago Fed President Charles Evans sounded grim. That said, Fed’s Kashkari mentioned that he hasn't "seen anything that changes" the need to raise the Fed's policy rate to 3.9% by year-end and to 4.4% by the end of 2023. Further, Fed policymaker Evens stated, “The economy is almost surely a little more fragile, but would take something adverse to trigger a recession.” Fed’s Evans also called inflation "unacceptably" high.
On a different page, US President Joe Biden’s pause in announcing tariff relaxations to China, actually the removal of the Trump-era tariffs, gain major attention and renew the Sino-US tussles to weigh on the market sentiment. Additionally, Additionally, a jump in the coronavirus cases from China, to 700 new confirmed cases in the mainland on August 10 versus 444 a day earlier, also roil the sentiment. Furthermore, Taiwan’s criticism of the “One China” policy and US House Speaker Nancy Pelosi’s support for Taipei also challenged the market optimism.
It should be noted that the cautious mood ahead of the preliminary readings of the UK’s second quarter (Q2) Gross Domestic Product (GDP) and the US Michigan Consumer Sentiment Index (CSI) for August also challenge the market’s optimism.
To sum up, recently softer US inflation data fail to keep the markets happy for long, which in turn highlights today’s scheduled statistics for fresh impulse.
- USD/JPY are taking over in a bid for the greenback.
- USD/JPY breakout could see the price move in on the neckline before the day is out for a test above 134 the figure.
USD/JPY has been picked up by the bulls at a discount and is on the verge of a significant bullish correction according to the following multi-timeframe analysis:
USD/JPY daily chart
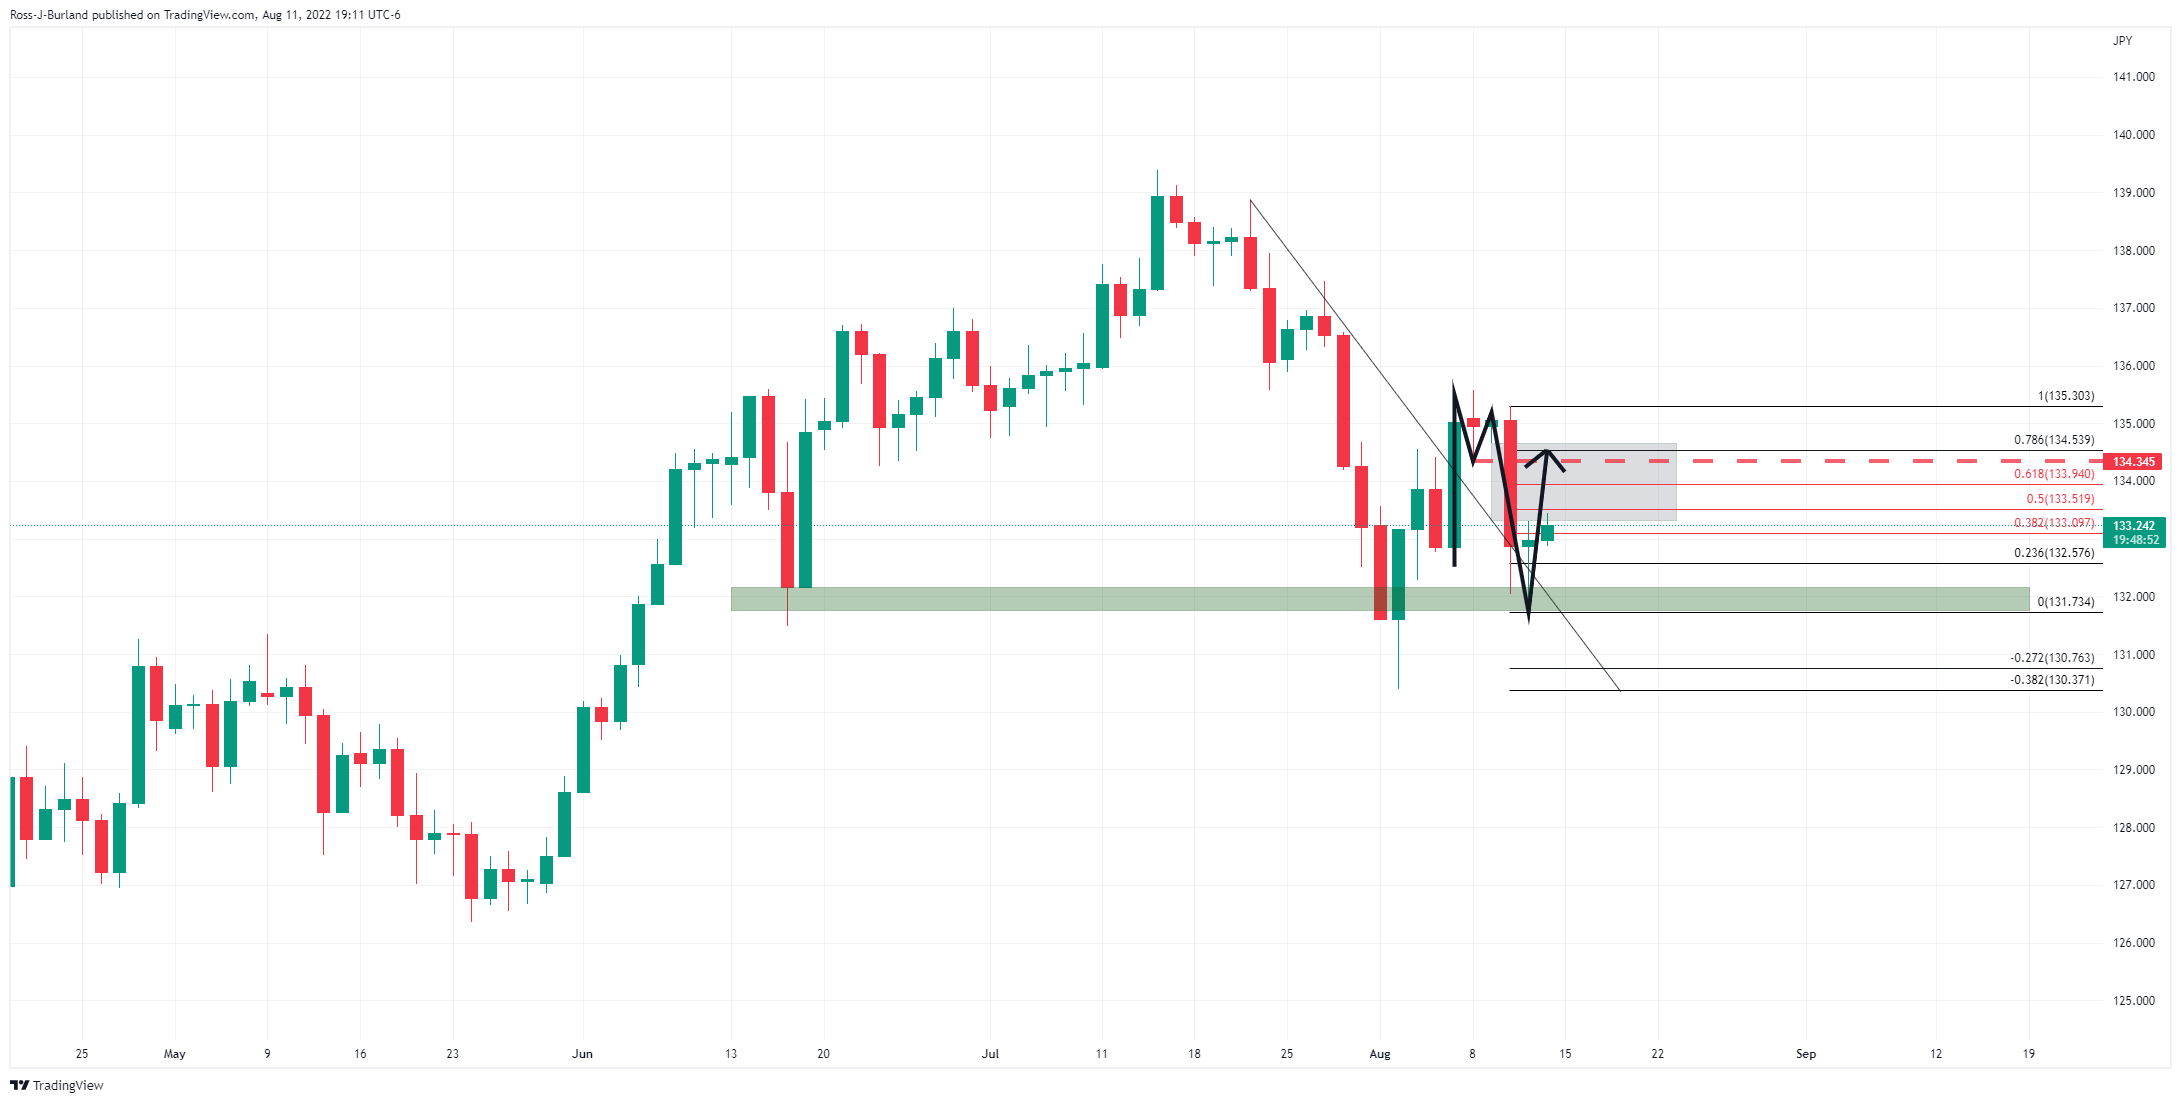
The M-formation is a reversion pattern that has a high probability of playing out in that the price is more than often attracted back into to test the neckline as illustrated above.
This gives rise to a prospect of a bullish correction that can be monitored from a lower time frame, such as the 15 min chart, as follows:
USD/JPY 15-min charts
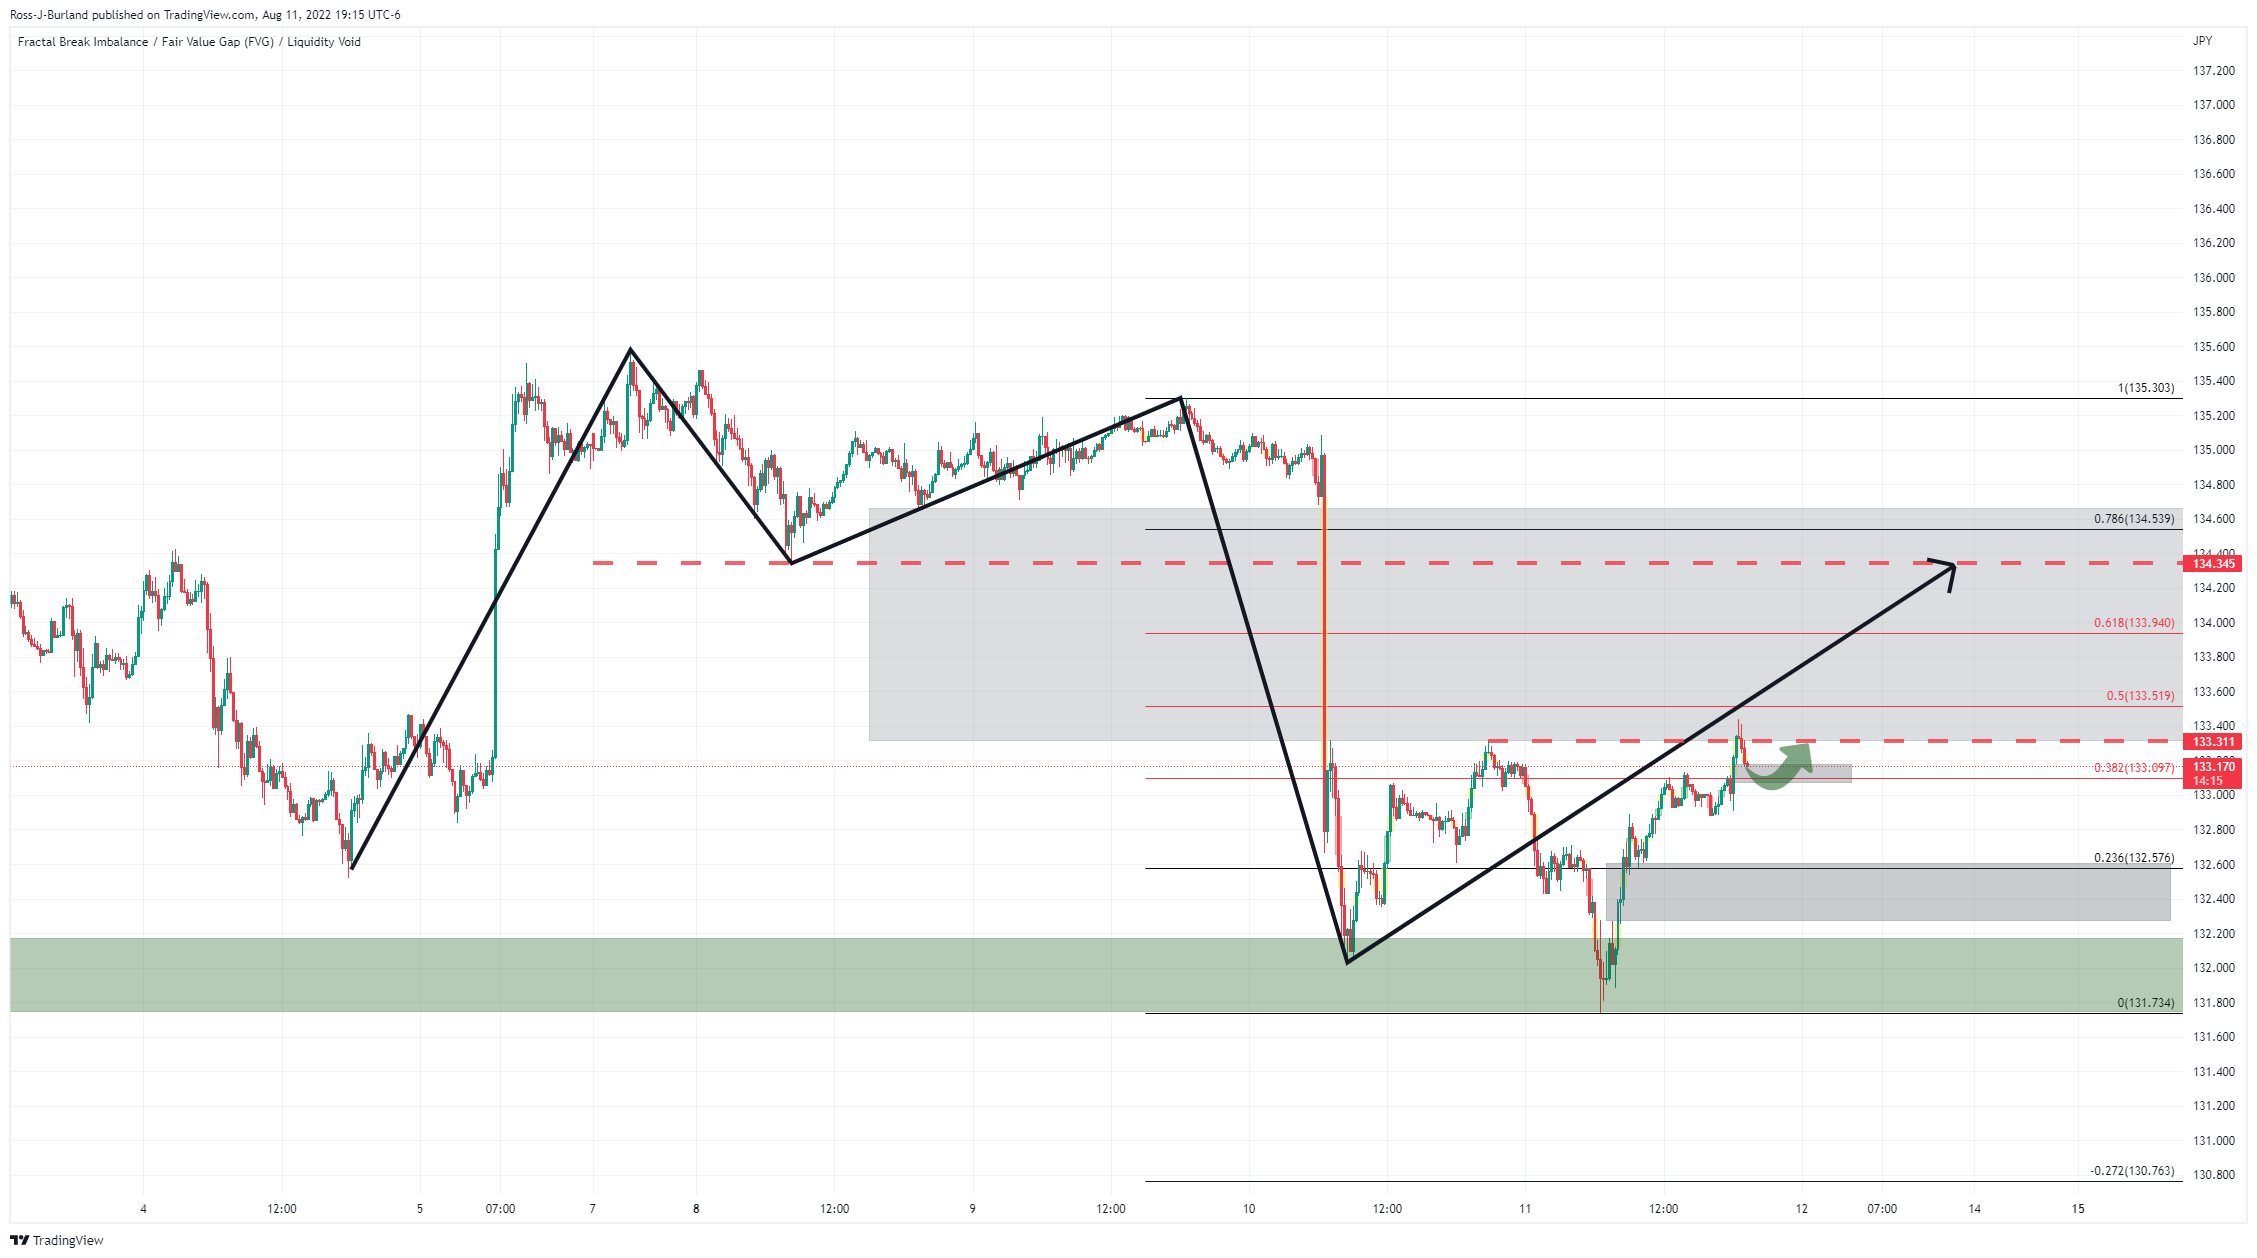
The price has been accumulating and is breaking the upside resistance structure near 133.30.
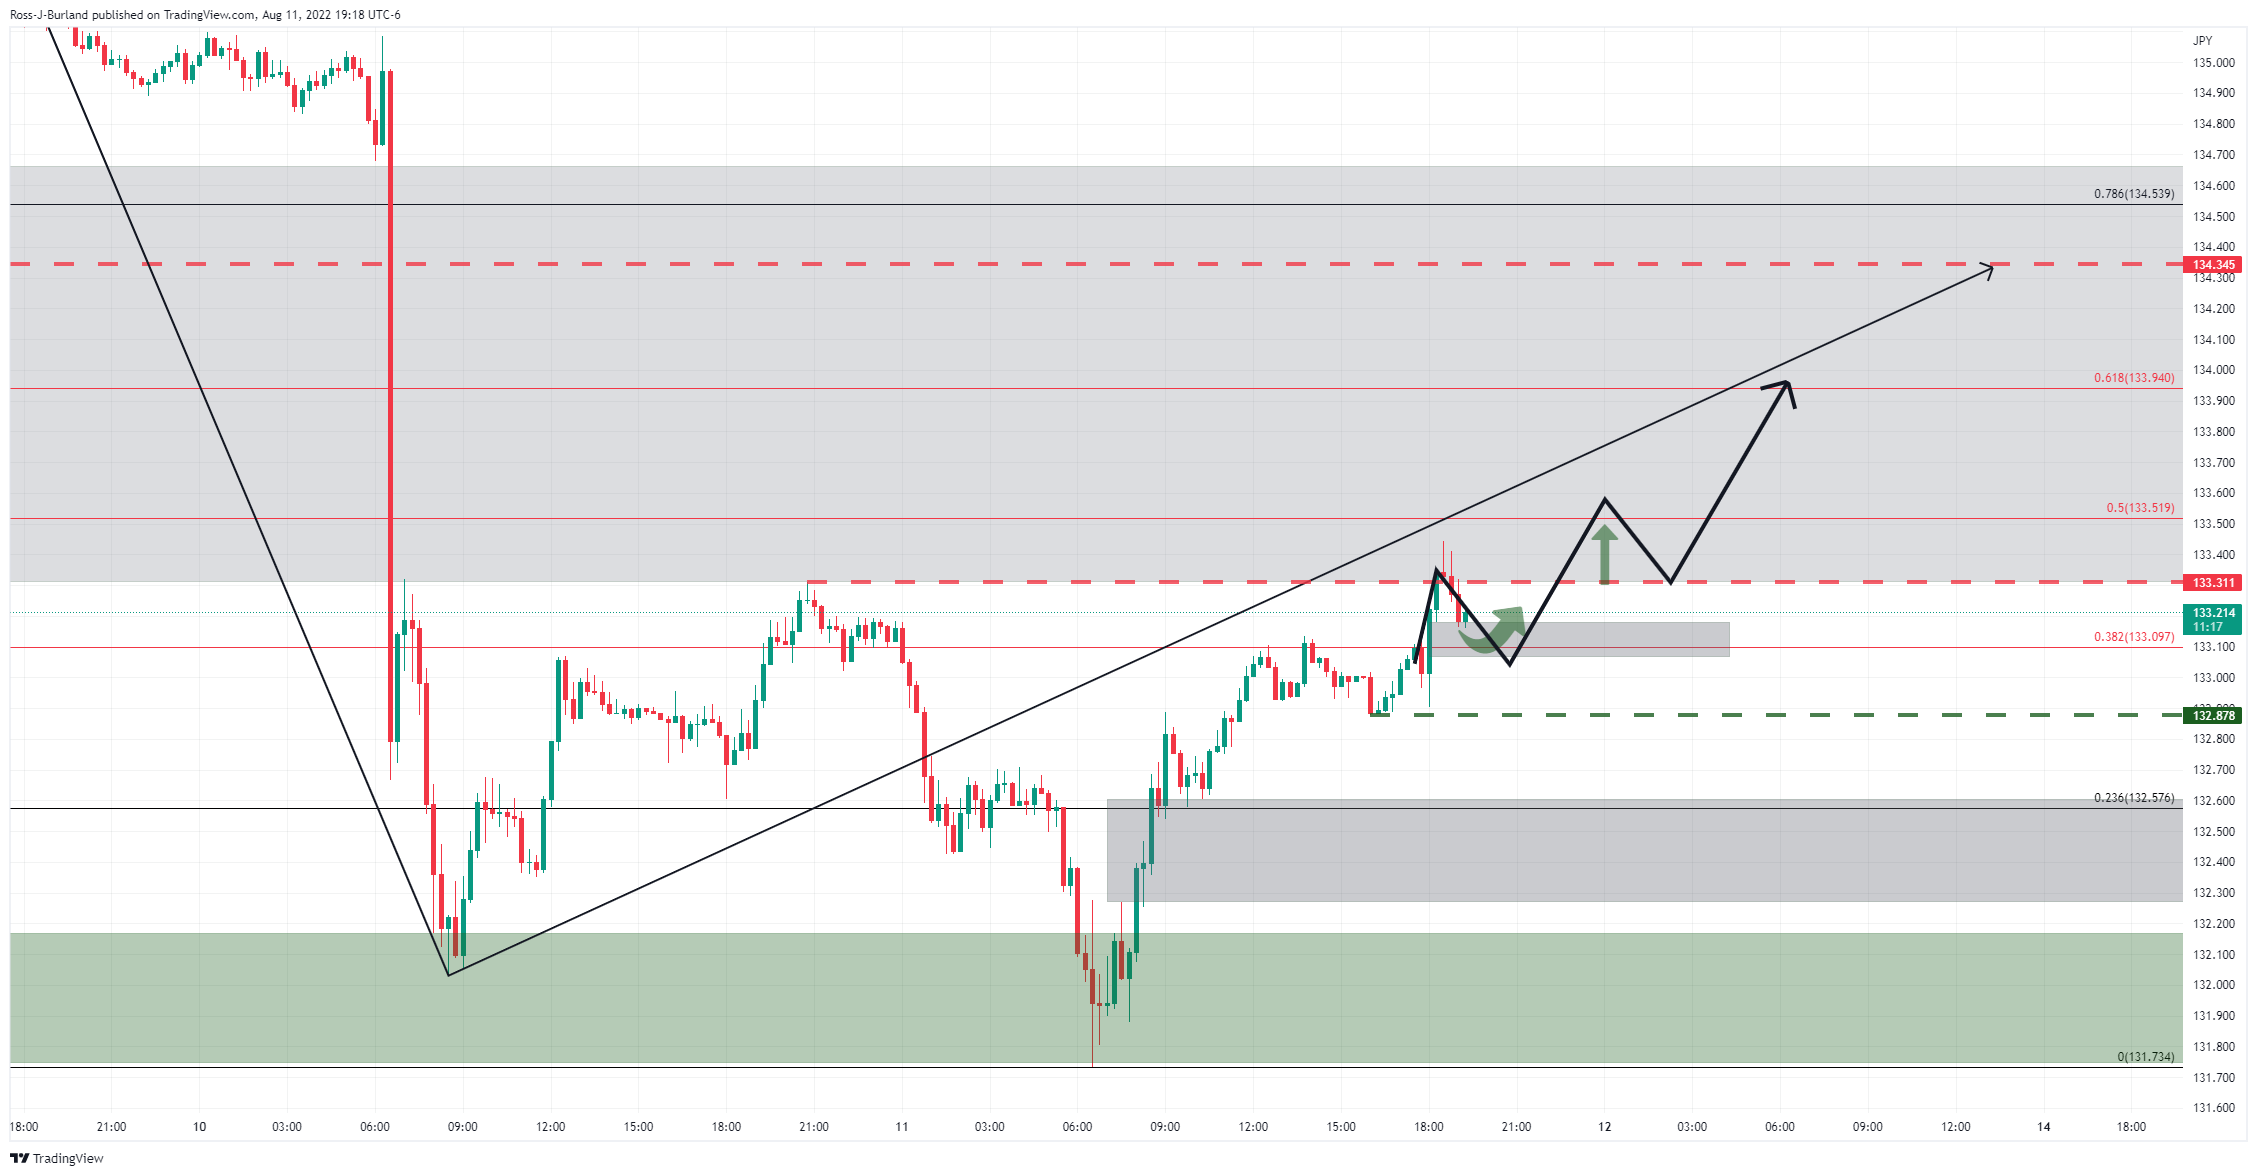
It is pulling back in a correction to mitigate the price imbalance below the recent highs but bulls could well be attracted from support which would likely see the price extend beyond the resistance for the day ahead. A continuation of the breakout could see the price move in on the neckline before the day is out for a test above 134 the figure.
In recent trade today, the People’s Bank of China (PBOC) set the yuan (CNY) at 6.7413 vs. the last close of 6.7450.
About the fix
China maintains strict control of the yuan’s rate on the mainland.
The onshore yuan (CNY) differs from the offshore one (CNH) in trading restrictions, this last one is not as tightly controlled.
Each morning, the People’s Bank of China (PBOC) sets a so-called daily midpoint fix, based on the yuan’s previous day's closing level and quotations taken from the inter-bank dealer.
- NZD/USD snaps four-day uptrend around the two-month high.
- Nearly overbought RSI, pullback from monthly resistance line add strength to bearish bias.
- Tops marked during mid-June, early-August lure near-term sellers ahead of monthly support line.
NZD/USD holds onto the previous day’s pullback from a two-month high as the adjacent key resistance line and 100-DMA challenge buyers during Friday’s Asian session. That said, the NZD/USD pair prints mild losses around 0.6430 by the press time.
The Kiwi pair’s latest drop from the upward sloping resistance line from July 08, as well as a retreat from the 100-DMA, also justifies the RSI’s recent struggles around the overbought territory. With this, the NZD/USD sellers are likely to re-enter the game.
However, the June 16 high will precede the August-start peak, respectively around 0.6395 and 0.6350, to restrict the short-term NZD/USD downside.
Following that, a one-month-old ascending support line near 0.6255 will be crucial to watch.
On the flip side, the 100-DMA and the aforementioned resistance line, around 0.6435 and 0.6455 in that order, will challenge the short-term advances of the Kiwi pair.
Even if the NZD/USD prices rise past 0.6455, the latest high close to 0.6465 can act as an extra filter to the north before directing bulls towards June’s monthly peak of 0.6575.
NZD/USD: Daily chart
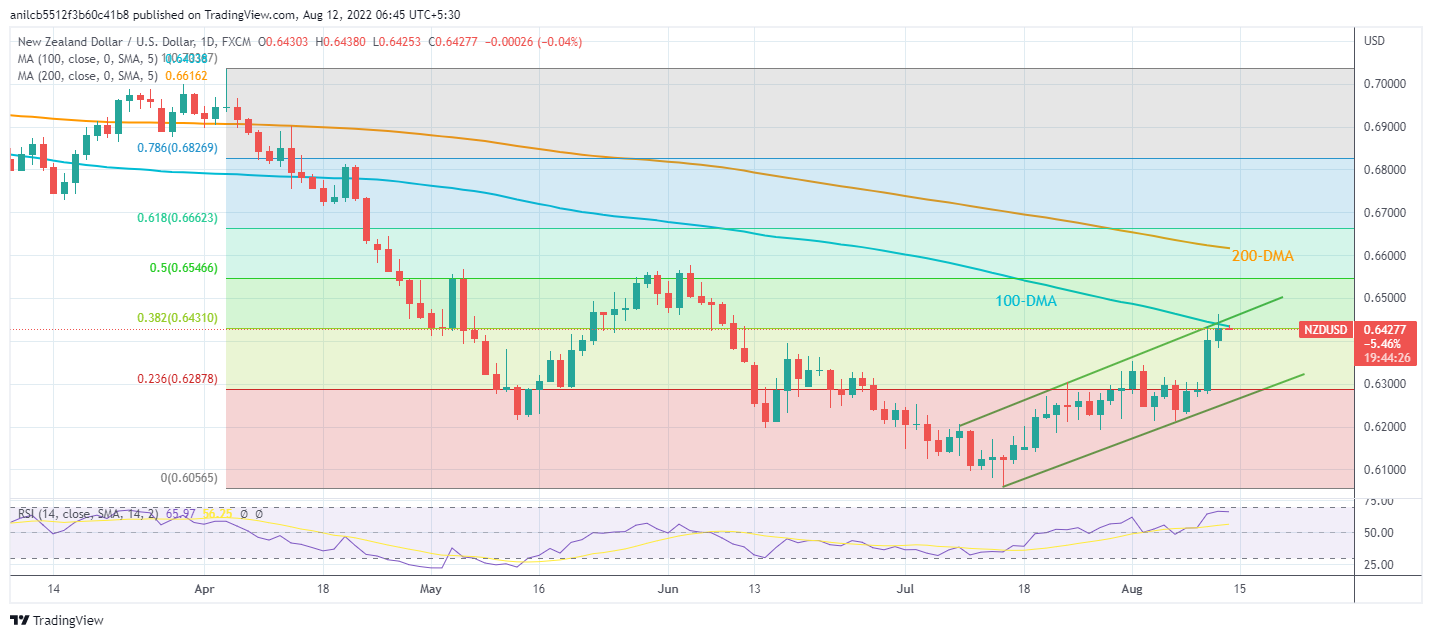
Trend: Further weakness expected
- A break of the consolidation formed in a 0.6869-0.7047 range strengthened the aussie bulls.
- An establishment above 61.8% Fibo retracement adds to the upside filters.
- Advancing 20-and 200-EMAs signal more gains ahead.
The AUD/USD pair has declined gradually below 0.7100 after printing a high of 0.7135 on Thursday. The asset has tumbled after sensing exhaustion in the upside momentum. However, that doesn’t warrant a bearish reversal for now but a corrective move, which is healthy for a decent uptrend.
On a four-hour scale, the asset has given an upside break of the consolidation formed in a broader range of 0.6869-0.7047, which has strengthened the aussie bulls. Also, the asset is auctioning above the 61.8% Fibonacci retracement (which is placed from June 3 high at 0.7283 to July 14 low at 0.6681) at 0.7054. For resuming an upside journey, a test of 61.8% Fibo is critical for the aussie bulls.
The 20-and 200-period Exponential Moving Averages (EMAs) at 0.7052 and 0.6950 respectively are advancing sharply, which adds to the upside filters.
Meanwhile, the Relative Strength Index (RSI) (14) is established in the bullish range of 60.00-80.00, which signals a continuation of upside momentum.
A pullback near 61.8% Fibo retracement at 0.7054 will drive the asset towards Thursday’s high at 0.7137. A latter breach will expose the asset for more upside towards 78.6% Fibo at 0.7156.
Alternatively, a drop below Wednesday’s low at 0.6951 will drag the asset towards the previous week’s low at 0.6869, followed by 23.6% Fibo retracement at 0.6824.
AUD/USD Price Analysis
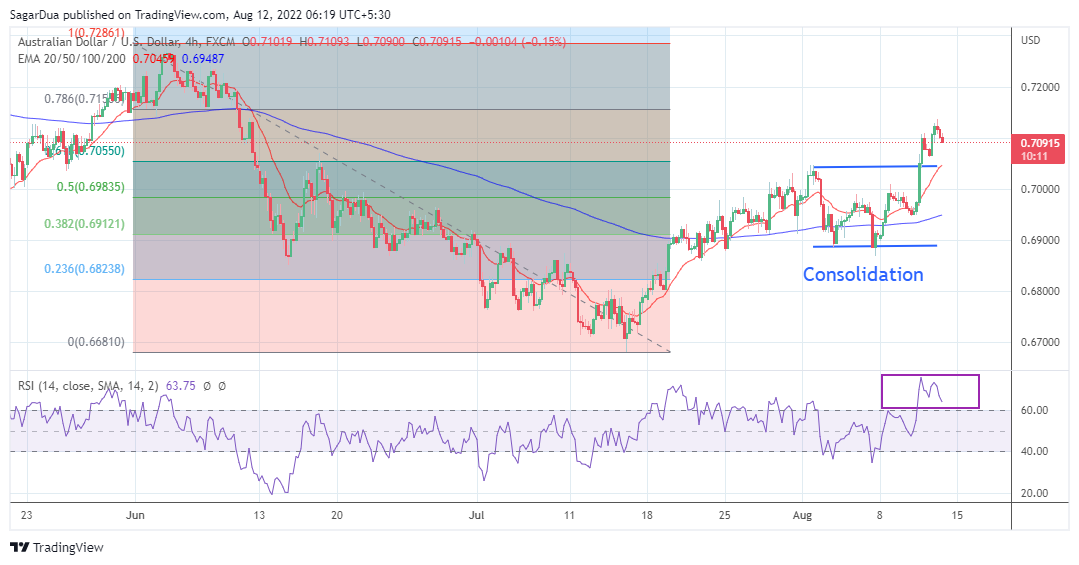
- GBP/USD extends the previous day’s losses towards refreshing daily low, mildly offered of late.
- Hawkish Fedspeak contradicts recently softer US inflation data and helps US dollar to lick its wounds after five-day downtrend.
- Jitters surrounding UK politics, Brexit join BOE’s gloomy outlook to keep buyers at bay.
- The preliminary reading of the UK’s Q2 GDP is likely to propel recession woes and weigh on the cable prices.
GBP/USD takes offers to refresh intraday low around 1.2180, down for the second consecutive day, as the US dollar pares weekly losses during Friday’s Asian session. In addition to the greenback’s consolidation of recent downside around the monthly low, the Cable pair trader’s cautious mood ahead of the initial estimations of the UK’s second quarter (Q2) Gross Domestic Product (GDP) also weigh on the quote.
Also read: UK GDP Preview: Early confirmation of BOE’s recession forecast
The pre-data anxiety appears strong enough to recall the GBP/USD bears even as the US Dollar Index (DXY) dropped for the fifth consecutive day on Thursday. The reason could be linked to the political and Brexit-linked pessimism surrounding Britain.
On Thursday, the UK government held talks with the energy bosses about high bills but Prime Minister Boris Johnson said, per Sky News, that it is for his successor in Number 10 to "make significant fiscal decisions". Elsewhere, a Conservative commentator has claimed per the UK Express that the US has taken favor with Brexit Britain due to its lack of ties to the European Union (EU).
On the other hand, US Producer Price Index (PPI) for July tracked the headline Consumer Price Index (CPI) while easing to 9.8% YoY versus 11.3% prior and 10.4% market forecasts. That said, the monthly PPI dropped to the lowest levels since May 2020, to -0.5% compared to 1.0% expected and 0.2% prior, which in turn signaled more easing of inflation fears.
Furthermore, the softer prints of the US Weekly Jobless Claims also portrayed improvement in the US employment scenario, tracking the recent job numbers from the world’s largest economy, which in turn helped to build the risk-on mood but could not favor GBP/USD. That said, US Initial Jobless Claims eased to 262K for the week ending August 6 versus 263K expected and downwardly revised 248K prior.
Recently, President and Chief Executive Officer of the Federal Reserve Bank of San Francisco Mary Daly mentioned that she is open to a 75bps rate hike in September. Previously, Minneapolis Fed President Neel Kashkari and Chicago Fed President Charles Evans sounded grim. That said, Fed’s Kashkari mentioned that he hasn't "seen anything that changes" the need to raise the Fed's policy rate to 3.9% by year-end and to 4.4% by the end of 2023. Further, Fed policymaker Evens stated, “The economy is almost surely a little more fragile, but would take something adverse to trigger a recession.” Fed’s Evans also called inflation "unacceptably" high.
Amid these plays, Wall Street began the day on a positive side before closing mixed while the US 10-year Treasury yields rallied 10 basis points (bps) to 2.88% at the latest. It’s worth noting that the S&P 500 Futures print mild gains around 4,215 and the US Treasury yields remain firmer by the press time.
To sum up, GBP/USD bears are set for further dominance ahead of the key UK GDP release, expected -0.2% QoQ versus 0.8% prior, mainly due to the Bank of England’s (BOE) fears of economic transition. However, as the markets are all negative, any positive surprise won’t be taken lightly considering the US dollar’s recent weakness and easing inflation fears.
Following the UK data, the first impressions of the US Michigan Consumer Sentiment Index (CSI) for August, expected at 52.5 versus 51.5 prior, will be important to watch for clear directions.
Also read: Michigan Consumer Sentiment Index Preview: Good news for the dollar but not for households
Technical analysis
GBP/USD extends pullback from a1 11-week-old downward sloping resistance line, at 1.2245 by the press time, towards revisiting the 21-DMA support near 1.2090. However, the cable pair’s further weakness hinges on the clear downside break of the previous resistance line from mid-June, around 1.1940 at the latest.
- EUR/GBP is sensing selling interest around 0.8470 despite the lower consensus for UK economic data.
- UK households are making higher payouts as subdued earnings are unable to offset soaring inflation.
- The second-tier Eurozone data is expected to display a vulnerable performance.
The EUR/GBP pair is facing barricades around the immediate hurdle of 0.8465 continuously since Thursday. The asset is expected to display topsy-turvy moves as investors await the UK Gross Domestic Product (GDP) data. On a broader note, the cross is advancing sharply higher in entire August after printing a three-month low of 0.8340.
According to the preliminary estimates, the UK economy has shrunk by 0.2% in the second quarter of CY2022 vs. the expansion of 0.8% recorded in Q1CY22. Also, the annual data is expected to shift lower to 2.8% from the prior release of 8.7%. A downside print in the growth rate indicates that the overall demand has dived significantly and eventually, the economic activities are facing a slowdown.
Soaring price pressures along with subdued Labor Cost Index are responsible for downward estimates of UK GDP data. The households are facing the headwinds of higher payouts due to surging cost pressures. Over that, subdued Average Hourly Earnings have forced them to slash their overall demand.
Adding to that, the Manufacturing Production data is also expected to display a vulnerable performance. The economic data is expected to slip lower to 0.9% against the former release of 2.3% on an annual basis. Adding to that, the monthly data is expected to display a de-growth of 1.8% against the previous print of 1.4%.
On the Eurozone front, Eurostat will report the Industrial production data, which are seen lower at 0.2% and 0.8% from their prior releases on a monthly and an annual basis respectively.
| Index | Change, points | Closed | Change, % |
|---|---|---|---|
| Hang Seng | 471.59 | 20082.43 | 2.4 |
| KOSPI | 42.9 | 2523.78 | 1.73 |
| ASX 200 | 78.3 | 7071 | 1.12 |
| FTSE 100 | -41.19 | 7465.91 | -0.55 |
| DAX | -6.42 | 13694.51 | -0.05 |
| CAC 40 | 21.23 | 6544.67 | 0.33 |
| Dow Jones | 27.16 | 33336.67 | 0.08 |
| S&P 500 | -2.97 | 4207.27 | -0.07 |
| NASDAQ Composite | -74.89 | 12779.91 | -0.58 |
- EUR/USD remains sidelined around monthly top, recently pressured near intraday low.
- RSI conditions, sustained break of five-week-old resistance keep buyers hopeful above 1.0280 short-term key support.
- 61.8% Fibonacci retracement guards immediate recovery, 200-SMA acts as an extra downside filter.
EUR/USD renews intraday low near 1.0315 during Friday Asian session, snapping four-day uptrend around the monthly peak. In doing so, the major currency pair extends the latest pullback from the 61.8% Fibonacci retracement level of its downside move between late June and mid-July.
Although the pullback from an important Fibonacci retracement level suggests further downside of the quote, a convergence of the previous support line from early July and 50% Fibonacci retracement level challenges the bears around 1.0280. Also pushing back the downside bias is the recently firmer RSI.
Even if the EUR/USD pair breaks the 1.0280 support confluence, the 200-SMA level surrounding 1.0220 and a one-month-old upward sloping support line near 1.0190 will challenge the bears.
Following that, a downward trajectory towards the 23.6% Fibonacci retracement level around 1.0110 can’t be ruled out.
Alternatively, recovery moves need validation from the 61.8% Fibonacci retracement level surrounding 1.0365.
Also challenging the EUR/USD bulls is the June 30 swing high of 1.0490, a break of which could propel prices towards a late June peak of 1.0614.
EUR/USD: Four-hour chart

Trend: Limited downside expected
| Pare | Closed | Change, % |
|---|---|---|
| AUDUSD | 0.71026 | 0.34 |
| EURJPY | 137.296 | 0.41 |
| EURUSD | 1.03224 | 0.2 |
| GBPJPY | 162.269 | 0.07 |
| GBPUSD | 1.22 | -0.14 |
| NZDUSD | 0.64241 | 0.35 |
| USDCAD | 1.27618 | -0.12 |
| USDCHF | 0.94092 | -0.14 |
| USDJPY | 133.004 | 0.2 |
- The DXY is hoping for a break above 105.20 on advancing hawkish Fed bets.
- Investors are ignoring the one-time slowdown in the US Inflation rate.
- A higher US Michigan CSI will strengthen the DXY bulls further.
The US dollar index (DXY) extended its gains to near 105.20 after sensing an intense buying interest while revisiting the six-week low at 104.64. The asset defended itself from refreshing a six-week low below 104.64. Now, the DXY has turned sideways but remains above 105.00 and is expected to record more gains on violating the immediate hurdle of 105.20.
Inflation exhaustion signals fade
Markets were cheering a downward shift in the US Consumer Price Index (CPI), which landed at 8.5% lower than the expectations of 8.7% and the prior release of 9.1%. Now, investors have started focusing on the extent of the interest rate hike by the Federal Reserve (Fed) in its September monetary policy meeting.
A one-time slowdown in the US inflation is not sufficient to have a ball as price pressures are still extremely deviated from the desired levels. Therefore, the Fed will continue on its path of accelerating interest rates. For the record, the extent of hawkish guidance will trim abruptly.
US Michigan CSI eyed
The Michigan Consumer Sentiment Index (CSI) data is expected to improve to 52.2 from the prior release of 51.5. A consecutive improvement is expected in the confidence of consumers after the data slipped to 50 for the first time in the past 20 years. An occurrence of the same will display that consumers have started showing their confidence in the economy and the overall demand will improve going forward.
- Gold price remain mildly offered as bears attack short-term key support line.
- Market’s inaction amid a light calendar restricts immediate XAU/USD moves.
- Inflation, Fed and China are in focus after the recent risk-positive data stream.
- Preliminary readings of August month Michigan Consumer Sentiment Index will be important for clear directions.
Gold price (XAU/USD) stays depressed at around $1,788 as sellers flirt with the immediate support line during Friday’s Asian session. In doing so, the yellow metal hesitates to welcome bears amid a sluggish session and a light calendar, as well as due to the cautious sentiment ahead of the first impressions of the US Michigan Consumer Sentiment Index (CSI) for August, expected at 52.5 versus 51.5 prior.
Also read: Michigan Consumer Sentiment Index Preview: Good news for the dollar but not for households
The XAU/USD prices dropped during the last two consecutive days despite the US dollar’s five-day downtrend as the Fed policymakers resist cheering downbeat inflation data from the US. Also challenging the gold buyers were fears surrounding China, one of the world’s largest commodity users.
On Thursday, US Producer Price Index (PPI) for July tracked the headline Consumer Price Index (CPI) while easing to 9.8% YoY versus 11.3% prior and 10.4% market forecasts. That said, the monthly PPI dropped to the lowest levels since May 2020, to -0.5% compared to 1.0% expected and 0.2% prior, which in turn signaled more easing of inflation fears.
In addition to the recently easing inflation woes, the softer prints of the US Weekly Jobless Claims also portrayed improvement in the employment scenario, tracking the recent job numbers from the world’s largest economy, which in turn helped to build the risk-on mood. That said, US Initial Jobless Claims eased to 262K for the week ending August 6 versus 263K expected and downwardly revised 248K prior.
Recently, President and Chief Executive Officer of the Federal Reserve Bank of San Francisco Mary Daly mentioned that she is open to 75bps rate hike in September. Previously, Minneapolis Fed President Neel Kashkari and Chicago Fed President Charles Evans sounded grim. That said, Fed’s Kashkari mentioned that he hasn't "seen anything that changes" the need to raise the Fed's policy rate to 3.9% by year-end and to 4.4% by the end of 2023. Further, Fed policymaker Evens stated, “The economy is almost surely a little more fragile, but would take something adverse to trigger a recession.” Fed’s Evans also called inflation "unacceptably" high.
On the same line were the headlines surrounding China. Reuters relied on sources to mention that the saying US President Biden rethinks steps on China tariffs in wake of Taiwan response. Additionally, a jump in the coronavirus cases from China, to 700 new confirmed cases in the mainland on August 10 versus 444 a day earlier, also weighs on the pair. Furthermore, Taiwan’s criticism of the “One China” policy and US House Speaker Nancy Pelosi’s support for Taipei also challenged the market optimism.
Against this backdrop, Wall Street began the day on a positive side before closing mixed while the US 10-year Treasury yields rallied 10 basis points (bps) to 2.88% at the latest. It’s worth noting that the S&P 500 Futures print mild gains around 4,215 and the US Treasury yields remain firmer by the press time.
To sum up, gold sellers are in the driver’s seat and are likely to keep reins but need validation from the key US data.
Technical analysis
Gold prices seesaw around a three-week-old support line after reversing from the weekly resistance line, as well as the 61.8% Fibonacci retracement level of the June-July downturn. That said, the RSI’s downside break of the short-term support also keeps sellers hopeful.
However, a convergence of the 50-SMA and the 50% Fibonacci retracement level, around $1,780-79, needs to validate the south-run.
Also acting as strong support is the convergence of the 200-SMA and the 38.2% Fibonacci retracement level, near $1,756.
Meanwhile, recovery moves may initially aim for the 61.8% Fibonacci retracement near $1,804 before challenging an upward sloping resistance line from August 02, close to $1,808 by the press time.
In a case where the XAU/USD rises past $1,808, July’s peak near $1,815 might act as the last defense of gold sellers.
Gold: Four-hour chart
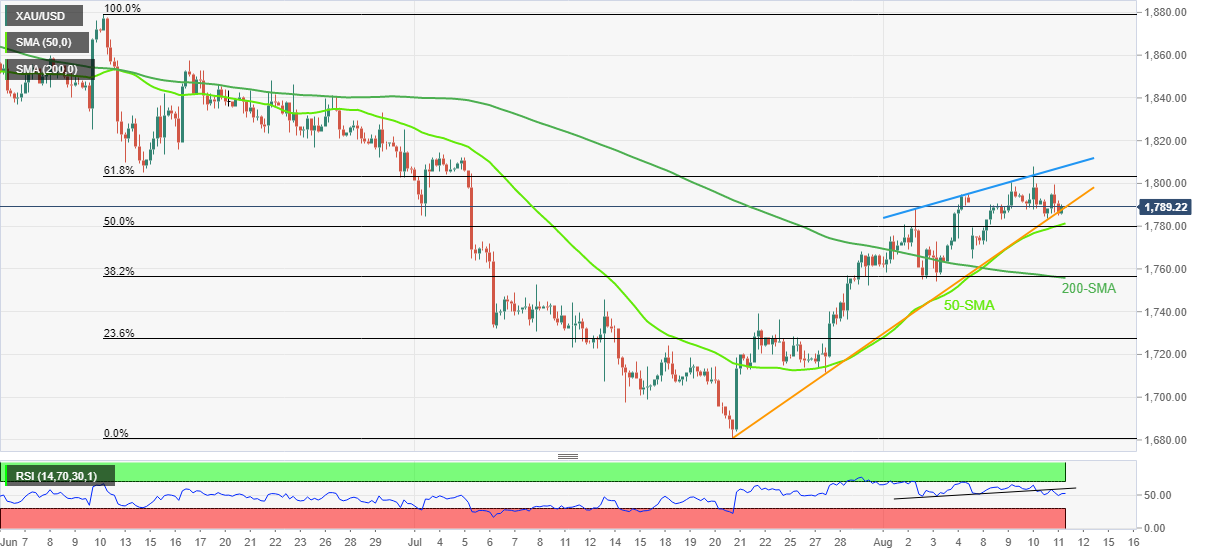
Trend: Further downside expected


© 2000-2026. All rights reserved.
This site is managed by Teletrade D.J. LLC 2351 LLC 2022 (Euro House, Richmond Hill Road, Kingstown, VC0100, St. Vincent and the Grenadines).
The information on this website is for informational purposes only and does not constitute any investment advice.
The company does not serve or provide services to customers who are residents of the US, Canada, Iran, The Democratic People's Republic of Korea, Yemen and FATF blacklisted countries.
Making transactions on financial markets with marginal financial instruments opens up wide possibilities and allows investors who are willing to take risks to earn high profits, carrying a potentially high risk of losses at the same time. Therefore you should responsibly approach the issue of choosing the appropriate investment strategy, taking the available resources into account, before starting trading.
Use of the information: full or partial use of materials from this website must always be referenced to TeleTrade as the source of information. Use of the materials on the Internet must be accompanied by a hyperlink to teletrade.org. Automatic import of materials and information from this website is prohibited.
Please contact our PR department if you have any questions or need assistance at pr@teletrade.global.
transfers