- Analytics
- News and Tools
- Market News
CFD Markets News and Forecasts — 15-08-2022
Early Tuesday morning in Asia, at 01:30 GMT, the Reserve Bank of Australia (RBA) will release the minutes of the latest monetary policy meeting held in August.
The RBA announced the third consecutive rate hike worth 50 basis points (bps) in August. Even so, the quarterly Monetary Policy Statement drowned the AUD/USD prices despite the rate lift by citing the growth concerns.
Although the RBA is more likely to keep its hawkish bias, the latest challenges for the key customer China and macroeconomic woes could probe the policymakers to adhere to softer rate increases in the future. The hints for such interesting events are likely to be watched in today’s RBA Minutes, making it crucial for the AUD/USD pair traders.
Westpac is on the same line and said,
RBA’s August meeting minutes will provide color around the third consecutive 50bp hike and risks to the outlook. Interest in the release is tempered somewhat by the intervening Statement on Monetary Policy.
How could the minutes affect AUD/USD?
AUD/USD holds lower ground near 0.7120 as bears take a breather ahead of the key RBA Minutes, especially after the biggest daily fall in a fortnight. In addition to the pre-event anxiety, an absence of major data/events and mixed concerns surrounding inflation and growth also appear to restrict immediate pair moves.
That said, the Aussie pair’s further downside hinges on how the RBA Minutes manage to keep the bulls happy even if they know that the 50 bps rate hike is given. That being said, talks over the economic transition and neutral rate, as well as surrounding employment conditions, will also be crucial to watch for short-term AUD/USD forecast ahead of this week’s key Wage Price Index for the second quarter (Q2), as well as July’s jobs report.
Technically, lows marked during late 2021 and earlier in the month, respectively around 0.6995 and 0.7030, will challenge the additional upside of the AUD/USD prices.
Alternatively, a clear U-turn from the 200-DMA hurdle, around 0.7120 by the press time, directs AUD/USD prices towards the previous resistance line from April 20, close to 0.6980 at the latest.
Key Notes
AUD/USD stays pressured towards 0.7000 ahead of RBA Minutes
AUD/USD Forecast: Steeper decline on a break below 0.6980
About the RBA minutes
The minutes of the Reserve Bank of Australia meetings are published two weeks after the interest rate decision. The minutes give a full account of the policy discussion, including differences of view. They also record the votes of the individual members of the Committee. Generally speaking, if the RBA is hawkish about the inflationary outlook for the economy, then the markets see a higher possibility of a rate increase, and that is positive for the AUD.
US inflation expectations, as per the 10-year breakeven inflation rate per the St. Louis Federal Reserve (FRED) data, begin the week on a negative note while declining to 2.44% at the latest. In doing so, the inflation precursor snapped two-day inaction by adding to the market’s cautious mood ahead of Wednesday’s Federal Open Market Committee (FOMC) meeting minutes.
With this, the inflation expectations join the league of recently downbeat Consumer Price Index (CPI) and the Producers Price Index (PPI) from the US to challenge the hawkish Fed bets. However, officials from the US Federal Reserve (Fed) defend the US central bank’s aggressive rate hikes while wanting to wait for sustained easy inflation numbers for any change in the outlook.
As a result, the market sentiment remains divided even as the Wall Street benchmarks post mild gains and the US 10-year Treasury yields ease.
That said, this week’s Fed Minutes will be crucial for near-term directions amid uncertainty over the policymakers’ bias after the latest inflation readings and the size of the next rate hike.
Also read: Forex Today: Growth-related concerns underpin the greenback
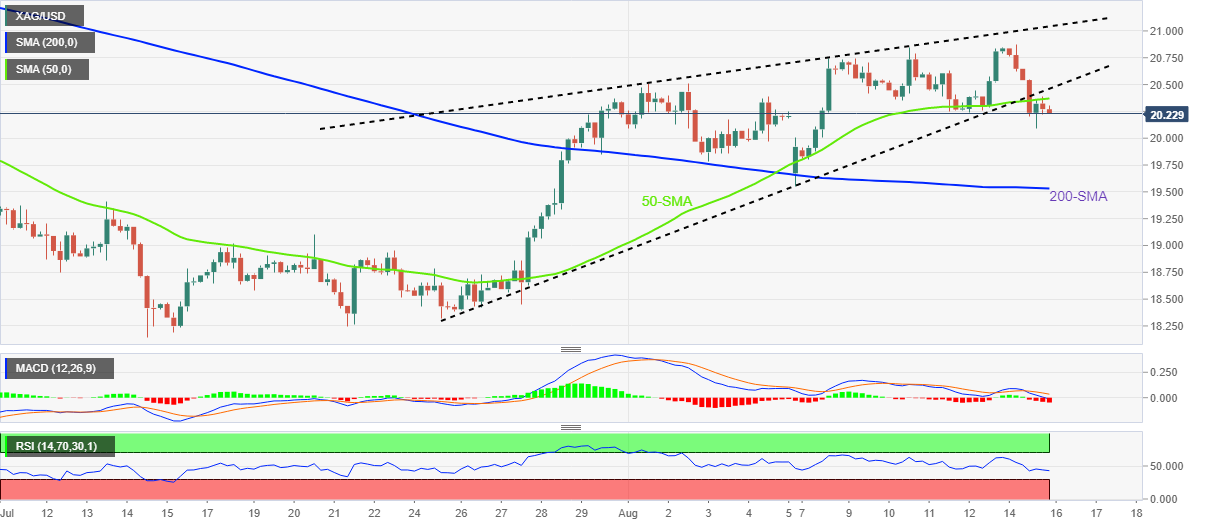
- Silver prices remain pressured after confirming three-week-old bearish chart pattern.
- MACD, RSI conditions join recent pullback from 50-SMA to keep sellers hopeful.
- 200-SMA can offer intermediate support during theoretical slump towards sub-$18.00 area.
Silver price (XAG/USD) holds lower ground near $20.20 after confirming a bearish formation, namely a rising wedge, the previous day. That said, the bright metal’s pullback from the 50-SMA and the downbeat oscillators also favor the sellers during Tuesday’s Asian session.
It should, however, be noted that the $20.00 threshold and the 200-SMA around $19.50 could restrict the short-term downside of the commodity prices.
Following that, multiple levels near $19.00 and the yearly low marked in July around $18.15 might test the XAG/USD bears before highlighting the theoretical target surrounding $17.80.
Meanwhile, the 50-SMA level around $20.40 challenges the quote’s corrective pullback ahead of the stated wedge’s lower line, close to $20.50 at the latest.
Even if the silver buyers manage to cross the $20.50 hurdle an upward sloping trend line from August 01, forming part of the wedge, can challenge the metal’s further advances near the $21.00 Threshold.
Overall, silver’s confirmation of rising wedge joins downbeat MACD and RSI to suggest the metal’s further downside.
Silver: Four-hour chart
Trend: Further weakness expected
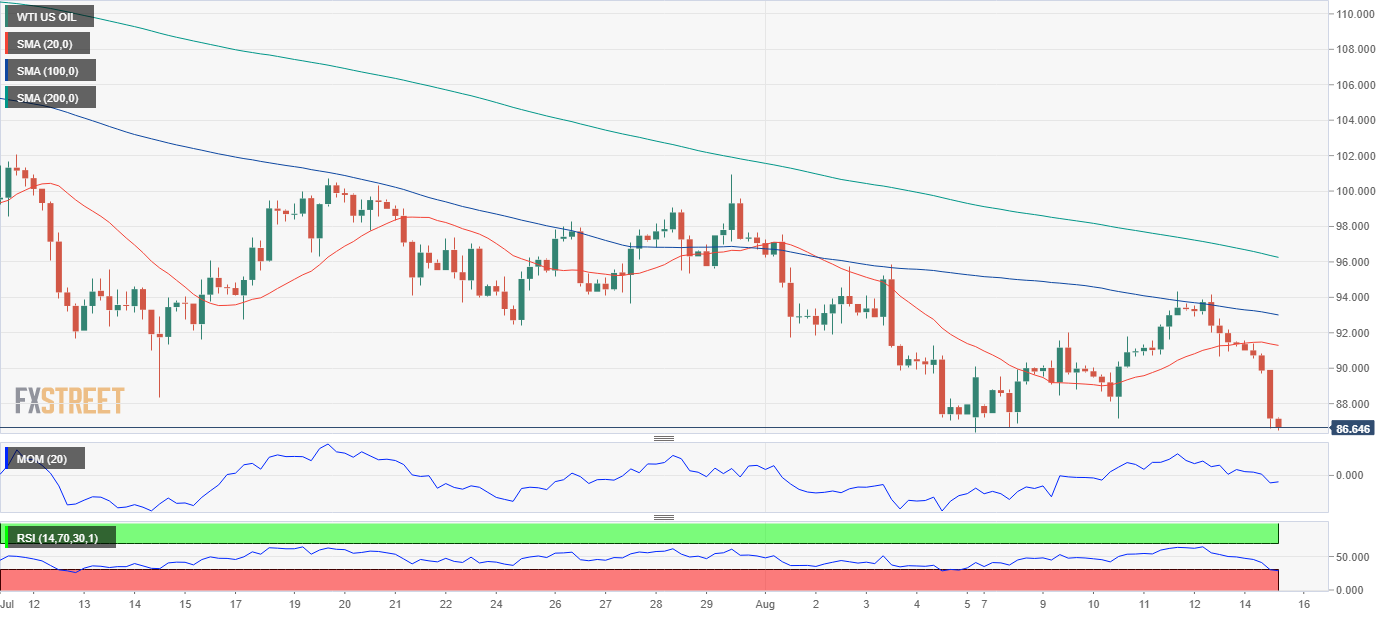
- WTI prices fall due to weak China-US economic data.
- China’s Industrial Production and Retail Sales increased less than expected.
- The PBoC reacted and cut interest rates as the bank aims to help reach the 2022 5% GDP target.
- Iran’s nuclear deal could be resolved soon, so oil prices slid.
US crude oil benchmark, also known as WTI (West Texas Intermediate) drops for the second consecutive day on disappointing US and China data, reigniting recession fears worldwide, with traders moving toward safe-haven assets. On Monday, WTI shed 4.37% from its price, closing below its opening price at $87.85. However, as the Asian Pacific session begins, WTI is trading at $88.18 PB, edging up by 0.57%.
In the early Monday session, China’s economic docket reported Industrial Production and Retail Sales, each at 3.8% YoY and 2.7% YoY, respectively, missing forecasts. That said, the People’s Bank of China (PBoC) surprised the markets, slashing its 1-year MLF to 2.75%, a consequence of the previously mentioned.
During the New York session, the NY Fed Empire State Manufacturing Index for August tumbled to -31.3, lower than estimates, as shipments and new orders plunged.
Meanwhile, the latest developments in the Iran nuclear deal weighed on lower crude oil prices. Sources cited by the semi-official Iranian Students’ New Agency said that Tehran’s stance had been sent to the EU top commissioner Josep Borrell.
Iran Foreign Minister Hossein Amirabdollahian commented that an agreement with Washington could be reached to restore the accord “if the US shows a realistic approach and flexibility,” as reported by Bloomberg. Amirabdollahian said that they’re ready to enter the phase of announcing the deal “if our latest points are met” and said that if the US is trying to “gain concession, then we’ll have to talk and negotiate more.”
If Iran’s nuclear deal is approved, oil from Iran would be seen as a relief from high energy prices, particularly consumers, which had been dealing with skyrocketing petrol and gasoline prices, with countries like the US battling inflation at 4-decade highs.
WTI Key Technical Levels
- USD/CAD seesaws around weekly top after positing the biggest daily jump in a month.
- Economic fears surrounding China, increase in oil output in Permian favor WTI bears.
- Risk-off mood also underpins bullish bias ahead of the key data/events.
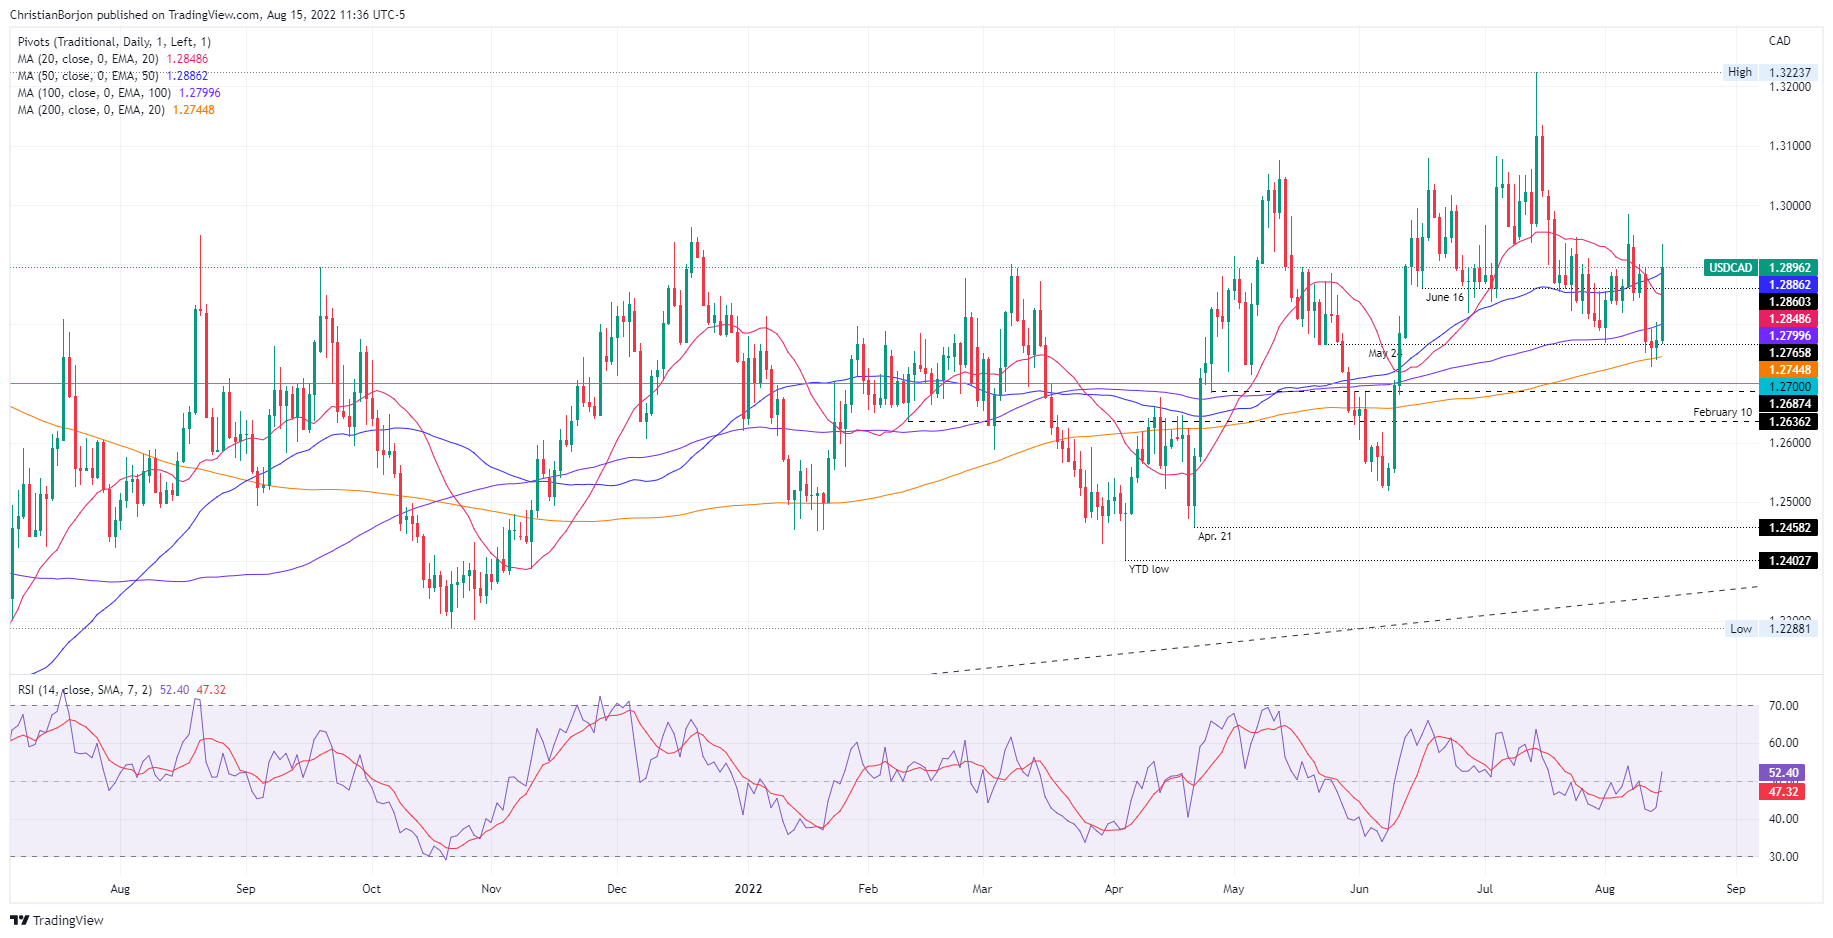
USD/CAD bulls take a breather around 1.2900, following the longest daily jump in a month, as traders await the key inflation data from Canada. In addition to the pre-data anxiety, cautious mood in the markets and sluggish prices of Canada’s main export item, namely WTI crude oil, also probes The Loonie pair buyers during Tuesday’s Asian session.
WTI crude oil remains sidelined around a six-month low, pausing a two-day downtrend, as bears seek fresh clues to extend the latest south-run. Even so, the black gold remains weak amid chatters of economic weakness in the world’s largest commodity user China and increased output from the Permian basin. “Oil output in the Permian in Texas and New Mexico, the biggest U.S. shale oil basin, is due to rise 79,000 barrels per day (bpd) to a record 5.408 million bpd in September, the U.S. Energy Information Administration (EIA) said in its productivity report on Monday,” per Reuters.
Elsewhere, China’s Retail Sales eased to 2.7% YoY in July versus 5.0% expected and 3.1% prior whereas Industrial Production (IP) edged lower to 3.8% during the stated month, from 3.9% prior and 4.6% market forecasts. Additionally, the People’s Bank of China (PBOC) surprised markets on Monday by cutting the one-year medium-term lending facility (MLF) rates by 10 basis points (bps) and trying to push back the bears.
Headlines suggesting improved coronavirus conditions in China's financial hub Shanghai and the resumption of the Russian bonds’ trading on Wall Street should have favored the risk appetite, but could not. Furthermore, hopes of a probable meeting between US President Joe Biden and his Chinese counterpart Xi Jinping, as signaled by the Wall Street Journal (WSJ), could favor the risk-on mood. On the same line were comments from China’s President Xi suggesting more efforts to revive the world’s second-largest economy.
It should be noted that the Federal Reserve (Fed) policymakers held their hawkish bias, despite recently downbeat US data, while suggesting the need for more proof of softer inflation. The latest from the Fed was Richmond Federal Reserve (Fed) Bank President Thomas Barkin who said that he wants to raise interest rates further to bring inflation under control. "I'd like to see a period of sustained inflation under control, and until we do that I think we are just going to have to move rates into restrictive territory," Barkin told CNBC, per Reuters.
That said, US NY Empire State Manufacturing Index for August, to 31.3 in August from 11.1 in July and 8.5 market forecasts, contributed to the economic slowdown fears. On the same line, the US August NAHB homebuilder confidence index also fell to 49 versus 55, its lowest level since the initial months of 2020.
While portraying the mood, the US 10-year Treasury yields dropped six basis points (bps) to 2.79% whereas Wall Street closed with mild gains. It should be noted that the S&P 500 Futures print mild losses by retreating from a three-month high by the press time.
Looking forward, headlines surrounding China may entertain USD/CAD traders ahead of the Canadian Consumer Price Index (CPI) for July. More important to track will be the Bank of Canada (BOC) Core CPI, expected 6.7% YoY versus 6.2% prior.
Technical analysis
A successful upside break of a one-month-old previous resistance line, now support around 1.2880, directs USD/CAD buyers towards the monthly peak of 1.2985.
- GBP/USD remains depressed around one-week low after breaking short-term key support.
- Steady RSI, impending bear cross on MACD also keep sellers hopeful.
- Buyers need validation from two-month-old resistance line, 1.2000 can test intraday sellers.
GBP/USD dribbles around mid-1.2000s as the Cable traders lick their wounds during Tuesday’s Asian session, after the biggest daily fall in a week. Even so, the quote remains on the bear’s radar as it stays beneath the 1.2110-2100 support-turned-resistance.
A clear downside break of the convergence of the 21-DMA and an upward sloping trend line from mid-July keep GBP/USD sellers hopeful. Also suggesting the pair’s further downside is the descending RSI (14), not oversold, as well as a looming bear cross on the MACD.
That said, the pair is likely declining towards the horizontal area comprising multiple levels marked since June, around 1.1930. However, the 1.2000 psychological magnet may offer an intermediate halt during the anticipated fall.
In a case where the GBP/USD prices drop below 1.1930, the odds of witnessing a slump towards the yearly low of 1.1760 seem acceptable.
Alternatively, a corrective pullback need not only to cross the 1.2100-2110 immediate hurdle but a two-month-old descending trend line resistance, close to 1.2265 by the press time, to convince GBP/USD buyers.
Even so, the 100-DMA level surrounding 1.2415 could challenge the quote’s further advances.
GBP/USD: Daily chart
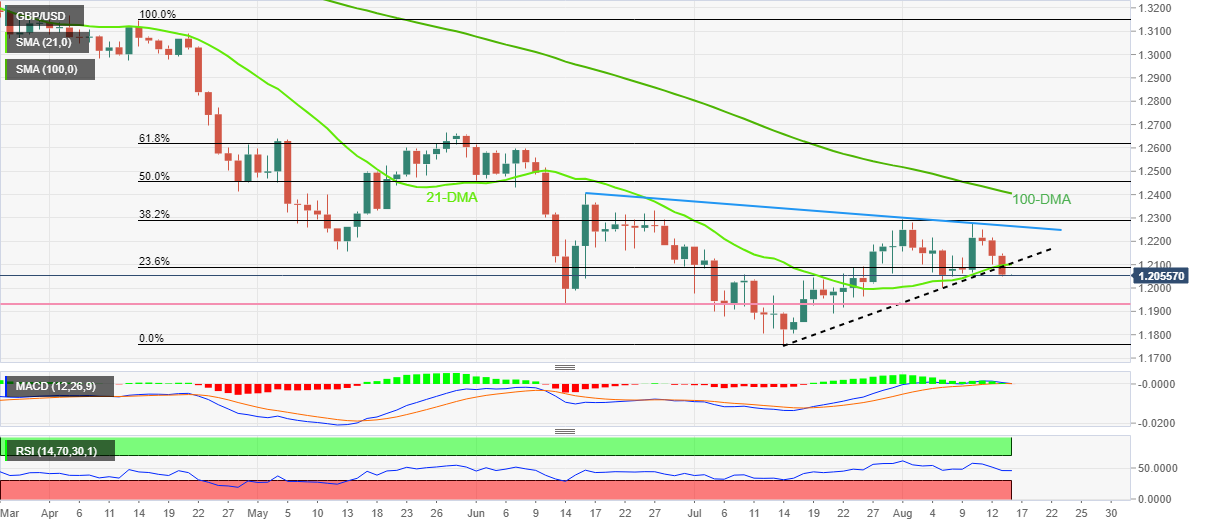
Trend: Further weakness expected
Analysts at Bank of America (BofA) offer their outlook on the USD/JPY pair, maintaining a bullish outlook over the medium term.
Key quotes
"With lower oil prices and stalling outward M&A by Japan Inc., corporate JPY supply has likely peaked for now. However, investors' USD demand, another pillar of USD/JPY strength this year, could continue as the Fed's rate hikes boost the USD/JPY carry and hedge cost. In the last tightening cycle, USD/JPY declined and JPY strengthened after the Fed stopped hiking rates at end-2018 with developed market (DM) central banks unable to hike as much.”
“Meanwhile, in the preceding cycle before the Global Financial Crisis, USD/JPY rose and JPY weakened while the Fed held policy rate at 5.25% for 14 months after the final hike and DM central banks hiked as aggressively.”
According to the latest Reuters poll of economists, the Reserve Bank of New Zealand (RBNZ) is widely expected to hike the Official Cash Rate (OCR) by 50 basis points(bps) at Wednesday's policy review, taking the cash rate to 3.00% and marking the most aggressive tightening since 1999.
Also read: NZIER: Recommends RBNZ to hike OCR by 50 bps in August
Key findings
“While the RBNZ has signalled plans to increase the rate to 4.00% by mid-2023, almost matching the US Federal Reserve, few see it reaching that level. “
“A handful were actually expecting rates to start easing by mid-next year.”
“That shift in market pricing has been driven by signs of a weakening economy amid the tightening in financial conditions.”
- AUD/USD licks its wounds after falling the most in two weeks.
- Fears of recession joins cautious mood ahead of Fed/RBA Minutes to exert downside pressure on the pair.
- Market sentiment dwindles but Wall Street manages to post mild gains.
- RBA Minutes eyed for hints of further rate hikes amid economic slowdown fears.
AUD/USD holds lower ground near 0.7120 as bears take a breather after the biggest daily fall in a fortnight. That said, the Aussie pair’s inaction during Tuesday’s Asian session could be linked to the caution mood ahead of the Reserve Bank of Australia’s (RBA) Minutes of the latest monetary policy meeting, as well as mixed concerns surrounding growth and inflation.
The quote began the key week on a negative footing after China’s downbeat data and the People’s Bank of China’s (PBOC) surprised rate cut spread fears for the AUD/USD, due to Australia’s strong trade ties with the dragon nation. Also weighing on the Aussie pair was the anxiety over the Fed’s next move after the recently downbeat data and hawkish Fedspeak.
The downbeat print of the US NY Empire State Manufacturing Index for August, to 31.3 in August from 11.1 in July and 8.5 market forecasts, contributed to the economic slowdown fears. On the same line, the US August NAHB homebuilder confidence index also fell to 49 versus 55, its lowest level since the initial months of 2020.
It’s worth noting, however, that the Federal Reserve (Fed) policymakers held their hawkish bias while suggesting the need for more proof of softer inflation. The latest from the Fed was Richmond Federal Reserve (Fed) Bank President Thomas Barkin who said that he wants to raise interest rates further to bring inflation under control. "I'd like to see a period of sustained inflation under control, and until we do that I think we are just going to have to move rates into restrictive territory," Barkin told CNBC, per Reuters.
On the other hand, China’s Retail Sales eased to 2.7% YoY in July versus 5.0% expected and 3.1% prior whereas Industrial Production (IP) edged lower to 3.8% during the stated month, from 3.9% prior and 4.6% market forecasts. Additionally, the PBOC cut the one-year medium-term lending facility (MLF) rates by 10 basis points (bps) and tried to push back the bears.
Elsewhere, headlines suggesting improved coronavirus conditions in China's financial hub Shanghai and the resumption of the Russian bonds’ trading on Wall Street should have favored the risk appetite, but could not. Furthermore, hopes of a probable meeting between US President Joe Biden and his Chinese counterpart Xi Jinping, as signaled by the Wall Street Journal (WSJ), could favor the risk-on mood. On the same line were comments from China’s President Xi suggesting more efforts to revive the world’s second-largest economy.
Against this backdrop, the US 10-year Treasury yields dropped six basis points (bps) to 2.79% whereas Wall Street closed with mild gains. It should be noted that the S&P 500 Futures print mild losses by retreating from a three-month high by the press time.
Moving on, AUD/USD traders should pay attention to the risk catalysts ahead of the RBA Minutes. The Aussie central bank announced a 0.50% rate hike in August but the concerns over the economic growth teased bears, which in turn highlights today’s Minute Statement for fresh impulse. Should the policymakers appear unconvinced of the next rate hike, due to the recession woes, the AUD/USD price may have a further downside to track.
Technical analysis
A clear U-turn from the 200-DMA hurdle, around 0.7120 by the press time, directs AUD/USD prices towards the previous resistance line from April 20, close to 0.6980 at the latest.
Citing the latest US Treasury Department data released on Monday, Reuters reported that China’s holdings of American government bonds were reduced for a seventh straight month in June.
Additional takeaways
“China's stash of US government debt dropped to $967.8 billion in June, the lowest since May 2010 when it held $843.7 billion.”
“Japan increased its holdings of Treasuries to $1.236 trillion in June, from a revised $1.224 trillion in May.”
“Overall, foreign holdings of Treasuries rose to $7.430 trillion in June from a revised $7.426 trillion in May.”
“US Treasuries have posted foreign inflows for a second straight month.”
Related reads
- Forex Today: Growth-related concerns underpin the greenback
- S&P 500 could drop 7.0% on Fed’s QT through 2023 – BofA
- AUD/JPY snaps two days of gains, plunges more than 150 pips on risk aversion.
- Weaker economic China and US data, drivers of risk-off impulse in the FX space.
- AUD/JPY Price Analysis: Falling-wedge in the hourly chart might open the door for a leg-up before resuming the downtrend.
After a risk-off impulse in the FX space, the AUD/JPY plunges from around three-week highs around 95.05 and dives towards the 100-day EMA to record its daily low near 92.99 on Monday, courtesy of weaker China and US data, which reignited recession fears. At the time of writing, the AUD/JPY is trading at 93.54.
AUD/JPY Price Analysis: Technical outlook
The AUD/JPY remains trading within the boundaries of a descending channel, as portrayed on Monday. The high of the day was also the top-trendline of the previously mentioned channel, in which sellers leaned on to drive prices lower, sending the pair plunging close to 150 pips, near the 100-day EMA. Nevertheless, an uptick in the Relative Strength Index (RSI), and US traders’ sentiment improvement, capped the downtrend, so the pair closed near the August 10 low at 93.48.
Zooming into the 1-hour scale, the AUD/JPY is neutral to upward biased, with the chart portraying the formation of a falling wedge, which would open the door for further upside before resuming its downtrend. Also, to further confirm the previously mentioned, RSI is about to cross over its 7-hour RSI SMA, which would accelerate the uptrend.
Therefore, the AUD/JPY first resistance would be 93.81; once cleared, it would open the door towards the confluence of the 20/200-hour EMA at 93.86, closely followed by the 100-hour EMA at 94.28.
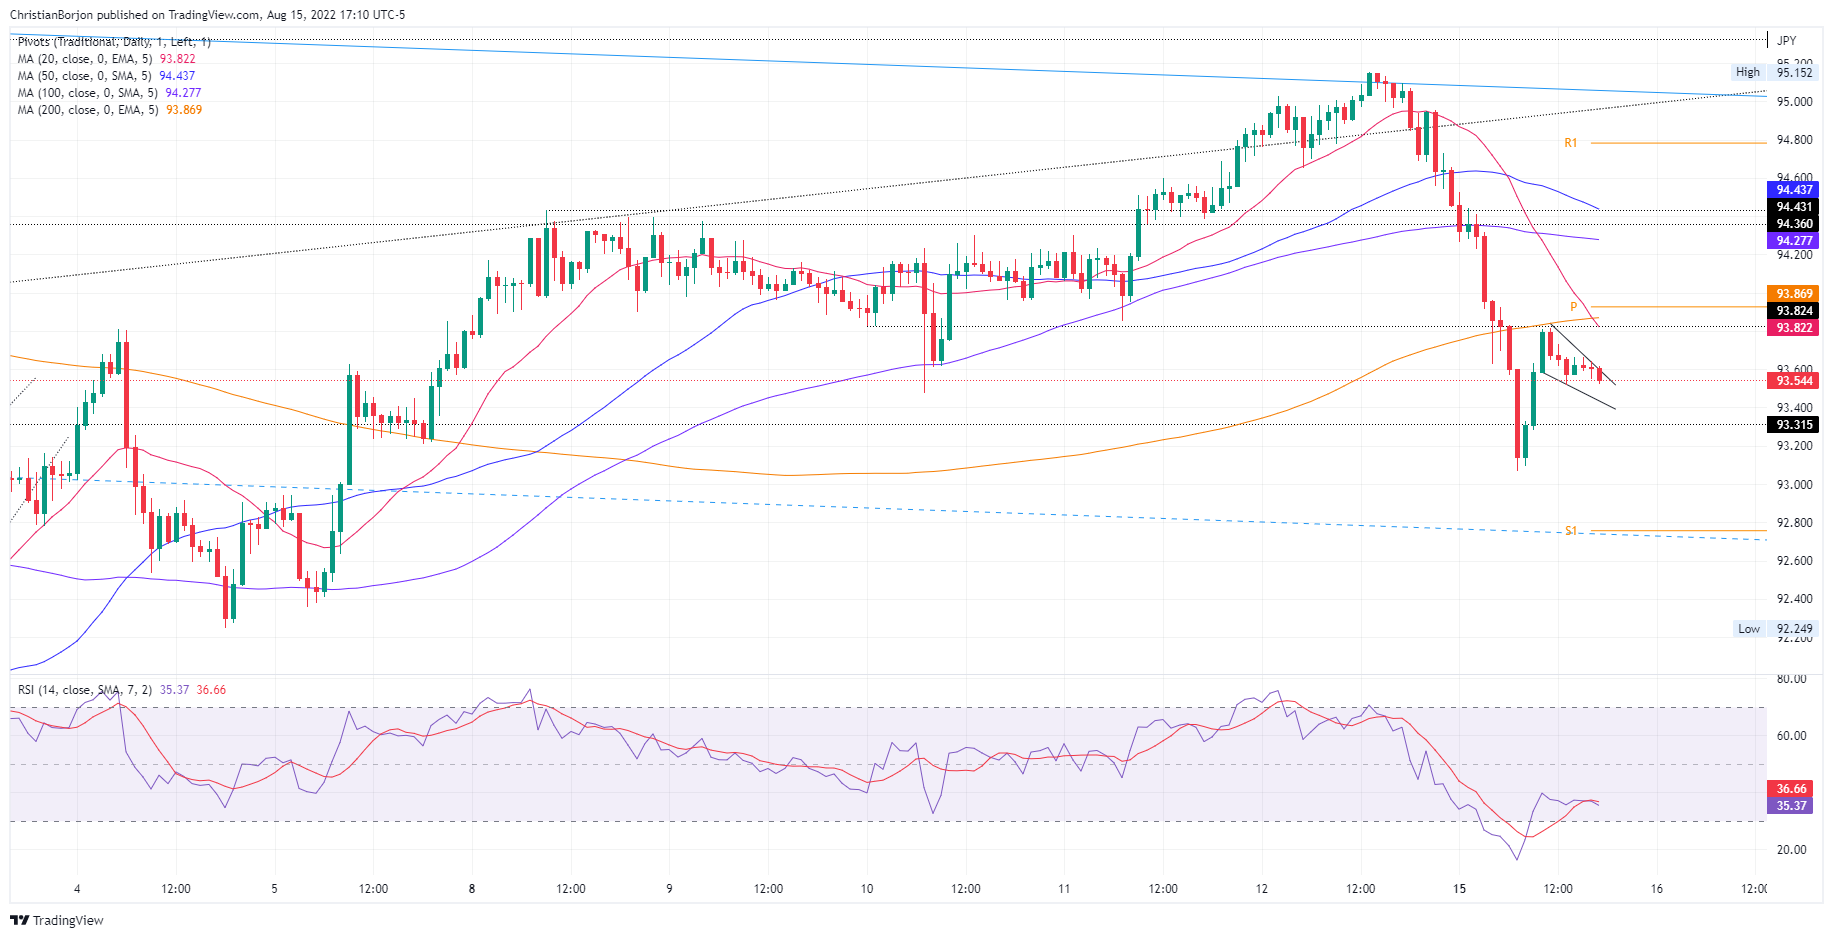 AUD/JPY Hourly chart
AUD/JPY Key Technical Levels
The winding down of the central bank’s balance sheet poses a risk to equity prices, according to Bank of America (BofA), reported Bloomberg late Monday.
“When looking at the historical relationship between the Fed’s bond purchases and S&P 500 returns from 2010 to 2019, the bank concluded in a research note on Monday that quantitative tightening through 2023 would translate into a 7% drop in the benchmark gauge from current levels,” the bank report also mentioned.
BofA also mentioned, per Bloomberg, “Quantitative Easing (QE) has explained more than 50% of the movement in the market.”
Bloomberg also quotes Chief Investment Officer at Independent Advisor Alliance as saying, “Quantitative Tightening (QT) has undoubtedly taken a back seat to more pressing issues such as inflation and recession angst.”
Key quotes (from Bloomberg)
The Fed started winding down its $8.9 trillion balance sheet in June and is phasing in the reductions to an eventual pace of $1.1 trillion a year. In the two months since, the S&P 500 has gained 4.8%.
A new study by a Federal Reserve Bank of Atlanta economist found that asset reductions will have a relatively modest impact on the economy compared to the Fed’s raising of interest rates to fight inflation, equating the effect over time to no more than three quarter-point interest-rate hikes.
Also read: Modest losses prevail in stocks
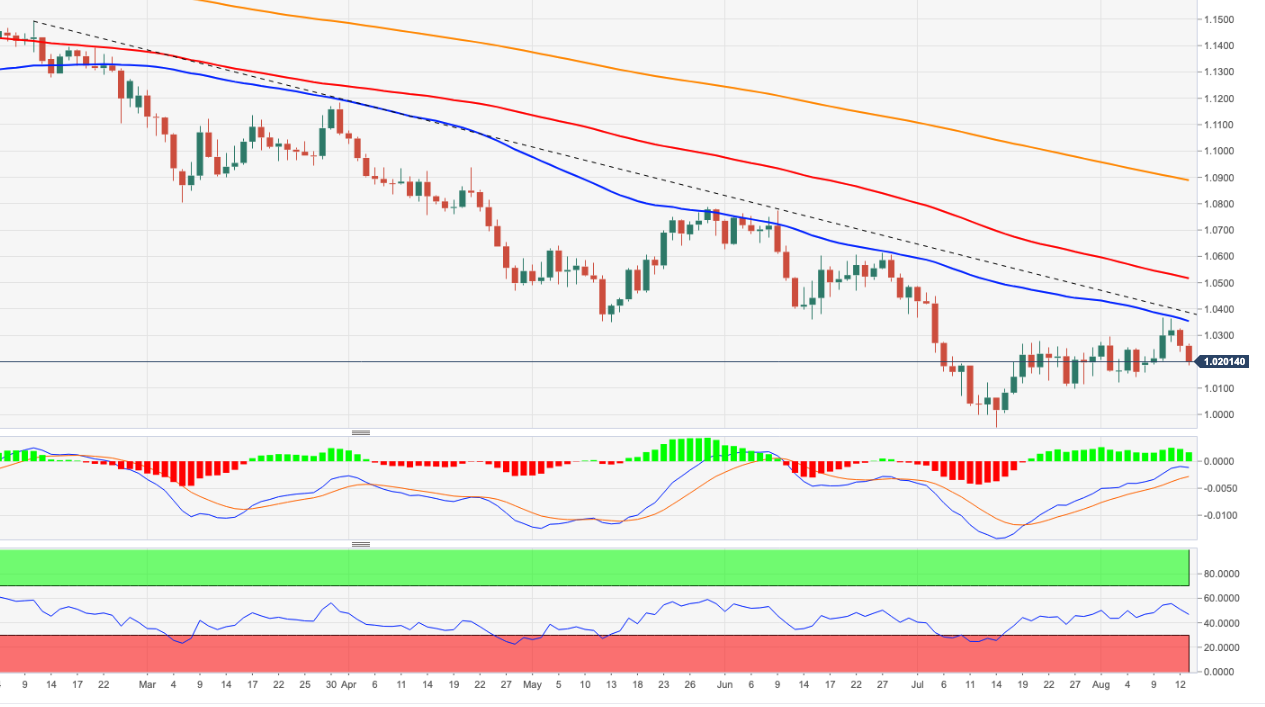
- EUR/USD holds lower ground after breaking short-term key support, now resistance.
- One-month-old horizontal area lures bears amid downbeat MACD, RSI.
- Convergence of 21-DMA, ascending trend line from mid-July guards immediate recovery.
EUR/USD remains pressured around 1.0160 during the initial Asian session on Tuesday, after breaking the 1.0200 key support the previous day.
In addition to the clear downside break of the 21-DMA and monthly ascending trend line, descending RSI (14) and receding bullish bias of the MACD also keep the EUR/USD bears hopeful.
With this, the EUR/USD pair becomes vulnerable to visiting the one-month-old horizontal support around 1.0100.
However, the 1.0000 parity mark can challenge the major currency pair’s further downside, which if ignored could quickly direct the south-run towards the yearly low surrounding 0.9950.
On the contrary, recovery remains elusive until the quote stays below the convergence of the immediate DMA and the upward sloping previous support line from mid-July, around 1.0200.
Even so, the 50-DMA and a descending trend line from May 30, close to 1.0310, appear a tough nut to crack for the EUR/USD bulls.
It’s worth noting that a three-month-old ascending support-turned-resistance line, close to 1.0360-65, appears the last defense of the pair sellers.
EUR/USD: Daily chart
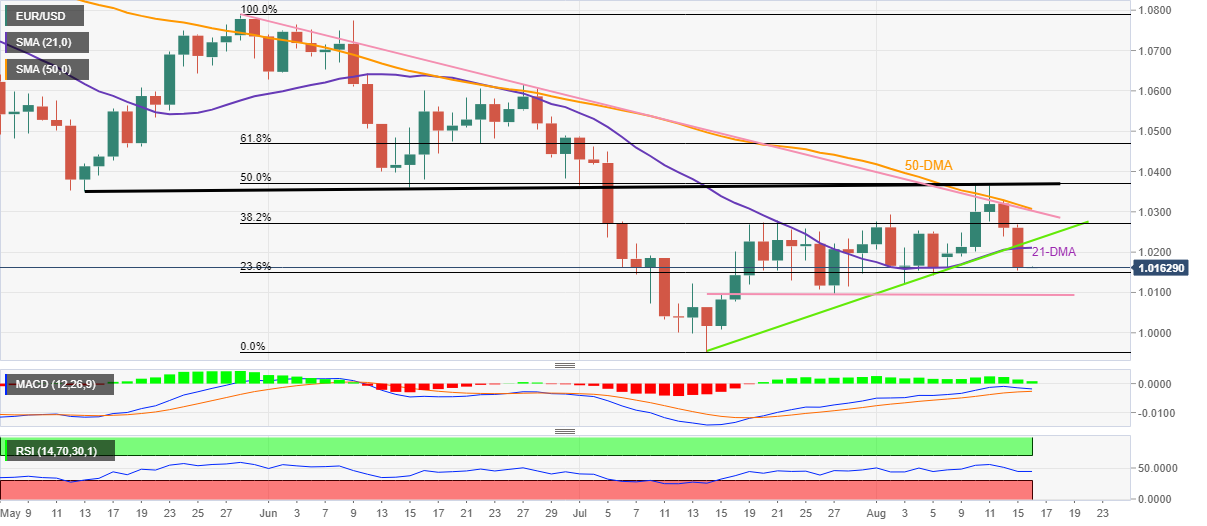
Trend: Further weakness expected
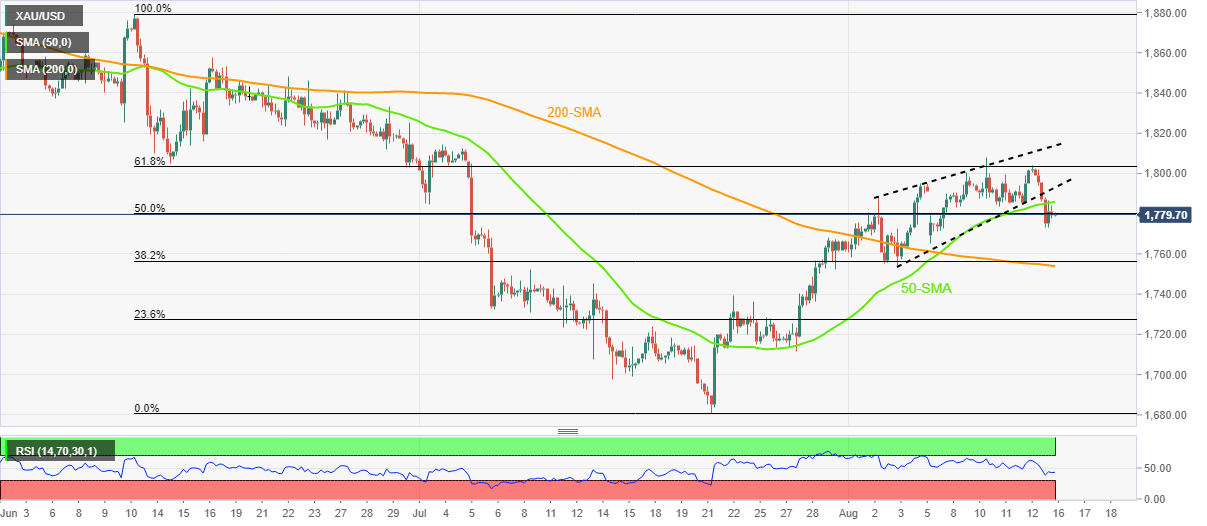
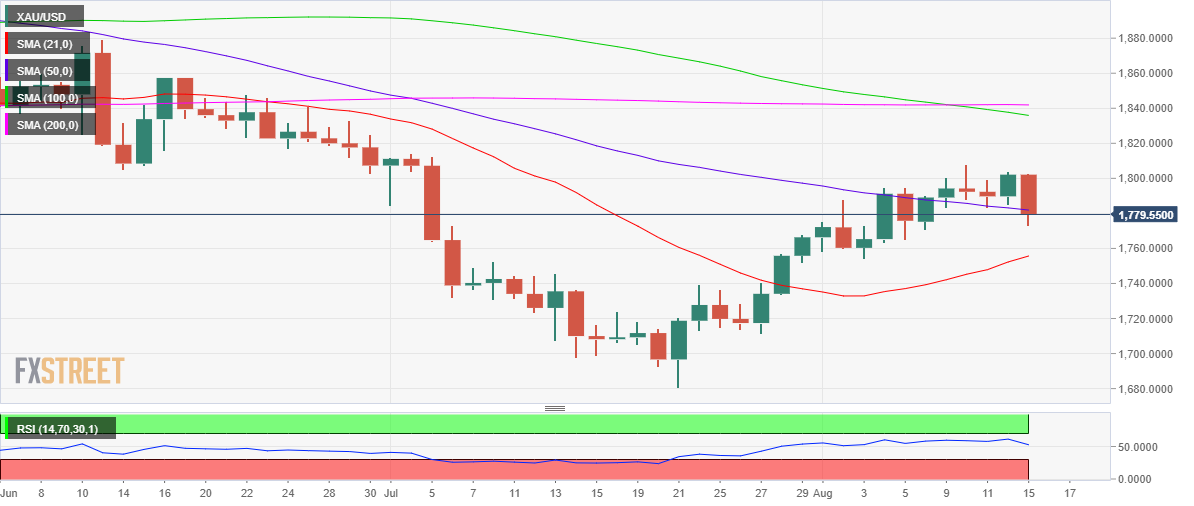
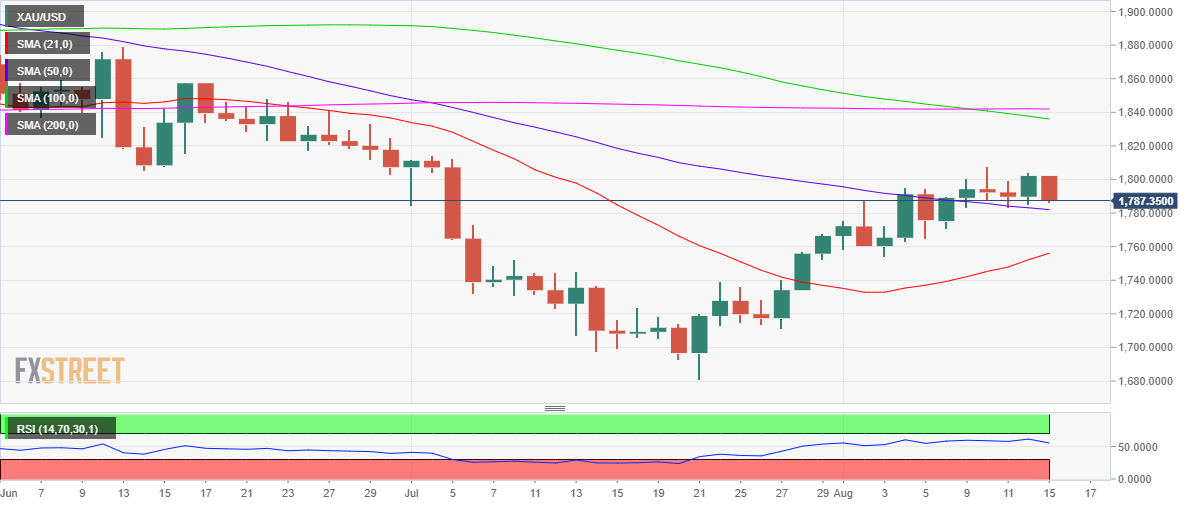
- Gold price remains pressured after confirming a bearish chart pattern.
- US dollar regains upside momentum amid growth concerns, cautious mood ahead of FOMC Minutes.
- Recession fears from China, softer US data weighed on the XAU/USD prices.
- Second-tier US data can entertain traders ahead of Fed Minutes.
Gold price (XAU/USD) keeps the previous day’s downside break of the fortnight-old rising wedge while flashing $1,780 as a quote during the early Asian session on Tuesday. The yellow metal’s latest losses could be linked to the US dollar’s sustained rebound, as well as the cautious mood ahead of Wednesday’s Federal Open Market Committee (FOMC) meeting minutes.
US Dollar Index (DXY) posted the biggest daily gains in a week as the greenback’s gauge versus the six major currencies cheered the market’s fears of recession, as well as concerns surrounding the Fed’s next move.
That said, the downbeat print of the US NY Empire State Manufacturing Index for August, to 31.3 in August from 11.1 in July and 8.5 market forecasts, contributed to the economic slowdown fears. On the same line, the US August NAHB homebuilder confidence index also fell to 49 versus 55, its lowest level since the initial months of 2020.
It should be noted that the softer than expected prints of China’s Retail Sales, Industrial Production and a lack of demand for the loaned funds joined the People’s Bank of China’s (PBOC) surprise rate cut to amplify the growth fears from the world’s biggest commodity user.
Elsewhere, headlines suggesting improved coronavirus conditions in China's financial hub Shanghai and the resumption of the Russian bonds’ trading on Wall Street should have favored the risk appetite, but could not. Furthermore, hopes of a probable meeting between US President Joe Biden and his Chinese counterpart Xi Jinping, as signaled by the Wall Street Journal (WSJ), could favor the risk-on mood. On the same line were comments from China’s President Xi suggesting more efforts to revive the world’s second-largest economy.
Amid these plays, the US 10-year Treasury yields dropped six basis points (bps) to 2.79% whereas Wall Street closed with mild gains.
Moving on, the second-tier US data concerning housing and activities could entertain the gold traders but major attention will be given to how the Fed can defend its hawkish stand in the Minutes amid recession fears and softer inflation data.
Technical analysis
Gold price justifies a confirmation of the two-week-old rising wedge bearish chart pattern by taking rounds to the 50% Fibonacci retracement of the June-July downside, near $1,780. The bearish bias also takes clues from the downbeat RSI (14), not oversold, as well as failures to extend the latest corrective pullback from beyond the 50-SMA.
That said, the XAU/USD bears presently aim for the convergence of the 200-SMA and 38.2% Fibonacci retracement, around $1,753. However, multiple supports around $1,730 and the $1,700 threshold could challenge the metal’s further downside amid likely oversold RSI.
Should the precious metal continues to decline past $1,700, the odds of its slump to the yearly low surrounding $1,680 can’t be ruled out.
Alternatively, a 50-SMA level surrounding $1,785-86 guards the quote’s immediate recovery ahead of the quote’s run-up towards the stated wedge’s lower line, close to $1,795 by the press time.
Following that, the $1,800 threshold and the 61.8% Fibonacci retracement level surrounding $1,805 could test the gold buyers before challenging the wedge’s upper line near $1,815.
Overall, XAU/USD remains on the bear’s radar despite the late Monday’s bounce off $1,773.
Gold: Four-hour chart
Trend: Further weakness expected
Iran responded to the European Union's "final" draft text to save a 2015 nuclear deal on Monday, an EU official said, as the Iranian foreign minister called on the United States to show flexibility to resolve three remaining issues, per Reuters.
While Washington has said, per Reuters, it is ready to quickly seal a deal to restore the 2015 accord on the basis of the EU proposals, Iranian negotiators said Tehran's "additional views and considerations" to the EU text would be conveyed later.
The EU official on Monday provided no details on Iran's response to the text.
"There are three issues that if resolved, we can reach an agreement in the coming days," Iranian Foreign Minister Hossein Amirabdollahian said earlier on Monday, suggesting Tehran's response would not be a final acceptance or rejection.
The Iranian policymaker also said, “We have told them that our red lines should be respected ... We have shown enough flexibility ... We do not want to reach a deal that after 40 days, two months or three months fails to be materialised on the ground.”
The 2015 agreement appeared on the verge of revival in March after 11 months of indirect talks between Tehran and U.S. President Joe Biden's administration in Vienna.
But talks broke down over obstacles including Tehran's demand that Washington provide guarantees that no U.S. president would abandon the deal as Trump did
Biden cannot promise this because the nuclear deal is a non-binding political understanding, not a legally binding treaty.
Market reaction
Given the lack of clear response from the European Union (EU), the news failed to garnet major attention.
Also read: Forex Today: Growth-related concerns underpin the greenback
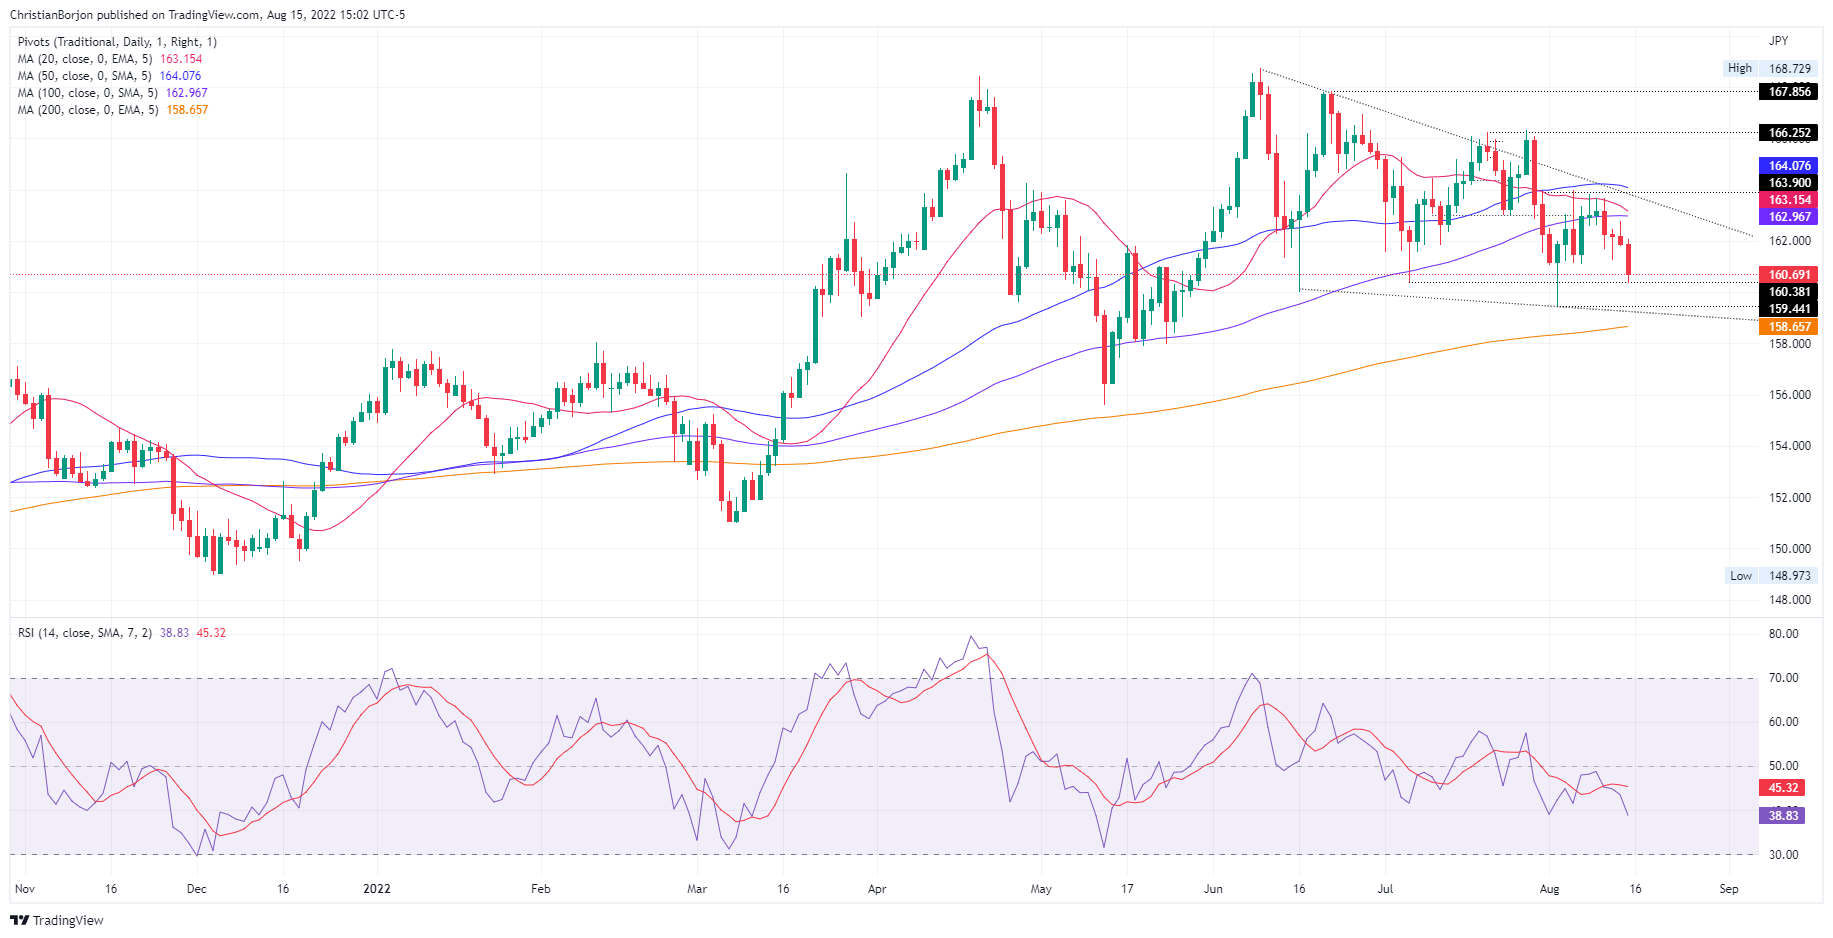
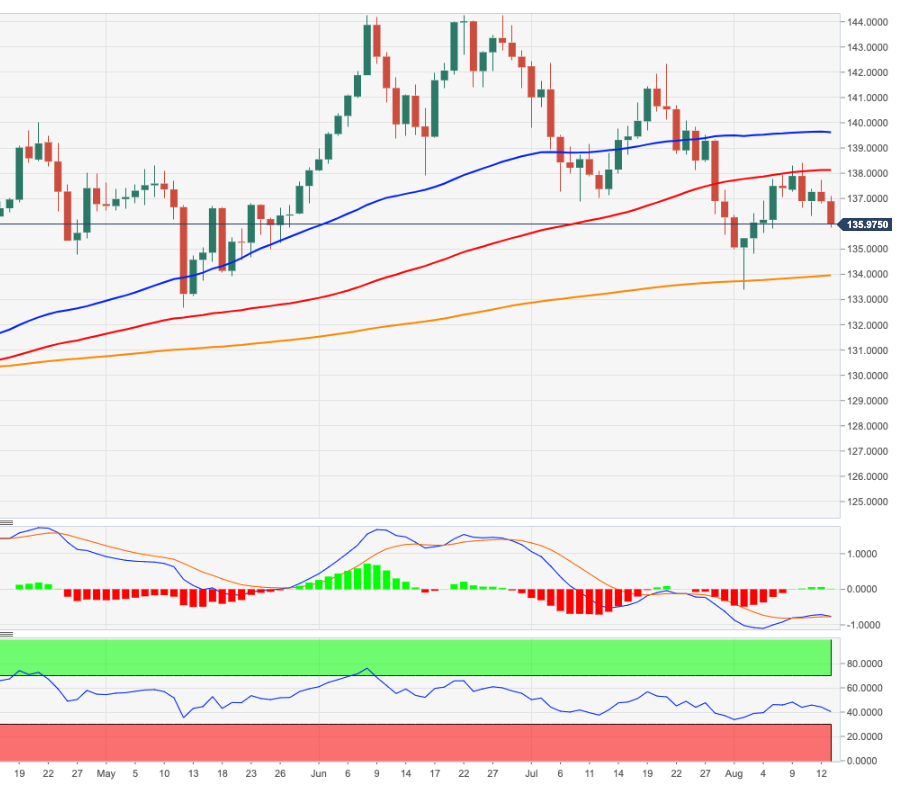
- GBP/JPY extends its losses, from around 163.00 to 160.60 in the last four days.
- Risk aversion in the FX space underpins safe-haven peers.
- GBP/JPY: To resume its downward bias below 160.34; otherwise, a test of 162.07 is on the cards.
The GBP/JPY stumbles and refreshes two-week lows, eyeing a break below the July 6 low at 160.38, which could exacerbate a move towards the August 2 low at 159.44, ahead of the 200-day EMA at 158.65. At the time of writing, the GBP/JPY is trading at 160.69, down 0.75, due to a risk-off impulse in the FX space, to the detriment of risk-sensitive currencies, namely the GBP, AUD, and NZD.
GBP/JPY Price Analysis: Technical outlook
The longer-term of the GBP/JPY is neutral-to-downward biased as shown by the daily chart. Succesive series of lower highs/lows, alongside the Relative Strength Index (RSI) aiming downwards and below its 7-day RSI SMA, exacerbated the cross fall in the last four days. Also, the 20-day EMA is about to cross under the 100-day EMAat 162.97, which would exert additional selling pressure on the pair. That could send the GBP/JPY towards the 200-day EMA at 158.65.
Therefore, the GBP/JPY’s first support would be the August 15 low at 160.34. Break below will expose the July 6 low at 160.38, followed by the August 2 low at 159.44, followed by the abovementioned 200-day EMA.
On the flip side, the GBP/JPY's first resistance would be the August 15 high at 162.07. Once cleared, the next resistance will be August 12, high at 162.79, followed by the 163.00 figure.
 GBP/JPY Daily chart
GBP/JPY Key Technical Levels
What you need to take care of on Tuesday, August 16:
Recession-related concerns took over financial markets at the beginning of the week, pushing the safe-haven dollar higher across the FX board. The greenback pared gains during US trading hours as Wall Street managed to post modest advances but held near its intraday highs.
News coming from China spurred the dismal mood. Retail Sales in the country were up 2.7% YoY in July, while Industrial Production rose by 3.8% in the same period, both missing the market’s expectations. At the same time, the central bank unexpectedly cut a key policy interest rate and drained liquidity. Additionally, China has announced more drills around Taiwan after a new delegation of US lawmakers met with Taiwanese President Tsai Ing-wen.
Meanwhile, the EU is working on a nuclear deal with Iran, with the latter expected to provide an answer by the end of the day. The EU wants to bring back Tehran’s nuclear deal amid energy shortages triggered by the Ukraine war. News on the matter will likely come early in the Asian session.
RBA Meeting Minutes coming up next.
The EUR/USD pair trades at around 1.0160, while GBP/USD hovers around 1.2050. Commodity-linked currencies are down, with AUD/USD trading at 0.7020 and USD/CAD at around 1.2910.
Gold was among the weakest USD safe-haven rivals, down to $1,779 a troy ounce. The USD/CHF pair is at 0.6460, while USD/JPY trades at around 133.20.
Crude oil prices were sharply down, recovering modestly ahead of the close. The barrel of WTI is currently at around $88.90.
Will the Bitcoin price fool chart readers once again?
Like this article? Help us with some feedback by answering this survey:
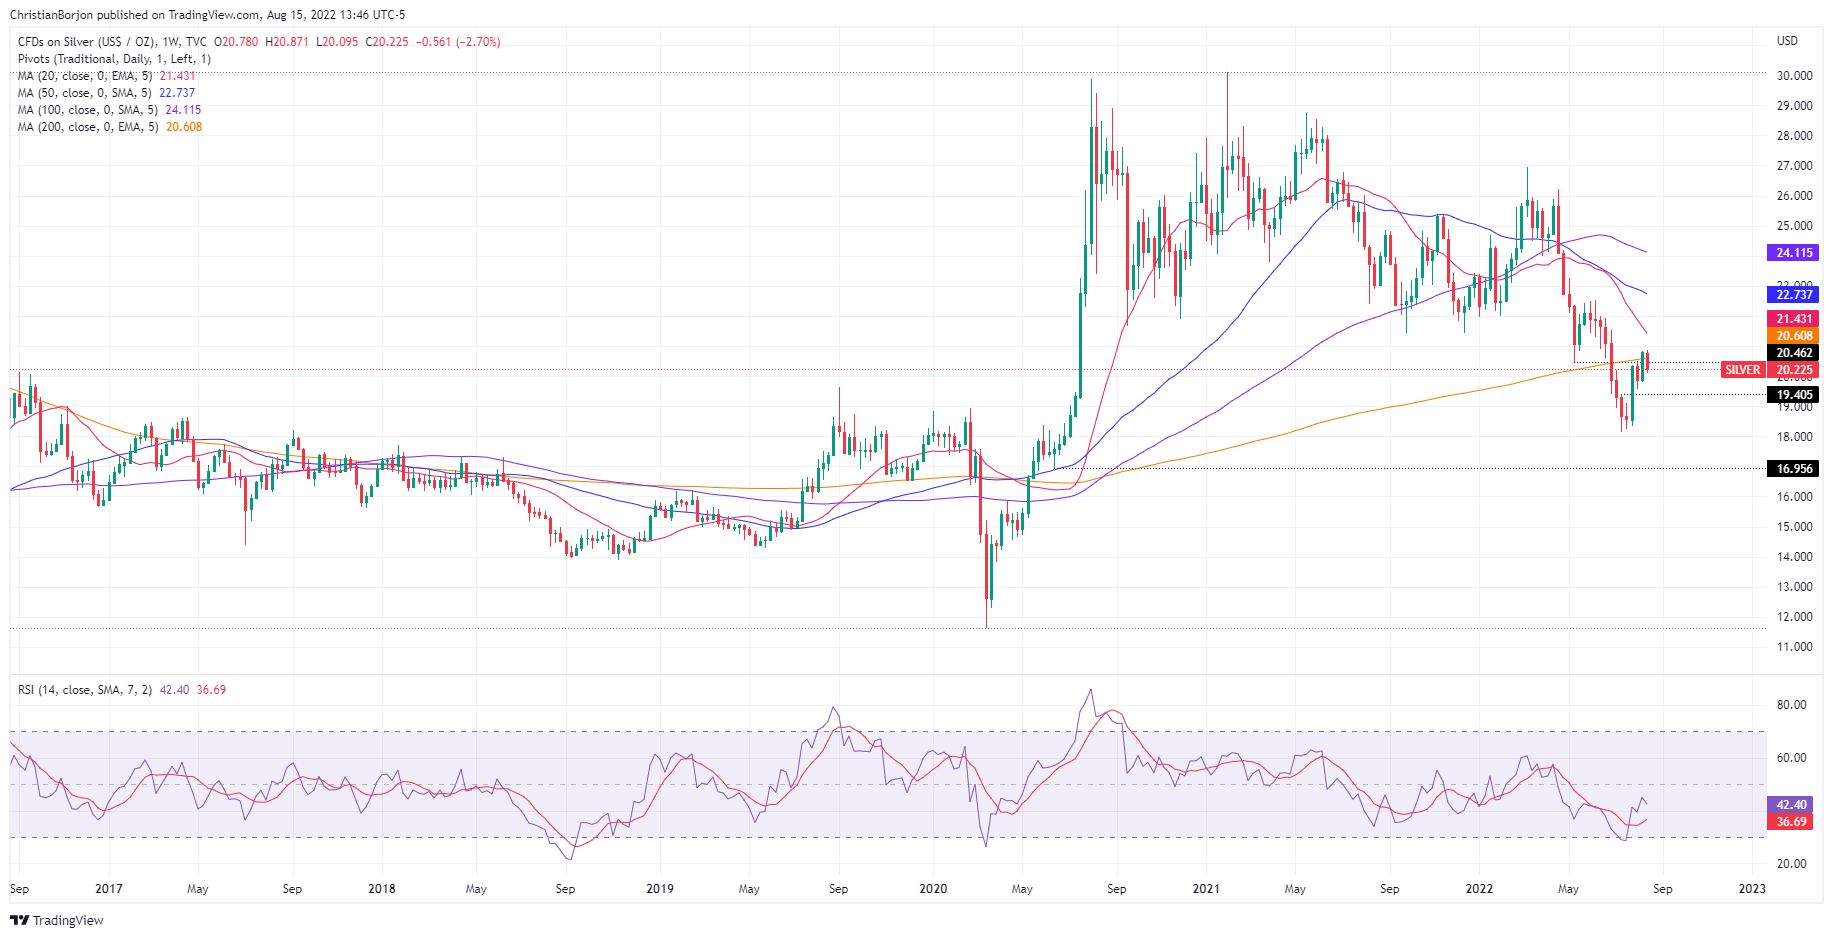
- Silver price is upward biased from a monthly chart perspective.
- In the weekly chart, XAG/USD remains below its 200-week EMA, downward biased.
- XAG/USD daily chart illustrates silver as neutral-to-downwards, though a bearish-engulfing candle pattern suggests a leg-down is on the cards.
Silver price edges lower during Monday’s North American session, down by 2.40% courtesy of US dollar strength, despite falling US Treasury bond yields, ahead of the release of the last FOMC monetary policy minutes. At the time of writing, the XAG/USD formed a bearish-engulfing candle pattern, trading at $20.23.
Silver Price Analysis (XAG/USD): Technical outlook
The white metal outlook looks more positive than negative from a monthly chart perspective. July’s price action formed a dragonfly-doji in a crowded area with the 50, 100, and 200-monthly MAs lying around the $18.48-$20.17 region, which could pave the way for further gains. On the topside, the 20-month EMA at $23.81 might cap further XAG/USD gains.
 XAG/USD Monthly chart
In the meantime, the XAG/USD weekly chart portrays the non-yielding metal struggling at the 200-week MA, at $20.60. Nevertheless, unless sellers push silver below $19.80, buyers could remain hopeful of higher prices, though they would face a wall of resistance at around $21.48, the 20-week EMA. Once cleared, it would pave the way towards the 50-week EMA at $22.73, ahead of the 100-week at $24.11.
 XAG/USD Weekly chart
The XAG/USD daily chart portrays silver as neutral-to-downwards biased. As previously mentioned, a bearish-engulfing candle pattern surfaced. Still, the 50-day EMA at $20.18 is a difficult support level to overcome for sellers, but the Relative Strength Index (RSI) aiming lower, towards the 50-midline, might open the door for further losses.
If XAG/USD sellers achieve a daily close below the above-mentioned, the XAG/USD next support would be the $20.00 figure, which, once cleared, could test the 20-day EMA at $19.73. On the flip side, if XAG/USD buyers hold the fort above the former, then the XAG/USD first resistance would be the $21.00 figure. Break below will expose crucial resistance levels, like the 50-day EMA at $21.68, followed by the 200-day EMA at $22.68.
 XAG/USD Daily chart
Silver (XAG/USD) Key Technical Levels
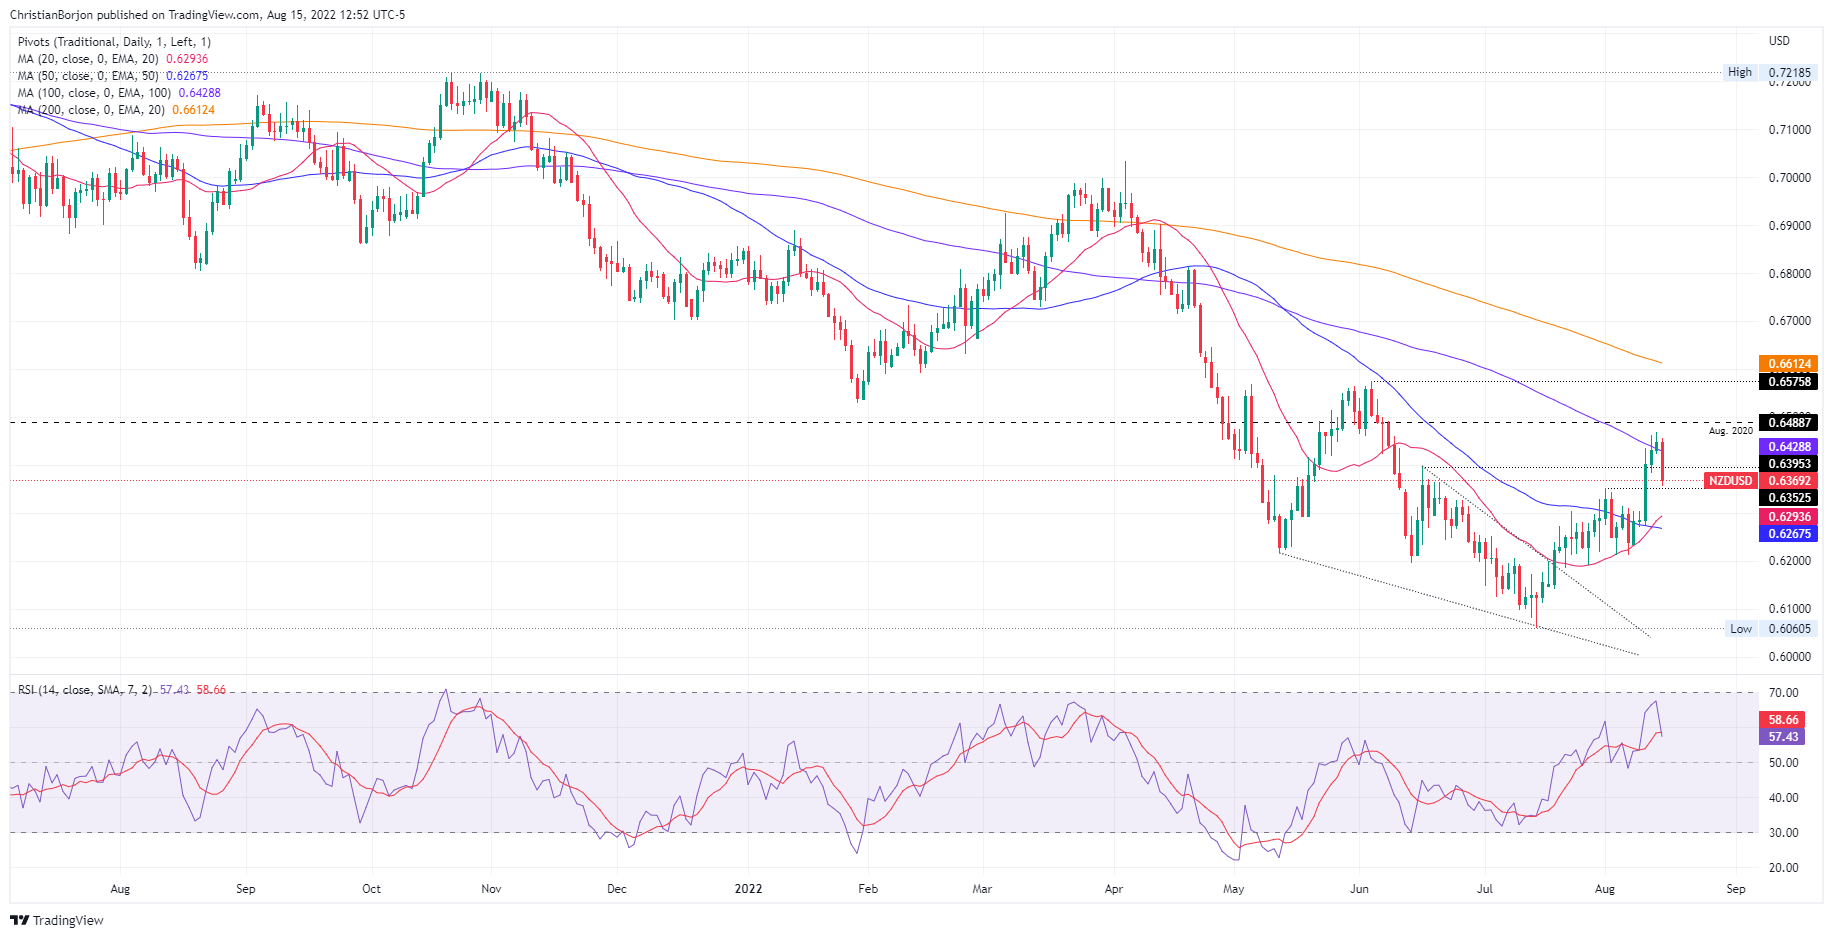
- NZD/USD drops from last week’s highs around 0.6468 on risk aversion.
- China’s economic slowdown looming and bleak NY Fed Empire State Index underpin the US dollar.
- The Reserve Bank of New Zealand is expected to hike rates by 50 bps on Wednesday.
The NZD/USD snaps five days of gains and tumbles from around last week’s highs due to a mixed sentiment, spurred by weak Chinese economic data, alongside a dismal NY Fed Empire State Manufacturing Index, which slightly weakened the greenback.
At the time of writing, the NZD/USD is trading at 0.6369, after hitting a daily high at 0.6456, before nosediving towards the day’s lows at 0.6355, as traders sought safety ahead of the release of FOMC’s minutes on Wednesday.
US equities are treading high, lifted by big tech companies. In the FX space, safe-haven peers are in control after China’s Industrial Production and Retail Sales data missed estimates. The PBoC reacted to the figures, slashing rates on its 1-year MLF from 2.85% to 2.75%, on growing concerns that the country will miss its 5% target by year’s end.
In the meantime, earlier in the US session, the NY Empire State Manufacturing Index for August got into contractionary territory, at -31.3 from 5 estimates, causing a hiccup in the US Dollar Index, which ticked lower to 106.000, before resuming its rally towards 106.405, up 0.69%.
What to watch
All that said, the NZD/USD outlook is tilted to the downside. However, with the RBNZ monetary policy looming and traders expecting a 50 bps increase, it would cap kiwi’s falls towards lower levels. For NZD/USD buyers is crucial to hold the exchange rate above 0.6395; if not, a fall towards August 1 daily high-turned-support at 0.6350 before opening the door for further losses.
On the US front, the economic calendar will feature the Federal Reserve Open Committee (FOMC) minutes, US Housing data, Initial Jobless Claims, the Conference Board Leading index, and Fed speak.
NZD/USD Daily chart
NZD/USD Key Technical Levels
- USD/CAD climbs sharply due to lower WTI prices spurred by China’s data showing its slowing economy.
- The New York Fed Empire State Manufacturing Index for August tumbles to -31.3, led by business conditions deteriorating.
- The USD/CAD might get some cues from Canadian inflation figures, alongside US Federal Reserve minutes to be released on Wednesday.
The USD/CAD rebounds from around the 200-day EMA and rallies sharply towards its daily high at 1.2934 due to a risk-off impulse spurred by weak Chinese economic data, alongside lower oil prices. WTI price slid 3.50%, below the $90 per barrel, a tailwind for the USD/CAD.
The USD/CAD is exchanging hands at 1.2896, after opening near its daily lows, reached during the Asian session, at 1.2766, but risk-aversion and broad US dollar strength bolstered the major, extending its gains throughout the day.
Early in the US session, the New York Fed reported its business conditions for August, also known as the NY Fed Empire State index, tumbled to -31.3, worse than estimations as orders and shipments decelerated.
In the meantime, WTI dropped on news of China’s economic slowdown, which reignited recession fears across the globe. Confirmation of the aforementioned is the People’s Bank of China (PBoC) cut its 1-year Medium-Term Lending Facility (MLF) by ten bps to 2.75%. The PBoC reacted to weaker than estimated data, like Industrial Production and Retail Sales, missing forecasts.
What to watch
In the week, the Canadian economic docket will feature inflation data. While the US calendar will reveal Federal Reserve minutes, US Housing data, Initial Jobless Claims, the Conference Board Leading index, and Fed speak.
USD/CAD Daily chart
USD/CAD Key Technical Levels
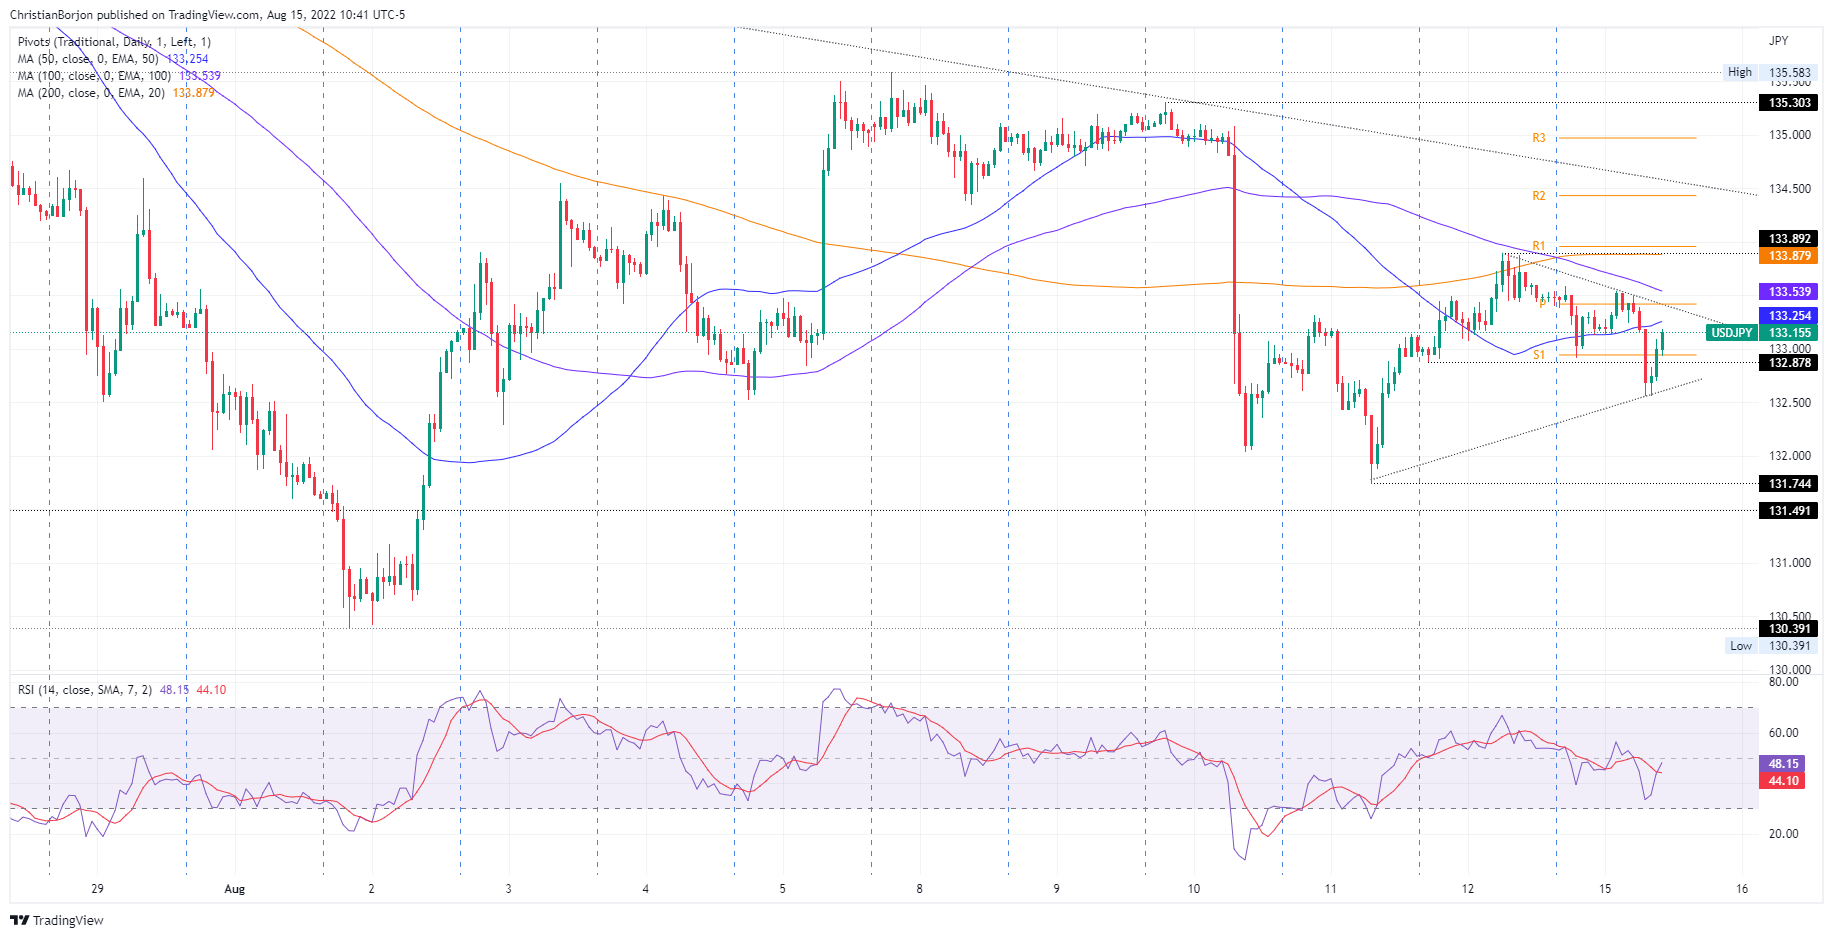
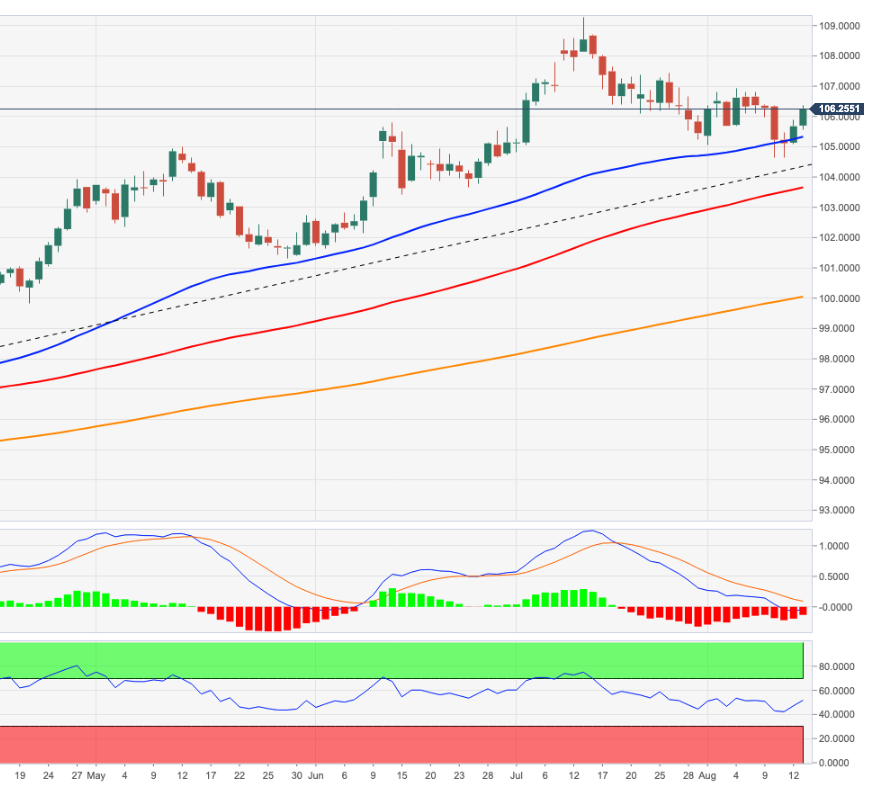
- USD/JPY is trapped between the 50 and the 100-day EMAs, waiting for a catalyst.
- In the near term, the USD/JPY is neutral to downwards and might aim lower if the 132.87 is broken; otherwise, expect a test of the 200-hour EMA at 133.88.
The USD/JPY is slightly in the red territory in the early New York session, though it remains above its daily low reached at 132.55, as bulls managed to defend last Friday’s daily low at 132.87, lifting the major above the 133.00 threshold. At the time of writing, the USD/JPY is trading at 133.15.
USD/JPY Price Analysis: Technical outlook
The USD/JPY is trading inside the boundaries of the 50-day EMA and the 100-day EMA on top/bottom, each at 135.31 and 131.41, respectively. Albeit the Relative Strength Index (RSI) illustrates sellers in charge, buyers are gathering momentum, lifting the RSI from its August lows near oversold conditions, about to reclaim the 50-midline.
Reviewing the pair from the 1-hour scale, indecision is the game’s name. The USD/JPY has been seesawing in the 132.85-133.90 range, though in the last couple of days, successive series of lower highs/lows might open the door for further downside. If USD/JPY sellers break below 132.87, the next support will be the August 11 low at 131.73. Once cleared, the next support would be 131.00.
On the flip side, the USD/JPY’s first resistance will be the 20-hour EMA at 133.25. A breach of the latter will expose further resistance levels like the 50-hour EMA at 133.54, followed by the confluence of the August 12 high and the 200-hour EMA at 133.88.
 USD/JPY Hourly chart
USD/JPY Key Technical Levels
- EUR/USD is under heavy selling as the US dollar keeps rallying amid risk-aversion.
- Recession fears amid deepening Germany’s energy crisis add to EUR’s misery.
- The sell-off in the Treasury yields fail to lend support to the major.
EUR/USD is falling like a house of cards, having surrendered the 1.0200 mark amid intense buying pressure seen around the US dollar.
The greenback remains the go-to safe-haven asset, as dismal Chinese data-led resurfacing growth fears spook investors’ sentiment.
Risk-off flows continue to dominate even as the American trading gets underway, with the downbeat Empire Manufacturing Survey and NAHB index doing little to deter dollar bulls.
Markets prefer to pile onto the dollars heading into Wednesday’s FOMC minutes showdown, which may reveal Fed policymakers' intent on the size of the future rate rises. The minutes may influence the market’s pricing of the September Fed rate hike, eventually impacting the USD valuations.
Meanwhile, the souring sentiment-driven sell-off in the US Treasury yields fail to lend any support to the spot. The main currency pair also remains undermined by growing recession risks in the euro area. Europe’s economic powerhouse, Germany, could enter into a recession amid the deepening energy crisis, with sinking Rhine waters making shipping along the river harder and adding to the supply-side issue.
Further up the river in Kaub, a noted bottleneck for shipping where the Rhine runs narrow and shallow, the reference level dropped below 40 centimeters, which could probably temper coal counts among key cargo moved on the waterway.
In the last hour, Economy Minister Robert Habeck said that “Germany had to introduce its new levy to help utilities cover the cost of replacing Russian supplies or else its energy market would collapse.” EUR bulls shrugged off Habeck’s comments amid relentless dollar demand.
EUR/USD: Technical levels to watch
Analysts at TD Securities expect the annual Consumer Price Index (CPI) in Canada to decline to 7.8% in July from 8.1% in June with lower energy prices and larger base effects weighing on the headline print.
USDCAD dips are a buy
"Food prices and rents should bounce back from their muted performance in June, while mortgage interest costs provide another source of strength. We also look for core inflation to hold near 5.0% with only a 0.1pp increase to CPI-common."
"FX: A moderation in CPI should help the market price in peak hawkishness by the BOC. USDCAD dips are a buy and we think legging into topside around the BOC meeting is compelling."
"Rates: CPI is naturally in the hot seat so big surprises will drive relative performance of Canada vs the US. Tactically we are gearing up for September 1 index-driven demand, which should trigger a meaningful supply-demand imbalance in conjunction with no 30y nominal auction this August month-end."
- Gold Price breaches the critical 50 DMA at $1,782 despite falling yields.
- China data-led triggers risk-aversion, boosts the safe-haven US dollar.
- XAU/USD remains exposed to testing the bullish 21 DMA on a daily closing below 50 DMA.
Gold Price is deep in the red in the American session, as investors resort to ‘sell-everything mode amid broad risk-aversion.
The latest leg down in the yellow metal took out the critical 50-Daily Moving Average (DMA) at $1,782, as the selling pressure intensified after the US stocks opened lower.
Risk-off flows extended into American trading, as downbeat Chinese activity data accentuated concerns over the health of the global economy while investors remained wary about the size of the next Fed rate hike move in the coming months.
Also read: Gold Price Forecast: XAU/USD closes the week above 50 DMA, what’s next?
Gold traders failed to capitalize on the unexpected rate cuts by the People’s Bank of China (PBOC), as it unnerved the market even further and offered extra zest to the best safety bet in the US dollar. Over the last hour, the bullion is finding some support near $1,770 levels amid a sharp sell-off in the US Treasury yields, investors scurry to the safe-haven American government bonds.
Technically, gold sellers eye a daily closing below the 50 DMA to resume the downslide towards the bullish 21 DMA at $1,756. Alternatively, if bulls manage to defend the former, then a rebound towards the $1.800 barrier will be inevitable.
The 14-day Relative Strength Index (RSI) has turned south, attacking the midline, justifying the recent weakness in the yellow metal.
Gold Price: Daily chart
Gold Price: Additional levels to consider
- AUD/USD plunges below its 100-DMA, threatening to negate an inverse head-and-shoulders, down more than 1%.
- China’s worst-than-expected data and US NY Fed Empire State report deteriorated investors’ mood.
- The Australia docket will unveil August RBA minutes, inflation, and employment data during the week.
The AUD/USD tumbles amidst a risk-off impulse on Monday, spurred by China’s economic data adding to the deceleration in its economic growth, while the US NY Fed Empire State Manufacturing Index plunged. Therefore, risk-sensitive currencies like the AUD, NZD, and CAD are down during the day.
The AUD/USD is trading at 0.7036, down 1.20%, after exchanging hands near last week’s highs at 0.7125, but worries about China’s economy and the PBoC surprise rate cut to its 1-year MLF weighed on the AUD/USD, with Australia being one of China’s largest trader partners. Hence, the AUD/USD dropped to a daily low at 0.7011 before stabilizing at current levels.
In the meantime, the US NY Fed Empire State Manufacturing for August plummeted to -31.3 from 5 due to orders and shipments declining. Even though it’s a dismal reading, sources cited by Bloomberg said: “that industries extrapolated orders from the Covid period and they ordered too much stuff.” Despite numbers of the previously mentioned report and last week’s US inflation figures cooling down, it might not deter the Federal Reserve from continuing hiking.
Meanwhile, during the Asian session, the Australian economic docket had nothing to report, but its largest trading partner did. China featured Industrial Production slowing from 4.3% expected to 3.8% YoY, while Retail Sales increased to 2.7% YoY, less than 4.9% estimates. In reaction, the People’s Bank of China (PBoC) reduced its 1-year MLF by ten basis points to 2.75%. Therefore, sentiment deterioration was a headwind for the AUD/USD.
What to watch
The Australian economic calendar will report the Reserve Bank of Australia’s (RBA) August minutes, inflation figures, Q2 wages, and employment figures during the week. On the US front, the US Federal Reserve minutes, housing data, Initial Jobless Claims, the CB leading index, and Fed speak.
AUD/USD Key Technical Levels
- USD/TRY extends the side-lined trading near 18.00.
- Türkiye Budget Balance showed a TL64B deficit in July.
- The CBRT is expected to keep rates unchanged later in the week.
Further consolidation remains the name of the game in USD/TRY for the time being and always just pips shy of the 18.00 zone.
USD/TRY poised to extend the extra range bound theme
USD/TRY keeps the side-lined mood well in place since late July in the area just below the 18.00 neighbourhood. So far, bulls remained unable to break above that key level, which appears to be strongly reinforced by FX intervention.
Data wise in Türkiye, the Budget Balance deficit more than doubled in July to TL64B, although the focus of attention is expected to be on the Turkish central bank (CBRT) meeting on Thursday. Consensus among investors, in the meantime, keeps pointing to another “on hold” decision by the central bank despite inflation rose near 80% in the year to July.
What to look for around TRY
The upside bias in USD/TRY remains unchanged and stays on course to revisit the key 18.00 zone.
In the meantime, the lira’s price action is expected to keep gyrating around the performance of energy and commodity prices - which are directly correlated to developments from the war in Ukraine - the broad risk appetite trends and the Fed’s rate path in the next months.
Extra risks facing the Turkish currency also come from the domestic backyard, as inflation gives no signs of abating (despite rising less than forecast in July), real interest rates remain entrenched in negative figures and the political pressure to keep the CBRT biased towards low interest rates remains omnipresent. In addition, there seems to be no Plan B to attract foreign currency in a context where the country’s FX reserves dwindle by the day.
Key events in Türkiye this week: Budget Balance (Monday) – CBRT Interest Rate Decision (Thursday).
Eminent issues on the back boiler: FX intervention by the CBRT. Progress (or lack of it) of the government’s new scheme oriented to support the lira via protected time deposits. Constant government pressure on the CBRT vs. bank’s credibility/independence. Bouts of geopolitical concerns. Structural reforms. Presidential/Parliamentary elections in June 23.
USD/TRY key levels
So far, the pair is gaining 0.20% at 17.9569 and faces the immediate target at 17.9874 (2022 high August 3) seconded by 18.2582 (all-time high December 20) and then 19.00 (round level). On the other hand, a breach of 17.1903 (weekly low July 15) would pave the way for 16.3099 (100-day SMA) and finally 16.0365 (monthly low June 27).
"Germany's Russia-dependent energy model has failed and isn't coming back," German Economy Minister Robert Habeck said on Monday, as reported by Reuters.
Additional takeaways
"We have to swallow bitter medicine to make the shift to a new energy model."
"Gas levy will secure supply."
"Alternative to levy would have been a collapse of the German energy system."
"These measures make us less vulnerable to blackmail."
"We need targeted relief to help people with gas levy."
Market reaction
The shared currency is struggling to stage a recovery and the EUR/USD pair was last seen losing 0.45% on the day at 1.0212.
Economists at TD Securities argue that the recent recovery in industrial metal prices was overdone in light of the latest macroeconomic data releases from China.
Base metals prices to revert lower
"The Chinese data was weaker-than-expected, with construction and property markets continuing to act as a significant drag, suggesting the recent recovery in industrial metal prices was overdone. Indeed, we are now anticipating Chinese growth of only 2.9% for this year, significantly weaker than the official target of "around 5.5%"."
"In this sense, while our proprietary gauge of commodity demand has mean-reverted sharply higher after the steepest liquidation event in nearly a decade, this recovery in commodity demand signals has likely run out of steam with weaker growth dynamics ultimately weighing on the complex."
"Notwithstanding, our gauge of metals supply risk continues to point to supply risk premia filtering through into base metals, reflecting the uncertainties surrounding the ongoing power curtailments in China and the surging European energy prices. However, we anticipate that the weakness on the demand front will prove to be the more dominant force moving forward. Ultimately, base metals are trading in a bear market regime, and we expect prices to revert lower as this transitory source of supply risk premia abates."
- GBP/USD stays under constant bearish pressure on Monday.
- The greenback preserves its strength despite disappointing data.
- Focus shifts to US housing data, UK July jobs report.
GBP/USD started the week under bearish pressure and dropped to a weekly low of 1.2051 in the European session. Although the pair staged a rebound toward 1.2100, it failed to reclaim that level. As of writing, the pair was down 0.3% on the day at 1.2090.
Dollar capitalizes on safe-haven flows
The negative shift witnessed in risk sentiment on Monday provides a boost to the safe-haven greenback. Disappointing macroeconomic data releases from China alongside the escalating geopolitical tensions don't allow risk-sensitive assets to find demand.
Meanwhile, the data from the US showed on Monday that the NY Fed Empire State Manufacturing Index slumped to -31.3 in August from 11.1 in July. The dollar lost some strength as this print missed analysts' forecast of 8.5 by a wide margin but the US Dollar Index managed to hold above 106.00.
Later in the session, the NAHB Housing Market Index data from the US will be looked upon for fresh impetus. Meanwhile, Wall Street's main indexes remain on track to open deep in negative territory with US stock index futures losing between 0.45% and 0.7% on the day.
On Tuesday, the UK's Office for National Statistics will release the July jobs report. Investors expect the ILO Unemployment Rate to remain steady at 3.8% in the three-month period ending in July.
Reuters reported that 30 of 51 economists that took part in a recently conducted survey saw the Bank of England raising its policy rate by 50 basis points in September but this report failed to help the sterling find demand.
Technical levels to watch for
- Chinese economic slowdown exacerbates the case of slowing oil demand.
- Market players keep an eye on nuclear discussions between the US and Iran.
- WTI trades near the August low at $86.99 and with a firmly bearish technical stance.
Crude oil prices are in free fall at the beginning of the week, with the barrel of West Texas Intermediate currently trading at $86.63, not far from this month's low at $86.40.
Several factors are weighing on oil prices, the main one being the worsening demand outlook. The data from China showed that the country's crude throughput fell to its lowest level since March 2020 at 53.21 million tonnes of crude oil in July. That number was also 8.8% lower than the same time last year. Additionally, disappointing Retail Sales and Industrial Production data from China revived concerns over a global recession.
On the supply side, Saudi Aramco's CEO said on Sunday that they would be able to raise the output to the max capacity of 12 million bpd if requested by the government. Looking ahead, Iran's response to the EU's offer to revive the 2015 nuclear deal, which is expected to be announced later in the day, could impact crude oil prices. In case Iran and the US reach an agreement, that could lead to the removal of sanctions on Iran's oil and gas exports.
WTI technical outlook
The aforementioned August low is the lowest WTI traded since February, which means that a break below it could result in a steeper decline. The initial bearish target and immediate support level is the $86.10 area, where the black gold has several intraday highs and lows from January this year. A bearish breakout could result in a test of the $85.00 figure. The sour tone of equities will likely keep crude oil prices on the downside through the rest of the day.
Should Wall Street recover, WTI may also find some demand. Intraday resistance stands at $88.50 and $90.00. Nevertheless, technical readings support a near-term downward extension, adding to the negative fundamental picture.
FX Strategist Quek Ser Leang at UOB Group’s Global Economics & Markets Research assesses the recent performance of the US 10-year yields.
Key Quotes
“In our Chart of the Day update from late last month (29 Jul 2022), when US 10-year treasury yield was at 2.688%, we highlighted that ‘the risk for 10-year yield is still clearly on the downside’ and indicated ‘the next support levels are at 2.557% and 2.500%’. We added, ‘resistance is at 2.900% (55-day exponential moving average) but only a break of the declining trend-line (currently at 2.975%) would indicate that the downside risk has dissipated’.
“The 10-year yield subsequently dropped to 2.516% before rebounding strongly on the same day. The price actions led to an ‘outside reversal bar’ formation. After the reversal bar, the 10-year yield edged higher until yesterday (11 Aug) when it not only broke the declining trend-line resistance but also closed above the 55-day exponential moving average. The technical developments and price actions suggest that the downside risk for 10-year has dissipated. To look at it another way, 2.516% is likely a bottom and this level could hold, at least for several weeks.”
“While the 10-year yield has found a bottom, it is premature to expect a major reversal. From here, the 10-year yield is likely to trade between the 2.516% low and 3.103%. Both July’s high and the top of the daily Ichimoku cloud are at 3.103%. A break of this solid resistance level would greatly increase the odds for a sustained advance in the 10-year yield.”
- NY Fed Empire State Manufacturing Index fell sharply in August.
- US Dollar Index erased a portion of its daily gains after the data.
The headline General Business Conditions Index of the Federal Reserve Bank of New York's Empire State Manufacturing survey declined to -31.3 in August from 11.1 in July. This reading missed the market expectation of 8.5 by a wide margin.
"New orders and shipments plunged, and unfilled orders declined. Delivery times held steady for the first time in nearly two years, and inventories edged higher," the New York Fed further explained in its publication. "Labor market indicators pointed to a small increase in employment, but a decline in the average workweek."
Regarding inflation, while still elevated, the prices paid index moved lower and the prices received index held steady, the NY Fed added and noted that firms did not expect much improvement in business conditions over the next six months.
Market reaction
The US Dollar Index (DXY) turned south and erased a portion of its daily gains after this data. As of writing, the DXY was still up 0.4% on the day at 106.10.
- EUR/USD corrects sharply lower and retests 1.0190/85.
- The lower bound of the range emerges around 1.0100.
EUR/USD accelerates the losses and drops below the key 1.0200 support on Monday.
Further correction carries the potential to revisit the lower end of the recent range in the 1.0100 neighbourhood, although a sustained break below this level looks not favoured for the time being.
In the longer run, the pair’s bearish view is expected to prevail as long as it trades below the 200-day SMA at 1.0887.
EUR/USD daily chart
UOB Group’s Senior Economist Julia Goh and Economist Loke Siew Ting review the latest GDP figures in Malaysia.
Key Takeaways
“Real GDP growth improved further to 8.9% y/y (1Q22: +5.0%) which was ahead of Bloomberg consensus (7.0%) but below ours (9.5%). On a seasonally adjusted quarter-on-quarter basis, real GDP rose by 3.5% (1Q22: +3.8%).”
“Key sectors of growth include services (12.0%), manufacturing (9.2%), and construction (2.4%), while agriculture (-2.4%) and mining (-0.5%) contracted. Domestic demand was the main contributor to overall GDP owing to further lift from private consumption (18.3%), private investments (6.3%), and government spending (2.8%).”
“Despite multiple external headwinds, we remain positive on the economic outlook in 2H22 with low base effects and the country’s ongoing transition into endemicity. Nevertheless, the pace of growth is expected to soften as the one-off cash aid from EPF withdrawals wane, effect of higher inflation and interest rates, as well as heightened external risks. Given the strong GDP print of 6.9% in 1H22, we upgrade our full-year GDP estimate to 6.5% for 2022 (vs. 5.5% previously, BNM est: 5.3%-6.3%). We maintain our forecast of 4.8% for 2023.”
- DXY adds to Friday’s gains and reclaims 106.00 and beyond.
- Further upside could extend to the 107.00 region in the near term.
DXY keeps the recovery mode well in place beyond the 106.00 mark at the beginning of the week.
The continuation of the upside momentum could extend to the August high near the 107.00 yardstick (August 5). Further north, the index could attempt to challenge the weekly high at 107.42 (July 27).
Looking at the broader scenario, the bullish view in the dollar remains in place while above the 200-day SMA at 100.10.
DXY daily chart
- Gold fell sharply at the beginning of the week.
- Broad-based dollar strength weighs heavily on XAU/USD on Monday.
- Markets remain risk-averse amid China slowdown, escalating geopolitical tensions.
Gold started the new week under heavy bearish pressure and dropped to a fresh weekly low of $1,773. As of writing, XAU/USD was trading at $1,775, where it was down 1.5% on a daily basis.
Dollar recovery picks up steam
The disappointing macroeconomic data releases from China reminded investors that a slowdown in the world's second-biggest economy could significantly weigh on the demand outlook for the yellow metal.
Additionally, escalating geopolitical tensions with US lawmakers visiting Taiwan and China continuing its military exercises around the island forced investors to seek refuge at the start of the week. The dollar gathered strength amid risk aversion and the US Dollar Index (DXY) managed to build on Friday's recovery gains. As of writing, the DXY was up 0.6% on the day at 106.29.
Looking ahead, the Federal Reserve Bank of New York's Empire State Manufacturing Survey will be featured in the US economic docket. The NAHB Housing Market Index for August will also be looked upon for fresh impetus.
As of writing, US stock index futures were down between 0.3% and 0.5%. Unless these data allow risk flows to return to markets, gold could find it difficult to stage a rebound in the second half of the day.
Technical levels to watch for
FX Strategist Quek Ser Leang at UOB Group’s Global Economics & Markets Research suggests USD/IDR could weaken to 14,620 in the near term.
Key Quotes
“The sharp drop in USD/IDR to 14,655 last week came as surprise (we were expecting sideway-trading).”
“While the rapid decline appears to be overdone, the weakness in USD/IDR could extend to 14,620 first before stabilization is likely. Resistance is at 14,760 followed by 14,810.”
Paul Donovan, Chief Economist of UBS Global Wealth Management, shares his views on the latest market developments.
China facing weaker domestic demand
"Last week’s US inflation data has left financial markets uncertain about the US Federal Reserve’s next policy move. This uncertainty (and associated risk premia) can be linked to the Fed’s June policy errors. The elevation of the status of consumer price inflation increases uncertainty given the flaws and volatility of that data. The trashing of forward guidance means markets can pursue their own whims on policy without effective Fed restraint."
"China has been moving in a very different direction, with a policy interest rate cut overnight. China is facing weaker domestic demand—retail sales in July were below the level of last year. Consumers in China are saving rather than spending."
"A weaker domestic economy is a problem for China because external demand is slowing as international consumers start to moderate spending and switch to services. China exports televisions which no one wants any more (and which are falling in price). China cannot export a two-week holiday in Majorca, which is all consumers seem to care about nowadays. The data calendar is relatively quiet. German July wholesale prices fell compared to June. The US NAHB housing indicator is due—housing is already clearly responding to the effects of policy tightening."
Economists at Standard Chartered Global Research note that China's growth slowed across the board in July, undershooting market expectations by a wide margin.
We now expect another 10bps cut to MLF
"Industrial production grew only 3.8% y/y in July, compared with expectations of 4.3% y/y. High frequency data indicates industrial activity is likely to remain weak in August due to deteriorating consumer sentiment and new COVID outbreaks. The drag of COVID prevention measures on services and retail sectors intensified, with growth slowing to 0.6% y/y and 2.7% y/y, respectively, in July, from 1.3% y/y and 3.1% in June. Fixed asset investment growth slowed to 3.6% from 5.8% y/y in June, led by moderating manufacturing investment growth and larger declines in real estate investment. Infrastructure investment growth picked up to 9.1% in July from 8.2% y/y in June, thanks to strong government support."
"In light of weaker-than-expected growth in July, we downgrade our forecasts for China’s Q3, Q4 and 2022 annual GDP growth to 3.2% y/y, 4.8% y/y and 3.3%, respectively, from 5.3%, 5.9% and 4.1% previously. We expect the path to China’s economic recovery to be a slog as local governments are likely be cautious about relaxing business restrictions ahead of the 20th Party Congress due to fears of COVID resurgence."
"Given the surprise interest rate cut by the People’s Bank of China (PBoC) today, we now expect another 10bps cut to the medium-term lending facility (MLF) rate before end-October, to support the economic recovery amid continued headwinds from a weakening housing market, deteriorating consumer sentiment and new COVID outbreaks "
- EUR/JPY remains on the defensive and breaches 136.00.
- Further decline could see the 200-day SMA retested.
EUR/JPY adds to to Friday’s pullback and breaks below the 136.00 yardstick on Monday.
In case bears push harder, then the cross could attempt another visit to the key 200-day SMA at 133.92 prior to the August low at 133.39 (August 2).
While above the 200-day SMA, the prospects for the pair should remain constructive.
EUR/JPY daily chart
Economists at BBH note that the dollar stays bid at the start of the week with China triggering risk-off impulses.
DXY is up for the second straight day
"DXY is up for the second straight day and is trading near 106.30 currently. Last week’s euro rally ran out of steam near $1.0360, which is the 62% retracement objective of the June-July drop. After failing to break that level twice, the euro is currently trading back below $1.02."
"Sterling is currently trading near $1.2060 and the break below $1.2110 sets up a test of the August 5 low near $1.20."
"USD/JPY is trading flat near 133.40 despite the risk-off backdrop. A break above 134.10 is needed to set up a test of the August 8 high near 135.60."
"The commodity currencies and EM FX are underperforming due to the poor data out of China. We maintain our strong dollar call as the dollar smile seems intact. Once this risk-off period ends, the dollar should still benefit from the relatively strong US economic outlook. However, we acknowledge that a period of consolidation is possible likely to be seen until markets readjust Fed tightening expectations higher."
Further upside is likely to prompt USD/MYR to revisit the 4.4615 level in the short-term, according to FX Strategist Quek Ser Leang at UOB Group’s Global Economics & Markets Research.
Key Quotes
“Our view for USD/MYR to edge higher last week was incorrect as it dropped sharply to 4.4310 before rebounding. USD/MYR traded on a firm note during early Asian hours today and the improved shorter-term upward momentum could lead to a retest of last week’s high at 4.4615.”
“At this stage, a sustained advance above this level appears unlikely. On the downside, support is at 4.4400 ahead of the 4.4310 low. The low is unlikely to come under threat this week.”
FX Strategist Quek Ser Leang at UOB Group’s Global Economics & Markets Research suggests USD/THB could extend the upside to the 35.80 region in the near term.
Key Quotes
“We expected USD/THB to weaken last week but we were of the view that ‘a sustained decline below 35.50 is unlikely’. USD/THB subsequently weakened more than expected as it plummeted to a low of 35.06 last Thursday (11 Aug) before rebounding.”
“USD/THB extended its rebound during early Asian hours today and appears poised to move clearly above the declining trend-line resistance. The price actions suggest 35.06 is likely a short-term bottom and the rebound could extend to 35.80. For this week, the next resistance at 36.00 is unlikely to come under threat. On the downside, support is at 35.20. The 35.06 low is not expected to come into the picture.”
Following renewed concerns over China’s economic recovery, the country’s Preesident Xi Jinping said on Monday that they will “use new development ideas in economic growth,” Xinhua News Agency reports.
Xi said that his Caibinet will “enhance reform in China and opening up.”
Meanwhile, China Military said that they “carried out drills around Taiwan on Monday,” adding that drills are a serious deterrent to the continued 'political tricks' played by the US and Taiwan
Market reaction
AUD/USD was last seen trading at 0.7046, down 1.03% on the day.
Related reads
- AUD/USD Price Analysis: Gets smashed towards 0.7050 after rejection at 200 DMA
- Weekend News: China, Taiwan gain major attention
- EUR/USD extends the decline to the vicinity of 1.0200.
- The greenback looks supported by the risk-off sentiment.
- US NAHB Index, TIC Flows, the NY Empire State Index all due later.
The selling bias still dominates the mood around the European currency and drags EUR/USD to fresh 3-day lows in the 1.0200 area at the beginning of the week.
EUR/USD weaker on USD-buying
EUR/USD loses ground for the second straight session on Monday, as the greenback continues to reclaim ground lost in a context favourable to the risk-off mood and amidst the loss of momentum in German yields.
Indeed, the pair started the week on the back foot in response to poor results from the Chinese docket earlier in the session. Also adding to the soft performance of the risk complex, the PBoC reduced the 7-day reverse repo rate to 2.00%, which is also seen impacting on the appetite for the riskier assets.
Nothing scheduled data wise in the Euroland, whereas the NAHB Index, the NY Empire State Index and TIC Flows are all due later in the NA session.
What to look for around EUR
EUR/USD’s upside momentum met a decent hurdle around 1.0360/70, an area coincident with the 55-day SMA and the 6-month resistance line so far.
Price action around the European currency, in the meantime, is expected to closely follow dollar dynamics, geopolitical concerns, fragmentation worries and the Fed-ECB divergence.
On the negatives for the single currency emerge the so far increasing speculation of a potential recession in the region, which looks propped up by dwindling sentiment gauges and the incipient slowdown in some fundamentals.
Key events in the euro area this week: EMU, Germany ZEW Economic Sentiment, EMU Balance of Trade (Tuesday), EMU GDP Growth Rate (Wednesday) – EMU Final Inflation Rate (Thursday).
Eminent issues on the back boiler: Continuation of the ECB hiking cycle. Italian elections in late September. Fragmentation risks amidst the ECB’s normalization of its monetary conditions. Impact of the war in Ukraine on the region’s growth prospects and inflation.
EUR/USD levels to watch
So far, spot is losing 0.1745 at 1.0210 and a break below 1.0096 (weekly low July 26) would target 1.0000 (psychological level) en route to 0.9952 (2022 low July 14). On the other hand, the next up barrier comes at 1.0368 (monthly high August 10) seconded by 1.0514 (100-day SMA) and finally 1.0615 (weekly high June 27).
- USD/CAD receives a double booster shot from a weaker USD and WTI sell-off.
- China wreaks havoc in markets yet again, triggers a range breakout in the pair.
- Bulls eye 50 DMA barrier after surpassing the 100 and 21 DMAs.
Having based out at the critical 200-Daily Moving Average (DMA) at 1.2748 last week, USD/CAD found buyers once again near the latter, staging a solid rebound towards the 1.2900 round number.
In doing so, the major broke the consolidative mode to the upside and stormed the mildly bullish 100 DMA at 1.2802, now briefly recapturing the bearish 21 DMA at 1.2854. The latest leg higher in the USD/CAD pair is fuelled by a combination of a broad-based US dollar upswing and a 2% sell-off in the WTI price.
Both the safe-haven dollar and the higher-yielding US oil are influenced by the resurfacing concerns over the Chinese economic slowdown after the country’s reported a drop in consumer spending, industrial sector and fixed asset investment activity.
The black gold also bore the brunt of comments from Aramco, Saudi Arabia’s oil giant. Aramco’s CEO Amin Nasser said that they stand ready to raise crude oil output to its maximum capacity of 12 million barrels per day (BPD) if requested to do so.
All eyes now remain on Wednesday, as it will see the release of the Canadian inflation figures, US Retail Sales and the Fed minutes. In the meantime, the major will take cues from risk sentiment and dynamics of the dollar and oil price.
USD/CAD daily chart
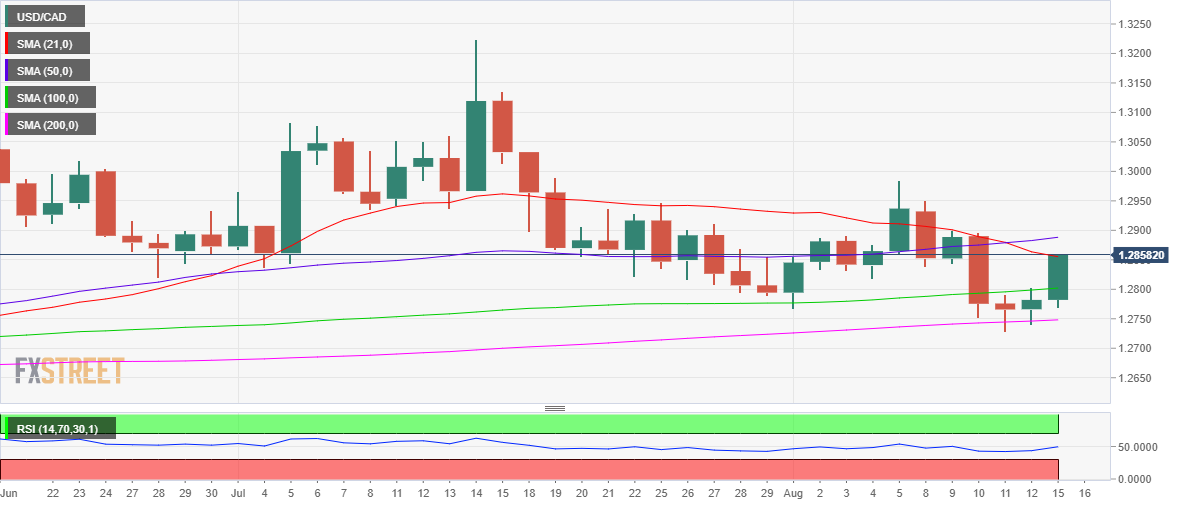
USD/CAD technical levels to consider
- Gold Price erases Friday’s rebound to test the crtiical 50 DMA at $1,782.
- China-led risk-aversion inspires the US dollar rally while yields recover.
- Focus shifts to US Retail Sales and Fed minutes for the next big move in XAU/USD.
Gold Price is tumbling towards the $1,780 level in European trading, having struggled around $1,800 earlier in the Asian session.
The risk-off market profile remains at full steam after Chinese activity came in below forecasts and fuelled growth concerns. Further, unexpected rate cuts by the PBOC amplified concerns over an economic slowdown in the world’s second-largest economy. Investors seek refuge in the US dollar amid the market panic, as US-Sino tensions also remain rife. A US congressional delegation arrived in Taiwan on Sunday, less than two weeks after the contentious visit by House Speaker Nancy Pelosi,
Also read: Gold Price Forecast: XAU/USD closes the week above 50 DMA, what’s next?
The greenback also finds fresh support from the renewed uptick in the US Treasury yields, as investors reassess Fed tightening expectations after Friday’s strong Michigan Consumer Sentiment Index. The preliminary August estimate of the UoM consumer sentiment index rose to three-month highs of 3.6 points to 55.1 from a July reading of 51.5. The inflation expectations sub-index eased, which triggered a sharp risk rally on Wall Street.
In absence of the first-tier US economic release, the Fed rate hike expectations and risk trends will have a significant impact on the bright metal. The main event risk for this week is Wednesday’s FOMC minutes, which will set a fresh direction for the bullion if it hints at the Fed’s future policy path.
Gold Price: Daily chart
Daily closing below the 50-Daily Moving Average (DMA) resistance-turned-support at $1,782 is critical to offsetting the recent recovery momentum. Bears will then look out for the $1,770 round figure, below which the 21 DMA at $1,756 will be tested.
On the upside, another strong attempt above the $1,800 mark will probe the monthly high of $1,808, above which fresh buying opportunities will emerge.
Gold Price: Additional levels to consider
The downside bias in USD/CNH seems over for the time being, say FX Strategists at UOB Group Quek Ser Leang and Peter Chia.
Key Quotes
24-hour view: “USD traded between 6.7302 and 6.7452 last Friday before closing at 6.7353 (-0.13%). USD soared during early Asian hours and upward momentum is beginning to build. Further advance would not be surprising but a break of the strong resistance at 6.7650 is unlikely. Support is at 6.7370 followed by 6.7300.”
Next 1-3 weeks: “Last Thursday (11 Aug, spot at 6.7290), we highlighted that the rapid build-up in downward momentum suggests USD could weaken further to 6.7100. Since then, USD has not been able to make much headway on the downside. Shorter-term downward has waned and the chance for USD to weaken to 6.7100 has diminished. That said, only a break of 6.7650 (no change in ‘strong resistance’ level from last Friday) would indicate that USD is unlikely to weaken further.”
- The index adds to Friday’s advance near the 106.00 mark.
- The better tone in the greenback weighs on the risk complex.
- The NAHB Index and TIC Flows are due next in the US docket.
The greenback, in terms of the US Dollar Index (DXY), extends Friday’s gains and trades at shouting distance from the 106.00 yardstick on Monday.
US Dollar Index bolstered by risk-off mood
The index advances for the second session in a row at the beginning of the week amidst the so far tepid bounce in US yields across the curve while the recent improvement in the risk-associated universe continues to take a breather.
On the latter, Chinese results from key fundamentals released earlier in the Asian trading hours came in below expectations, while the interest rate cut by the PBoC also added to the sour mood in the risk complex.
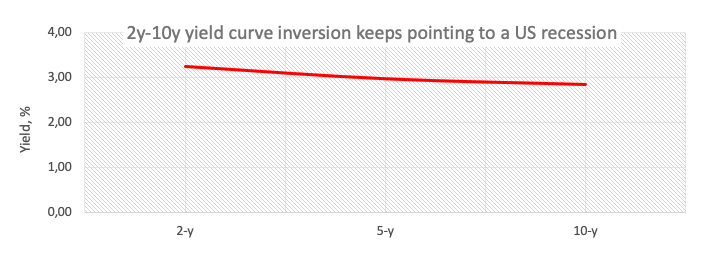
Regarding US yields, the short end of the curve extends the uptrend seen in the last couple of days, while the belly and the long term manage to leave behind part of the Friday’s pullback. The persistent inversion of the curve, in the meantime, continues to support market chatter pointing to a US recession.
In the US data space, the NAHB Index is due seconded by TIC Flows.
What to look for around USD
The recent corrective downside in the index appears to have met firm contention in the 104.60 region - where the 6-month support line also converges – and sparked a corrective bounce to the boundaries of the 106.00 zone so far.
The dollar, in the meantime, is poised to suffer some extra volatility amidst investors’ repricing of the next move by the Federal Reserve, namely a 50 bps or 75 bps hike in September.
Looking at the macro scenario, the dollar appears propped up by the Fed’s divergence vs. most of its G10 peers (especially the ECB) in combination with bouts of geopolitical effervescence and occasional re-emergence of risk aversion.
Key events in the US this week: NAHB Index, TIC Flows (Monday) – Building Permits, Housing Starts, Industrial Production (Tuesday) – MBA Mortgage Applications, Retail Sales, Business Inventories, FOMC Minutes (Wednesday) – Initial Claims, Philly Fed Manufacturing Index, CB Leading Index, Existing Home Sales (Thursday).
Eminent issues on the back boiler: Hard/soft/softish? landing of the US economy. Escalating geopolitical effervescence vs. Russia and China. Fed’s more aggressive rate path this year and 2023. US-China trade conflict.
US Dollar Index relevant levels
Now, the index is losing 0.20% at 104.98 and a breach of 104.63 (monthly low August 10) would expose 103.67 (weekly low June 27) and finally 103.58 (100-day SMA). On the upside, a breakout of 107.42 (weekly high post-FOMC July 27) would expose 109.29 (2022 high July 15) and then 109.77 (monthly high September 2002).
- AUD/USD sees a sharp sell-off on renewed China growth concerns.
- US dollar gathers upside traction as risk-off remains at full steam.
- Multiple rejection at 200 DMA spells trouble for the aussie ahead of RBA/ Fed minutes.
AUD/USD is falling hard towards 0.7050, as the selling interest around the aussie dollar remains unabated amid resurfacing concerns over China’s economic recovery.
Disappointing Chinese acitivity numbers for July raised alarm that the post-pandemic economic recovery is weakness in the workd’s second-largest economy. This has rattled market sentiment while weighing heavily on the Chinese proxy, as well as, the higher-yielding AUD.
Additionally, tensions are building up between Washington and Beijing after a US delegation arrived in Taiwan, especially after the contentious visit by House Speaker Nancy Pelosi. The US-China geopolitical risks are also rendering AUD-negative. Commenting on a US congressional delegation’s visit to Taiwan, China Global Television Network (CGTN) expert Han Peng said, Beijing may tighten its military blockade of Taiwan and economic sanctions on the island.
The US dollar emerges the sole winner amid the risk-off scenarion, extending Friday’s rebound towards 106.00 against its major peers. Attention turns towards Tuesday’s RBA minutes and FOMC minutes due to be published on Wednesday for fresh trading opportunities in the pair.
From a short-term technical perspective, the daily structure appears interesting, as the price has run into the critical horizontal 200-Daily Moving Average (DMA) at 0.7121 for the third trading day in a row.
This has spelled trouble for AUD bulls, prompting a pullback towards the 0.7050 psychological support. The next key downside target aligns at 0.7000, the round figure.
Although bulls still remain hopeful as the 21 DMA has crossed the 100 DMA for the upside, flashing a bulish signal.
The 14-day Relative Strength Index (RSI) has turned south but remains well above the midline, suggesting that the sell-off could be seen as a good buying opportunity.
If bulls manage to defend 0.7050, then a rebound towards 0.7100 will be in the offing, The 200 DMA barrier will be back on buyers’ radars on a renewed upside.
AUD/USD: Daily chart
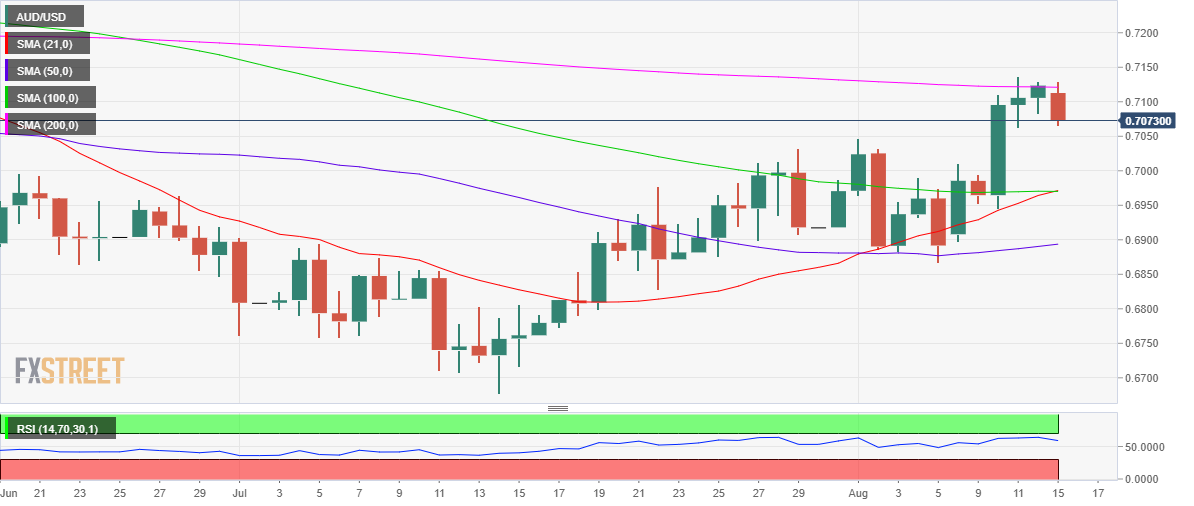
AUD/USD: Additional levels to consider
- GBP/USD holds lower ground near one-week low, down for the third consecutive day.
- Convergence of 21-DMA, monthly support line challenges bears.
- Downward sloping resistance line from mid-June restricts immediate upside.
GBP/USD bears keep reins for the third day in a row around the intraday bottom, down 0.22% intraday heading into Monday’s London open.
While a downward sloping resistance mile from mid-June triggered the GBP/USD reversal, a confluence of the 21-DMA and a one-month-old upward slopping support line, close to 1.2100, challenge the bears.
Given the recently easing bullish bias of the MACD, as well as descending RSI (14), GBP/USD is likely to extend the latest weakness beneath the 1.2100 key support level.
Following that, the 23.6% Fibonacci retracement level of the pair’s downside between late May to mid-July, around 1.1975, could offer an intermediate halt during the pair’s slump towards the yearly low near 1.1760.
Meanwhile, recovery moves may initially attack the 50% Fibonacci retracement level of 1.2215 ahead of challenging the stated resistance line from mid-June, close to 1.2260 at the latest.
In a case where the GBP/USD buyers manage to cross the 1.2260 hurdle, the monthly peak near 1.2295 and the mid-June swing high near 1.2410 could test the bulls before giving them control.
GBP/USD: Daily chart
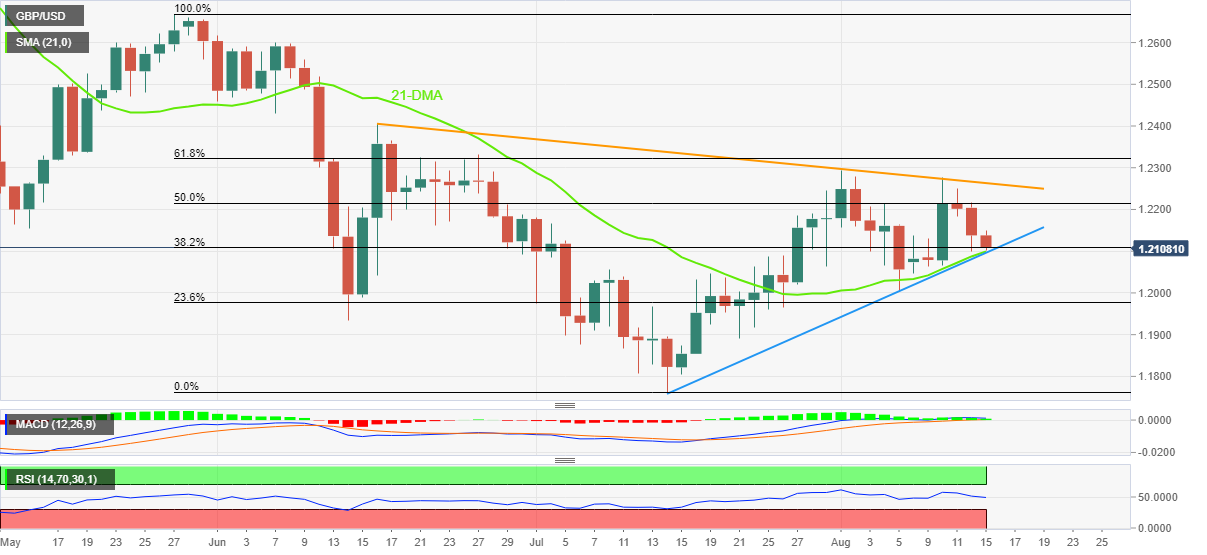
Trend: Further weakness expected
- Steel price refreshes monthly top even as China fails to please bulls.
- PBOC rate cut contrasts with softer data to test the metal buyers, lack of loan demand renew recession fears.
- Sluggish US dollar adds filters to steel trading, Shanghai eased covid-led restrictions to favor bulls.
Metal basket remained surprisingly firmer, despite risk-negative headlines from China, as traders seem to brace for Wednesday’s Federal Open Market Committee (FOMC) meeting minutes.
Steel price also follows the trend and refreshes monthly high, as far as steel rebar price on the Shanghai Futures Exchange (SFE), is concerned. That said, the steel rebar price is around 4,150 yuan per tonne, up nearly 1.0% of late.
The latest run-up in steel price could be linked to the People’s Bank of China’s (PBOC) rate cut. That said, the PBOC cut the one-year medium-term lending facility (MLF) rates by 10 basis points (bps).
On the same line could be the improved coronavirus conditions in China's financial hub Shanghai that led to the reopening of all-format schooling after multiple months of coronavirus-led closures.
On contrary, China’s Retail Sales eased to 2.7% YoY in July versus 5.0% expected and 3.1% prior whereas Industrial Production (IP) edged lower to 3.8% during the stated month, from 3.9% prior and 4.6% market forecasts.
It’s worth observing that the probable meeting between US President Joe Biden and his Chinese counterpart Xi Jinping, as signaled by the Wall Street Journal (WSJ), could favor the risk-on mood and the steel prices.
Other than the China-linked catalysts, receding inflation numbers and hawkish bets on the Fed’s next move also favor steel buyers. However, it all depends upon this week’s Fed Minutes, which could weigh on the metal prices if the policymakers show readiness for further rate increases.
USD/JPY could attempt to consolidate prior to a potential decline to the 131.65 level in the next weeks, comment FX Strategists at UOB Group Quek Ser Leang and Peter Chia.
Key Quotes
24-hour view: “Last Friday, we highlighted that ‘slowing downward momentum suggests USD is unlikely to weaken further’ and we expected USD ‘to trade sideways between 132.30 and 133.80’. USD subsequently trade within a narrower range than expected (132.87/133.89). The underlying tone has softened somewhat and USD is likely to edge lower. However, the support at 132.40 is unlikely to come under threat (minor support is at 132.70). Resistance is at 133.55 followed by 133.80.”
Next 1-3 weeks: “Last Thursday (11 Aug, spot at 132.85), we highlighted that USD could consolidate for a couple of days first before declining to 131.65. While downward momentum has waned somewhat, there is no change in our view for now. Overall, only a breach of 134.40 (no change in ‘strong resistance’ from last Friday) would indicate that USD is unlikely to weaken further.”
Considering advanced prints from CME Group for natural gas futures markets, open interest rose for the second session in a row on Friday, now by around 3.3K contracts. On the other hand, volume dropped sharply by around 187.4K contracts following two daily builds in a row.
Natural Gas faces decent support near $7.50
Friday’s small downtick in prices of natural gas was accompanied by rising open interest, which could allow for the continuation of the corrective downside in the very near term. A deeper drop, however, is expected to meet decent contention around the $7.50 per MMBtu.
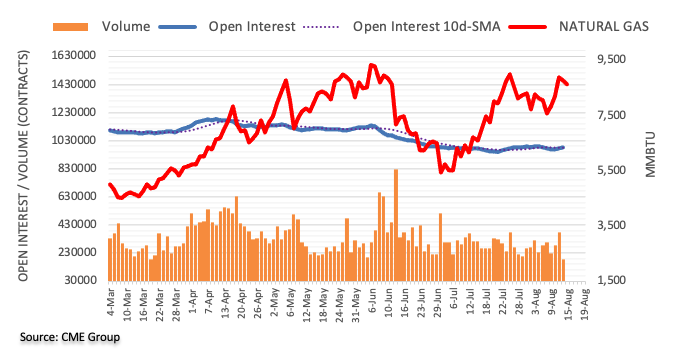
In the opinion of FX Strategists at UOB Group Quek Ser Leang and Peter Chia, AUD/USD could advance further and visit the 0.7170 region in the near term.
Key Quotes
24-hour view: “Last Friday, we highlighted that AUD ‘is unlikely to advance further’ and we expected it to ‘trade sideways within a range of 0.7060/0.7130’. Our view for sideway-trading was not wrong even though AUD traded within a narrower range than expected (0.7085/0.7128). Further sideway-trading would not be surprising, albeit likely within a higher range of 0.7095/0.7140.”
Next 1-3 weeks: “Our view from last Thursday (11 Aug, spot at 0.7080) still stands. As highlighted, AUD is likely to strengthen further and the level to monitor is at 0.7170. Overall, the current AUD strength is deemed intact as long as it does not move below 0.7035 (strong support’ level was at 0.7015 last Friday).”
Here is what you need to know on Monday, August 15:
After having closed the previous week on a firm footing, the greenback stays resilient against its major rivals early Monday with the US Dollar Index extending its recovery toward 106.00. There won't be any high-impact data releases featured in the European economic docket on Monday but Germany's Bundesbank will release its monthly report. In the second half of the day, the Federal Reserve Bank of New York's Empire State Manufacturing Survey and NAHB Housing Market Index data from the US will be looked upon for fresh impetus.
Over the weekend, the Wall Street Journal reported that Chinese officials were planning for President Xi Jinping to meet his American counterpart Joe Biden in November. On the other hand, a delegation of American lawmakers arrived in Taiwan on Sunday, not allowing the US-China tensions to de-escalate. Reflecting the cautious market mood, US stock index futures are down between 0.2% and 0.3%. In the meantime, the benchmark 10-year US Treasury bond yield continues to move sideways above 2.8%.
In the early Asian session, the data from China showed that Retail Sales rose by 2.7% on a yearly basis, missing the market expectation of 5% by a wide margin. Other data revealed that Industrial Production increased by 3.8% in the same period, compared to analysts' estimate of 4.6%.
Pressured by the disappointing data from China and the souring market mood, AUD/USD and NZD/USD were both down more than 0.5% at the time of press.
EUR/USD trades in negative territory below 1.0250 in the early European morning on Monday as the shared currency struggles to find demand in the risk-averse market environment. A recently conducted survey by Bloomberg showed that economists think that a eurozone recession is now more likely than not.
GBP/USD continues to edge lower toward 1.2100 early Monday after having lost nearly 100 pips on Friday. Reuters reported on Monday that 30 of 51 polled economists expect the Bank of England to hike its policy rate by 50 basis points to 2.25% at the September policy meeting.
USD/JPY continues to fluctuate in a relatively tight range above 133.00 on Monday. Earlier in the day, the data from Japan revealed that the real Gross Domestic Product expanded by 0.5% on a quarterly basis in the second quarter. This reading came in slightly lower than the market expectation of 0.6% but failed to trigger a significant market reaction.
Gold stays on the back foot since having failed to clear $1,800. As of writing, XAU/USD was down 0.6% on the day at $1,792.
Following the weekend's choppy action, Bitcoin gained traction and climbed above $24,500. Ethereum gained nearly 14% last week and trades within a touching distance of $2,000 early Monday.
CME Group’s flash data for crude oil futures markets noted traders added around 2.5K contracts to their open interest positions on Friday, reaching the second daily build in a row. Volume, instead, shrank markedly by around 245.3K contracts after three consecutive daily builds.
WTI remains limited by the 200-day SMA
Prices of the barrel of the WTI gave away part of the weekly advance on Friday amidst increasing open interest. Against that, the continuation of the corrective downside now appears on the cards with the immediate target at recent lows near the $87.00 mark per barrel (August 5). So far, occasional bullish attempts in crude oil remain capped by the key 200-day SMA, today at $95.50.
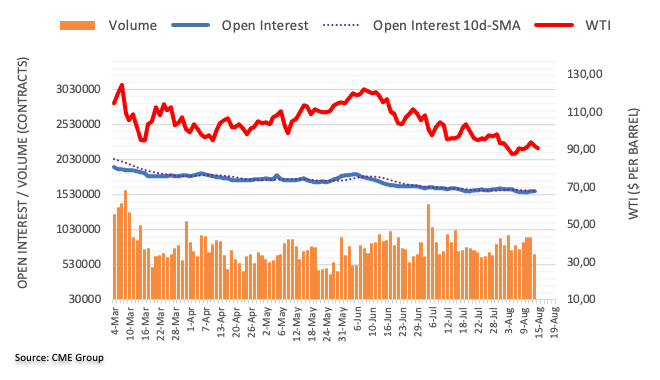
Strategists at Societe Generale believe that raising UK interest rates by 50bp right now is viewed as counterproductive because it adds downside risks to already weak economic growth.
Key quotes
"There are not many winners in FX against the dollar because everyone is in the same boat fighting the same inflation war.”
"The debate will move on when there is greater certainty that price pressures are receding around the world.”
“The pound could strengthen once the Fed takes its foot off the monetary brakes, but that moment is still some time away. In the meantime, we must hope that the UK economy does not worsen."
USD/JPY pares intraday losses around 133.30 heading into Monday’s European open, after snapping a two-day uptrend earlier in the day.
In doing so, the USD/JPY tracks yields amid mixed data, softer-than-expected Japan Gross Domestic Product (GDP) versus firmer Industrial Production for June.
Also troubling the USD/JPY pair is the lack of uniformity among the options market traders. That said, the one-month risk reversal for the yen pair, a difference between the call options and the put options, rose during the last two days but marked the weekly negatives. It’s worth noting that the daily RR rose 0.110 and 0.025 levels in the last two days but the weekly RR dropped to -0.025 on the weekly basis.
On the other hand, US 10-year Treasury yields remain pressured near 2.84% by the press time.
Also read: USD/JPY retreats towards 133.00 on softer Japan GDP, yields ahead of Fed Minutes
- WTI takes offers to refresh intraday low, extends Friday’s pullback from one-week high.
- Bearish MACD signals, pullback from 100-SMA keep sellers hopeful.
- Six-week-old resistance line, the channel’s top challenges the buyers.
WTI crude oil prices drop for the second consecutive day, down 1.0% while refreshing daily lows around $90.50 heading into Monday’s European session.
In doing so, the black gold approaches the lower line of the weekly bullish channel, while also extending Thursday’s pullback from the 100-SMA. The downside bias also takes clues from bearish MACD signals.
That said, the energy benchmark needs to break the $90.30 support to welcome bears. Also challenging the sellers is the $90.00 threshold.
It should, however, be noted that the quote’s weakness past $90.00 makes the commodity vulnerable to revisiting the six-month low of $86.40.
On the contrary, recovery moves may initially need validation from the 100-SMA, at $93.20 by the press time.
Above all, a convergence of the monthly resistance line and the upper line of the stated channel, close to $95.70, will be a crucial hurdle for the WTI bulls to cross to retake control.
Overall, the commodity prices brace for the fresh leg towards the south.
WTI: Four-hour chart
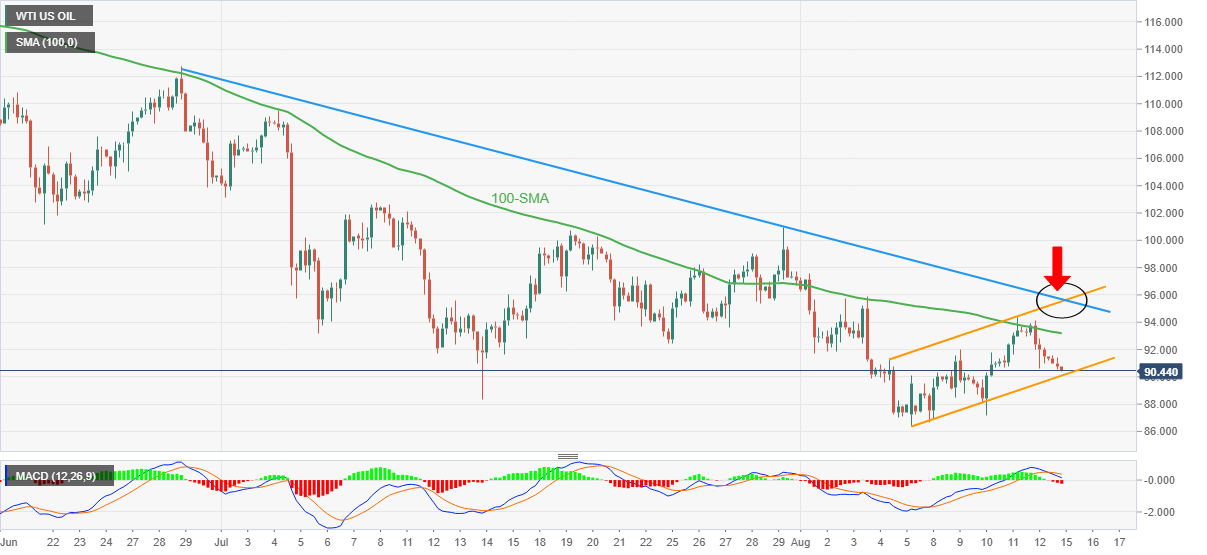
Trend: Further weakness expected
GBP/USD is now expected to navigate within the 1.2050-1.2245 range in the next weeks, suggest FX Strategists at UOB Group Quek Ser Leang and Peter Chia.
Key Quotes
24-hour view: “The rapid drop in GBP to 1.2100 last Friday came as a surprise (we were expected GBP to trade between 1.2160 and 1.2240). Despite the decline, downward momentum is not strong. That said, there is scope for GBP to dip to 1.2090 first before a more sustained rebound is likely. The major support at 1.2050 is not expected to come under threat. On the upside, a breach of 1.2180 (minor resistance is at 1.2160) would indicate that the current downward pressure has eased.”
Next 1-3 weeks: “After GBP soared to a high of 1.2277, we highlighted last Thursday (11 Aug, spot at 1.2215) that while the risk for GBP has shifted to the upside, it has to crack major resistance at 1.2300 before further sustained advance is likely. Last Friday, GBP dropped sharply and cracked our ‘strong support’ of 1.2125 (low of 1.2100). Upward momentum has dissipated and GBP is likely to trade sideways from here, expected to be within a range of 1.2050/1.2245.”
The latest survey of economists by Bloomberg showed that the Eurozone could enter a technical recession amid the deepening energy crisis and record-high inflation.
Key findings
"The probability of output shrinking for two straight quarters has risen to 60% from 45% in a previous survey, and up from 20% before Russia invaded Ukraine."
"Inflation is now expected to average almost 8% in 2022 -- about four times the European Central Bank’s goal -- and 4% next year. Respondents still see it slowing to the 2% target in 2024, however."
"They see the ECB raising interest rates by a half-point in September -- as it did in its initial move in July."
-
EUR/USD pares intraday losses near 1.0250, Fed Minutes, EU recession in focus
Open interest in gold futures markets rose for the third session in a row on Friday, this time by round 1.2K contracts according to preliminary figures from CME Group. On the other hand, volume shrank for the second consecutive session, now by around 4.5K contracts.
Gold: Further gains expected above $1,800
Friday’s uptick in gold prices was on the back of rising open interest, which is supportive of extra upside in the very near term. The drop in volume, however, could prompt some consolidation while the uptrend so far remains capped by the $1,800 mark per ounce troy.
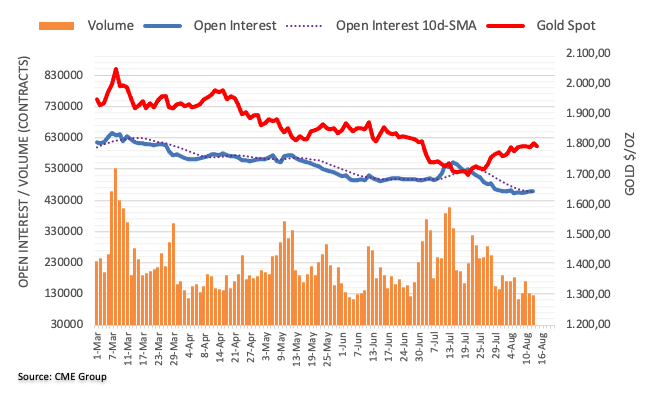
Economists at Goldman Sachs reason why they think the post-US inflation weakness in the dollar is not here to stay.
Key quotes
"Last week's softer inflation reports caused some understandable relief for risky assets and put depreciation pressure on the USD that can likely extend a bit further given the light calendar ahead and likelihood that this week's FOMC minutes will contain some discussion of the FOMC's apparent desire to slow the pace of hikes soon. But we do not expect it to be lasting relief."
“First of all, on the international side, slowing inflation has been a bit contagious, and in any case it is hard to find a major currency that we think can rally meaningfully in the near term given that other central banks face an even more difficult growth and inflation trade-off than the Fed. And on the US. specifically, most of the miss to our inflation forecasts came from bottlenecked and travel-related categories - such as used and new cars, as well as rental cars and hotels - while underlying inflation was slightly softer than last month's worrying report but essentially in line with the recent run rate and other measures of core."
FX Strategists at UOB Group Quek Ser Leang and Peter Chia noted EUR/USD’s potential move to the 1.0400 region seems to have lost momentum.
Key Quotes
24-hour view: “Our view for EUR to ‘trade sideways’ last Friday was incorrect as it dropped to 1.0236 before closing at 1.0258 (-0.57%). The decline lacks momentum and EUR is unlikely to weaken much further. For today, EUR is likely to trade within a range of 1.0235/1.0300.”
Next 1-3 weeks: “After EUR soared to a high of 1.0368, we highlighted last Thursday (11 Aug, spot at 1.0300) that further EUR strength appears likely even though overbought shorter-term conditions suggest a slower pace of advance. We indicated the next resistance is at 1.0400. EUR has not been able to make any headway on the upside and it dropped to 1.0236 on Friday. Conditions remain overbought and this coupled with waning momentum suggests the odds for EUR to advance to 1.0400 have diminished. In order to rejuvenate the flagging momentum, EUR has to move and stay above 1.0330 within these 1 to 2 days or break of 1.0230 (no change in ‘strong support’ level from last Friday) would indicate that 1.0400 is not coming into the picture this time round.”
- USD/CNH takes the bids to poke one-week high, prints the biggest daily gains in a month.
- PBOC surprised markets with 0.10% one-year MLF rate cut, China data dump failed to push back recession fears.
- Shanghai reopens all schooling formats from September 01 after multiple days of covid-led off.
- Fed Minutes, news concerning the Sino-American ties are also important for clear directions.
USD/CNH takes the bids to refresh the daily high, also renewing the weekly peak, near 6.7710 heading into Monday’s European session. The offshore Chinese yuan (CNH) pair’s latest gains could be linked to the downbeat China data and a rate cut from the People’s Bank of China (PBOC). Headlines surrounding the US-China tussles and a lack of loan demand also appear to propel the pair prices of late.
China’s Retail Sales eased to 2.7% YoY in July versus 5.0% expected and 3.1% prior whereas Industrial Production (IP) edged lower to 3.8% during the stated month, from 3.9% prior and 4.6% market forecasts. Earlier in the day, the People’s Bank of China (PBOC) cut the one-year medium-term lending facility (MLF) rates by 10 basis points (bps) and tried to push back the bears.
It’s worth noting that the early-day data dump also revealed a lack of demand for loans, which in turn amplified the recession woes even as the PBOC tried to placate bears.
On the same line was news concerning the increased numbers of US lawmakers visiting Taiwan after House Speaker Nancy Pelosi’s visit.
On the other hand, headlines suggesting improved coronavirus conditions in China's financial hub Shanghai and the resumption of the Russian bonds’ trading on Wall Street should have favored the risk appetite, but could not. Furthermore, hopes of a probable meeting between US President Joe Biden and his Chinese counterpart Xi Jinping, as signaled by the Wall Street Journal (WSJ), could favor the risk-on mood.
Elsewhere, hawkish Fedspeak, despite the latest softness in the US inflation numbers, appears to have favored the US dollar ahead of Wednesday’s Federal Open Market Committee (FOMC) meeting minutes.
For today, Empire State Manufacturing Index for August, expected 8.5 versus 1.1 prior, may offer immediate directions to the USD/CNH pair.
Technical analysis
A successful upside break of the two-week-old resistance line, now support near 6.7490, directs USD/CNH bulls towards the monthly high of 6.7955.
FX option expiries for August 15 NY cut at 10:00 Eastern Time, via DTCC, can be found below.
- EUR/USD: EUR amounts
- 1.0210 250m
- GBP/USD: GBP amounts
- 1.2285 786m
- USD/JPY: USD amounts
- 131.50 300m
- 133.00 365m
- 134.00 685m
- AUD/USD: AUD amounts
- 0.7195 411m
- USD/CAD: USD amounts
- 1.2740 662m
- 1.2950 655m
- EUR/GBP: EUR amounts
- 0.8535 742m
- USD/CAD remains sandwiched between key daily moving averages.
- Bulls extend previous gains amid a renewed uptick in the US dollar.
- WTI tumbles amid China concerns but a test of 200 DMA remains on the cards.
USD/CAD is consolidating gains just below the 1.2800 level, as bulls take a breather after the latest leg higher. The pair continues to find solace from tumbling WTI prices and a renewed uptick in the US dollar.
The common factor influencing the dollar as well as the WTI’s price action is the latest disappointing data from China, which has weighed negatively on risk sentiment. Traders keep their focus on Wednesday’s Canadian inflation data and the Fed minutes for a fresh directional move on the major.
From a short-term technical perspective, USD/CAD has edged higher to challenge the mildly bullish 100-Daily Moving Average (DMA) at 1.2801.
A sustained break above the latter will open doors for the additional upside towards the downward-sloping 21 DMA at 1.2852.
The 14-day Relative Strength Index (RSI) is trading flat beneath the midline, supporting the case for the downside.
A retest of the 200 DMA at 1.2747 remains inevitable should the pair witness renewed selling in the sessions ahead.
Daily closing below the 200 DMA support will initiate a fresh downtrend back towards the 1.2600 level.
USD/CAD: Daily chart
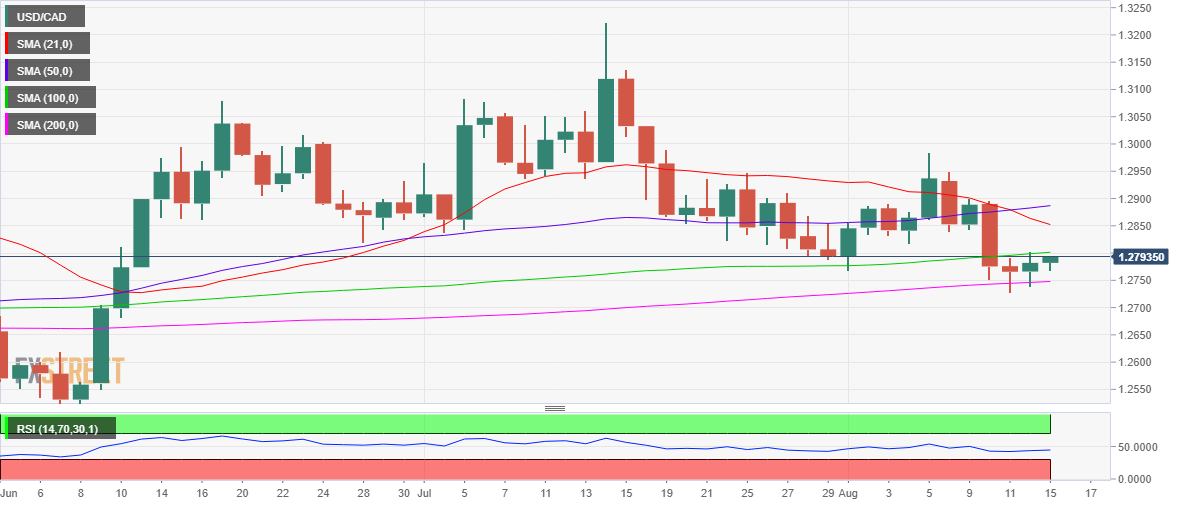
USD/CAD: Additional levels to consider
- EUR/USD picks up bids to consolidate daily losses amid sluggish session.
- Headlines surrounding Russia bonds, China underpin cautious optimism.
- Fedspeak, Sino-American tussles and the European economic fears seem to challenge.
- Eurozone GDP, FOMC Minutes will be crucial for near-term directions.
EUR/USD licks its wounds as traders brace for the long week during early Monday morning in Europe. Even so, the major currency pair remains down for the second consecutive day while keeping eyes on this week’s Federal Open Market Committee (FOMC) meeting minutes, as well as chatters surrounding the Eurozone recession.
The quote’s latest rebound could be linked to the US Dollar Index (DXY) retreat from its intraday high. The greenback’s gauge recently eased from the daily top on headlines suggesting the resumption of the Russian bonds’ trading on Wall Street. Also favoring the market’s cautious optimism were headlines suggesting improved coronavirus conditions in China's financial hub Shanghai.
However, fears surrounding the Eurozone recession, mainly led by the German energy crisis, challenge the market’s sentiment. On the same line could be the hawkish Fedspeak, despite recently softer inflation data from the US.
On Friday, Richmond Federal Reserve (Fed) Bank President Thomas Barkin said that he wants to raise interest rates further to bring inflation under control. "I'd like to see a period of sustained inflation under control, and until we do that I think we are just going to have to move rates into restrictive territory," Barkin told CNBC, per Reuters. His comments rolled out after the firmer US Michigan Consumer Sentiment Index (CSI) for August edged higher to 55.1 (flash) from 51.5 in July and the market expectation of 52.5. Further details revealed that the one-year-ahead inflation expectations fell to a six-month low of 5.0% from 5.2%, while the five-year inflation outlook edged up to 3.0% from 2.9%.
Elsewhere, Klaus Mueller, head of the Bundesnetzagentur (BNA) regulator told the Financial Times (FT) that Germany reached the 75 percent goal two weeks ahead of schedule, as gas saving measures and high prices led to reduced use. The energy regulator, however, also said the next two milestones were “much more ambitious”.
It’s worth noting that the mixed updates surrounding the US-China tussles and the Biden-Xi meeting also keep a tab on the EUR/USD prices amid the sluggish session.
Against this backdrop, the US 10-year Treasury yields remain pressured at around 2.83 after posting weekly losses by the end of Friday. Further, S&P 500 Futures print 0.25% intraday losses while Japan’s Nikkei 225 rises 2.65% on a day by the press time. It’s worth noting that Wall Street rallied on Friday.
Looking forward, today’s NY Empire State Manufacturing Index for August, expected 8.5 versus 1.1 prior, may offer immediate directions to the EUR/USD pair traders. However, Germany’s ZEW Economic Sentiment, the second reading of the Eurozone Q2 GDP and the Fed Minutes will be more important for the pair traders to observe.
Technical analysis
A convergence of the 100-SMA and 200-SMA, as well as an upward sloping trend line from mid-July, constitutes strong support for the EUR/USD pair traders to watch around 1.0210 level.
That said, recovery moves need validation from the monthly peak near 1.0370 to retake control.
- USD/INR remains sidelined between 20-DMA support and monthly resistance line.
- Impending bull cross on MACD suggests further grinding towards the north.
- Fortnight-old support line, 50-DMA restricts short-term downside.
- A successful break of 80.00 appears necessary for buyers’ conviction.
USD/INR extends the previous day’s reversal from a two-week-old hurdle while taking rounds to 79.60-65 during the early Monday morning in Europe. Even so, the 20-DMA defends the Indian rupee (INR) sellers while the looming bull cross on the MACD teases the pair buyers.
That said, the quote’s recent weakness aims for the 20-DMA support of 79.50, a break of which could direct the USD/INR sellers towards the fortnight-old support line near 79.20.
Following that, the 50-DMA and an upward sloping support line from April, respectively near 79.00 and 78.45, will be crucial for the pair bears to watch. It’s worth observing that the monthly low of 78.40 acts as an extra filter to the south.
Alternatively, the USD/INR rebound needs to cross the aforementioned resistance line, at 79.90 by the press time, to convince buyers.
However, successful trading beyond the 80.00 psychological magnet appears necessary for the pair bulls to keep reins. In that case, the latest peak of 80.20 will be on the bull’s radar as an immediate hurdle.
Overall, USD/INR grinds higher with multiple filters that challenge the bears.
USD/INR: Daily chart
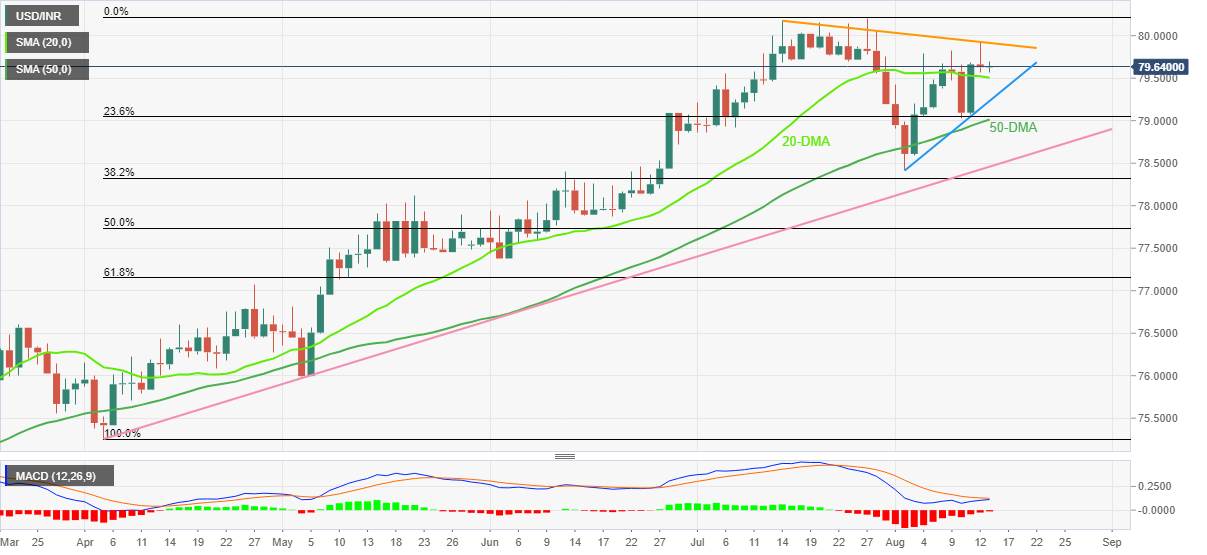
Trend: Further upside expected
- Gold price extends pullback from 61.8% Fibonacci retracement level as US dollar pares recent losses ahead of FOMC Minutes.
- Risk-off mood, downbeat China data also weigh on the XAU/USD prices.
- Second-tier US data, headlines surrounding the Fed, Inflation and recession will be important as well.
Gold price (XAU/USD) refreshes intraday low near $1,795 as a firmer US dollar weighed on the key asset during Monday’s Asian session. That said, the sour sentiment and catalysts from China join the market’s cautious mood ahead of this week’s Federal Open Market Committee (FOMC) meeting minutes to propel the greenback of late.
US Dollar Index (DXY) licks it wound around 105.75 as a risk-aversion wave underpins the greenback’s haven demand. Also keeping the greenback firmer is the Fed policymakers’ resistance to praising the recently softer inflation, as well as economic fears emanating from China and Europe.
Recently, China’s Retail Sales eased to 2.7% YoY in July versus 5.0% expected and 3.1% prior whereas Industrial Production (IP) edged lower to 3.8% during the stated month, from 3.9% prior and 4.6% market forecasts. During the previous week, China’s inflation numbers also eased for July, which in turn pushed the People’s Bank of China (PBOC) to cut the one-year medium-term lending facility (MLF) rates by 10 basis points (bps). China’s status as the world’s biggest user of commodities makes XAU/USD prices prone to news surrounding the dragon nation.
The economic fears are also present in Europe amid a steep decline in Russia’s energy exports to the old continent after the bloc sanctioned Moscow for its invasion of Ukraine.
During the weekend, news that many US lawmakers are visiting Taiwan after House Speaker Nancy Pelosi’s visit seemed to have raised fears of the US-China tension, which in turn weighed on the gold prices.
On the contrary, the news suggests that a probable meeting between US President Joe Biden and his Chinese counterpart Xi Jinping, as signaled by the Wall Street Journal (WSJ), could favor the risk-on mood. Also positive for the mood were headlines suggesting improved coronavirus conditions in China's financial hub Shanghai.
Elsewhere, softer prints of the US Consumer Price Index (CPI) and the Producers Price Index (PPI) managed to ease the market’s inflation fears. Even so, Richmond Federal Reserve (Fed) Bank President Thomas Barkin said on Friday that he wants to raise interest rates further to bring inflation under control. "I'd like to see a period of sustained inflation under control, and until we do that I think we are just going to have to move rates into restrictive territory," Barkin told CNBC, per Reuters.
While portraying the mood, the US 10-year Treasury yields remain pressured at around 2.83 after posting weekly losses by the end of Friday. Further, S&P 500 Futures print 0.25% intraday losses while Japan’s Nikkei 225 rises 2.65% on a day by the press time. It’s worth noting that Wall Street rallied on Friday.
Having tracked the risk catalysts earlier, gold traders may wait for Wednesday’s Fed Minutes for clearer directions. However, today’s NY Empire State Manufacturing Index for August, expected 8.5 versus 1.1 prior, may offer immediate directions.
Technical analysis
Gold price prints the biggest daily loss in over a week as it reverses from the 61.8% Fibonacci retracement of the June-July downturn. That said, the RSI (14) retreat also favors the XAU/USD’s latest weakness.
The pullback moves, however, need validation from the 50-SMA level surrounding $1,784 before directing gold sellers towards the previous resistance line from June 16, close to $1,760 by the press time.
It should be noted, however, that a convergence of the 200-SMA and 38.2% Fibonacci retracement level, near $1,754, appears a tough nut to crack for the metal sellers afterward.
Alternatively, an upside clearance of the 61.8% golden ratio, close to $1,805, might not be above to propel the XAU/USD prices as a fortnight-old resistance line near $1,811 acts as an extra filter to the north.
Gold: Four-hour chart
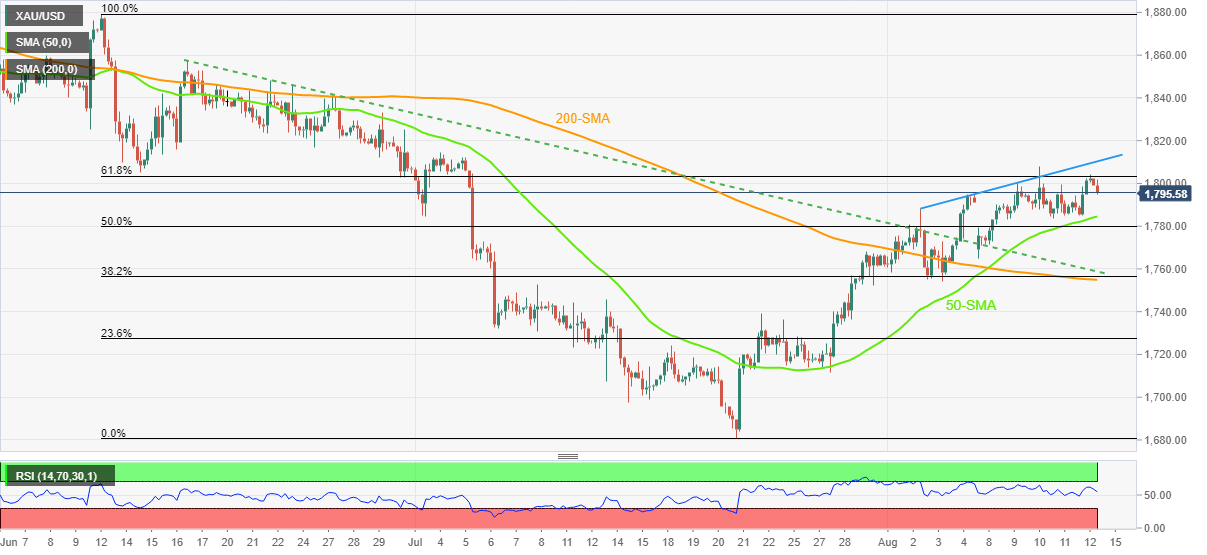
Trend: Limited downside expected
- USD/JPY finds fresh bids just under 133.00 but rebound appears limited.
- The US dollar sees renewed buying amid China's data-led risk-aversion.
- Bear cross on the 1D chart keeps sellers alive while 100 DMA offers a floor.
USD/JPY has paused its two-day recovery momentum, trading on the backfoot in Asian trading this Monday.
The pair remains volatile within a familiar trading range, having dropped to daily lows near 132.90 before rebounding to near 133.30, where it now wavers.
The latest upswing in the major could be attributed to a fresh leg up in the US dollar across its major peers after disappointing Chinese Retail Sales, Industrial Output and Fixed Asset Investment data missed expectations and spooked investors’ sentiment.
The US Treasury yields also trade sluggishly, offering little impetus to bulls, as investors also remain wary about the latest unexpected rate cuts by the PBOC.
Earlier on, the Japanese yen picked up bids and reached daily highs against the greenback, despite the below-forecast Japanese Q2 GDP data, which grew at a quarterly pace of 0.5% vs. 0.6% expected. Japan’s PM Fumio Kishida instructed to keep the imported wheat prices unchanged, shrugging off rising inflationary pressures.
From a short-term technical perspective, bulls need acceptance above Friday’s high of 133.89 to extend the ongoing recovery.
The next crucial resistance is aligned at 135.00, which is the confluence of the round figure mark and the bearish 21-Daily Moving Average (DMA).
Although the recent upside in the price appears to faze out, bears remain hopeful following the confirmation of a bear cross last Friday. The 21 DMA cut the 50 DMA for the downside, flashing a bearish signal.
The 14-day Relative Strength Index (RSI) is inching lower below the midline, adding credence to a potential move lower.
USD/JPY: Daily chart
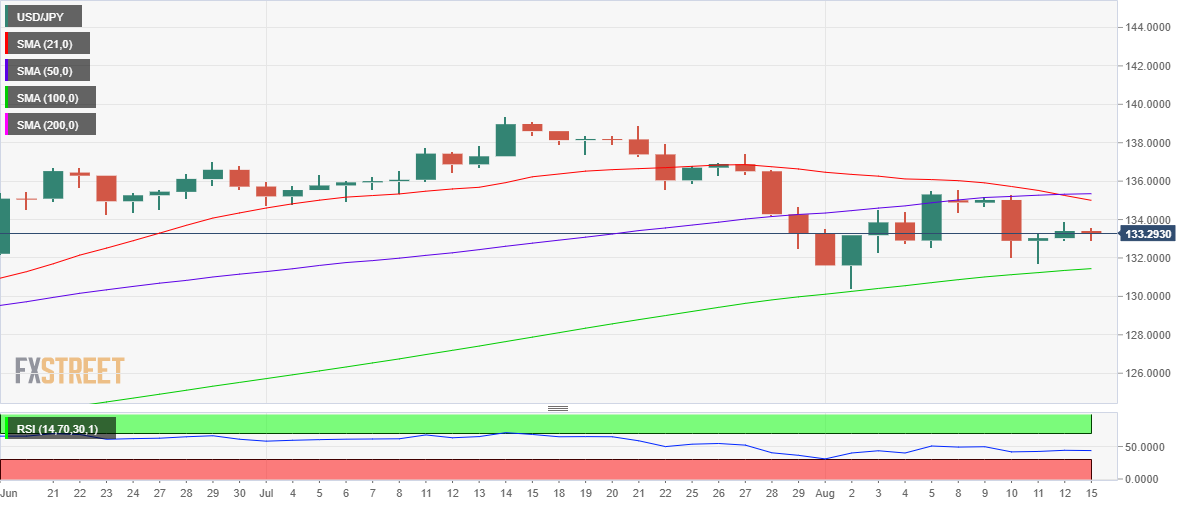
The spot could look to retest the upward-sloping 100 DMA at 131.45 on a failure below the daily low.
Further south, the August 2 low of 130.39 will be on sellers’ radars.
USD/JPY: Additional levels to consider
| Raw materials | Closed | Change, % |
|---|---|---|
| Silver | 20.829 | 2.58 |
| Gold | 1801.7 | 0.67 |
| Palladium | 2210.06 | -2.92 |
- NZD/USD takes offers to renew intraday low, snaps three-day downtrend while reversing from a two-month high.
- China’s growth of Retail Sales, Industrial Production eased in July.
- Previous resistance line from early July restricts immediate downside, 200-DMA appears a tough nut to crack for bulls.
- RSI hints at a pullback, MACD suggests limited downside room.
NZD/USD bulls retreat after China flashed downbeat statistics for July during Monday’s Asian session. That said, the Kiwi pair renews its intraday low near 0.6430 by the press time.
China’s Retail Sales eased to 2.7% YoY in July versus 5.0% expected and 3.1% prior whereas Industrial Production (IP) edged lower to 3.8% during the stated month, from 3.9% prior and 4.6% market forecasts.
With the downbeat data from the world’s biggest commodity user, NZD/USD portrayed the much-awaited pullback from the downward sloping resistance line from April 26, around 0.6465 at the latest. The Kiwi pair’s latest losses also justify the RSI retreat from the nearly overbought territory.
However, an upward sloping previous resistance line from July 08, close to 0.6420 by the press time, restricts the immediate downside of the NZD/USD pair.
In a case where the quote drops below 0.6420, the 0.6400 round figure and 100-DMA support near 0.6325 will gain the bear’s attention.
On the contrary, recovery moves need to cross the aforementioned resistance line near 0.6465 to recall the NZD/USD buyers.
Following that, 50% Fibonacci retracement of the April-July downside and the 200-DMA, respectively near 0.6530 and 0.6545, will be in focus.
NZD/USD: Daily chart
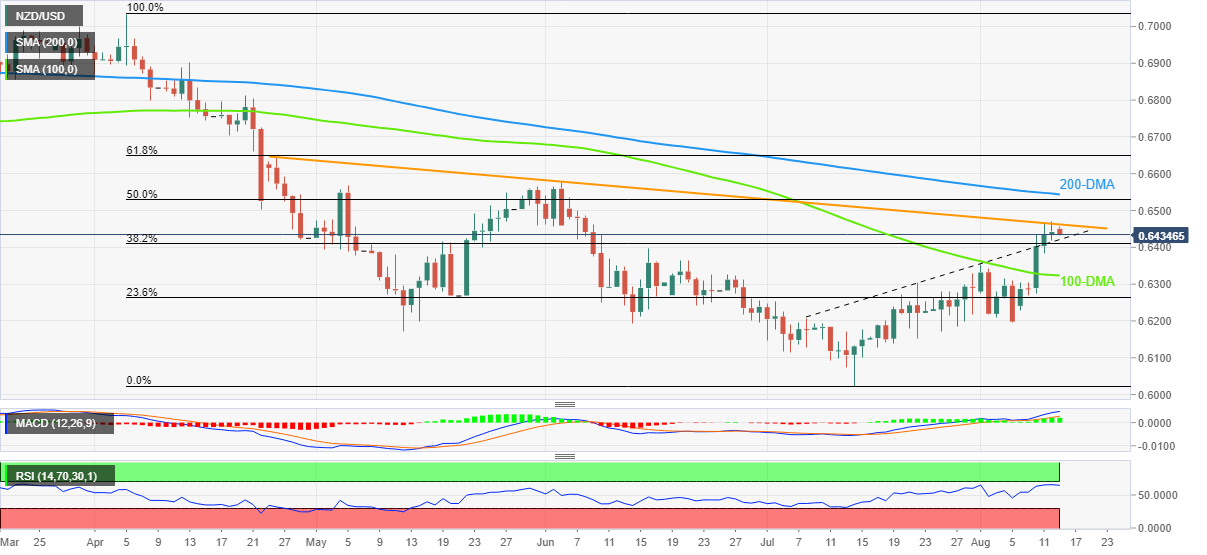
Trend: Limited weakness expected
Following the release of the July activity numbers, China’s National Bureau of Statistics (NBS) released a statement, via Reuters, expressing their view on the economy.
Key headlines
Momentum of China's economic recovery slowed in July.
more to come ....
Related reads
- AUD/USD retreats towards 0.7100 on downbeat China data
- China’s July Retail Sales and Industrial Output disappoint
- AUD/USD struggles to defend four-day uptrend at the highest levels since early June.
- China’s Retail Sales eased to 2.7%, Industrial Production growth also slowed down to 3.8% YoY in July.
- Sour sentiment challenges bulls around multi-day high, US dollar weakness probes bears.
- Second-tier US data, risk catalysts to trace for intraday directions.
AUD/USD retreats towards 0.7100, down 0.08% intraday around 0.7120 by the press time, as China’s softer-than-expected data dump joins the cautious mood in the market during Monday’s Asian session. The Aussie pair’s struggle could also be linked to the anxiety ahead of the Minutes of the latest monetary policy meeting from the Reserve Bank of Australia (RBA) and the Federal Reserve (Fed).
China’s Retail Sales eased to 2.7% versus 5.0% expected and 3.1% prior whereas Industrial Production (IP) edged lower to 3.8% from 3.9% prior and 4.6% market forecasts.
Earlier in the day, the People’s Bank of China (PBOC) cut the one-year medium-term lending facility (MLF) rates by 10 basis points (bps) and tried to push back the bears. Also positive for the market sentiment were better-than-previous Japan GDP growth numbers. However, the increased count of the US lawmakers who are visiting Taiwan challenges the sentiment amid the Sino-American ties over US House Speaker Nancy Pelosi’s visit to Taipei.
Elsewhere, softer prints of the US Consumer Price Index (CPI) and the Producers Price Index (PPI) managed to ease the market’s inflation fears. Even so, Richmond Federal Reserve (Fed) Bank President Thomas Barkin said on Friday that he wants to raise interest rates further to bring inflation under control. "I'd like to see a period of sustained inflation under control, and until we do that I think we are just going to have to move rates into restrictive territory," Barkin told CNBC, per Reuters. San Francisco Fed President Mary Day, Minneapolis Fed President Neel Kashkari and Chicago Fed President Charles Evans were also among the Fed hawks who kept favoring higher rates.
To sum up, having witnessed the initial market reaction to China’s monthly data dump, AUD/USD traders should pay attention to NY Empire State Manufacturing Index for August, expected 8.5 versus 1.1 prior. Although softer prints of the US PMI data could probe the AUD/USD bulls, the downside remains elusive ahead of Tuesday’s RBA Minutes, Australia’s Wage Price Index for the second quarter, up for publishing on Wednesday, as well as Thursday’s Aussie jobs report. Additionally, headlines surrounding China and US ties will join the RBA Minutes to entertain Aussie pair traders.
Technical analysis
The 200-DMA restricts immediate AUD/USD upside around 0.7120, which in turn joins sluggish RSI at the higher end to suggest that the AUD/USD bulls are running out of steam. The pullback moves, however, remain elusive until the quote stays beyond the previous resistance line from late April, at 0.6990 by the press time.
China’s July Retail Sales YoY, unexpectedly fall to 2.7% vs. 5.0% expected and 3.1% previous while Industrial Production YoY came in at 3.8% and 4.6% estimated and 3.9% prior.
Meanwhile, the Fixed Asset Investment YoY drops to 5.7% in July vs 6.2% expected and 6.1% last.
Earlier on, the House Price Index dropped 0.9% in July when compared to a 0.5% contraction seen in June.
Additional details
China July survey-based jobless rate for 16-24 years old at 19.9%, the highest on record.
China Jan-July property investment -6.4% YoY.
China Jan-July new construction starts -36.1% YoY.
Market reaction
The Australian dollar meets fresh supply on the release of the downbeat Chinese data. The AUD/USD pair is retreating to near 0.7110, down 0.13% on a daily basis.
- Market sentiment remains sluggish as traders await Fed Minutes to overcome the anxiety after last week’s softer US inflation.
- Mixed headlines surrounding China, Taiwan also weigh on the risk appetite.
- China data dump, second-tier US statistics to entertain intraday traders.
Global markets fade the previous week’s optimism as traders await fresh clues from the US Federal Reserve amid mixed feelings during Monday’s Asian session. Also challenging the sentiment are the mixed headlines concerning China and the Fed policymakers’ resistance to welcoming softer US inflation data.
While portraying the mood, the US 10-year Treasury yields remain pressured at around 2.84% after posting weekly losses by the end of Friday. Further, S&P 500 Futures print 0.25% intraday losses while Japan’s Nikkei 225 rises 0.65% on a day by the press time. It’s worth noting that Wall Street rallied on Friday.
Weekend news suggests that a probable meeting between US President Joe Biden and his Chinese counterpart Xi Jinping, as signaled by the Wall Street Journal (WSJ), could favor the risk-on mood. Also positive for the mood were headlines suggesting improved coronavirus conditions in China's financial hub Shanghai. However, the increased count of the US lawmakers who is visiting Taiwan challenges the sentiment.
It’s worth noting that the People’s Bank of China (PBOC) recently cut the one-year medium-term lending facility (MLF) rates by 10 basis points (bps) and tried to push back the bears.
During the last week, softer prints of the US Consumer Price Index (CPI) and the Producers Price Index (PPI) managed to ease the market’s inflation fears. Even so, Richmond Federal Reserve (Fed) Bank President Thomas Barkin said on Friday that he wants to raise interest rates further to bring inflation under control. "I'd like to see a period of sustained inflation under control, and until we do that I think we are just going to have to move rates into restrictive territory," Barkin told CNBC, per Reuters.
Previously, San Francisco Fed President Mary Day backed opportunities of witnessing another 75 basis points (bps) of a rate hike in September, while also suggesting an upfront 0.50% rate hike to be sure. Also, Minneapolis Fed President Neel Kashkari and Chicago Fed President Charles Evans sounded grim. That said, Fed’s Kashkari mentioned that he hasn't "seen anything that changes" the need to raise the Fed's policy rate to 3.9% by year-end and to 4.4% by the end of 2023. Further, Fed policymaker Evans stated, “The economy is almost surely a little more fragile, but would take something adverse to trigger a recession.” Fed’s Evans also called inflation "unacceptably" high.
Given the market’s indecision over the Fed’s next moves, coupled with the long week ahead, traders may witness a lack of major moves ahead of the key data/events. Among them, today’s US Empire State Manufacturing PMI for August could gain the first attention. However, the key will be Wednesday’s Minutes of the latest Federal Open Market Committee (FOMC) meeting.
The People’s Bank of China (PBOC) sold CNY400 billion via one-year medium-term lending (MLF) facility on Monday.
The Chinese central bank cut the rate for one-year MLF operation rate to 2.75% vs. 2.85% previous. The PBOC broke the status-quo after the fifth straight meeting.
The PBOC slashed its 7-day reverse repos to 2% vs. 2.10% prior.
- AUD/JPY takes offers to renew intraday low, snaps three-day uptrend.
- Weekly support line, 50-DMA challenge short-term downside amid bullish MACD signals, firmer RSI.
- Buyers need validation from July’s high to keep reins.
AUD/JPY refreshes daily bottom around 94.70 as it extends pullback from short-term key resistance line during Monday’s Asian session. In doing so, the cross-currency pair prints the first daily loss in four.
However, an upward sloping support line from August 03 joins the bullish MACD signals and firmer RSI (14), not oversold, to keep buyers hopeful unless the quote stays beyond 94.50.
Following that, the 50-DMA support near 93.90 will be crucial for the AUD/JPY bears to watch as it holds the key to the pair’s further downside towards the monthly low near 90.50.
During the anticipated fall, the 50% Fibonacci retracement of the May-June upside, near 92.00, could act as an intermediate halt.
Alternatively, an upside clearance of the two-month-old descending resistance line, at 95.10 by the press time, could tease the buyers.
Even so, July’s high of 95.75 may challenge the upside momentum before directing the AUD/JPY prices towards the yearly top of 96.88, marked in May.
Overall, AUD/JPY is expected to witness a short-term downside but the trend remains bullish.
AUD/JPY: Daily chart
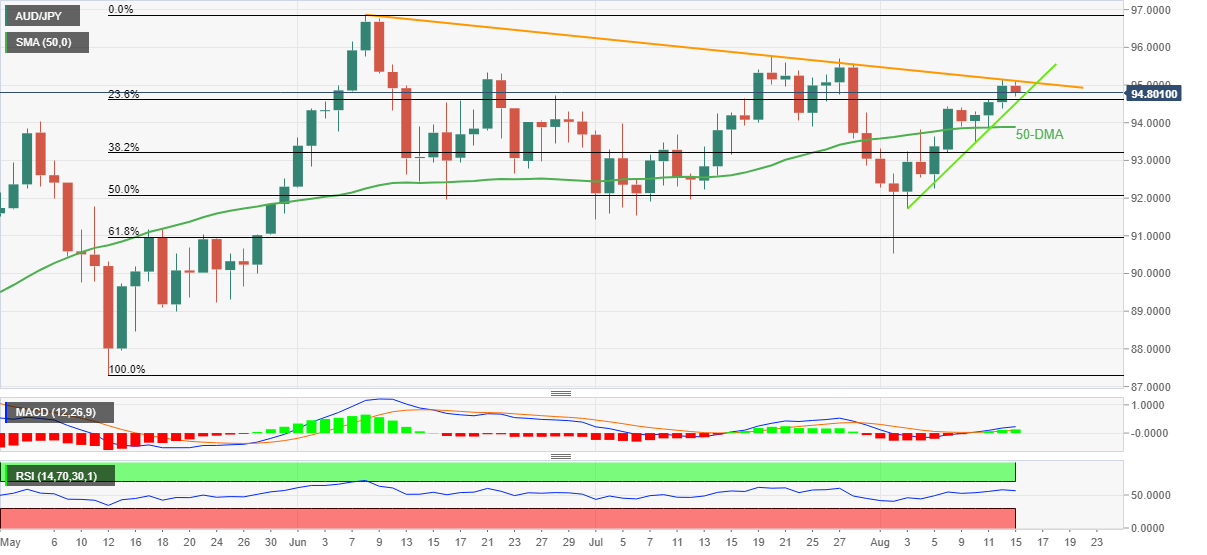
Trend: Limited downside expected
The People’s Bank of China (PBOC) set the USD/CNY reference rate at 6.7410 on Monday when compared to the previous fix and the previous close at 6.7413 and 6.7430 respectively.
Japan’s Economy Minister Daishiro Yamagiwa expressed his take on the economic expansion seen in the second quarter of this year.
Also read: Japan PM Kishida: Instructed to keep unchanged imported wheat prices from October
Key quotes
GDP shows economy in moderate pick-up.
Expects economy to contiue picking up ahead.
Need to pay attention to uncertainties that could hamper economic recovery such as energy, food price hikes, slowdown in global economy and coronavirus resurgence.
Want to bring economy to higher growth path while expanding momentum of wage hikes.
Will proceed with seamless measures to cope with price hikes while making flexible use of budget reserves.
Market reaction
At the press time, USD/JPY is keeping its range just above 133.00, losing 0.30% so far.
According to the latest Reuters poll of economists, the Bank of England (BOE) remains on track for a 50 basis points (bps) rate hike in September before returning to a more regular 25 bps increase in November.
Also read: GBP/USD prints corrective pullback around 1.2150 ahead of key UK statistics, Fed Minutes
Key findings
30 of 51 - said the BoE would take Bank Rate to 2.25% on Sept. 15 by adding 50 basis points. The other 21 suggested a more modest 25 basis point lift to 2.00%.
A large majority of those polled said the Bank would slow the pace in November to 25 basis points.
For the December meeting, 18 economists said the Bank would add another 25 basis points while 25 said it would pause.
The median forecast suggested borrowing costs would end the year at 2.50%, where they would stay until a cut in 2024.
UK economy to grow 3.5% in 2022, 0.2% in 2023 vs. 3.4%; 0.6% in July poll.
Inflation will reach 11.4% in the fourth quarter, higher than the 10.2% predicted last month, before slowing.
- GBP/USD resists extending two-day downtrend despite recent inaction.
- BOE’s Bailey shows readiness for a ‘review’ on UK PM Candidate Truss’ criticism.
- UK employment, retail sales and inflation data to decorate calendar, Fed Minutes will be eyed too.
GBP/USD picks up bids to refresh intraday high near 1.2150 during Monday’s Asians session. In doing so, the cable pair cheers the broad US dollar weakness while paying less heed to the uncertainty surrounding the Bank of England’s (BOE) next move.
The Telegraph came out with the news suggesting that Bank of England (BOE) Governor Andrew Bailey would be “open to a review” of the central bank’s mandate after Foreign Secretary Liz Truss criticized its approach to inflation. The news should have gained major attention as Truss is the front runner in the UK PM race and has signaled, per Bloomberg News, that she would “look again” at the BOE’s mandate “to make sure it is tough enough on inflation.”
On a different page, the US Dollar Index (DXY) renews its daily bottom around 105.60, remains pressured around the monthly low, as traders weigh the recently downbeat US inflation data and the hawkish Fedspeak.
It should be noted that the UK’s softer prints of the Gross Domestic Product (GDP) for the second quarter (Q2) joined better-than-forecast Michigan Consumer Sentiment Index for August to weigh on the GBP/USD prices the previous day.
During the weekend, a probable meeting between US President Joe Biden and his Chinese counterpart Xi Jinping, as signaled by the Wall Street Journal (WSJ), appeared to have favored the risk-on mood. Also positive for the mood were headlines suggesting improved coronavirus conditions in China's financial hub Shanghai. However, the increased count of the US lawmakers who is visiting Taiwan challenges the sentiment.
Amid these plays, the US 10-year Treasury yields remain pressured at around 2.84% after posting weekly losses by the end of Friday. Further, S&P 500 Futures print 0.25% intraday losses while Japan’s Nikkei 225 rises 0.65% on a day by the press time. It’s worth noting that Wall Street rallied on Friday.
Having witnessed a short-covering move, GBP/USD traders may observe Monday’s Empire State Manufacturing PMI for August for fresh impulse. However, major attention will be given to the UK’s top-tier data and the Federal Open Market Committee (FOMC) Minutes.
Technical analysis
GBP/USD bounces off 50-DMA support near 1.2130 but remains on the seller’s radar unless staying below a two-month-old resistance line, around 1.2260 by the press time. Also acting as the key support is an upward sloping support trend line from mid-July, close to 1.2090 at the latest.
Japanese Prime Minister Fumio Kishida said on Monday that he “instructed Agriculture Minister to keep unchanged imported wheat prices from October.”
Additional quotes
Instructed Trade Minister to come up with details on plans from October onward to curb fuel prices.
Instructed Trade Minister to come up with additional steps on energy and rising electricity bills.
more to come ...
- EUR/USD is finding buyers amid sluggish market conditions.
- Investors turn cautious amid US-Sino tensions, ahead of Fed minutes.
- The European energy crisis deepens as Germany’s Rhine river dry up.
EUR/USD is trading better bid above 1.0250, as buyers seemingly find support from a dismal market mood and sluggish US Treasury yields.
The US rates pause their upswing seen on Friday, as investors seek refuge in the government bonds and the dollar amid looming US-China risks after the former sent a delegation to Taiwan over the weekend even after the contentious visit by House Speaker Nancy Pelosi to the disputed island, which infuriated Beijing.
Further, rising odds of a 50 bps Fed rate hike in September, after easing US inflation pressures, weigh negatively on the yields, with all eyes on Wednesday’s FOMC minutes for fresh insights on the policy path of the world’s most powerful central bank.
Meanwhile, the US dollar is holding steady in early Asian trades, divided between the retreat in the yields and a tepid appetite for riskier assets. The US dollar index is trading flat at 105.61, having rebounded firmly to 105.88 last Friday. Stronger US Michigan Consumer Sentiment data and easing US inflation outlook triggered a sharp rally on the buck, despite solid performance on Wall Street.
On the EUR side of the equation, the gains in the shared currency will likely remain limited amid the deepening European energy crisis. Already, a cut in the Russian gas exports is severely impacting the old continent, with Germany being the worst hit. German economy could tip into a recession as sinking Rhine waters make shipping along the river harder.
Further up the river in Kaub, a noted bottleneck for shipping where the Rhine runs narrow and shallow, the reference level was forecast to go below 40 centimeters by the end of the week. It's worth noting that coal counts among key cargo moved on the waterway.
On the economic data front, Monday’s calendar is relatively data-scare on both sides of the Atlantic, with regard to the top-tier events. Therefore, the broader market sentiment and the dollar price action will continue to influence the main currency pair.
EUR/USD: Technical levels to watch
- US Dollar Index fades Friday’s corrective pullback from a six-week low.
- US Treasury bond yields remain pressured as Fed hawks resist welcoming softer inflation data.
- Fears of recession in Eurozone, US-China tussles also fail to propel DXY ahead of Wednesday’s FOMC Minutes.
US Dollar Index (DXY) takes offers to reverse Friday’s recovery moves, down 0.07% intraday near 105.60 during Monday’s Asian session. In doing so, the greenback’s gauge follows the US Treasury bond yields amid a sluggish session.
That said, the US 10-year Treasury yields remain pressured at around 2.84% after posting the weekly losses by the end of Friday.
It should be noted that the weakness in yields could be linked to the market’s fears of economic growth despite recently softer US inflation data, mainly due to the hawkish comments from the Fed policymakers and the energy crisis in Europe.
During the last week, softer prints of the US Consumer Price Index (CPI) and the Producers Price Index (PPI) managed to ease the market’s inflation fears. Even so, Richmond Federal Reserve (Fed) Bank President Thomas Barkin said on Friday that he wants to raise interest rates further to bring inflation under control. The policymaker further added that he will watch the US economic data to decide how big a rate hike to support at the Fed's next meeting in September. "I'd like to see a period of sustained inflation under control, and until we do that I think we are just going to have to move rates into restrictive territory," Barkin told CNBC, per Reuters.
Previously San Francisco Fed President Mary Day backed opportunities of witnessing another 75 basis points (bps) of a rate hike in September, while also suggesting an upfront 0.50% rate hike to be sure. Also, Minneapolis Fed President Neel Kashkari and Chicago Fed President Charles Evans sounded grim. That said, Fed’s Kashkari mentioned that he hasn't "seen anything that changes" the need to raise the Fed's policy rate to 3.9% by year-end and to 4.4% by the end of 2023. Further, Fed policymaker Evens stated, “The economy is almost surely a little more fragile, but would take something adverse to trigger a recession.” Fed’s Evans also called inflation "unacceptably" high.
Elsewhere, a probable meeting between US President Joe Biden and his Chinese counterpart Xi Jinping, as signaled by the Wall Street Journal (WSJ), appeared to have favored the risk-on mood. Also positive for the mood were headlines suggesting improved coronavirus conditions in China's financial hub Shanghai. However, the increased count of the US lawmakers who is visiting Taiwan challenges the sentiment.
Against this backdrop, S&P 500 Futures print 0.25% intraday losses while Japan’s Nikkei 225 rises 0.65% on a day by the press time. It’s worth noting that Wall Street rallied on Friday.
Moving on, DXY traders may pay attention to Monday’s Empire State Manufacturing PMI for August for fresh impulse. However, major attention will be given to the Federal Open Market Committee (FOMC) Minutes.
Technical analysis
US Dollar Index rebound remains elusive unless crossing a monthly resistance line, around 106.15 by the press time.
| Index | Change, points | Closed | Change, % |
|---|---|---|---|
| NIKKEI 225 | 727.65 | 28546.98 | 2.62 |
| Hang Seng | 93.19 | 20175.62 | 0.46 |
| KOSPI | 4.16 | 2527.94 | 0.16 |
| ASX 200 | -38.5 | 7032.5 | -0.54 |
| FTSE 100 | 35 | 7500.9 | 0.47 |
| DAX | 101.34 | 13795.85 | 0.74 |
| CAC 40 | 9.19 | 6553.86 | 0.14 |
| Dow Jones | 424.38 | 33761.05 | 1.27 |
| S&P 500 | 72.88 | 4280.15 | 1.73 |
| NASDAQ Composite | 267.28 | 13047.19 | 2.09 |
- GBP/JPY refreshes intraday low but stays inside a one-week-old symmetrical triangle.
- Preliminary readings of Q2 Japan GDP appeared softer-than-forecast but improved from prior readings.
- 200-HMA restricts immediate upside but nearly oversold RSI hints at limited downside room.
GBP/JPY renews daily bottom near 161.60 after Japan’s Q2 GDP flashed softer than expected figures during the initial hour of Monday’s Asian session. Even so, the cross-currency pair remains inside a one-week-old symmetrical triangle, keeping the traders less interested despite the latest move.
That said, preliminary readings of Japan’s Q2 GDP appeared at 0.5% QoQ versus 0.6% expected and -0.1% prior. Further, the GDP Annualized eased below 2.5% expected to 2.2%, versus -0.5% prior.
It’s worth noting that the quote’s latest weakness also portrays the bear’s dominance below the 200-HMA, suggesting further downside.
However, the RSI (14) line is nearly oversold and the GBP/JPY appears close to the stated triangle’s support line, around 161.30, which in turn signals limited room to the south for the pair sellers to cheer.
In a case where GBP/JPY remains weak past 161.30, the 161.00 threshold and the monthly low of 159.44 will be in focus.
Alternatively, a successful break of the 200-HMA level surrounding 162.35 could propel the buyers towards the stated triangle’s upper line, at 163.25 by the press time.
Following that, the monthly peak of around 164.00 will be important to watch for GBP/JPY buyers.
GBP/JPY: Hourly chart
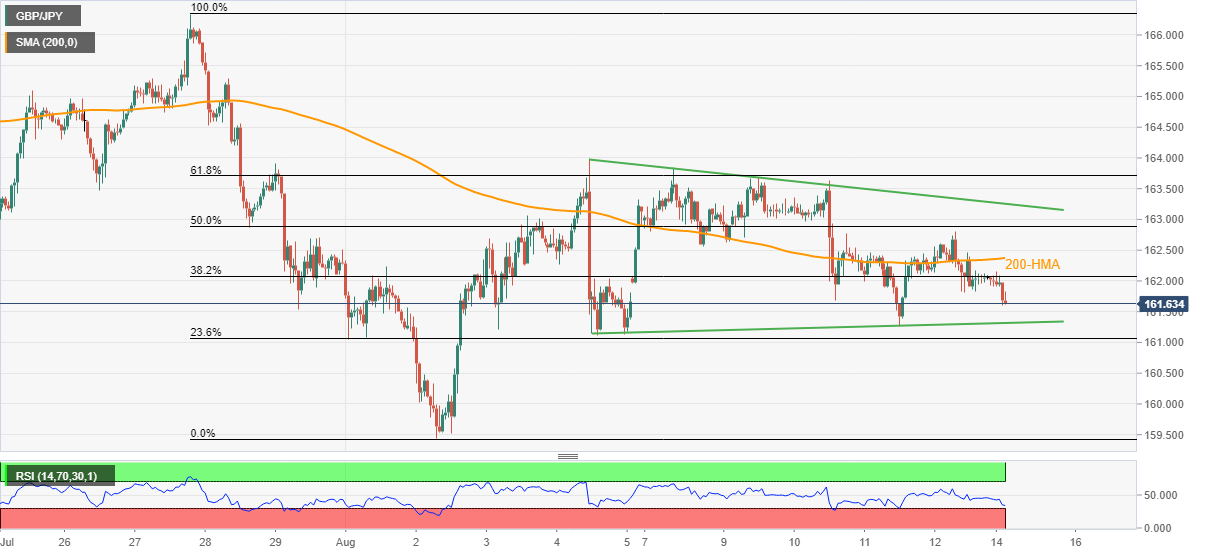
Trend: Sideways
- Gold Price remains wary, with September Fed rate hike bets in play.
- Treasury yields pullback in Asia while the USD clings to Friday’s gains.
- XAU/USD yielded a weekly close above key 50 DMA, Fed Minutes in focus.
Gold Price is struggling to find demand at the start of the week near the $1,800 mark, as bulls give into the bearish pressures amid a cautious risk sentiment.
Amidst intensifying US-Sino tensions, a five-member congressional delegation arrived in Taiwan on Sunday, less than two weeks after the contentious visit by House Speaker Nancy Pelosi, sapping investors’ confidence. Markets believe that the delegation’s presence in Taipei will provoke a sharp reaction from Beijing, possibly more military exercises.
Also read: Gold, Chart of the Week: XAU bears eye a break below $1,783
Further, investors turn cautious ahead of Wednesday’s Fed July meeting’s minutes, which may reveal fresh insights over a likely debate amongst the policymakers regarding the size of the next rate hike. Markets are currently pricing a 55% probability of the Fed going in for a 50 bps rate increase next month. Softer US inflation last week poured cold water on supersized Fed rate hikes in the coming months.
Uncertainty around Fed’s next policy move combined with the US-China conflict underpin the US dollar’s safe-haven appeal, weighing down on the USD-priced gold. The greenback preserves a major part of Friday’s upsurge, triggered by a strong jump in the Michigan Consumer Sentiment Index. The preliminary August estimate of the UoM consumer sentiment index rose to three-month highs of 3.6 points to 55.1 from a July reading of 51.5.
The downside in the bright metal, however, appears capped, for now, courtesy of the pullback in the Treasury yields across the curve after Friday’s steep rebound. The benchmark 10-year Treasury yields retreated after having run into stiff resistance just below the 3.0% key level.
Attention now turns towards the FOMC minutes due this Wednesday for investors’ re-pricing of the Fed tightening outlook Ahead of that the Chinese activity data and US industrial figures will set the tone for markets.
Gold Price: Daily chart
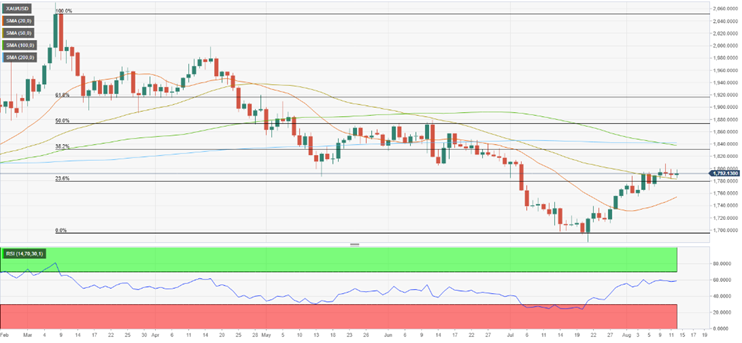
Technically, “$1,800 capped this week's advance and buyers are likely to refrain from betting on further gold strength unless this resistance fails. Above that level, $1,830 (Fibonacci 38.2% retracement of the latest uptrend) aligns as the next bullish target ahead of $1,840, where the 100-day and the 200-day SMAs are located,” FXStreet Analyst Eren Sengezer explained.
Eren added,” on the downside, significant support seems to have formed at $1,780 (50-day SMA, Fibonacci 23.6% retracement) ahead of $1,750 (20-day SMA).”
Gold Price: Additional levels to consider
| Pare | Closed | Change, % |
|---|---|---|
| AUDUSD | 0.71219 | 0.21 |
| EURJPY | 136.916 | -0.22 |
| EURUSD | 1.02562 | -0.66 |
| GBPJPY | 161.987 | -0.1 |
| GBPUSD | 1.21358 | -0.53 |
| NZDUSD | 0.645 | 0.26 |
| USDCAD | 1.27719 | 0.07 |
| USDCHF | 0.9414 | 0.03 |
| USDJPY | 133.486 | 0.42 |
- USD/JPY takes offers to refresh intraday low, snaps two-day uptrend.
- Japan’s Q2 GDP grew less than expected but stayed firmer compared to previous readouts.
- Market sentiment dwindles as Fedspeak resist welcoming softer US inflation.
- FOMC Minutes will be important for clear directions, US-China headlines may entertain traders.
USD/JPY refreshes intraday low around 133.20 as Tokyo opens on Monday. In doing so, the yen pair justifies mixed Gross Domestic Product (GDP) data for the second quarter (Q2), as well as a lack of clarity on the macro front.
That said, preliminary readings of Japan’s Q2 GDP appeared at 0.5% QoQ versus 0.6% expected and -0.1% prior. Further, the GDP Annualized eased below 2.5% expected to 2.2%, versus -0.5% prior.
Elsewhere, the US Treasury yields remain pressured at around 2.84% as Fed policymakers remain hawkish, suggesting further hardships for optimists suggesting less aggressive rate hikes and fewer challenges to economic growth. Also challenging the yields, as well as the USD/JPY traders are the mixed headlines surrounding the US and China.
The USD/JPY pair’s latest weakness justifies the softer US dollar amid downbeat inflation data. The reason could be linked to the hawkish comments from the Fed policymakers.
Chatters of a meeting between US President Joe Biden and his Chinese counterpart Xi Jinping, as signaled by the Wall Street Journal (WSJ), appeared to have favored the risk-on mood. Also positive for the mood were headlines suggesting improved coronavirus conditions in China's financial hub Shanghai. However, the increased count of the US lawmakers who are visiting Taiwan challenges the sentiment.
On Friday, Richmond Federal Reserve (Fed) Bank President Thomas Barkin said that he wants to raise interest rates further to bring inflation under control. Even so, the policymaker added that he will watch the US economic data to decide how big a rate hike to support at the Fed's next meeting in September. "I'd like to see a period of sustained inflation under control, and until we do that I think we are just going to have to move rates into restrictive territory," Barkin told CNBC, per Reuters.
Amid these plays, S&P 500 Futures print 0.25% intraday losses while Japan’s Nikkei 225 rises 0.65% on a day by the press time. It’s worth noting that Wall Street rallied on Friday.
Looking forward, China’s monthly Retail Sales and Industrial Production for July will offer immediate directions to the USD/JPY traders. However, major attention will be given to the Federal Open Market Committee (FOMC) Minutes.
Technical analysis
USD/JPY remains sidelined until crossing the 13-day-old symmetrical triangle, currently between 132.35 and 134.45.


© 2000-2026. All rights reserved.
This site is managed by Teletrade D.J. LLC 2351 LLC 2022 (Euro House, Richmond Hill Road, Kingstown, VC0100, St. Vincent and the Grenadines).
The information on this website is for informational purposes only and does not constitute any investment advice.
The company does not serve or provide services to customers who are residents of the US, Canada, Iran, The Democratic People's Republic of Korea, Yemen and FATF blacklisted countries.
Making transactions on financial markets with marginal financial instruments opens up wide possibilities and allows investors who are willing to take risks to earn high profits, carrying a potentially high risk of losses at the same time. Therefore you should responsibly approach the issue of choosing the appropriate investment strategy, taking the available resources into account, before starting trading.
Use of the information: full or partial use of materials from this website must always be referenced to TeleTrade as the source of information. Use of the materials on the Internet must be accompanied by a hyperlink to teletrade.org. Automatic import of materials and information from this website is prohibited.
Please contact our PR department if you have any questions or need assistance at pr@teletrade.global.
transfers