- Analytics
- News and Tools
- Market News
CFD Markets News and Forecasts — 11-08-2022
Reuters reports that San Francisco Federal Reserve Bank President Mary Daly said on Thursday that a 50 basis point interest rate hike in September "makes sense" given recent economic data including on inflation, but that she is open to a bigger rate hike if data warrants.
''Saying that she does not want to be 'headfaked' by the recent improvement in inflation readings, Daly told Bloomberg TV in an interview that she has an "open mind" on the possibility of a 75 basis point hike.
Financial conditions need to remain tight to continue to bridle economic growth and bring down inflation, she said.''
Earlier, Daly had already been reported by the FT saying that she did not rule out a third consecutive 0.75 percentage point rate rise at the central bank’s next policy meeting in September, although she signalled her initial support for the Fed to slow the pace of its interest rate increases, the Financial Times reported.
"We have a lot of work to do. I just don’t want to do it so reactively that we find ourselves spoiling the labour market," the central banker said while also indicating that she would be watching the next consumer price and non-farm payroll reports to better calibrate her decision.
Meanwhile, Thursday's data showed US producer prices (PPI) unexpectedly fell in July amid a drop in the cost of energy products. This followed Wednesday's surprise news that consumer prices (CPI) were unchanged in July due to a drop in gasoline prices. Both the greenback and US Treasury yields rallied after dropping sharply earlier. DXY is back trading around 105.10.
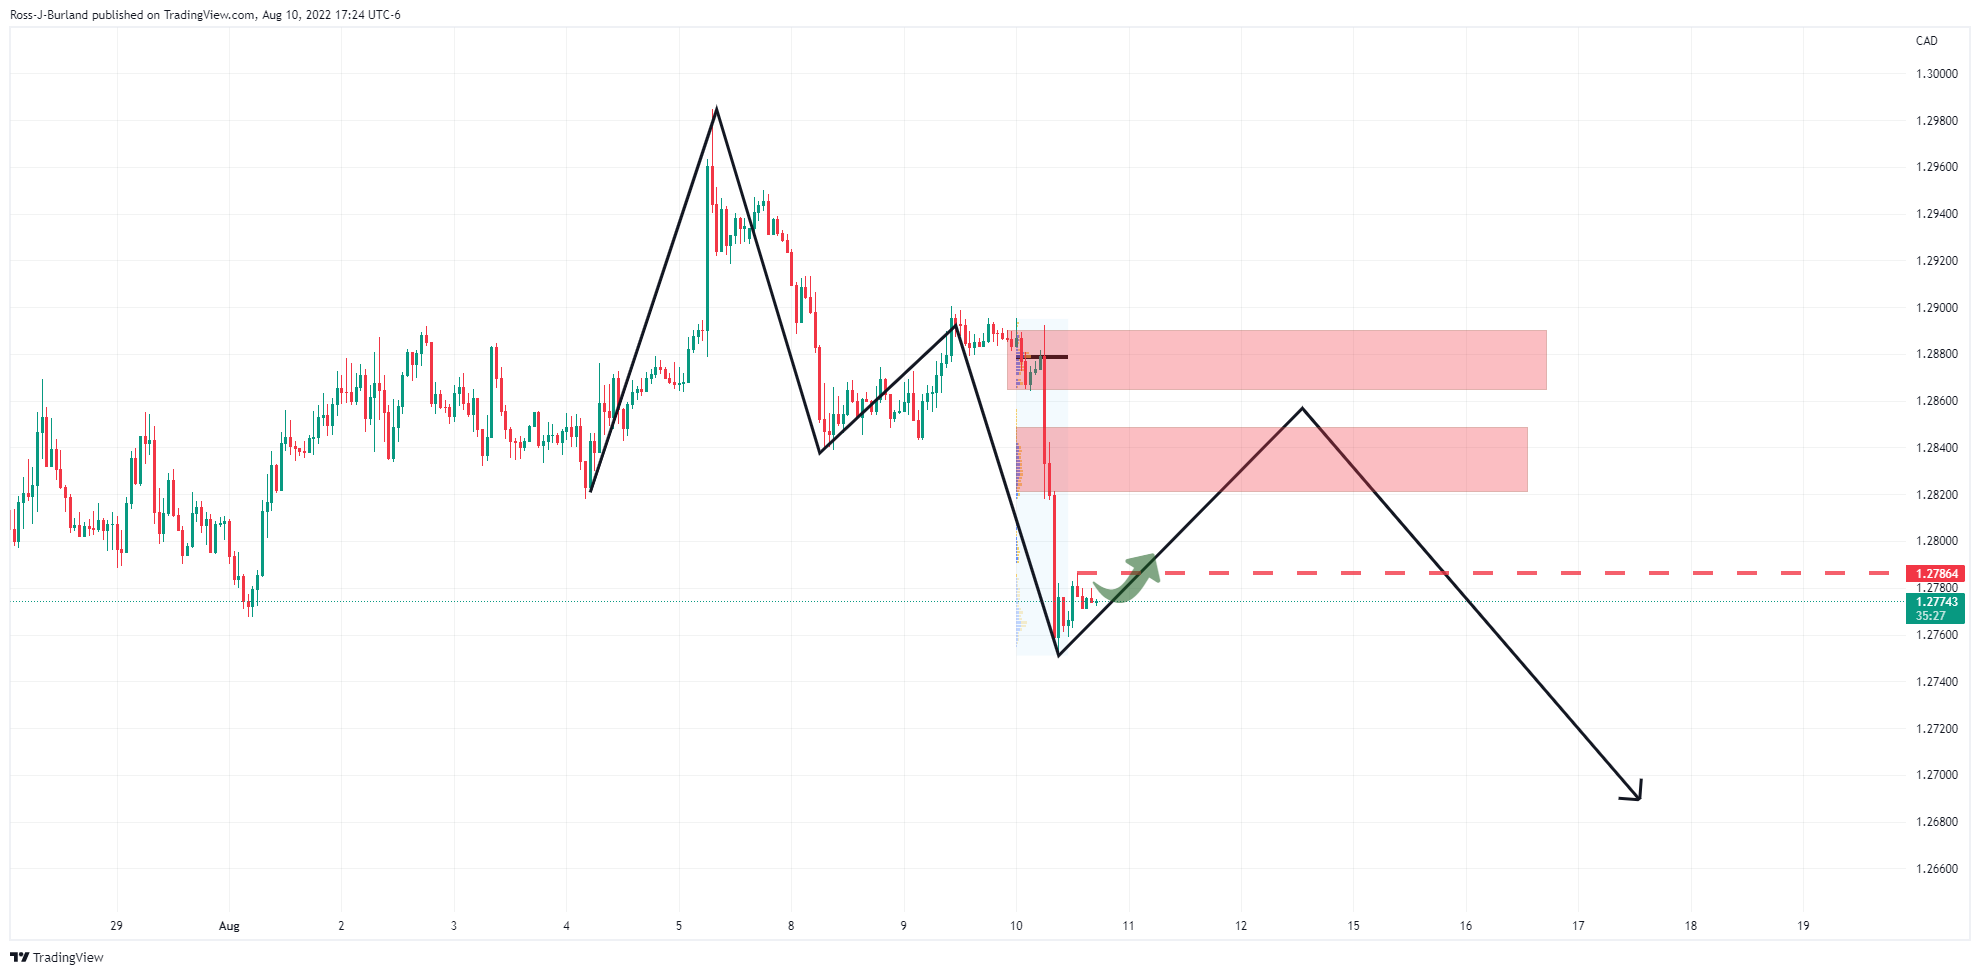
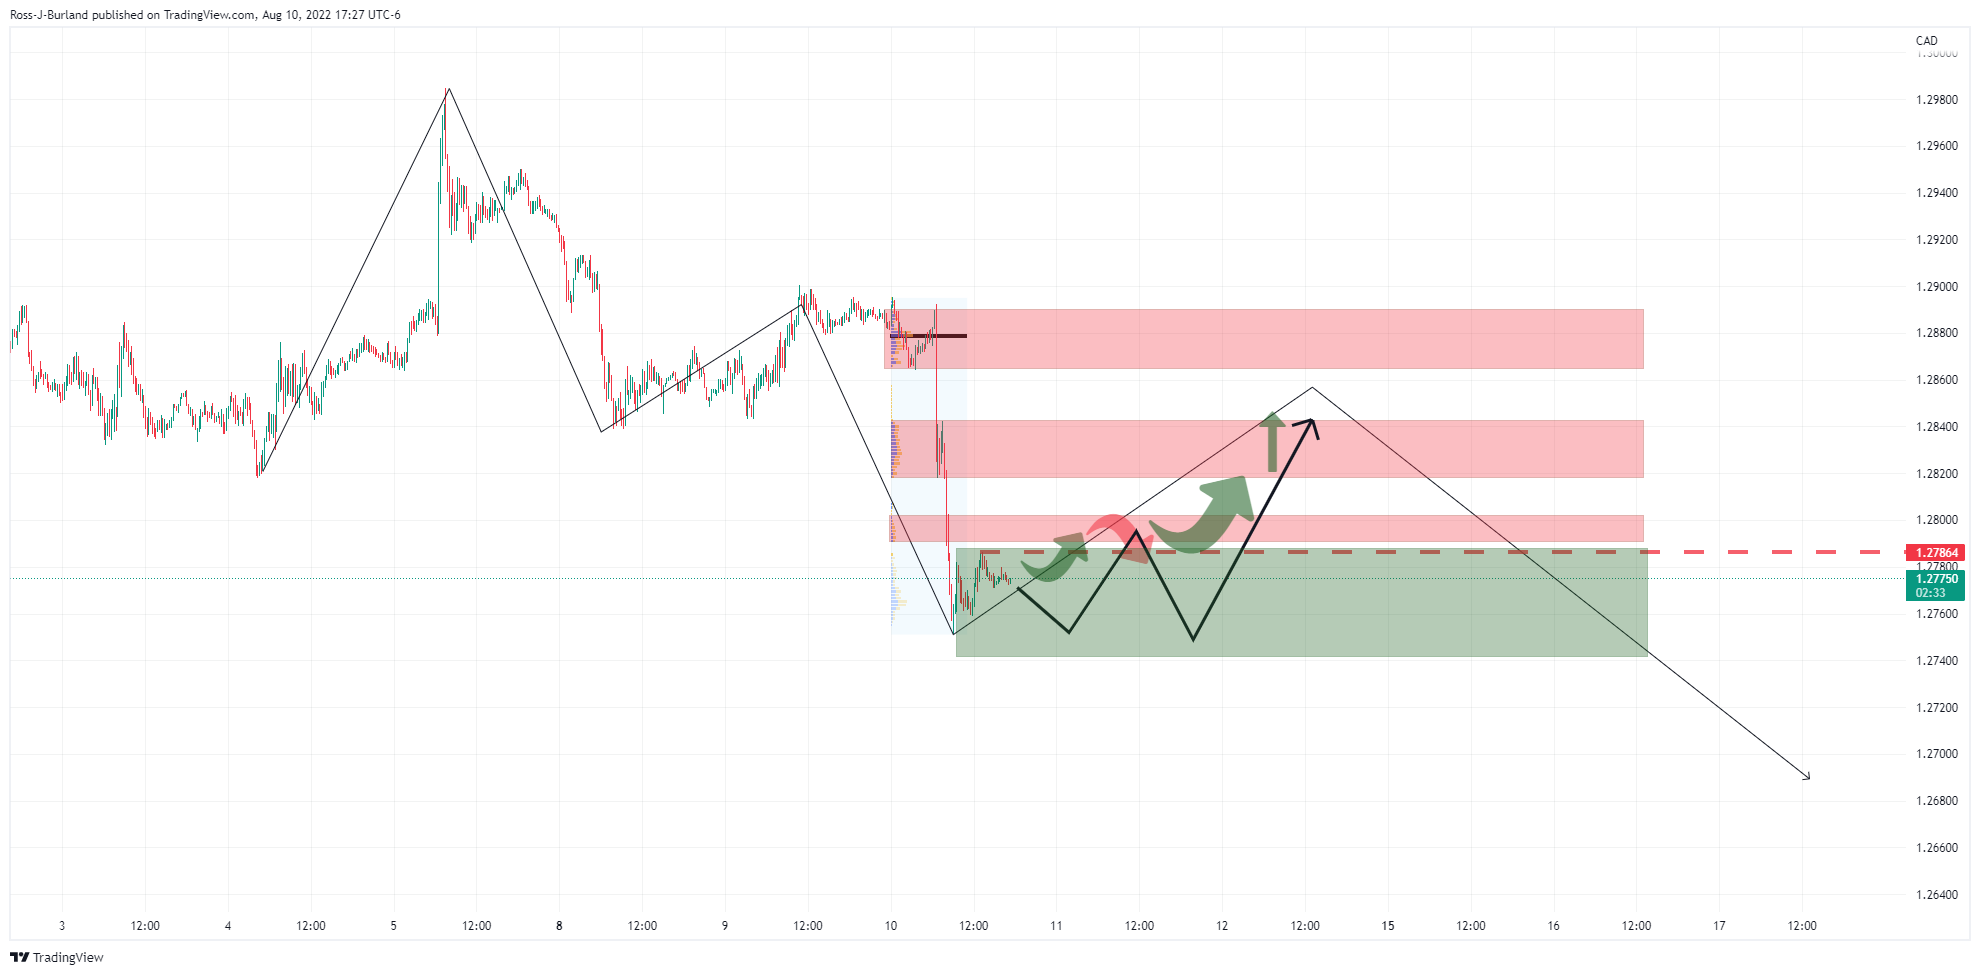
- USD/CAD bulls are lurking and the US dollar is firmer.
- Bulls need to commit to a break of 1.2780 and then 1.2790/00.
As per the prior analysis, USD/CAD Price Analysis: Bulls could be about to clean up, the price is in a phase of accumulation currently and a resurgence in the greenback would be expected to see USD/CAD rally in due course.
The following is an update of the prior analysis.
USD/CAD daily chart, prior analysis
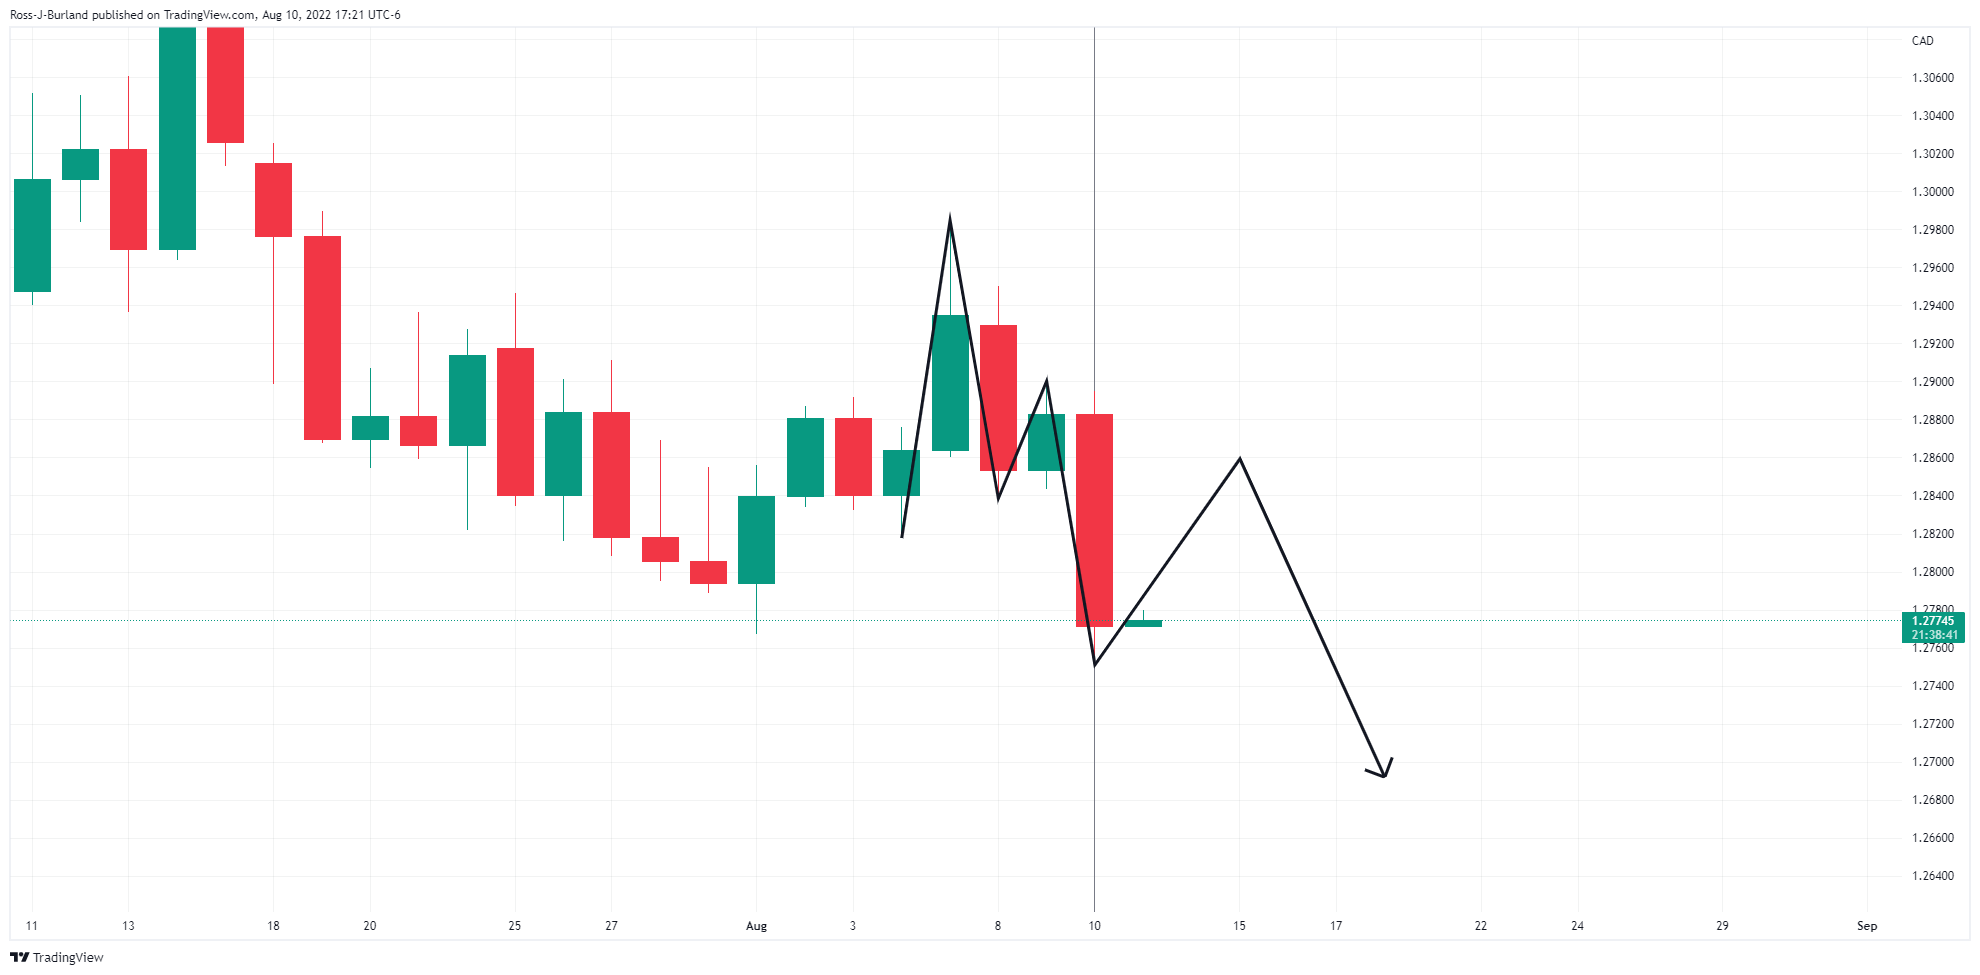
The price extended a touch lower on Thursday, but the bullish thesis remains in play, as per the following hourly and 15-minute charts:
USD/CAD 15-min chart, live market
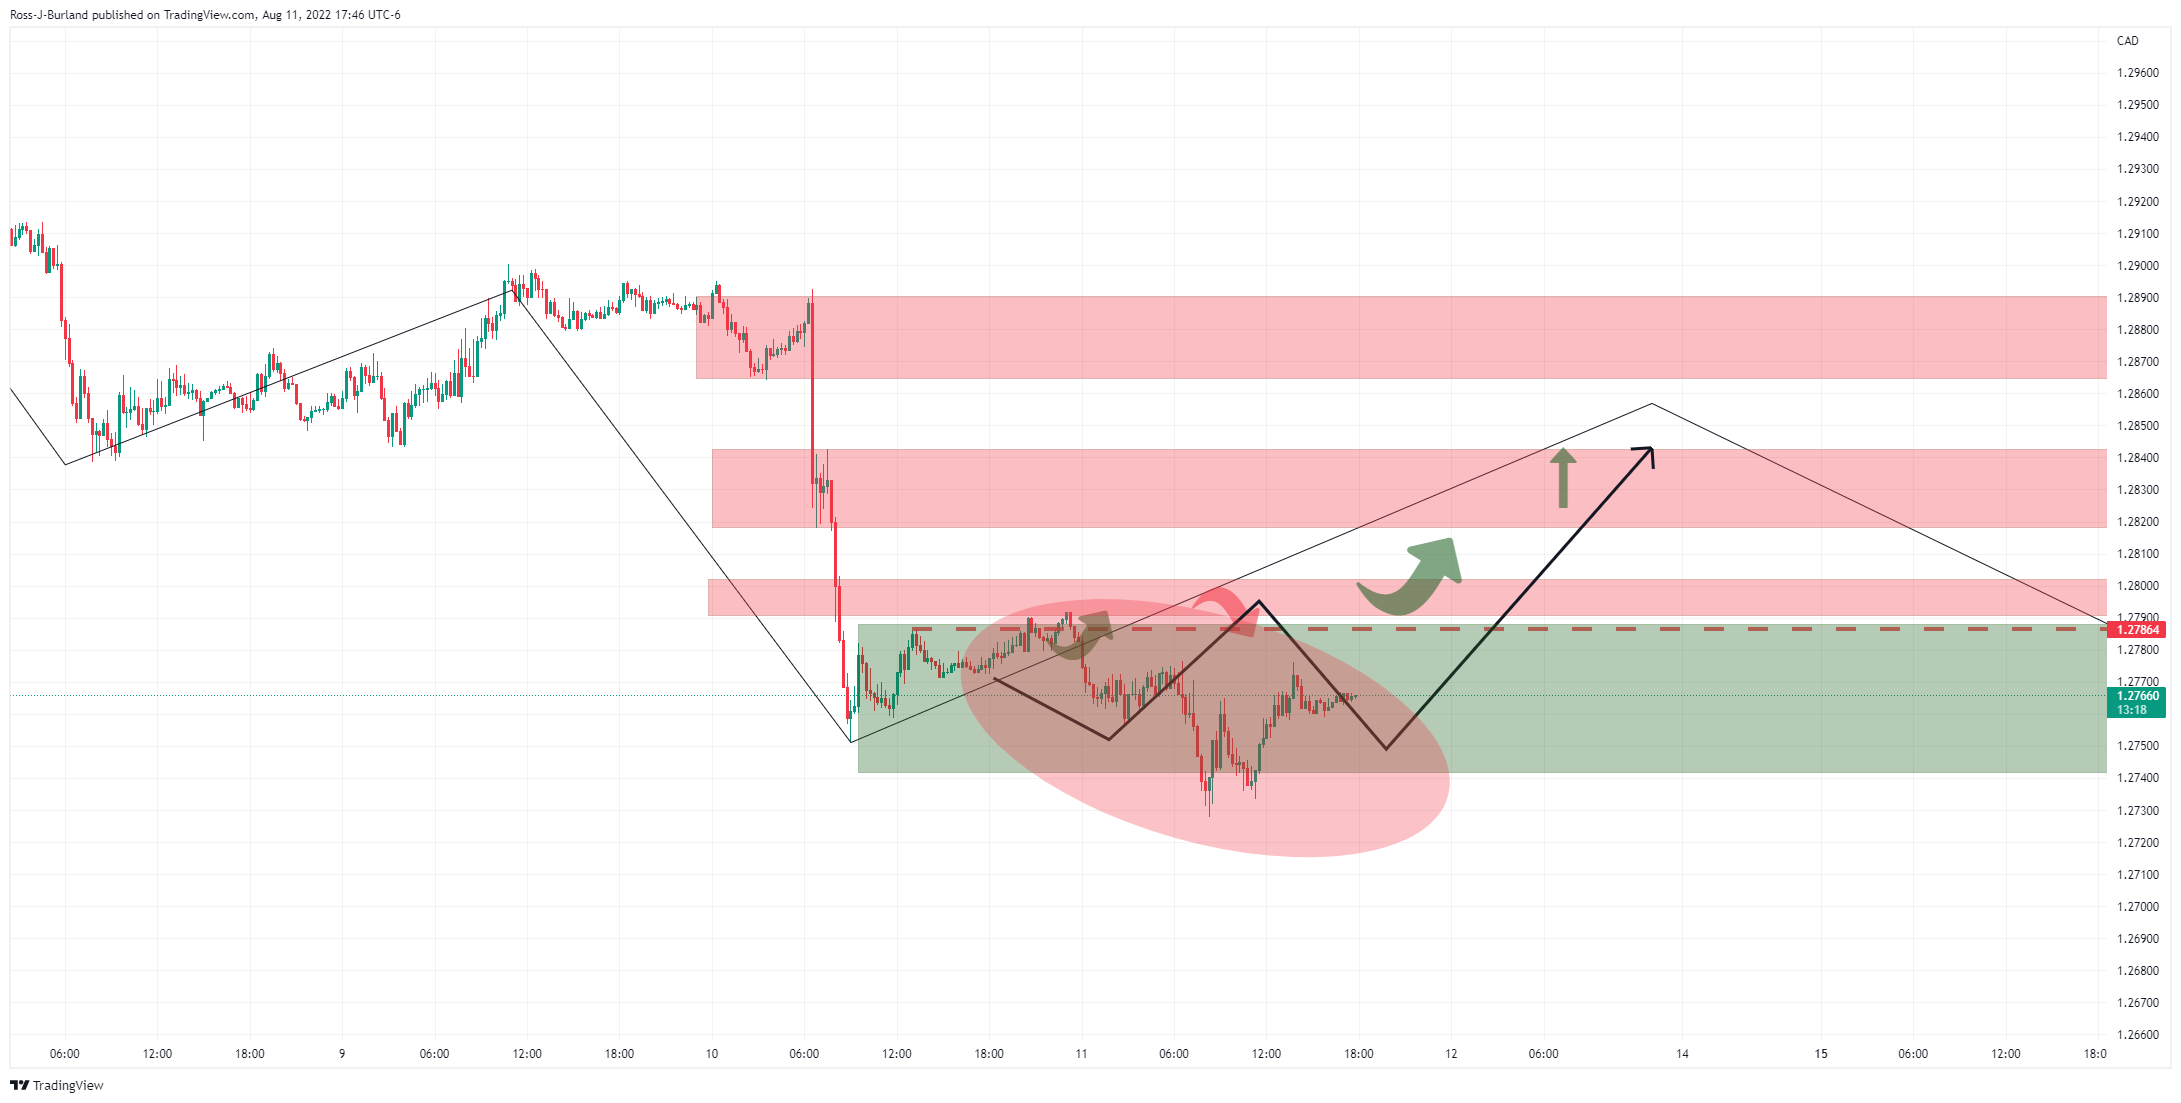
The price has been moving sideways within a consolidation price discovery phase of accumulation. This was flagged as a possibility in the prior analysis:
''From a 15-min perspective, the price action could develop over the coming sessions as follows. In a fast market, the price would be expected to correct steeply, but in a long drawn-out process in which there is a lack of commitment from the bulls, the ride could be a bumpy one along the support area as illustrated above. This would potentially result in an even lower low yet to come before the bulls fully commit to the correction in a phase of accumulation.''
The sentiment surrounding the greenback is turning more positive towards the end of the week so we could now start to see more commitment from the bulls over the coming sessions:
A break of 1.2780 and then 1.2790/00 will be key.
- AUD/NZD is expected to display significant losses after surrendering the cushion of 1.0300.
- The RBNZ is likely to announce a half-a-percent rate hike for the fourth time consecutively.
- A lower Australian Consumer Inflation Expectations print has failed to support aussie bulls.
The AUD/NZD pair has turned sideways at around 1.0400 after a downside move from 1.0500. The asset is on the verge of printing a fresh weekly low if the kiwi bulls manage to drag the cross below the immediate support of 1.0300. A release of an upbeat Business NZ PMI has strengthened the kiwi bulls.
The Business NZ PMI data has landed at 52.7, higher than the expectations of 52.5 and the prior release of 50. This is going to delight the Reserve Bank of New Zealand (RBNZ) in its fight against inflation. Next week, the RBNZ will announce an interest rate decision in its monetary policy meeting. RBNZ Governor Adrian Orr is expected to step up its Official Cash Rate (OCR) by 50 basis points (bps) consecutively for the fourth time. An announcement of the same will elevate the OCR to 3%.
As per the Reuters survey, the RBNZ will elevate its OCR to 4.00% by mid-2023. And, the Inflation is expected to fall within the target range of 2-3% in the H1CY2023. It seems like the RBNZ’s goal of bringing price stability is visible now.
On the Aussie front, lower Consumer Inflation Expectations data has failed to support the aussie bulls. A slippage in aussie Consumer Inflation Expectations, which presents the consumer expectations of future inflation during the next 12 months will force a decline in the hawkish guidance by the Reserve Bank of Australia (RBA).
- WTI retreats from one-week high, probes two-day uptrend.
- OPEC, EIA anticipate world energy demand to ease in 2022, and increase next year.
- Mixed sentiment, light calendar could restrict short-term moves.
- US Michigan Consumer Sentiment Index eyed for clear directions.
WTI crude oil prices remain sidelined at around $93.30-35 during Friday’s Asian session, pausing a two-day recovery around the weekly top. The black gold’s latest inaction could be linked to the light calendar and mixed catalysts. However, downbeat demand forecasts for 2022 by the Organization of the Petroleum Exporting Countries (OPEC) and the International Energy Agency (IEA), published on Thursday, appear to weigh on the quote.
That said, OPEC said that it lowered the 2022 full-year demand growth forecast to 3.1 million barrels per day (bpd) from 3.36 million bpd reported previously, per Reuters. "2023 world oil demand to rise by 2.7 million bpd, unchanged from the previous forecast," the forecasts add. The OPEC update also mentioned that the 2022 global economic growth forecast was lowered to 3.1% (prev. 3.5%), 2023 view was trimmed to 3.1% with significant downside risks prevailing.
On the other hand, the EIA said that it expects the global oil demand to rise by 2.1 million barrels per day in 2023 to surpass the pre-Covid levels at 101.8 million bps. “Demand growth is expected to slow from 5.1 mln bpd in 1Q22 to just 40,000 bpd by 4Q22,” adds EIA. The report also mentioned that the world oil supply hit a post-pandemic high of 100.5 million bpd in July.
Elsewhere, market sentiment remains mixed and joins the recent rebound in the oil prices to weigh on the black gold. While portraying the mood, Wall Street began the day on a positive side before closing mixed while the US 10-year Treasury yields rallied 10 basis points (bps) to 2.88% at the latest.
Behind the moves could be the comments from Minneapolis Fed President Neel Kashkari and Chicago Fed President Charles Evans challenged the market optimism earlier on Thursday. That said, Fed’s Kashkari mentioned that he hasn't "seen anything that changes" the need to raise the Fed's policy rate to 3.9% by year-end and 4.4% by the end of 2023. Further, Fed policymaker Evens stated, “The economy is almost surely a little more fragile, but would take something adverse to trigger a recession.” Fed’s Evans also called inflation "unacceptably" high.
On the same line were the headlines surrounding China. Reuters relied on sources to mention that the saying US President Biden rethinks steps on China tariffs in wake of Taiwan response. Additionally, a jump in the coronavirus cases from China, to 700 new confirmed cases in the mainland on August 10 versus 444 a day earlier, also weighs on the pair. Furthermore, Taiwan’s criticism of the “One China” policy and US House Speaker Nancy Pelosi’s support for Taipei also challenged the market optimism.
It’s worth noting that the softer prints of the US Jobless Claims and Producer Price Index (PPI) for July underpinned the risk-on mood and restricted the black gold’s downside.
Moving on, a light calendar at home requires the WTI crude oil traders to keep their eyes on the qualitative catalysts for fresh directions ahead of the US Michigan Consumer Sentiment Index (CSI) for August, expected at 52.5 versus 51.5 prior.
Also read: Michigan Consumer Sentiment Index Preview: Good news for the dollar but not for households
Technical analysis
A two-month-old descending resistance line precedes the 21-DMA to restrict immediate WTI rebound near $93.40 and $94.15 levels in that order. Given the recently firmer MACD, coupled with the gradual rebound from the yearly low, the commodity buyers are likely to keep reins.
- Silver price holds lower ground near the short-term key support comprising 50-day EMA, three-week-old ascending support line.
- Receding bullish MACD signals, sustained pullback from 61.8% Fibonacci retracement tease sellers.
- Bulls need validation from $21.00 to retake control.
Silver price (XAG/USD) remains pressured at around $20.30, keeping the previous day’s bearish bias during Friday’s Asian session. In doing so, the bright metal holds on to the latest downside break of the 50% Fibonacci retracement level of the June-July fall amid recently easing bullish signals of the MACD.
That said, the quote’s U-turn from the 61.8% Fibonacci retracement level earlier in the week also keeps XAG/USD sellers hopeful to conquer the $20.20 support confluence including the 50-DMA and an upward sloping trend line from July 25.
It’s worth noting that the silver sellers might search for the daily closing below the $20.00 threshold to validate the weakness past $20.20.
Following that, a south-run towards the five-week-long horizontal area near $19.55-45 can’t be ruled out.
Meanwhile, the 50% and the 61.8% Fibonacci retracement levels, respectively near $20.35 and $20.85 could restrict short-term upside moves of the silver price.
Should the quote manage to cross the $20.85 hurdle, the mid-June swing low near $21.00 will act as an extra filter to the north before directing the XAG/USD buyers towards the June 27 peak of $21.53.
Silver: Daily chart
Trend: Further weakness expected
- NZD/USD is advancing towards its two-month high at 0.6260 as Business NZ PMI lands higher at 52.7.
- A fourth consecutive 50 bps rate hike is expected by the RBNZ.
- The impact of the lower US CPI print is fading away and investors are focusing on Fed’s next meeting.
The NZD/USD pair has continued its four-day winning streak and is likely to recapture its two-month high at 0.6260 as Business NZ has reported upbeat PMI data. The economic data has landed at 52.7, higher than the expectations of 52.5 and the prior release of 50.
An upbeat PMI data has strengthened the kiwi bulls against the greenback. Also, it may back the former to print a fresh two-month high.
Going forward, the kiwi bulls are likely to dance to the tunes of the Reserve Bank of New Zealand (RBNZ) as the central bank will announce an interest rate decision on Wednesday.
As per the Reuters poll, the RBNZ will elevate its Official Cash Rate (OCR) by 50 basis points (bps) consecutively for the fourth time, taking the interest rates to 3%. Also, the insights from Reuters’ survey indicate that the RBNZ will elevate its OCR to 4.00% by mid-2023. And, the Inflation is expected to fall within the target range of 2-3% in the H1CY2023.
Meanwhile, the US dollar index (DXY) is likely to display a minor correction after facing hurdles around 105.20. The upside seems intact as investors have ignored the evidence of exhausting inflation and are now focusing on the extent of the rate hike that the Federal Reserve (Fed) will feature in its monetary policy meeting in September.
There is no denying the fact that inflation exhaustion signals cheered the market participants. However, price pressures are still on the rooftop and highly deviated from the desired levels. So Fed’s rate announcement will continue further.
- USD/CHF broke below the 200-DMA, ending the major’s upward bias.
- In the near term, the USD/CHF is neutral to downwards, but buyers reclaiming 0.9450 exerts upward pressure on the major.
The USD/CHF stumbles for the sixth consecutive day and breaks support provided by the 200-DMA at 0.9427, shifting the major’s bias downwards, with sellers reclaiming the latter, extending the USD/CHF losses in the week to 2.17%. At the time of writing, the USD/CHF is trading at 0.9408.
USD/CHF Price Analysis: Technical outlook
From a daily chart perspective, although breaking below the 200-day EMA, the USD/CHF risks are skewed to the upside. Thursday’s price action formed a hammer, preceded by a downtrend. That said, the major might re-test the 200-day EMA as a resistance level. If the latter holds, that could pave the way towards the March 31 low at 0.9194.
 USD/CHF Daily chart
Zooming into the one-hour scale, the USD//CHF chart portrays the pair as neutral-to-downwards, but a positive divergence between the RSI and price action suggests an upward correction is on the cards. If that scenario plays out, the USD/CHF first resistance would be the confluence of the 50-hour EMA and the R1 pivot at 0.9447. Break above will expose the R2 daily pivot at 0.9484, followed by 0.9500.
 USD/CHF 1-hour chart
USD/CHF Key Technical Levels
Analysts at the investment bank Morgan Stanley (MS) think that the British Pound (GBP) has a limited scope of portraying a heavy downside.
"We turn bearish skew for GBP but see another sharp leg lower in GBP as unlikely. The BoE delivered a 50bp hike, in line with market expectations, but this decision was accompanied by a very bleak set of forecasts and an explicit warning of a protracted UK recession starting from 4Q22," mentioned MS ahead of the preliminary readings of the UK’s second quarter (Q2) Gross Domestic Product (GDP).
The US bank also adds, "It is these weak growth expectations which we think will continue to keep GBP on the back foot against its G10 peers. However, given how low growth expectations already are and how bearish sentiment is on GBP, we think the risk of a further sharp leg lower in GBP has decreased.”
Also read: UK GDP Preview: Early confirmation of BOE’s recession forecast
- GBP/JPY fades bounce off weekly low ahead of the preliminary UK Q2 GDP.
- Multiple failures to cross 50-day EMA, previous support line from March favor sellers amid steady RSI, bearish MACD signals.
- 200-day EMA offers strong support, six-week-old horizontal line adds to upside filters.
GBP/JPY holds lower grounds inside an immediate 30-pip trading range above 162.10 during Friday’s initial Asian session. In doing so, the cross-currency pair fails to extend the late Thursday’s rebound from the weekly bottom ahead of the preliminary readings of the UK’s second quarter (Q2) Gross Domestic Product (GDP).
Also read: UK GDP Preview: Early confirmation of BOE’s recession forecast
Technically, the pair has been on the bear’s radar for the last two weeks after it dropped below an upward sloping trend line from March to late July. Also keeping the sellers hopeful is the quote’s multiple failures to cross the 50-day EMA resistance, as well as bearish MACD signals and the steady RSI.
That said, GBP/JPY sellers currently aim for the 38.2% Fibonacci retracement level of March-June upside, near 161.95 ahead of challenging multiple supports around 161.15-10.
It should be noted, however, that the quote’s weakness past 161.10 appears difficult as the 160.00 psychological magnet will precede the 200-day EMA level surrounding 159.50 to challenge the bears.
Alternatively, the 50-day EMA level near 163.30 guards the GBP/JPY pair’s immediate recovery ahead of the support-turned-resistance line around 164.10.
Following that, a daily closing beyond the 23.6% Fibonacci retracement level of 164.55 becomes necessary for the GBP/JPY bulls to mark another attempt in crossing the 1.5-month-long horizontal hurdle close to 166.25-35.
GBP/JPY: Daily chart
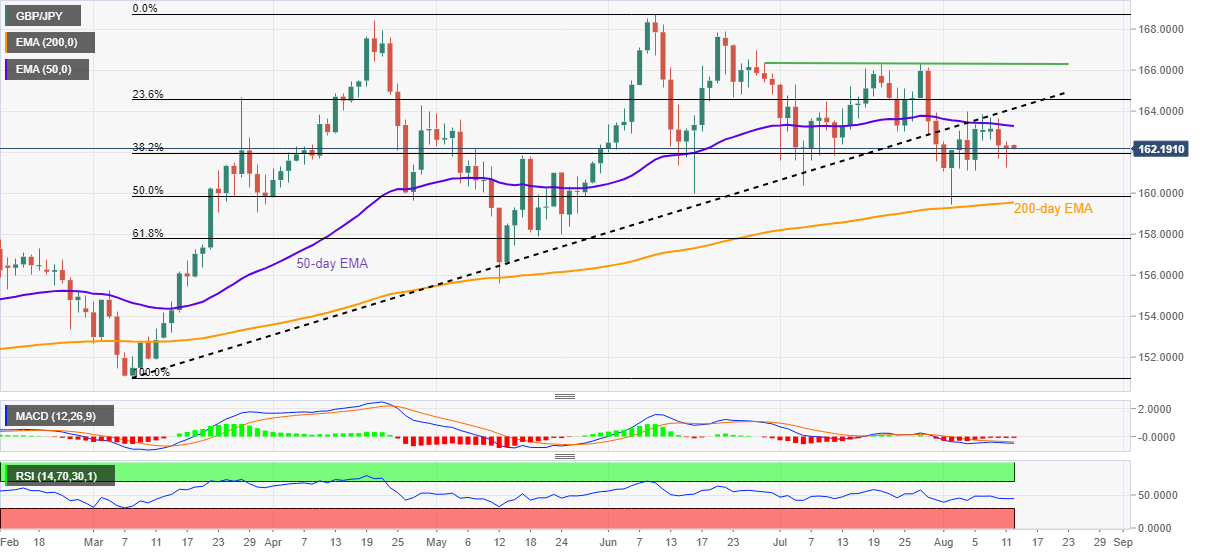
Trend: Further upside expected
“The Reserve Bank of New Zealand (RBNZ) will stick to its hawkish stance and deliver a fourth straight half-point rate hike on Wednesday in its most aggressive tightening in over two decades to try to rein in stubbornly-high inflation,” as per the latest Reuters poll published early Friday morning in Asia.
Key findings
All 23 economists in the Aug. 8-11 Reuters poll forecast rate setters at the RBNZ would hike its official cash rate by another 50 basis points at its Aug. 17 meeting, taking it to 3.00%. It was 1.00% before the COVID-19 pandemic.
All but one of the 23 economists polled also forecast rates to reach 3.50% or higher by the end of 2022 in what would be the most aggressive policy tightening since the official cash rate was introduced in 1999.
While the RBNZ has signaled plans to increase the rate to 4.00% by mid-2023, almost matching the U.S. Federal Reserve, few economists in the poll said it would go that far.
Only five of 23 economists predicted rates would reach 4.00% by end-2022, up from one in the previous poll.
Twelve of 19 respondents forecast the cash rate to either stay steady at 3.50% or be lower by end-2023. The remaining seven predicted it would climb to 3.75% or higher by then.
Inflation was expected to fall within the target range of 2%-3% in the second half of next year, a separate Reuters poll showed.
Also read: NZD/USD: RBNZ’s tone should underpin the kiwi – ANZ
- GBP/USD is facing barricades around 1.2200 as investors await UK GDP data.
- A vulnerable UK GDP will accelerate troubles for the BOE.
- Higher Initial Jobless Claims have supported the DXY at lower levels.
The GBP/USD pair is hovering around the immediate hurdle of 1.2200 after a modest rebound from 1.2185. The asset defended Wednesday’s low at around 1.2180 but is now displaying a torpid rebound, which could be fragilized effortlessly by the market participants. The cable is expected to remain subdued as investors are awaiting the release of the Gross Domestic Product (GDP) data. Apart from that, the release of the Industrial Production and Manufacturing Production data holds utmost importance.
As per the market consensus, the UK economy has shrunk by 0.2% in the second quarter of CY2022 vs. the expansion of 0.8% recorded in Q1CY22. Also, the annual data is expected to shift lower to 2.8% from the prior release of 8.7%. An occurrence of the same is likely to create more troubles for the Bank of England (BOE). The central bank is already stuck in the laborious job of dealing with ramping up inflation and over that, a slump in growth rates will restrict the BOE to combat price pressures with full power.
Adding to that, the Manufacturing Production data is also expected to display a vulnerable performance. The economic data is expected to slip lower to 0.9% against the former release of 2.3% on an annual basis. Adding to that, the monthly data is expected to display a de-growth of 1.8% against the previous print of 1.4%.
Whereas the Industrial Production data is seen higher by 20 basis points on yearly basis but the monthly culture is likely to land in negative territory.
On the dollar front, the US dollar index (DXY) defended the downside bias confidently and now, has advanced to near 105.20. Printing of higher jobless claims by the first-timers supported the DXY from refreshing its monthly lows. The economic data landed at 262k, mostly in line with the expectations but lower than the prior release of 248k.
- AUD/USD bulls take a breather around 11-week top amid cautious optimism.
- Softer US PPI, Aussie CPI joined firmer equities to favor the pair buyers.
- Strong yields, fears of US-China tussles and the Fedspeak tested the upside momentum.
- Risk catalysts eyed for immediate directions amid a light calendar in Asia, US Michigan Consumer Sentiment Index is the key.
AUD/USD steps back from a two-month high, recently sidelined, as bulls seek fresh clues to extend the latest uptrend amid a light calendar and recently mixed mood during Friday’s Asian session. That said, the Aussie pair seesaws around 0.7100, after refreshing the multi-day high with 0.7137, during Friday’s initial Asian session.
US Producer Price Index (PPI) for July tracked the headline Consumer Price Index (CPI) while easing to 9.8% YoY versus 11.3% prior and 10.4% market forecasts, the data published by the US Bureau of Labor Statistics revealed on Thursday. That said, the monthly PPI dropped to the lowest levels since May 2020, to -0.5% compared to 1.0% expected and 0.2% prior, which in turn signaled more easing of inflation fears.
At home, Australia’s downbeat prints of Consumer Inflation Expectations for August, to 5.9% from 6.3%, offered additional relief to the Reserve Bank of Australia (RBA) that raised concerns over a surge in the prices of late.
In addition to the receding inflation woes, the softer prices of the US Weekly Jobless Claims also portrayed improvement in the employment scenario, tracking the recent job numbers from the world’s largest economy, which in turn helped to build the risk-on mood. That said, US Initial Jobless Claims eased to 262K for the week ending August 6 versus 263K expected and downwardly revised 248K prior.
Alternatively, comments from Minneapolis Fed President Neel Kashkari and Chicago Fed President Charles Evans challenged the market optimism earlier on Thursday. That said, Fed’s Kashkari mentioned that he hasn't "seen anything that changes" the need to raise the Fed's policy rate to 3.9% by year-end and to 4.4% by the end of 2023. Further, Fed policymaker Evens stated, “The economy is almost surely a little more fragile, but would take something adverse to trigger a recession.” Fed’s Evans also called inflation "unacceptably" high.
On the same line were the headlines surrounding China. Reuters relied on sources to mention that the saying US President Biden rethinks steps on China tariffs in wake of Taiwan response. Additionally, a jump in the coronavirus cases from China, to 700 new confirmed cases in the mainland on August 10 versus 444 a day earlier, also weighs on the pair. Furthermore, Taiwan’s criticism of the “One China” policy and US House Speaker Nancy Pelosi’s support for Taipei also challenged the market optimism.
Amid these plays, Wall Street began the day on a positive side before closing mixed while the US 10-year Treasury yields rallied 10 basis points (bps) to 2.88% at the latest.
Looking forward, a light calendar at home requires the AUD/USD traders to keep their eyes on the qualitative catalysts for fresh directions ahead of the US Michigan Consumer Sentiment Index (CSI) for August, expected at 52.5 versus 51.5 prior.
Technical analysis
An upwards loping support line from early July, around 0.7090, restricts the immediate downside of the AUD/USD pair. The fresh upside momentum, however, needs validation from 0.7140.
- The EUR/JPY rebounded from 136.29 weekly lows and reclaimed the 137.00 area towards Thursday’s close.
- The cross-currency pair is neutral-to-downward biased, and a break below 136.31 will send the pair sliding towards 135.80.
The EUR/JPY jumps off weekly lows and trims some of Wednesday’s losses amidst a mixed market mood as reflected by the US equities split between gainers/losers towards the end of the session.
Earlier risk appetite improved due to US PPI data, which showed that inflation on the producer’s side is also cooling. So traders asses that the previously-mentioned data, alongside Wednesday’s US CPI, might ease Fed pressures to tackle inflation, meaning a less aggressive tightening
EUR/JPY Price Analysis: Technical outlook
Reviewing Wednesday’s notes, I wrote that a bearish-engulfing candle pattern emerged on the daily chart, which has bearish implications. So Thursday’s price action followed suit and reached a weekly low at 136.29. Nevertheless, as the yen weakened, the EUR/JPY aimed higher, though recorded its daily close below the August 8 daily low at 137,26. Still, the Relative Strength Index (RSI) is in bearish territory, so sellers are in charge, so any rallies could be better entry prices for shorts.
Therefore, the EUR/JPY’s first support would be the August 10 daily low at 136.61. Break below will expose the August 11 pivot low at 136.30, followed by the August 5 daily low at 135.80. On the other hand, If the EUR/JPY clears the 100-day EMA, then a test towards the 138.35 weekly highs is on the cards.
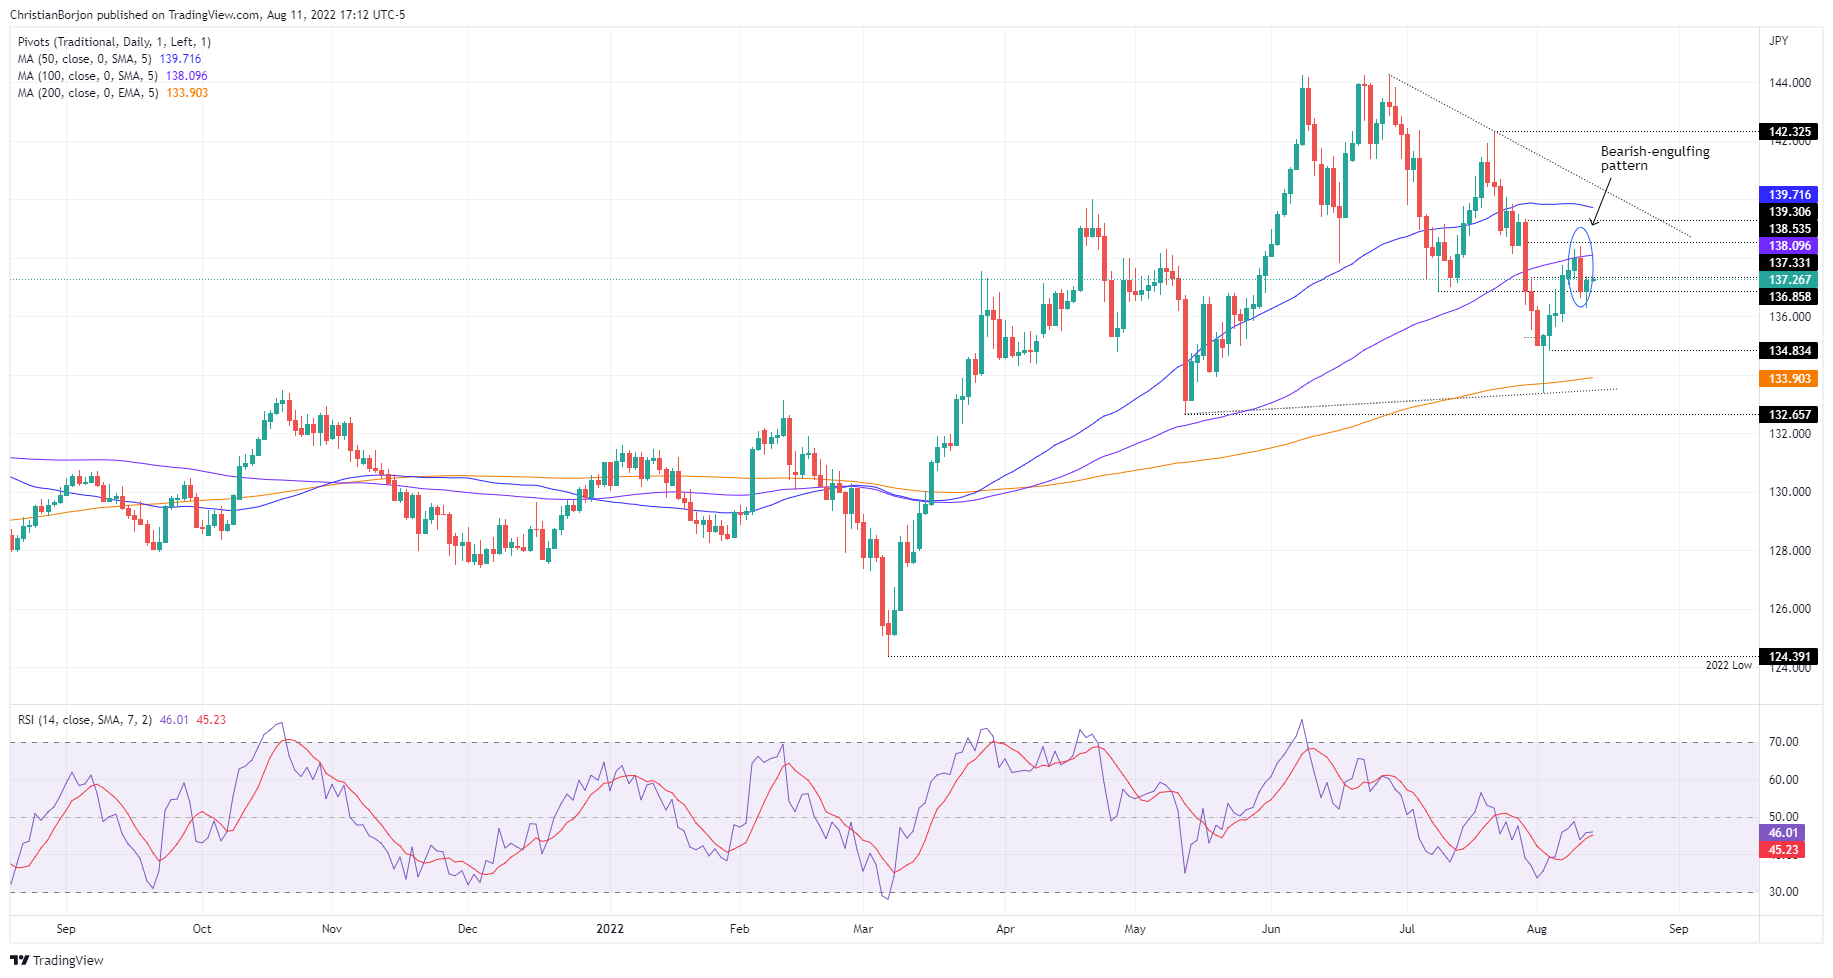 EUR/JPY Daily chart
EUR/JPY Key Technical Levels
- EUR/USD has turned sideways around 1.0320 as DXY rebounds sharply.
- Fresh evidence of exhaustion in the US CPI is meaningful but short-lived if not find follow-ups.
- A vulnerable performance is expected from Eurozone Industrial Production data.
The EUR/USD pair is auctioning in an inventory distribution phase after a sheer downside move. The asset declined sharply after testing the monthly high of 1.0370. Failing to print a fresh monthly high due to a less-confident upside rally delighted the market participants to deploy significant offers at elevated levels. Usually, an inventory distribution phase after a vertical fall results in a continuation of downside momentum as investors bet on breaking the consolidation.
The US dollar index (DXY) displayed a confident rebound after sensing an intense buying interest while revisiting the six-week low at 104.64. The DXY has extended its gains to near 105.20 after a firmer rebound and is likely to advance further as investors are shrugging off a one-time softer US inflation show.
No doubt, the fresh evidence of exhaustion in the US Consumer Price Index (CPI) is indicating that good days are ahead and the Federal Reserve (Fed)’s journey towards achieving price stability is visible now despite being blurred. However, an annual US CPI figure of 8.5% is not the right time to enjoy a ball as the Fed will continue on its path of accelerating interest rates. For the record, the extent of hawkish guidance will trim abruptly.
Going forward, investors will keep an eye on the US Michigan Consumer Sentiment Index (CSI) data. The sentiment data is expected to improve to 52.2 from the prior release of 51.5. A consecutive improvement is expected in the confidence of consumers after the data slipped to 50 for the first time in the past 20 years.
Also, the Eurozone will report the Industrial production data, which are seen lower at 0.2% and 0.8% from their prior releases on a monthly and an annual basis respectively.
- Gold could be on the verge of a significant downside correction.
- The US dollar bulls are emerging as markets digest Fed speak and inflation data.
The gold price is back to flat in the close on Wall Street following a move in the US dollar and yields that have shaken out some weak hands that have been positioned short in the greenback. The market backdrop has turned increasingly risk-friendly over the past two days which has supported the yellow metal with sentiment reflecting some upside in growth indicators and the downside of inflation pressures.
However, at the time of writing, the greenback is moving higher on the 4-hour charts in a solid correction of the inflation blowout as markets take some time out to look ahead. Thursday's Producer Price Index sent similar signals to that of Wednesday's CPI and embedded the hope that the Federal Reserve will be able to cool down price growth without shoving the economy into the deep freeze of recession.
July PPI month-over-month and year-over-year came in below expectations. In fact, the month-over-month reading was actually negative. Core readings were below the Reuters poll on a month-over-month basis and in-line on a year-over-year basis. The report lessened the prospects of the Fed up interest rates by 75 basis points for the third time in a row at the conclusion of its September policy meeting. Instead, CME Fed funds futures now predict a smaller 50 bp rate hike by nearly two to one.
The markets were digesting the recent Consumer Price Index and PPI outcomes that came in below expectations, taking on board subsequent comments made by Federal Reserve officials also.
Fed officials are hawkish
Fed officials spoke after the inflation data this week. For instance, following yesterday's CPI, Neel Kashkari unleashed his inner hawk and said the July CPI data did not change his expected rate path, though he was happy to see inflation surprise to the downside. Kashkari stressed that the Fed is far from declaring victory over inflation and stressed that recession “will not deter me” from getting to the 2% target.
Today, Mary Daly, President of the San Francisco Fed did not rule out a third consecutive 0.75 percentage point rate rise at the central bank’s next policy meeting in September, although she signalled her initial support for the Fed to slow the pace of its interest rate increases, the Financial Times reported. "We have a lot of work to do. I just don’t want to do it so reactively that we find ourselves spoiling the labour market," the central banker said while also indicating that she would be watching the next consumer price and non-farm payroll reports to better calibrate her decision.
US stocks faded
On Wall Street, heading towards the final hour of trade, stocks had turned over easing earlier gains as investors figure that the one-month data is not enough to start calling peak inflation. As a consequence, after adding more than 2% on Wednesday and rising more than 1% to a 3-month high earlier on Thursday, the S&P 500 edged 0.1% lower to 4,207.32 and the Nasdaq Composite was 0.6% lower at 12,779.91. The Dow Jones Industrial Average rose 0.1% to 33,336.67.
The 10-year yield was 3.41% higher on the day and has made a fresh high for the day of 2.902%. The move coincided with the 30-year bond auction. Meanwhile, the DXY, an index that measures the greenback vs. a basket of currencies was back to near flat for the day at 105.14. The index has recovered from a low of 104.646.
Commenting on the US dollar and in light of yesterday's CPI data, analysts at Brown Brothers Harriman said, ''we stress that there is a lot of noise right now even as markets remain thin during the summer months.''
''We are likely to continue seeing violent moves in the markets in the coming weeks as markets continue to struggle to find a stable and sustainable macro outlook to trade on.
Analysts at TD Securities argued that the recent downside miss of US core inflation underscores that we have likely seen the peak of inflation and perhaps the stagflation concerns. Even so, however, they ''don't think that risk assets are out of the woods yet, suggesting it could a bit more time to expect a persistent, positive boost in growth expectations and financial conditions.''
''A potential inflation peak (and associated end to Fed terminal rate price discovery) is an important ingredient to call the top in the USD. The other key (and arguably) more important ingredient is the outlook for global growth. On that factor, we don't think it is time to completely fade the USD, though the recent backdrop reductions convictions on USD long exposure,'' the analysts explained.
Meanwhile, the analysts at TD Securities said that the gold sellers are lurking.
''Gold's failure to break north of a key threshold for substantial short covering from CTA trend followers amid a miss in the highly anticipated US inflation data may be pointing to significant selling interest. After all, strong physical demand may have exacerbated the short covering rally sparked by Chair Powell's FOMC speech, but we see evidence that the Chinese bid in gold continues to unwind.''
''Prices now need to break north of $1830/oz to catalyze a buying program from trend followers. Ultimately, prop traders are still holding a massive amount of complacent length, suggesting we have yet to see capitulation in gold, which argues that the pain trade remains to the downside.''
Gold technical analysis
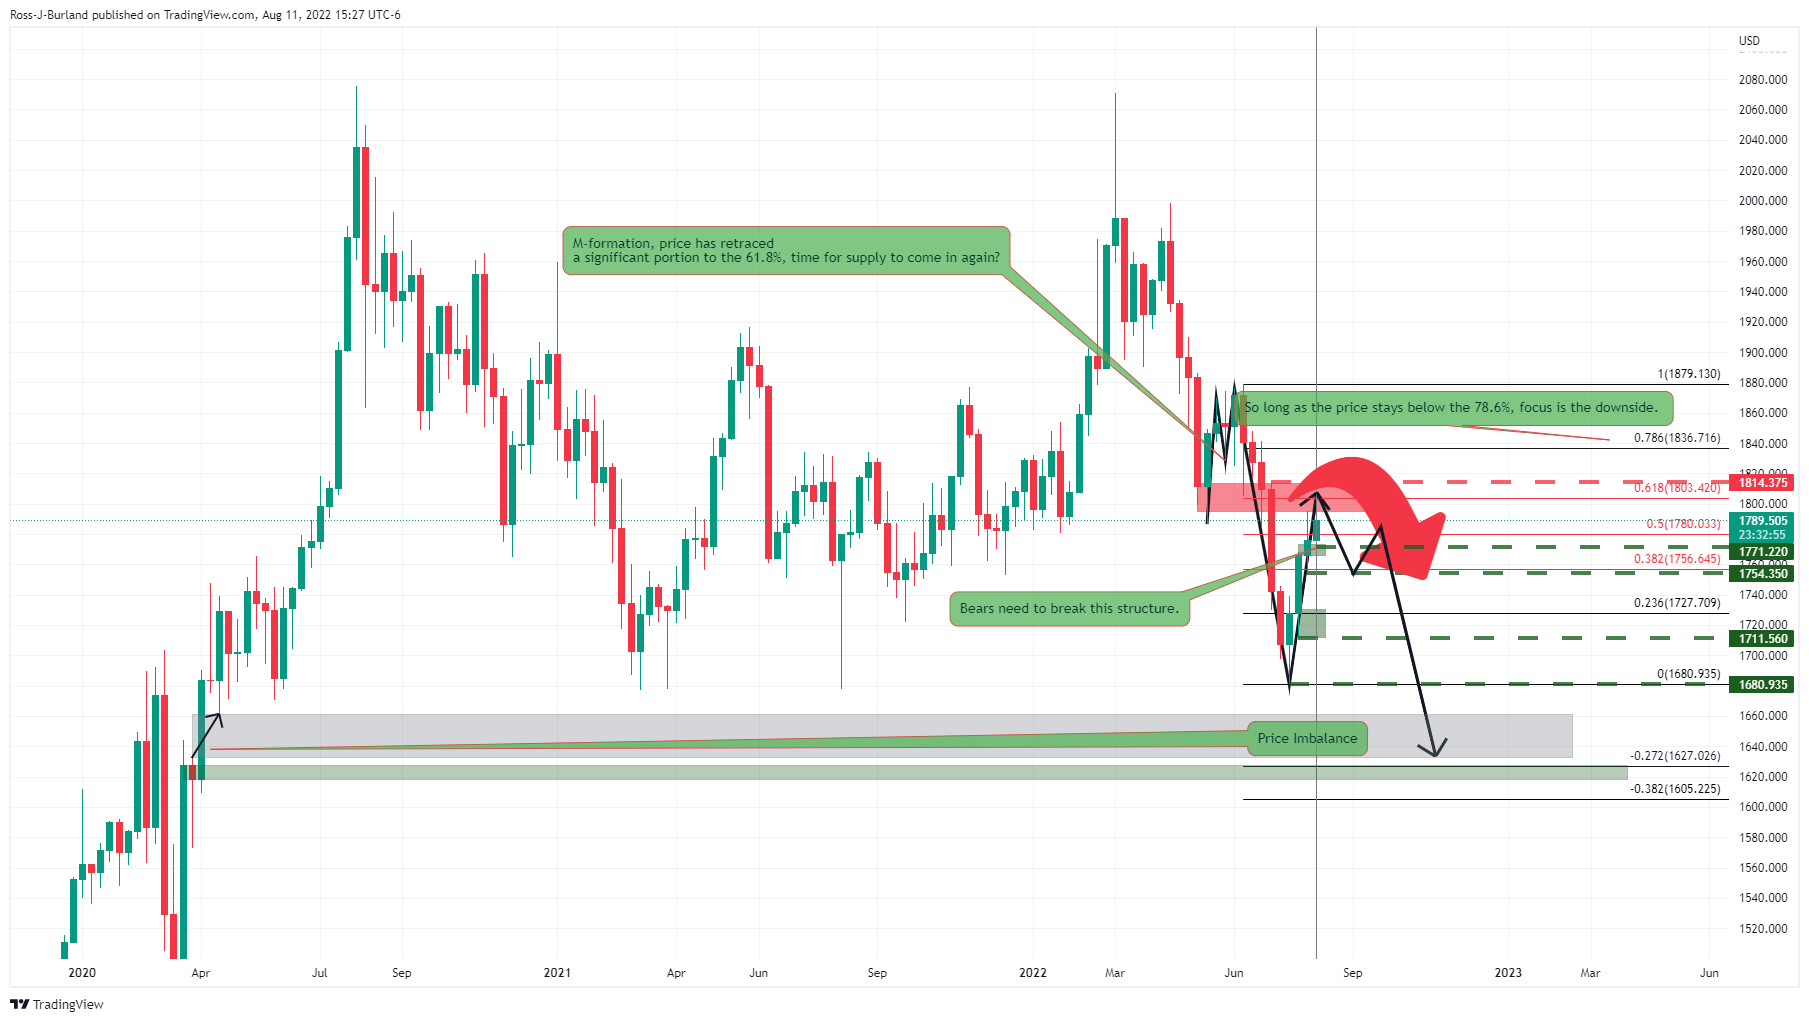
As illustrated, the price has run up to the 61.8% golden ratio where some profit taking would be expected to occur. A build-up of supply could pick up over the course of the coming days and weeks ahead resulting in a topping of this correction of the M-formation's bearish leg.
- The AUD/JPY is trading near two-week highs around 94.66.
- Risk appetite is mixed, as shown by Wall Street, finishing mixed.
- In the short-term, the AUD/JPY could test 95.00; otherwise, a fall towards the 100-EMA is on the cards.
The AUD/JPY snaps two days of losses and advances after Wall Street closed mixed as investors’ upbeat sentiment pauses. Earlier risk appetite improved due to US PPI data, which showed that inflation on the producer’s side is also cooling. So traders asses that the previously-mentioned data, alongside Wednesday’s US CPI, might ease Fed pressures to tackle inflation, meaning a less aggressive tightening. At the time of writing, the AUD/JPY is trading at 94.53, up 0.47%.
AUD/JPY Price Analysis: Technical outlook
The AUD/JPY daily chart illustrates buyers reclaiming control. On Thursday, the AUD/JPY hit a two-week high at 94.60, followed by a retracement due to a three-month-old upslope trendline-turned-resistance, which was challenging to overcome. Nevertheless, the Relative Strength Index (RSI) is still aiming upwards, meaning buyers are gathering momentum.
Zooming into the 4-hour scale, the AUD/JPY is neutral-to-upward biased, but the uptrend appears to be losing steam. The intersection of the R2 daily pivot with the previously mentioned three-month-old upslope trendline is solid resistance around the 94.50-80 area. A breach of the latter will expose the figure at 95.00, followed by the July 27 daily high at 95.70.
On the flip side, if the AUD/JPY breaks below the 94.00 mark, the first support would be the 200-EMA at 93.60, previous to testing the August 10 pivot low at 93.48-
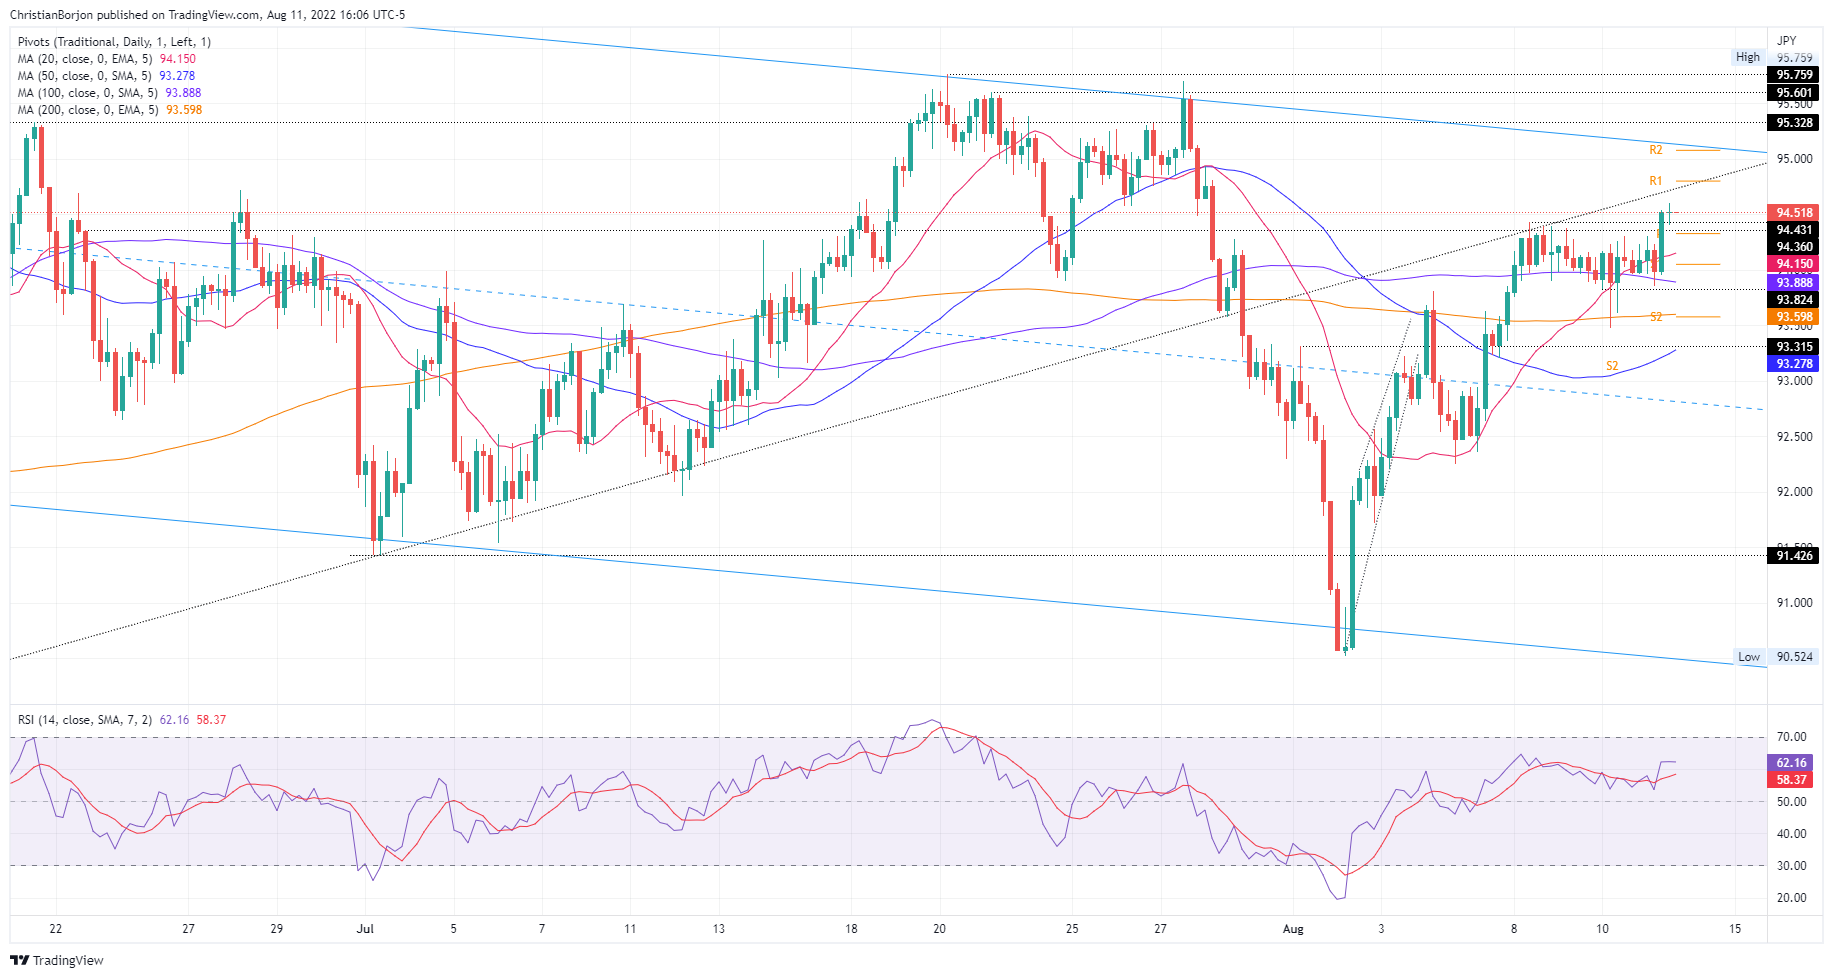 AUD/JPY 4-hour chart
AUD/JPY Key Technical Levels
What you need to take care of on Friday, August 12:
The greenback seesawed between gains and losses, ending the day lower against most major rivals. Wall Street opened the day firmly higher amid more signals of receding US inflationary pressures, as the July Producer Price Index advanced by 9.8%, below expected.
Nevertheless and as US government bond yields advanced, equities lost steam, helping the dollar to recover some ground ahead of the daily close. At the time being, US indexes trade mixed around their opening levels, while the yield on the 10-year Treasury note stands at 2.88%.
The EUR/USD pair peaked at around 1.0360 for a second consecutive day, settling at around 1.0320. The GBP/USD pair trades just below 1.2200 ahead of the release of first-tier UK data. The country will publish the preliminary Q2 Gross Domestic Product estimate and June Industrial and Manufacturing Production.
The AUD/USD pair hovers around 0.7100, while USD/CAD trades at around 1.2770. Finally, safe-haven currencies eased at the end of the day, finishing it pretty much unchanged. USD/CHF hovers around 0.9420 while USD/JPY stands at 133.10.
Gold eased and is now trading at $1,785 a troy ounce. Crude oil prices increased, with WTI ending at $94.00 a barrel.
Will the Ethereum price finally flip Bitcoin?
Like this article? Help us with some feedback by answering this survey:
- USD/JPY bulls moving in as US yields bounce back.
- The US dollar is finding buyers in a short squeeze and US stocks flip over.
The market backdrop has turned increasingly risk-friendly over the past two days. The mood is reflecting some upside in growth indicators and the downside of inflation pressures. However, USD/JPY is back to being flat on the day following a move in the US dollar and yields that have shaken out some weak hands that have been positioned short in the greenback.
At the time of writing, USD/JPY is trading at 105.13 within the 104.646/105.461 day range. The markets are digesting the recent inflation data that has been released over two days, including Thursday's Producer Price Index.
The PPI echoed that of Wednesday's and embedded the hope that the Federal Reserve will be able to cool down price growth without shoving the economy into the deep freeze of recession. US stocks were higher in early trade on the fresh evidence of calming inflation but they have started to ease in midday trade as investors take profits and in the wake of a sell-off across the US dollar forex pairs with the 10-year yield rallying.
US stocks faded
On Wall Street, heading towards the final hour of trade, stocks have flipped over into negative territories as investors figure that the one-month data is not enough to start calling peak inflation. As a consequence, after adding more than 2% on Wednesday and rising more than 1% to a 3-month high earlier on Thursday, both the S&P and Nasdaq turned negative.
At the time of writing, the 10-year yield is 3.41% higher on the day and has made a fresh high for the day of 2.902%. The move coincides with the 30-year bond auction. Meanwhile, the DXY, an index that measures the greenback vs. a basket of currencies is now back to near flat for the day at 105.14. The index has recovered from a low of 104.646.
July PPI month-over-month and year-over-year came in below expectations. In fact, the month-over-month reading was actually negative. Core readings were below the Reuters poll on a month-over-month basis and in-line on a year-over-year basis. The report lessened the prospects of the Fed up interest rates by 75 basis points for the third time in a row at the conclusion of its September policy meeting. Instead, CME Fed funds futures now predict a smaller 50 bp rate hike by nearly two to one.
Fed officials remain hawkish
Meanwhile, Fed officials spoke after the inflation data this week. For instance, following yesterday's CPI, Neel Kashkari unleashed his inner hawk and said the July CPI data did not change his expected rate path, though he was happy to see inflation surprise to the downside. Kashkari stressed that the Fed is far from declaring victory over inflation and stressed that recession “will not deter me” from getting to the 2% target.
Today, Mary Daly, President of the San Francisco Fed did not rule out a third consecutive 0.75 percentage point rate rise at the central bank’s next policy meeting in September, although she signalled her initial support for the Fed to slow the pace of its interest rate increases, the Financial Times reported. "We have a lot of work to do. I just don’t want to do it so reactively that we find ourselves spoiling the labour market," the central banker said while also indicating that she would be watching the next consumer price and non-farm payroll reports to better calibrate her decision.
Commenting on the US dollar and in light of yesterday's CPI data, analysts at Brown Brothers Harriman said, ''we stress that there is a lot of noise right now even as markets remain thin during the summer months.''
''We are likely to continue seeing violent moves in the markets in the coming weeks as markets continue to struggle to find a stable and sustainable macro outlook to trade on.
Recession? Soft landing? Tightening? Easing? All of these questions remain unanswered right now and we will not know the truth for months, if not quarters.''
Analysts at TD Securities argued that the recent downside miss of US core inflation underscores that we have likely seen the peak of inflation and perhaps the stagflation concerns. Even so, however, they ''don't think that risk assets are out of the woods yet, suggesting it could a bit more time to expect a persistent, positive boost in growth expectations and financial conditions.''
''A potential inflation peak (and associated end to Fed terminal rate price discovery) is an important ingredient to call the top in the USD. The other key (and arguably) more important ingredient is the outlook for global growth. On that factor, we don't think it is time to completely fade the USD, though the recent backdrop reductions convictions on USD long exposure,'' the analysts explained.
- Silver price is dropping close to 1.50% on Thursday.
- July’s US CPI and PPI inflation reports show signs of topping; however, Fed officials remained hawkish.
- Traders’ focus shifts toward the University of Michigan Consumer Sentiment and Inflation Expectations.
Silver price drops moderately as market sentiment remains upbeat following the release of the US inflation data on Wednesday, followed by Thursday’s PPI report, which showed prices are slowing down, painting a positive picture for the US Federal Reserve. Given the previously mentioned, traders reduced their exposure to safe-haven assets to the detriment of the white metal. At the time of writing, XAGUUSD is trading at $20.28, near the daily lows.
The Department of Labor revealed that prices paid by producers, also known as PPI, rose slower than estimated. The PPI for July jumped by 9.8%YoY, higher than the 10.4% estimates, while the so-called core CPI, which strips volatile items, increased 7.6% YoY, aligned with expectations. Adding the previously mentioned pieces of data to Wednesday’s release of US CPI, which is around 8.5%, still paints a picture of hot US inflation. Even though Fed policymakers welcomed the reports, they reiterated the Fed’s commitment to bringing inflation towards their 2% target.
On Wednesday, Minnesota Fed’s Kashkari said that although the CPI news was good, he said that the Fed is “far, far away from declaring victory.” He added that he hadn’t seen anything that changes the Fed’s path to 3.9% by year-end and the 4.4% by 2023. Kashkari also pushed back against the market’s rate cuts expectations early in the next year and said they are “not realistic.”
In the meantime, the US Dollar Index, a gauge of the greenback’s value, drops 0.10%, at 105.100, while the US 10-year bond yield rallies nine bps, up at 2.88%, weighing on the white metal prices.
What to watch
By Friday, the US economic calendar will feature the University of Michigan Consumer Sentiment alongside inflation expectations.
Silver (XAGUSD) Key Technical Levels
Reuters reported that the Bank of Mexico hiked its benchmark interest rate by three-quarters of a percentage point to a record rate of 8.5% on Thursday, mirroring the US Federal Reserve's most recent policy decision as inflation surged to an over two-decade high.
The five board members of Banxico, as the central bank is known, voted unanimously for the second 75 basis points rate hike in a row, saying they would "assess the magnitude of the upward adjustments in the reference rate for its next policy decisions based on the prevailing conditions."
- Mexico central bank sets benchmark interest rate at 8.5%.
- Mexico central bank say board was unanimous on rate decision.
- Mexican central bank says the board will assess the magnitude of the upward adjustments in the reference rate for its next policy decisions based on the prevailing conditions.
- Mexico central bank says the balance of risks for the trajectory of inflation within the forecast horizon remains biased significantly to the upside.
- Mexico central bank says the board will thoroughly monitor inflationary pressures as well as all factors that have an incidence on the foreseen path for inflation and its expectations.
- Mexico's central bank says in view of greater-than-anticipated inflationary pressures, forecasts for headline and core inflation were revised upwards up to the third quarter of 2023.
- Mexico's central bank says among key global risks are those associated with the pandemic, the persistence of inflationary pressures, the intensification of geopolitical turmoil, and greater adjustments in economic, monetary and financial conditions.
- Mexico central bank says recent information indicates that during the second quarter of 2022, economic activity grew at a similar rate to that observed during the first quarter, thus continuing its gradual recovery, while slack conditions decreased.
- Mexico central bank says an environment of uncertainty prevails, while the balance of risks remains biased to the downside.
- Mexico central bank sees average annual headline inflation of 8.1% for the fourth quarter 2022.
USD/MXN trimmed the losses of the day and is now printing at 19.9611.
- AUD/USD is being pressured as the US dollar recovers in midday New York trade.
- The bears are moving in with US yields also rallying and as US stocks tail-off.
The US dollar DXY, and the US 10-Year Treasury yields were lower which had been giving US stocks and higher beta currencies such as the Aussie a lift at the start of the New York day, extending the overnight gains. AUD/USD rallied from a low of 0.7062 to a high of 0.7136 on Thursday, extending the prior day's range of between 0.6946-0.7109.
More inflation data released on Thursday rhymed with that of Wednesday's and embedded the hope that the Federal Reserve will be able to cool down price growth without shoving the economy into the deep freeze of recession. US stocks were higher in early trade on the fresh evidence of calming inflation but they have started to ease in midday trade as investors take profits and in the wake of a sell-off across the US dollar forex pairs with the 10-year yield rallying. At the time of writing, the 10-year yield is 3.41% higher on the day and has made a fresh high for the day of 2.880%. The move coincides with the 30-year bond auction. Meanwhile, the DXY, an index that measures the greenback vs. a basket of currencies is now back to near flat for the day at 105.14. The index has recovered from a low of 104.646.
July PPI month-over-month and year-over-year came in below expectations. In fact, the month-over-month reading was actually negative. Core readings were below the Reuters poll on a month-over-month basis and in-line on a year-over-year basis. The report lessened the prospects of the Fed up interest rates by 75 basis point for the third time in a row at the conclusion of its September policy meeting. Instead, CME Fed funds futures now predict a smaller 50 bp rate hike by nearly two to one.
Meanwhile, commenting on the US dollar and in light of yesterday's CPI data, analysts at Brown Brothers Harriman said, ''we stress that there is a lot of noise right now even as markets remain thin during the summer months.''
''We are likely to continue seeing violent moves in the markets in the coming weeks as markets continue to struggle to find a stable and sustainable macro outlook to trade on. Recession? Soft landing? Tightening? Easing? All of these questions remain unanswered right now and we will not know the truth for months, if not quarters.''
While the CPI data came in softer than expected, it has not changed the expected rate path of some Fed officials that spoke after the event. For instance, Neel Kashkari unleashed his inner hawk and said the July CPI data did not change his expected rate path, though he was happy to see inflation surprise to the downside. Kashkari stressed that the Fed is far from declaring victory over inflation and stressed that recession “will not deter me” from getting to the 2% target.
Meanwhile, Mary Daly, President of the San Francisco Fed did not rule out a third consecutive 0.75 percentage point rate rise at the central bank’s next policy meeting in September, although she signalled her initial support for the Fed to slow the pace of its interest rate increases, the Financial Times reported. "We have a lot of work to do. I just don’t want to do it so reactively that we find ourselves spoiling the labour market," the central banker said while also indicating that she would be watching the next consumer price and non-farm payroll reports to better calibrate her decision.
RBA in focus
As for the Aussie dollar, Net AUD short positions increased for a third straight week reflecting the recent weakness in commodity prices. Markets are anticipation that the Reserve Bank of Australia will hike another 50 bps RBA rate hike this month. The central bank recently stated that the domestic economy has been resilient, forecasting the unemployment rate to drop to 3.25% over the coming months. Headline and underlying inflation are expected to peak around the end of this year and the Bank's cash rate assumption is for a year-end 2022 target rate of 3%. With the target cash rate currently at 1.85%, the RBA assumes another 115bps of hikes over the next 4 meetings. In other words, the RBA is placing some chance of delivering a 50bps hike and 3x25bps hikes for a total of 125bps in hikes by year-end. This would take the year-end 2022 cash rate to 3.10%.
- The NZD/USD advances for the second straight day, up in the week by 3.03%.
- The US PPI for July rose by 9.8% YoY, less than estimates and last month’s reading.
- US Initial Jobless Claims jumped for two consecutive weeks, hinting the labor market is moderating.
The NZD/USD climbs above the 100-day EMA around 0.6439, courtesy of investors’ positive sentiment, as reports emerging from the US showed that prices might be peaking. Still, even though Fed speakers cheered and welcomed the information, they held to their hawkish stance. Given the abovementioned scenario, the greenback remains soft during the day.
At the time of writing, the NZD/USD is trading at 0.6444, after hitting a daily low below the 0.6400 figure, gaining 0.68%.
Sentiment remains positive, with US equities registering gains between 0.14% and almost 1%. The US Producer Price Index for July slowed its pace to 9.8% YoY, vs. estimations of 10.4%. Additionally, the so-called core PPI, which strips food and energy, rose by 7.6% YoY, in line with measures.
Meanwhile, US Initial Jobless Claims for the last week, which ended on August 6, increased by 262K, less than estimations, but began to show signs of moderation. Worth noticing that claims jumped for the second consecutive week, further confirming the latter.
The US Dollar Index, a gauge of the buck’s value against a basket of six rivals, edges down 0.12% at 105.055, a tailwind for the NZD/USD.
Data-wise, the New Zealand calendar reported that Visitor Arrivals rose by 83.5%, crushing expectations of 15%.
What to watch
The New Zealand economic docket will feature Business PMI for July, estimated at 49.2, alongside Food Inflation, estimated at 6.5%. On the US front, the US calendar will reveal the University of Michigan Consumer Sentiment, estimated at 52.5, and Consumer Inflation expectations for a 5-year horizon, forecasted at 2.8%.
NZD/USD Key Technical Levels
- Treasury bonds decline even after another reading below expectations of US inflation.
- Gold fails to rise above $1800 and correct lower.
- Immediate support is seen at $1785, followed by $1774.
Gold turned negative for the day after a reversal from near $1800. XAUUSD peaked at $1799 during the American session and then turned to the downside falling toward $1785.
Gold not shining
Data released on Thursday showed the Producer Price Index in the US dropped by 0.5% in July, and the annual rate fell to 9.8%, against expectations of a 0.2% monthly advance. On Wednesday, it was reported the Consumer Price Index was unchanged in July against expectations of a 0.2% gain. The decline in inflation weighed on the US dollar.
Market participants still expect the Federal Reserve to hike by at least 50 basis points at the September meeting. However, US yields are up even amid the probability of an inflation peak in the US. The US 10-year yield is up 1.90% at 2.83%, while the 2-year is at 3.20%, both at the highest level in almost a week.
The increase in US yields limited the upside in gold. XAU/USD’s inability of holding above 1800$, even after the recent US data, rises doubts about the rally. The immediate support is seen at $1785 followed by the weekly opening at $1774. If the yellow metal consolidates above $1800 more gains seem likely.
Technical levels
- USD/CAD extended its losses for the second straight day as sellers eye a break of the 200-DMA.
- July’s US inflation reports show signs of peaking, with CPI at 9% YoY and PPI at 10% YoY, below their previous month’s readings.
- Traders’ focus shifts toward the University of Michigan Consumer Sentiment and Inflation Expectations.
The USD/CAD slides towards the 200-day EMA on Thursday due to a risk-on impulse propelled by additional US inflation data, which completes the puzzle alongside consumer inflation, leaving to the Fed, the decision if US inflation has already peaked or not. Also, the labor market began to show signs of moderation. All those factors weighed on the greenback, which, as portrayed by the US Dollar Index, is down 0.24% at 104.960.
The USD/CAD is trading at 1.2738 under its opening price after hitting a daily high at 1.2792, but as North American traders got to their desks, tumbled the major to its daily low at 1.2727, 13 pips below the 200-day EMA.
USD/CAD falls on US inflation slows, easing Fed's pressure
Investors’ mood is positive, as reflected by EU and US equities trading in the green. A report from the US Labor Department showed that wholesale prices cooled down, with the PPI increasing by 9.8% YoY, lower than foreseen. Moreover, the core PPI, which excluded volatile items, came aligned to estimations of 7.6% YoY, less than June’s 7.9%.
Regarding the labor market, US Initial Jobless Claims for the week ending on August 6 rose 262K, less than 263K expected but jumped for the second-consecutive week.
Given the abovementioned, the USD/CAD dropped as US inflation on both sides of the spectrum slid. Therefore, traders moved towards riskier assets in the FX space, namely the antipodeans and commodity-linked currencies, like the Loonie.
That said, crude oil prices rose for the second consecutive day, underpinning the CAD after hitting a weekly low of $87.25 PB. At the time of writing, Western Texas Intermediate (WTI), the US crude oil benchmark, exchanges hands at $94.48 PB.
Hence, USD/CAD traders should also be aware of a possible break of the 200-DMA, which, once decisively broken, exposes the 1.2700 mark as sellers’ next challenge.
What to watch
On Friday, the US economic calendar will feature the University of Michigan Consumer Sentiment, alongside inflation expectations.
USD/CAD Key Technical Levels
- Fresh US data shows a slowdown in inflation.
- Banxico is expected to hike rates by 75 basis points on Thursday.
- USD/MXN falls for the fourth consecutive day.
The USD/MXN printed a fresh monthly low on Thursday at 19.90. It remains near the bottom, under pressure ahead of Banxico’s decision and amid a weaker US dollar.
Economic data in the US shows inflation slowed down in July. The Consumer Price Index remained unchanged while the Produce Price Index dropped by 0.5% according to data released on Thursday.
The decline in inflation eased expectations about further aggressive tightening from the Federal Reserve. Still, market participants see a 50 basis points rate hike at the next meeting in September.
The US dollar remains under pressure. The greenback tumbled on Wednesday and so far on Thursday is holding onto those losses, unable to recover ground on a sustained basis, even as US yields soar. The US 10-year climbed from 2.75% to 2.84%, the 2-year rose to 3.20% and the 30-year to 3.11%.
Emerging market currencies in general are rising against the US dollar supported also by the improvement in risk sentiment. The Dow Jones is up by 0.47% and the S&P by 0.37%, adding to Wednesday’s strong gains.
The Bank of Mexico will announce its decision in a few hours. The central bank is expected to raise the key rate from 7.75% to 8.50% as inflation shows no signs of a slowdown. The CPI rose in July to 8.15%, the highest annual rate since December 2002, well above Banxico’s 2-4% target. “The swaps market is pricing in 175 bp of further tightening over the next 6 months that would see the policy rate peak near 9.50% but we see some upside risks”, said analysts at Brown Brothers Harriman.
Technical levels
- US July PPI drops unexpectedly in July while jobless claims hit monthly highs.
- The dollar remains in negative territory, even as US yields rise.
- EUR/USD up for the fifth consecutive day, holds under Wednesday’s top.
The EUR/USD failed to break Wednesday’s highs around 1.0355 and pulled back. It is hovering around 1.0325 as the US dollar attempts to recover during the American session as US yield surge.
Other indicator shows a slowdown in US inflation
Data released on Thursday showed the Producer Price Index in the US dropped by 0.5% in July, and the annual rate slid to 9.8%, against expectations of a 0.2% advance. On Wednesday, it was reported the Consumer Price Index was unchanged in July against expectations of a 0.2% gain. On Thursday, a report from US Labor Department informed Initial Jobless Claims rose to 262K in the week ended August 6, the highest level since November. Continuing Claims hit monthly highs.
US yields are rising sharply despite the signs of a slowdown in inflation. Market participants continue to see an increase in the Fed Fund rate at the next meeting by at least 50 basis points. The US 10-year yield stands at 2.84%, the highest in almost a week, while the 30-yield is at the highest level since July 21 at 3.10%. The US Dollar Index is falling for the fourth consecutive day trading around 105.00, after finding support again above 104.60.
The EUR/USD peaked at 1.0363 after the beginning of the American session, slightly below yesterday’s high. It failed to break and retreat. So far it found support at 1.0320. A break lower would expose the next support at 1.0305, followed by the daily low at 1.0274. The technical outlook looks bullish as long as EUR/USD holds above 1.2060/80.
Technical levels
- The GBP/USD drops almost 0.05% amidst a risk-off impulse while the US dollar weakens.
- US prices paid by producers easied, while unemployment claims jumped for the second consecutive week.
- GBP/USD Price Analysis: Retreated from a descending-channel trendline, eyes a break below 1.2200.
GBP/USD edges lower off the weekly highs around 1.2276 near a top-trendline of a descending channel, amidst an upbeat sentiment spurred by a cooler-than-expected US inflation report, now on the side of producers. Further, the US labor market shows signs of ease, weighing on the greenback, underpinned by a hawkish Fed from YTD.
That said, the GBP/USD is trading at 1.2204, down almost 0.05%. Earlier in the day, the pound retraced some of Wednesday’s gains, reaching a daily low at 1.2182, before hitting a daily high at 1.2249. Nevertheless, once the dust settled, cable meanders around current price levels.
The US Department of Labor released another piece of the puzzle regarding inflation. The Producer Price Index (PPI), also known as prices paid by producers, rose by 9.8% YoY, less than the 10.4% estimates and less than June’s reading. In the meantime, the so-called core PPI, which excludes volatile items, followed suit, increasing by 7.6%, unchanged compared to forecasts, but 0.3% less than the previous month.
The data suggests that inflationary pressures on the wholesale side have begun to ease. That would temper the pace of prices paid by consumers in upcoming months. Additionally, the survey added that there are indications that supply-chain conditions are improving.
At the same time, the US Initial Jobless Claims for the week ending on August 6 jumped by 262K less than forecast but rose for the second-consecutive week.
On the UK’s side, the Bank of England (BoE) Chief Economist Huw Pill said that the bank would need to double down on the 2% inflation target on Wednesday. He added that “higher rates in the short term” could also mean some “slowing in the economy.”
Given that the Bank of England has hiked six times since December 2021, Pill added that the effects of measures taken would be felt at the end of 2023.
Earlier in the week, BoE’s Deputy Governor Dave Ramsden backed the BoE’s plan to sell its stock of Gilts, even if an economic slowdown “forces” the bank to cut rates.
Dave Ramsden said that he backs up the need to raise rates further while adding that due to the “extraordinary period where a lot is changing,” he won’t make predictions of where the Bank Rate will end.
What to watch
Friday’s UK calendar is packed, reporting GDP, Industrial Production, and the Balance of Trade. On the US front, the University of Michigan Consumer Sentiment, alongside inflation expectations.
GBP/USD Price Analysis: Technical outlook
The GBP/USD exchange rate is located near a two-month-old top-trendline of a descending channel, briefly broken yesterday. However, the false breakout is a sign of buyers’ weakness, with the spot price tumbling within the boundaries of the previously mentioned channel, opening the door for selling pressure.
To the upside, the GBP/USD crucial ceiling level to break would be 1.2300. Once cleared, it could send the pair towards the 100-day EMA at 1.2432. On the flip side, a breach of 1.2200 would pave the way toward the 20-day EMA at 1.2085.
GBP/USD is capped at key 1.2270 resistance. A break above here could clear the path for substantial gains, economists at Scotiabank report.
GBP/USD on the cusp of a potentially bullish technical break out
“Key resistance at 1.2270 stands in the way of the GBP and a possibly sharp (+4%) squeeze higher, as improbable as this might sound.”
“Cable has developed an inverse head and shoulders reversal through Jun/Jul but the neckline trigger at 70 held yesterday’s test. Progress here is, however, time sensitive and a break higher should happen sooner, rather than later, if it is to happen at all – otherwise 1.2270 becomes a wall, rather than a springboard.”
Economists at Scotiabank do note that technical signals hint at a potentially positive outlook for the EUR/USD. The pair could surge towards 1.05/06 on a break past 1.0380/85.
Techs lean bullish
“EUR/USD renewed buying pressure through early European trade has built a solid, short-term base around 1.0275 (40-day MA and former resistance, now support) for a renewed attack on yesterday’s high just under 1.0370 (May and June lows at 1.0360, therefore resistance).”
“Spot is nearing the top of the bear channel in place since Feb (1.0380/85); a breakout should confer more strength on the EUR and prompt a rise to 1.05/1.06.”
- USD/TRY keeps the side-lined trading below 18.00.
- Türkiye Current Account deficit came at $3.46B in June.
- US Producer Prices contracted 0.5% MoM in July.
USD/TRY reverses two consecutive daily pullbacks and resumes the upside near 17.96 on Thursday.
USD/TRY holds on just below 18.00
Bulls keep pushing harder but there seems to be a huge resistance in the 18.00 neighbourhood so far.
Indeed, while the selling bias around the Turkish lira remained well in place in the past couple of weeks, the contention area around the 18.00 mark has so far held on pretty well.
In the domestic calendar, the Current Account deficit shrank to $3.46B in June (from $6.47B).
In the meantime, investors have started to shift their focus to the upcoming monetary policy meeting by the Turkish central bank (CBRT) on August 18, where consensus remains so far biased towards another “on hold” stance despite inflation ran at the fastest pace since 1998 at nearly 80% YoY in July.
What to look for around TRY
The upside bias in USD/TRY remains unchanged and stays on course to revisit the key 18.00 zone.
In the meantime, the lira’s price action is expected to keep gyrating around the performance of energy and commodity prices - which are directly correlated to developments from the war in Ukraine - the broad risk appetite trends and the Fed’s rate path in the next months.
Extra risks facing the Turkish currency also come from the domestic backyard, as inflation gives no signs of abating (despite rising less than forecast in July), real interest rates remain entrenched in negative figures and the political pressure to keep the CBRT biased towards low interest rates remains omnipresent. In addition, there seems to be no Plan B to attract foreign currency in a context where the country’s FX reserves dwindle by the day.
Key events in Türkiye this week: End year CPI Forecast, Industrial Production, Retail Sales (Friday).
Eminent issues on the back boiler: FX intervention by the CBRT. Progress (or lack of it) of the government’s new scheme oriented to support the lira via protected time deposits. Constant government pressure on the CBRT vs. bank’s credibility/independence. Bouts of geopolitical concerns. Structural reforms. Presidential/Parliamentary elections in June 23.
USD/TRY key levels
So far, the pair is gaining 0.92% at 17.9524 and faces the immediate target at 17.9874 (2022 high August 3) seconded by 18.2582 (all-time high December 20) and then 19.00 (round level). On the other hand, a breach of 17.1903 (weekly low July 15) would pave the way for 16.2471 (100-day SMA) and finally 16.0365 (monthly low June 27).
- USD/JPY turns lower for the second straight day and drops to over a one-week low on Thursday.
- The post-US CPI USD selling bias, sliding US bond yields continue to exert pressure on the pair.
- The risk-on impulse could undermine the safe-haven JPY and help limit the fall, for the time being.
The USD/JPY pair attracts fresh selling near the 133.30 region on Thursday and prolongs the previous day's rejection slide from the 50-day SMA. The intraday descent extends through the early North American session and drags spot prices to a one-week low, around the 131.75-131.70 area in the last hour.
The US dollar remains depressed near its lowest level since late June amid diminishing odds for a more aggressive rate hike by the Fed. Apart from this, a fresh leg down in the US Treasury bond yields narrows the US-Japan rate differential and benefits the Japanese yen, which, in turn, exerts downward pressure on the USD/JPY pair.
That said, the risk-on rally - as depicted by a strong performance across the equity markets - could keep a lid on any further gains for the safe-haven JPY. This, the divergent monetary policy stance adopted by the Fed and the Bank of Japan, should lend some support to the USD/JPY pair and limit the fall, at least for the time being.
From a technical perspective, bulls now look to the 131.50-40 strong horizontal resistance breakpoint to offer some support. This is closely followed by the 100-day SMA, around the 131.20 region, which if broken decisively would be seen as a fresh trigger for bearish traders and prompt aggressive technical selling around the USD/JPY pair.
The downward trajectory could then accelerate towards challenging the monthly swing low, around the 130.40-130.35 region touched on August 2. The next relevant support is pegged near the key 130.00 psychological mark, which should act as a pivotal point for traders and help determine the next leg of a directional move for the USD/JPY pair.
On the flip side, the 132.50-132.55 region now seems to cap any recovery move. Sustained strength beyond might trigger some short-covering and allow the USD/JPY pair to reclaim the 133.00 round-figure mark. Some follow-through buying, leading to a subsequent move above the daily high, around the 133.30 region, would negate the negative bias.
The USD/JPY pair might then climb to the 133.80-133.85 intermediate hurdle en route to the 134.00 mark and the 134.30 resistance zone. The upward trajectory could get extended toward the 135.00 psychological mark, above which bulls could aim to conquer the 50-day SMA strong barrier, currently around the 135.20-135.25 region.
USD/JPY daily chart
-637958224787537095.png)
Key levels to watch
- Gold attracts some dip-buying and climbs to $1,800 neighbourhood amid sustained USD selling.
- Diminishing odds for a larger Fed rate hike, sliding US bond yields continue to weigh on the USD.
- The risk-on impulse seems to be the only factor capping the upside for the safe-haven commodity.
Gold reverses an intraday dip to the $1,784-$1,783 region and climbs to a fresh daily high during the early North American session. Bulls, however, seem struggling to capitalize on the move and push the XAU/USD back above the $1,800 round-figure mark.
The US dollar struggles to attract any buyers and remains well within the striking distance of its lowest level since late June, which, in turn, offers some support to the dollar-denominated gold. The softer-than-expected US consumer inflation figures released on Wednesday forced investors to pare bets for a 75 bps Fed rate hike move at the September policy meeting. This, along with a fresh leg down in the US Treasury bond yields, further undermines the greenback and benefits the non-yielding yellow metal.
That said, the risk-on mood keeps a lid on any further gains for the safe-haven gold, at least for the time being. Signs that inflation might have peaked already continue to fuel speculations for a less aggressive policy tightening by the US central bank. The US Producer Price Index (PPI) released this Thursday reinforces market expectations and further boosts investors' confidence. This is evident from a strong performance around the equity markets, which seems to act as a headwind for the commodity.
Furthermore, the Fed is still expected to hike interest rates by at least 50 bps in September and might further contribute to capping the upside for gold. Hence, it would be prudent to wait for some follow-through buying beyond the $1,808 area - a five-week high touched on Wednesday - before positioning for any further appreciating move. Nevertheless, the intraday bounce favours bullish traders and suggests that any meaningful pullback could still be seen as a buying opportunity.
Technical levels to watch
XAU/USD is keeping the corrective momentum intact, as it remains below the $1,800 mark. In the view of strategists at TD Securities, gold’s price action may be revealing substantial selling interest.
Chinese bid in gold is reversing at a fast clip
“Gold's failure to break north of a key threshold for substantial short covering from CTA trend followers amid a miss in the highly anticipated US inflation data may be pointing to significant selling interest.”
“Strong physical demand may have exacerbated the short covering rally sparked by Chair Powell's FOMC speech, but we see evidence that the Chinese bid in gold continues to unwind.”
“The bar for additional CTA purchases continues to rise – prices now need to break north of $1,830 to catalyze a buying program from trend followers.”
- EUR/USD extends the upside momentum and retests 1.0350.
- Extra gains await on a break above 1.0390.
EUR/USD adds to the weekly rebound and revisits the 1.0350 region on Thursday.
The continuation of the ongoing upside looks favoured in the short term. Immediately to the upside emerges the August high at 1.0368 (August 10), an area coincident with the 55-day SMA.
The breakout of the latter should pave the way for a challenge of the 6-month resistance line around 1.0390. If the pair clears the latter, it could then accelerate the upside to, initially, the 100-day SMA at 1.0530.
In the longer run, the pair’s bearish view is expected to prevail as long as it trades below the 200-day SMA at 1.0901.
EUR/USD daily chart
- Initial Jobless Claims rose by 14,000 in the week ending August 6.
- US Dollar Index continues to push lower, trades below 105.00.
There were 262,000 initial jobless claims in the week ending August 6, the weekly data published by the US Department of Labor (DOL) showed on Thursday. This print followed the previous week's print of 248,000 (revised from 260,000) and came in slightly lower than the market expectation of 263,000.
Further details of the publication revealed that the advance seasonally adjusted insured unemployment rate was 1% and the 4-week moving average was 252,000, an increase of 4,500 from the previous week's revised average.
"The advance number for seasonally adjusted insured unemployment during the week ending July 30 was 1,428,000, an increase of 8,000 from the previous week's revised level," the DOL said.
Market reaction
The dollar stays under constant selling pressure on Thursday and the US Dollar Index was last seen losing 0.26% on the day at 104.92.
- Annual PPI in US fell at a stronger pace than expected in July.
- The dollar stays under bearish pressure with the DXY dropping below 105.00.
The Producer Price Index (PPI) for final demand in the US declined to 9.8% on a yearly basis in July from 11.3% in June, the data published by the US Bureau of Labor Statistics revealed on Thursday. This print came in lower than the market expectation of 10.4%.
The annual Core PPI fell to 7.6% from 8.2%, matching the market expectation. On a monthly basis, the Core PPI fell by 0.5% following June's 1% increase.
Market reaction
The dollar came under renewed selling pressure with the initial reaction and the US Dollar Index was last seen losing 0.4% on the day at 104.82.
UOB Group’s Senior Economist Julia Goh and Economist Loke Siew Ting comment on the publication of the Malaysian jobs report.
Key Takeaways
“Malaysia’s labour market continues its steady march towards full recovery with the number of employed persons and unemployment rate improving further. Total number of employed persons rose for the 11th month by 36.3k to 15.94mn in Jun. The non-seasonally adjusted unemployment rate edged lower to 3.8% while the seasonally adjusted rate fell to 3.6%, a shade above the prepandemic unemployment rate of 3.3%.”
“Employment gains recorded in the services sector particularly in food & beverages, wholesale & retail trade, and administrative & support services activities. Agriculture, manufacturing and construction sectors also saw job gains while the mining & quarrying sector recorded further declines in employment. The worker segment that is temporarily not working but had jobs to return to declined further to 87.8k (vs 801.1k in Jun 2021). Workers who are unemployed for more than 12 months also eased to 35.0k or 6.6% of total actively unemployed (vs 62.9k or 9.8% in Jun 2021).”
“According to the Monster Employment Index (MEI), Malaysia’s job market recorded 31% growth in job demand with 5% increase in hiring activities in Jun. Several key industries continue to face labour shortages as reopening activities spur demand. Despite the improvement, the employment outlook waned in 2Q22 amid more cautious consumer and business sentiment. Elevated costs, supply chain disruptions, and rising recession risks could moderate the recruitment drive. We maintain our yearend unemployment rate target of 3.6% (BNM est: average ~4.0%).”
In its monthly report published on Thursday, the Organization of the Petroleum Exporting Countries (OPEC) said that it lowered the 2022 full-year demand growth forecast to 3.1 million barrels per day (bpd) from 3.36 million bpd, as reported by Reuters.
Additional takeaways
"2023 world oil demand to rise by 2.7 million bpd, unchanged from previous forecast."
"2022 global economic growth forecast lowered to 3.1% (prev. 3.5%), 2023 view trimmed to 3.1% with significant downside risks prevailing."
"Refined product markets in the second half of the year is likely to see seasonal support from transport fuels, fuel sales could benefit from moderating product prices."
"OPEC's oil output rose by 162,000 bpd in July to 28.84 million bpd."
Market reaction
Crude oil prices showed no immediate reaction to this publication and the barrel of West Texas Intermediate was last seen rising 1.5% on a daily basis at $92.90.
- DXY revisits the sub-105.00 region once again on Thursday.
- A drop below 104.60 opens the door to extra losses.
DXY remains well on the defensive and puts the 105.00 support under further pressure on Thursday.
If the selling bias picks up extra pace, the dollar risks a deeper pullback to, initially, the August low at 104.63 (August 10), just ahead of the 6-month support line, today near 104.50.
Looking at the broader scenario, the bullish view in the dollar remains in place while above the 200-day SMA at 99.98.
DXY daily chart
- AUD/USD catches fresh bids on Thursday and climbs to a two-month high amid weaker USD.
- Diminishing odds for a larger Fed rate hike in September, the risk-on mood weighs on the USD.
- The technical set-up favours bullish traders and supports prospects for further near-term gains.
The AUD/USD pair attracts some dip-buying on Thursday and steadily climbs to a fresh two-month high during the mid-European session. The pair is currently trading around the 0.7110-0.7115 region, with bulls looking to build on the overnight move beyond the previous monthly high.
The US dollar languishes near its lowest level since late June and offers some support to the AUD/USD pair. Softer US CPI report forced investors to trim their bets for a more aggressive Fed rate hike in September. This, along with a generally positive tone around the equity markets, further undermines the safe-haven buck and benefits the risk-sensitive aussie.
From a technical perspective, spot prices now seem to have found acceptance above the 38.2% Fibonacci retracement level of the April-July downfall. Furthermore, the recent goodish bounce from over a two-year low has been along an ascending channel, which points to a short-term bullish trend and supports prospects for further gains.
The constructive setup is reinforced by the fact that oscillators on the daily chart have been gaining positive traction and are still far from being in the overbought territory. The top boundary of the aforementioned channel, meanwhile, coincides with the very important 200-day SMA and should now act as a key pivotal point.
Bulls might wait for a sustained strength beyond the said confluence hurdle before positioning for a move towards the 50% Fibo. level, around the 0.7170-0.7175 region. Some follow-through buying should allow the AUD/USD pair to reclaim the 0.7200 mark and climb further towards the next relevant hurdle near the 0.7225-0.7230 zone.
On the flip side, any meaningful slide could be seen as a buying opportunity around the 0.7050-0.7045 area, or the 38.2% Fibo. level. This should help limit the downside near the 0.7000 psychological mark. That said, failure to defend the said support levels could drag the AUD/USD pair to the 23.6% Fibo. level, around the 0.6900 mark.
The latter coincides with the ascending channel support and should act as a strong base for spot prices, which if broken decisively would pave the way for a further near-term downfall. The AUD/USD pair could then accelerate the fall towards intermediate support near the mid-0.6800s before dropping to the 0.6800 round-figure mark.
AUD/USD daily chart
-637958165726648017.png)
Key levels to watch
Senior Economist Julia Goh and Economist Loke Siew Ting at UOB Group comment on the recently published GDP figures in the Philippines.
Key Takeaways
“The Philippines’ economy held up its strong growth momentum with 2Q22 GDP growing 7.4% y/y (1Q22: revised down to +8.2% from +8.3% previously). The reading exceeded our estimate (+6.3%) but came in below Bloomberg consensus (+8.4%). It was largely credited to the easing of COVID19 restrictions on mobility, election-related spending, and continued government policy support during the quarter.”
“We raise our 2022 full-year GDP growth forecast to 7.0% (from 6.5% previously, official est: 6.5%7.5%), purely reflecting the robust economic growth of 7.8% in 1H22. For 2H22, we continue to expect the growth momentum to be considerably held back to around 6.4% as headwinds to growth have intensified. To counter lingering downside risks, a safe full reopening of the economy with higher national vaccination rates against COVID-19, broad policy continuity post presidential elections, and resilient overseas cash remittances are key to sustain the growth momentum in the near term.”
“Both the upbeat inflation for Jul and 2Q22 GDP numbers justify a continuation of monetary policy normalisation this month (Aug) after the unscheduled 75bps hike last month (14 Jul) and two back-to-back increases of 25bps each in May and Jun. We have revised our BSP rate call last Fri (5 Aug) for a 50bps hike in the RRP rate to 3.75% on 18 Aug (vs 25bps previously).”
- EUR/JPY attempts a mild rebound following Wednesday’s drop.
- The August top at 138.39 caps the upside for the time being.
EUR/JPY bounces off weekly lows in the 136.60/50 band and reclaims part of the ground lost on Wednesday’s strong retracement.
So far, the August recovery appears to have met some initial resistance in the 138.40 zone (August 10). If the cross regains upside traction and surpasses this level, it could then extend the move to, initially, the 55-day SMAs, today at 139.06.
While above the 200-day SMA at 133.87, the outlook for the cross is expected to remain constructive. This contention zone also appears underpinned by the proximity of the August low at 133.39 (August 2).
EUR/JPY daily chart
EUR/USD climbed to its highest level in a month at 1.0368 on Wednesday. A sustained break above the 1.0360 area would clear the way towards June 27 high near 1.0615, economists at BBH report.
ECB tightening expectations have stabilized
“The euro rally yesterday ran out of steam near 1.0360, which is the 62% retracement objective of the June-July drop. It is testing that level again today and a clean break above would set up a test of the June 27 high near 1.0615.”
“WIRP suggests a 50 bps hike is nearly 90% priced in for September 8. The swaps market is pricing in 125-150 bps of tightening over the next 12 months that would see the deposit rate peak between 1.25-1.50%, steady from the start of this week but up from 125 bps at the start of last week.”
- EUR/GBP regains positive traction on Thursday and climbs back closer to the overnight swing high.
- The BoE’s gloomy outlook is seen as a key factor behind the British pound’s underperformance.
- The post-US CPI USD weakness benefits the euro and remains supportive of the intraday move up.
The EUR/GBP cross catches fresh bids on Thursday and prolongs its intraday positive move through the first half of the European session. The momentum pushes spot prices back above mid-0.8400s in the last hour, closer to over a two-week high touched the previous day.
The back of the Bank of England's gloomy outlook continues to act as a key factor behind the British pound's relative underperformance and offers some support to the EUR/GBP cross. It is worth recalling that the UK central bank painted a particularly bleak picture last week and warned that a prolonged economic recession would start in the fourth quarter.
The shared currency, on the other hand, draws some support from the softer US CPI-induced US dollar weakness. This provides an additional lift to the EUR/GBP cross and contributes to the intraday positive move. That said, Europe's energy supply concerns, which could drag the Eurozone economy faster and deeper into recession, could cap gains for the cross.
In the latest development, the supply of Russian oil to three European countries through Ukraine was suspended as Western sanctions prevented the latter from accepting transit fees. This makes it prudent to wait for strong follow-through selling before confirming that the EUR/GBP cross has formed a near-term bottom and positioning for any further appreciating move.
There isn't any major market-moving economic data due for release on Thursday, either from the Eurozone or the UK. Hence, the market focus now shifts to the Preliminary UK Q2 GDP report, due for release on Friday. The data would play a key role in influencing the near-term sentiment surrounding sterling and provide a fresh directional impetus to the EUR/GBP cross.
Technical levels to watch
The German government respects the European Central Bank's (ECB) independence and will continue to defend it, German Chancellor Olaf Scholz said on Thursday, as reported by Reuters.
"The European Union must handle these difficult times in solidarity, this is something I explicitly commit to," Scholz told journalists. "I believe that, as the biggest country with the greatest economy and the largest population at the centre of Europe, we have a special task."
Market reaction
These comments don't seem to be having a noticeable impact on risk sentiment with Germany's DAX 30 Index trading flat on the day at 13,696.
UOB Group’s Senior Economist Julia Goh and Economist Loke Siew Ting assess the latest foreign capital flows data in the Malaysian economy.
Key Takeaways
“Malaysia recorded further foreign outflows of MYR3.4bn in Jul albeit narrower compared to MYR5.4bn in the previous month. This has reversed year-to-date cumulative flows to an outflow of MYR0.6bn in Jan-Jul (vs inflows of MYR2.9bn in 1H22). Jul’s net foreign outflows were concentrated in MYR debt securities (-MYR3.5bn) against a small net inflow into equities (+MYR0.1bn).”
“Bank Negara Malaysia (BNM)’s foreign reserves increased by USD0.2bn m/m to USD109.2bn as at end-Jul after dropping the most in nearly seven years by USD3.8bn m/m to USD109.0bn in the preceding month. The latest reserves position is sufficient to finance 5.8 months of imports of goods & services and is 1.1 times total short-term external debt.”
“Foreign capital flows are likely to remain volatile in 2H22 and into 2023 as investors weigh global recession risk, geopolitics and inflation against the Fed’s aggressive monetary tightening. Tighter global financial conditions, negative real interest rates and a stronger USD will continue to drive flow dynamics and investors’ risk appetite for emerging market assets. In focus are China’s economic outlook and renewed geopolitical tensions with US that could further weigh on Asian FX including MYR in the near term.”
- USD/CHF drops to a fresh multi-month low amid the emergence of fresh USD selling.
- Diminishing odds for a later Fed rate hike in September continue to weigh on the USD.
- The risk-on mood undermines the safe-haven CHF and helps limit any further downside.
The USD/CHF pair witnessed some selling for the fourth successive day and drops to a four-month low during the first half of the European session. Spot prices, however, show some resilience below the 0.9400 mark and quickly recover around 20 pips in the last hour.
The US dollar struggles to capitalize on the previous day's bounce and remains sluggish near its lowest level since late June touched in the aftermath of softer US consumer inflation figures on Wednesday. This, in turn, exerts some downward pressure on the USD/CHF pair, though sustained weakness below the 0.9400 mark is needed to confirm a bearish breakdown below a technically significant 200-day SMA.
The weaker-than-expected US CPI report forced investors to scale back expectations for a larger 75 bps Fed rate hike move in September. That said, the overnight hawkish comments by Fed officials should act as a tailwind for the greenback. Apart from this, a generally positive tone around the equity markets seems to undermine the safe-haven swiss franc and limit losses for the USD/CHF pair, at least for now.
The Fed, meanwhile, is still expected to hike interest rates by 50 bps points at the September policy meeting. This, in turn, supports prospects for the emergence of some dip-buying around the USD and further warrants some caution for aggressive bearish traders. Market participants now look forward to the US Producer Price Index (PPI) for a fresh impetus later during the early North American session.
Technical levels to watch
- Gold price fails to capitalize on broad US dollar weakness and sluggish Treasury yields.
- US CPI data shows the first sign of peak inflation but not enough to dissuade hawkish Fed.
- XAU/USD bears could extend control below the key $1,784 support.
Gold price is keeping the corrective momentum intact, as it remains below the $1,800 mark. The bright metal is on its retreat from monthly highs of $1,808 after softer US inflation triggered a sharp sell-off in the dollar alongside the Treasury yields. Odds of a 75 bps September Fed rate hike have dropped to nearly 43% vs. 68% seen pre-inflation data release. The greenback is resuming its downtrend this Thursday, as markets continue to believe that a one-time softening in the price pressure is unlikely to dissuade the Fed from altering its monetary policy course. Therefore, the non-interest-bearing gold remains under pressure, helped by sluggish price action in the yields. Although the downside appears cushioned (for now) amid resurfacing US-China trade tensions and renewed covid lockdowns in some of the Chinese cities and towns.
Also read: Gold Price Forecast: Bear cross outweighs softer US inflation, 50 DMA support at risk
Gold Price: Key levels to watch
The Technical Confluence Detector shows that the gold price is challenging the $1,787 support, which is the SMA5 one-day and the previous day’s low.
The next crucial downside cap for XAU/USD is aligned at $1,784, the convergence of the SMA50 one-day and the Fibonacci 23.6% one-week.
Should sellers manage to find a strong foothold below the latter, a fresh drop towards the Fibonacci 38.2% one-week at $1,780 will be on the table.
The line in the sand for gold bulls is seen at the confluence of the SMA10 one-day and the pivot point one-day S2 at $1,775.
On the upside, Fibonacci 23.6% one-day at $1,792 guards the immediate upside, above which the $1,795 supply zone will be tested. That area is the intersection of the Fibonacci 38.2% one-day, the previous week’s high and the pivot point one-week R1.
Bulls will then target the Fibonacci 61.8% one-day at $1,800, bringing the monthly high of $1,808 back in sight.
Here is how it looks on the tool
About Technical Confluences Detector
The TCD (Technical Confluences Detector) is a tool to locate and point out those price levels where there is a congestion of indicators, moving averages, Fibonacci levels, Pivot Points, etc. If you are a short-term trader, you will find entry points for counter-trend strategies and hunt a few points at a time. If you are a medium-to-long-term trader, this tool will allow you to know in advance the price levels where a medium-to-long-term trend may stop and rest, where to unwind positions, or where to increase your position size.
Economist at UOB Group Ho Woei Chen, CFA, reviews the latest trade data in the Chinese economy.
Key Takeaways
“China’s export rebound continued into Jul while import maintained a sluggish momentum in USD terms, thus bringing the trade surplus to a fresh record high of US$101.26 bn from previous high of US$97.94 bn in Jun.”
“Export growth in Apr-Jul averaged 14.2% y/y compared to 15.8% y/y in 1Q22, suggesting that activities have likely normalised from Shanghai’s two-month lockdown with the recovery over Jun-Jul.”
“We see downside risks to China’s trade outlook due to increasing external headwinds (higher inflation, sharper pace of global monetary policy tightening), uncertainties from COVID-19 and Russia-Ukraine war that could further disrupt the global supply chain, and the worsening relations with US and Taiwan.”
“Given the high comparison base in 2021 when China’s export and import rose 29.9% and 30.1% respectively, we expect a more moderate growth of 10-12% for export and around 5% for import this year.”
Speaking at the summer news conference on Thursday, Chancellor Olaf Scholz said that “Germany will steer a way through the difficult energy crisis.”
Additional quotes
“German gas reserves to be fuller than last year.”
“The government to put forward the third package to tackle the crisis.”
“Tax relief is certainly part of an overall package to help citizens.”
“Securing prosperity is a central reform project of this government. “
“I do not think we will see unrest in this country.”
Market reaction
EUR/USD was last seen trading at 1.0331, higher by 0.33% on the day.
GBP/USD has gone into a consolidation phase early Thursday following Wednesday's impressive rally. The pair is set to remain bullish as long as 1.2175 support holds, FXStreet’s Eren Sengezer reports.
1.2350 aligns as next bullish target on a break above 1.2275
“In case the market mood continues to sour, GBP/USD could struggle to stretch higher and vice versa.”
“On the downside, 1.2175 (Fibonacci 23.6% retracement of the latest uptrend) forms strong support. In case the pair drops below that level, bears could show interest and drag cable lower toward 1.2150 (50-period SMA on the four-hour chart) and 1.2100 (Fibonacci 38.2% retracement, 100-period SMA).”
“1.2275 (the end-point of the uptrend) aligns as next important hurdle ahead of 1.2300 (psychological level), 1.2350 (static level) and 1.2400 (psychological level, static level).”
The Jpanaese yen has gotten some relief lately. Nevertheless, economists at Nordea expect the USD/JPY to reach 140 again.
Times of weaker JPY to persist
“The Fed’s continued path towards tight monetary policy together with most other G10 central banks hiking will keep the pressure on the JPY.”
“Without any changes from the Bank of Japan, which we don’t expect in the foreseeable future, the door will be open for the JPY to reach 140 once more.”
In the view of economists at Nordea, the EUR/USD has more downside left. The pair could easily dip below parity in the months to come.
USD should do well because of its status as the ultimate safe haven
“We believe we are far from a Fed pivot to dovish policy and thus not yet at the peak for the USD.”
“EUR/USD is set to fall below parity to bottom at around 0.97 at the turn of the year.”
“We see the US economy doing better than most other major economies ahead. It has become clear that Europe and Asia will pay a hefty price to keep the lights and heating on this winter, while the US will benefit from its energy independence. Even if you don’t agree and instead expect the US economy to crash soon, the USD should do well because of its status as the ultimate safe haven.”
- USD/JPY turns lower for the second straight day on Thursday amid renewed USD selling.
- Diminishing odds for a larger Fed rate hike in September continue to weigh on the buck.
- The Fed-BoJ policy divergence and a positive risk tone could undermine the safe-haven JPY.
- A convincing break below the post-US CPI swing low is needed to confirm a fresh breakdown.
The USD/JPY pair retreats nearly 90 pips from the daily high and drops to a fresh daily low during the First half of the European session on Thursday. The pair is currently placed below mid-132.00s, still well above a one-and-half-week low touched the previous day.
The US dollar struggles to preserve its modest intraday recovery gains and meets with a fresh supply, which, in turn, is seen exerting some downward presure on the USD/JPY pair. Softer US inflation figures released on Wednesday forced investors to trim their bets for a more aggressive policy tightening by the Fed. Apart from this, a modest downtick in the US Treasury bond yields continues to weigh on the buck.
The Fed, however, is still expected to hike interest rates by at least 50 bps at the September policy meeting. In contrast, the Bank of Japan has repeatedly said that it will stick to its ultra-easy policy settings. The resultant Fed-BoJ monetary policy divergence, along with a generally positive tone around the equity markets, could undermine the safe-haven Japanese yen and offer support to the USD/JPY pair.
From a technical perspective, the overnight rejection slide from the 50-day SMA was seen as a fresh trigger. That said, it would be prudent to wait for a convincing break below the 132.00 mark, or the post-US CPI low before positioning for any further depreciating move. On the flip side, the daily swing high, around the 133.30 region, could now act as an immediate strong hurdle for the USD/JPY pair, at least for now.
Market participants now look forward to the US economic docket, featuring the release of the Producer Price Index (PPI) later during the early North American session. This, along with the US bond yields, might influence the USD price dynamics and provide some impetus to the USD/JPY pair. Traders would further take cues from the broader market risk sentiment to grab short-term opportunities around the pair.
Technical levels to watch
EUR/USD has reclaimed 1.0300 following a downward correction. As FXStreet’s Eren Sengezer notes, buyers could remain interested in case the pair clears 1.0370.
Euro faces stiff resistance at 1.0370
“1.0370 (Fibonacci 61.8% retracement of the latest downtrend, Aug. 10 high) aligns as key resistance. In case this level turns into support, EUR/USD could target 1.0400 (psychological level) and 1.0450 (static level).”
“On the downside, 1.0300 (psychological level, Fibonacci 50% retracement) aligns as interim support ahead of 1.0230 (Fibonacci 38.2% retracement, 200-period SMA on the four-hour chart) and 1.0200 (psychological level, 100-period SMA).”
In its monthly report published on Thursday, the International Energy Agency (IEA) said that it expects the global oil demand to rise by 2.1 million barrels per day in 2023 to surpass the pre-Covid levels at 101.8 million bps, as reported by Reuters.
Additional takeaways
"Russian oil exports fell by 115,000 bpd in july to 7.4 mln bpd from about 8 mln bpd at the start of the year."
"Declines in Russian supply more limited than previously forecast."
"Global oil inventories fell by 5 million barrels in June."
"Demand growth is expected to slow from 5.1 mln bpd in 1Q22 to just 40,000 bpd by 4Q22."
"World oil supply hit a post-pandemic high of 100.5 mln bpd in July."
"Record natural gas and electricity prices incentivise gas-to-oil switch in some countries."
"Gains due to oil switching mask relative weakness in other sectors amid economic headwinds."
"Raised 2022 estimate for oil demand growth by 380,000 bpd to 2.1 mln bpd due to more gas-to-oil switching."
Market reaction
Crude oil prices edged higher after this report and the barrel of West Texas Intermediate was last seen trading at $92.10, where it was up 0.6% on the day.
- USD/CAD remains on the defensive near a two-month low touched on Wednesday.
- Hopes for a less aggressive Fed, the risk-on mood continues to weigh on the buck.
- An uptick in oil prices underpins the loonie and also contributes to capping the pair.
The USD/CAD pair struggles to gain any meaningful traction and remains confined in a narrow trading band through the early European session. The pair is currently trading around the 1.2770-1.2765 area, just a few pips above a two-month low touched the previous day.
The US dollar meets with a fresh supply and remains well within the striking distance of its lowest level since late June set in the aftermath of softer US consumer inflation figures on Wednesday. This, in turn, is seen acting as a headwind for the USD/CAD pair and capping spot prices near the 100-DMA support breakpoint, turned resistance.
Investors rushed to trim their bets for a larger 75 bps Fed rate hike at the September policy meeting following the release of the weaker-than-expected US CPI report for July. This, along with a softer tone around the US Treasury bond yields and the risk-on impulse in the equity markets, continues to drive flows away from the safe-haven greenback.
Apart from this, an uptick in crude oil prices underpins the commodity-linked loonie and exerts some pressure on the USD/CAD pair. That said, concerns that a global economic downturn could hit fuel demand could keep a lid on the black liquid. This, along with the overnight hawkish remarks by Fed officials, should limit the USD losses.
The mixed fundamental backdrop warrants some caution for bearish traders, though the overnight break below the 100-day SMA for the first time since June supports prospects for further losses. That said, it would still be prudent to wait for some follow-through selling below the post-US CPI low, around mid-1.2700s, before confirming a breakdown.
Market participants now look forward to the release of the US Producer Price Index (PPI), due later during the early North American session. Apart from this, the US bond yields and the broader risk sentiment would drive the USD demand. Traders would also take cues from oil price dynamics to grab short-term opportunities around the USD/CAD pair.
Technical levels to watch
- EUR/USD fades the initial knee-jerk and regains 1.0300.
- The dollar remains offered in the wake of US CPI results.
- US Producer Prices will be the salient event in the calendar.
The optimism around the European currency looks unabated and bulls now push EUR/USD back to the area beyond 1.0300 the figure on Thursday.
EUR/USD bolstered by risk appetite
EUR/USD trades with gains since Monday and looks to consolidate the recent breakout of the key 1.0300 hurdle always on the back of the intense offered stance in the US dollar.
Indeed, sellers so far remain in control of the sentiment surrounding the greenback, particularly after US inflation showed signs of slowing down its pace in July, as per Wednesday’s releases.
Along with the above, the probability of a 75 bps rate hike by the Fed next month continues to dwindle, which is another factor dragging hurting the buck’s mood.
Nothing scheduled data wise in Euroland on Thursday should leave the attention to the publication of US Producer Prices and Initial Claims.
What to look for around EUR
EUR/USD breaks above the 1.0300 hurdle with certain conviction helped by the intense drop in the dollar in the wake of lower-than-expected US CPI prints for the month of July.
Price action around the European currency, in the meantime, is expected to closely follow dollar dynamics, geopolitical concerns, fragmentation worries and the Fed-ECB divergence.
On the negatives for the single currency emerges the so far increasing speculation of a potential recession in the region, which looks propped up by dwindling sentiment gauges and the incipient slowdown in some fundamentals.
Key events in the euro area this week: EMU Industrial Production (Friday).
Eminent issues on the back boiler: Continuation of the ECB hiking cycle. Italian elections in late September. Fragmentation risks amidst the ECB’s normalization of monetary conditions. Impact of the war in Ukraine on the region’s growth prospects and inflation.
EUR/USD levels to watch
So far, spot is gaining 0.27% at 1.0327 and faces the next up barrier at 1.0368 (monthly high August 10) seconded by 1.0371 (55-day SMA) and finally 1.0615 (weekly high June 27). On the flip side, a break below 1.0096 (weekly low July 26) would target 1.0000 (psychological level) en route to 0.9952 (2022 low July 14).
FX Strategists at UOB Group Lee Sue Ann and Quek Ser Leang hint at the possibility that USD/CNH could drop to 6.7100 in the short term.
Key Quotes
24-hour view: “Yesterday, USD dropped sharply to 6.7163 before rebounding to close at 6.7235 (-0.45%). The rebound amidst oversold conditions suggests USD is unlikely to weaken further. For today, USD is more likely to trade between 6.7200 and 6.7500.”
Next 1-3 weeks: “Our latest narrative was from last Wednesday (03 Aug, spot at 6.7750) where USD is likely to trade between 6.7350 and 6.8000. Yesterday (10 Aug), USD cracked the support at 6.7350 and plummeted to a low of 6.7163. The rapid build-up in downward momentum suggests USD could weaken further to 6.7100. Only a break of 6.7650 (‘strong resistance’ level) would indicate that USD is unlikely to weaken further.”
- The index resumes the downside and flirts with 105.00.
- A 50 bps rate hike in September remains favoured so far.
- Producer Prices, Initial Claims next on tap in the NA session.
The US Dollar Index (DXY), which measures the greenback vs. a basket of its main competitors, leaves behind the initial upbeat note and refocuses on the downside near 105.00.
US Dollar Index weighed down by risk-on trade
The index extends the leg lower for the fourth consecutive session, as investors continue to favour the risk complex on Thursday, particularly following the decline in the US consumer prices during last month.
By the same token, market participants now see a 50 bps rate hike at the Fed’s September gathering as more likely, with CME Group’s FedWatch Tool noting a probability of nearly 60% of such scenario.
Amidst rising appetite for the risk complex, the greenback remains well on the defensive and challenges once again the 105.00 neighbourhood, opening the door at the same time to a potential test of recent lows near 104.60 (August 10).
In the US docket, Producer Prices for the month of July will take centre stage seconded by the usual weekly Initial Claims.
What to look for around USD
The index remains under pressure and returns to the 105.00 zone, as market participants continue to assess the recent publication of US inflation figures.
The dollar, in the meantime, is poised to suffer some extra volatility amidst investors’ repricing of the next move by the Federal Reserve.
Looking at the macro scenario, the dollar appears propped up by the Fed’s divergence vs. most of its G10 peers (especially the ECB) in combination with bouts of geopolitical effervescence and occasional re-emergence of risk aversion.
Key events in the US this week: Initial Claims, Producer Prices (Thursday) – Flash Consumer Sentiment (Friday).
Eminent issues on the back boiler: Hard/soft/softish? landing of the US economy. Escalating geopolitical effervescence vs. Russia and China. Fed’s more aggressive rate path this year and 2023. US-China trade conflict. Future of Biden’s Build Back Better plan.
US Dollar Index relevant levels
Now, the index is losing 0.20% at 104.98 and a breach of 104.63 (monthly low August 10) would expose 103.67 (weekly low June 27) and finally 103.58 (100-day SMA). On the upside, a breakout of 107.42 (weekly high post-FOMC July 27) would expose 109.29 (2022 high July 15) and then 109.77 (monthly high September 2002).
- Attracts dip buying in the 1.2180 area amid the emergence of fresh USD selling on Thursday.
- Diminishing odds for a larger Fed rate hike in September, the risk-on mood undermines the USD.
- Bulls might still wait for some follow-through buying before positioning for any further move up.
The GBP/USD pair recovers nearly 50 pips from the intraday low and touches a fresh daily peak, around the 1.2230 region during the early European session.
The US dollar struggles to capitalize on its modest bounce and meets with fresh supply on Thursday, which, in turn, offers some support to the GBP/USD pair. Wednesday's softer US consumer inflation figures force investors to scale back expectations for a more aggressive rate hike by the Fed. Apart from this, a generally positive tone around the equity markets undermines the safe-haven buck.
That said, a combination of factors should help limit any further USD losses and cap the upside for the GBP/USD pair, at least for the time being. Growing worries about a global economic downturn, along with the US-China tensions over Taiwan, might keep a lid on the latest optimism in the markets. Adding to this, the overnight hawkish remarks by Fed officials should act as a tailwind for the greenback.
In fact, Chicago Fed President Charles Evans noted that inflation is still unacceptably high and expects the Fed to continue to raise the interest rate to 3.25%-3.50% by year-end. Separately, Minneapolis Fed President Neel Kashkari said that the Fed is far away from declaring victory on inflation and that he had recommended the interest rate at 3.9% by the end of 2022 in the June economic projections.
Furthermore, the Bank of England's gloomy economic outlook should act as a headwind for the British pound and also contribute to capping the GBP/USD pair. It is worth recalling that the UK central bank last week indicated that a prolonged recession would start in the fourth quarter. Hence, the market focus now shifts to the Preliminary UK GDP report for the second quarter, due for release on Friday.
Even from a technical perspective, the overnight pullback from the vicinity of the monthly peak warrants caution for bulls. This makes it prudent to wait for some follow-through buying beyond the mid-1.2200s before positioning for any further appreciating move. Traders now look forward to the US Producer Price Index (PP) for a fresh impetus later during the early North American session.
Technical levels to watch
In Norway, inflation was much higher than expected in July. Additionally, a risk-positive market environment is supporting the krone. Economists at ING believe the EUR/NOK could test the 9.65 zone.
Better risk environment and stronger July core inflation help the NOK
“A slightly better risk environment and some stronger July core inflation (making the case for 50 bps at next week's Norges Bank meeting) are helping the Norwegian krone.”
“We now have a window for EUR/NOK to push to the 9.65 area.”
See – Norway: Inflation refuses to slow down, second 50 bps hike incoming – TDS
The softer dollar allowed a decent reprieve to GBP/USD yesterday, but the move stalled before resistance at 1.2300. Economists at ING expect the pair to turn back lower towards 1.20.
EUR/GBP could edge back below 0.8400
“We think cable will struggle to get above the 1.23 level and would favour a return to the 1.20 area. We would have tight stops on short cable positions just above 1.2300, however.”
“A quiet August with benign conditions could see EUR/GBP edging back below 0.8400 – confounding the pound pessimists.”
The dollar sold off around 1% across the board on yesterday's softer-than-expected July CPI number. Nonetheless, economists at ING expect the greenback to remain supported on dips.
Counter-trend dollar sell-off won’t last
“It seems it is too early to expect any sustained downside move in the short end of the US Treasury yield curve. And historically (since the 1980s) the US 2-10 year US curve has struggled to invert more than by 50 bps. That suggests limited downside for US yields from here (including the US 10-year), which would favour positioning back into long USD/JPY.”
“Expectations of quiet summer markets have seen expected volatility priced through the FX options market continuing to sink further. This will favour the carry trade and we could see fresh interest in pairs like long MXN/JPY which could push to the 6.80 area this month.”
“The low-yielder weighted DXY should find good demand below 105 and we would favour a recovery back to the 106.00/106.30 area.”
EUR/USD climbed to its highest level in a month at 1.0368 on Wednesday. Economists at ING expect the 1.0350/1.0400 area to be the top of the pair’s trading this month.
Don't chase the EUR/USD rally
“We would favour 1.0350/0400 proving the top of the August trading range for EUR/USD.”
“In addition to the Russian threat from energy prices, the European manufacturing industry now has to contend with drought conditions and low water levels on the Rhine. That will challenge coal shipments, amongst other cargoes, and is keeping European natural gas prices bid near the highs. This factor remains an outright euro negative.”
In the view of economists at Goldman Sachs, the Federal Reserve is set to hike rates by 50 basis points at the next meeting. Regarding EUR/USD, the pair is expected to retest parity.
50bps most likely at next FOMC meeting
“We still think a step down to 50 bps is most likely at the next meeting, but see risks that rate hikes could be more frontloaded. But, with the market still pricing cuts next year, the bottom line is that we still see upside risks to inflation and policy pricing over the next few months."
“Overall, we continue to see upside risks to real yields in the US, and downside risks for the ECB. As a result, we think EUR/USD can retest parity in the months ahead.”
Here is what you need to know on Thursday, August 11:
The US Dollar Index (DXY), which tracks the greenback's performance against a basket of six major currencies, lost more than 1% on Wednesday after the data from the US showed that annual inflation declined to 8.5% in July from 9.1% in June. DXY stays in a consolidation phase above 105.00 early Thursday as investors await the weekly Initial Jobless Claims and the Producer Price Index (PPI) data from the US. Following Wednesday's impressive rally, Wall Street's main indexes remain on track to open in positive territory with US stock index futures rising between 0.35% and 0.5%. Meanwhile, the benchmark 10-year US Treasury bond yield continues to fluctuate between 2.7% and 2.8%.
Commenting on the inflation data, Chicago Fed President Charles Evans said that they were not finished with rate hikes. On a similar note, Minneapolis Fed President Neel Kashkari and San Francisco Fed President Mary Daly both argued that it was too early to declare victory on inflation. According to the CME Group FedWatch Tool, markets are pricing in a 56% probability of the Fed opting for a 50 basis points rate hike in September.
US Inflation Analysis: It is peak inflation only until the Fed's verdict, stock rally at risk.
EUR/USD climbed to its highest level in a month at 1.0368 on Wednesday but retreated to the 1.0300 area in the European session on Thursday.
GBP/USD gained more than 100 pips on Wednesday and advanced toward 1.2300 before losing its bullish momentum. Ahead of Friday's growth data from the UK, the pair stays relatively quiet above 1.2200.
UK GDP Preview: Early confirmation of BOE’s recession forecast.
USD/JPY fell sharply on soft US inflation data but the T-bond yields' resilience helped the pair find support. As of writing, USD/JPY was moving sideways in a narrow band below 133.00.
Gold advanced beyond $1,800 for the first time in nearly two months on Wednesday but failed to preserve its bullish momentum. After having closed the day with small losses on Wednesday, XAU/USD continues to inch lower and was last seen trading below $1,790.
Bitcoin benefited from the risk-positive market environment and gained nearly 4% on Wednesday. BTC/USD pushes higher toward $25,000 and early Thursday. Ethereum is trading at its highest level in two months and closes in on $2,000.
- AUD/USD attracts some dip-buying on Thursday and climbs back closer to the 0.7100 mark.
- The risk-on impulse undermines the safe-haven USD and benefits the risk-sensitive aussie.
- Recession fears, the overnight hawkish remarks by Fed officials could limit the USD losses.
- A sustained move beyond the 0.7100 mark is needed to support prospects for further gains.
The AUD/USD pair attracts some dip-buying near the 0.7060 region on Thursday and climbs to a fresh daily high during the early European session. Spot prices, however, remain below the 0.7100 mark and a two-month high touched in the aftermath of softer US consumer inflation figures on Wednesday.
The prevalent risk-on mood acts as a headwind for the safe-haven US dollar and turns out to be a key factor offering some support to the AUD/USD pair. The weaker-than-expected US CPI report pushed back expectations for a more aggressive policy tightening by the Fed and boosted investors' confidence. This is evident from a generally positive tone around the equity markets, which tends to benefit the risk-sensitive aussie.
That said, growing worries about a global economic downturn, along with the US-China tensions over Taiwan, could keep a lid on the optimistic move. Moreover, the overnight hawkish remarks by several Fed officials should help limit deeper losses for the greenback and cap gains for the AUD/USD pair. This, in turn, warrants caution for bullish traders and positioning for any further appreciating move, at least for now.
In fact, Chicago Fed President Charles Evans noted that inflation is still unacceptably high and expects Fed to continue to raise the interest rate to 3.25%-3.50% by year-end, and 3.75%-4.00% by the end of next year. Adding to this, Minneapolis Fed President Neel Kashkari said that the Fed is far away from declaring victory on inflation and recommended the rate at 3.9% by the end of this year in the June economic projections.
Furthermore, the Fed is still expected to hike interest rates by at least 50 bps at the September policy meeting. This further makes it prudent to wait for sustained strength beyond the 0.7100 round-figure mark before placing fresh bullish bets around the AUD/USD pair. Market participants now look forward to the release of the US Producer Price Index (PPI) for a fresh impetus later during the early North American session.
Technical levels to watch
- Silver keeps pullback from six-week high inside a bearish chart pattern.
- Higher low on RSI backs firmer prices to suggest short-term grind towards the north.
- 200-SMA adds to the downside filters before directing sellers towards July’s low.
Silver price (XAG/USD) remains pressured at around $20.50, keeping the previous day’s pullback from the 1.5-month high marked the previous day. In doing so, the bright metal seesaws inside a fortnight-old rising wedge bearish chart pattern.
It should, however, be noted that the recent higher-low formation on prices gain support from the RSI (14), which in turn suggests a further grind of the quote towards the north.
However, a horizontal area comprising multiple levels marked since mid-June and the upper end of the rising wedge, around $20.85-90, appears a tough nut to crack for the XAG/USD bulls to crack.
Even if the bullion prices cross the $20.90 hurdle, the $21.00 round figure and late June swing high close to $21.55 should test the XAG/USD buyers before directing them to the six-week top surrounding $22.00.
Meanwhile, a downside break of the $20.10 will confirm the rising wedge, which in turn suggests the theoretical south-run towards $17.70.
It’s worth noting, however, that the convergence of the 200-SMA and a 38.2% Fibonacci retracement level of June-July downside, around $19.60-65, will precede the yearly bottom of $18.15 to challenge the metal bears.
XAG/USD: Four-hour chart
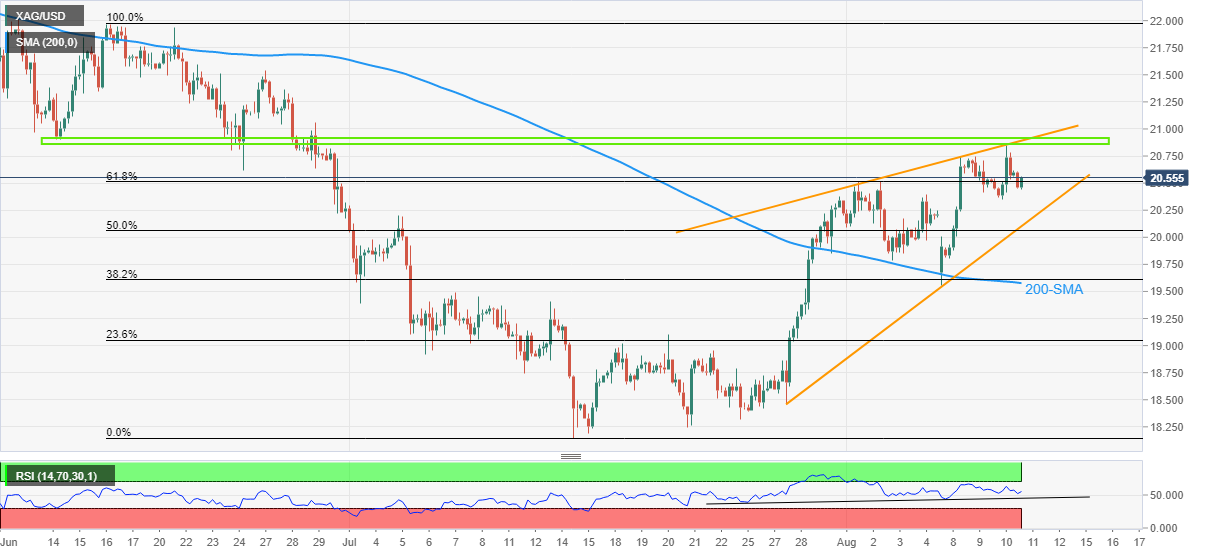
Trend: Limited upside expected
Economists at ANZ Bank see limited upside in iron ore prices. They have lowered their end of year target to $115/t.
Iron ore prices to sit under $100/t by end-2023
“We expect the market to swing back into a small surplus in 2023. As such, we see limited upside in iron ore prices.”
“We have lowered our end-of-year target to $115/t and expect prices to trend lower in Q4 and into 2023 as the impact of the stimulus measures peter out and iron ore demand weakens.”
“We ultimately see prices at the end of 2023 sitting under $100/t as the market tightness eases.”
Tensions are running high with rising fears over a Chinese invasion of Taiwan in the not too distant future. While risks are rising, economists still see a rather small probability of a Chinese invasion of Taiwan in the next couple of years. However, the risk of war in the medium to longer term is high, in their view.
No immediate risk of a Chinese invasion of Taiwan
“Despite current tensions, we do not see a high risk of war on Taiwan in the near term as all sides have an interest to maintain status quo. However, the risk is real in the medium to longer term as China may eventually choose a path of nonpeaceful reunification if it sees no other way out.”
“A risk within the next couple of years may come around a possible change of government in the US in 2024 if a new US President-elect wishes to change the status quo.”
“We expect tensions to stay elevated for the foreseeable future as we expect the US and EU to continue to expand relations with Taiwan and keep a high military presence around Taiwan and the South China Sea. China in response is set to continue a high-level military drills. This may be a new status quo at a higher level of tension than before.”
“In the end, both sides have a strategy of deterrence. But with tensions running this high, the risk of miscalculations or unintended accidents that trigger a tit-for-tat spiral could also end in military confrontation.”
Extra weakness carries the potential to drag USD/JPY to the 131.65 level in the next weeks, note FX Strategists at UOB Group Lee Sue Ann and Quek Ser Leang.
Key Quotes
24-hour view: “USD lurched lower and nose-dived to 132.01 before rebounding to close at 132.87 (-1.67%). The rebound amidst oversold conditions suggests that USD is unlikely to weaken further. For today, USD is more likely to consolidate and trade between 132.30 and 133.60.”
Next 1-3 weeks: “Our view from Monday (08 Aug, spot at 135.40) where USD could advance to 136.00 was invalidated as USD plunged below our ‘strong support’ level at 134.00. Note that USD closed lower by a whopping 1.67% (NY close of 132.87), its largest 1-day drop since Nov 2021. While oversold shorter-term conditions could lead to a couple of days of consolidation first, the impulsive decline could extend to 131.65 later on. The current USD weakness is intact as long as USD does not move above 134.40 (‘strong resistance’ level).”
In the view of economists at Commerzbank, it all comes back to the question of whether or not the pandemic shock and energy crisis catapulted us out of the lowflation world. For the time being, analysts at Commerzbank expect high volatility in the markets.
Remove your seatbelts and prepare for soft landing
“Do central banks have to fight persistent upside risks to inflation with aggressive monetary policy over the longer term, even at the expense of the real economy, or can the Fed prevent inflation dynamics from taking hold with short-term, rigorous rate hikes? Currently, the market seems to be leaning toward the latter scenario.”
“At some point, the Fed would have done ‘enough’ from which point there would be no further USD impetus. However, yesterday's inflation data do not change the fact that it remains unclear when exactly this point will be reached. Rather, I see the strong market reaction as a sign of how high uncertainty about the Fed's future course still is in the FX market. Prepare for continued turbulence.”
Mexico's central bank Banxico is set to raise its key interest rate today by another 75 basis points. As in the market it seems to be largely priced in, the statement will determine if the Mexican peso can strengthen, economists at Commerzbank report.
Banxico likely to add 75 bps
“We expect Banxico to raise the policy rate to 8.5% and also maintain the outlook for further rate increases. An even bigger rate step cannot be ruled out and would probably boost the peso which was recently able to gain ground against the USD, at least temporarily; however, it seems less likely to us.”
“If Banxico delivers as generally expected, it will probably depend primarily on the statement whether the peso can benefit additionally because much seems to be priced in already.”
Open interest in natural gas futures markets extended the downtrend and shrank by just 169 contracts on Wednesday, noted preliminary readings from CME Group. On the other hand, volume resumed the uptrend and went up by around 53.4K contracts, partially offsetting the previous drop.
Natural Gas remains supported around $7.50
Prices of natural gas edged higher once again on Wednesday, although the move was amidst shrinking open interest and a moderate increase in volume. That said, while the rebound could extend further in the very near term, it could also start to run out of steam. Looking at the recent price action, occasional bearish moves in the commodity should face decent support around the $7.50 mark per MMBtu.
- USD/TRY pares recent losses ahead of the key Turkish data.
- Fed policymakers resist praising downbeat US inflation.
- Turkiye reported downbeat Unemployment Rate for June previously.
- Turkish President Erdogan is also up for a speech, Ankara braces for record Current Account Deficit.
USD/TRY takes the bids to refresh intraday high around 17.92 amid the initial European session on Thursday. In doing so, the Turkish lira (TRY) pair prints the first daily gains in three ahead of the nation’s publication of the Current Account Balance data for June.
Turkey's current account is expected to record a deficit of $3.4 billion in June and end the year with a deficit of more than $40 billion, a Reuters poll showed on Friday, as soaring energy prices widen the shortfall.
In addition to the pre-data move, the US dollar’s rebound amid the Fed policymakers’ mixed comments and headlines surrounding China also underpin the USD/TRY pair’s latest rebound.
Mary Daly, President of the San Francisco Fed recently hesitated to declare victory over inflation. In doing so, the policymaker joined the likes of Minneapolis Fed President Neel Kashkari and Chicago Fed President Charles Evans while rejecting any major reason to cheer July’s US Consumer Price Index (CPI) that dropped to 8.5% on YoY versus 8.7% expected and 9.1% prior.
Previously, Fed’s Kashkari mentioned that he hasn't "seen anything that changes" the need to raise the Fed's policy rate to 3.9% by year-end and 4.4% by the end of 2023. Further, Fed policymaker Evens stated, “The economy is almost surely a little more fragile, but would take something adverse to trigger a recession.” Fed’s Evans also called inflation "unacceptably" high.
Elsewhere, talks surrounding China also propel the USD/TRY prices. Reuters relied on sources to mention that the saying US President Biden rethinks steps on China tariffs in wake of Taiwan response. Additionally, a jump in the coronavirus cases from China, to 700 new confirmed cases in the mainland on August 10 versus 444 a day earlier, favors the pair buyers. Furthermore, China Customs’ latest rejection of US meat from a specific producer and comments from the Taiwan Foreign Ministry, suggest rejection of China’s motto of 'One country, Two systems’ also underpin the US dollar’s safe-haven demand.
It should be noted that the Turkish Unemployment Rate for June dropped to 10.3% on Wednesday, below the downwardly revised 10.6% prior.
Moving on, comments from Turkish President Recep Tayyip Erdogan, at two different events around 11:30 GMT and 12:30 GMT, will be important. It should be noted that the US Jobless Claims and the monthly Producer Price Index (PPI) for July could also entertain short-term USD/TRY traders.
Technical analysis
USD/TRY remains on the bull’s radar until staying beyond the upward sloping support line from early May, near 17.75 by the press time. However, RSI suggests that the bulls are running out of steam around the 18.00 threshold, making it an important hurdle.
NZD/USD sports a 0.64 handle for the first time since early June. Economists at ANZ expect the kiwi to receive further support from the Reserve Bank of New Zealand (RBNZ) next week.
A hawkish MPS next week
“US CPI data show that inflation may have peaked, and markets certainly interpreted it that way, with decent rallies seen in equities and other risk assets. Bond markets reacted more cautiously, with US bond yields having unwound most of their knee-jerk move lower. That leaves us a tad cautious, anticipating potential volatility.”
“The RBNZ MPS next week we think it will be hawkish, and even if some of the dent is taken out of the USD in coming days, the RBNZ’s tone should help the NZD.”
“Support 0.6060/0.6290 Resistance 0.6435/0.6575/0.6660”
While the FX market still seems to see a soft landing in the US at least within the realm of possibility, the ship has probably sailed in the United Kingdom. Economists at Commerzbank expect the British pound to face a tough time to attain gains.
Hard landing for the pound?
“The Bank of England expects a longer-lasting recession from the end of the year.”
“Rising energy costs are a key reason for the BoE's significant upward revision of its inflation forecast. Of course, the BoE also expects to get inflation back under control. However, everything depends on how the energy crisis in Europe develops.”
“The BoE's course is not set in stone either, and the risks in GBP exchange rates remain high.”
FX option expiries for August 11 NY cut at 10:00 Eastern Time, via DTCC, can be found below.
- EUR/USD: EUR amounts
- 1.0095-05 2b
- 1.0125 607m
- 1.0150 507m
- 1.0200 700m
- 1.0235 524m
- 1.0245-55 737m
- 1.0265 300m
- 1.0275 518m
- 1.0300 716m
- 1.0315 406m
- 1.0350 251m
- 1.0400 643m
- GBP/USD: GBP amounts
- 1.2140-50 538m
- 1.2155-65 703m
- 1.2200 288m
- USD/JPY: USD amounts
- 130.00 2b
- 130.40 281m
- 132.00 530m
- 133.00-05 506m
- 133.44-45 310m
- 133.70-75 375m
- 134.00 422m
- 134.25-30 735m
- 134.97-00 1.15b
- USD/CHF: USD amounts
- 0.9500 325m
- AUD/USD: AUD amounts
- 0.6975-85 664m
- 0.7000 1.12b
- USD/CAD: USD amounts
- 1.2800 275m
- 1.2900 275m
- 1.3200 825m
- EUR/GBP: EUR amounts
- 0.8350 780m
- 0.8650 716m
- EUR/CHF: EUR amounts
- 0.9700 225m
In the opinion of FX Strategists at UOB Group Lee Sue Ann and Quek Ser Leang, the current upward bias could encourage NZD/USD to advance to the 0.6475 level in the short term.
Key Quotes
24-hour view: “The outsized surge of 1.84% (NY close of 0.6404) in NZD came as a surprise (we were expecting sideway-trading). The overbought rally could extend to 0.6440. For today, the major resistance at 0.6475 is unlikely to come under threat. Support is at 0.6380 but only a break of 0.6350 would indicate that the current upward pressure has eased.’
Next 1-3 weeks: “We expected NZD to trade sideways between 0.6215 and 0.6350 since late last week. Yesterday (10 Aug), NZD lifted off, cracked 0.6350 and flew to a high of 0.6434. The rapid ascent is accompanied by strong upward momentum and NZD is likely to advance further to 0.6475. Overall, only a break of 0.6320 (‘strong support’ level) would indicate that NZD is not ready to advance to 0.6475.”
Considering advanced prints from CME Group for crude oil futures markets, traders scaled back their open interest positions by around 2.7K contracts on Wednesday, resuming the downtrend following Tuesday’s daily build. Volume, instead, went up for the second straight session, now by around 70.3K contracts.
WTI: Initial support emerges near $87.00
Prices of the WTI traded in a volatile fashion on Wednesday amidst the ongoing recovery from last week’s multi-month lows. The daily uptick was on the back of shrinking open interest, which leaves the upside somewhat limited for the time being. On the downside, there is decent contention around the $87.00 mark per barrel.
- The 200-period EMA is acting as a major barricade for the counter.
- A bullish flag formation adds to the upside filters.
- The RSI (14) is attempting a break above 60.00, which will strengthen the oil bulls.
West Texas Intermediate (WTI), futures on NYMEX, is displaying back and forth moves in a narrow range of $90.68-91.34 in the early Tokyo session. The black gold has turned sideways after delivering a juggernaut rally from a low near $87.00 on Wednesday. The north-side perpendicular move remained shy of $92.00.
A Bullish Flag formation on an hourly scale signals a continuation of bullish momentum after a rangebound phase. Usually, a consolidation phase denotes intensive buying interest from the market participants, which prefer to enter an auction after the establishment of the trend.
Bulls are struggling to cross the mighty 200-period Exponential Moving Average (EMA) at $91.40, however, the upside momentum assures a break sooner. The 50-EMA at $90.18 has started advancing higher, which warrants short-term optimism.
Meanwhile, the Relative Strength Index (RSI) is struggling to cross 60.00. A break of the same will unleash the oil bulls for upside.
A decisive move above Tuesday’s high at 92.00 will drive the asset towards the round-level resistance at 95.00, followed by an August 1 high at $97.57.
Alternatively, oil prices can lose momentum if it drops below Wednesday’s low at $88.46. An occurrence of the same will drag the asset towards the August 5 low at $86.40. A slippage below $86.40 will open doors for more downside towards the 9 November 2021 high at $83.34.
WTI hourly chart
-637957948576513979.png)
- EUR/USD snaps three-day uptrend, grinds lower at intraday bottom.
- MACD, RSI hint at a gradual upward trajectory but 1.0370 is the key hurdle.
- Further downside can aim the 1.0190 support confluence.
EUR/USD remains pressured around the intraday low of 1.0275 heading into Thursday’s European session.
In doing so, the major currency pair keeps the previous day’s pullback from a three-month-old ascending resistance line, around 1.0370 by the press time. However, bullish MACD signals and the firmer RSI (14) challenge the sellers.
Also likely to restrict the short-term EUR/USD downside is the convergence of the 21-DMA, an ascending trend line from July 14 and a two-month-old previous resistance line, close to 1.0190.
Should the quote drop below 1.0190 support, the odds of its slump towards the yearly low surrounding 0.9950 can’t be ruled out. However, 1.0120 and the 1.0000 parity level may offer intermediate halts during the fall.
Meanwhile, the 1.0300 threshold and the 50-DMA level surrounding 1.0340 guard the EUR/USD pair’s short-term upside.
In a case where EUR/USD bulls manage to keep reins past 1.0340, a run-up towards the late June swing high near 1.0615 appears more likely.
Overall, EUR/USD grinds higher with the limited downside expected for the short-term.
EUR/USD: Daily chart
Trend: Limited downside expected
Gold price is extending its retreat from one-month highs of $1,808. The yellow metal is at risk of falling below the 50-Daily Moving Average (DMA) support at $1,784, FXStreet’s Dhwani Mehta reports.
Bear cross in play
“Daily closing below the bearish 50-Daily Moving Average (DMA) at $1,784 will extend the corrective decline towards the $1,770 round figure, below which the $1,750 support zone will be tested again.”
“The 100 and 200 DMA bear cross is playing out and weighing negatively on the bright metal even though the 14-day Relative Strength Index (RSI) still remains above the midline.”
“On the upside, acceptance above the $1,800 mark is critical to resume its recovery momentum. The monthly high at $1,808 and the July 5 high at $1,812 will be next on buyers’ radars.”
US House of Representatives Speaker Nancy Pelosi said on Wednesday, the US couldn’t let China establish a “new normal” around Taiwan, per Bloomberg.
Key quotes
Chinese leaders had been “trying to push their way” toward their goals on Taiwan.”
“What we saw with China is they were trying to establish sort of a new normal.”
“And we just can’t let that happen.”
Market reaction
The US dollar index is on a gradual recovery mode amid renewed Sino-American tensions over Taiwan, which have translated on the trade front.
The spot is trading at 105.40, adding 0.19% on the day. Meanwhile, the S&P 500 futures are also up 0.19% on the day.
- EUR/JPY is declining gradually after failing to sustain above the critical hurdle of 137.00.
- The shared currency bulls are facing the heat as German Lindner has displayed a gloomy Eurozone outlook.
- Despite the prolonged ultra-loose monetary policy, the BOJ is failing to inflation rate above 2%.
The EUR/JPY pair has slipped to near 136.85 after failing to sustain above the immediate hurdle of 137.00 in the Asian session. The cross plunged on Wednesday after the release of the German inflation data. Apart from that, Germany’s Finance Minister Christian Lindner displayed a gloomy picture of Germany and the Eurozone.
The Germany Harmonized Index of Consumer Prices (HICP) landed at 8.5%, in line with the estimates and the prior release. It is worth noting that US inflation dropped sharply on declining oil prices while German inflation remained steady, which indicates that the energy crisis has deepened in the Eurozone area.
Germany’s Lindner featured a gloomy outlook citing that the euro area’s powerhouse is fragile as the European gas crisis deepens by no means out of the Russia-Ukraine war. He added that the economy is on brink of recession, as companies expect significantly worse business activity in the coming months.
The already tedious job of the European Central Bank (ECB) is getting trickier as higher price pressures are accompanied by an energy crisis. Above all, the ECB is on track to elevate its interest rates by 50 basis points (bps). The ECB also hiked its interest rates by 25 bps in July.
On the Tokyo front, the Covid situation and lower inflation is getting more critical for the Bank of Japan (BOJ). The central bank is failing in keeping the inflation rate above 2% and pushing growth rates higher despite the continuation of an ultra-loose monetary policy. Apart from that, the ongoing cabinet re-shuffle is impacting the yen bulls.
A close above 1.2300 should allow GBP/USD to extend the uptrend in the next few weeks, according to FX Strategists at UOB Group Lee Sue Ann and Quek Ser Leang.
Key Quotes
24-hour view: “We did not expect the outsized advance in GBP as it surged to 1.2277 before easing off to close at 1.2217 (+1.18%). The sharp and swift rise appears to be running ahead of itself and GBP is unlikely to advance further. For today, GBP is more likely to trade between 1.2160 and 1.2260.”
Next 1-3 weeks: “On Monday (08 Aug, spot at 1.2065), we highlighted that the risk for GBP is tilted to the downside but it has to crack the major support at 1.2000 before a sustained decline is likely. However, GBP did not break 1.2000 as it surged to a high of 1.2277 during NY session. The rapid build-up in upward momentum suggests that the risk for GBP has shifted to the upside. That said, it has to crack the major resistance at 1.2300 before further sustained advance is likely. The upside risk is intact as long as GBP does not move below the ‘strong support’ level at 1.2125 within these couple of days.”
- Gold price remains pressured around intraday low, extends pullback from one-month high.
- US dollar traces Treasury yields as Fed policymakers reject post US CPI optimism.
- Headlines surrounding China also underpin the US dollar’s safe-haven demand.
Gold price (XAU/USD) holds lower grounds near intraday bottom surrounding $1,784 as bears attack the 50-DMA heading into Thursday’s European session. In doing so, the precious metal respects the US dollar’s latest rebound amid mixed concerns surrounding the US Federal Reserve’s (Fed) next move and China.
That said, the US Dollar Index (DXY) pares the biggest daily loss in five months, up 0.20% intraday near 105.45 by the press time, as Fed policymakers fail to cheer Wednesday’s softer US Consumer Price Index (CPI) for July, down to 8.5% on YoY in July versus 8.7% expected and 9.1% prior.
Mary Daly, President of the San Francisco Fed recently hesitated to declare victory over inflation. In doing so, the policymaker joined the likes of Minneapolis Fed President Neel Kashkari and Chicago Fed President Charles Evans. Previously, Fed’s Kashkari mentioned that he hasn't "seen anything that changes" the need to raise the Fed's policy rate to 3.9% by year-end and 4.4% by the end of 2023. Further, Fed policymaker Evens stated, “The economy is almost surely a little more fragile, but would take something adverse to trigger a recession.” Fed’s Evans also called inflation "unacceptably" high.
In addition to this, talks surrounding China also weigh on the XAU/USD prices due to the Dragon Nation’s status as among the world’s biggest gold consumers. Reuters relied on sources to mention that the saying US President Biden rethinks steps on China tariffs in wake of Taiwan response. Additionally, a jump in the coronavirus cases from China, to 700 new confirmed cases in the mainland on August 10 versus 444 a day earlier, also weighs on the gold price. Furthermore, China Customs’ latest rejection of US meat from a specific producer and comments from the Taiwan Foreign Ministry, suggest rejection of China’s motto of 'One country, Two systems’, also weigh on the bright metal prices.
Against this backdrop, S&P 500 Futures print mild gains near 4,220 by the press time after Wall Street rallied and the US Treasury yields remained mostly unchanged the previous day.
Looking forward, US Jobless Claims and the monthly Producer Price Index (PPI) for July. Furthermore, Friday’s preliminary readings of the US Michigan Consumer Sentiment Index for August will also be important for fresh impulse.
Technical analysis
A clear downside break of the three-week-old ascending support line, now a resistance line around $1,795, joins the RSI retreat and the MACD’s easing bullish bias to tease the XAU/USD bears.
However, a daily close below the 50-DMA support surrounding $1,784 appears necessary for the gold price to extend the latest weakness towards the 23.6% Fibonacci retracement level of April-July downside, near $1,755.
On the contrary, an upside clearance of the $1,795 support-turned-resistance isn’t an open call to the gold buyers.
The reason is the existence of a downward sloping resistance line from late April, around $1,824.
Gold: Daily chart
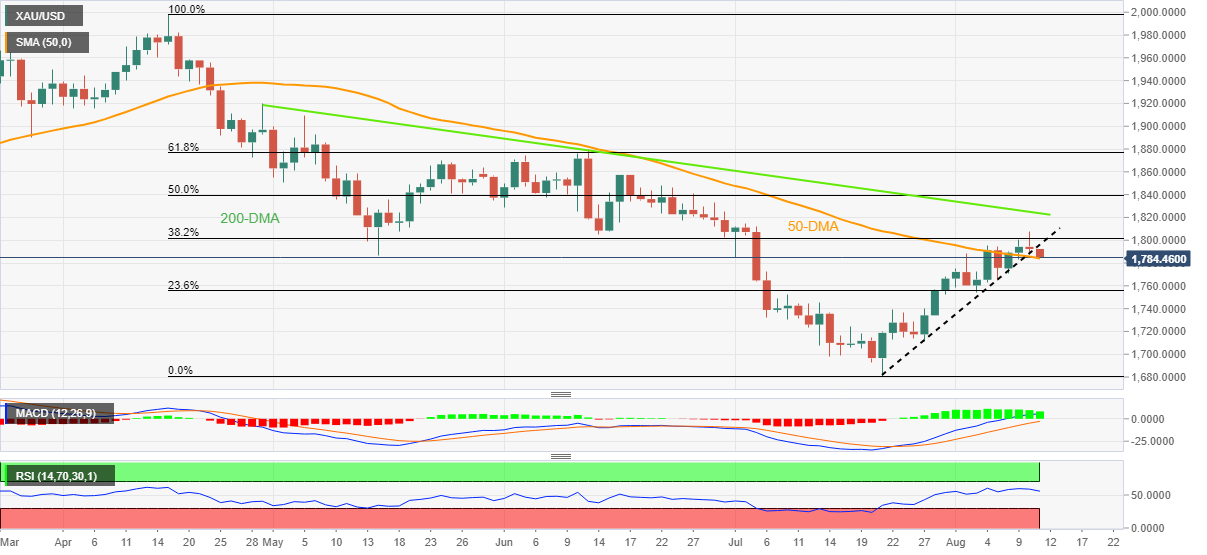
Trend: Further weakness expected
CME Group’s flash data for gold futures markets noted open interest rose by around 2.6K contracts on Wednesday, extending the current erratic performance. In the same line, volume went up for the second session in a row, this time by around 40K contracts.
Gold remains capped by $1,800
Prices of the ounce troy of gold surpassed the key $1,800 mark on Wednesday, although they close below this key mark and with modest losses. The move was in tandem with increasing open interest and volume, indicative that further decline could be in the pipeline in the very near term.
FX Strategists at UOB Group Lee Sue Ann and Quek Ser Leang suggest further upside could lift EUR/USD to the 1.0400 hurdle.
Key Quotes
24-hour view: “EUR lifted off during NY session and rocketed to 1.0368 before coming back down to close at 1.0297 (+0.84%). The strong surge appears to be overdone and EUR is unlikely to advance further. For today, EUR is more likely to trade sideways between 1.0260 and 1.0350.”
Next 1-3 weeks: “After trading within a 1.0100/1.0300 range for a few weeks, EUR lifted off and cracked 1.0300 during NY session (high has been 1.0368). Further EUR strength appears likely even though overbought shorter-term conditions suggest a slower pace of advance. The next resistance level of note is at 1.0400. On the downside, a break of 1.0230 (‘strong support’ level) would indicate that the current rapid build-up in upward momentum has fizzled out.”
- Steel prices remains pressured as softer US dollar couldn’t impress buyers amid concerns over China, costing at home.
- Increased prices of coke, easing production strain also weigh on the metal prices.
- Headlines surrounding China, US consumer sentiment will be important for fresh impulse.
Steel price reverses the post US inflation gains as traders fail to cheer softer US dollar amid fears of more output and higher costs, as well as a lack of demand, during early Thursday morning in Europe. That said, the construction steel rebar on the Shanghai Futures Exchange (SFE) slipped 0.1% while the hot-rolled coil gained 0.1%. Further, stainless steel rose 0.9% by the press time.
Given the recently mixed performance of steel traders, Reuters said, “Steel mills have restarted some of their idled blast furnaces in recent days, encouraged by improved margins and a pickup in demand from the construction sector.”
The news analysis also mentioned that the medium-term demand outlook for steel products and ingredients remains clouded by several issues, such as mandatory steel output cuts in China aimed at curbing emissions, a financial crisis engulfing Chinese property developers and COVID-19 lockdowns.
Elsewhere, the mixed comments from the Fed policymakers join the China-linked news surrounding the Sino-American trade war, covid and Taiwan, to weigh on the market sentiment and the steel prices.
Recently, Mary Daly, President of the San Francisco Fed hesitated to declare victory over inflation, even after the US Consumer Price Index (CPI) declined to 8.5% on YoY in July versus 8.7% expected and 9.1% prior. In doing so, the policymakers joined the likes of Minneapolis Fed President Neel Kashkari and Chicago Fed President Charles Evans. Previously, Fed’s Kashkari mentioned that he hasn't "seen anything that changes" the need to raise the Fed's policy rate to 3.9% by year-end and 4.4% by the end of 2023. Further, Fed policymaker Evens stated, “The economy is almost surely a little more fragile, but would take something adverse to trigger a recession.” Fed’s Evans also called inflation "unacceptably" high.
Talking about China-related news, Reuters relied on sources to mention that the saying US President Biden rethinks steps on China tariffs in wake of Taiwan response. Additionally, a jump in the coronavirus cases from China, to 700 new confirmed cases in the mainland on August 10 versus 444 a day earlier, also weighs on the pair. Furthermore, China Customs’ latest rejection of US meat from a specific producer and comments from the Taiwan Foreign Ministry, suggest rejection of China’s motto of 'One country, Two systems’.
Looking forward, US Jobless Claims and the monthly Producer Price Index (PPI) for July. Furthermore, Friday’s preliminary readings of the US Michigan Consumer Sentiment Index for August will also be important for fresh impulse.
- USD/CAD prints mild gains as it consolidates the biggest daily fall in two-months.
- Six-week-old support line, 200-DMA challenged bears but 100-DMA guards recovery moves.
- Sluggish MACD, RSI (14) fail to support recovery moves from the lowest levels since early June.
USD/CAD grinds higher around the daily top as it pares the biggest daily slump since June near 1.2790 during early Thursday morning in Europe.
In doing so, the Loonie pair extends the previous day’s rebound from the convergence of the 200-DMA and a downward sloping support line from late June, around 1.2745-50. However, the 100-DMA challenges the quote’s immediate upside near the 1.2800 threshold.
It’s worth noting that the sluggish RSI and MACD fail to entertain the USD/CAD pair’s latest corrective pullback as it bounces off a two-month low.
Even if the quote crosses the 1.2800 immediate resistance, the monthly peak of 1.2985 and the 1.3000 round figure could challenge the buyers.
On the contrary, pullback remains elusive until the USD/CAD prices remain beyond 1.2745-50 support confluence.
Following that, the 61.8% Fibonacci retracement of April-July upside, near 1.2715, can entertain the pair sellers.
It’s worth noting, however, that the USD/CAD weakness past 1.2745 could drag it to the upward sloping support line from April 05, close to 1.2630 by the press time.
USD/CAD: Daily chart
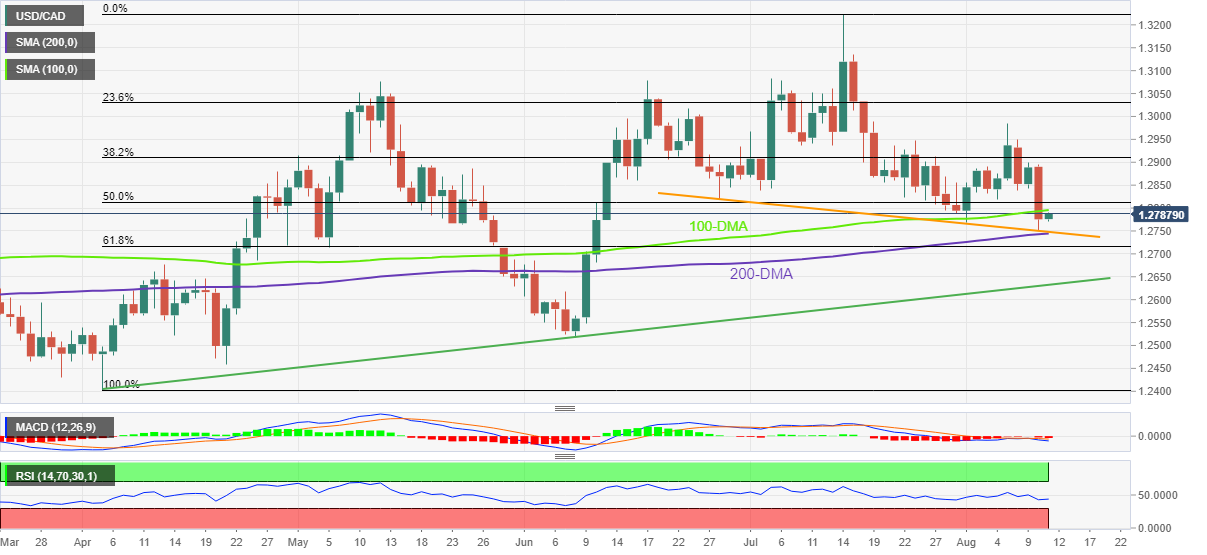
Trend: Further weakness expected
- USD/JPY is auctioning in a balanced profile above 133.00 as DXY extends recovery.
- A downward US CPI will result in a trimmed extent of hawkish guidance by the Fed.
- An ongoing Japan cabinet re-shuffle will keep the yen bulls on the tenterhooks.
The USD/JPY pair has extended its recovery and has managed to sustain above the critical hurdle of 133.00 in the Asian session. The asset has elevated its pullback move after nosediving to near 132.00 on Wednesday. The further journey is likely to remain critical as more upside would require sufficient strength from the greenback bulls.
The asset shifted into a negative trajectory after the US Consumer Price Index (CPI) tumbled to 8.5% from the prior release of 9.1%. Exhaustion signs in the price pressures after remaining a headache for the Federal Reserve (Fed) cheered the market participants. While the US dollar index (DXY) faced immense heat from the market participants.
No doubt, a lower release of US inflation has cooled off volatility in the global market and has trimmed the odds of extremely hawkish guidance by the Federal Reserve (Fed). However, the odds of a rate hike are still intact as the road to reaching a 2% inflation rate is far from over. Therefore, the US dollar index (DXY) has extended its recovery in the Asian session after a pullback move from a six-week low of 104.64.
On the Tokyo front, the ongoing cabinet re-shuffle is expected to result in a dramatic change in the situation of the Japanese yen on a broader basis. Finance Minister Shunichi Suzuki said that Japan’s financial position is still severe. He added that “it's critical to continue reacting to covid and inflation.”
In the remaining week, the US Michigan Consumer Sentiment Index (CSI) will hog the limelight. The sentiment data is expected to improve to 52.2 from the prior release of 51.5. This may strengthen the DXY as higher consumer confidence in the US economy will accelerate the overall demand.
- GBP/USD keeps pullback from one-week high, holds lower grounds near daily lows.
- US dollar retreats as Fedspeak fails to praise inflation miss, China-linked news favor safe haven demand.
- UK ministers will meet major energy firms amid talks of tightening 25% levy on North Sea oil and gas operators.
- US Jobless Claims, PPI will also be important for intraday directions.
GBP/USD remains pressured around 1.2200 heading into Thursday’s London open, having witnessed the biggest daily jump in two months the previous day.
That said, the US dollar’s weakness post-inflation release pleased the Cable pair buyers on Wednesday. However, the quote’s latest weakness could be linked to the mixed comments from the Fed policymakers and the cautious mood ahead of the key meeting between the UK ministers and energy companies. Also teasing the bears are the China-linked news surrounding the Sino-American trade war, covid and Taiwan.
“Government ministers are to meet energy companies on Thursday as the Treasury considers toughening the 25% levy on the profits of North Sea oil and gas operators announced in May,” Said The Guardian. The news also adds, “Chancellor Nadhim Zahawi and business secretary Kwasi Kwarteng will meet energy bosses to discuss soaring energy bills for households, at a time when oil and gas companies are raking in billions of pounds in profits.”
Elsewhere, Mary Daly, President of the San Francisco Fed recently hesitated to declare victory over inflation, even after the US Consumer Price Index (CPI) declined to 8.5% on YoY in July versus 8.7% expected and 9.1% prior. In doing so, the policymakers joined the likes of Minneapolis Fed President Neel Kashkari and Chicago Fed President Charles Evans. Previously, Fed’s Kashkari mentioned that he hasn't "seen anything that changes" the need to raise the Fed's policy rate to 3.9% by year-end and to 4.4% by the end of 2023. Further, Fed policymaker Evens stated, “The economy is almost surely a little more fragile, but would take something adverse to trigger a recession.” Fed’s Evans also called inflation "unacceptably" high.
Talking about China-related news, Reuters relied on sources to mention that the saying US President Biden rethinks steps on China tariffs in wake of Taiwan response. Additionally, a jump in the coronavirus cases from China, to 700 new confirmed cases in the mainland on August 10 versus 444 a day earlier, also weighs on the pair. Furthermore, China Customs’ latest rejection of US meat from a specific producer and comments from the Taiwan Foreign Ministry, suggest rejection of China’s motto of 'One country, Two systems’.
Amid these plays, S&P 500 Futures print mild gains near 4,220 by the press time after Wall Street rallied and the US Treasury yields remained mostly unchanged the previous day.
Looking forward, the outcome of the British Ministers’ meeting with energy firms will be important for the GBP/USD traders. Also crucial to track are the details surrounding the US Jobless Claims and the monthly Producer Price Index (PPI) for July. Furthermore, UK’s Q2 Gross Domestic Product (GDP) up for publishing on Friday, will also be important to watch for fresh impulse.
Technical analysis
A downward sloping trend line from June 16 restricts immediate GBP/USD upside around 1.2270. However, bears need validation from the 21-DMA support surrounding 1.2070 to retake control. That said, RSI (14) and MACD signals keep buyers hopeful.
- Asian equities have soared while Nikkei225 has pathways and has eased 0.65%.
- Signs of exhaustion in the inflation rate have cheered the risk-perceived assets.
- Oil prices have surpassed $90.00 despite a buildup of oil inventories last week.
Markets in the Asian domain have jumped sharply as investors’ risk appetite has improved dramatically after a soft landing of the US Consumer Price Index (CPI) on Wednesday. US equities remained upbeat after the US Bureau of Labor Statistics reported the plain-vanilla inflation rate at 8.5% on an annual basis, lower than the already downward consensus of 8.7%. While the core CPI that doesn’t inculcate volatile food and oil prices remained unchanged at 5.9%.
At the press time, China A50 surged 1.40%, Hang Seng jumped 1.90%, Nifty50 gained 0.80% while Japan’s Nikkei225 surrendered 0.65%.
The market participants were cautious as the Federal Reserve (Fed) was expected to remain harsh on interest rates after the release of the upbeat US Nonfarm Payrolls (NFP). Well, hawkish bets are still not down as the Fed has a long way to go to reach the neutral rate. But signs of exhaustion in the runaway inflation have cheered the risk-sensitive currencies.
Meanwhile, the US dollar index (DXY) is facing barricades around 105.40 and a downside move could resume as the lower inflation rate has not only trimmed the odds of prolonged hawkish guidance but has also trimmed recession fears.
On the oil front, oil prices have crossed the psychological resistance of $90.00 swiftly as recession fears have trimmed. This could be merely a pullback move as the Energy Information Administration (EIA) reported a decent buildup of oil inventories last week. The EIA oil stockpiles landed higher at 5.458 million barrels than the prior release of 4.467 million barrels.
“Mary Daly, President of the San Francisco Fed, did not rule out a third consecutive 0.75 percentage point rate rise at the central bank’s next policy meeting in September, although she signalled her initial support for the Fed to slow the pace of its interest rate increases,” said the Financial Times (FT) while quoting the latest interview with the policymaker.
Key quotes (From Financial Times)
There’s good news on the month-to-month data that consumers and business are getting some relief, but inflation remains far too high and not near our price stability goal.
Still, ‘core’ prices — which strip out volatile items such as energy and food — climbed higher, led by an uptick in services inflation that Daly said showed little sign of moderating.
This is why we don’t want to declare victory on inflation coming down.
We’re not near done yet.
There is a lot of uncertainty, so leaping ahead with great confidence that [a 0.75 percentage point rate rise] is what we need and being prescriptive would not be optimal policy.
We have a lot of work to do. I just don’t want to do it so reactively that we find ourselves spoiling the labor market.
If we tip the economy over and [people] lose jobs, then we haven’t really made them better off.
What we need is not a good report on inflation. It’s encouraging, but it’s not evidence of the goal we really want.
Instead, Daly is looking for the data in the aggregate to affirm the Fed is ‘on a path to bring inflation down substantially and achieve our price stability target’.
FX implications
The news joins the previously hawkish comments from Minneapolis Fed President Neel Kashkari and Chicago Fed President Charles Evans to challenge the market’s mood.
Also read: S&P 500 Futures cheer US inflation miss but yields stay sluggish on Fed, China concerns
AUD/USD remains pressured towards 0.7050 amid early Thursday morning in Europe. The Aussie pair’s latest weakness could be linked to the US dollar’s consolidation of the US inflation-led slump. In doing so, the AUD/USD prices ignore the heavily optimistic signals marked by the options market.
That said, the one-month risk reversal (RR) of the AUD/USD jumped the most since early June 2022 on the daily basis, while flashing 0.190 figures at the latest. It should be noted that the Aussie RR, the difference between the call options and the put options, also rose for the sixth consecutive day by the end of Wednesday’s North American session.
On the same line, the weekly RR braces for the biggest positive readings in nearly three months while flashing the 0.370 mark by the press time.
It’s worth observing that Australia’s downbeat prints of Consumer Inflation Expectations for August, to 5.9% from 6.3%, also exert downside pressure on the AUD/USD prices.
Also read: AUD/USD skids to near 0.7070 as Aussie Consumer Inflation Expectations slip to 5.9%
- USD/INR pares the biggest daily loss in four months around weekly low.
- Key SMAs, two-week-old resistance line challenge buyers amid bearish MACD signals.
- Weekly horizontal support holds the gate for bear’s entry.
USD/INR picks up bids to 79.22 as traders lick their wounds after the biggest daily fall since early April. Even so, the Indian rupee (INR) pair remains below the key short-term key resistances during early Thursday morning in Europe.
That said, the 50% Fibonacci retracement of the July 27 to August 02 downturn, around 79.30, appears the immediate hurdle for the USD/INR buyers to cross before challenging the 200-SMA level near 79.40.
It should be noted, however, that a convergence of the 200-SMA and 61.8% Fibonacci retracement level around 79.52 appears a strong resistance to watch.
If the quote rises past 79.52, a downward sloping trend line from July 28, near 79.60, acts as the last defense of the USD/INR bears.
On the contrary, the one-week-old horizontal support area surrounding the 79.00 threshold could restrict the immediate downside of the Indian rupee pair. Following that, the monthly low of 78.40 should return to the charts.
In a case where the USD/INR bears keep reins past 78.40, the odds of witnessing the 78.00 round figure back on the screen can’t be ruled out.
USD/INR: Four-hour chart
Trend: Limited recovery expected
- EUR/USD has tumbled to near 1.2850 amid a significant recovery in the DXY.
- A lower US CPI print has trimmed the odds of hawkish guidance while rate hike odds are solid.
- This week, the US Michigan CSI data will be of utmost importance.
The EUR/USD pair has declined gradually to near 1.2850 after surrendering the round-level support of 1.0300 in the Asian session. Earlier, the asset printed a fresh monthly high of 1.0369 after the US dollar index nosedived on the lower print of the US Consumer Price Index (CPI).
The plain-vanilla US CPI released lower at 8.5% than the estimates of 8.7% and the prior release of 9.1%. No doubt, a lower release of US inflation has cooled off volatility in the global market and has trimmed the odds of extremely hawkish guidance by the Federal Reserve (Fed). However, the odds of a rate hike are still intact as the road to reaching 2% inflation rate is far from over. Therefore, the US dollar index (DXY) has extended its recovery in the Asian session after a pullback move from a six-week low of 104.64.
Going forward, investors will keep an eye on the US Michigan Consumer Sentiment Index (CSI) data, which is due on Friday. As per the market consensus, the sentiment data is seen higher at 52.2 from its prior release of 51.5. A consecutive improvement is expected in the confidence of consumers after the data slipped to 50 for the first time in the past 20 years.
On the Eurozone front, an unchanged German inflation data at 8.5% despite a meaningful plunge in the oil prices have created havoc for the European Central Bank (ECB). A road to bring inflation down is getting trickier for the ECB as hiking interest rates is not easy due to debt-burden countries in the Eurozone.
- Gold price has slipped to near $1,785.00 as the DXY has advanced above 105.00.
- The precious metal has shifted into a healthy correction phase.
- A little higher consensus for Michigan CSI has supported the DXY bulls.
Gold price (XAU/USD) has dropped to near $1,785.00 after surrendering the critical support of $1,788.00 in the Asian session. The precious metal has entered into a healthy correction phase after printing a fresh monthly high at $1,807.96 on Wednesday.
Investors are trimming their gold positions after realizing that the lower US Consumer Price Index (CPI) for a single month can trim the hawkish guidance by the Federal Reserve (Fed) but cannot shrug off the odds of a rate hike in September. To be noted, the plain-vanilla US CPI landed at 8.5%, lower than the forecasts and the prior release of 8.7% and 9.1% respectively.
Meanwhile, the US dollar index (DXY) has extended its recovery after a confident pullback move and has reached to near 105.40. Now, the market participants are shifting their focus toward the US Michigan Consumer Sentiment Index (CSI), which is due on Friday. The sentiment data is expected to improve to 52.2 from the prior release of 51.5. A consecutive improvement is expected in the confidence of consumers after the data slipped to 50 for the first time in the past 20 years.
Gold technical analysis
Gold price has surrendered the cushion of the lower portion of the Rising Channel at $1,788.00, formed on the four-hour scale. The upper portion of the above-mentioned chart pattern is placed from July 22 high at $1,739.37 while the lower portion is plotted from July 27 low at $1,711.55.
A golden cross, represented by the 50-and 200-period Exponential Moving Averages (EMAs) at $1,768.90 adds to the upside filters.
While the Relative Strength Index (RSI) has shifted into the 40.00-60.00 range pertaining to a mild correction but is likely o find support at 40.00
Gold four-hour chart
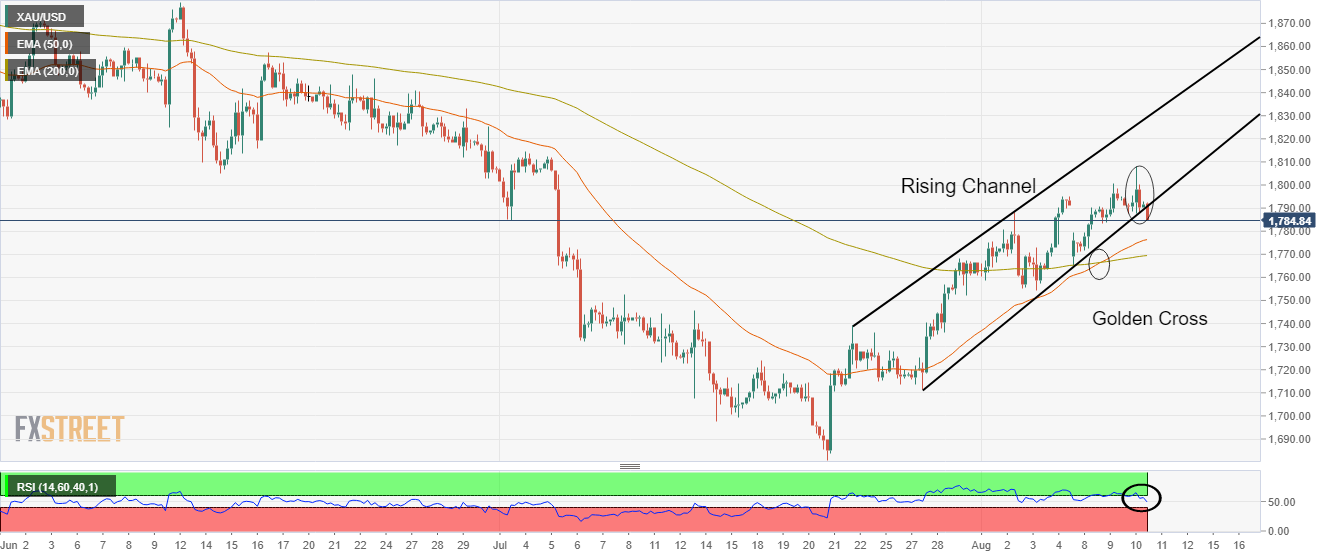
| Raw materials | Closed | Change, % |
|---|---|---|
| Silver | 20.591 | 0.38 |
| Gold | 1791.95 | -0.12 |
| Palladium | 2236.9 | 0.98 |
- Market sentiment remains cautiously optimistic amid fears surrounding Fed’s aggression, China.
- Fedspeak appears mixed despite softer US CPI for July.
- Biden’s rethink on China tariff, covid case increase in Mainland China weigh on sentiment.
- S&P 500 Futures print mild gains, US 10-year Treasury yields remain sluggish.
Risk appetite remains unclear during early Thursday, after the US inflation numbers triggered the market’s optimism. The reason could be linked to the latest comments from the Fed policymakers, as well as headlines surrounding China and coronavirus.
While portraying the mood, S&P 500 Futures print mild gains near 4,120 after Wall Street rallied. Further, the US Treasury yields remained mostly unchanged near the previous day’s closing around 2.79%. That said, the WTI crude oil grinds higher past $91.00, up 0.10% intraday, whereas the US Dollar Index (DXY) gains 0.14% to 105.40 at the latest.
Market sentiment improved after US Consumer Price Index (CPI) declined to 8.5% on YoY in July versus 8.7% expected and 9.1% prior. “Traders of futures tied to the Fed's benchmark interest rate pared bets on a third straight 75-basis-point hike at its Sept. 20-21 policy meeting, and now see a half-point increase as the more likely option,” mentioned Reuters after the US inflation data release.
Also supporting the optimism in the US markets were comments from US President Joe Biden who said, “Seeing some signs that inflation may be moderating,” as reported by Reuters. "We could face additional headwinds in the months ahead," Biden added. "We still have work to do but we're on track," adds US President Biden.
However, comments from Minneapolis Fed President Neel Kashkari and Chicago Fed President Charles Evans challenged the risk-on mood. That said, Fed’s Kashkari mentioned that he hasn't "seen anything that changes" the need to raise the Fed's policy rate to 3.9% by year-end and to 4.4% by the end of 2023. Further, Fed policymaker Evens stated, “The economy is almost surely a little more fragile, but would take something adverse to trigger a recession.” Fed’s Evans also called inflation "unacceptably" high.
On the same line were the headlines surrounding China that also underpinned the latest rebound in the US dollar. Reuters relied on sources to mention that the saying US President Biden rethinks steps on China tariffs in wake of Taiwan response. Additionally, a jump in the coronavirus cases from China, to 700 new confirmed cases in the mainland on August 10 versus 444 a day earlier, also weighs on the pair.
Given the market’s mixed performance, the traders should wait for weekly readings of the US Jobless Claims and the monthly Producer Price Index (PPI) for July for fresh impulse. Also important will be the risk catalysts and Friday’s preliminary readings of the Michigan Consumer Sentiment Index for August.
- US Dollar Index pares the biggest daily loss in five month, grinds higher around intraday top of late.
- Fed policymakers hesitate in cheering downbeat US inflation.
- Biden’s rethink on China tariffs, covid woes in the Dragon Nation challenge risk-on mood.
- US PPI, Jobless Claims could entertain intraday traders.
US Dollar Index (DXY) consolidate the biggest daily loss since early March during the mid-Asian session on Thursday. In doing so, the greenback’s gauge versus six major currencies takes clues from the mixed Fedspeak and fears surrounding China to reverse the US inflation-led losses, as well as refresh the intraday high near 105.40 at the latest.
The US Consumer Price Index (CPI) declined to 8.5% on YoY in July versus 8.7% expected and 9.1% prior. After the data, Reuters mentioned that traders of futures tied to the Fed's benchmark interest rate pared bets on a third straight 75-basis-point hike at its Sept. 20-21 policy meeting, and now see a half-point increase as the more likely option.
On the same line was US President Joe Biden who said, “Seeing some signs that inflation may be moderating,” as reported by Reuters. "We could face additional headwinds in the months ahead," Biden added. "We still have work to do but we're on track," adds US President Biden.
The Wall Street benchmarks rallied after the inflation miss but the US Treasury yields couldn’t cheer the softer CPI. The reason could be linked to the comments from Minneapolis Fed President Neel Kashkari and Chicago Fed President Charles Evans. Fed’s Kashkari mentioned that he hasn't "seen anything that changes" the need to raise the Fed's policy rate to 3.9% by year-end and to 4.4% by the end of 2023. Further, Fed policymaker Evens stated, “The economy is almost surely a little more fragile, but would take something adverse to trigger a recession.” Fed’s Evans also called inflation "unacceptably" high.
Furthermore, headlines surrounding China also underpinned the latest rebound in the US dollar. Reuters relied on sources to mention that the saying US President Biden rethinks steps on China tariffs in wake of Taiwan response. Additionally, a jump in the coronavirus cases from China, to 700 new confirmed cases in the mainland on August 10 versus 444 a day earlier, also weighs on the pair.
Against this backdrop, US 10-year Treasury yields rebound to 2.79% whereas the S&P 500 Futures print mild gains around 4,130 by the press time.
Moving on, DXY traders should pay attention to the weekly readings of the US Jobless Claims and the monthly Producer Price Index (PPI) for July for fresh impulse. Also important will be the risk catalysts and Friday’s preliminary readings of the Michigan Consumer Sentiment Index for August.
Technical analysis
US Dollar Index holds onto the previous day’s downside break of the ascending trend line from late March, as well as the 50-DMA, despite the latest corrective pullback from a six-week low.
Even if the DXY crosses the 50-DMA and the previous support line, respectively around 105.55 and 105.65, the bulls need validation from the 21-DMA hurdle surrounding 106.45 to retake control.
On the contrary, bears could aim for the 38.2% Fibonacci retracement level of the DXY’s run-up from late March to mid-July, around 104.85.
It’s worth noting that the bearish MACD and steady RSI (14) join the latest breakdown of the key supports, now resistances, to keep sellers hopeful.
US Dollar Index: Daily chart
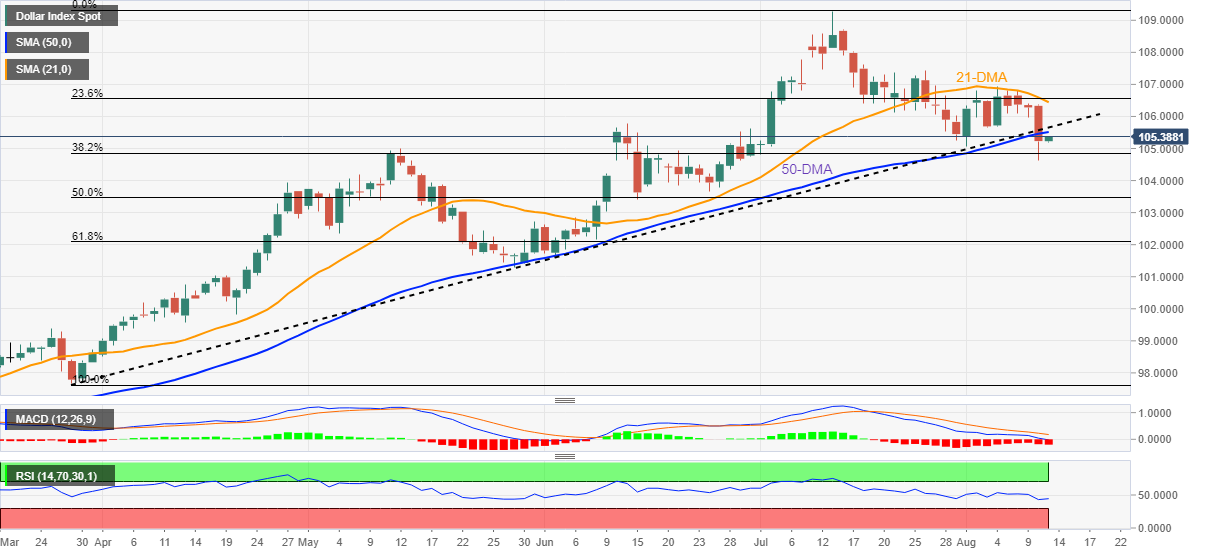
Trend: Further weakness expected
- GBP/USD bears are making their moves and a correction could be on the cards.
- Weekly resistance is a compelling feature across the time frames.
GBP/USD bulls are tiring following the overnight rally that was sparked by a miss in US Consumer Price Index. There are complications for the bulls at this point as they run into weekly resistance and there is a reversion pattern left behind on the daily chart that followed Wednesday's rally. The following illustrate the prospects of a move to the downside for the day ahead.
GBP/USD weekly chart
The weekly M-formation's neckline has been hit and the price could well start to feel a bout of strong supply at this juncture.
GBP/USD daily chart
The daily W-formation is compelling as the bears move in at resistance and eye the neckline of the pattern.
GBP/USD H1 scenarios
The price is moving to the downside following a strong rally to the upside on the back of the US inflation data. The Fibonaccis are in view for a move to mitigate the price imbalance to the downside that the rally has left behind on the hourly chart.
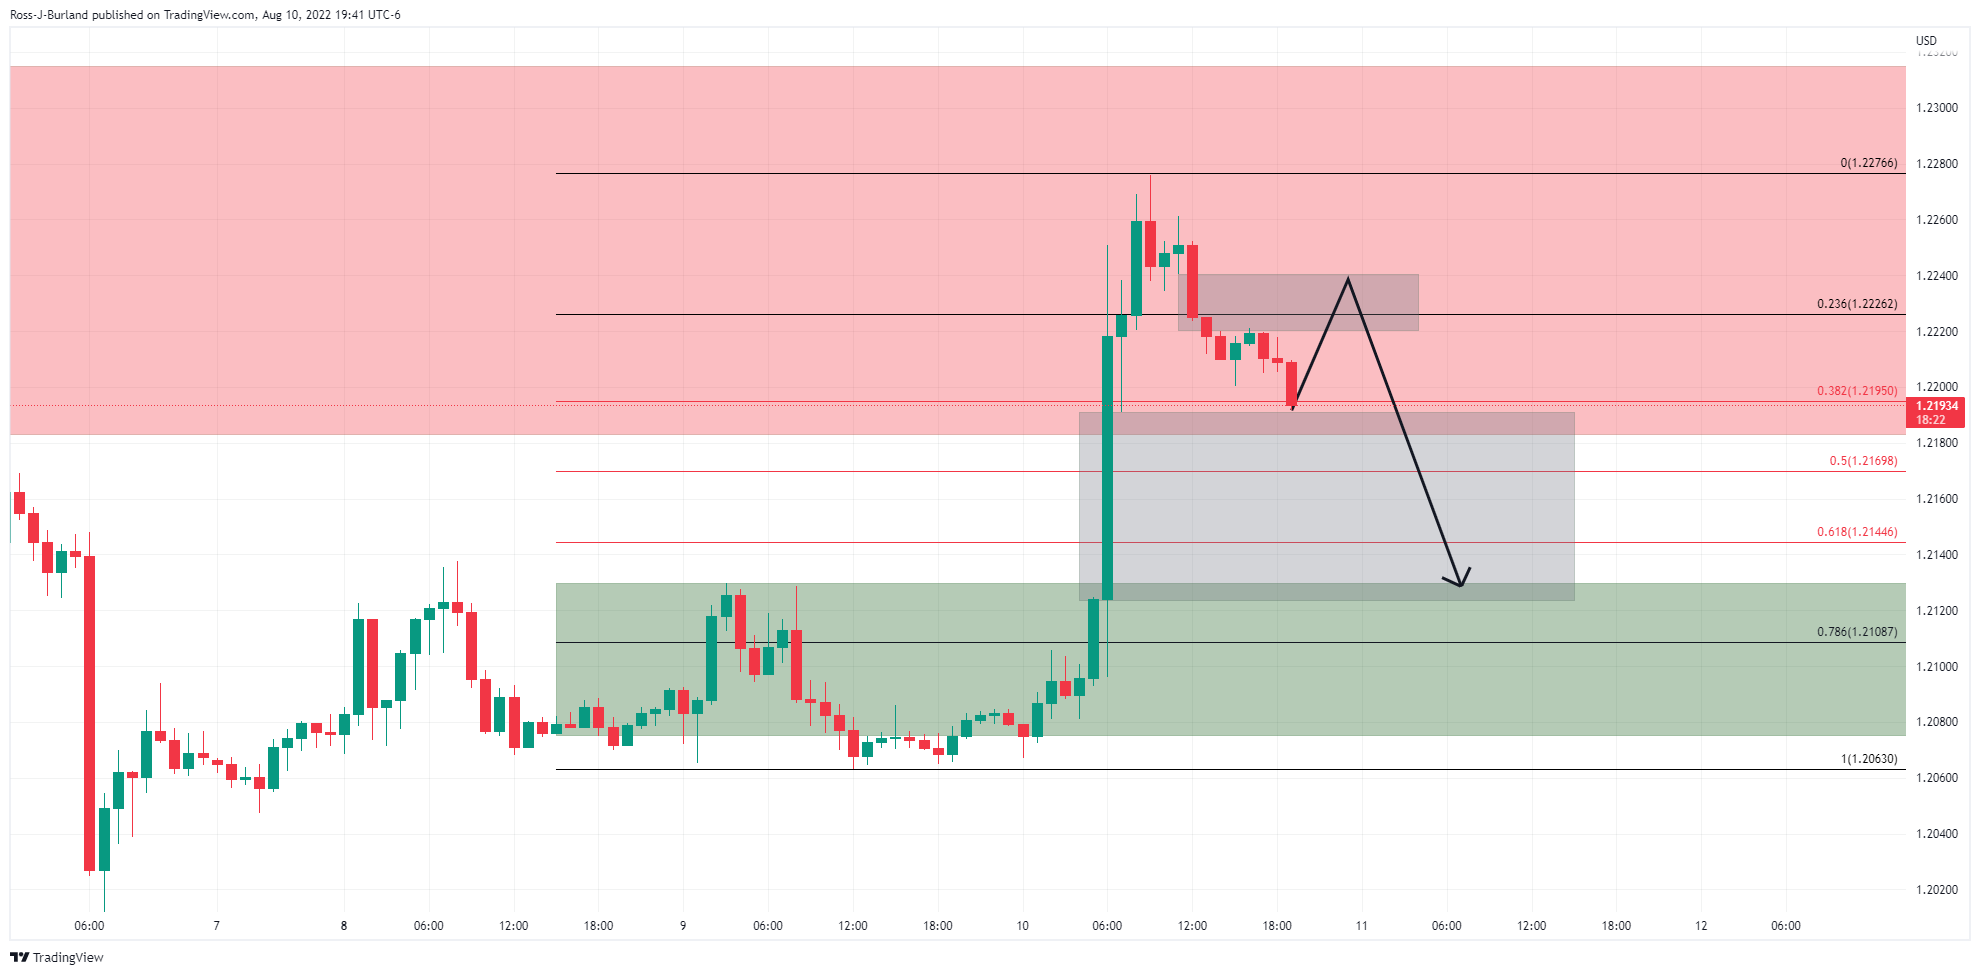
The price has left behind an imbalance to the upside on the hourly chart that could be mitigated prior to the next significant move lower.
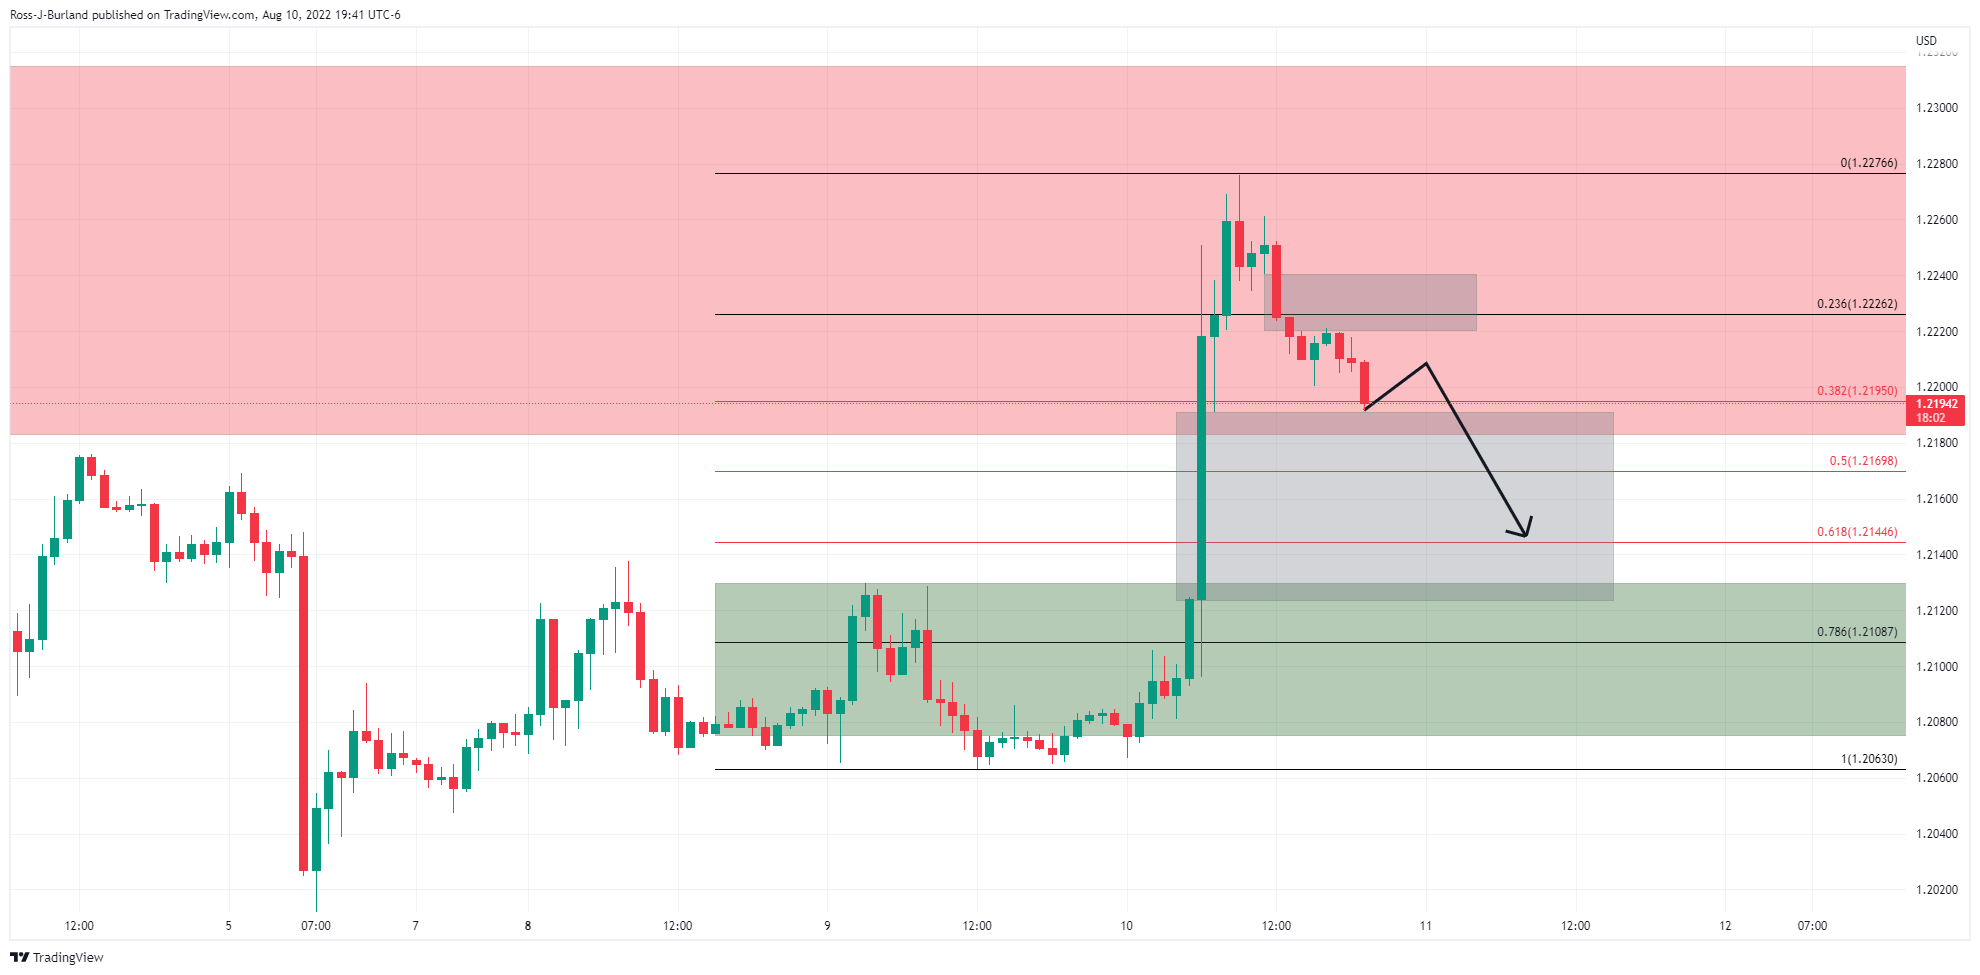
On the other hand, the price could well just fall through a low volume area if the session lows are broken in the coming hours.
- USD/CAD bounces off two-month low as US dollar licks post-inflation wounds.
- Headlines surrounding China, Fedspeak favors DXY’s corrective pullback.
- WTI crude oil grinds higher ahead of OPEC, IEA demand forecasts.
- US PPI, risk catalysts could entertain traders amid a light calendar.
USD/CAD picks up bids to refresh intraday high near 1.2785 as traders lick US inflation-led wounds at a two-month low during Thursday’s Asian session. In doing so, the quote justifies the US dollar’s recent rebound, amid doubts over the Fed’s next move and China-linked headlines, while ignoring upbeat prices of Canada’s main export item WTI crude oil.
The Loonie pair slumped the most since early June the previous day after the US Consumer Price Index (CPI) declined to 8.5% on YoY in July versus 8.7% expected and 9.1% prior. “After Wednesday's CPI report, traders of futures tied to the Fed's benchmark interest rate pared bets on a third straight 75-basis-point hike at its Sept. 20-21 policy meeting, and now see a half-point increase as the more likely option,” said Reuters following the data.
US President Joe Biden also cheered the US CPI miss while saying, “Seeing some signs that inflation may be moderating,” as reported by Reuters. "We could face additional headwinds in the months ahead," Biden added. "We still have work to do but we're on track," adds US President Biden.
However, Minneapolis Fed President Neel Kashkari and Chicago Fed President Charles Evans raised doubts about the latest easing of hawkish Fed bets. Fed’s Kashkari mentioned that he hasn't "seen anything that changes" the need to raise the Fed's policy rate to 3.9% by year-end and to 4.4% by the end of 2023. Further, Fed policymaker Evens stated, “The economy is almost surely a little more fragile, but would take something adverse to trigger a recession.” Fed’s Evans also called inflation "unacceptably" high.
In addition to the Fedspeak, headlines surrounding China also underpinned the latest rebound in the US dollar. Reuters relied on sources to mention that the saying US President Biden rethinks steps on China tariffs in wake of Taiwan response. Additionally, a jump in the coronavirus cases from China, to 700 new confirmed cases in the mainland on August 10 versus 444 a day earlier, also weighs on the pair.
Against this backdrop, S&P 500 Futures print mild gains near 4,120 by the press time after Wall Street rallied and the US Treasury yields remained mostly unchanged the previous day. That said, the WTI crude oil grinds higher past $91.00, up 0.10% intraday, whereas the US Dollar Index (DXY) gains 0.14% to 105.40 at the latest.
Looking forward, the weekly readings of the US Jobless Claims and the monthly Producer Price Index (PPI) for July could entertain the gold traders. However, major attention should be given to the qualitative factors in the wake of recent risk-negative headlines. Also important will be the monthly oil demand forecasts from the Organization of the Petroleum Exporting Countries (OPEC) and the International Energy Agency (IEA).
Technical analysis
USD/CAD recovery aims for the 100-DMA level surrounding 1.2800. However, the previous resistance line from early June, around 1.2820 by the press time, challenges the bull’s return. On the contrary, fresh selling remains doubtful until the quote stays beyond the 200-DMA support, near 1.2745 at the latest.
- AUD/USD has slipped to near 0.7070 amid a downward shift in Aussie inflation expectations data.
- The Aussie inflation guidance data has landed at 5.9%, lower than the prior release of 6.3%.
- A meaningful decline in US CPI may trim Fed’s hawkish guidance.
The AUD/USD pair has dropped to near 0.7070 as the University of Melbourne has released the Aussie Consumer Inflation expectations lower at 5.9%. Earlier, the long-term inflation data landed at 6.3%. A slippage in aussie Consumer Inflation Expectations, which presents the consumer expectations of future inflation during the next 12 months will force a decline in the guidance by the Reserve Bank of Australia (RBA).
Considering the plain-vanilla aussie inflation, which landed at 6.1%, recorded the highest since 1990, for the second quarter of CY2022, higher than the prior release of 5.1% indicates that the price pressures are still far from over. However, the exhaustion signal should be cherished.
To contain the inflation mess, the Reserve Bank of Australia (RBA) has already elevated its Official Cash Rate (OCR) to 1.85% after three consecutive 50 basis points (bps) interest rate hike announcements.
Meanwhile, the US dollar index (DXY) is displaying a lackluster performance in the Asian session. The DXY is sticking to its prior day’s closing price but is likely to re-visit its six-week low at 104.64 recorded on Wednesday. The downside shift in the US Consumer Price Index (CPI) forced the market participants to dump the DXY.
The plain-vanilla US inflation landed at 8.5%, lower than the expectations and the prior release of 8.7% and 9.1% on an annual basis. A decent drop in the inflation rate on an annual basis led by a serious fall in oil prices in July has displayed a meaningful exhaustion signal to the market participants. No doubt, more rate hikes will be announced by the Federal Reserve (Fed), however, the long-term hawkish guidance will witness a serious dent.
In recent trade today, the People’s Bank of China (PBOC) set the yuan (CNY) at 6.7324 vs. the last close of 6.7245.
About the fix
China maintains strict control of the yuan’s rate on the mainland.
The onshore yuan (CNY) differs from the offshore one (CNH) in trading restrictions, this last one is not as tightly controlled.
Each morning, the People’s Bank of China (PBOC) sets a so-called daily midpoint fix, based on the yuan’s previous day's closing level and quotations taken from the inter-bank dealer.
- AUD/JPY reverses the previous day’s gains amid cautious optimism, downbeat Aussie data.
- Australia Consumer Inflation Expectations eased to 5.9% from 6.3% in August.
- US tariff chatters, covid fears in China test buyers despite US inflation-led market optimism.
- Yields, risk catalysts are important for clear directions amid a light calendar.
AUD/JPY holds lower grounds near the intraday low surrounding 94.00 after Australia’s Consumer Inflation Expectations eased during August. In addition to the Aussie data, challenges to the sentiment also exert downside pressure on the cross currency pair.
The latest release of Australia Consumer Inflation Expectations dropped to 5.9% in August, versus 6.3% prior. The Aussie data tracks the US Consumer Price Index (CPI) that declined to 8.5% on YoY in July versus 8.7% expected and 9.1% prior, which in turn joins the latest economic fears signalled by the Reserve Bank of Australia (RBA) to challenge AUD/JPY bulls.
On the other hand, fears surrounding Australia’s largest customer China also weigh on the AUD/JPY prices. Reuters relied on sources to mention that the saying US President Biden rethinks steps on China tariffs in wake of Taiwan response. Additionally, a jump in the coronavirus cases from China, to 700 new confirmed cases in mainland on August 10 versus 444 a day earlier, also weigh on the pair.
Amid these plays, S&P 500 Futures print mild gains near 4,120 by the press time after Wall Street rallied and the US Treasury yields remained mostly unchanged the previous day.
Moving on, a light calendar requires AUD/JPY traders to concentrate on the risk catalysts, mainly surrounding China, for fresh impulse.
Technical analysis
Despite the latest pullback, AUD/JPY sellers need to break the 50-DMA support surrounding 93.85 to retake control. On the contrary, an upside break of the latest peak of 94.42 should lure bulls.
- EUR/USD remains indecisive after retreating from five-week high.
- Monthly horizontal line challenges pullback from 50% Fibonacci retracement of June-July downside.
- Buyers have a comparatively smoother road to journey than the one signaled for bear’s return.
EUR/USD treads water around 1.0300, after refreshing the monthly high, during Thursday’s initial Tokyo session. In doing so, the major currency pair struggles to extend the previous pullback from the 50% Fibonacci retracement of a downturn between June and July.
That said, bullish MACD signals and the quote’s sustained trading beyond the previous horizontal resistance line from early July, around 1.0280, keep EUR/USD buyers hopeful.
Even if the quote drops below 1.0280, the 200-SMA and a downward sloping trend line from early June, respectively near 1.0230 and 1.0205, could challenge the pair sellers.
It’s worth noting that a four-week-long support line of around 1.0180 acts as the last defense for the EUR/USD buyers.
Meanwhile, the pair’s fresh run-up could aim for the aforementioned key Fibonacci retracement level near 1.0365.
Following that, a run-up towards the 61.8% Fibonacci retracement and the late June swing high, surrounding 1.0460 and 1.0490 in that order, could lure the EUR/USD bulls.
Overall, EUR/USD is likely to remain on the bull’s radar until staying beyond 1.0180.
EUR/USD: Four-hour chart
Trend: Further upside expected
China's islands and cities are battling COVID-19 outbreaks yet again. By the start of the week, there were at least nine cities and towns, with a combined population of about 7 million, said their residents must not leave where they live except for necessary reasons such as COVID tests, grocery shopping or essential job roles. They also suspended public transport services.
In recent trade, it has been reported that China's Sanya's cases are surging and the city of Yiwu has moved into lockdown. Meanwhile, China's capital Beijing and financial hub Shanghai reported zero new cases, local government data showed earlier this week. The southern technology hub of Shenzhen also recorded no new infections.
- EUR/GBP has slipped lower after facing selling pressure around 0.8440.
- An unchanged German HICP at 8.5% has weakened the shared currency bulls.
- The US GDP is expected to remain vulnerable ahead.
The EUR/GBP pair has faced hurdles around the critical resistance of 0.8440 in the early Tokyo session. Earlier, the cross displayed a pullback move after a sheer downside to near 0.8420. The asset plunged on Wednesday after declining below the critical support of 0.8440 as the German Harmonized Index of Consumer Prices (HICP) remained unchanged at 8.5%. Also, the German inflation landed in line with the estimates.
It is worth noting that the US economy also reported the inflation rate, which tumbled sharply due to weak oil prices. The impact of weak oil prices should also be reflected in German inflation too. This indicates that the ongoing energy crisis in Germany after Russia blocked the major pipeline of gas to Europe shrugged off the impact of lower oil prices.
And, the market participants dumped the shared currency bulls. Well, the multiplier effects of the same will be faced by the European Central Bank (ECB) and their job of containing the inflation mess will get trickier.
On the UK front, the market participants are expecting a shrink in Gross Domestic Product (GDP) in the second quarter by 0.2% against the expansion of 0.3%. Also, the UK economy is expected to shrink by 1.3% against the expansion of 0.5% on a monthly basis. Adding to that, the estimate for annual GDP is 2.8%, significantly lower than the prior print of 8.7%.
Adding to that, an underperformance is also expected on the Manufacturing production front. The annual data is likely to slip lower to 1.3% vs. the prior release of 2.3%. Whereas, Industrial Production could display an uptick to 1.6% from 1.4% annually.
| Index | Change, points | Closed | Change, % |
|---|---|---|---|
| NIKKEI 225 | -180.63 | 27819.33 | -0.65 |
| Hang Seng | -392.6 | 19610.84 | -1.96 |
| KOSPI | -22.58 | 2480.88 | -0.9 |
| ASX 200 | -37.1 | 6992.7 | -0.53 |
| FTSE 100 | 18.91 | 7507.11 | 0.25 |
| DAX | 165.96 | 13700.93 | 1.23 |
| CAC 40 | 33.44 | 6523.44 | 0.52 |
| Dow Jones | 535.1 | 33309.51 | 1.63 |
| S&P 500 | 87.77 | 4210.24 | 2.13 |
| NASDAQ Composite | 360.88 | 12854.8 | 2.89 |
- Gold price remains sidelined around one-month high, traders flirt with previous resistance.
- Fedspeak, US-China chatters join 61.8% Fibonacci retracement level to challenge XAU/USD bulls.
- Risk catalysts will be important, US PPI, Jobless Claims can entertain traders.
Gold price (XAU/USD) fades US inflation-led gains as the metal retreats to $1,790 during the initial Tokyo session on Thursday. The precious metal’s latest weakness could be linked to the mixed concerns surrounding the US Federal Reserve’s (Fed) next moves and the Sino-American tension.
On Wednesday, the US Consumer Price Index (CPI), declined to 8.5% on YoY in July versus 8.7% expected and 9.1% prior. Following the US inflation release, US President Joe Biden said on Wednesday that they are seeing some signs that inflation may be moderating, as reported by Reuters. "We could face additional headwinds in the months ahead," Biden added. "We still have work to do but we're on track," adds US President Biden.
“After Wednesday's CPI report, traders of futures tied to the Fed's benchmark interest rate pared bets on a third straight 75-basis-point hike at its Sept. 20-21 policy meeting, and now see a half-point increase as the more likely option,” said Reuters following the data.
On the contrary, Minneapolis Fed President Neel Kashkari recently mentioned, “The Fed is ‘far, far away from declaring victory’ on inflation.” The policymaker also added that he hasn't "seen anything that changes" the need to raise the Fed's policy rate to 3.9% by year-end and to 4.4% by the end of 2023. Elsewhere, Chicago Fed President Charles Evans stated, “The economy is almost surely a little more fragile, but would take something adverse to trigger a recession.” Fed’s Evans also called inflation "unacceptably" high.
Additionally, Reuters relied on sources to mention that the saying US President Biden rethinks steps on China tariffs in wake of Taiwan response, which in turn challenged the XAU/USD bulls.
Against this backdrop, S&P 500 Futures print mild gains near 4,120 by the press time after Wall Street rallied and the US Treasury yields remained mostly unchanged the previous day.
Moving on, the weekly readings of the US Jobless Claims and the monthly Producer Price Index (PPI) for July could entertain the gold traders. However, major attention should be given to the qualitative factors in the wake of recent risk-negative headlines.
Technical analysis
Gold price remains pressured towards the previous resistance line from mid-June, after failing to cross the 61.8% Fibonacci retracement of the June-July downturn.
However, higher-low on the XAU/USD prices gain support from the same pattern of the RSI (14), which in turn portrays the bullish divergence and keeps the metal buyers hopeful.
It’s worth noting that, the commodity’s downside break of the resistance-turned-support, near $1,788, isn’t a call to the gold sellers as a three-week-old ascending support line and the 50-SMA, respectively near $1,783 and $1,777, could challenge the quote’s further weakness.
Alternatively, recovery moves need validation from the 61.8% Fibonacci retracement level surrounding $1,804.
Following that, a run-up towards the mid-June swing high near $1,858 can’t be ruled out.
Gold: Four-hour chart
Trend: Further upside expected
- NZD/USD bears could be about to move in.
- The 0.6350s is vulnerable to a restest in the coming sessions.
NZD/USD is stacking up for a downside correction with 0.6350 eyed as a potential support area that could be met should the bulls continue to throw in the towel following Wednesday's surge related to the US CPI data.
NZD/USD daily chart
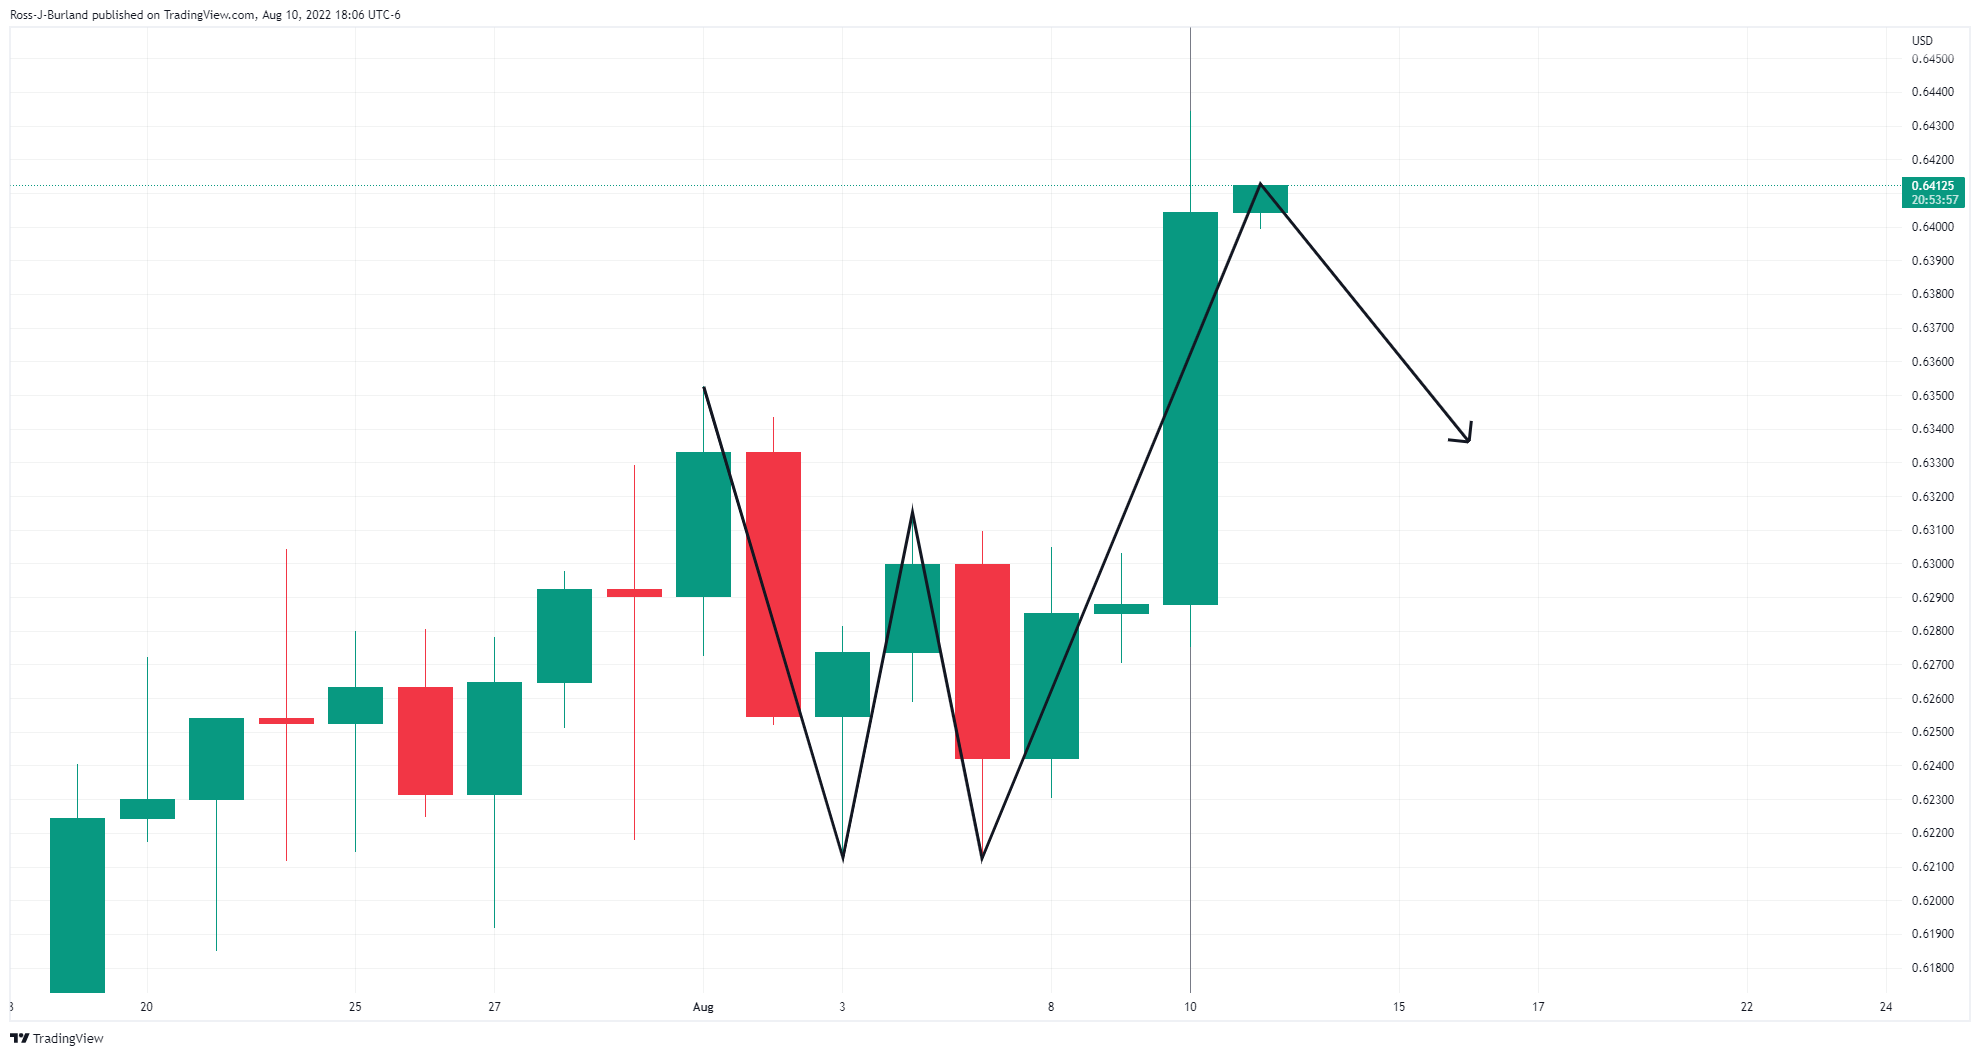
The price is stalling on the bid and a downside correction could be on the cards for the days ahead.
NZD/USD H1 chart
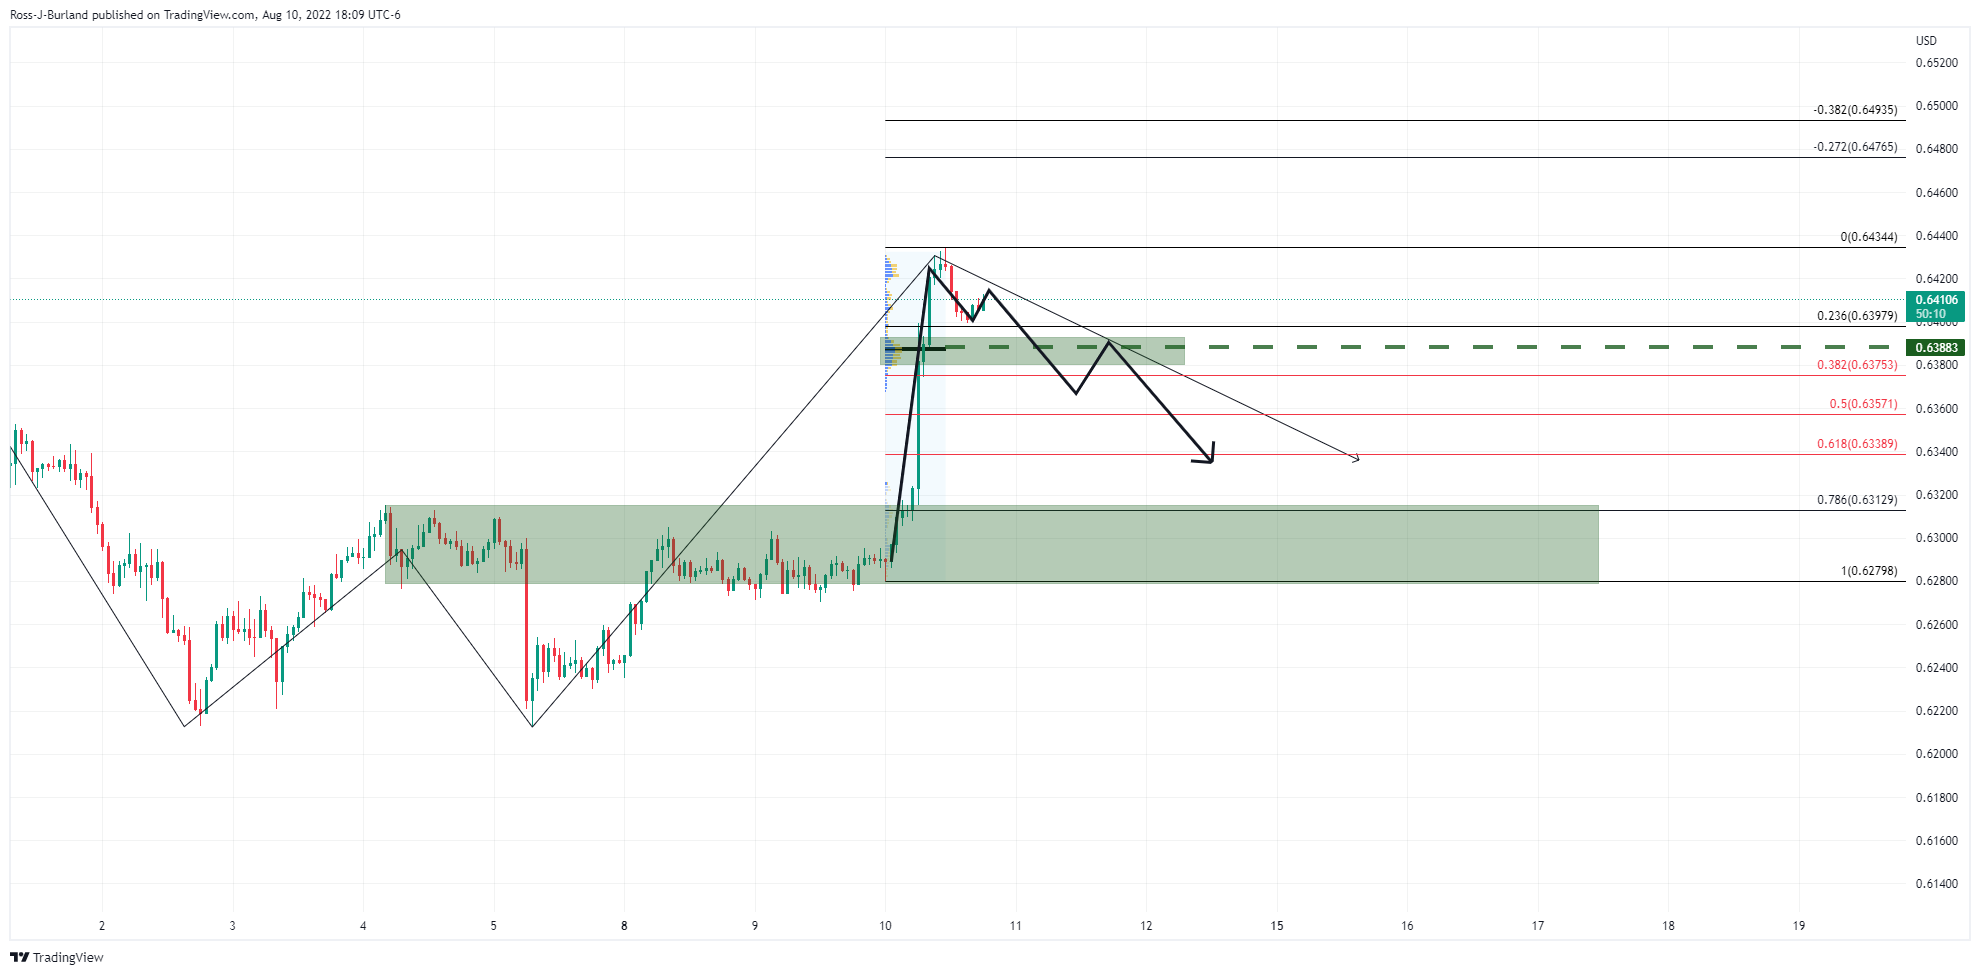
The price needs to get below the volumes seen around 0.6380/90 and in doing so, it will be moving in on the 38.2% Fibonacci retracement level. If this were to give, then there will be prospects of a 50% mean revision of the hourly bullish impulse. Below there, 61.8% and 78.6% will come into focus that guards a run to the neckline of the daily chart's W pattern around 0.6280/6315.
| Pare | Closed | Change, % |
|---|---|---|
| AUDUSD | 0.70786 | 1.66 |
| EURJPY | 136.849 | -0.83 |
| EURUSD | 1.0299 | 0.84 |
| GBPJPY | 162.294 | -0.49 |
| GBPUSD | 1.22152 | 1.18 |
| NZDUSD | 0.63957 | 1.74 |
| USDCAD | 1.27737 | -0.85 |
| USDCHF | 0.94256 | -1.16 |
| USDJPY | 132.883 | -1.63 |
- Downside momentum is indicating that the DXY will re-visit its six-week low at 104.64.
- The odds of a Fed rate hike will remain steady while the hawkish guidance will trim abruptly.
- A meaningful decline in the US CPI has underpinned risk-sensitive assets.
The US dollar index (DXY) witnessed an intense sell-off on Wednesday after a downward shift in the US Consumer Price Index (CPI). The DXY fell like a house of cards as a significant slowdown in the price pressures trimmed the odds of a bumper rate hike by the Federal Reserve (Fed) in its September monetary policy meeting. A downside break of the consolidation formed in a 106.00-106.80 range dragged the asset towards 104.64. A pullback move has been observed, however, the downside will remain intact.
Plain-Vanilla CPI skids 60 bps
The plain-vanilla US inflation landed at 8.5%, lower than the expectations and the prior release of 8.7% and 9.1% on an annual basis. A decent drop in the inflation rate on an annual basis led by a serious fall in oil prices in July has displayed a meaningful exhaustion signal to the market participants. No doubt, more rate hikes will be announced by the Federal Reserve (Fed), however, the long-term hawkish guidance will witness a serious dent.
Risk-on market mood to remain for a while
After a series of policy tightening measures by the Fed through raising interest rates and concluding the bond-purchase program, a sigh of relief is taken by Fed policymakers. A month with upbeat employment data and a significant drop in the price pressures is what investors were eyeing for the past few months to push liquidity into the risk-perceives assets. Going forward, the risk-on impulse will remain active for a tad longer period.
US inflation expectations, as per the 10-year breakeven inflation rate per the St. Louis Federal Reserve (FRED) data, dropped to the lowest levels in two weeks after the US Bureau of Labor Statistics released downbeat figures of the US Consumer Price Index (CPI) for July on Wednesday.
That said, the inflation precursor dropped to 2.43% by the end of Wednesday’s North American session.
Following the US inflation release, US President Joe Biden said on Wednesday that they are seeing some signs that inflation may be moderating, as reported by Reuters. "We could face additional headwinds in the months ahead," Biden added. "We still have work to do but we're on track," adds US President Biden.
“After Wednesday's CPI report, traders of futures tied to the Fed's benchmark interest rate pared bets on a third straight 75-basis-point hike at its Sept. 20-21 policy meeting, and now see a half-point increase as the more likely option,” said Reuters.
However, Minneapolis Fed President Neel Kashkari mentioned, “The Fed is ‘far, far away from declaring victory’ on inflation. The policymaker also added that he hasn't ‘seen anything that changes’ the need to raise the Fed's policy rate to 3.9% by year-end and to 4.4% by the end of 2023. Elsewhere, Chicago Fed President Charles Evans mentioned, “The economy is almost surely a little more fragile, but would take something adverse to trigger a recession.” Fed’s Evans also called inflation "unacceptably" high.
FX implications
Markets remain cautiously optimistic following the latest reduction in the US CPI, as well as the slump in inflation expectations. That said, S&P 500 Futures print mild gains near 4,120 by the press time.


© 2000-2026. All rights reserved.
This site is managed by Teletrade D.J. LLC 2351 LLC 2022 (Euro House, Richmond Hill Road, Kingstown, VC0100, St. Vincent and the Grenadines).
The information on this website is for informational purposes only and does not constitute any investment advice.
The company does not serve or provide services to customers who are residents of the US, Canada, Iran, The Democratic People's Republic of Korea, Yemen and FATF blacklisted countries.
Making transactions on financial markets with marginal financial instruments opens up wide possibilities and allows investors who are willing to take risks to earn high profits, carrying a potentially high risk of losses at the same time. Therefore you should responsibly approach the issue of choosing the appropriate investment strategy, taking the available resources into account, before starting trading.
Use of the information: full or partial use of materials from this website must always be referenced to TeleTrade as the source of information. Use of the materials on the Internet must be accompanied by a hyperlink to teletrade.org. Automatic import of materials and information from this website is prohibited.
Please contact our PR department if you have any questions or need assistance at pr@teletrade.global.
transfers