- Analytics
- News and Tools
- Market News
CFD Markets News and Forecasts — 11-04-2024
The Federal Reserve (Fed) should be able to start cutting interest rates by the end of 2024, according to Kristalina Georgieva, managing director of the International Monetary Fund.
Key quotes
“We remain on our projection that we would see, by the end of the year, the Fed being in a position to take some action in a direction of bringing interest rates down,”
“But again, don’t hurry until the data tells you you can do it.”
“Inflation is going down.”
“But, it is not yet where we want it to be.”
Market reaction
At the press time, the US Dollar Index (DXY) was down 0.01% on the day to trade at 105.27.
Fed FAQs
Monetary policy in the US is shaped by the Federal Reserve (Fed). The Fed has two mandates: to achieve price stability and foster full employment. Its primary tool to achieve these goals is by adjusting interest rates. When prices are rising too quickly and inflation is above the Fed’s 2% target, it raises interest rates, increasing borrowing costs throughout the economy. This results in a stronger US Dollar (USD) as it makes the US a more attractive place for international investors to park their money. When inflation falls below 2% or the Unemployment Rate is too high, the Fed may lower interest rates to encourage borrowing, which weighs on the Greenback.
The Federal Reserve (Fed) holds eight policy meetings a year, where the Federal Open Market Committee (FOMC) assesses economic conditions and makes monetary policy decisions. The FOMC is attended by twelve Fed officials – the seven members of the Board of Governors, the president of the Federal Reserve Bank of New York, and four of the remaining eleven regional Reserve Bank presidents, who serve one-year terms on a rotating basis.
In extreme situations, the Federal Reserve may resort to a policy named Quantitative Easing (QE). QE is the process by which the Fed substantially increases the flow of credit in a stuck financial system. It is a non-standard policy measure used during crises or when inflation is extremely low. It was the Fed’s weapon of choice during the Great Financial Crisis in 2008. It involves the Fed printing more Dollars and using them to buy high grade bonds from financial institutions. QE usually weakens the US Dollar.
Quantitative tightening (QT) is the reverse process of QE, whereby the Federal Reserve stops buying bonds from financial institutions and does not reinvest the principal from the bonds it holds maturing, to purchase new bonds. It is usually positive for the value of the US Dollar.
- EUR/USD remains on the defensive around 1.0728 in Friday’s early Asian session.
- US PPI figure rose 0.2% MoM in March, compared to the 0.3% estimate; yearly PPI climbed 2.1%, the biggest gain since April 2023.
- The ECB held its key interest rates steady at 4.0% for a fifth straight meeting on Thursday, as widely expected.
The EUR/USD pair trades with a negative bias near 1.0728 on Friday during the early Asian session. The modest recovery in the US Dollar (USD) amid the rising speculation of a Fed rate cut in September weighs on the major pair. On Thursday, the European Central Bank (ECB) held interest rates steady at a record high as expected and opened the door to a rate cut in June. Investors await the German March inflation data and the preliminary US Michigan Consumer Sentiment, due on Friday.
A measure of US inflation at the wholesale level came in softer-than-expected in March, boosting hopes for rate cuts from the Federal Reserve (Fed) this year. The US Producer Price Index (PPI) rose 0.2% MoM in March, compared to the 0.3% estimate. Annually, the PPI jumped 2.1% YoY in the same period, the biggest gain since April 2023. Additionally, the Core PPI, excluding food and energy, increased 2.4% YoY, beating market expectations, according to the Bureau of Labor Statistics on Thursday.
The report had little impact on the market. Investors are now pricing in only two rate cuts this year, which will most likely begin in September, according to CME FedWatch Tool. The FOMC minutes released on Wednesday showed that participants noted their uncertainty about the elevated high inflation and recent data had not increased their confidence that inflation was moving sustainably down to 2%," according to the minutes.
Across the pond, the ECB held its key interest rates steady at 4.0% for a fifth straight meeting on Thursday. The central bank also hinted about an upcoming rate cut, despite uncertainty over the Fed's next moves. The markets have priced in a 25 basis points (bps) rate cut from the ECB in June, according to LSEG data. The growing speculation that the ECB would cut its rate before the US Fed exerted some selling pressure on the Euro (EUR) and acts as a tailwind for the EUR/USD pair.
- AUD/USD edges up to 0.6539 after US producer inflation hints at easing pressures.
- US Jobless Claims drop, indicating a resilient labor market despite mixed economic signs.
- Federal Reserve officials express concerns over inflation trends, influencing market expectations about the timing and extent of future rate cuts.
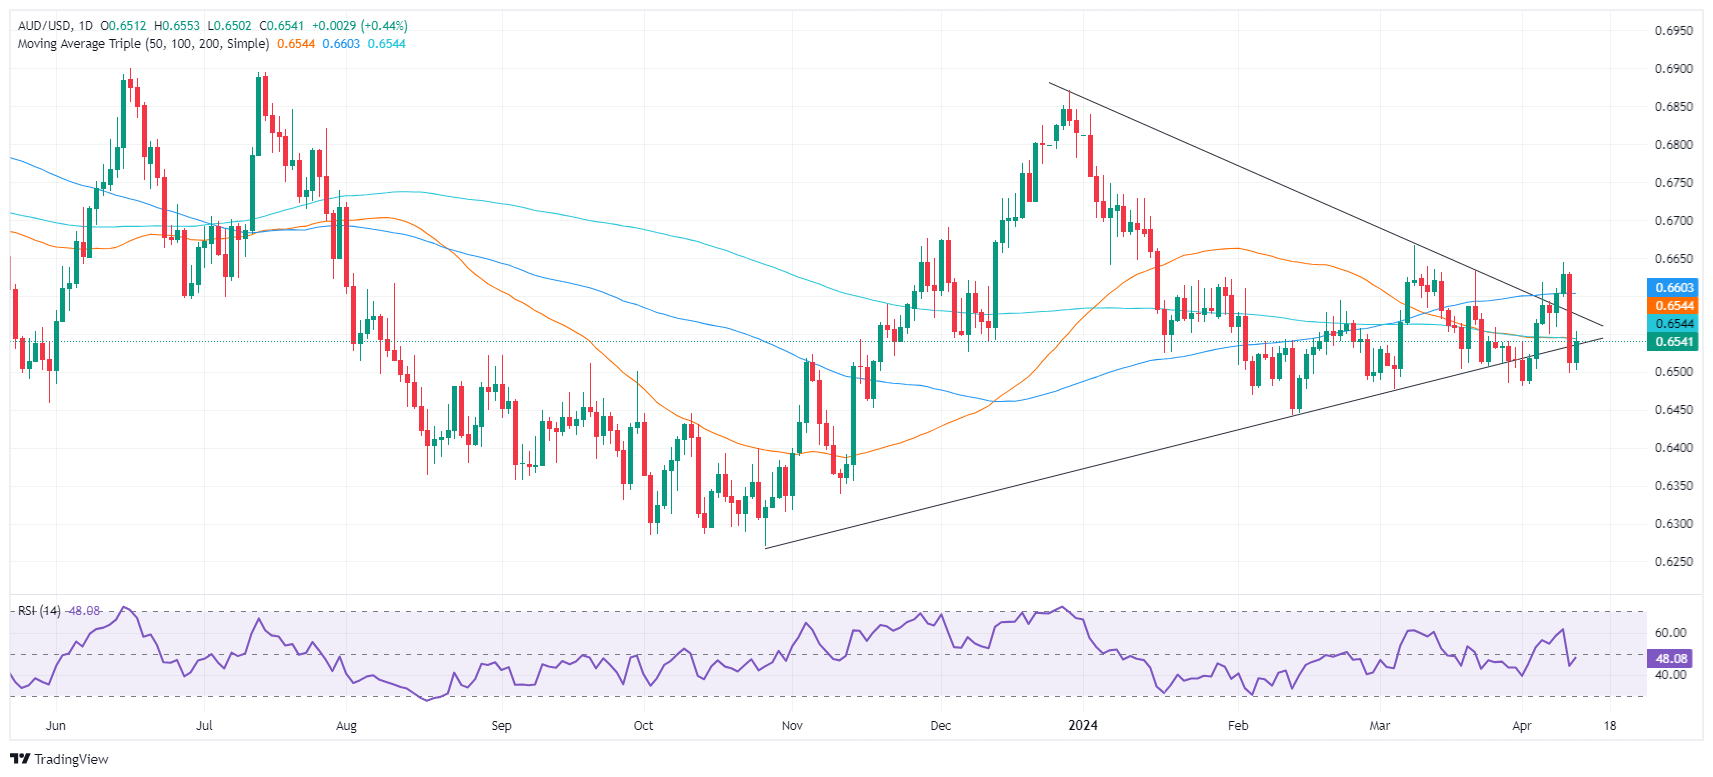
The Australian Dollar recovered some territory against the US Dollar yet fell shy of reclaiming key technical resistance levels after Thursday’s US inflation data capped the Greenback's advance. As the Asian session begins, the AUD/USD trades at 0.6539, up by a minimal 0.02% at the time of writing.
AUD/USD shows a slight recovery after US PPI data underperforms expectations
On Thursday, the US Department of Labor revealed March’s Producer Price Index (PPI) with figures registering a 0.2% MoM increase, which is below the anticipated 0.3%. Similarly, the core PPI, which excludes volatile food and energy prices, also recorded a 0.2% increase, falling short of both estimates and the previous month's figure.
Annually based figures showed the PPI increasing by 2.1%, less than expected but up from February's 1.6%. Meanwhile, the core PPI over the same period stood at 2.4%, exceeding both forecasts and the figure from the prior month.
Other data revealed that the number of Americans filing for unemployment benefits fell, as Initial Jobless Claims for the week ending April 6 dipped from 222K to 211K, below estimates of 215K.
Given Thursday’s economic data's mixed outlook, AUD/USD traders booked profits following Wednesday’s plunge of 1.75%, which dragged spot prices to a fresh weekly low of 0.6498.
Elsewhere, Federal Reserve officials remain in a wait-and-see mode, led by New York Fed President John Williams, who commented that recent inflation data is disappointing. Richmond Fed Thomas Barkin added that “inflation data raise the question if we are seeing a shift.” Finally, Boston Fed Susan Collins added that she still sees rate cuts in 2024, though they could be fewer than projected.
In that regard, futures traders of Federal funds rates (FFR) are projecting that the Fed would ease policy twice, as shown by data from the Chicago Board of Trade (CBOT). The December 2024 contract depicts traders expect the FFR to end at 4.97%.
AUD/USD Price Analysis: Technical outlook
From a technical perspective, the AUD/USD tilted slightly bearish after cracking the confluence of the 50 and 200-day moving averages (DMAs) at 0.6541. If buyers conquer that level, the next resistance will be 0.6600. However, failure to do so will drive the exchange rate below 0.6500, opening the door to test April’s 1 low of 0.6483, ahead of the February 13 low of 0.6442.
New Zealand’s Business NZ Performance of Manufacturing Index (PMI) contracted to 47.1 in March from the previous reading of 49.3, according to Business NZ on Friday.
This reading registered the lowest since December 2023 and has now been in contraction for 13 consecutive months.
“The PMI’s average for the first quarter of the year is consistent with manufacturing GDP posting another quarter that is below that of a year earlier," said BNZ’s Senior Economist Doug Steel.
Market reaction
At the press time, the NZD/USD pair was up 0.11% on the day to trade at 0.6003.
New Zealand Dollar FAQs
The New Zealand Dollar (NZD), also known as the Kiwi, is a well-known traded currency among investors. Its value is broadly determined by the health of the New Zealand economy and the country’s central bank policy. Still, there are some unique particularities that also can make NZD move. The performance of the Chinese economy tends to move the Kiwi because China is New Zealand’s biggest trading partner. Bad news for the Chinese economy likely means less New Zealand exports to the country, hitting the economy and thus its currency. Another factor moving NZD is dairy prices as the dairy industry is New Zealand’s main export. High dairy prices boost export income, contributing positively to the economy and thus to the NZD.
The Reserve Bank of New Zealand (RBNZ) aims to achieve and maintain an inflation rate between 1% and 3% over the medium term, with a focus to keep it near the 2% mid-point. To this end, the bank sets an appropriate level of interest rates. When inflation is too high, the RBNZ will increase interest rates to cool the economy, but the move will also make bond yields higher, increasing investors’ appeal to invest in the country and thus boosting NZD. On the contrary, lower interest rates tend to weaken NZD. The so-called rate differential, or how rates in New Zealand are or are expected to be compared to the ones set by the US Federal Reserve, can also play a key role in moving the NZD/USD pair.
Macroeconomic data releases in New Zealand are key to assess the state of the economy and can impact the New Zealand Dollar’s (NZD) valuation. A strong economy, based on high economic growth, low unemployment and high confidence is good for NZD. High economic growth attracts foreign investment and may encourage the Reserve Bank of New Zealand to increase interest rates, if this economic strength comes together with elevated inflation. Conversely, if economic data is weak, NZD is likely to depreciate.
The New Zealand Dollar (NZD) tends to strengthen during risk-on periods, or when investors perceive that broader market risks are low and are optimistic about growth. This tends to lead to a more favorable outlook for commodities and so-called ‘commodity currencies’ such as the Kiwi. Conversely, NZD tends to weaken at times of market turbulence or economic uncertainty as investors tend to sell higher-risk assets and flee to the more-stable safe havens.
- Silver surges, bolstered by easing US producer prices, sparking interest in precious metals.
- Though overbought, strong bullish momentum could target the next resistance at $28.74.
- Support established at $28.00 and $27.54, key during potential pullbacks.
Silver price surges on Thursday after the release of prices paid by producers in the United States (US) showed that factory inflation continues to decelerate, contrasting Wednesday’s red-hot Consumer Price Index (CPI). Investors capitalized on that, as they took advantage of the dip in precious metals and lifted their prices near year-to-date peaks.
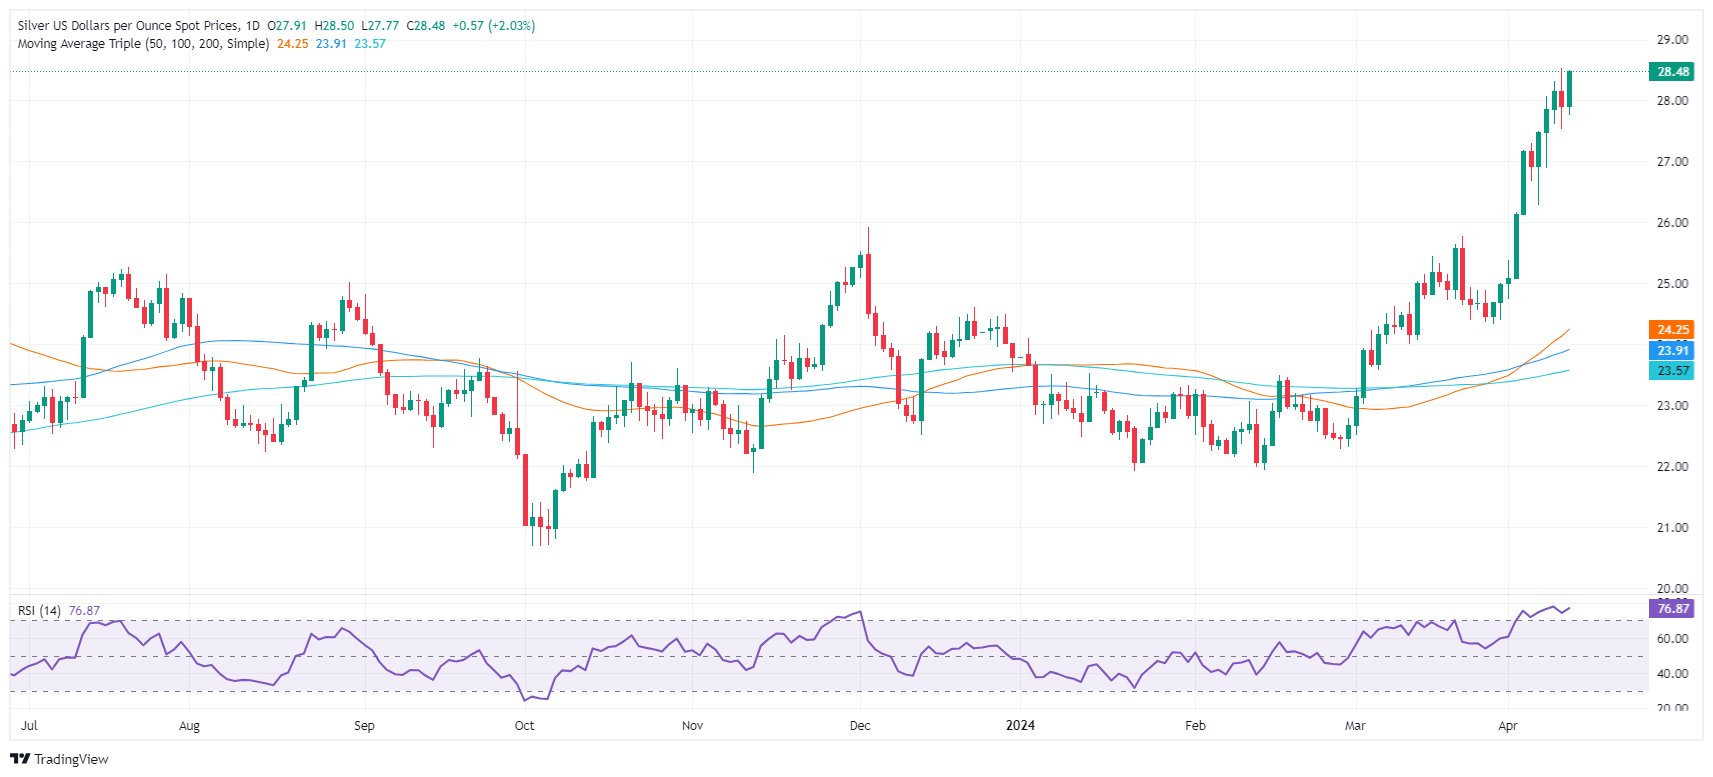
The XAG/USD trades at $28.45 and clocks minimal gains of 0.09% after ending Thursday’s session up by 1.94%.
XAG/USD Price Analysis: Technical outlook
The grey metal rally is set to extend after rallying after June 10, 2021, at a high of $28.28, which has opened the door for further upside. Silver gains momentum, although momentum oscillators suggest it's overbought. The Relative Strength Index (RSI), at 77.41, is still shy of reaching the 80 levels sought by traders as the overbought condition in a strong bullish trend.
With that said Silver’s next resistance would be the May 18 high at $28.74, followed by the psychological $29.00 figure. On the other hand, if sellers drag prices below the June 10, 2021, high, turned support, that will pave the way for further losses. The first support would be $28.00, followed by the April 10 low of $27.54, ahead of $27.00.
XAG/USD Price Action – Daily Chart
- Continued placement of EUR/JPY above key SMA levels shows strong bullish sentiment.
- The daily chart indicators reveal a loss of the bullish momentum.
- The hourly RSI and rising MACD depict short-term buyers' shift to regain momentum.
- The pair's approach towards the key SMA level at 163.09 raises the possibility of a trend shift.
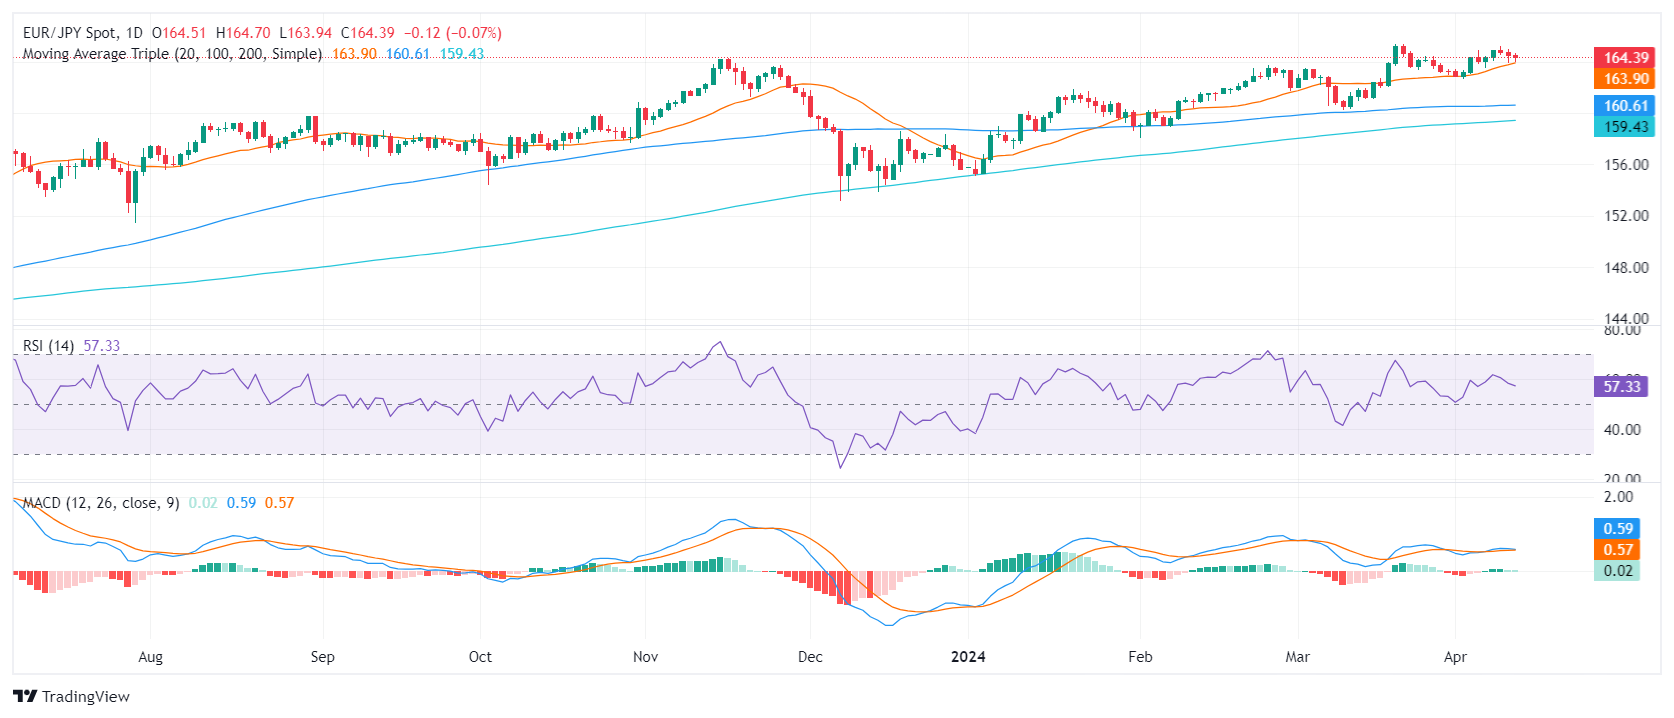
The EUR/JPY pair currently trades at approximately 164.37, indicating a slight decrease. Despite the bullish trend, traders must closely monitor for potential reversals as the bullish momentum wanes on the daily chart and bears approach the 20-day Simple Moving Average (SMA).
On the daily chart, The Relative Strength Index (RSI) consistently has been within the positive territory, but on Thursday it pointed south suggesting a loss of buying traction. The Moving Average Convergence Divergence (MACD) prints diminish green bars, also adding arguments to the momentum loss.
EUR/JPY daily chart
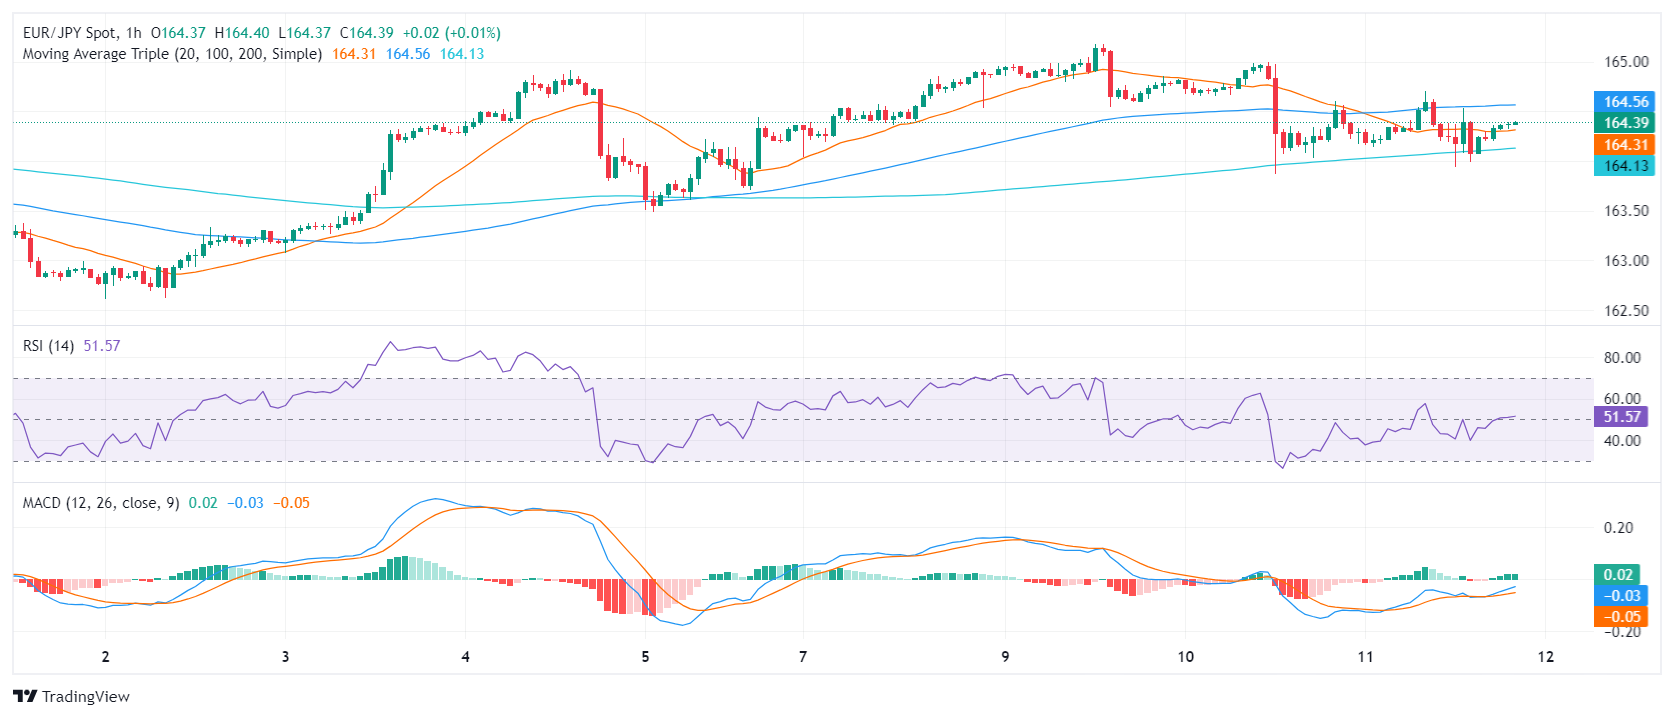
In contrast to the daily chart, the hourly chart tells a slightly different story. Here, the RSI readings fluctuate somewhat, particularly in the latest hours, with a decline towards the negative territory. However, recovery seems likely, as the latest hour reports an RSI value of 51, placing the index back in positive momentum. During these hours, the Moving Average Convergence Divergence (MACD) histogram prints rising green bars, indicating positive momentum.
EUR/JPY hourly chart
For a broader outlook, the EUR/JPY displays significant strength, remaining steadfast above its three crucial Simple Moving Averages (SMA) of 20, 100 and 200-day SMAs. Such positioning generally indicates a sustainable bullish climate, with strong implications for the short and long-term trend. However, today's signals suggest a potential challenge, as the pair edges closer to the 20-day SMA, currently set at 163.09 and any future movement below it could signal a shift to a bearish bias.
- USD/CHF declines, breaking below key support amid shifting market conditions.
- Despite downturn, upward trend holds; resistance at 0.9100, 0.9147 if recovery occurs.
- Continued falls could test supports at 0.9023 and key 0.9000 level.
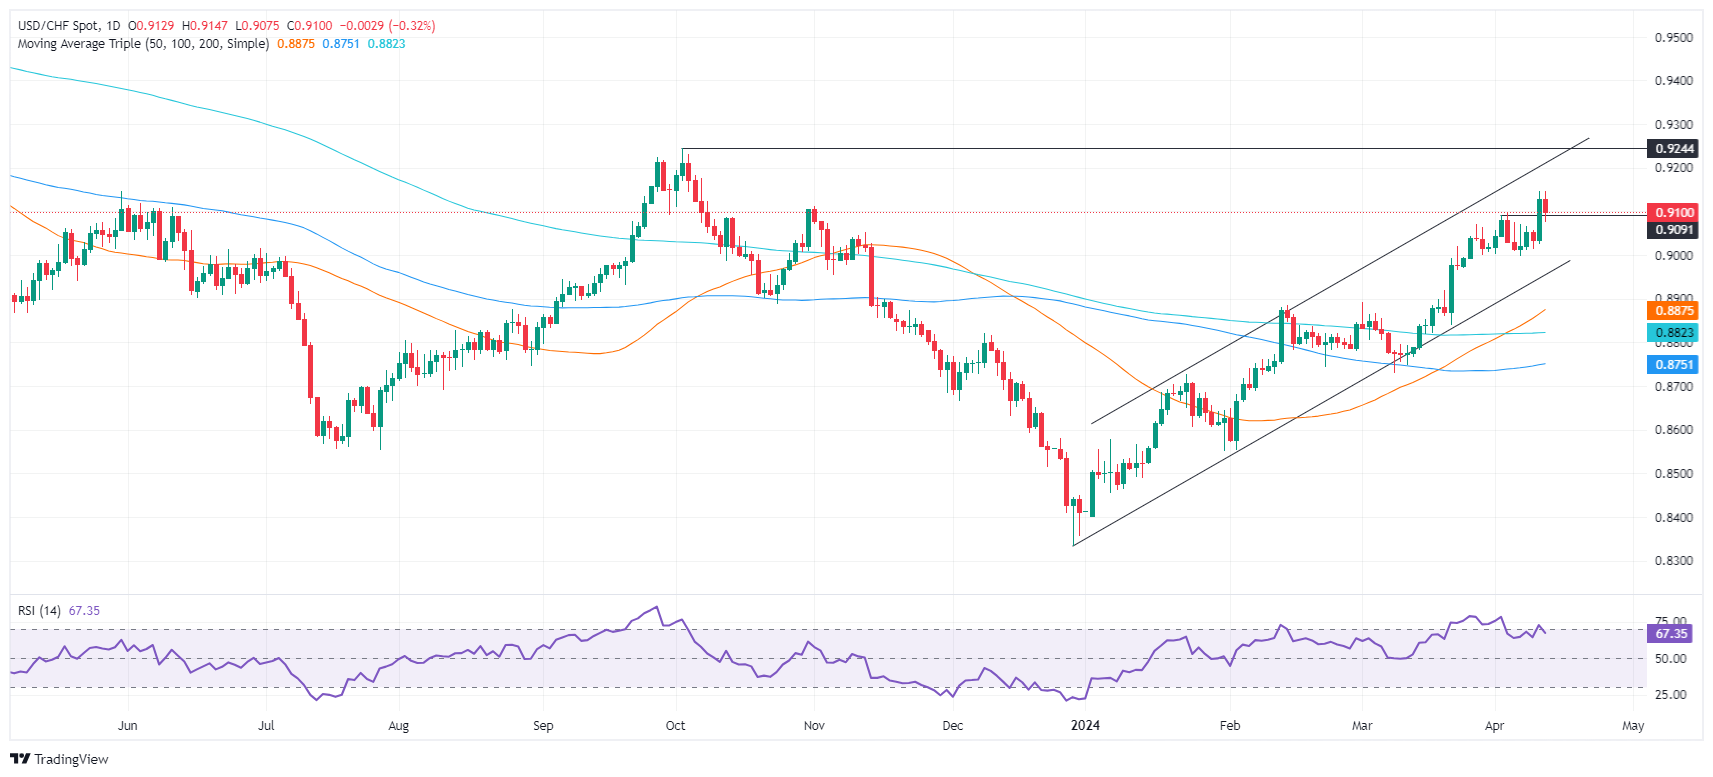
The USD/CHF retreats from year-to-date (YTD) highs reached on Wednesday and drops below the 0.9100 figure as risk appetite improves. The major trades were down by 0.9099 by 0.32%.
USD/CHF Price Analysis: Technical outlook
From a technical perspective, the daily chart depicts the pair as upward biased. After bottoming around the 0.8300 figure, successive series of higher highs and higher lows, alongside the breach of key resistance levels like the 50, 100, and 200-day moving averages (DMAs), opened the door for further upside.
However, after peaking at around 0.9147, the USD/CHF dipped below the April 3 high turned support at 0.9095, but unless the pair closes below the latter, the rally remains alive. The first resistance would be the 0.9100 mark, followed by the year-to-date (YTD) high of 0.9147. Once cleared, the next stop would be the 0.9200 mark, closely followed by the October 3 high of 0.9245.
In the scenario of sellers pushing spot prices below 0.9095, that could pave the way for testing the April 10 swing low of 0.9023, followed by 0.9000.
USD/CHF Price Action – Daily Chart
- Gold prices recover, buoyed by falling US Treasury yields and a weaker US Dollar.
- Mixed signals from producer inflation, labor data bolster Gold amid uncertainties.
- Fed officials' inflation worries enhance Gold’s safe-haven appeal, swaying sentiment.
Gold price erased Wednesday’s losses and climbed past the $2,360 area on Thursday, shrugging off a red-hot consumer inflation report. Further data was revealed earlier during the North American session with the Producer Price Index (PPI) showing signs of easing inflation. Consequently, US Treasury yields fell, capping the US Dollar rally.
XAU/USD spot trades at $2,362 a troy ounce, posting solid gains of 1.29%. The US Bureau of Labor Statistics (BLS) revealed additional inflation data on the producer side, alongside Initial Jobless Claims. The number of Americans filing for unemployment benefits was below the previous reading and forecasts, indicating the labor market remains tight.
Federal Reserve (Fed) officials grabbed some highlights. New York Fed President John Williams and Richmond Fed President Thomas Barkin added that recent inflation data was disappointing and doesn’t increase confidence that disinflation is spreading.
Daily digest market movers: Gold shrugs off hot US CPI report, resumes uptrend
- The March US Producer Price Index (PPI) showed that the disinflation process continues, with data clocking at 0.2% MoM, below estimates of 0.3%. The core PPI printed at 0.2% MoM, which is below estimates and February’s reading.
- In the twelve months to March, the PPI rose by 2.1%, less than projections but surpassing February’s 1.6%. The core PPI stood at 2.4%, however, above estimates and the previous month's data.
- Initial Jobless Claims for the week ending April 6 dipped from 222K to 211K, below estimates of 215K, reinforcing the labor market's robustness following last Friday’s release of the Nonfarm Payrolls report.
- High inflationary levels in the United States, revealed by the March Consumer Price Index (CPI) report, prompted investors to trim expectations of the Fed’s rate cuts.
- Data from the Chicago Board of Trade (CBOT) suggests that futures traders expect just two cuts to the fed funds rate as they project the main reference rate to end the year at 4.955%.
- Despite that, the fall of US Treasury nominal and real yields is a headwind for Gold prices. US real yields fall three basis points to 2.148%.
- The US Dollar Index (DXY) also witnessed a substantial increase, soaring over 1% to reach new YTD high of 105.27.
- World Gold Consortium reveals that the People’s Bank of China was the largest buyer of the yellow metal in February, increasing its reserves by 12 tonnes to 2,257 tonnes.
Technical analysis: Gold’s rise resumes as buyers eye $2,400
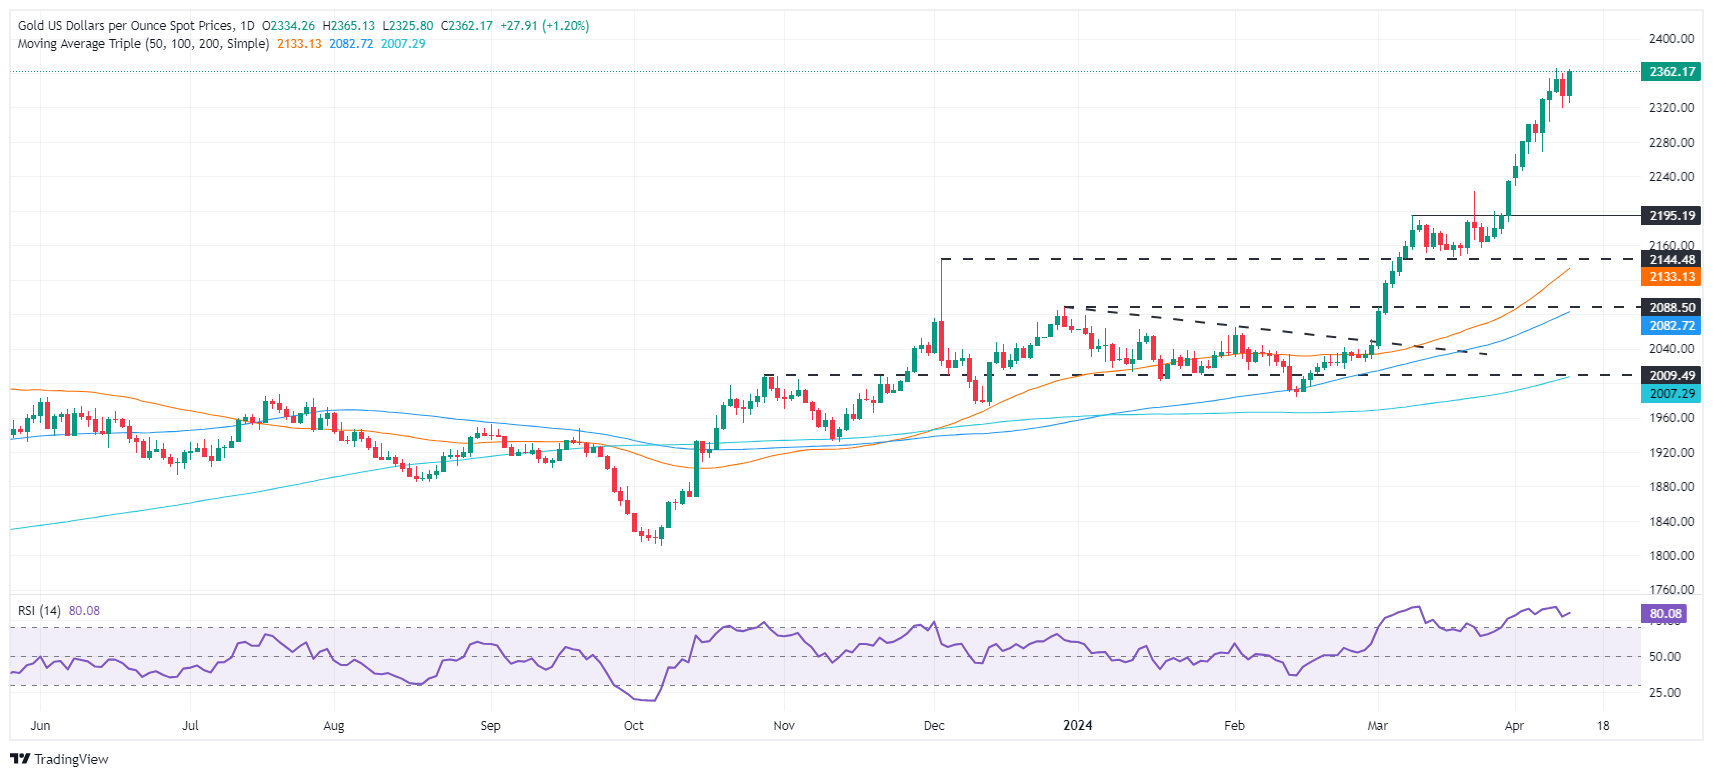
Gold remains upwardly biased despite dipping toward the $2,310 area on Wednesday. Nevertheless, the drop in US real yields sponsored XAU/USD’s last leg up, with buyers threatening to push prices to refresh all-time highs.
If XAU/USD decisively surpasses the $2,365 area, it would pave the way to challenging the psychological $2,400 mark. Further upside is seen at $2,450 and $2,500.
On the other hand, if the precious metal’s price drops below $2,359, look for a challenge of the April 10 low of $2,319, followed by the April 8 daily low of $2,303. Once cleared, the next support would be March’s 21-session high of $2,222. Further losses are seen at $2,200.
Gold FAQs
Gold has played a key role in human’s history as it has been widely used as a store of value and medium of exchange. Currently, apart from its shine and usage for jewelry, the precious metal is widely seen as a safe-haven asset, meaning that it is considered a good investment during turbulent times. Gold is also widely seen as a hedge against inflation and against depreciating currencies as it doesn’t rely on any specific issuer or government.
Central banks are the biggest Gold holders. In their aim to support their currencies in turbulent times, central banks tend to diversify their reserves and buy Gold to improve the perceived strength of the economy and the currency. High Gold reserves can be a source of trust for a country’s solvency. Central banks added 1,136 tonnes of Gold worth around $70 billion to their reserves in 2022, according to data from the World Gold Council. This is the highest yearly purchase since records began. Central banks from emerging economies such as China, India and Turkey are quickly increasing their Gold reserves.
Gold has an inverse correlation with the US Dollar and US Treasuries, which are both major reserve and safe-haven assets. When the Dollar depreciates, Gold tends to rise, enabling investors and central banks to diversify their assets in turbulent times. Gold is also inversely correlated with risk assets. A rally in the stock market tends to weaken Gold price, while sell-offs in riskier markets tend to favor the precious metal.
The price can move due to a wide range of factors. Geopolitical instability or fears of a deep recession can quickly make Gold price escalate due to its safe-haven status. As a yield-less asset, Gold tends to rise with lower interest rates, while higher cost of money usually weighs down on the yellow metal. Still, most moves depend on how the US Dollar (USD) behaves as the asset is priced in dollars (XAU/USD). A strong Dollar tends to keep the price of Gold controlled, whereas a weaker Dollar is likely to push Gold prices up.
- Mexican Peso trims some weekly losses as USD/MXN stays virtually unchanged.
- Mexico's Industrial Production contracts, underscoring economic challenges, while US producer prices suggest softening inflation.
- Fed officials' comments on inflation and monetary policy decisions reflect a cautious optimism.
The Mexican Peso depreciated modestly against the US Dollar for the third straight trading session on Thursday, following a red-hot consumer inflation report on Wednesday. Further economic data from Mexico and the United States (US) keeps the exotic pair within familiar levels, though the downtrend remains intact. The USD/MXN trades at 16.43, virtually unchanged.
Mexico’s economic docket featured the release of Industrial Production for February. The monthly reading missed estimates and contracted. On a yearly basis, data expanded below estimates but surpassed January’s reading.
Across the border, the release of prices paid by producers showed that inflation cooled a little but remains stickier than expected on the annual core reading. Monthly readings showed that the disinflation process continues to show success.
In the meantime, Federal Reserve (Fed) officials crossed newswires. The New York Fed’s Williams and Richmond Fed’s Barkin mentioned that recent data was disappointing, while the Boston Fed’s Collins added that recent data argues against the imminent need to change rates.
Daily digest market movers: Mexican Peso shrugs off hot US inflation data
- Mexico’s Industrial Production edged lower in February from the previous month and shrank -0.1% MoM, below estimates of 0.3% expansion. On a yearly basis, Industrial Production rose by 3.3% compared to the last reading, but forecasts were missed by 3.5%.
- This data, combined with the recent inflation report, which is below estimates, justified the Bank of Mexico's (Banxico) March rate cut. However, not everything was positive news as the yearly CPI exceeded expectations.
- The US Producer Price Index (PPI) rose by 0.2% MoM in March, below the previous month’s reading. The core PPI clocked the same reading of 0.2% MoM, which is below estimates and February’s reading.
- For the twelve months to March, the PPI increased by 2.1%, exceeding February’s data. The core PPI printed above estimates, and the previous reading, at 2.4%, which was above estimates of 2.3% and February’s 2.1%.
- Initial Jobless Claims for the week ending April 6 arrived at 211K, below estimates of 215K and the prior’s reading of 222K.
- Thursday’s data, along with Wednesday’s US inflation report, prompted traders to price in two rate cuts by the Federal Reserve in 2024, according to the Chicago Board of Trade (CBOT). The December 2024 fed funds futures contract depicts it ending the year at 4.975%.
- Federal Reserve officials led by New York President John Williams and Richmond’s Thomas Barkin expressed their disappointment with recent inflation data. Both expressed there’s no need to change policy, given the actual scenario of stickier inflation and robust economic growth.
Technical analysis: Mexican Peso opposes resistance, caps the USD/MXN advance below 16.50
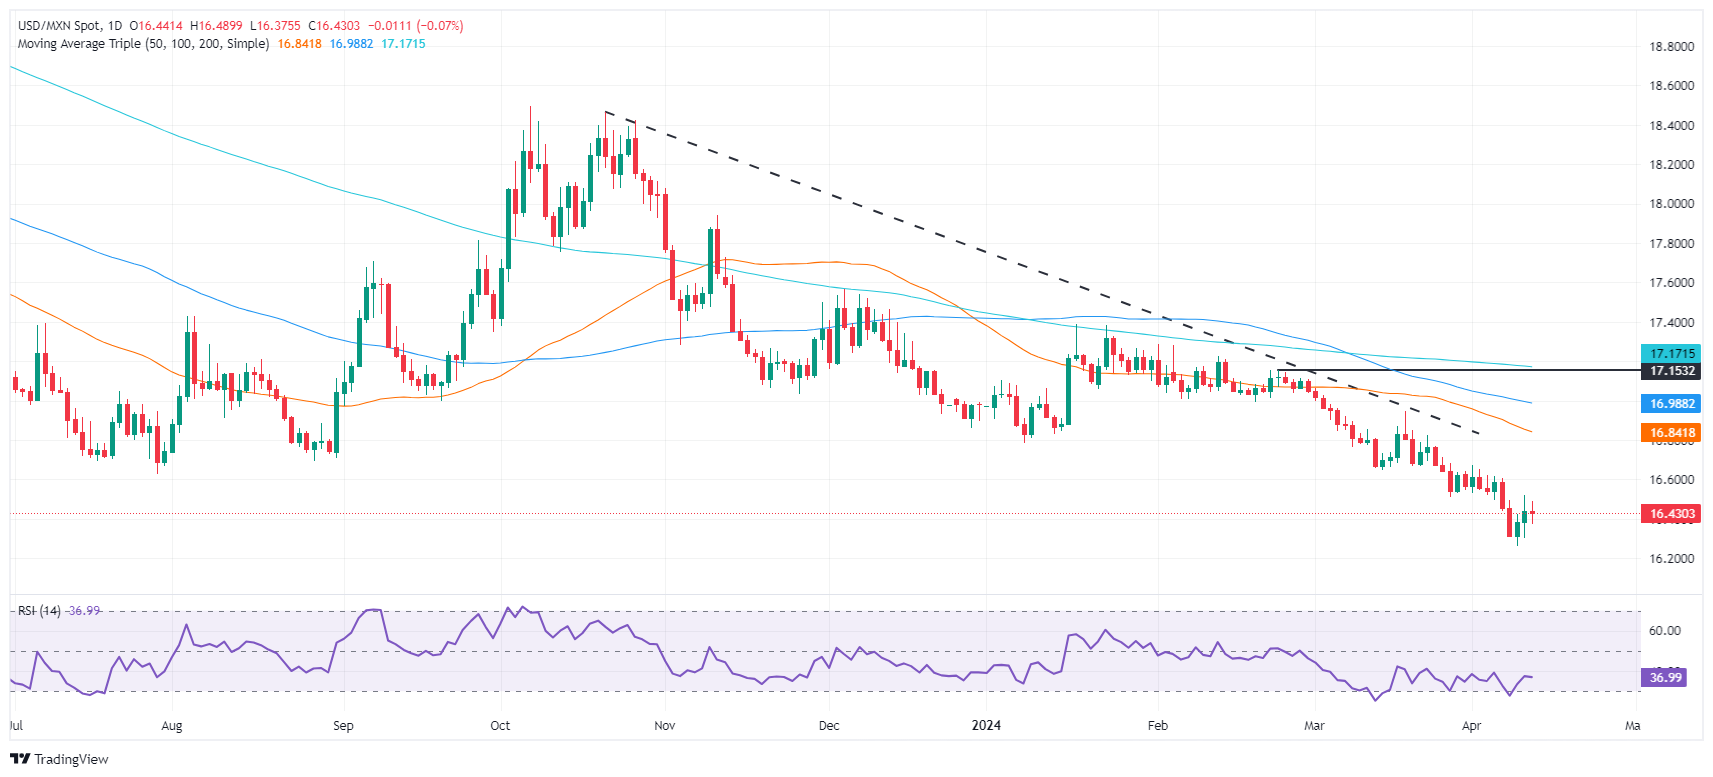
The USD/MXN daily chart depicts the pair consolidating near 16.40, with buyers still unable to crack the current week’s high achieved on Wednesday at 16.52. Once that area is breached, the next supply zone to challenge would be the 16.62 mark, followed by the 50-day Simple Moving Average (SMA) at 16.85 and the 100-day SMA at 16.99.
Failure at 16.50 and the USD/MXN could tumble to October’s 2015 low of 16.32 before retesting the year-to-date (YTD) low of 16.25.
Mexican Peso FAQs
The Mexican Peso (MXN) is the most traded currency among its Latin American peers. Its value is broadly determined by the performance of the Mexican economy, the country’s central bank’s policy, the amount of foreign investment in the country and even the levels of remittances sent by Mexicans who live abroad, particularly in the United States. Geopolitical trends can also move MXN: for example, the process of nearshoring – or the decision by some firms to relocate manufacturing capacity and supply chains closer to their home countries – is also seen as a catalyst for the Mexican currency as the country is considered a key manufacturing hub in the American continent. Another catalyst for MXN is Oil prices as Mexico is a key exporter of the commodity.
The main objective of Mexico’s central bank, also known as Banxico, is to maintain inflation at low and stable levels (at or close to its target of 3%, the midpoint in a tolerance band of between 2% and 4%). To this end, the bank sets an appropriate level of interest rates. When inflation is too high, Banxico will attempt to tame it by raising interest rates, making it more expensive for households and businesses to borrow money, thus cooling demand and the overall economy. Higher interest rates are generally positive for the Mexican Peso (MXN) as they lead to higher yields, making the country a more attractive place for investors. On the contrary, lower interest rates tend to weaken MXN.
Macroeconomic data releases are key to assess the state of the economy and can have an impact on the Mexican Peso (MXN) valuation. A strong Mexican economy, based on high economic growth, low unemployment and high confidence is good for MXN. Not only does it attract more foreign investment but it may encourage the Bank of Mexico (Banxico) to increase interest rates, particularly if this strength comes together with elevated inflation. However, if economic data is weak, MXN is likely to depreciate.
As an emerging-market currency, the Mexican Peso (MXN) tends to strive during risk-on periods, or when investors perceive that broader market risks are low and thus are eager to engage with investments that carry a higher risk. Conversely, MXN tends to weaken at times of market turbulence or economic uncertainty as investors tend to sell higher-risk assets and flee to the more-stable safe havens.
- The daily chart reveals a positive momentum, with the RSI and MACD demonstrating the upper hand of buyers.
- The hourly RSI is exchanging hands around the 50 level.
- The pair is building strong support around the 20-day SMA.
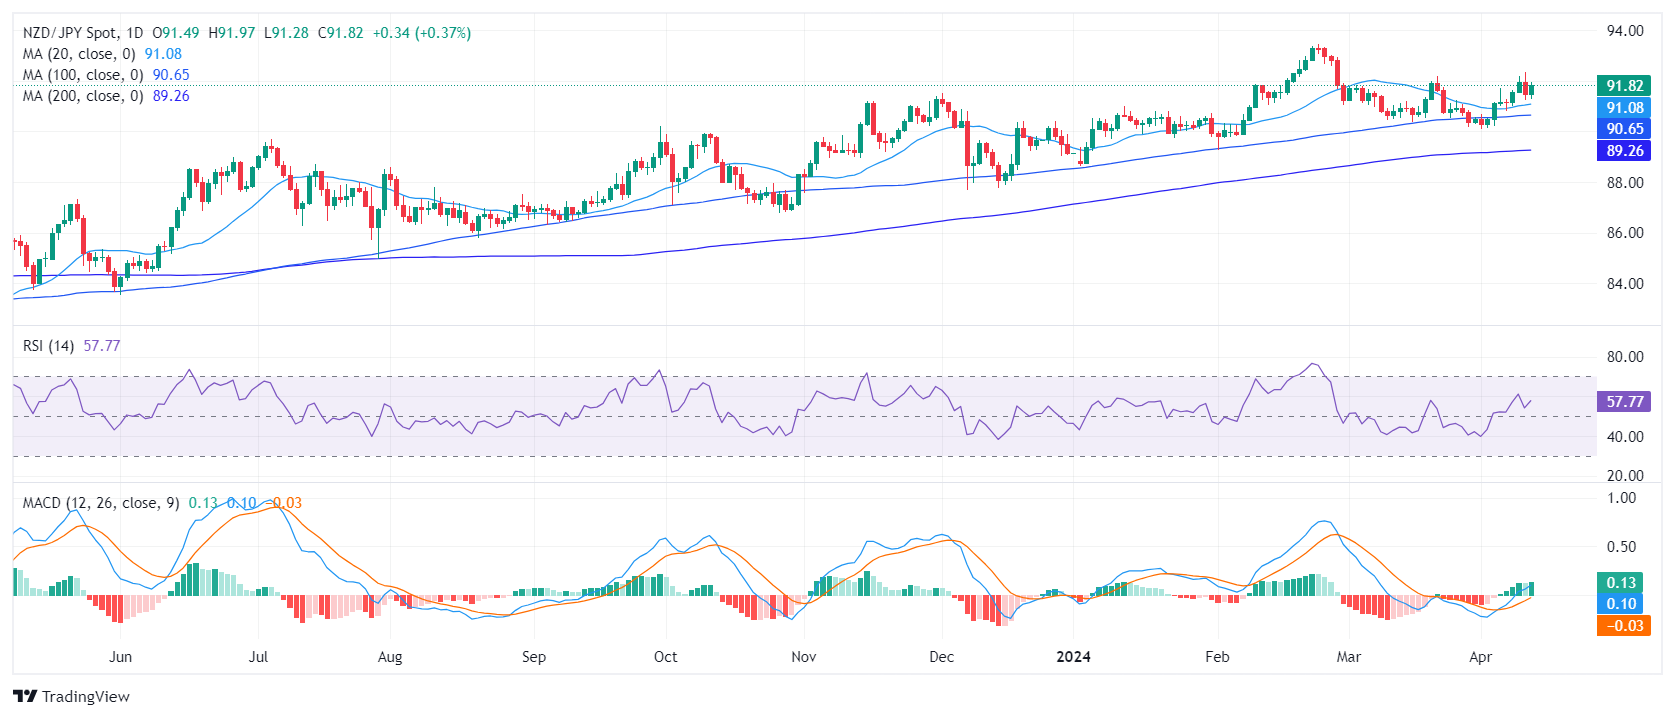
The NZD/JPY currency pair is trading near the 91.541 level, experiencing what appears to be a robust uptrend. Indicators on the daily chart remain strong while hourly indicators stand somewhat mixed. On the negative side, for bears to start talking, they must breach the 20-day Simple Moving Average (SMA) at 91.00 which is acting as a strong support in favor of the bulls.
On the daily chart, the Relative Strength Index (RSI) shows positive momentum for the NZD/JPY pair, settling at about 56. The recent history of the RSI in positive territory highlights the dominance of buyers, occasionally counterbalanced with dips flirting with the negative domain. Concurrently, the MACD histogram displays green bars, further indicating positive momentum in the market.
NZD/JPY daily chart
Moving to the hourly chart, the RSI fluctuates around the neutral mark of 50, with the latest reading jumping back to 57 after a slight decline earlier in the session. The MACD histogram continues to print flat green bars, indicating a flattening buying momentum.
NZD/JPY hourly chart
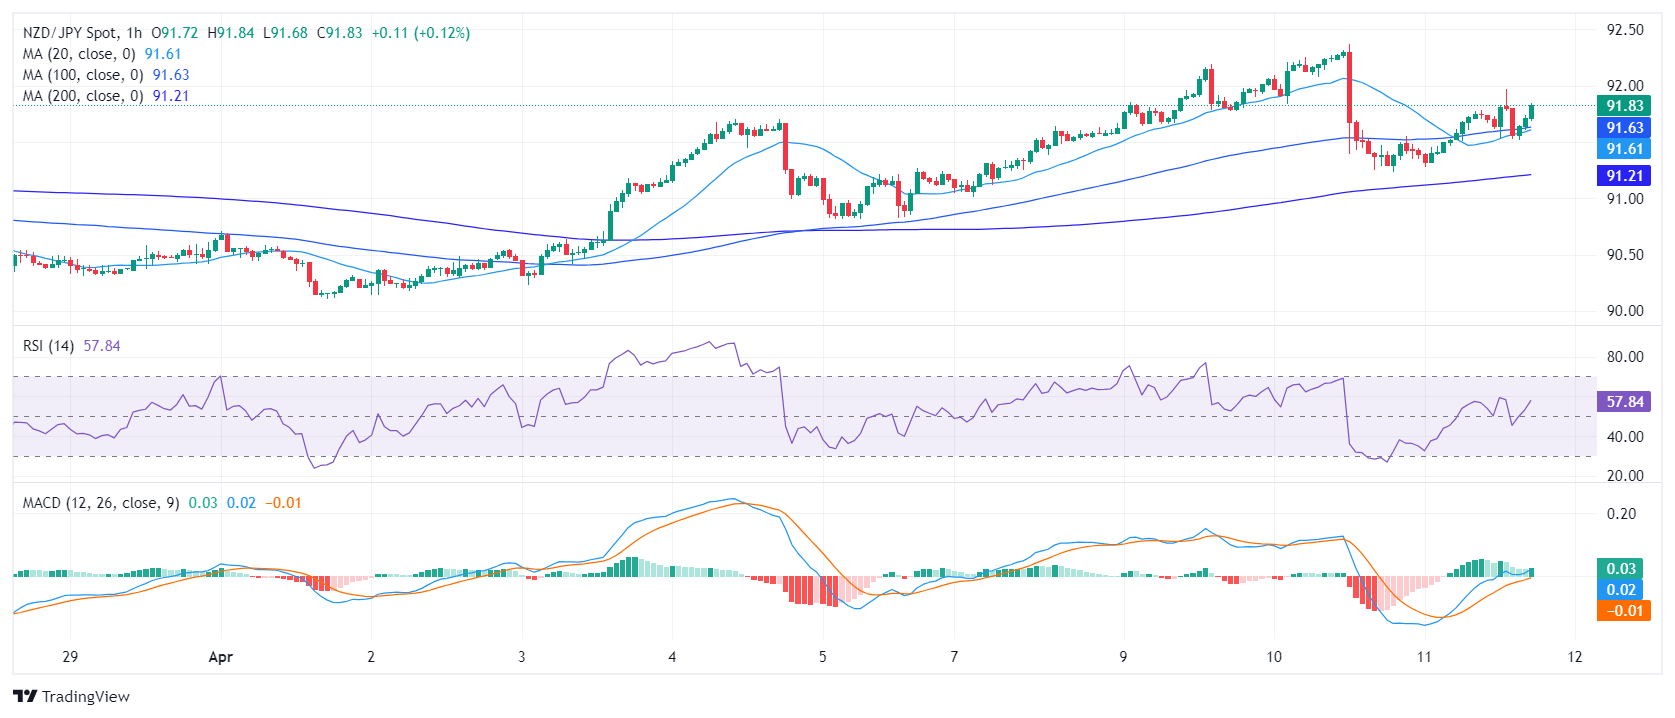
Taking into account this technical landscape, the NZD/JPY shows a bullish inclination in a broader outlook. It stands notably above the 20, 100, and 200-day Simple Moving Averages (SMAs), indicating a consistent uptrend. As long as the pair holds above the key 20-day average, the bullish trend will remain intact. However, the mixed outlook on the hourly chart advises that the buyers may give up ahead of the Asian session which could pave the way for a retest of the mentioned average.
The risk complex regained some poise amidst a mild corrective decline in the US Dollar and rising speculation of a Fed rate cut in September. In the meantime, the ECB left rates unchanged as expected and opened the door to a rate cut in June.
Here is what you need to know on Friday, April 12:
The US Dollar maintained its bullish bias and advanced to fresh 2024 peaks around 105.50 when gauged by the DXY on Thursday. On April 12, the preliminary Michigan Consumer Sentiment is due, followed by speeches by the Fed's Bostic and Daly.
EUR/USD came under further downward bias and briefly dipped below the 1.0700 support. The final Inflation Rate in Germany is due on April 12, along with the ECB’s Survey of Professional Forecasters (SPF).
GBP/USD ended the session with marginal gains following an earlier drop to multi-week lows. In the UK, GDP prints, Balance of Trade, Construction Output, Industrial and Manufacturing Production, and the NIESR GDP Tracker are all due on April 12.
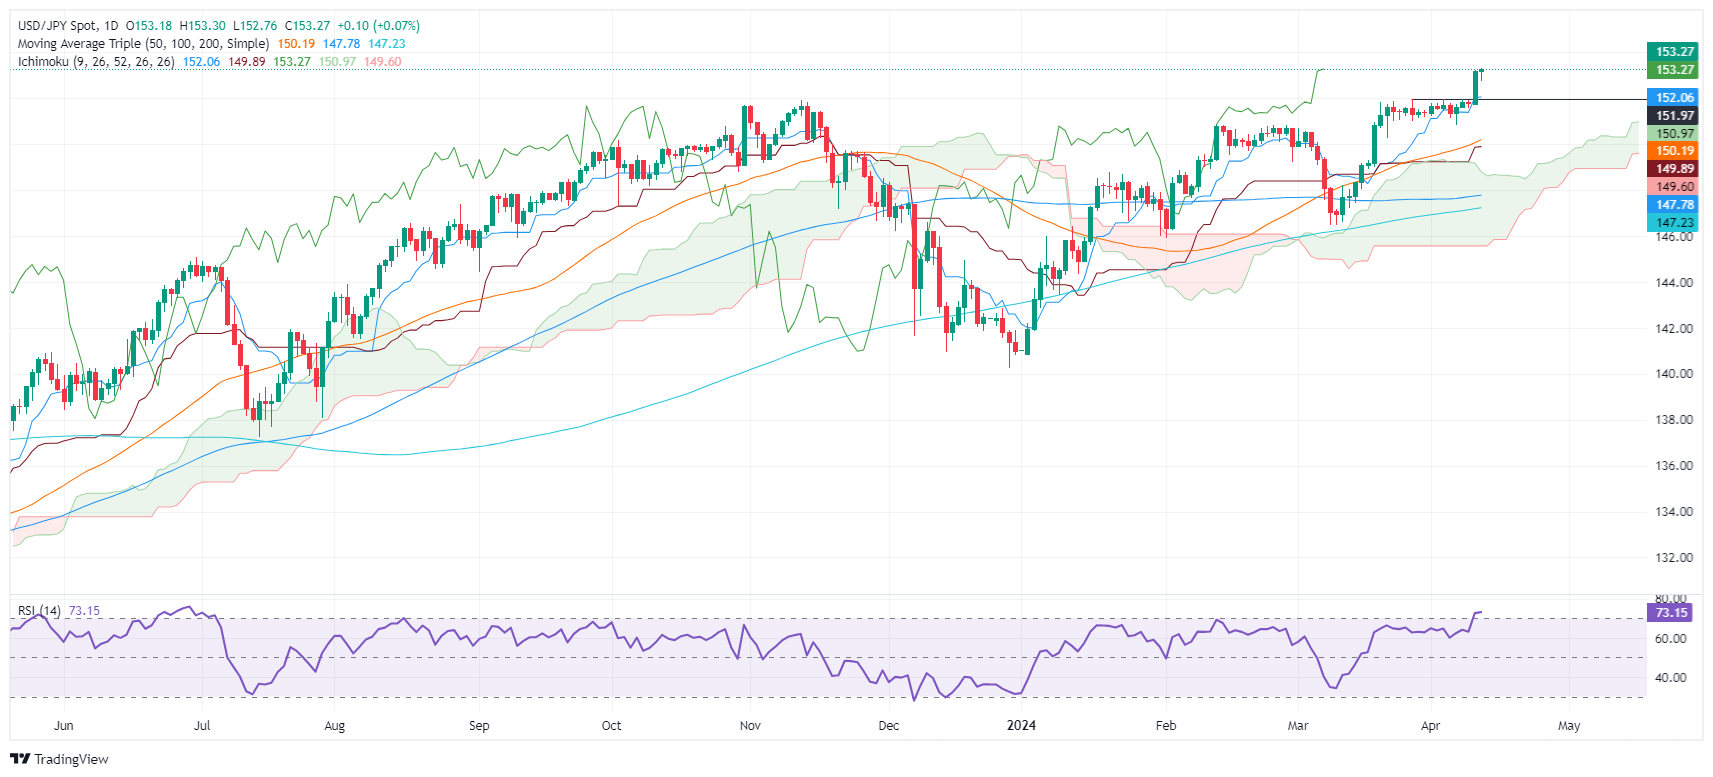
The rally in USD/JPY remained unchanged, this time hitting highs not seen since June 1990 around 153.30. In Japan, final Industrial production readings are expected on April 12.
AUD/USD met some decent support near the 0.6500 neighbourhood, managing to regain composure and advance modestly on Thursday.
WTI prices resumed the downtrend amidst geopolitical concerns and diminishing bets on the Fed’s rate cut in the summer.
Prices of Gold regained the upside momentum and shifted their focus to the all-time high near $2,360 per troy ounce. Silver, in the same direction, set aside Wednesday’s decline and reclaimed the area beyond the $28.00 mark per ounce.
- The Pound keeps trading lower with the recent reversal from 1.2700 increasing bearish pressure.
- Higher US yields and market expectations of a ‘higher for longer” Fed outlook are expected to support the USD.
- GBP/USD is ready to test an important support area at 1.2500.
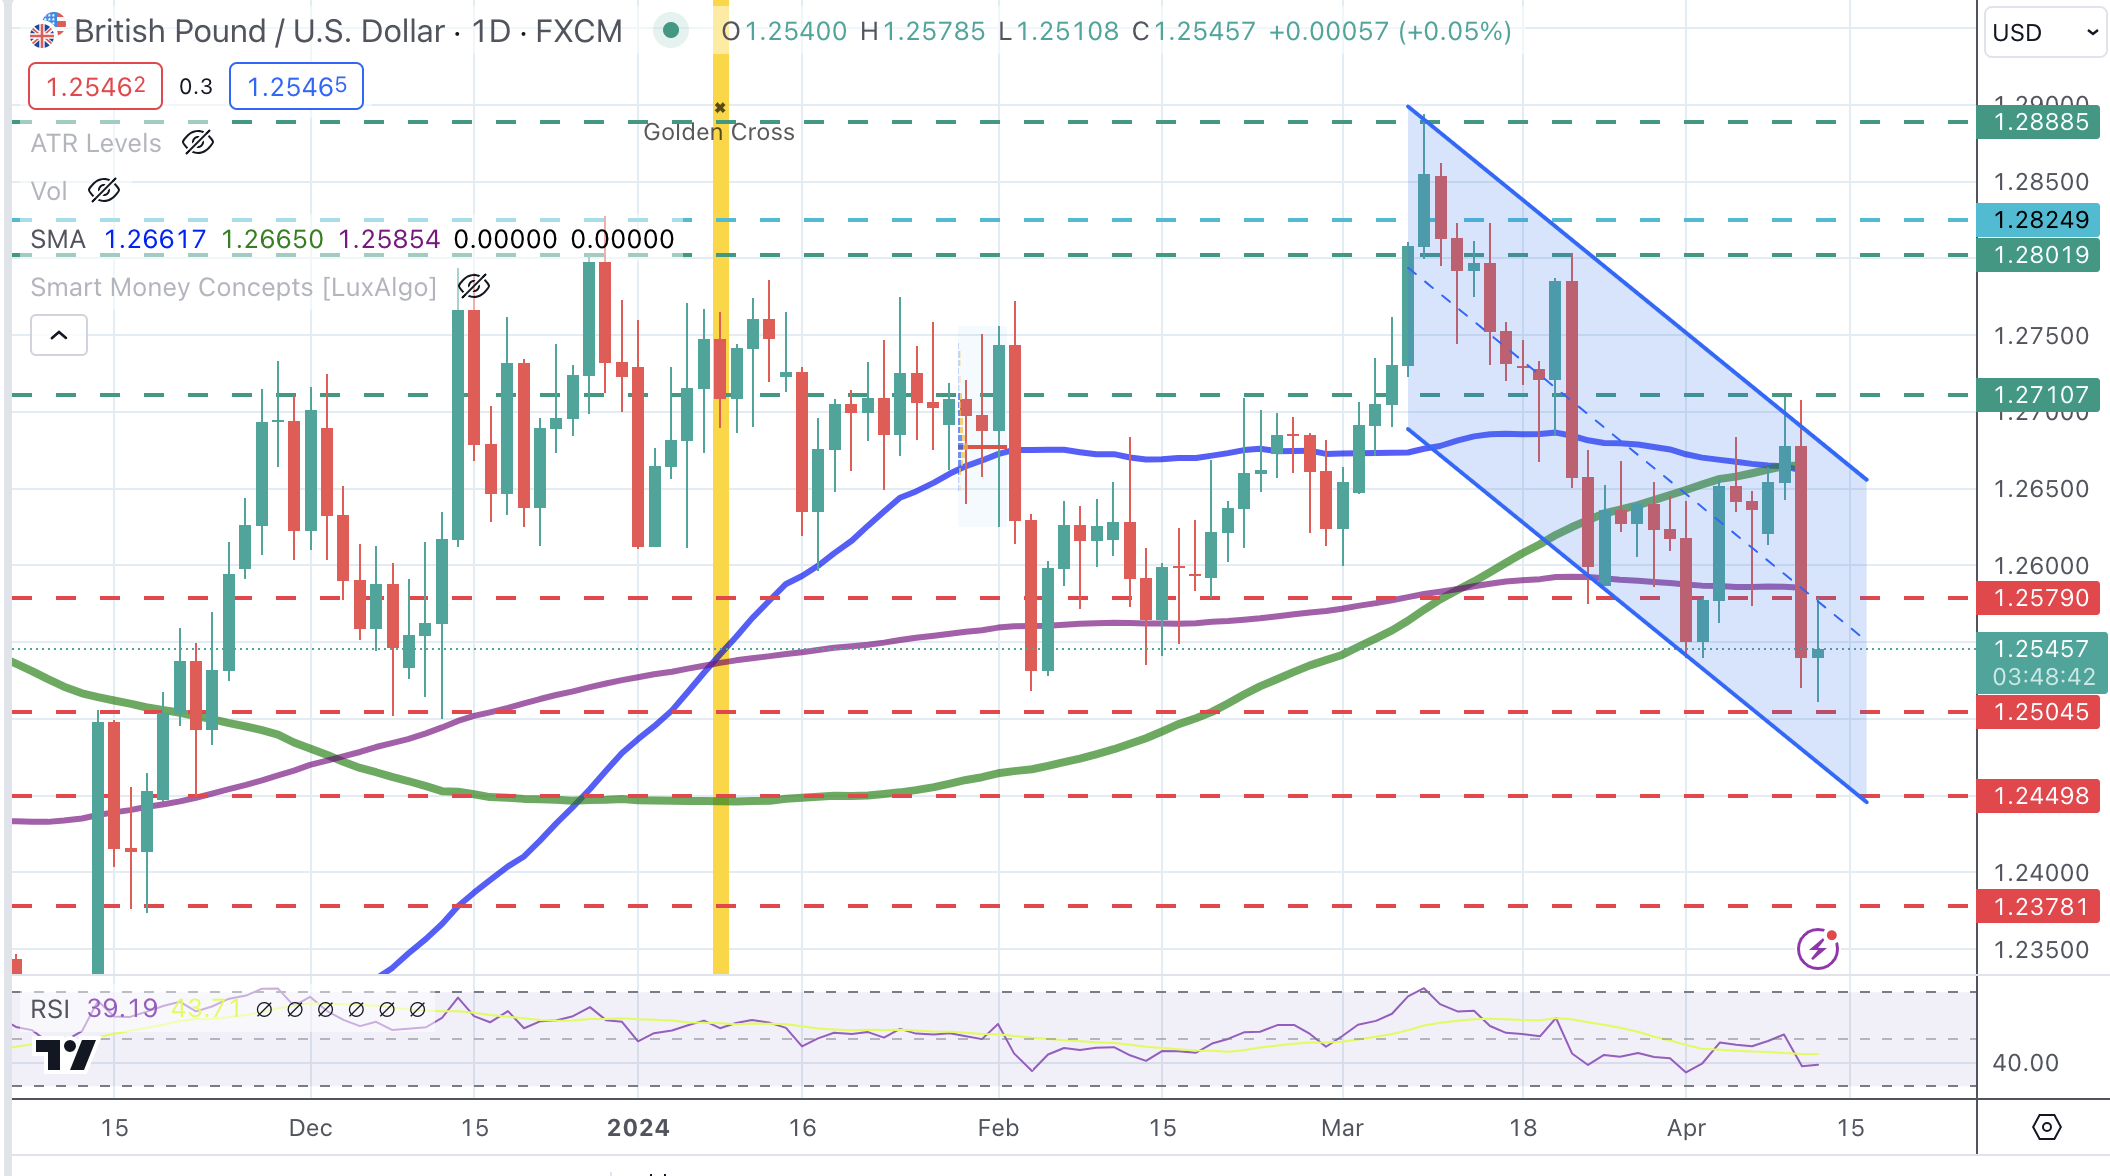
The Sterling keeps trading within a bearish channel from early March lows and seems ready to test an important support area at 1.2500. Wednesday’s long negative candle reflects an impulsive bearish move and gives sellers hope to explore fresh year-to-date lows.
US Treasury yieldskeep[ rallying and investors reassess their expectations of Fed cuts this year which is acting as a tailwind for the US Dollar. US PPI data and the slight increase in US Jobless claims have provided a certain relief although USD reversals remain limited for now.
Oscillators are pointing lower and the bearish cross between the 50 and the 100-day SMAss are adding weight to the pair. On Friday the UK Industrial Production data might give further direction to the pair.
The next supports are 1.2500 and 1.2450. On the upside 1.2600 and 1.2710 are likely to cap upside attempts.
GBP/USD Daily Chart
- Dow Jones index trades lower for fourth consecutive session this week with Wall Street mixed.
- US PPI data has provided some relief to investors although market sentiment remains frail.
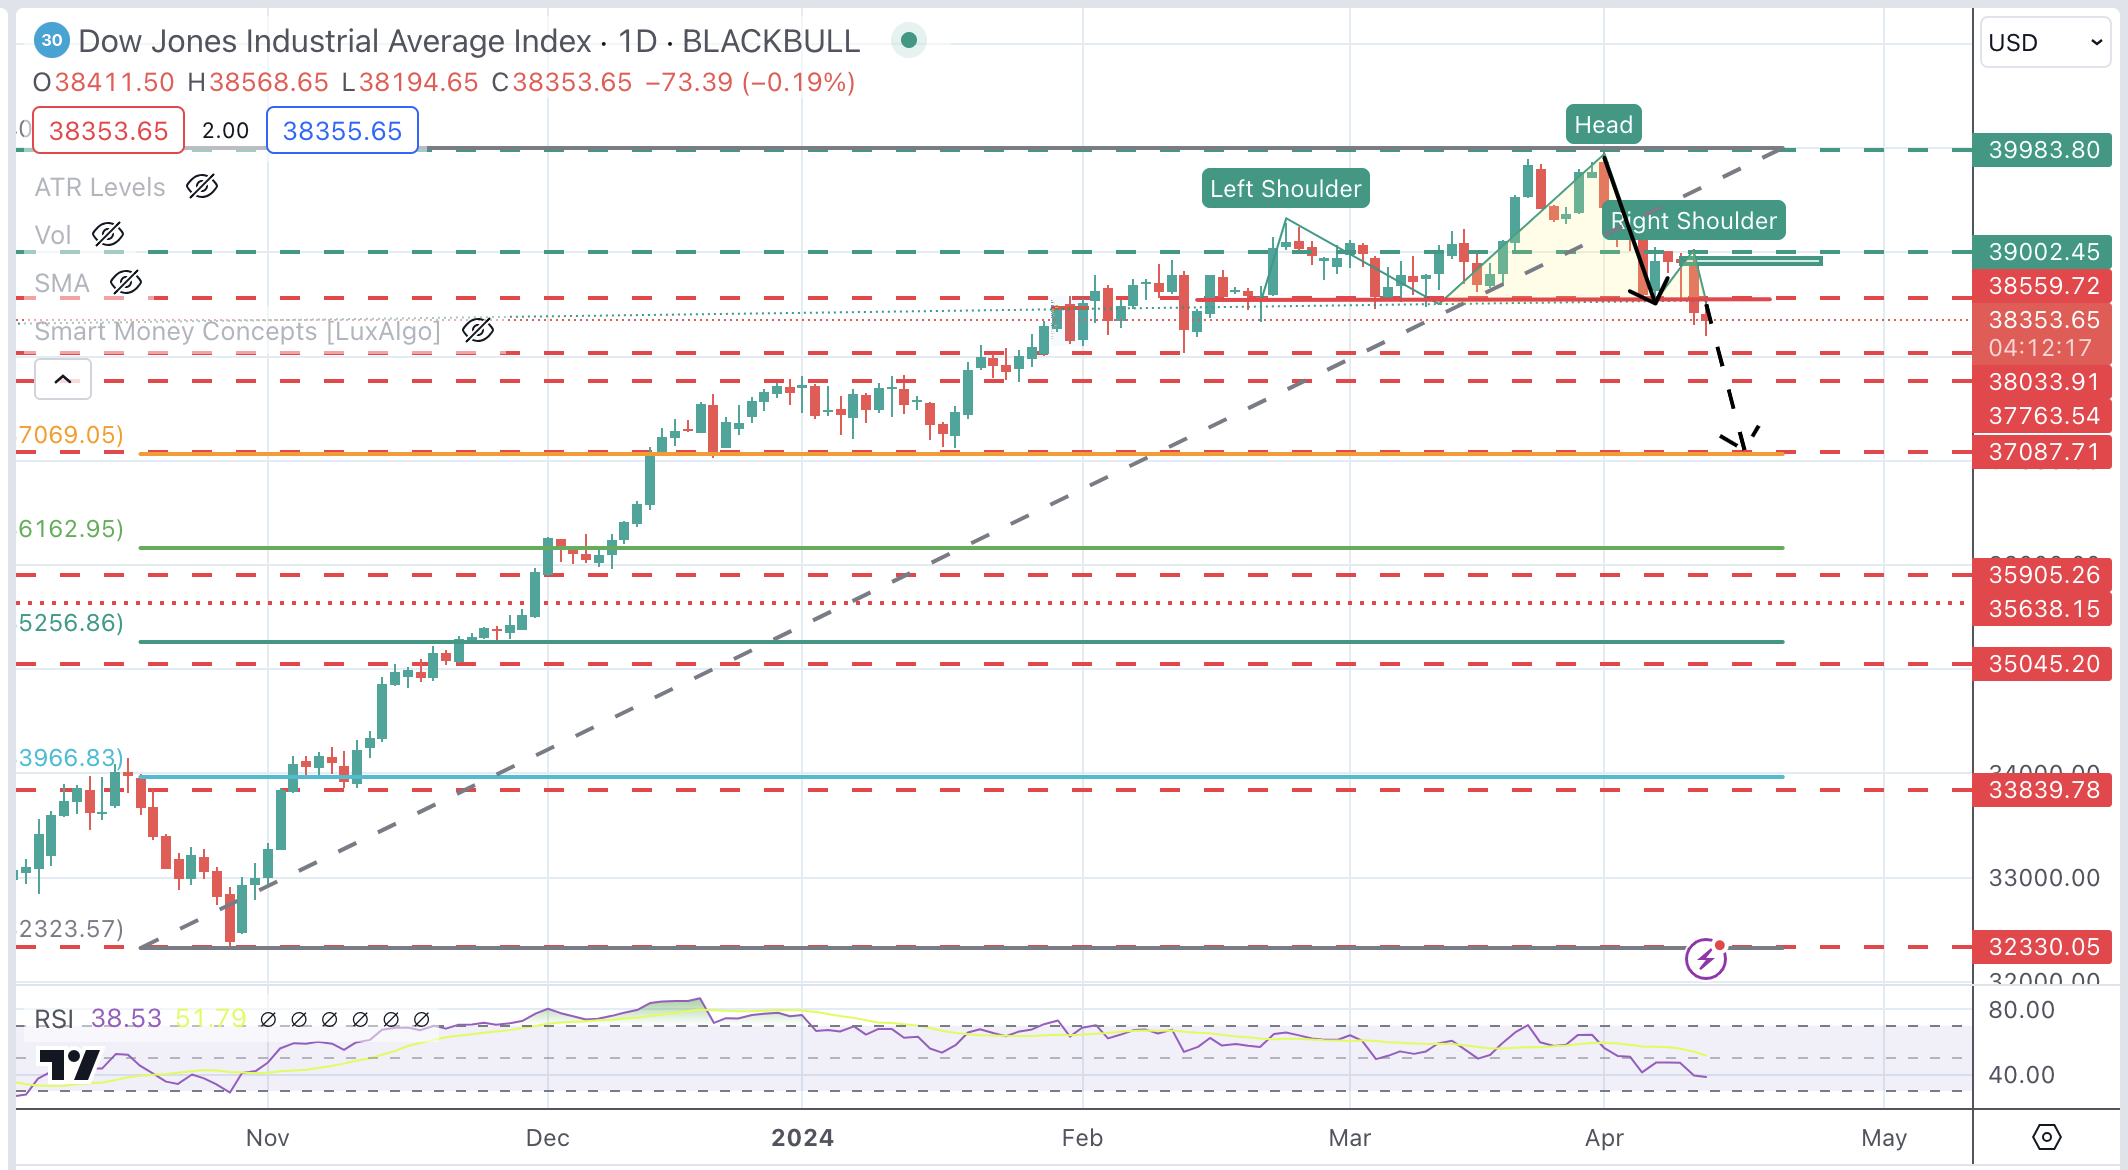
- The Dow Jones index forms bearish Head & Shoulders pattern that might anticipate deeper correction.
The Dow Jones Industrial Average (DJIA) is posting losses for the fourth consecutive day this week with Wall Street markets mixed as US PPI data has eased concerns triggered by Wednesday’s Consumer Price Index (CPI).
US Producer Prices Index (PPI) rose at a 0.2% MoM rate in March, below the 0.6% increase seen in the previous month. The yearly rate accelerated to 2.1% from 1.6% in February, but that was still below the 2.2% rate forecasted by market experts.
Wall Street indices are mixed on Thursday with the NASDAQ 0.6% higher at 16,279, the S&P 500 trading 0.1% above the opening level at 5,166, while the Dow Jones lags with a 0.3% decline to 38,343.
Dow Jones news
Most Wall Street sectors are posting losses on Thursday with investor confidence still weak as the market pares back its hopes of Fed cuts for this year.
The Energy sector is the most affected Thursday with a 1% decline, followed by Financials, which are 0.59% lower. On the winners' end, Technology is leading gains with a 0.98% advance, followed by Communication Services, up 0.45%.
Travelers Companies (TRV) is the worst performer of the index with a 1.68% fall to $220.61. Next is Chevron (CVX), down 1.34% to $160.50. Nike (NKE) is outperforming its peers on Thursday, boosted by the release of the US Olympic uniforms with a 3.15% rally to $91.78, followed by Apple (AAPL) trading 1.41% higher at $170.16.
Dow Jones technical outlook
The Dow Jones Index is trading lower again on Thursday. The move below 38,560 has activated a bearish Head & Shoulders pattern that might anticipate a sharper decline.
The next bearish targets are 38,033 and 37,750. The measured target of the H&S pattern is the mid-January low and 38.6% Fibonacci retracement at 37,087. A bullish reaction above 38,540 might find some more supply ahead of 39,000 (order block).
Dow Jones Index Daily Chart
Central banks FAQs
Central Banks have a key mandate which is making sure that there is price stability in a country or region. Economies are constantly facing inflation or deflation when prices for certain goods and services are fluctuating. Constant rising prices for the same goods means inflation, constant lowered prices for the same goods means deflation. It is the task of the central bank to keep the demand in line by tweaking its policy rate. For the biggest central banks like the US Federal Reserve (Fed), the European Central Bank (ECB) or the Bank of England (BoE), the mandate is to keep inflation close to 2%.
A central bank has one important tool at its disposal to get inflation higher or lower, and that is by tweaking its benchmark policy rate, commonly known as interest rate. On pre-communicated moments, the central bank will issue a statement with its policy rate and provide additional reasoning on why it is either remaining or changing (cutting or hiking) it. Local banks will adjust their savings and lending rates accordingly, which in turn will make it either harder or easier for people to earn on their savings or for companies to take out loans and make investments in their businesses. When the central bank hikes interest rates substantially, this is called monetary tightening. When it is cutting its benchmark rate, it is called monetary easing.
A central bank is often politically independent. Members of the central bank policy board are passing through a series of panels and hearings before being appointed to a policy board seat. Each member in that board often has a certain conviction on how the central bank should control inflation and the subsequent monetary policy. Members that want a very loose monetary policy, with low rates and cheap lending, to boost the economy substantially while being content to see inflation slightly above 2%, are called ‘doves’. Members that rather want to see higher rates to reward savings and want to keep a lit on inflation at all time are called ‘hawks’ and will not rest until inflation is at or just below 2%.
Normally, there is a chairman or president who leads each meeting, needs to create a consensus between the hawks or doves and has his or her final say when it would come down to a vote split to avoid a 50-50 tie on whether the current policy should be adjusted. The chairman will deliver speeches which often can be followed live, where the current monetary stance and outlook is being communicated. A central bank will try to push forward its monetary policy without triggering violent swings in rates, equities, or its currency. All members of the central bank will channel their stance toward the markets in advance of a policy meeting event. A few days before a policy meeting takes place until the new policy has been communicated, members are forbidden to talk publicly. This is called the blackout period.
- Canadian Dollar extends losses with US Dollar strengthening across the board.
- Mixed US PPI figures fail to offset risk-averse reaction triggered by Wednesday’s CPI figures completely.
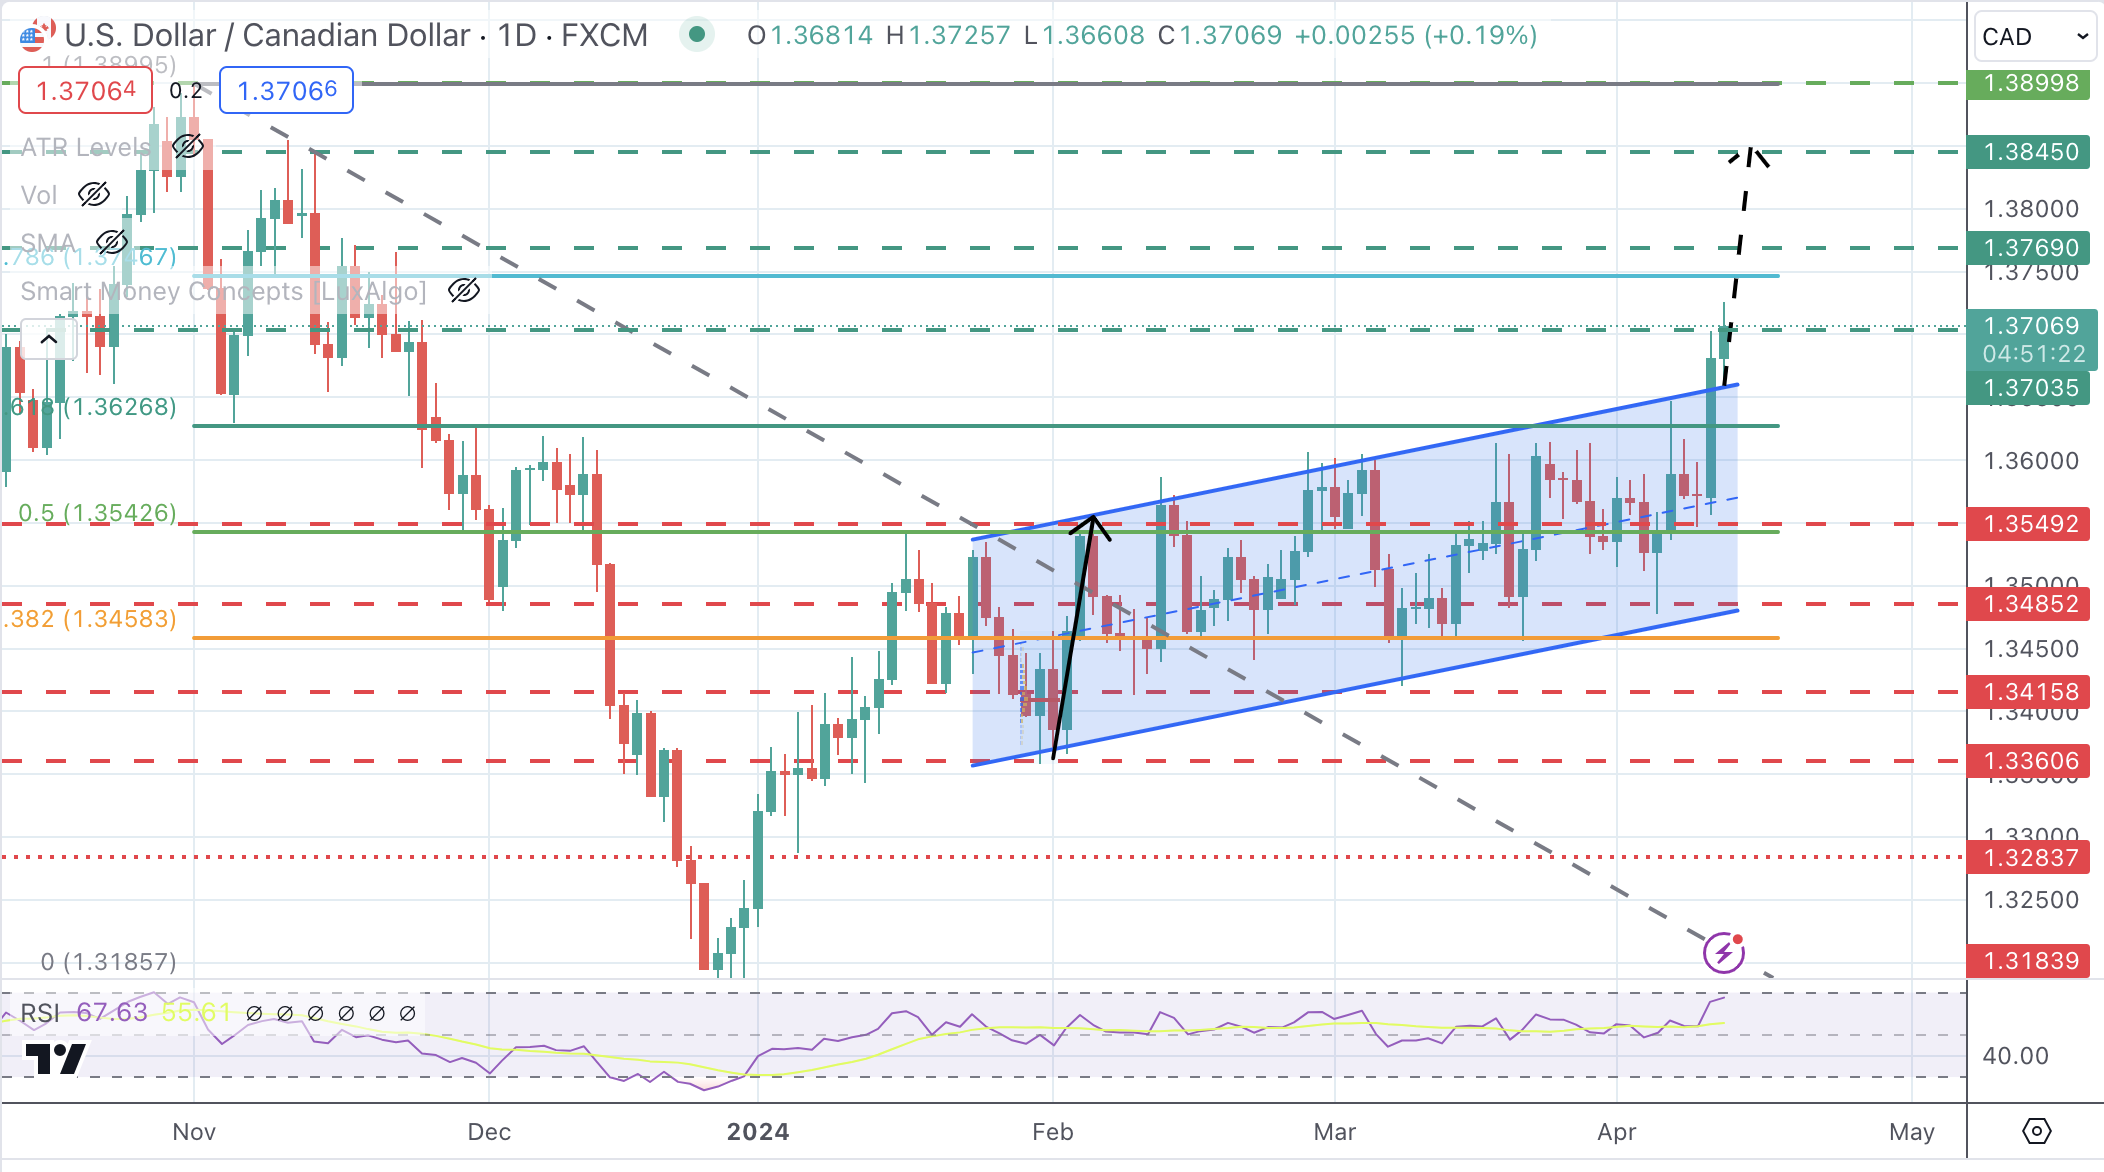
- USD/CAD keeps marching higher, 1.3740 and 1.3770 on bulls’ radar.
The Canadian Dollar (CAD) is selling off for the second consecutive day on Thursday. The Loonie has depreciated more than 1% over the last two trading days with the US Dollar appreciating across the board as investors dial down hopes of Federal Reserve (Fed) easing for 2024.
The US Producer Prices Index (PPI) has shown mixed data, with the headline figures accelerating below expectations but still offering hotter-than-expected core inflation. These figures have provided some relief but do not offset the risk-averse sentiment triggered by the high Consumer Prices Index (CPI) figures released on Wednesday.
Richmond Fed President Thomas Barkin has wondered if there is a shift in inflation trends and asked for some more time to start cutting rates. NY Fed CEO John Williams has shown a more dovish profile, stating that there will be a need to cut rates but that a hike is not on the cards at the moment. Later today the Fed’s Collins and Bostic will meet the press.
Daily digest market movers: USD/CAD keeps marching higher as Fed cut hopes wane
- Canadian Dollar drops to fresh five-month lows on Thursday, on track to its worst weekly performance since November.
- US PPI slowed down to 0.2% in March, from 0.6% in February, although the yearly rate bounced up to 2.1% from 1.6% in the previous month. Core PPI accelerated to a 2.4% yearly rate from 2.1% in February, above expectations of a 2.3% reading.
- On Wednesday, US CPI inflation accelerated at 0.4% pace in March and 3.5% YoY, beating expectations of 0.3% and 3.2%, respectively. Risk aversion sent US yields and the US Dollar surging.
- Treasury yields for the US 10-year note have surpassed the key 4.5% level for the first time this year. The 2-year yield has rallied about 40 basis points in three days to test the 5% level.
- On Wednesday, BoC left interest rates unchanged at 5%, but Governor Macklem revealed that committee discussed possibility of cutting rates, adding negative pressure to CAD.
- Futures market bets for Fed rate cuts in June have dropped to 20% from levels above 50% before US CPI report, according to CME Group’s FedWatch Tool.
-
Canadian Dollar price today
The table below shows the percentage change of Canadian Dollar (CAD) against listed major currencies today. Canadian Dollar was the weakest against the Swiss Franc.
| USD | EUR | GBP | CAD | AUD | JPY | NZD | CHF | |
| USD | 0.22% | 0.03% | 0.12% | -0.25% | 0.18% | -0.13% | -0.26% | |
| EUR | -0.22% | -0.21% | -0.09% | -0.47% | -0.05% | -0.35% | -0.48% | |
| GBP | -0.03% | 0.19% | 0.09% | -0.28% | 0.13% | -0.17% | -0.30% | |
| CAD | -0.12% | 0.10% | -0.08% | -0.36% | 0.07% | -0.22% | -0.40% | |
| AUD | 0.22% | 0.44% | 0.26% | 0.34% | 0.40% | 0.11% | -0.02% | |
| JPY | -0.17% | 0.06% | -0.15% | -0.07% | -0.42% | -0.31% | -0.43% | |
| NZD | 0.13% | 0.35% | 0.16% | 0.24% | -0.12% | 0.29% | -0.14% | |
| CHF | 0.26% | 0.47% | 0.31% | 0.39% | 0.02% | 0.44% | 0.17% |
The heat map shows percentage changes of major currencies against each other. The base currency is picked from the left column, while the quote currency is picked from the top row. For example, if you pick the Euro from the left column and move along the horizontal line to the Japanese Yen, the percentage change displayed in the box will represent EUR (base)/JPY (quote).
Technical analysis: USD/CAD breaks above channel top, next resistance at 1.3740
The US Dollar has broken above the last two months’ channel top as the strong US inflation data dampened hopes of a rate cut in June. Bulls have taken control, extending their rally beyond 1.3700 with no sign of a bearish reversal in sight.
The reverse trendline has provided support, confirming the bullish trend. The next upside targets are 1.3740 and 1.3770. The measured target of the broken channel is the mid-November high at 1.3845. Supports are the mentioned channel top, 1.3660 and 1.3545.
USD/CAD Daily Chart
Inflation FAQs
Inflation measures the rise in the price of a representative basket of goods and services. Headline inflation is usually expressed as a percentage change on a month-on-month (MoM) and year-on-year (YoY) basis. Core inflation excludes more volatile elements such as food and fuel which can fluctuate because of geopolitical and seasonal factors. Core inflation is the figure economists focus on and is the level targeted by central banks, which are mandated to keep inflation at a manageable level, usually around 2%.
The Consumer Price Index (CPI) measures the change in prices of a basket of goods and services over a period of time. It is usually expressed as a percentage change on a month-on-month (MoM) and year-on-year (YoY) basis. Core CPI is the figure targeted by central banks as it excludes volatile food and fuel inputs. When Core CPI rises above 2% it usually results in higher interest rates and vice versa when it falls below 2%. Since higher interest rates are positive for a currency, higher inflation usually results in a stronger currency. The opposite is true when inflation falls.
Although it may seem counter-intuitive, high inflation in a country pushes up the value of its currency and vice versa for lower inflation. This is because the central bank will normally raise interest rates to combat the higher inflation, which attract more global capital inflows from investors looking for a lucrative place to park their money.
Formerly, Gold was the asset investors turned to in times of high inflation because it preserved its value, and whilst investors will often still buy Gold for its safe-haven properties in times of extreme market turmoil, this is not the case most of the time. This is because when inflation is high, central banks will put up interest rates to combat it. Higher interest rates are negative for Gold because they increase the opportunity-cost of holding Gold vis-a-vis an interest-bearing asset or placing the money in a cash deposit account. On the flipside, lower inflation tends to be positive for Gold as it brings interest rates down, making the bright metal a more viable investment alternative.
- DXY Index is currently trading around the high level of 105.45, realizing gains.
- Core PPI for March came in higher than expected on Thursday.
- Weekly Jobless Claims also came in hot.
The US Dollar Index (DXY) is currently trading at 105.45, marking its highest position since November 2023. The Greenback continues to rise on the back of hawkish bets on the Federal Reserve (Fed) due to hot inflation figures. A strong labor market also raises the appeal of the Greenback.
After a robust labor market report and signs of rising inflation in March, Fed officials might begin indicating that they need more proof of the economy slowing down before lowering rates. Consequently, US Treasury yields could keep climbing, which would be advantageous for the USD.
Daily digest market movers: Dollar edges higher on strong data, Treasury yields continue climbing
- Producer Price Index (PPI) for March increased by 0.2% MoM and 2.1% YoY, falling short of predicted figures.
- The annual core PPI surpassed predictions with a 2.4% rise on a yearly basis compared to the expected 2.3% increase and 2% recorded in February.
- Weekly Initial Jobless Claims showed improvement, registering at 211K, lower than the anticipated 215K and a reduction from the previous 222K.
- Market expectations for rate cuts have seen fluctuations after the CPI data release.
- Odds of a cut in June plummeted toward 20% following March’s inflation data on Wednesday.
- US Treasury bond yields continued rising. The 2-year yield was the only one that declined to 4.95%, while the 5 and 10-year yields rose to 4.62% and 4.58%, respectively.
DXY technical analysis: DXY continues rising as bullish momentum pushes further
The technical indicators on the daily chart reflect a bullish momentum for the DXY. The Relative Strength Index (RSI), following a positive slope in positive territory, suggests the presence of underlying buying momentum. In addition, the Moving Average Convergence Divergence (MACD) seems to corroborate this bullish outlook. It shows rising green bars, adding conviction to the market's bullish sentiment.
A glance at the Simple Moving Averages (SMAs) reveals a similar story as the DXY is firmly seated above the key 20, 100 and 200-day SMAs. This positioning suggests that the current trend is bullish with the bulls having the upper hand.
US Dollar FAQs
The US Dollar (USD) is the official currency of the United States of America, and the ‘de facto’ currency of a significant number of other countries where it is found in circulation alongside local notes. It is the most heavily traded currency in the world, accounting for over 88% of all global foreign exchange turnover, or an average of $6.6 trillion in transactions per day, according to data from 2022. Following the second world war, the USD took over from the British Pound as the world’s reserve currency. For most of its history, the US Dollar was backed by Gold, until the Bretton Woods Agreement in 1971 when the Gold Standard went away.
The most important single factor impacting on the value of the US Dollar is monetary policy, which is shaped by the Federal Reserve (Fed). The Fed has two mandates: to achieve price stability (control inflation) and foster full employment. Its primary tool to achieve these two goals is by adjusting interest rates. When prices are rising too quickly and inflation is above the Fed’s 2% target, the Fed will raise rates, which helps the USD value. When inflation falls below 2% or the Unemployment Rate is too high, the Fed may lower interest rates, which weighs on the Greenback.
In extreme situations, the Federal Reserve can also print more Dollars and enact quantitative easing (QE). QE is the process by which the Fed substantially increases the flow of credit in a stuck financial system. It is a non-standard policy measure used when credit has dried up because banks will not lend to each other (out of the fear of counterparty default). It is a last resort when simply lowering interest rates is unlikely to achieve the necessary result. It was the Fed’s weapon of choice to combat the credit crunch that occurred during the Great Financial Crisis in 2008. It involves the Fed printing more Dollars and using them to buy US government bonds predominantly from financial institutions. QE usually leads to a weaker US Dollar.
Quantitative tightening (QT) is the reverse process whereby the Federal Reserve stops buying bonds from financial institutions and does not reinvest the principal from the bonds it holds maturing in new purchases. It is usually positive for the US Dollar.
- USD/JPY edges up to 153.22, lifted by inflation reports and rising DXY.
- US PPI data indicates slower inflation growth yet fails to dampen the bullish momentum for the US Dollar.
- Fed officials express disappointment in inflation trends, highlighting ongoing economic challenges.
The USD/JPY climbed during the North American session and remains above the 153.00 figure despite Japanese authorities jawboning on excessive Japanese Yen (JPY) movements. Further data from the United States (US) depicts inflation is stickier than expected, putting pressure on the Federal Reserve. At the time of writing, the major trade at 153.22, up 0.05%.
Despite Japanese interventions warnings, USD/JPY edges higher as stickier US inflation data fuels USD strength
The Greenback is strengthening across the board, as the US Dollar Index (DXY) rises to its highest level since November 2023. The DXY is up at 105.51, shy of testing the next resistance seen at 106.06. Wednesday’s inflation report sponsored the buck’s reaction. Meanwhile, the recently revealed Producer Price Index (PPI) was softer compared to CPI, though it failed to weigh on the US Dollar.
The US Department of Labor revealed that PPI in March slowed more than expected, coming at 0.2% MoM, below estimates of 0.3%. Annually-based figures witnessed the PPI rising by 2.1%, lower than projected by surpassing February’s 1.6%, while the core PPI stood at 2.4%, also above estimates and the previous month's data.
Given that US economic data suggests that the Federal Reserve’s job is not done, further US Dollar strength is seen, in the near term. Also, US Treasury yields on Wednesday, climbed more than 20 basis points along the whole yield curve, boosting the prospects of the American currency.
In the meantime, Federal Reserve officials continued to cross the wires. New York Fed President John Williams commented that recent inflation data has been disappointing, adding that the economic outlook is uncertain. Recently, Richmond’s Fed Thomas Barkin added that the latest inflation data does not increase confidence that disinflation is spreading in the economy, raising the question of whether we (the Fed) are seeing a shift.
On the Japanese front, Finance Minister Suzuki said that authorities wouldn’t rule out any steps to deal with excessive volatility in the Yen. He added, “We are looking with a high sense of urgency.”
USD/JPY Price Analysis: Technical outlook
Given the fact the USD/JPY has broken the 153.00 barrier, the next resistance level would be the June 1990 monthly high at 155.78, followed by the April 1990 pivot high at 160.32. On the other hand, the risks of intervention could tumble the pair toward the next key support levels. Firstly, the Tenkan-Sen at 152.05, followed by the Senkou Span A at 150.97, the Kijun-Sen at 149.89, closely followed by the Senkou Span B at 149.59.
Federal Reserve (Fed) Bank of New York President John Williams argued on Thursday that the Fed does not need to change monetary policy in the very near term," per Reuters.
Key takeaways
"Eventually will need to cut rates."
"A Fed rate hike is not part of the baseline view for outlook."
"Fed policymaking progress is working out economic imbalances."
"Core services ex-housing inflation is falling faster than expected."
"Shelter inflation slower to come down than expected."
"Recent inflation setbacks are not a surprise to the Fed."
Market reaction
The US Dollar Index preserves its bullish momentum following these comments and was last seen trading at its highest level since November at 105.40, rising 0.22% on the day.
Richmond Federal Reserve Bank President Thomas Barkin said on Thursday that the latest inflation data did not increase his confidence that disinflation is spreading in the economy, per Reuters.
Key takeaways
"Latest inflation data looks like disinflation did at end-2023, with goods prices falling, shelter moving sideways and services increasing."
"Fed is not yet where we want to be on inflation, though headed in the right direction over a longer time frame."
Market reaction
The US Dollar preserves its strength after these comments and was last seen gaining 0.08% on the day at 105.27.
Christine Lagarde, President of the European Central Bank (ECB), explains the ECB's decision to leave the key interest rates unchanged in April and responds to questions from the press.
Key quotes
"Inflation decline won't be linear."
"Won't wait until each item in inflation is back at 2%."
"Attentive to evolution of oil prices."
"Observing a decline of inflation, progressing disinflation."
"Comforting that monetary policy is contributing to disinflation."
About ECB's press conference
Following the ECB´s monetary policy decisions, the ECB President delivers a prepared statement and responds to questions from the press on the policy outlook. Her comments may influence the volatility of EUR and determine a short-term positive or negative trend. Her hawkish view is considered as positive, or bullish for the EUR, whereas her dovish view is considered as negative, or bearish.
Central banks FAQs
Central Banks have a key mandate which is making sure that there is price stability in a country or region. Economies are constantly facing inflation or deflation when prices for certain goods and services are fluctuating. Constant rising prices for the same goods means inflation, constant lowered prices for the same goods means deflation. It is the task of the central bank to keep the demand in line by tweaking its policy rate. For the biggest central banks like the US Federal Reserve (Fed), the European Central Bank (ECB) or the Bank of England (BoE), the mandate is to keep inflation close to 2%.
A central bank has one important tool at its disposal to get inflation higher or lower, and that is by tweaking its benchmark policy rate, commonly known as interest rate. On pre-communicated moments, the central bank will issue a statement with its policy rate and provide additional reasoning on why it is either remaining or changing (cutting or hiking) it. Local banks will adjust their savings and lending rates accordingly, which in turn will make it either harder or easier for people to earn on their savings or for companies to take out loans and make investments in their businesses. When the central bank hikes interest rates substantially, this is called monetary tightening. When it is cutting its benchmark rate, it is called monetary easing.
A central bank is often politically independent. Members of the central bank policy board are passing through a series of panels and hearings before being appointed to a policy board seat. Each member in that board often has a certain conviction on how the central bank should control inflation and the subsequent monetary policy. Members that want a very loose monetary policy, with low rates and cheap lending, to boost the economy substantially while being content to see inflation slightly above 2%, are called ‘doves’. Members that rather want to see higher rates to reward savings and want to keep a lit on inflation at all time are called ‘hawks’ and will not rest until inflation is at or just below 2%.
Normally, there is a chairman or president who leads each meeting, needs to create a consensus between the hawks or doves and has his or her final say when it would come down to a vote split to avoid a 50-50 tie on whether the current policy should be adjusted. The chairman will deliver speeches which often can be followed live, where the current monetary stance and outlook is being communicated. A central bank will try to push forward its monetary policy without triggering violent swings in rates, equities, or its currency. All members of the central bank will channel their stance toward the markets in advance of a policy meeting event. A few days before a policy meeting takes place until the new policy has been communicated, members are forbidden to talk publicly. This is called the blackout period.
Christine Lagarde, President of the European Central Bank (ECB), explains the ECB's decision to leave the key interest rates unchanged in April and responds to questions from the press.
Key quotes
"We will get a lot more data by June."
"We are not dependent on the US Federal Reserve."
"We do not speculate on what other central banks may do."
"US and Eurozone inflation driven by different factors."
"Can't assume that Eurozone inflation will mirror US inflation."
About ECB's press conference
Following the ECB´s monetary policy decisions, the ECB President delivers a prepared statement and responds to questions from the press on the policy outlook. Her comments may influence the volatility of EUR and determine a short-term positive or negative trend. Her hawkish view is considered as positive, or bullish for the EUR, whereas her dovish view is considered as negative, or bearish.
Euro FAQs
The Euro is the currency for the 20 European Union countries that belong to the Eurozone. It is the second most heavily traded currency in the world behind the US Dollar. In 2022, it accounted for 31% of all foreign exchange transactions, with an average daily turnover of over $2.2 trillion a day. EUR/USD is the most heavily traded currency pair in the world, accounting for an estimated 30% off all transactions, followed by EUR/JPY (4%), EUR/GBP (3%) and EUR/AUD (2%).
The European Central Bank (ECB) in Frankfurt, Germany, is the reserve bank for the Eurozone. The ECB sets interest rates and manages monetary policy. The ECB’s primary mandate is to maintain price stability, which means either controlling inflation or stimulating growth. Its primary tool is the raising or lowering of interest rates. Relatively high interest rates – or the expectation of higher rates – will usually benefit the Euro and vice versa. The ECB Governing Council makes monetary policy decisions at meetings held eight times a year. Decisions are made by heads of the Eurozone national banks and six permanent members, including the President of the ECB, Christine Lagarde.
Eurozone inflation data, measured by the Harmonized Index of Consumer Prices (HICP), is an important econometric for the Euro. If inflation rises more than expected, especially if above the ECB’s 2% target, it obliges the ECB to raise interest rates to bring it back under control. Relatively high interest rates compared to its counterparts will usually benefit the Euro, as it makes the region more attractive as a place for global investors to park their money.
Data releases gauge the health of the economy and can impact on the Euro. Indicators such as GDP, Manufacturing and Services PMIs, employment, and consumer sentiment surveys can all influence the direction of the single currency. A strong economy is good for the Euro. Not only does it attract more foreign investment but it may encourage the ECB to put up interest rates, which will directly strengthen the Euro. Otherwise, if economic data is weak, the Euro is likely to fall. Economic data for the four largest economies in the euro area (Germany, France, Italy and Spain) are especially significant, as they account for 75% of the Eurozone’s economy.
Another significant data release for the Euro is the Trade Balance. This indicator measures the difference between what a country earns from its exports and what it spends on imports over a given period. If a country produces highly sought after exports then its currency will gain in value purely from the extra demand created from foreign buyers seeking to purchase these goods. Therefore, a positive net Trade Balance strengthens a currency and vice versa for a negative balance.
- EUR/USD prints a fresh monthly low at 1.0720 after the ECB holds key rates steady.
- ECB Lagarde didn’t provide cues about when the central bank could pivot to rate cuts.
- The US Dollar strengthens as investors don’t see the Fed reducing rates soon.
The EUR/USD pair falls further to 1.0720 in Thursday’s early New York session after the European Central Bank (ECB) decided to hold its Main Refinancing Operations Rate steady at 4.5%. The ECB was widely anticipated to keep its borrowing rates higher to maintain downward pressure on the consumer price inflation.
In the monetary policy statement, the ECB commented that restrictive financial conditions and interest rate hikes yet made are weighing on overall demand and pushing downward pressure on inflation. The ECB denied committing to any particular rate path and said it would remain data-dependent to determine how long interest rates need to remain restrictive.
In the press conference, ECB President Christine Lagarde warned that the economy is weak and risks to growth have tilted to the downside. Lagarde added that labour market conditions are continuously easing, and demand for the manufacturing sector is weak. She is confident that inflation will decline to target next year, which is 2%. ECB Lagarde didn’t comment on when the central bank could start reducing interest rates.
The strong US Dollar also drives the weakness in the major currency pair. The US Dollar Index (DXY), which tracks the US Dollar’s value against six major currencies, hovers near more than a four-month high of around 105.20. The appeal for the US Dollar strengthens as traders push back market expectations to Federal Reserve (Fed) rate cuts. The Fed is expected to keep interest rates in the range of 5.25%-5.50% at least till the September meeting, as the United States consumer price inflation for March turned out stronger than expected.
Meanwhile, the US Bureau of Labor Statistics (BLS) has reported hot annual core Producer Price Index (PPI) data for March. US core PPI grew strongly by 2.4% from estimates of 2.3% and the prior reading of 2.0%.
Christine Lagarde, President of the European Central Bank (ECB), explains the ECB's decision to leave the key interest rates unchanged in April and responds to questions from the press.
Key quotes
"Economy remains weak."
"Surveys point to gradual recovery."
"Recovery to be supported by rising real incomes."
"Exports to pick up in coming quarters."
"Tightness in labour market is gradually declining."
"Price pressures are gradually diminishing."
"Inflation to fluctuate around current levels in coming months."
"Inflation will then decline to target next year."
"Risks to growth are tilted to the downside."
About ECB's press conference
Following the ECB´s monetary policy decisions, the ECB President delivers a prepared statement and responds to questions from the press on the policy outlook. Her comments may influence the volatility of EUR and determine a short-term positive or negative trend. Her hawkish view is considered as positive, or bullish for the EUR, whereas her dovish view is considered as negative, or bearish.
ECB FAQs
The European Central Bank (ECB) in Frankfurt, Germany, is the reserve bank for the Eurozone. The ECB sets interest rates and manages monetary policy for the region. The ECB primary mandate is to maintain price stability, which means keeping inflation at around 2%. Its primary tool for achieving this is by raising or lowering interest rates. Relatively high interest rates will usually result in a stronger Euro and vice versa. The ECB Governing Council makes monetary policy decisions at meetings held eight times a year. Decisions are made by heads of the Eurozone national banks and six permanent members, including the President of the ECB, Christine Lagarde.
In extreme situations, the European Central Bank can enact a policy tool called Quantitative Easing. QE is the process by which the ECB prints Euros and uses them to buy assets – usually government or corporate bonds – from banks and other financial institutions. QE usually results in a weaker Euro. QE is a last resort when simply lowering interest rates is unlikely to achieve the objective of price stability. The ECB used it during the Great Financial Crisis in 2009-11, in 2015 when inflation remained stubbornly low, as well as during the covid pandemic.
Quantitative tightening (QT) is the reverse of QE. It is undertaken after QE when an economic recovery is underway and inflation starts rising. Whilst in QE the European Central Bank (ECB) purchases government and corporate bonds from financial institutions to provide them with liquidity, in QT the ECB stops buying more bonds, and stops reinvesting the principal maturing on the bonds it already holds. It is usually positive (or bullish) for the Euro.
Federal Reserve (Fed) Bank of New York President John Williams said on Thursday that the Fed must be data-dependent as the outlook remains uncertain, per Reuters.
Key takeaways
"Fed forecasts rate cuts starting this year."
"Outlook is uncertain, Fed must be data dependent."
"Inflation moving toward 2%, expecting further bumps."
"Fed has made considerable progress on lowering inflation."
"Risks between inflation, unemployment moving into better balance."
"Expecting unemployment rate to rise to 4% this year."
"Inflation to stand at 2.25%-2.5% this year."
"Inflation to settle back to 2% next year."
"Focused on getting inflation back to 2%."
"Expecting US GDP to hit 2% this year."
"Job market remains strong."
"Housing is very strong but no signs of bubble."
"Slowing balance sheet run off does not mean ending process."
"Evidence suggests reserve levels remain abundant."
"Commercial real estate area of concern, will take time to resolve."
Market reaction
These comments don't seem to be having a significant impact on the US Dollar's valuation. At the time of press, the US Dollar Index was virtually unchanged on the day at 105.15.
- Initial Jobless Claims rose by 211K from a week earlier.
- Continuing Jobless Claims rose by nearly 1.820M.
US citizens that applied for unemployment insurance benefits increased by 211K in the week ending April 6 according to the US Department of Labor (DoL) on Thursday. The prints came in just below initial estimates (215K) and down from the previous weekly gain (222K revised).
Further details of the publication revealed that the advance seasonally adjusted insured unemployment rate was 1.2% and the 4-week moving average stood at 214.25, a decrease of 0.250K from the previous week's revised average.
In addition, Continuing Claims increased by 28K to 1.817M in the week ended March 30.
Market reaction
The US Dollar Index (DXY) comes under some selling pressure around the 105.10 zone in the wake of the release.
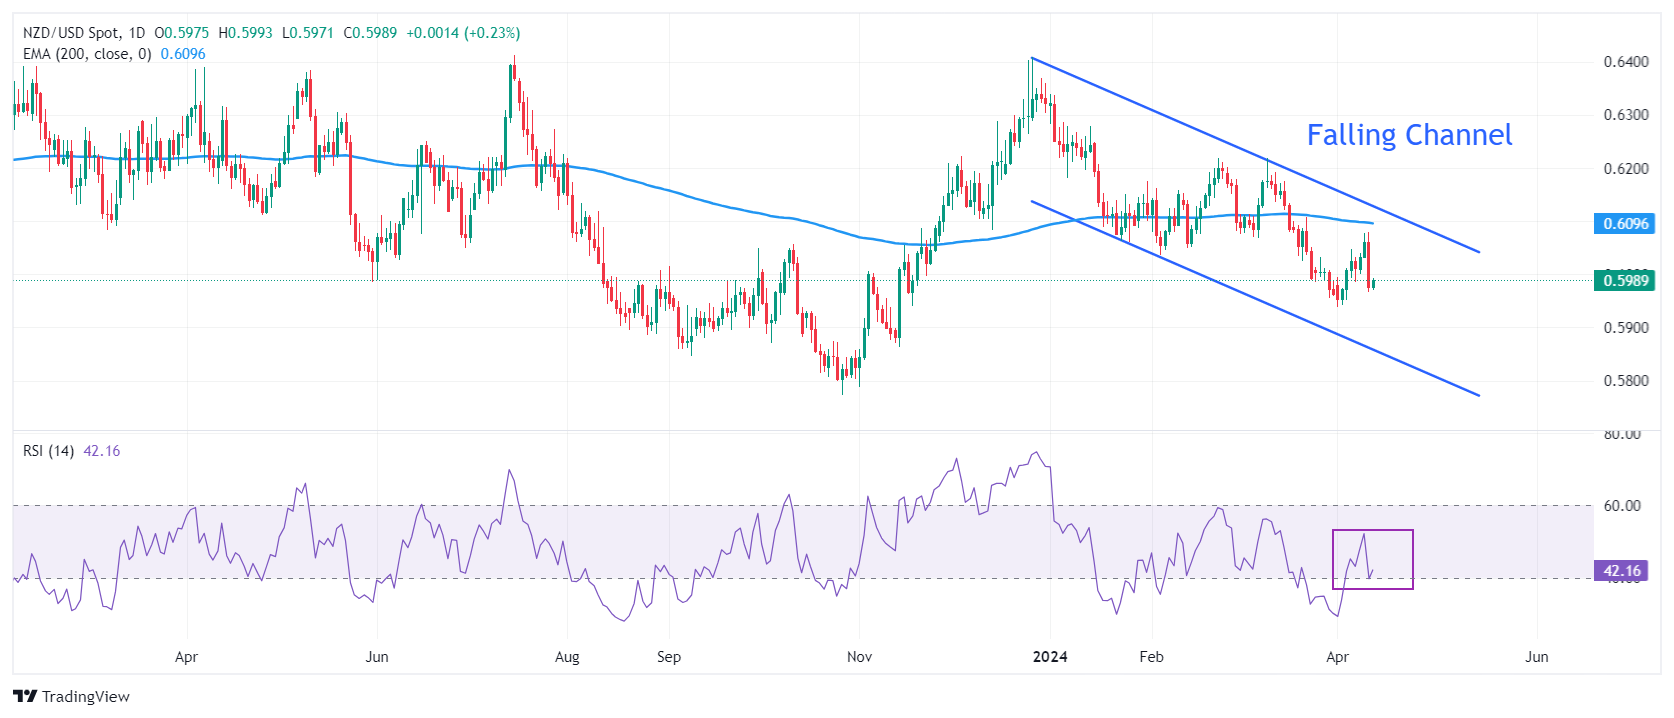
- NZD/USD dips below 0.6000 as US Dollar strengthens after the release of the hot US Inflation data.
- Investors see the Fed to begin reducing interest rates from September, previously anticipated from June.
- The RBNZ delivered a hawkish guidance after keeping the OCR steady at 5.5%.
The NZD/USD pair finds a temporary cushion near 0.5966 in Thursday’s European session after falling vertically from the round-level resistance of 0.6100. The Kiwi asset is expected to deliver more losses as the US Dollar strengthens after expectations for the Federal Reserve (Fed) pivoting to rate cuts shifted to the September policy meeting from prior anticipation in June.
The US Dollar Index (DXY) jumps to more than four-month high above 105.00 as stronger-than-expected United States inflation data for March forces traders to unwind bets supporting rate cuts by the Fed. Also, traders’ anticipation for number of rate cuts by the Fed this year reduced to two from three projected by policymakers in the latest dot plot.
Meanwhile, investors shift focus to the US Producer Price Index (PPI) data for March, which will be published at 12:30 GMT. The annual headline PPI is forecasted to have grown strongly by 2.2% after increasing 1.6% in February. In the same period, annual core PPI that excludes volatile food and energy prices is anticipated to have risen sharply by 2.3% against the former reading of 2.0%.
On the Kiwi front, the Reserve Bank of New Zealand (RBNZ) kept its Official Cash Rate (OCR) unchanged at 5.5% for the sixth time in a row. The RBNZ delivered a hawkish guidance as annual price pressures at 4.7% are significantly higher than the desired range of 1-3%.
NZD/USD falls sharply while attempting to recapture the crucial resistance of 0.6100. The Kiwi asset trades in the Falling Channel chart pattern in which each pullback is considered as selling opportunity by the market participants. The long-term outlook of the Kiwi asset remains bearish as it trades below the 200-period Exponential Moving Average (EMA), which trades around 0.6100.
The 14-period Relative Strength Index (RSI) drops to 40.00. A bearish momentum would trigger if the RSI drops below the above-mentioned level.
Fresh downside would appear if the asset breaks below November 17 low at 0.5940. This would drag the asset toward the round-level support of 0.5900, followed by November 13 low at 0.587.
On the flip side, a recovery move above March 18 high at 0.6100 will drive the pair toward March 12 low at 0.6135. A breach of the latter will drive the asset further to February 9 high around 0.6160.
NZD/USD daily chart
- Gold price faces pressure while investors see the Fed keeping interest rates at current levels until the third quarter of this year.
- US core inflation has come in higher than expected for three months in a row.
- Increasing geopolitical tensions and physical Gold buying by global central banks are expected to limit Gold’s downside.
Gold price (XAU/USD) edges down to $2,330 in Thursday’s European session as traders have priced out strong speculation that the Federal Reserve (Fed) will pivot to rate cuts in the June meeting. Investors pare Fed rate cut bets drastically after the United States Consumer Price Index (CPI) report for March showed that core price pressures rose more than expected for straight three months.
Hot inflation figures have heightened fears that US interest rates will remain higher in the range of 5.25%-5.50% for a longer period. This is a favorable scenario for interest-bearing assets, such as US bonds and the US Dollar. 10-year US Treasury yields fell slightly to 4.56% in Thursday’s London session but remain close to more than a four-month high. The US Dollar Index (DXY) trades close to an almost five-month high near 105.30.
Generally, higher bond yields increase the opportunity cost of holding investments in non-yielding assets such as Gold. Gold price has retreated from fresh all-time highs at $2,365. However, the near-term demand for Gold is still intact due to heightened geopolitical risks. Fears of direct involvement of Iran in the Israel-Hamas war in Gaza have increased as the Israeli army is planning to invade Rafah, where most of the displaced Palestinians are refuged.
Apart from that, pent-up demand for Gold from global central banks is expected to keep its price supported. The World Gold Council (WGC) showed early this week that China extended its Gold buying spree in February for the 17th consecutive month.
Daily digest market movers: Gold price falls while US Dollar advances
- Gold price falls to $2,330 as Federal Reserve rate cut expectations fade after the United States consumer price index data for March turned out sticky. The US inflation rose more than expected due to higher gasoline prices, rentals and insurance costs.
- The monthly headline and core CPI grew by 0.4%, while investors had forecasted a slower growth rate of 0.3%. In the first three months of this year, monthly core inflation rose steadily by 0.4%, more than double from 0.17%, the pace required for price pressures to return to the desired rate of 2%.
- Price pressures remaining stubbornly higher in the first quarter, along with strong labor market conditions, will allow Fed policymakers to delay rate cut plans. The Federal Open Market Committee (FOMC) minutes for the March meeting, released on Wednesday, indicated that policymakers were worried about higher-than-expected inflation readings in the first two months of this year.
- The CME’s Fedwatch tool shows that bets supporting rate cuts in the June and July meetings have been winded, and traders are now expecting the Fed to begin reducing borrowing costs from the September meeting. Also, financial market participants are anticipating that the Fed will cut interest rates only two times this year instead of three, which is what policymakers projected in the latest dot plot. At the start of the year, investors anticipated as many as six rate cuts for 2024.
- In Thursday’s session, investors will focus on the US Producer Price Index (PPI) data for March, which will be published at 12:30 GMT. Annual headline PPI is forecasted to have grown strongly by 2.2% after increasing by 1.6% in February. Monthly headline PPI is estimated to grow by 0.3% Annual core PPI, which excludes volatile food and energy prices, is anticipated to have risen sharply by 2.3% against the former reading of 2.0%.
- Stronger-than-projected PPI figures would further dent Fed rate cut prospects, strengthening downward pressure on Gold, while soft numbers will do the opposite.
Technical Analysis: Gold price slips from all-time highs around $2,365
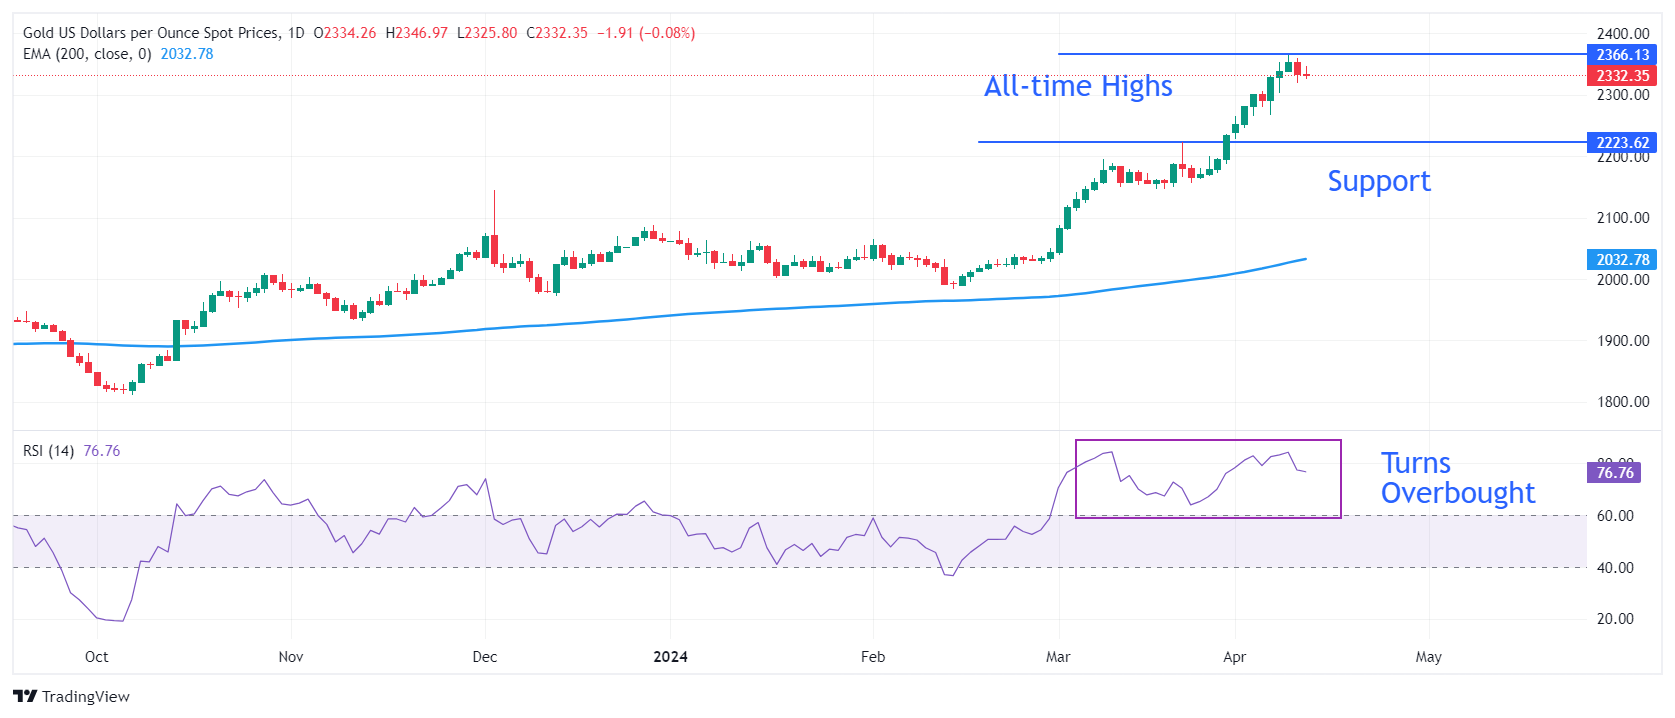
Gold price falls back from fresh lifetime highs of $2,365 after US inflation data for March turned out sticky. A mild correction is largely anticipated as momentum oscillators turned extremely overbought. The 14-period Relative Strength Index (RSI) is expected to cool down after sustaining in the bullish range of 60.00-80.00 since the beginning of April.
The near-term appeal of the precious metal remains upbeat as all short-to-long-term Exponential Moving Averages (EMAs) are sloping higher. On the downside, March 21 high at $2,223 will be a major support area for the Gold price bulls.
Gold FAQs
Gold has played a key role in human’s history as it has been widely used as a store of value and medium of exchange. Currently, apart from its shine and usage for jewelry, the precious metal is widely seen as a safe-haven asset, meaning that it is considered a good investment during turbulent times. Gold is also widely seen as a hedge against inflation and against depreciating currencies as it doesn’t rely on any specific issuer or government.
Central banks are the biggest Gold holders. In their aim to support their currencies in turbulent times, central banks tend to diversify their reserves and buy Gold to improve the perceived strength of the economy and the currency. High Gold reserves can be a source of trust for a country’s solvency. Central banks added 1,136 tonnes of Gold worth around $70 billion to their reserves in 2022, according to data from the World Gold Council. This is the highest yearly purchase since records began. Central banks from emerging economies such as China, India and Turkey are quickly increasing their Gold reserves.
Gold has an inverse correlation with the US Dollar and US Treasuries, which are both major reserve and safe-haven assets. When the Dollar depreciates, Gold tends to rise, enabling investors and central banks to diversify their assets in turbulent times. Gold is also inversely correlated with risk assets. A rally in the stock market tends to weaken Gold price, while sell-offs in riskier markets tend to favor the precious metal.
The price can move due to a wide range of factors. Geopolitical instability or fears of a deep recession can quickly make Gold price escalate due to its safe-haven status. As a yield-less asset, Gold tends to rise with lower interest rates, while higher cost of money usually weighs down on the yellow metal. Still, most moves depend on how the US Dollar (USD) behaves as the asset is priced in dollars (XAU/USD). A strong Dollar tends to keep the price of Gold controlled, whereas a weaker Dollar is likely to push Gold prices up.
- The US Dollar trades in the green across the board on Thursday’s European session.
- Traders brace for further US data and ECB monetary policy decision as well.
- The US Dollar Index consolidates above 105.00 and could set sail for 106.00.
The US Dollar (USD) holds into gains on Thursday after having a field day on Wednesday, trading over 1% in the green, with a move not seen since early January. Finally, the standstill and sideways price action that accounts for 2024 thus far is changing, and volatility could finally pick up. Markets could see outflows from carry trades into the Greenback as the US Dollar is expected to remain steady due to the anticipation that the Federal Reserve (Fed) could keep higher interest rates for longer, while all other major central banks will be cutting them sooner.
On the economic data front, there are plenty of data points to digest besides the European Central Bank (ECB) meeting later on Thursday. On the docket, the weekly Initial Jobless Claims could add to the current US Dollar strength should they decline or steady. Adding on, the Producer Price Index (PPI) numbers could add more oil to the bonfire as another strong number could signal that inflation pressures persist.
Daily digest market movers: ECB and PPI as drivers
- On the geopolitical front, China has sanctioned two US companies for allegedly selling arms to Taiwan, according to Bloomberg.
- The European Central Bank is set to announce its monetary policy decision on Thursday:
- At 12:15 GMT, the ECB’s Policy Rate decision will be released, accompanied by a written statement.
- At 12:45 GMT, ECB President Christine Lagarde will speak and have a Q&A session with reporters.
- Around 12:30 GMT, a bulk load of US data will be released:
- Jobless Claims:
- Initial Jobless Claims are expected to decline to 215,000 from 221,000 in the week ending on April 5.
- Continuing Jobless Claims data are for the week ending on March 29. There were 1.791 million claims the week before.
- The Producer Price Index (PPI) data for March will be released at the same time:
- Monthly headline PPI is set to decline to 0.3% from 0.6%.
- Yearly headline PPI is expected to grow at a faster pace of 2.2% from 1.6%.
- Monthly core PPI is set to increase by 0.2%, slowing from 0.3%.
- Yearly core PPI is anticipated to increase by 2.3%, more than the 2.0% seen a month earlier.
- Jobless Claims:
- Federal Reserve Bank of New York President John Williams will deliver some remarks around 12:45 GMT.
- Another Fed speaker, Federal Reserve Bank of Atlanta President Raphael Bostic, will speak around 17:10 GMT.
- US equity futures are rather flat ahead of the PPI numbers later on Thursday. Traders are digesting if risk on is the way to go as it becomes increasingly likely that US interest rates will probably remain elevated for longer.
- After the hotter-than-expected US consumer inflation data released on Wednesday, expectations for a hold in the Fed’s interest rate at the June meeting increased sharply to over 80%, from roughly 40% before the release of the CPI figures.
- The benchmark 10-year US Treasury Note trades around 4.56%, which is lower ahead of US inflation.
US Dollar Index Technical Analysis: Game-changing moment for 2024
The US Dollar Index (DXY) snaps above 105.00 for the first time this year and sets the bar at a fresh five-month high around 105.32. As the Fed could now keep interest rates steady longer than other major central banks, the rate differentials will start to kick in, seeing ample amounts of more US dollar strength ahead.
With Wednesday’s seismic move, fresh levels need to be pencilled in for more upside. The first level is the November 10 high at 106.01, just above the 106.00 figure. Further up and above the 107.00 round level, the DXY Index could meet resistance at 107.35, the October 3 high..
On the downside, fresh support levels need to be pencilled in as well, with the first important level at the 105.00 big figure, which can see the DXY Index orbiting around it, snapping back below and above it, for a brief amount of time. Further down, 104.60 should also act as a support, ahead of the region with both the 55-day and the 200-day Simple Moving Averages at 103.97 and 103.84, respectively.
US Dollar FAQs
The US Dollar (USD) is the official currency of the United States of America, and the ‘de facto’ currency of a significant number of other countries where it is found in circulation alongside local notes. It is the most heavily traded currency in the world, accounting for over 88% of all global foreign exchange turnover, or an average of $6.6 trillion in transactions per day, according to data from 2022. Following the second world war, the USD took over from the British Pound as the world’s reserve currency. For most of its history, the US Dollar was backed by Gold, until the Bretton Woods Agreement in 1971 when the Gold Standard went away.
The most important single factor impacting on the value of the US Dollar is monetary policy, which is shaped by the Federal Reserve (Fed). The Fed has two mandates: to achieve price stability (control inflation) and foster full employment. Its primary tool to achieve these two goals is by adjusting interest rates. When prices are rising too quickly and inflation is above the Fed’s 2% target, the Fed will raise rates, which helps the USD value. When inflation falls below 2% or the Unemployment Rate is too high, the Fed may lower interest rates, which weighs on the Greenback.
In extreme situations, the Federal Reserve can also print more Dollars and enact quantitative easing (QE). QE is the process by which the Fed substantially increases the flow of credit in a stuck financial system. It is a non-standard policy measure used when credit has dried up because banks will not lend to each other (out of the fear of counterparty default). It is a last resort when simply lowering interest rates is unlikely to achieve the necessary result. It was the Fed’s weapon of choice to combat the credit crunch that occurred during the Great Financial Crisis in 2008. It involves the Fed printing more Dollars and using them to buy US government bonds predominantly from financial institutions. QE usually leads to a weaker US Dollar.
Quantitative tightening (QT) is the reverse process whereby the Federal Reserve stops buying bonds from financial institutions and does not reinvest the principal from the bonds it holds maturing in new purchases. It is usually positive for the US Dollar.
- WTI trades back above $85 after a small retreat earlier this week.
- Oil traders remain bullish amid reports of a potential Iranian retaliation against Israel or US assets in the Middle East.
- The US Dollar Index sprinted to 105.00 on a hot US inflation report ahead of the ECB meeting.
Oil prices are stretching higher on Thursday and could further jump with geopolitical tensions spiraling out of control and ahead of the key monthly report from OPEC. On the geopolitical side, CNN reported that US intelligence expects a flare up in attacks from Iran on Israeli or US assets in the Middle East in response to the Israeli attacks in Damascus. The Iranian-backed Houthi rebels in Yemen, meanwhile, are targeting vessels again in the Gulf of Aden and are attacking a US destroyer, Reuters reported.
The US Dollar is returning to the Iron Throne after a long hiatus this year. The Greenback made its way back above 105.00 after the US Consumer Price Index (CPI) for March came in higher than what economists broadly expected. A red-hot inflation print fully erases any possibility of the US Federal Reserve (Fed) cutting before the summer, and even the number of rate cuts for overall 2024 appears to be put into question. All elements seem to play in favor of the US Dollar ahead of the European Central Bank meeting later on Thursday.
Crude Oil (WTI) trades at $85.94 and Brent Crude at $90.33 at the time of writing.
Oil news and market movers: Geopolitical tensions grow
- The monthly OPEC report is set to be released later this Thursday. No real change is expected besides a prolonging of the current production cuts.
- Mexican Oil exports are steady, though not recovering after Oil exports in March tumbled to the lowest levels since 2019, Bloomberg reports.
- US Intelligence believes major drone and missile strikes by Iran are set to take place, both Bloomberg and Reuters report.
- Occidental Petroleum Corp. is set to restart its Gulf of Mexico output after a pipe leak earlier.
Oil Technical Analysis: US strategic reserve build-up economics
Oil prices are jumping higher with tensions in the Middle East nearing a new dynamic. After Iran vowed to retaliate against Israel or any US asset in the region, tensions are getting high as such an attack could drag the whole region back into a long drawn-out dispute with the risk of Oil delivery disruptions. These elements are enough for traders to price in more risk premium in crude, which is making its way to $90.
If the high of last week at $87.12 gets broken, the $90 handle should come into grasp. One small barrier in the way is $89.64, the peak from October 20. In case of further escalating tensions in the Middle East , expect even $94 to become a possibility, and a fresh 18-month high could be on the cards.
On the downside, $83.34 is the first level to have a look for after a very clean break and test for support on April 1 and 2. Should it not hold, $80.63 is the next best candidate as a pivotal supportive level. A touch softer, the convergence with the 55-day and the 200-day Simple Moving Averages (SMAs) at $79.32 should halt any further downturn.
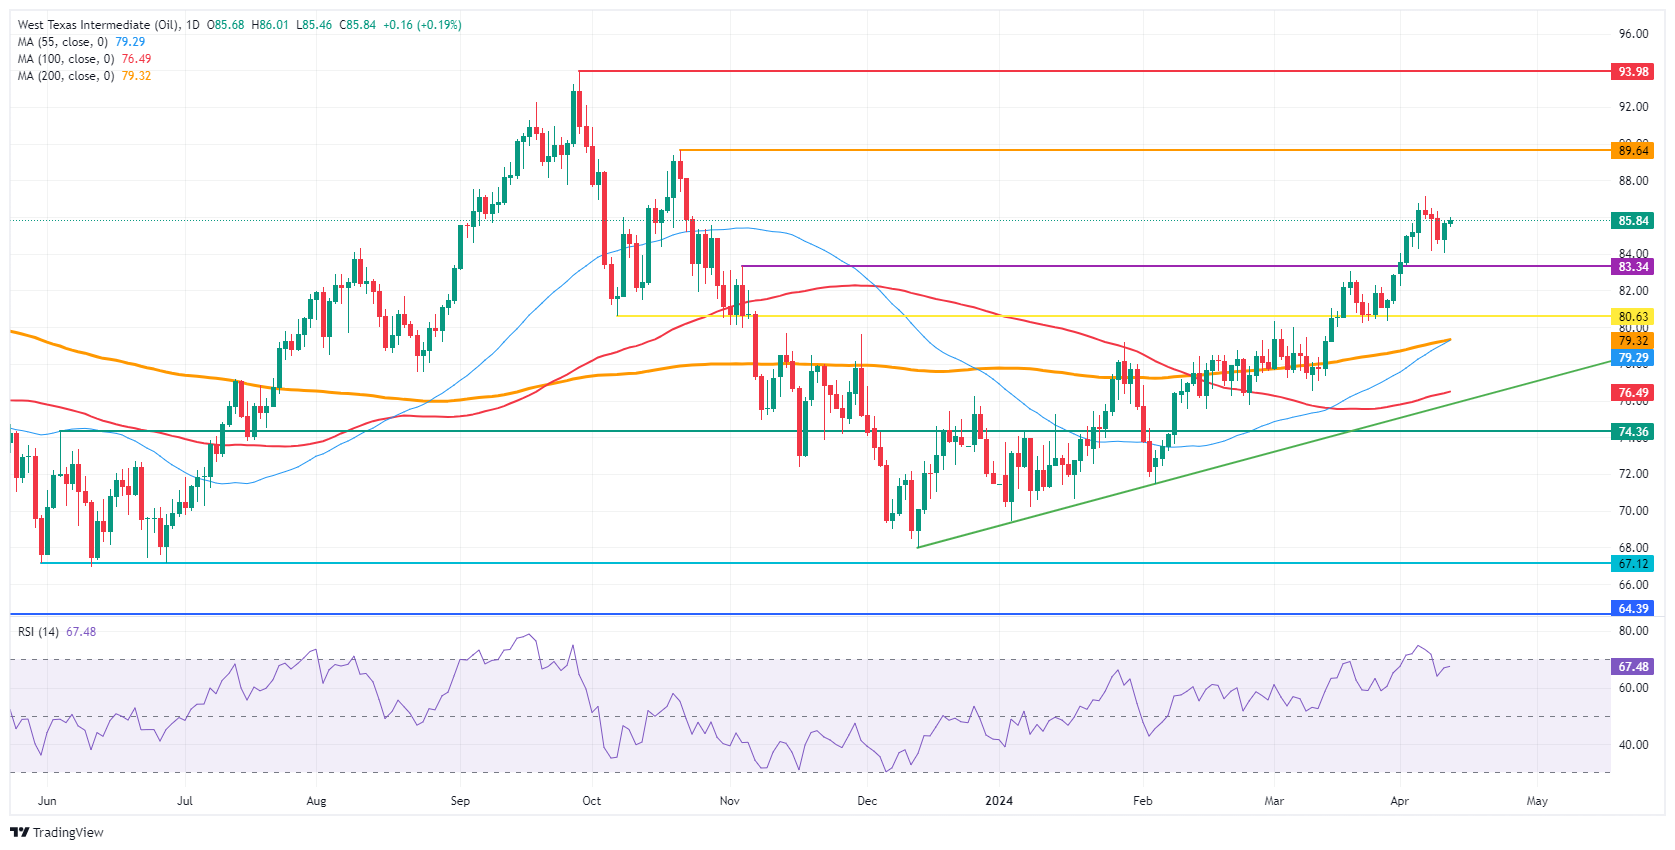
US WTI Crude Oil: Daily Chart
WTI Oil FAQs
WTI Oil is a type of Crude Oil sold on international markets. The WTI stands for West Texas Intermediate, one of three major types including Brent and Dubai Crude. WTI is also referred to as “light” and “sweet” because of its relatively low gravity and sulfur content respectively. It is considered a high quality Oil that is easily refined. It is sourced in the United States and distributed via the Cushing hub, which is considered “The Pipeline Crossroads of the World”. It is a benchmark for the Oil market and WTI price is frequently quoted in the media.
Like all assets, supply and demand are the key drivers of WTI Oil price. As such, global growth can be a driver of increased demand and vice versa for weak global growth. Political instability, wars, and sanctions can disrupt supply and impact prices. The decisions of OPEC, a group of major Oil-producing countries, is another key driver of price. The value of the US Dollar influences the price of WTI Crude Oil, since Oil is predominantly traded in US Dollars, thus a weaker US Dollar can make Oil more affordable and vice versa.
The weekly Oil inventory reports published by the American Petroleum Institute (API) and the Energy Information Agency (EIA) impact the price of WTI Oil. Changes in inventories reflect fluctuating supply and demand. If the data shows a drop in inventories it can indicate increased demand, pushing up Oil price. Higher inventories can reflect increased supply, pushing down prices. API’s report is published every Tuesday and EIA’s the day after. Their results are usually similar, falling within 1% of each other 75% of the time. The EIA data is considered more reliable, since it is a government agency.
OPEC (Organization of the Petroleum Exporting Countries) is a group of 13 Oil-producing nations who collectively decide production quotas for member countries at twice-yearly meetings. Their decisions often impact WTI Oil prices. When OPEC decides to lower quotas, it can tighten supply, pushing up Oil prices. When OPEC increases production, it has the opposite effect. OPEC+ refers to an expanded group that includes ten extra non-OPEC members, the most notable of which is Russia.
- EUR/JPY rallies over 50 pips from the daily low amid some repositioning ahead of the ECB.
- The BoJ’s dovish outlook continues to undermine the JPY and acts as a tailwind for the cross.
- Intervention fears could limit the JPY losses and cap gains ahead of the central bank event risk.
The EUR/JPY cross attracts some dip-buying near the 164.15-164.10 area on Thursday and climbs to a fresh daily peak during the first half of the European session. Spot prices currently trade around the 164.65-164.70 region and for now, seem to have snapped a two-day losing streak to the weekly low touched on Wednesday.
The Japanese Yen (JPY) continues to be undermined by the Bank of Japan's (BoJ) cautious approach and uncertain outlook for future rate hikes. Apart from this, some repositioning trade ahead of the key central bank event risk – the highly-anticipated European Central Bank (ECB) meeting – acts as a tailwind for the EUR/JPY cross. That said, a combination of factors might hold back bulls from placing aggressive bets and cap the upside.
A flurry of verbal warnings from Japanese officials that they would intervene in the markets to address any excessive falls in the domestic currency, along with the cautious market mood, could help limit losses for the safe-haven JPY. Apart from this, bets that the ECB will start cutting interest rates in June, amid a faster-than-anticipated fall in the Eurozone inflation, should contribute to keeping a lid on the EUR/JPY cross.
Hence, the market focus will remain glued to fresh economic projections, which, along with ECB President Christine Lagarde's comments at the post-meeting press conference, will be looked upon for cues about the timing of the first rate cut. This, in turn, will influence the shared currency in the near term and provide a fresh directional impetus to the EUR/JPY cross. Nevertheless, the fundamental backdrop warrants caution for bullish traders.
Silver prices (XAG/USD) broadly unchanged on Thursday, according to FXStreet data. Silver trades at $27.93 per troy ounce, steady from Wednesday.
Silver prices have increased by 9.65% since the beginning of the year.
| Unit measure | Today Price |
|---|---|
| Silver price per troy ounce | $27.93 |
| Silver price per gram | $0.90 |
The Gold/Silver ratio, which shows the number of troy ounces of Silver needed to equal the value of one troy ounce of Gold, stood at 83.46 on Thursday, down from 83.63 on Wednesday.
Investors might use this ratio to determine the relative valuation of Gold and Silver. Some may consider a high ratio as an indicator that Silver is undervalued – or Gold is overvalued – and might buy Silver or sell Gold accordingly. Conversely, a low ratio might suggest that Gold is undervalued relative to Silver.
Global Market Movers: Comex Silver price holds retreat below $28.00 amid geopolitical tensions
- Comex Silver price holds correction below $28.00 despite the retreat in the US Dollar on Thursday.
- Precious metals’ traders overlook the US inflation report that came in hotter than expected.
- Data overnight showed higher US inflation in March, decimating the chance of a rate cut in June. Core CPI advanced 0.4%, above forecasts of a 0.3% rise.
- Fed Funds Futures market pushed expectations for the first rate cut from June to September, according to the CME FedWatch Tool.
- Rising industrial demand and escalating geopolitical tensions in the Middle East boost the Silver price.
- Israel and Hamas rejected ceasefire talks and Iran vowed retaliation for an airstrike on its embassy in Syria.
(An automation tool was used in creating this post.)
Silver FAQs
Silver is a precious metal highly traded among investors. It has been historically used as a store of value and a medium of exchange. Although less popular than Gold, traders may turn to Silver to diversify their investment portfolio, for its intrinsic value or as a potential hedge during high-inflation periods. Investors can buy physical Silver, in coins or in bars, or trade it through vehicles such as Exchange Traded Funds, which track its price on international markets.
Silver prices can move due to a wide range of factors. Geopolitical instability or fears of a deep recession can make Silver price escalate due to its safe-haven status, although to a lesser extent than Gold's. As a yieldless asset, Silver tends to rise with lower interest rates. Its moves also depend on how the US Dollar (USD) behaves as the asset is priced in dollars (XAG/USD). A strong Dollar tends to keep the price of Silver at bay, whereas a weaker Dollar is likely to propel prices up. Other factors such as investment demand, mining supply – Silver is much more abundant than Gold – and recycling rates can also affect prices.
Silver is widely used in industry, particularly in sectors such as electronics or solar energy, as it has one of the highest electric conductivity of all metals – more than Copper and Gold. A surge in demand can increase prices, while a decline tends to lower them. Dynamics in the US, Chinese and Indian economies can also contribute to price swings: for the US and particularly China, their big industrial sectors use Silver in various processes; in India, consumers’ demand for the precious metal for jewellery also plays a key role in setting prices.
Silver prices tend to follow Gold's moves. When Gold prices rise, Silver typically follows suit, as their status as safe-haven assets is similar. The Gold/Silver ratio, which shows the number of ounces of Silver needed to equal the value of one ounce of Gold, may help to determine the relative valuation between both metals. Some investors may consider a high ratio as an indicator that Silver is undervalued, or Gold is overvalued. On the contrary, a low ratio might suggest that Gold is undervalued relative to Silver.
- The Pound Sterling struggles to recover against the US Dollar as Fed rate cut prospects for June and July faded.
- UK monthly GDP data for February will provide cues about the current state of the economy.
- The BoE is expected to start lowering interest rates earlier than the Fed.
The Pound Sterling (GBP) finds some demand in Thursday’s London session after an intense sell-off that dragged the Cable to a two-month low near 1.2520. The near-term appeal of the GBP/USD pair has weakened as the US Dollar strengthens after traders dialled back bets supporting rate cuts by the Federal Reserve (Fed) in the June and July policy meetings.
Persistently higher United States Consumer Price Index (CPI) and Nonfarm Payrolls (NFP) data for March suggested that the Fed may not opt for rate cuts in the near term as these could ramp up price pressures. Also, the Federal Open Market Committee (FOMC) Minutes for the March meeting, released on Wednesday, indicated that policymakers remain worried about the inflation readings for the first two months of the year.
The US Dollar Index (DXY), which tracks the US Dollar’s value against six major currencies, prints a fresh more than four-month high near 105.30.
Meanwhile, waned Fed rate cut expectations for the June and July meetings have deepened fears of a prolonged policy divergence between the Fed and the Bank of England (BoE). The BoE is anticipated to begin reducing interest rates in June as inflation in the United Kingdom has slowed steadily for the last two months. Also, slower economic growth projections and easing labor market conditions would boost expectations for the BoE to pivot to rate cuts sooner. This scenario bodes poorly for the Pound Sterling.
Daily digest market movers: Pound Sterling eyes more downside on dismal market mood
- The Pound Sterling trades above the psychological support of 1.2500. The currency remains on the back foot against the US Dollar as market sentiment turns risk-off after investors push back Federal Reserve rate cut expectations. S&P 500 futures have extended their downside in the European session after plunging almost 1% on Wednesday.
- Hot United States inflation data for March, combined with robust labor demand, forced traders to pare big bets supporting Fed rate cuts. Meanwhile, investors’ confidence in three rate cuts by the year-end has also waned, and they are now anticipating only two.
- The US CPI has risen by more than expected for straight three months, suggesting that the Federal Reserve will opt to continue to hold interest rates steady in the range of 5.25%-5.50%. Price pressures remained stubbornly higher in March due to a significant rise in gasoline prices, rentals, and insurance costs.
- On the United Kingdom front, the monthly Gross Domestic Product (GDP) and factory data for February, which will be published on Friday, will guide the next move in the Pound Sterling. The monthly GDP data, which represents the state of the economy, are forecasted to have grown at a slower pace of 0.1% after expanding by 0.2% in January.
- Economists have forecasted that monthly Industrial Production data will remain stagnant after contracting by 0.2% in January. On year, Industrial Production is estimated to have increased 0.6% from the prior reading of 0.5%. Monthly Manufacturing Production is expected to have increased by a meagre 0.1% after remaining stagnant in January. On an annual basis, the economic data is anticipated to rise at a higher pace of 2.1% against the former reading of 2.0%.
- The UK factory data is a leading indicator of overall demand from domestic and overseas markets. Upbeat factory data would boost hopes of the UK economy coming out of the technical recession.
Technical Analysis: Pound Sterling sees downside near 1.2500
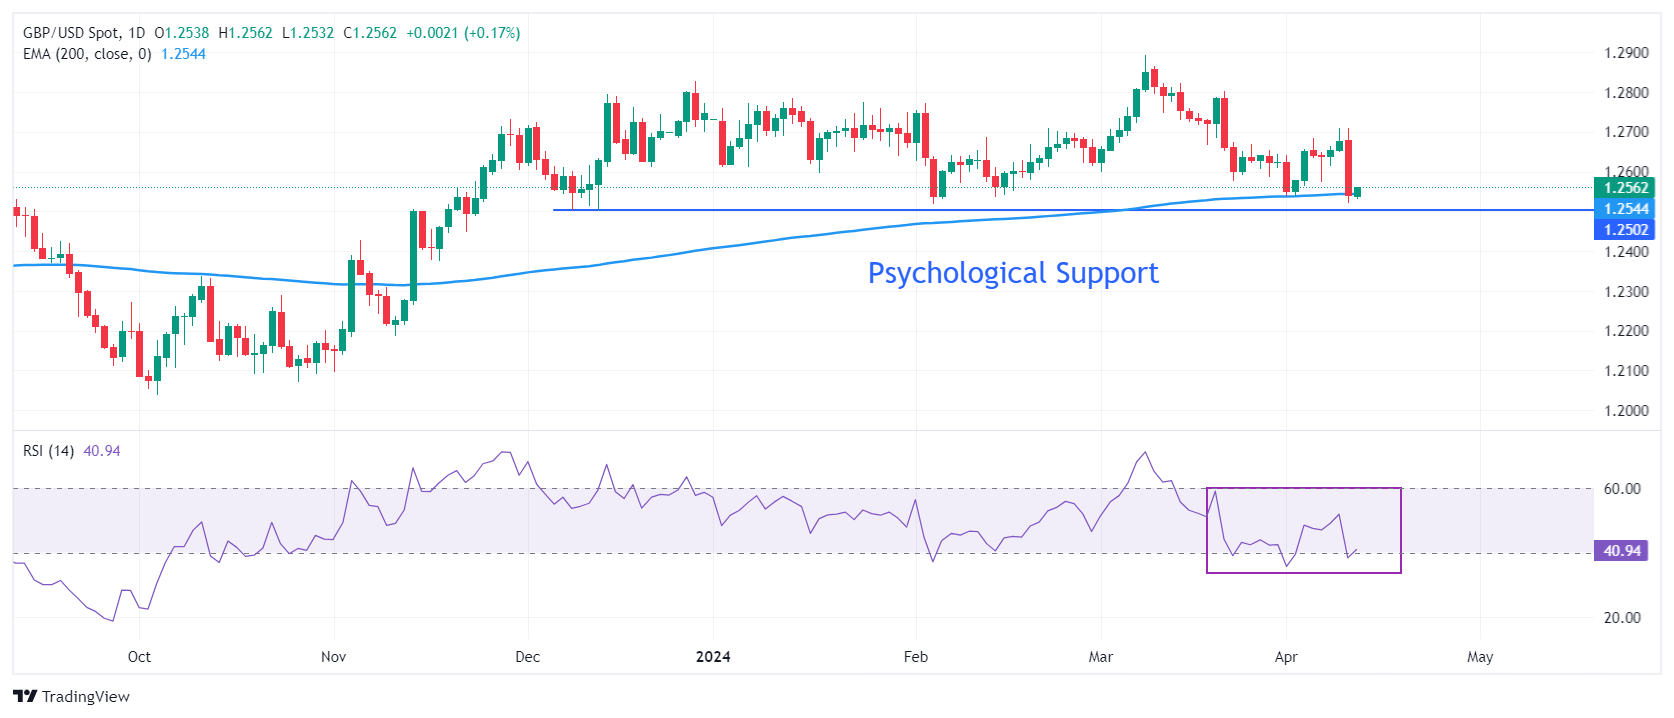
The Pound Sterling declines towards the psychological support of 1.2500 on risk-aversion mood. The GBP/USD pair dips to the 200-day Exponential Moving Average (EMA) at 1.2570, which remained a major support before the release of the hot US CPI data. The Cable could witness a sharp downside if it decisively breaks below the 1.2500 support.
The 14-period Relative Strength Index (RSI) hovers near 40.00. If it drops below this level, bearish momentum will trigger.
Pound Sterling FAQs
The Pound Sterling (GBP) is the oldest currency in the world (886 AD) and the official currency of the United Kingdom. It is the fourth most traded unit for foreign exchange (FX) in the world, accounting for 12% of all transactions, averaging $630 billion a day, according to 2022 data. Its key trading pairs are GBP/USD, aka ‘Cable’, which accounts for 11% of FX, GBP/JPY, or the ‘Dragon’ as it is known by traders (3%), and EUR/GBP (2%). The Pound Sterling is issued by the Bank of England (BoE).
The single most important factor influencing the value of the Pound Sterling is monetary policy decided by the Bank of England. The BoE bases its decisions on whether it has achieved its primary goal of “price stability” – a steady inflation rate of around 2%. Its primary tool for achieving this is the adjustment of interest rates. When inflation is too high, the BoE will try to rein it in by raising interest rates, making it more expensive for people and businesses to access credit. This is generally positive for GBP, as higher interest rates make the UK a more attractive place for global investors to park their money. When inflation falls too low it is a sign economic growth is slowing. In this scenario, the BoE will consider lowering interest rates to cheapen credit so businesses will borrow more to invest in growth-generating projects.
Data releases gauge the health of the economy and can impact the value of the Pound Sterling. Indicators such as GDP, Manufacturing and Services PMIs, and employment can all influence the direction of the GBP. A strong economy is good for Sterling. Not only does it attract more foreign investment but it may encourage the BoE to put up interest rates, which will directly strengthen GBP. Otherwise, if economic data is weak, the Pound Sterling is likely to fall.
Another significant data release for the Pound Sterling is the Trade Balance. This indicator measures the difference between what a country earns from its exports and what it spends on imports over a given period. If a country produces highly sought-after exports, its currency will benefit purely from the extra demand created from foreign buyers seeking to purchase these goods. Therefore, a positive net Trade Balance strengthens a currency and vice versa for a negative balance.
- USD/MXN trades with a positive bias for the third straight day, albeit lacks follow-through.
- The technical setup supports prospects for the emergence of fresh selling at higher levels.
- Reduced Fed rate cut bets continue to underpin the USD and should limit the downside.
The USD/MXN pair attracts some buyers for the third successive day on Thursday, albeit lacks bullish conviction and remains below the weekly top, around the 16.50-16.55 area touched the previous day.
The aforementioned area represents the 23.6% Fibonacci retracement level of the January-April downfall and should act as a key pivotal point for short-term traders. A sustained strength beyond might trigger a short-covering rally and lift the USD/MXN pair to the next relevant hurdle near the 16.65-16.70 supply zone, or the 38.2% Fibo. level. Some follow-through buying should pave the way for a move towards challenging the 16.85 confluence hurdle, comprising the 100-day Simple Moving Average (SMA) and the 50% Fibo. level.
Meanwhile, technical indicators on the daily chart – though have been recovering – are still holding in the negative territory and suggest that any meaningful upside might still be seen as a selling opportunity. This, in turn, warrants some caution for bullish traders and before confirming that the USD/MXN pair has bottomed out in the near term. In the meantime, the 16.30-16.25 area, or the lowest level since August 2015, is likely to protect the immediate downside, below which spot prices could slide to test the 16.00 round-figure mark.
The hotter US consumer inflation figures released on Wednesday forced investors to push back expectations for the first interest rate cut to September from June. Moreover, the markets are now pricing in the possibility of less than two 25 basis point rate cuts in 2024, which assists the US Dollar (USD) to stand tall near the YTD peak. This should assist the USD/MXN pair to defend the aforementioned handle, which if broken decisively should pave the way for the extension of an over a two-month-old downtrend witnessed from the YTD peak touched in January.
USD/MXN daily chart
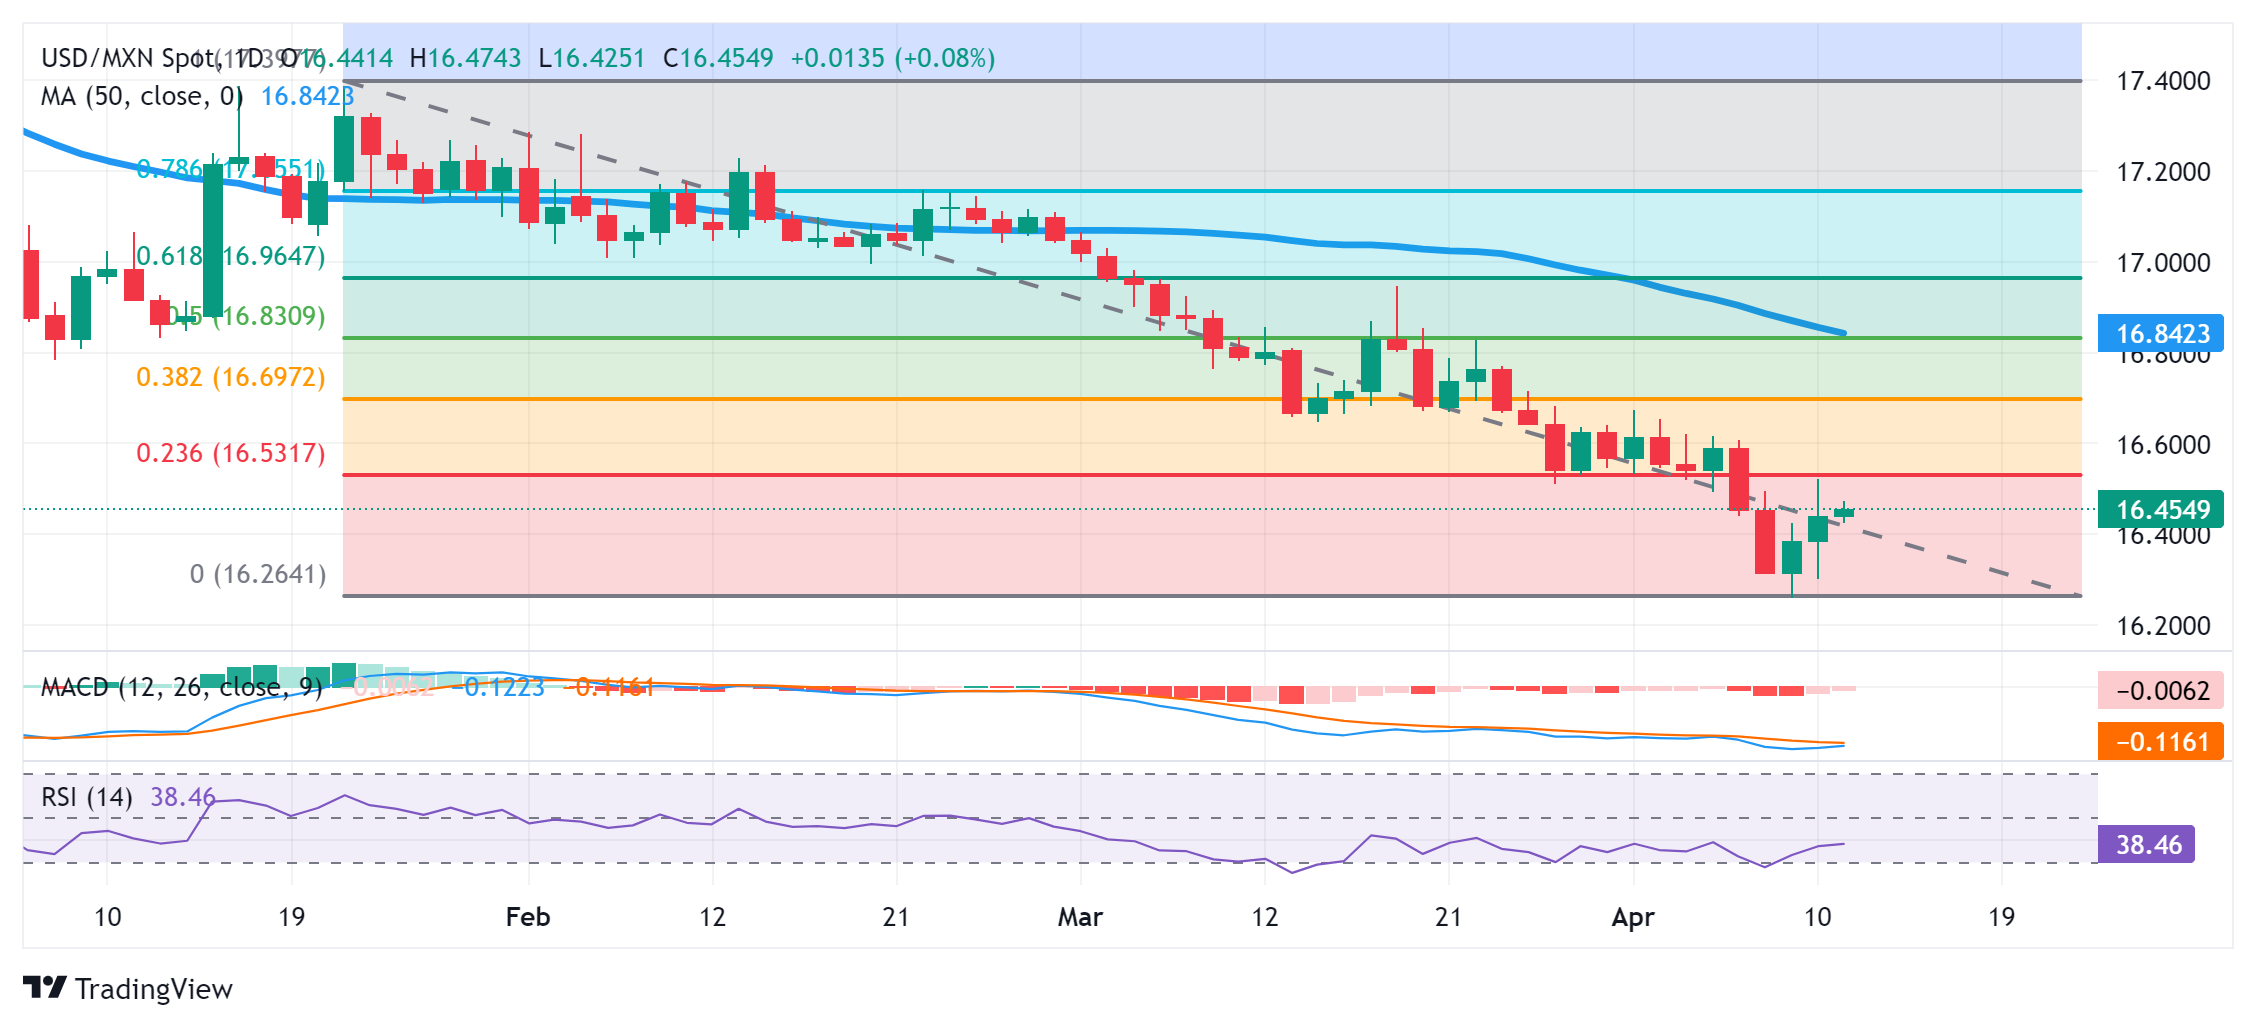
- EUR/GBP drifts lower on Thursday, albeit manages to hold above a one-week low.
- Bets for more aggressive policy easing by the BoE cap the GBP and lend support.
- Traders might also refrain from placing aggressive bets ahead of the ECB meeting.
The EUR/GBP cross struggles to capitalize on the previous day's goodish rebound from the 0.8545 area, or a one-week low and meets with a fresh supply on Thursday. Spot prices remain depressed through the early European session and currently trade around the 0.8560 region as traders keenly await the European Central Bank (ECB) meeting before placing fresh directional bets.
The ECB is widely expected to keep its main refinancing rate unchanged and hence, the focus will remain on the fresh round of staff projections, which will be scrutinized for cues about the timing of any upcoming interest rate cut. The markets have been pricing in a greater chance of the first rate cut in June amid a faster-than-anticipated fall in the Eurozone inflation. This, in turn, is seen undermining the shared currency and exerting some pressure on the EUR/GBP cross.
Hence, the outlook, along with ECB President Christine Lagarde's comments at the post-meeting press conference, will play a key role in influencing the shared currency in the near term and provide some meaningful impetus to spot prices. Heading into the key central bank event risk, rising bets for at least four interest rate cuts this year by the Bank of England (BoE), starting in June, should cap the upside for the British Pound (GBP) and limit losses for the EUR/GBP cross.
From a technical perspective, the recent failure near the 100-day Simple Moving Average (SMA) and the subsequent downfall favours bearish traders. The aforementioned fundamental backdrop, however, makes it prudent to wait for strong follow-through selling before positioning for any meaningful downside and an eventual breakdown through the 0.8500 psychological mark, or the YTD low touched in February.
- The European Central Bank will likely maintain rates on hold once again.
- ECB President Christine Lagarde could change its cautious tone and hint at an upcoming rate cut.
- US CPI was hotter than anticipated in March, triggering risk aversion.
- EUR/USD bearish case gains momentum as the pair stands below 1.0800.
The European Central Bank (ECB) will announce its monetary policy decision on Thursday. Market participants anticipate no changes to the current policy, but policymakers continue paving the way towards interest rate cuts in June. The ECB has tightened rates to fight skyrocketing inflation in the pandemic aftermath, lifting the Main Refinancing Operations Rate to 4.50% and the Deposit Facility Rate to 4% from negative levels in little over a year.
Beyond rates, the ECB is using other tools: the Asset Purchase Programme (APP) and the Pandemic Emergency Purchase Programme (PEPP). The first one is being reduced methodically and predictably as the Eurosystem ceases reinvestments from maturing securities. Regarding the PEPP, the central bank planned to reduce the portfolio by an average of €7.5 billion per month beginning in the latter half of 2024 and cease reinvestments under the PEPP by the close of 2024. No changes are expected there either in the April meeting.
European Central Bank interest rate decision: What to know in markets on Thursday
Major central banks kept rates steady in the first quarter of 2024, claiming they would need more data before reverting their current restrictive monetary policies. Overall, policymakers converge in interest rates having reached cycle peaks.
The United States (US) Federal Reserve (Fed) foresaw three rate cuts in 2024 in its December Summary of Economic Projections (SEP), and repeated it in the March document. However, recent comments from Chairman Jerome Powell cooled down expectations, as he said policymakers are in no rush to trim rates.
At this point, the ECB is likely to trim rates before the Fed, which would be quite notable and could put pressure on the EUR/USD pair.
The latest Hamburg Commercial Bank (HCOB) and S&P Global surveys delivered a positive surprise in the Eurozone as March Composite PMIs showed business activity expanded for the first time in over a year.
In the March meeting, the ECB projected headline inflation should fall from 5.4% in 2023 to 2.3% in 2024 and then to 2.0% in 2025, reaching 1.9% in 2026. At the same time, policymakers expect that real GDP should increase by 0.6% in 2024, by 1.5% in 2025 and by 1.6% in 2026.
The US published the March Consumer Price Index (CPI) on Wednesday, which was higher than anticipated, sending financial markets into a risk-averse spiral. The US Dollar soared, while stocks collapsed, as the figures gave the Fed plenty of time before trimming interest rates.
The EUR/USD pair heads into the ECB announcement gaining bearish momentum and trading well below the 1.0800 threshold.
What to expect from the ECB meeting and how could it impact EUR/USD?
The ECB is expected to keep the three main interest rates unchanged. In March, the central bank announced that “the interest rate on the main refinancing operations and the interest rates on the marginal lending facility and the deposit facility will remain unchanged at 4.50%, 4.75% and 4.00%, respectively.” The statement also reiterated that local policymakers aim to keep rates at current levels for as long as necessary and that decisions will be made based on data.
European policymakers have come a long way since their December meeting, when President Christine Lagarde's efforts were on pushing back against rate cuts expectations. In these last three months, however, multiple policymakers have sounded much more optimistic about trimming rates as soon as June. The ECB seems more convinced than the Fed about the need to revert the current monetary policy.
Furthermore, macroeconomic data has reinforced market expectations for a rate cut, with money markets currently pricing in a cut for June, betting on 90 basis points (bps) of cuts by December and a total of 150 bps by September 2025.
Eurozone inflation slowed to 2.4% in March, according to preliminary data from Eurostat, better than expected. The core inflation rate, which excludes energy, food, alcohol and tobacco prices, also cooled to 2.9% from 3.1% in February, further boosting the odds for an upcoming rate cut.
If the ECB keeps rates on hold as expected, the focus will be on President Christine Lagarde's press conference following the announcement. Lagarde has been cautious with her words, emphasizing the need to maintain rates higher for longer at the risk of price pressures resuming the advance and that policymakers are data-dependent. But if officials are actually thinking about a rate cut in June, they would need to pave the way for it in this meeting.
The Euro could appreciate as an initial reaction to the news, although rate cuts tend to weaken the currency. If the ECB trims rates before the Fed, EUR/USD should turn bearish. It may be a bit too early to consider that, but for sure, if Lagarde is more explicit on upcoming cuts, the market will react accordingly.
The EUR/USD pair plummeted with hotter-than-anticipated US inflation figures and has room to extend its slump. Valeria Bednarik, FXStreet Chief Analyst, notes: “Markets are all about central banks these days and the growing imbalances between the Fed and the ECB. The first one has not much to worry about, as inflation could be above the central bank’s goal, but is far from dramatic, while at the same time, the economy keeps growing at a healthy pace. The ECB, however, is still struggling to see economic growth, while inflation is closer to their around 2% target. There are growing chances the ECB could trim rates before the Fed, in which case, EUR/USD is just now kick-starting a bearish trend.”
Bednarik adds: “From a technical perspective, the daily chart supports additional slides, given that technical indicators retreated from their midlines and gained downward traction. Indicators head firmly south within negative levels, reflecting increased selling interest. At the same time, EUR/USD develops far below all its moving averages, with the 20 Simple Moving Average (SMA) accelerating south between the longer ones, also a sign of sellers taking over. Support comes at 1.0720 and 1.0685, while below the latter EUR/USD could test the 1.0600 mark. Near-term sellers are now aligned around 1.0800, while a firmer resistance level comes at 1.0870.”
Economic Indicator
ECB Monetary Policy Statement
At each of the European Central Bank’s (ECB) eight governing council meetings, the ECB releases a short statement explaining its monetary policy decision, in light of its goal of meeting its inflation target. The statement may influence the volatility of the Euro (EUR) and determine a short-term positive or negative trend. A hawkish view is considered bullish for EUR, whereas a dovish view is considered bearish.
Read more.Next release: Thu Apr 11, 2024 12:15
Frequency: Irregular
Consensus: -
Previous: -
Source: European Central Bank
Euro FAQs
The Euro is the currency for the 20 European Union countries that belong to the Eurozone. It is the second most heavily traded currency in the world behind the US Dollar. In 2022, it accounted for 31% of all foreign exchange transactions, with an average daily turnover of over $2.2 trillion a day. EUR/USD is the most heavily traded currency pair in the world, accounting for an estimated 30% off all transactions, followed by EUR/JPY (4%), EUR/GBP (3%) and EUR/AUD (2%).
The European Central Bank (ECB) in Frankfurt, Germany, is the reserve bank for the Eurozone. The ECB sets interest rates and manages monetary policy. The ECB’s primary mandate is to maintain price stability, which means either controlling inflation or stimulating growth. Its primary tool is the raising or lowering of interest rates. Relatively high interest rates – or the expectation of higher rates – will usually benefit the Euro and vice versa. The ECB Governing Council makes monetary policy decisions at meetings held eight times a year. Decisions are made by heads of the Eurozone national banks and six permanent members, including the President of the ECB, Christine Lagarde.
Eurozone inflation data, measured by the Harmonized Index of Consumer Prices (HICP), is an important econometric for the Euro. If inflation rises more than expected, especially if above the ECB’s 2% target, it obliges the ECB to raise interest rates to bring it back under control. Relatively high interest rates compared to its counterparts will usually benefit the Euro, as it makes the region more attractive as a place for global investors to park their money.
Data releases gauge the health of the economy and can impact on the Euro. Indicators such as GDP, Manufacturing and Services PMIs, employment, and consumer sentiment surveys can all influence the direction of the single currency. A strong economy is good for the Euro. Not only does it attract more foreign investment but it may encourage the ECB to put up interest rates, which will directly strengthen the Euro. Otherwise, if economic data is weak, the Euro is likely to fall. Economic data for the four largest economies in the euro area (Germany, France, Italy and Spain) are especially significant, as they account for 75% of the Eurozone’s economy.
Another significant data release for the Euro is the Trade Balance. This indicator measures the difference between what a country earns from its exports and what it spends on imports over a given period. If a country produces highly sought after exports then its currency will gain in value purely from the extra demand created from foreign buyers seeking to purchase these goods. Therefore, a positive net Trade Balance strengthens a currency and vice versa for a negative balance.
- Siver price loses momentum near $27.85 on the stronger USD on Thursday.
- Precious metals traders do not seem too concerned about U.S. inflation reports that came in higher than expected.
- Rising industrial demand and escalating geopolitical tensions in the Middle East boost the silver price.
Siver price (XAG/USD) trades with mild losses around $27.85 after retracing from the fresh three-year high of $28.53 during the early European session on Thursday. The lower speculation that the Federal Reserve (Fed) will cut the interest rate in June drags the gray metal lower. Investors await the US March Producer Price Index (PPI) on Thursday for fresh impetus.
Traders slashed bets on Fed interest rate cuts on Wednesday after US inflation was hotter than expectations and US President Joe Biden acknowledged that there was more work to be done to combat rising prices. The US Consumer Price Index (CPI) report in March suggested that the path of easing inflation remains extremely bumpy and the US central bank is likely to maintain the higher-for-longer rate narrative. This might limit the upside of silver as the gray metal becomes less attractive compared to interest-bearing assets. Fed Funds Futures market pushed expectations for the first rate cut from June to September, according to the CME FedWatch Tool.
On the other hand, rising industrial demand and its attraction to an alternative inflation hedge might cap the downside of silver prices. Additionally, the ongoing geopolitical tensions in the Middle East and its attraction to an alternative inflation hedge might lift silver prices in the near term as Israel and Hamas rejected ceasefire talks and Iran vowed retaliation for an airstrike on its embassy in Syria.
Here is what you need to know on Thursday, April 11:
The US Dollar (USD) registered impressive gains against its rivals following the strong inflation data on Wednesday. The European Central Bank (ECB) will announce monetary policy decisions after the conclusion of the April meeting on Thursday and the US economic docket will feature the weekly Initial Jobless Claims data alongside the Producer Price Index (PPI) figures for March.
The Consumer Price Index (CPI) in the US rose 3.5% on a yearly basis in March, the US Bureau of Labor Statistics reported on Wednesday. This reading followed the 3.2% increase recorded in February and came in above the market expectation of 3.4%. On a monthly basis, the CPI and the core CPI both rose 0.4%.
The USD Index surged higher and reached its strongest level since November above 105.00, rising over 1% on the day. Later in the day, the minutes of the Federal Reserve's March meeting showed that policymakers expressed general uncertainty about the persistence of elevated inflation and indicated that recent data did not increase their confidence in inflation trending sustainably towards the 2% target. Meanwhile, the benchmark 10-year US Treasury bond yield advanced beyond 4.5% and major equity indexes in the US lost around 1%.
US Dollar price this week
The table below shows the percentage change of US Dollar (USD) against listed major currencies this week. US Dollar was the strongest against the Swiss Franc.
| USD | EUR | GBP | CAD | AUD | JPY | NZD | CHF | |
| USD | 0.88% | 0.67% | 0.60% | 0.74% | 0.92% | 0.34% | 1.17% | |
| EUR | -0.88% | -0.19% | -0.28% | -0.13% | 0.06% | -0.53% | 0.33% | |
| GBP | -0.69% | 0.20% | -0.08% | 0.07% | 0.24% | -0.33% | 0.50% | |
| CAD | -0.60% | 0.28% | 0.08% | 0.15% | 0.32% | -0.25% | 0.57% | |
| AUD | -0.75% | 0.13% | -0.06% | -0.15% | 0.18% | -0.41% | 0.43% | |
| JPY | -0.92% | -0.05% | -0.23% | -0.33% | -0.17% | -0.56% | 0.27% | |
| NZD | -0.34% | 0.52% | 0.34% | 0.25% | 0.40% | 0.57% | 0.81% | |
| CHF | -1.20% | -0.33% | -0.50% | -0.59% | -0.45% | -0.28% | -0.86% |
The heat map shows percentage changes of major currencies against each other. The base currency is picked from the left column, while the quote currency is picked from the top row. For example, if you pick the Euro from the left column and move along the horizontal line to the Japanese Yen, the percentage change displayed in the box will represent EUR (base)/JPY (quote).
The ECB is widely anticipated to leave key rates unchanged. Following the policy announcements, ECB President Christine Lagarde will speak on the policy outlook and respond to questions from the press. EUR/USD lost more than 1% on Wednesday and was last seen trading slightly below 1.0750.
The Bank of Canada (BoC) maintained the policy rate at 5% as expected on Wednesday. In the post-meeting press conference, BoC Governor Tiff Macklem said that a June rate cut was "within the realm of possibilities." USD/CAD gathered bullish momentum and advanced to its highest level since November above 1.3700. The pair stays in a consolidation phase slightly below this level in the European morning on Thursday.
USD/JPY broke out of its three-week-old range and rose to a fresh multi-decade high above 153.00. The pair fluctuates in a tight channel above this level in the early European session.
GBP/USD extended its slide after dropping below 1.2600 and lost over 1% on Wednesday. The pair holds steady slightly below 1.2550 to start the European session.
Gold staged a deep correction on Wednesday and declined below $2,320. XAU/USD edged slightly higher during the Asian trading hours and was last seen trading in positive territory near $2,340.
ECB FAQs
The European Central Bank (ECB) in Frankfurt, Germany, is the reserve bank for the Eurozone. The ECB sets interest rates and manages monetary policy for the region. The ECB primary mandate is to maintain price stability, which means keeping inflation at around 2%. Its primary tool for achieving this is by raising or lowering interest rates. Relatively high interest rates will usually result in a stronger Euro and vice versa. The ECB Governing Council makes monetary policy decisions at meetings held eight times a year. Decisions are made by heads of the Eurozone national banks and six permanent members, including the President of the ECB, Christine Lagarde.
In extreme situations, the European Central Bank can enact a policy tool called Quantitative Easing. QE is the process by which the ECB prints Euros and uses them to buy assets – usually government or corporate bonds – from banks and other financial institutions. QE usually results in a weaker Euro. QE is a last resort when simply lowering interest rates is unlikely to achieve the objective of price stability. The ECB used it during the Great Financial Crisis in 2009-11, in 2015 when inflation remained stubbornly low, as well as during the covid pandemic.
Quantitative tightening (QT) is the reverse of QE. It is undertaken after QE when an economic recovery is underway and inflation starts rising. Whilst in QE the European Central Bank (ECB) purchases government and corporate bonds from financial institutions to provide them with liquidity, in QT the ECB stops buying more bonds, and stops reinvesting the principal maturing on the bonds it already holds. It is usually positive (or bullish) for the Euro.
- AUD/USD finds intermediate support neat 0.6500, more downside remains likely.
- The US Dollar strengthens as market push back Fed rate cut expectations for June.
- Australia’s consumer inflation expectations for next 12 months rose to 4.6%.
The AUD/USD pair finds an interim support near the psychological level of 0.6500 in Thursday’s early European session. The Aussie asset is expected to continue the downside move as faded market expectations for the Federal Reserve (Fed) beginning to reduce interest rates in the first half of this year has dampened appetite for risk-sensitive currencies.
S&P 500 futures have posted nominal gains in the Asian session. While the overall market sentiment is downbeat as investors shift focus to the September policy meeting when the Fed could pivot to rate cuts. Prospects for Fed early rate cuts have waned as the United States inflation for March turned out sticky. The US Dollar Index (DXY) jumps to 105.20, approaching five-month high at 106.00.
The US Bureau of Labor Statistics (BLS) reported on Monday that annual and monthly core Consumer Price Index (CPI), which strips of volatile food and energy prices, rose steadily by 3.8% and 0.4%, respectively, suggested that rate cuts are not appropriate currently.
Meanwhile, expectations for the Reserve Bank of Australia (RBA) reducing interest rates sooner have eased due to a significant increase in consumer inflation expectations. The Melbourne Institute reported that inflation expectations for next 12 months accelerated to 4.6% from prior reading of 4.3%.
AUD/USD witnesses an intense sell-off after failing to sustain the breakout of the Descending Triangle chart pattern formed on a daily timeframe. The Aussie asset is declining towards the horizontal support of the aforementioned pattern plotted from March 5 low at 0.6477.
The Aussie asset falls below the 20-day Exponential Moving Average (EMA) trading near 0.6550, suggesting weak demand for the Australian Dollar.
The 14-period Relative Strength Index (RSI) falls sharply after failing to climb above 60.00, indicating limited upside.
Investors might build fresh shorts if the asset drops below March 28 low at 0.6485. Profits on shorts would be booked near February 13 low around 0.6440 and the round-level support of 0.6400.
In an alternate scenario, fresh upside would appear if the asset breaks above March 21 high at 0.6635. This will drive the asset toward March 8 high at 0.6667, followed by the round-level resistance of 0.6700.
AUD/USD daily chart
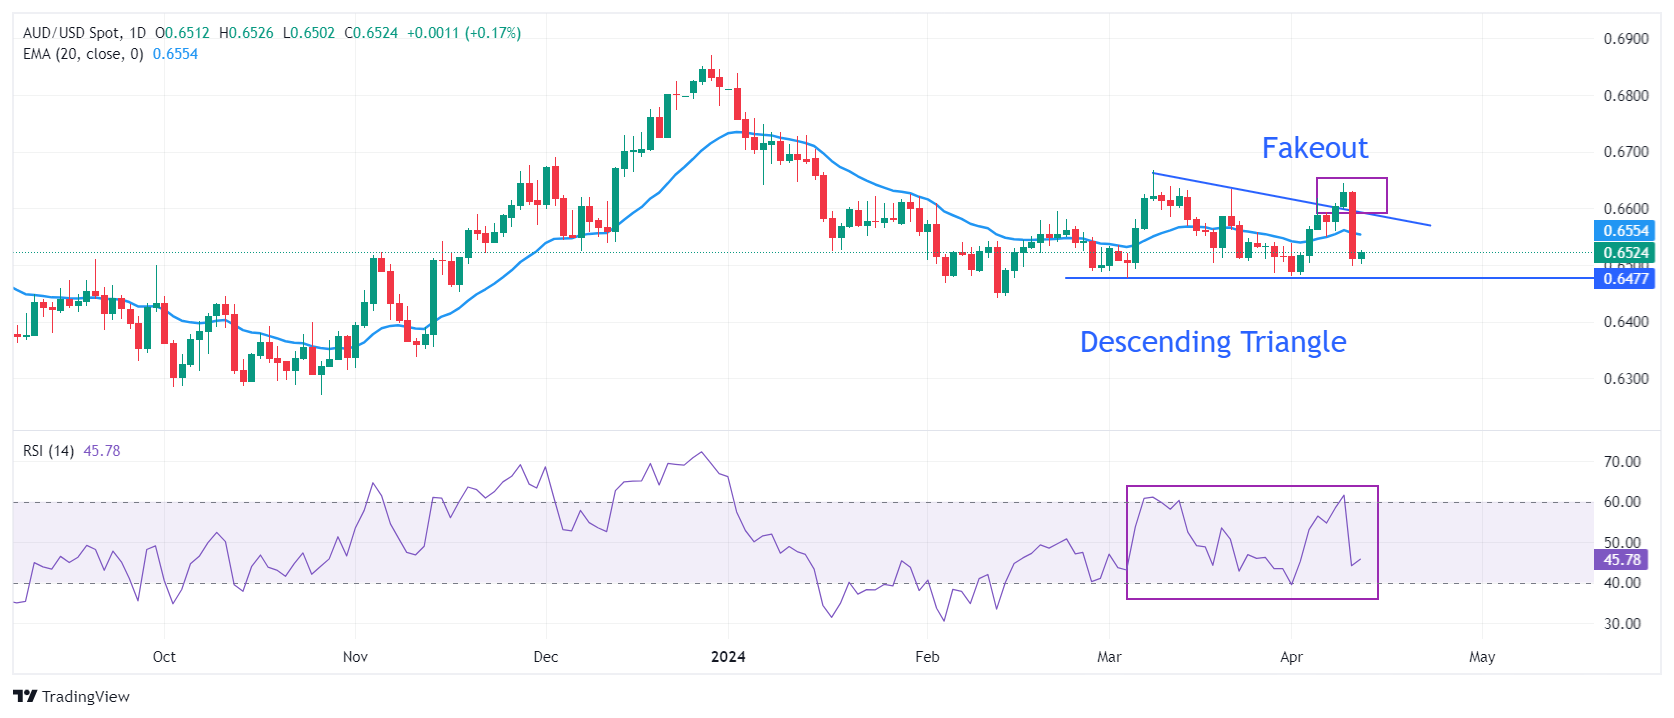
- USD/CHF gains momentum near 0.9125 on Thursday.
- The headline US CPI rose 0.4% MoM in March, while the yearly CPI figure advanced 3.5% YoY, hotter than expected.
- The uncertainty and ongoing geopolitical tensions in the Middle East might lift the CHF and cap the pair’s upside.
The USD/CHF pair trades on a positive note near 0.9125, the highest level since October 2023 on Thursday during the early European session. The hotter-than-expected US inflation in March has prompted investors to scale back bets on US interest rate cuts this year, which provides some support to the Greenback. However, the ongoing geopolitical tensions in the Middle East might boost safe-haven assets like the Swiss Franc (CHF).
An unexpected rise in US Consumer Price Index (CPI) data in March pushed out the expected timing of a first-rate cut to September from June. The headline CPI rose 0.4% MoM in March, while the yearly CPI figure advanced 3.5% YoY. Meanwhile, the Core CPI, excluding volatile food and energy components, climbed 0.4% MoM, while jumping 3.8% from a year ago.
Furthermore, Minutes of the last Fed meeting suggested that participants were worried about elevated inflation and the recent data did not help the Fed gain confidence that inflation moved sustainably towards the 2% target. The higher-for-longer US rate narrative lifts the USD and creates a tailwind for the USD/CHF pair.
On the other hand, the uncertainty surrounding ceasefire talks between Israel and Hamas and the ongoing geopolitical tensions in the Middle East might boost safe-haven flows, benefiting the Swiss Franc (CHF). Israeli foreign minister Israel Kat warned on Wednesday that Israel will retaliate if Iran attacks from its territory. Earlier, Iran's supreme leader said Israel "must be punished" for an apparent attack on an Iranian consulate building in Syria last week.
- EUR/USD attracts some sellers near 1.0745 on the firmer USD on Thursday.
- The pair resumes its bearish stance below the key EMA, with an oversold RSI condition.
- The key support level is seen at the 1.0725–1.0730 zone; the first upside target is located at 1.0800.
The EUR/USD pair loses traction around 1.0745 on Thursday during the early European session. The hotter-than-expected US inflation data boosted the Greenback to yearly highs and exerted some selling pressure on the EUR/USD pair. The European Central Bank (ECB) interest rate decision will be the highlight later on Thursday, which is expected to leave interest rates steady at a record high.
From a technical perspective, EUR/USD resumes its bearish outlook as the major pair is below the key 100-period Exponential Moving Average (EMA) on the four-hour chart. The downward momentum is confirmed by the Relative Strength Index (RSI), which holds in bearish territory below 50. Nonetheless, the oversold RSI condition indicates that further consolidation cannot be ruled out before positioning for any near-term EUR/USD depreciation.
The confluence of the lower limit of the Bollinger Band and a low of October 10 at the 1.0725–1.0730 region acts as a crucial support level for EUR/USD, Any follow-through selling will see a drop to the 1.0700 psychological level. The additional downside filter to watch is a low of November 9, 2023 at 1.0660, followed by a low of November 3, 2023 at 1.0615.
On the upside, the first upside barrier will emerge near a low of March 22 and the round figure at 1.0800. Further north, the next target is seen around the 100-period EMA at 1.0825. A break above the latter will pave the way to a high of April 9 at 1.0885, en route to the upper boundary of the Bollinger Band at 1.0920.
EUR/USD four-hour chart
-638484079121384481.png)
Bank of England's Monetary Policy Committee (MPC) member Megan Greene said in the Financial Times (FT) interview on Thursday that “UK services inflation remains much higher than in the US.”
Key takeaways
Markets now expect the Bank of England will cut rates earlier and by more than the Federal Reserve this year.
Higher inflation expectations have translated to higher pay growth, by metrics
- WTI struggles to attract any follow-through buying amid mixed fundamental cues.
- Concerns about the worsening Middle East act as a tailwind for the black liquid.
- Signs of cooling fuel demand might hold back bulls from placing aggressive bets.
West Texas Intermediate (WTI) US crude Oil prices struggle to capitalize on the previous day's goodish bounce from the $84.00 mark, or over a one-week low and oscillate in a narrow band during the Asian session on Thursday. The commodity currently trades around the $85.75-$85.80 region and remains well supported by concerns about the worsening Middle East crisis.
Ceasefire talks between Israel and Hamas have yielded no agreement. Adding to this, a possible Iranian retaliation over a suspected Israeli strike on its embassy in Syria raises the risk that the Israel-Hamas war could escalate across the Middle East, putting the Oil supply at risk and acting as a tailwind for the black liquid, though a substantial rise in US Crude inventories cap the upside.
Official data published by the Energy Information Administration showed an estimated US Oil inventory build of 5.8 million barrels for the week to April 5, much more market expectations and a build of 3.2 million barrels for the previous week. Adding to this, an unexpected build in gasoline inventories pointed to signs of cooling in fuel demand, which, in turn, keeps a lid on Crude Oil prices.
Furthermore, the hotter US consumer inflation figures released on Wednesday forced investors to push back their expectations for the first interest rate cut by the Federal Reserve (Fed) to September from June. This, in turn, is expected to hamper economic activity and further dent fuel consumption, warranting some caution before positioning for any further appreciating move for Crude Oil prices.
Moving ahead, traders now look to the US economic docket – featuring the release of the usual Weekly Initial Jobless Claims and the Producer Price Index (PPI). This, along with speeches by influential FOMC members, should drive the USD demand and provide some impetus to the US Dollar-denominated commodities, including Crude Oil prices.
- USD/CAD hovers around 1.3650 in Thursday’s Asian session.
- The BoC held rates at 5% for the sixth consecutive meeting on Wednesday.
- US inflation in March was hotter than expected, and the Fed might delay rate cuts this year.
The USD/CAD pair consolidates its gains above 1.3650 during the Asian trading hours on Thursday. The uptick of the pair is backed by US inflation that came in stronger than expected in March, which boosted the Greenback to a yearly high of 105.30. Investors will take more cues from the US Producer Price Index (PPI), due later on Thursday. The headline and Core PPI figures are estimated to show an increase of 2.2% YoY and 2.3% YoY, respectively.
On Thursday, the Bank of Canada (BoC) held its key interest rate at 5% for the sixth consecutive time since July at its April meeting. The BoC governor Tiff Macklem said during the press conference following the announcement that the recent progress in inflation is encouraging, but he needs to see more evidence to make sure that inflation is sustained before moving on rate cuts. Macklem further stated that an interest rate cut in June is possible.
On the other hand, high inflation in the US grew stronger than expected in March, convincing the Federal Reserve (Fed) to keep its benchmark rates higher for longer. The Labor Department’s Bureau of Labor Statistics reported on Wednesday that the US Consumer Price Index (CPI) gained 0.4% MoM in March, while the yearly CPI figure showed an increase of 3.5% YoY. Furthermore, the Core CPI, excluding volatile food and energy components, rose 0.4% MoM while climbing 3.8% from a year ago.
Following the CPI data, the markets’ chance of a June rate cut dropped to 21%, down from 53% on Tuesday, according to the CME FedWatch tool. The US inflation report in March indicated that the path of easing inflation remains extremely bumpy, and any loosening of monetary policy is likely to be delayed. This, in turn, propels the US Dollar Index (DXY) to yearly highs and provides some support to the USD/CAD pair.
- Gold price attracts fresh buyers on Thursday following the previous day’s US CPI-inspired downfall.
- Geopolitical risks benefit the safe-haven XAU/USD amid a modest USD pullback from the YTD peak.
- Reduced bets for an early interest rate cut by the Fed might cap gains amid overbought conditions.
Gold price (XAU/USD) witnessed some selling on Wednesday and retreated from the all-time peak touched the previous day in reaction to hotter US consumer inflation figures, which tempered hopes for an imminent rate cut by the Federal Reserve (Fed). The precious metal, however, stalls the intraday slide near the $2,319 region and regains some positive traction during the Asian session on Thursday amid a generally weaker tone around the equity markets.
Expectations that the Fed will keep interest rates higher for longer, along with concerns over the worsening Middle East crisis, weigh on investors' sentiment and benefit the safe-haven Gold price. Meanwhile, a modest pullback in the US Treasury bond yields prompts some US Dollar (USD) profit-taking and turns out to be another factor lending support to the non-yielding yellow metal. Traders now look to the US PPI print and Fedspeak for short-term opportunities.
Daily Digest Market Movers: Gold price attracts haven flows amid persistent geopolitical risks, despite hawkish Fed expectations
- The US Dollar strengthened across the board amid a surge in the US Treasury bond yields in response to a robust inflation report and exerted downward pressure on the Gold price on Wednesday.
- The US Bureau of Labor Statistics (BLS) reported the headline Consumer Price Index (CPI) climbed 3.5% on a year-on-year basis and 0.4% compared with the previous month, surpassing expectations.
- Excluding volatile food and energy components, the core CPI accelerated to the 3.8% YoY rate, also beating estimates and stoking worries that the Federal Reserve may keep rates higher for longer.
- The minutes from the March FOMC meeting revealed that policymakers wouldn’t be cutting rates until they gained greater confidence that inflation was on a steady path back to the 2% annual target.
- The markets were quick to react and pushed back the expected timing of a first interest rate cut by the Fed to September from June and the number of 25 basis points cuts this year to under two.
- The yield on the rate-sensitive two-year US government bond and the benchmark 10-year Treasury note spiked to their highest level since November last year, pushing the USD to a fresh YTD peak.
- Ceasefire talks between Israel and Hamas have yielded no agreement, which, along with a possible Iranian retaliation over a suspected Israeli strike on its embassy in Syria, weigh on investors' sentiment.
Technical Analysis: Gold price might face resistance near the all-time peak, around $2,365 area amid overbought RSI on the daily chart
From a technical perspective, the Relative Strength Index (RSI) on the daily chart is flashing extremely overbought conditions and warrants some caution before placing fresh bullish bets around the Gold price. Hence, any subsequent move-up is likely to face stiff resistance around the $2,365-2,366 area, or the record high touched earlier this week. Some follow-through buying, however, should pave the way for a further near-term appreciation towards the $2,400 round figure mark.
On the flip side, the overnight swing low, around the $2,319 area, now seems to protect the immediate downside ahead of the weekly trough, around the $2,302 region. A convincing break below the latter might prompt some technical selling and drag the Gold price further towards the $2,267-2,265 horizontal support, which should now act as a key pivotal point for short-term traders.
Gold FAQs
Gold has played a key role in human’s history as it has been widely used as a store of value and medium of exchange. Currently, apart from its shine and usage for jewelry, the precious metal is widely seen as a safe-haven asset, meaning that it is considered a good investment during turbulent times. Gold is also widely seen as a hedge against inflation and against depreciating currencies as it doesn’t rely on any specific issuer or government.
Central banks are the biggest Gold holders. In their aim to support their currencies in turbulent times, central banks tend to diversify their reserves and buy Gold to improve the perceived strength of the economy and the currency. High Gold reserves can be a source of trust for a country’s solvency. Central banks added 1,136 tonnes of Gold worth around $70 billion to their reserves in 2022, according to data from the World Gold Council. This is the highest yearly purchase since records began. Central banks from emerging economies such as China, India and Turkey are quickly increasing their Gold reserves.
Gold has an inverse correlation with the US Dollar and US Treasuries, which are both major reserve and safe-haven assets. When the Dollar depreciates, Gold tends to rise, enabling investors and central banks to diversify their assets in turbulent times. Gold is also inversely correlated with risk assets. A rally in the stock market tends to weaken Gold price, while sell-offs in riskier markets tend to favor the precious metal.
The price can move due to a wide range of factors. Geopolitical instability or fears of a deep recession can quickly make Gold price escalate due to its safe-haven status. As a yield-less asset, Gold tends to rise with lower interest rates, while higher cost of money usually weighs down on the yellow metal. Still, most moves depend on how the US Dollar (USD) behaves as the asset is priced in dollars (XAU/USD). A strong Dollar tends to keep the price of Gold controlled, whereas a weaker Dollar is likely to push Gold prices up.
Japan’s Chief Cabinet Secretary Yishimasa Hayashi said on Thursday, he “won't rule out any steps to respond to excessive FX moves.”
Additional quotes
Won't comment on forex levels, currency intervention.
Important for currencies to move in stable manner reflecting fundamentals.
Excessive FX volatility undesirable.
Closely watching FX moves with a high sense of urgency.
Related reads
| Raw materials | Closed | Change, % |
|---|---|---|
| Silver | 27.877 | -0.95 |
| Gold | 2331.82 | -0.89 |
| Palladium | 1046.46 | -4.16 |
- The Japanese Yen attracts some buyers and recovers a part of the post-US CPI slump on Wednesday.
- Intervention fears, along with a weaker risk tone, underpin the JPY and exert pressure on USD/JPY.
- The divergent Fed-BoJ policy expectations should limit any meaningful corrective slide for the pair.
The Japanese Yen (JPY) slumped to the weakest level since July 1990 against its American counterpart on Wednesday following the release of hotter-than-expected US consumer inflation figures. The data pushed market expectations about the timing of the first interest rate cut by the Federal Reserve to September from June. Adding to this, minutes of the last FOMCmeeting indicated that officials were worried that the progress on inflation slowed, and they may have to keep rates higher for longer. This marks a big contrast to the Bank of Japan's (BoJ) cautious approach towards further policy tightening, which suggests that the US-Japan rate differential will stay wide and, in turn, weigh heavily on the JPY.
Meanwhile, expectations that the Fed will keep interest rates higher for longer triggered the overnight steep fall in the US equity markets. This, along with a flurry of verbal warnings from Japanese officials that they would intervene in the markets to prop up the domestic currency, assists the safe-haven JPY to attract some buyers during the Asian session on Thursday. Any meaningful JPY-appreciating move, however, still seems elusive, warranting caution before confirming a near-term top for the USD/JPY pair. Traders now look to the US Weekly Initial Jobless Claims data, which, along with the US Producer Price Index (PPI) and Fedspeak, will drive the USD demand and produce short-term opportunities around the currency pair.
Daily Digest Market Movers: Japanese Yen bears turn cautious amid intervention warning from Japanese authorities
- The US Dollar surged across the board in reaction to the third straight month of strong US consumer price readings, dragging the Japanese Yen to its lowest level since mid-1990 on Wednesday.
- The US Bureau of Labor Statistics (BLS) reported that the headline Consumer Price Index (CPI) rose by the 3.5% YoY rate in March compared to the 3.4% anticipated and 3.2% in the previous month.
- Meanwhile, the annual core CPI, which excludes volatile food and energy prices, held steady at 3.8%, while on a monthly basis, the CPI and the core CPI both rose 0.4% as against the 0.3% estimated.
- This follows last week's upbeat US jobs data for March and fueled speculations that the Federal Reserve would delay cutting rates, triggering a surge in the US Treasury yields and the US Dollar.
- The FOMC meeting minutes showed concerns over stalling inflation progress, pushing the yield on the two-year and the 10-year US government bonds to their highest level since last November.
- Japanese government officials continued with their jawboning to defend the domestic currency, which, in turn, provides some respite to the Japanese Yen and exerts pressure on the USD/JPY pair.
- Japan's top currency diplomat, Masato Kanda, reiterated that he won't rule out any steps to respond to disorderly FX moves and that he is prepared to take necessary actions whenever possible.
- Finance Minister Shunichi Suzuki also offered some verbal intervention, saying that excessive FX moves are undesirable and that he is in constant discussion with Vice Finance Minister Kanda on FX.
- The Bank of Japan struck a dovish tone at the end of the March meeting and stopped short of offering any guidance about future steps, which should keep a lid on any further gains for the JPY.
- Thursday's US economic docket features the release of the usual Weekly Initial Jobless Claims and the Producer Price Index (PPI) for March, followed by speeches by influential FOMC members.
Technical Analysis: USD/JPY could attract dip-buying near short-term trading range resistance breakpoint, around 152.00
From a technical perspective, the downtick could be attributed to some profit-taking amid overbought conditions on hourly charts. Any subsequent slide, however, is likely to stall near the 23.6% Fibonacci retracement level of the recent rally from the 150.80 area, or the monthly low touched last Friday. Some follow-through selling below the said support, around the 152.65 region, could drag the USD/JPY pair to the 152.30 zone, or the 38.2% Fibo. level, en route to the 152.00 mark. The latter represents a short-term trading range breakout point and should act as a strong near-term base for spot prices.
On the flip side, the 153.00 round figure might now offer some resistance ahead of the multi-decade peak, around the 153.25 region. A sustained strength beyond will be seen as a fresh trigger for bullish traders and set the stage for an extension of the USD/JPY pair's recent uptrend witnessed over the past month or so.
Japanese Yen FAQs
The Japanese Yen (JPY) is one of the world’s most traded currencies. Its value is broadly determined by the performance of the Japanese economy, but more specifically by the Bank of Japan’s policy, the differential between Japanese and US bond yields, or risk sentiment among traders, among other factors.
One of the Bank of Japan’s mandates is currency control, so its moves are key for the Yen. The BoJ has directly intervened in currency markets sometimes, generally to lower the value of the Yen, although it refrains from doing it often due to political concerns of its main trading partners. The current BoJ ultra-loose monetary policy, based on massive stimulus to the economy, has caused the Yen to depreciate against its main currency peers. This process has exacerbated more recently due to an increasing policy divergence between the Bank of Japan and other main central banks, which have opted to increase interest rates sharply to fight decades-high levels of inflation.
The BoJ’s stance of sticking to ultra-loose monetary policy has led to a widening policy divergence with other central banks, particularly with the US Federal Reserve. This supports a widening of the differential between the 10-year US and Japanese bonds, which favors the US Dollar against the Japanese Yen.
The Japanese Yen is often seen as a safe-haven investment. This means that in times of market stress, investors are more likely to put their money in the Japanese currency due to its supposed reliability and stability. Turbulent times are likely to strengthen the Yen’s value against other currencies seen as more risky to invest in.
- NZD/USD holds positive ground near 0.5982 after the Chinese economic data on Thursday.
- Chinese CPI rose 0.1% YoY in March, compared to a 0.7% rise in February and the consensus of 0.4% increase.
- The strong US economy and elevated inflation triggered the Federal Reserve (Fed) to delay cutting interest rates this year.
The NZD/USD pair gains ground around 0.5982 on Thursday during the Asian trading hours. The Chinese Consumer Price Index (CPI) was softer than estimated in March, while the Producer Price Index (PPI) was in line with expectations. The attention will shift to the US PPI for March, due later on Thursday.
The latest key Chinese data from the National Bureau of Statistics of China indicated easing inflation in the world’s second-largest economy. China’s Consumer Price Index (CPI) rose 0.1% YoY in March, compared to a 0.7% rise in February and the consensus of a 0.4% increase. On a monthly basis, Chinese CPI inflation arrived at -1.0% MoM in March versus 1.0% prior, below the 0.5% decline estimated.
Finally, China’s Producer Price Index (PPI) fell 2.8% YoY in March, compared with a 2.7% decline in the previous reading, beating market expectations in the reported period. Concerns over slowing economic growth in China have grown in recent months and the softer inflation data raises concerns about uncertain economic prospects, which might cap the upside of the China-proxy New Zealand Dollar (NZD) against the USD.
On the other hand, the robust US economy and elevated inflation could convince the Federal Reserve (Fed) to cut interest rates this year. This, in turn, provides some support to the Greenback. According to the CME's FedWatch tool, financial markets now see a 66% likelihood of an interest rate cut at the September meeting.
- AUD/USD is seen consolidating Wednesday’s post-US CPI slump to over a one-week low.
- Bets that the Fed will delay cutting rates underpin the USD and cap the upside for the pair.
- Softer Chinese inflation figures do little to influence the Aussie or provide any impetus.
The AUD/USD pair oscillates in a narrow trading range during the Asian session on Thursday and consolidates the previous day's hotter US CPI-inspired slump to over a one-week low. Spot prices hold steady above the 0.6500 psychological mark and move little following the release of inflation figures from China.
The National Bureau of Statistics reported that China’s consumer inflation declined more than estimated, by 1% in March as compared to the previous month's rise of 1%. On a yearly basis, the headline CPI decelerated to 0.1% from 0.7% in the previous month, missing expectations for a 0.4% increase. Furthermore, the Producer Price Index, which measures wholesale prices at the factory gate, dropped by 2.8% from a year ago, marking the 18th consecutive month of decline and indicating persistent deflationary pressures. This, to a larger extent, overshadows a jump in Australian consumer inflation expectations to 4.6% for April from 4.3% previous and does little to provide any meaningful impetus to the Aussie.
The US Dollar (USD), on the other hand, ticks lower amid some profit-taking after the previous day's sharp spike to the highest level since November 14 and lends some support to the AUD/USD pair. Any meaningful USD corrective decline, however, still seems elusive in the wake of expectations that the Federal Reserve (Fed) will delay cutting interest rates amid sticky inflation. This, along with a generally weaker tone around the equity markets, should act as a tailwind for the safe-haven buck and cap the risk-sensitive Australian Dollar (AUD), warranting caution for aggressive bullish traders.
China’s Consumer Price Index (CPI) rose 0.1% YoY in March after reporting a 0.7% growth in February. The market forecast was for a 0.4% increase.
Chinese CPI inflation came in at -1.0% over the month in March versus February’s 1.0% rise, much worse than the 0.5% decline expected.
China’s Producer Price Index (PPI) fell 2.8% YoY in March, compared with a 2.7% drop seen previously. The data matched expectations for a 2.8% decrease in the reported period.
Market reaction to Chinese inflation data
AUD/USD is unperturbed by the mostly downbeat Chinese inflation data, adding 0.05% on the day to trade near 0.6510 following the data release.
Australian Dollar price today
The table below shows the percentage change of Australian Dollar (AUD) against listed major currencies today. Australian Dollar was the strongest against the US Dollar.
| USD | EUR | GBP | CAD | AUD | JPY | NZD | CHF | |
| USD | -0.02% | -0.03% | -0.01% | -0.06% | -0.05% | -0.07% | -0.01% | |
| EUR | 0.02% | -0.03% | 0.01% | -0.06% | -0.04% | -0.06% | 0.04% | |
| GBP | 0.04% | 0.01% | 0.03% | -0.03% | -0.03% | -0.03% | 0.02% | |
| CAD | 0.01% | -0.01% | -0.02% | -0.05% | -0.04% | -0.07% | 0.01% | |
| AUD | 0.07% | 0.04% | 0.04% | 0.07% | 0.02% | 0.01% | 0.07% | |
| JPY | 0.06% | 0.05% | 0.02% | 0.04% | -0.03% | 0.00% | 0.06% | |
| NZD | 0.07% | 0.06% | 0.05% | 0.07% | 0.00% | 0.01% | 0.08% | |
| CHF | 0.01% | -0.02% | -0.03% | -0.01% | -0.06% | -0.06% | -0.07% |
The heat map shows percentage changes of major currencies against each other. The base currency is picked from the left column, while the quote currency is picked from the top row. For example, if you pick the Euro from the left column and move along the horizontal line to the Japanese Yen, the percentage change displayed in the box will represent EUR (base)/JPY (quote).
- GBP/USD trades on a softer note around 1.2540 in Thursday’s early Asian session.
- A resilient US economy and elevated inflation are likely to derail Fed's plans to cut interest rates this year.
- Any hints about May rate cuts or any dovish remarks from the BoE might exert pressure on the GBP.
The GBP/USD pair remains under selling pressure near 1.2540 after bouncing off the 2024 low of 1.2520. The sell-off in the major pair is driven by the firmer US Dollar (USD) after the upside surprises in US Consumer Price Index (CPI) data in March. Investors await the US March Producer Price Index (PPI) and weekly Initial Jobless Claims on Thursday ahead of the UK monthly Gross Domestic Product (GDP) numbers later this week.
On Wednesday, the release of the CPI inflation for March affirmed the conviction that sticky inflation would convince the Federal Reserve (Fed) to delay its rate-cutting plans. Fed Funds Futures market pushed expectations for the first rate cut from June to September, according to the CME FedWatch Tool.
US inflation, as measured by the CPI, rose 0.4% MoM in March, putting the yearly inflation rate at 3.5%, the Labor Department’s Bureau of Labor Statistics revealed on Wednesday. Meanwhile, the Core CPI, excluding volatile food and energy components, climbed 0.4% MoM while rising 3.8% from a year ago, compared with estimates for 0.3% and 3.7%, respectively.
On the other hand, the Pound Sterling (GBP) will be influenced by the United Kingdom's monthly Gross Domestic Product (GDP) and February Industrial Production, due on Friday. The markets anticipate the UK central bank cutting the rate after its June meeting. Meanwhile, any hints about May rate cuts or any dovish comments from the BoE policymakers might weigh on the GBP and act as a headwind for the GBP/USD pair.
On Thursday, the People’s Bank of China (PBoC) set the USD/CNY central rate for the trading session ahead at 7.0968 as compared to the previous day's fix of 7.0959 and 7.2622 Reuters estimates.
Japanese Finance Minister Shunichi Suzuki offered some verbal intervention on Thursday. Suzuki said that he won't rule out any actions to respond to excessive foreign exchange (FX) moves. He further stated that he is in constant discussion with Vice Finance Minister Kanda on FX.
Key quotes
“No comment on daily forex moves.”
“Important for currencies to move in a stable manner, reflecting fundamentals.”
“Excessive FX moves are undesirable.”
“Looking at the background of Yen weakening to 152, 153 to Dollar and not necessarily at the levels themselves.”
“In constant communication with Vice Finance Minister Kanda on forex.”
“Won't rule out any steps to respond to excessive FX moves.”
“Forex levels are basically determined by markets.”
“Weak yen has merits, demerits.”
“Always interested, concerned about the impact of weak yen on prices.”
Market reaction
At the time of writing, USD/JPY is trading 0.22% lower on the day to trade at 152.85
Japanese Yen FAQs
The Japanese Yen (JPY) is one of the world’s most traded currencies. Its value is broadly determined by the performance of the Japanese economy, but more specifically by the Bank of Japan’s policy, the differential between Japanese and US bond yields, or risk sentiment among traders, among other factors.
One of the Bank of Japan’s mandates is currency control, so its moves are key for the Yen. The BoJ has directly intervened in currency markets sometimes, generally to lower the value of the Yen, although it refrains from doing it often due to political concerns of its main trading partners. The current BoJ ultra-loose monetary policy, based on massive stimulus to the economy, has caused the Yen to depreciate against its main currency peers. This process has exacerbated more recently due to an increasing policy divergence between the Bank of Japan and other main central banks, which have opted to increase interest rates sharply to fight decades-high levels of inflation.
The BoJ’s stance of sticking to ultra-loose monetary policy has led to a widening policy divergence with other central banks, particularly with the US Federal Reserve. This supports a widening of the differential between the 10-year US and Japanese bonds, which favors the US Dollar against the Japanese Yen.
The Japanese Yen is often seen as a safe-haven investment. This means that in times of market stress, investors are more likely to put their money in the Japanese currency due to its supposed reliability and stability. Turbulent times are likely to strengthen the Yen’s value against other currencies seen as more risky to invest in.
| Index | Change, points | Closed | Change, % |
|---|---|---|---|
| NIKKEI 225 | -191.32 | 39581.81 | -0.48 |
| Hang Seng | 311.1 | 17139.17 | 1.85 |
| ASX 200 | 24.3 | 7848.5 | 0.31 |
| DAX | 20.61 | 18097.3 | 0.11 |
| CAC 40 | -3.79 | 8045.38 | -0.05 |
| Dow Jones | -422.16 | 38461.51 | -1.09 |
| S&P 500 | -49.27 | 5160.64 | -0.95 |
| NASDAQ Composite | -136.28 | 16170.36 | -0.84 |
| Pare | Closed | Change, % |
|---|---|---|
| AUDUSD | 0.65118 | -1.74 |
| EURJPY | 164.284 | -0.29 |
| EURUSD | 1.0742 | -1.06 |
| GBPJPY | 191.806 | -0.29 |
| GBPUSD | 1.25392 | -1.08 |
| NZDUSD | 0.59739 | -1.37 |
| USDCAD | 1.36798 | 0.8 |
| USDCHF | 0.91253 | 1.01 |
| USDJPY | 152.954 | 0.79 |
- EUR/USD remains under pressure around 1.0740 on the stronger USD on Thursday.
- The ECB is widely expected to leave interest rates unchanged at its April meeting on Thursday.
- The US CPI figure rose 0.4% MoM in March, compared with the 0.3% gain estimated.
The EUR/USD pair remains on the defensive near 1.0740 during the early Asian session on Thursday. An unexpected rise in US CPI inflation data in March propelled the US Dollar (USD) to yearly highs and weighed on the major pair. Investors will closely monitor the European Central Bank (ECB) interest rate decision and press conference later on Thursday, along with the release of the US Producer Price Index (PPI) report.
The ECB is anticipated to keep interest rates steady at a record high at its April meeting on Thursday, but ECB President Christine Lagarde is likely to discuss about inflation data and the possibilities of a June rate cut. The Federal Reserve (Fed) might delay the easing cycle this year due to the robust economy and upside surprises in inflation. The ECB insists on setting policy independently, but the divergence of interest rates between the Fed and ECB might exert some selling pressure on the Euro (EUR) and create a headwind for the EUR/USD pair.
An unexpected rise in the US inflation data in March triggered speculation that the US central bank would delay cutting the interest rate. The Greenback rose to fresh yearly highs north of 105.30 after the data. The US Consumer Price Index (CPI) rose 0.4% MoM in March, compared with the 0.3% gain estimated. On an annual basis, the CPI climbed 3.5% YoY versus the expectation of a 3.4% rise, according to the Labor Department on Wednesday.
The Core CPI figure, excluding volatile food and energy, jumped 0.4% MoM in March, compared with the market consensus of a 0.3% rise. Meanwhile, the Core figure grew by 3.8%, against the expectation of a 3.7% increase. Later on Thursday, the US Producer Price Index for March and weekly Initial Jobless Claims will be due. Also, the Fed’s Williams, Collins, and Bostic are set to speak.


© 2000-2026. All rights reserved.
This site is managed by Teletrade D.J. LLC 2351 LLC 2022 (Euro House, Richmond Hill Road, Kingstown, VC0100, St. Vincent and the Grenadines).
The information on this website is for informational purposes only and does not constitute any investment advice.
The company does not serve or provide services to customers who are residents of the US, Canada, Iran, The Democratic People's Republic of Korea, Yemen and FATF blacklisted countries.
Making transactions on financial markets with marginal financial instruments opens up wide possibilities and allows investors who are willing to take risks to earn high profits, carrying a potentially high risk of losses at the same time. Therefore you should responsibly approach the issue of choosing the appropriate investment strategy, taking the available resources into account, before starting trading.
Use of the information: full or partial use of materials from this website must always be referenced to TeleTrade as the source of information. Use of the materials on the Internet must be accompanied by a hyperlink to teletrade.org. Automatic import of materials and information from this website is prohibited.
Please contact our PR department if you have any questions or need assistance at pr@teletrade.global.
transfers