- Analytics
- News and Tools
- Market News
CFD Markets News and Forecasts — 12-04-2024
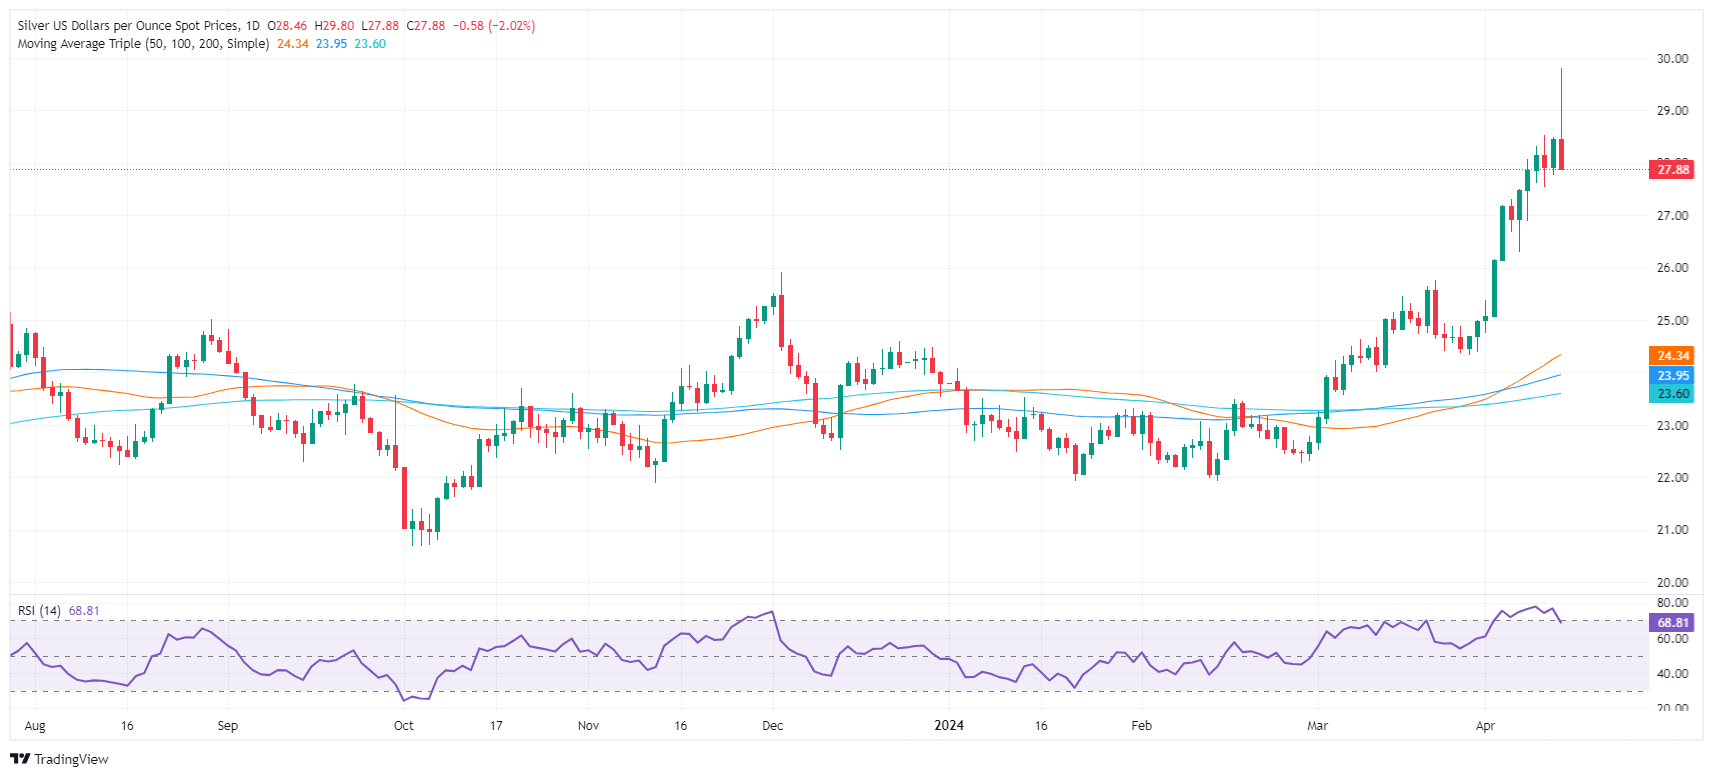
- Silver pulls back sharply from its highest point since February 2021, suggesting the rally might be overextended.
- If it breaks below key supports at $28.28 and $28.00, further declines to $27.54 and $27.00 could occur.
- A recovery above $28.00 could reignite bullish sentiment, aiming for previous highs and resistances.
Silver's price tumbled on Friday’s session after refreshing three-year highs reached in February 2021. The grey metal peaked at $29.79 before plunging close to $2.00. The XAG/USD traded at $27.84, down 2.01%.
XAG/USD Price Analysis: Technical outlook
Silver is bullishly biased despite retreating sharply after spiking toward the $29.70s area. However, achieving a daily close below the June 10, 2021, high turned support at $28.28 and clearing below $28.00 has opened the door for a pullback. Therefore, XAG/USD's first support would be the April 10, low at $27.54, ahead of challenging the $27.00 figure. Further losses are seen on May 5, 2023, with high turned support at $26.12.
On the other hand, strong bullish momentum remains, and if buyers reclaim $28.00, that could be put back into the table, the continuation of the rally. The first supply zone would be June 10, 2021, high at $28.28, before testing May 18, 2021, at $28.74. Once surpassed, the next stop would be the year-to-date (YTD) high at $29.79.
XAG/USD Price Action – Daily Chart
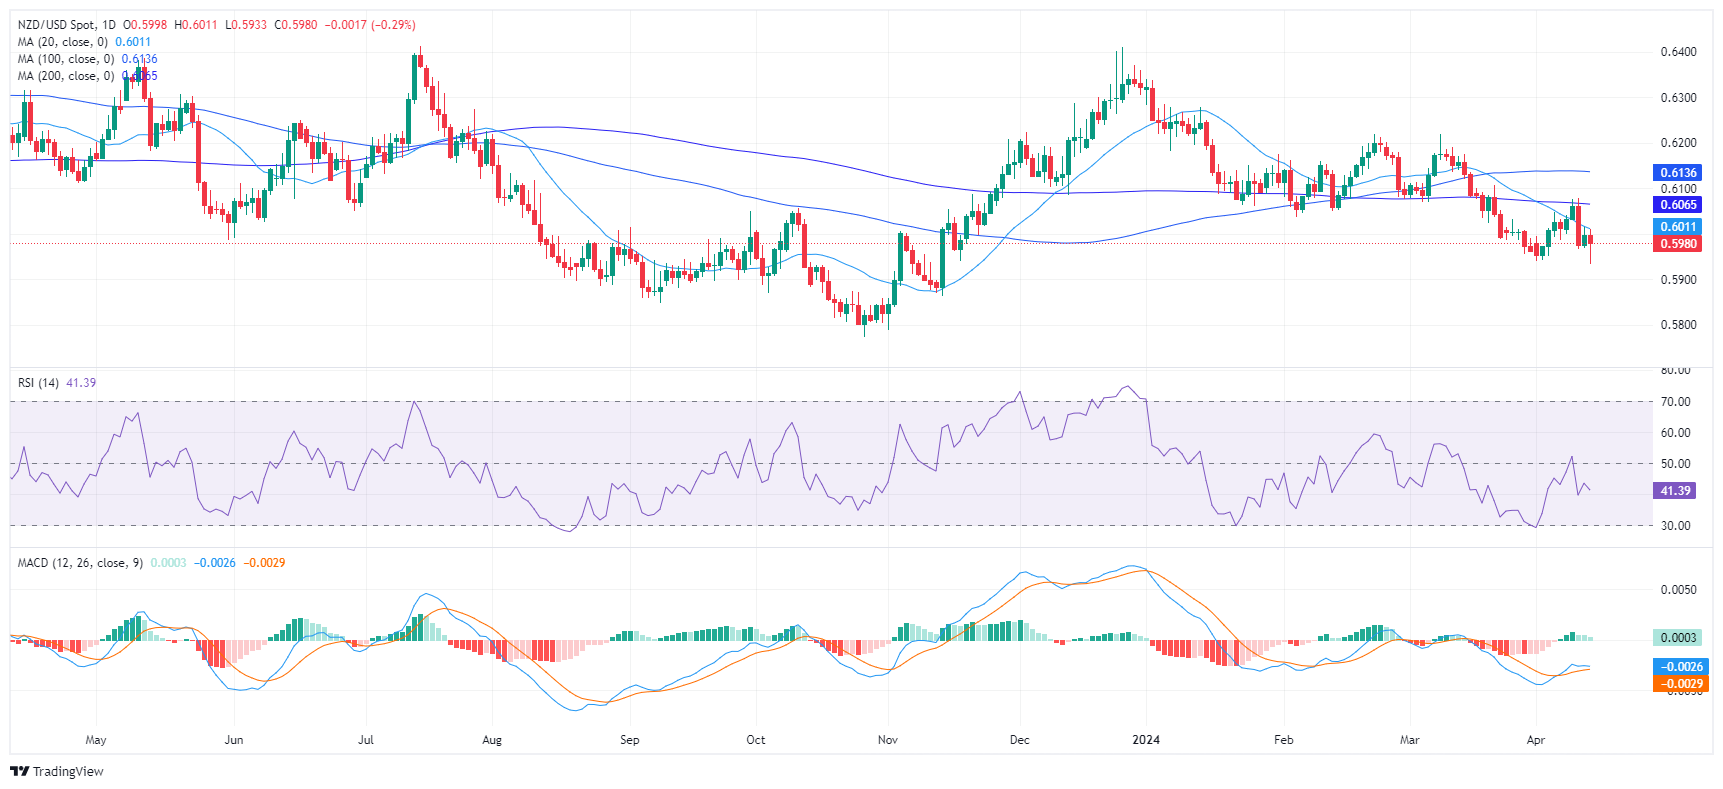
- The daily RSI of the NZD/USD reveals that sellers remain in command with values below 50.
- The daily MACD shows a slowdown in selling pressure as flat green bars begin to form.
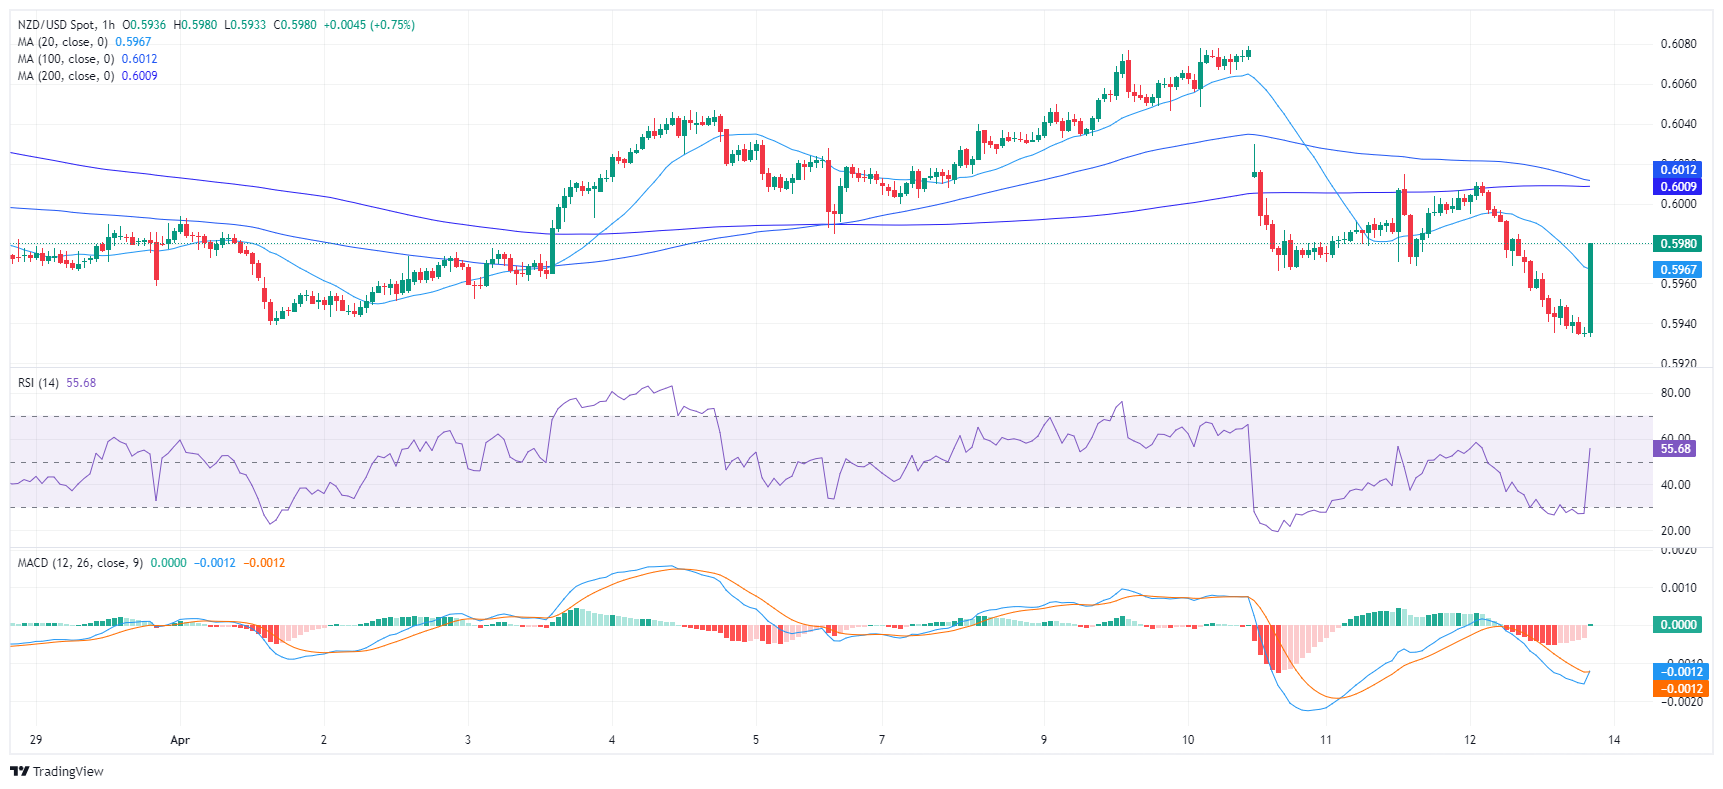
- Buyers hint at gaining minor traction in the short term, with hourly indicators recovering.
The NZD/USD pair reflects the ongoing dominance of sellers, declining towards the 0.5935 mark. While signs of bearish control are evident, there is a clue of bullish resilience, hinting at a neutral to bearish outlook in the short term.
The daily Relative Strength Index (RSI) maintains a consistent presence in the negative territory below 50, with the latest value at 38 which indicates that sellers are in command. That being said, green bars take shape on the Moving Average Convergence Divergence (MACD) histogram, indicating a slowing of the bearish momentum.
NZD/USD daily chart
In contrast, the hourly chart indicates a gradually increasing RSI with the latest reading at 47. This suggests a mild recovery of buying interest after dropping into oversold conditions earlier in the session. Moreover, the MACD histogram shows a fresh green bar, implying a positive change in the short term momentum.
NZD/USD hourly chart
With respect to the broader trend, the outlook is bearish with the pair below the 20,100 and 200-day Simple Moving Averages (SMAs). However, the pair is close to its 20-day average and if buyers regain additional ground and recapture it, the outlook may start to shift in favor of the bulls.
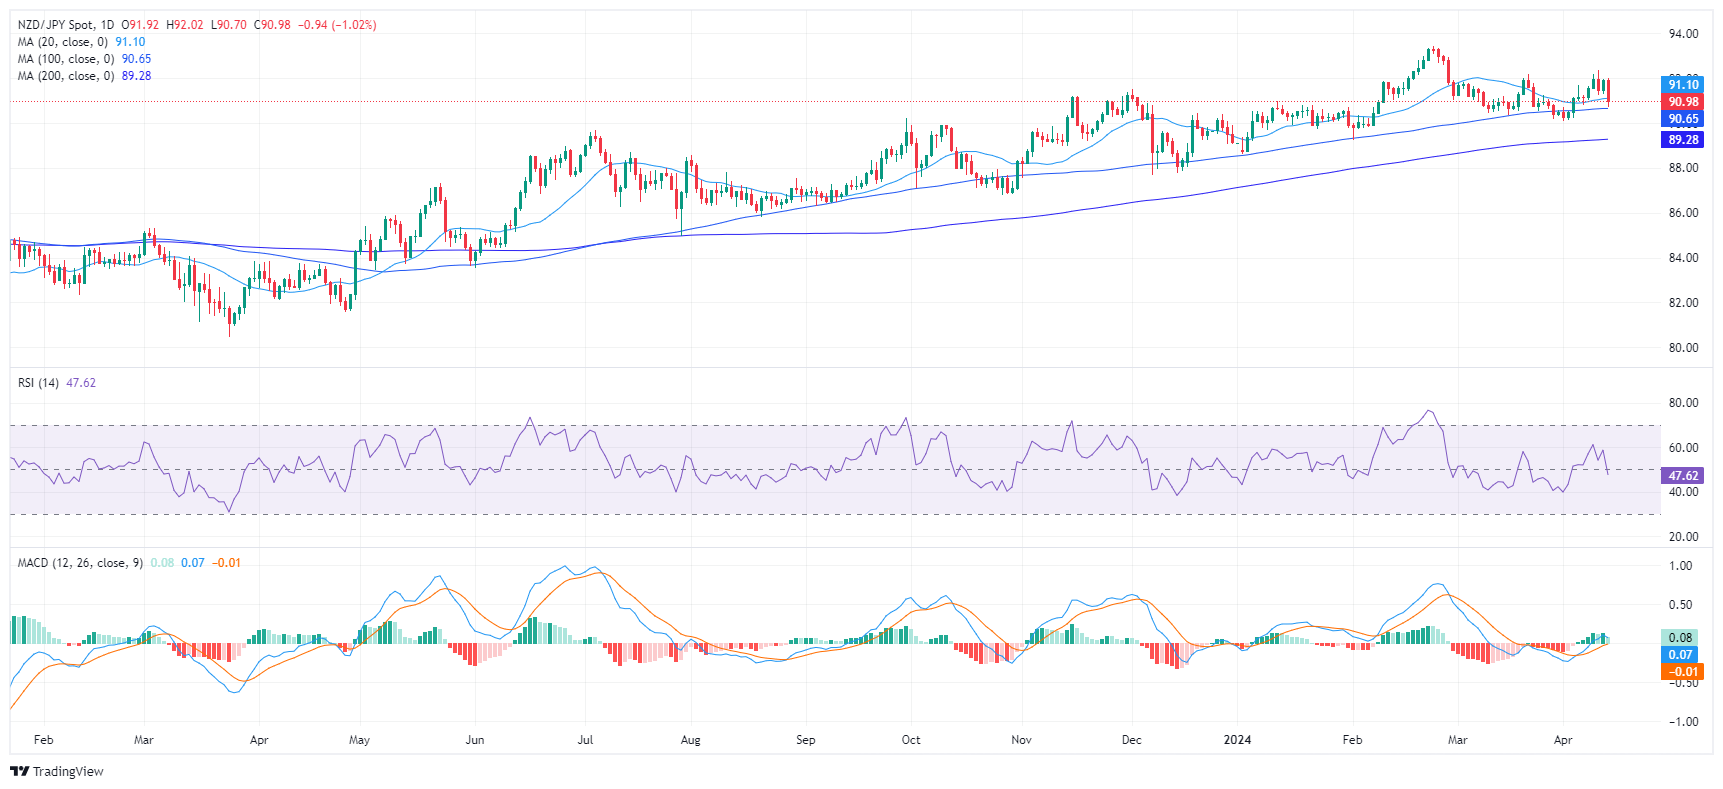
- The daily chart RSI signals NZD/JPY's shift towards negative momentum.
- Hourly RSI reveals an oscillating pattern in oversold territory, indicating increasing bearish pressure.
The NZD/JPY declined to 90.95 on Friday, marking a decrease of 1%. Sellers have gained significant ground and hourly indicators indicate oversold conditions which suggests that the pair might sideways trade in the next sessions. As for now, the short term has turned somewhat bearish for the cross as it lost the 20-day Simple Moving Average (SMA).
Based on the indicators of the daily chart, the NZD/JPY has pivoted towards a negative momentum. Its Relative Strength Index (RSI) is settling into negative territory, with a last reading of 47. This change indicates that sellers are taking control after a period of positive strength that had the RSI peaking at 63 this week.
NZD/JPY daily chart
From the hourly chart, the RSI values reveal oversold conditions, with the most recent reading dipping to 30. The Moving Average Convergence Divergence (MACD) histogram generates flat red bars, signaling sustained negative momentum. This coincides with a drop in buyer demand over the past hours, and it could set the tone for the upcoming trading sessions. However, a consolidation shouldn't be ruled out as bears might take a breather.
NZD/JPY hourly chart
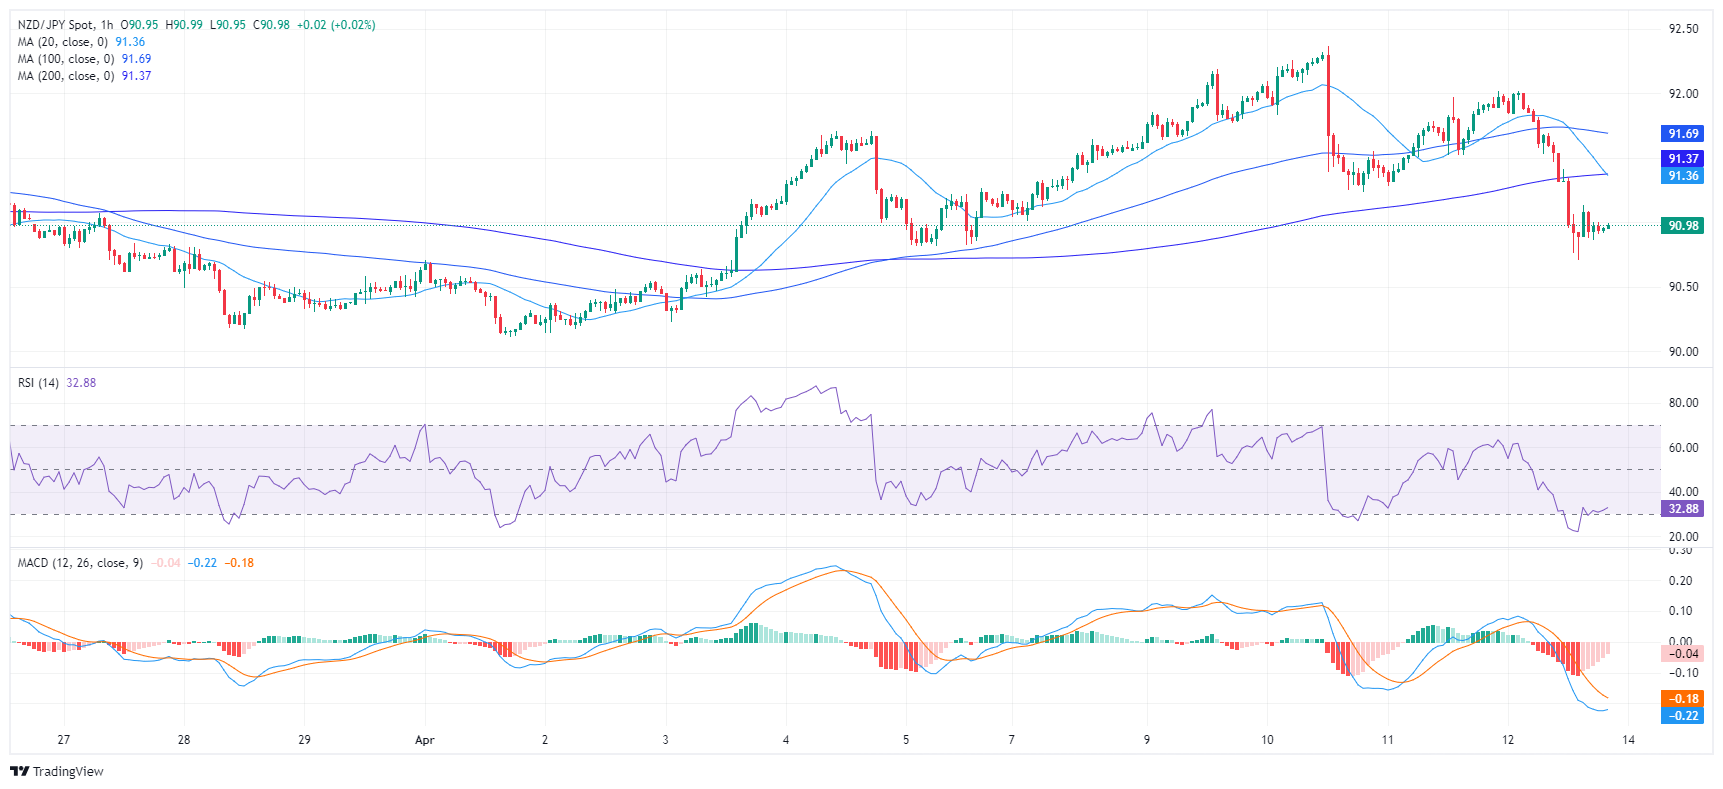
In the broader outlook, the NZD/JPY, based on its Simple Moving Average (SMA) still holds a positive outlook as it holds above the 100 and 200-day SMAs. However, the cross, having fallen today below the 20-day SMA, presents a bearish signal for the short term which aligns with the indicators on the daily and hourly chart.
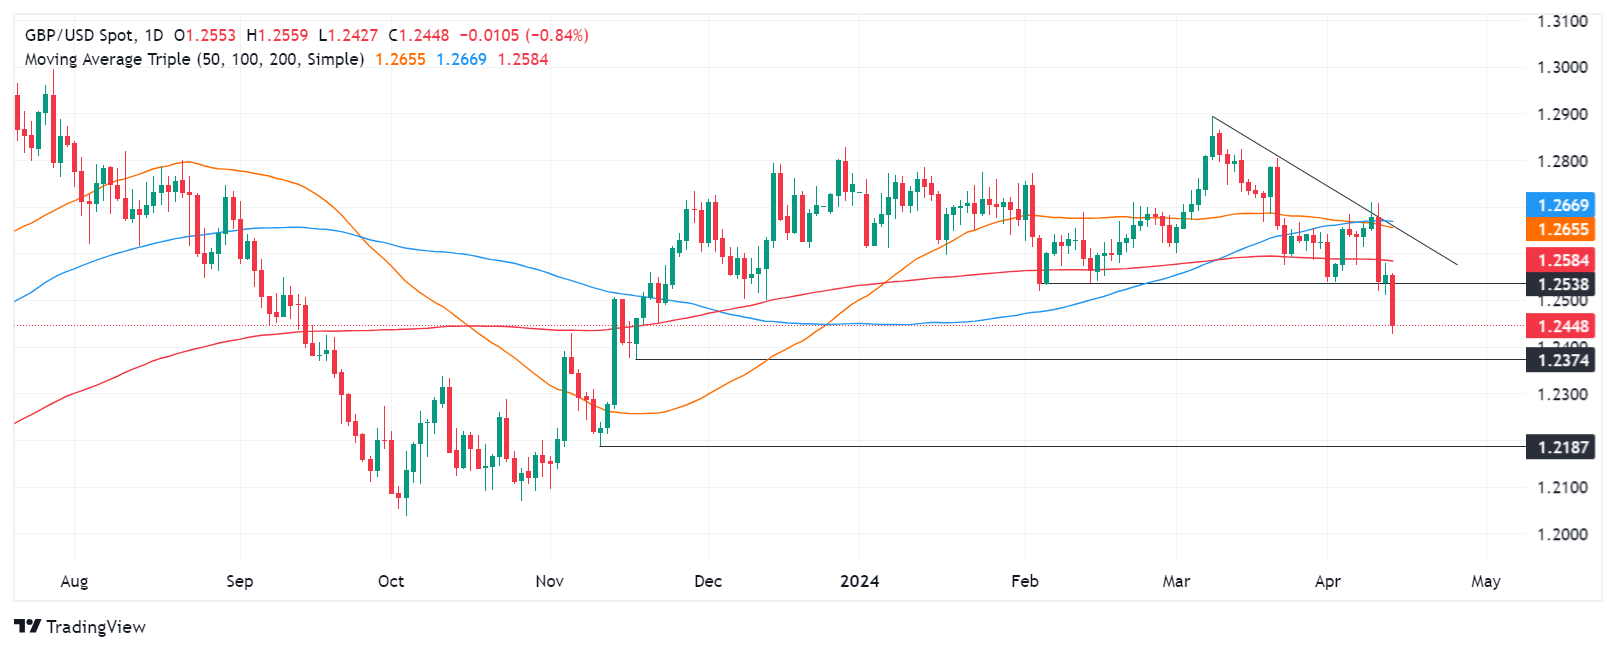
- GBP/USD falls sharply, influenced by a move towards safer assets and a strengthening US Dollar.
- Technical analysis indicates a shift to bearish territory after dropping below the 200-day moving average.
- Recovery targets include reclaiming 1.2500, with resistance at the 200-day DMA.
The British Pound plunged against the US Dollar late in the North American session, down 0.74%, and trades at 1.2445 after hitting a daily high of 1.2559. Risk aversion triggered a flight to safety, a headwind for the Pound Sterling even though UK GDP figures were solid.
GBP/USD Price Analysis: Technical outlook
From a technical perspective, the GBP/USD shifted bearish as it achieved a successive series of lower highs and lows while breaching key support levels. On its way south, the pair cleared the 200-day moving average (DMA) at 1.2584, which opened the door to a tumble below 1.2500.
For a bearish continuation, the GBP/USD needs to clear the 1.2400 mark. A breach of the latter will expose the November 17, 2023, low of 1.2374, followed by the 1.2300 mark.
On the other hand, if buyers lift the GBP/USD past the 1.2500, that could pave the way for further gains. The next resistance would be the 200-day moving average (DMA) at 1.2584, ahead of 1.2600.
As the GBP/USD dropped below key support levels and achieved
GBP/USD Price Action – Daily Chart
- Gold reaches record $2,431, then pulls back amid stronger US Dollar and reduced inflation concerns.
- Geopolitical tensions between Iran-Israel spark market volatility, initially raising demand for safe havens.
- Fed officials' comments boost the US Dollar, a headwind for Gold prices.
Gold's price fell during the North American session after refreshing all-time peaks during Friday’s session. Geopolitical risks spurred a flight to safety, driving the golden metal price toward $2,431, a new all-time high, before retreating on overall US Dollar strength. At the time of writing, the XAU/USD exchanges hands at $2,352, down 0.64%.
According to news sources, Iran is preparing an attack on Israeli soil following an Israeli attack that killed seven Iranian officials two weeks ago.
Aside from this, the latest US inflation figures revealed on Wednesday and Thursday sparked volatility in the precious metal. The non-yielding metal traveled down to $2,303 following the US Consumer Price Index (CPI) release. However, the dip was short-lived as inflation pressures eased following the Producer Price Index (PPI) report printing below headline consensus and some of February’s readings.
Federal Reserve officials are crossing newswires led by Boston Fed President Susan Collins, Chicago Fed President Austan Goolsbee, and the Kansas City Fed’s Jeffrey Schmid, largely heaping more cold water on rate cut hopes.
Daily digest market movers: Gold tumbles amid sour sentiment on US Dollar strength
- The University of Michigan's preliminary Consumer Sentiment Index for April showed a decline to 59.7, falling below the expected 79.0. Additionally, short-term inflation expectations for the coming year increased to 3.1%, up from the anticipated and previous rate of 2.9%. Long-term inflation expectations, looking five years ahead, also rose, moving from 2.8% to 3.0%.
- Mixed inflationary data revealed in the United States (US) prompted investors to trim expectations of the Fed’s rate cuts. Data from the Chicago Board of Trade (CBOT) suggests that futures traders expect just two cuts to the fed funds rate as they project the main reference rate to end the year at around 4.915%.
- The US Dollar Index (DXY) also witnessed a substantial increase, soaring over 0.64% to reach a new YTD high of 106.10.
- Boston Fed President Susan Collins said the first rate cut could be delayed while adding that she expects to cut rates twice instead of thrice.
- Chicago Fed’s Austan Goolsbee commented that multiple inflation readings are higher than he wants, adding that the Middle East instability is a wild card for the Fed in terms of oil prices and gas; a negative supply shock is not good.
- Kansas City Fed's Jeffrey Schmid emphasized that the current stance of US monetary policy is appropriate, given the persistently sticky inflation levels. He urged for patience on interest rates, advocating for a cautious approach until it is evident that inflation is receding toward the 2% target.
- World Gold Consortium reveals that the People’s Bank of China was the largest buyer of the yellow metal in February, increasing its reserves by 12 tonnes to 2,257 tonnes.
Technical analysis: Gold’s rally stalls as XAU/USD drops below $2,400
Gold’s uptrend is set to continue despite dipping toward the $2,350 area, after hitting an all-time high above $2,400. In the event that sellers push prices below $2,350, the next support level would be the April 10 low of $2,319, followed by the April 8 daily low of $2,303. Once cleared, the next support would be March’s 21-session high of $2,222. Further losses are seen at $2,200.
On the flip side, expect further upside above $2,400, with the next resistance seen at $2,431, followed by $2,450. The next milestone will be reaching $2,500.
Gold FAQs
Gold has played a key role in human’s history as it has been widely used as a store of value and medium of exchange. Currently, apart from its shine and usage for jewelry, the precious metal is widely seen as a safe-haven asset, meaning that it is considered a good investment during turbulent times. Gold is also widely seen as a hedge against inflation and against depreciating currencies as it doesn’t rely on any specific issuer or government.
Central banks are the biggest Gold holders. In their aim to support their currencies in turbulent times, central banks tend to diversify their reserves and buy Gold to improve the perceived strength of the economy and the currency. High Gold reserves can be a source of trust for a country’s solvency. Central banks added 1,136 tonnes of Gold worth around $70 billion to their reserves in 2022, according to data from the World Gold Council. This is the highest yearly purchase since records began. Central banks from emerging economies such as China, India and Turkey are quickly increasing their Gold reserves.
Gold has an inverse correlation with the US Dollar and US Treasuries, which are both major reserve and safe-haven assets. When the Dollar depreciates, Gold tends to rise, enabling investors and central banks to diversify their assets in turbulent times. Gold is also inversely correlated with risk assets. A rally in the stock market tends to weaken Gold price, while sell-offs in riskier markets tend to favor the precious metal.
The price can move due to a wide range of factors. Geopolitical instability or fears of a deep recession can quickly make Gold price escalate due to its safe-haven status. As a yield-less asset, Gold tends to rise with lower interest rates, while higher cost of money usually weighs down on the yellow metal. Still, most moves depend on how the US Dollar (USD) behaves as the asset is priced in dollars (XAU/USD). A strong Dollar tends to keep the price of Gold controlled, whereas a weaker Dollar is likely to push Gold prices up.
- Increasing bearish pressure is shown by the RSI and MACD of both hourly and daily charts.
- Sellers appear to have control, after gaining the 20-day SMA.
- Buyers need to maintain control over the 100 and 200-day SMAs to prevent further bearish inclination.
The EUR/JPY pair is settling at the 163.00 level, displaying a noteworthy shift favoring the sellers. Although the pair is securely situated above key long-term Simple Moving Averages (SMAs), implying a possible enduring bullish bias, recent indicators suggest a change in the narrative for the short term.
On the daily chart the Relative Strength Index (RSI) indicates a negative trend, having dropped from positive territory to 46. Illustrating this downward trajectory, the Moving Average Convergence Divergence (MACD) also prints red bars, indicating a negative momentum underway.
EUR/JPY daily chart
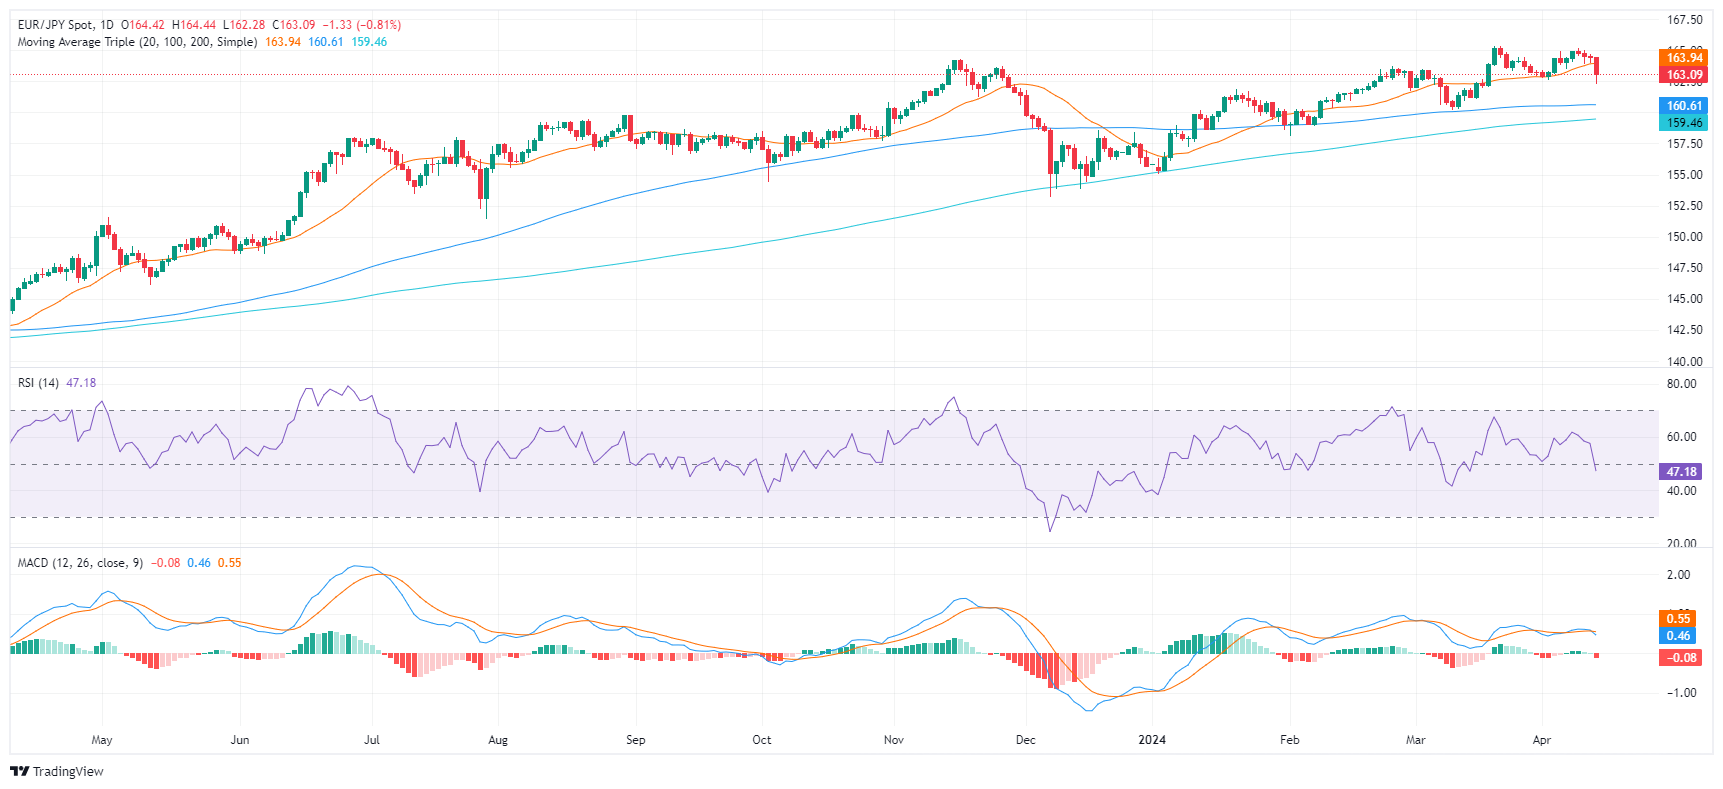
Switching to the hourly chart, the RSI reveals a similar picture, with the latest reading sitting at 39, reflecting a continuous negative trend. The MACD also prints red bars, carrying the negative momentum from the daily chart to the hourly chart. These indicators, together, could suggest an ongoing bearish pressure for the EUR/JPY throughout the session.
EUR/JPY hourly chart
On the broader outlook, the EUR/JPY gives mixed signals from a technical analysis standpoint. On Friday, it fell below the 20-day Simple Moving Average (SMA), hinting at a possible bearish shift in the short-term trend. This could trigger increased selling pressure on the pair with the potential of further losses. Yet, from a broader perspective, the cross stands above both the 100 and 200-day SMA, which leaves a long-term bullish outlook intact.
- Despite weak sentiment data, USD rides high on hawkish Fed bets.
- CPI data reported this week made hopes of a June cut unlikely.
- Fed’s Collins and Goolsbee were on the wires sounding hawkish.
The US Dollar Index (DXY) is trading above the 106.00 mark, attaining its highest level since early November. The Index's upward movement is largely driven by rising US yields and a hot inflation data environment that favors the US Dollar. In addition, Federal Reserve (Fed) officials expressed fewer possibilities for rate cuts this year, and an increase in hawkish bets is another driver boosting the currency.
On Wednesday, inflation measured by the US Consumer Price Index (CPI) accelerated in March, which made US Treasury yields rally, and markets are now expecting a more aggressive Fed.
Daily digest market movers: DXY shrugs off weak sentiment data on the back of hawkish bets
- Early April saw a decrease in US Consumer Confidence as indicated by the University of Michigan's Consumer Sentiment Index, which fell to 77.9 from March's 79.3, shyer than anticipated.
- Decreases were recorded in Sentiment Indices for both Current Conditions and Consumer Expectations, falling to 79.3 and 77 from 82.5 and 77.4, respectively.
- On Wednesday, the Consumer Price Index (CPI), reported by the US Bureau of Labor Statistics, rose to 3.5% YoY in March, a jump from February's 3.2%. The core CPI also accelerated.
- Because of heightened inflation figures, there is increased anticipation of a hawkish response from the Fed, which has led to a rise in US Treasury bond yields, subsequently strengthening the US Dollar (USD).
- Susan Collins, from the Boston Fed, pointed out that only two rate cuts could happen this year. Austan Goolsbee also warned that the Fed might take action if Personal Consumption Expenditures accelerates.
- The Odds of a July cut are reportedly less than 60%, a decrease from the prior 99% chance before the inflation data were publicized. The odds for a second rate cut happening in December stand at 75%.
- The market's hopes for a June rate cut also declined to around 20%.
DXY technical analysis: DXY bullish as momentum indicators favor buyers, correction likely
The indicators on the daily chart reflect a favorable buying momentum. The Relative Strength Index (RSI), with its positive slope and placement in positive territory, suggests that bulls are gaining ground in the currency price action. However, the RSI stands now in overbought terrain, which may hint that a correction is incoming.
Meanwhile, the Moving Average Convergence Divergence (MACD) also supports this bullish view as the green bars on the histogram show an upward trajectory, indicating that buyers are in control.
US Dollar FAQs
The US Dollar (USD) is the official currency of the United States of America, and the ‘de facto’ currency of a significant number of other countries where it is found in circulation alongside local notes. It is the most heavily traded currency in the world, accounting for over 88% of all global foreign exchange turnover, or an average of $6.6 trillion in transactions per day, according to data from 2022. Following the second world war, the USD took over from the British Pound as the world’s reserve currency. For most of its history, the US Dollar was backed by Gold, until the Bretton Woods Agreement in 1971 when the Gold Standard went away.
The most important single factor impacting on the value of the US Dollar is monetary policy, which is shaped by the Federal Reserve (Fed). The Fed has two mandates: to achieve price stability (control inflation) and foster full employment. Its primary tool to achieve these two goals is by adjusting interest rates. When prices are rising too quickly and inflation is above the Fed’s 2% target, the Fed will raise rates, which helps the USD value. When inflation falls below 2% or the Unemployment Rate is too high, the Fed may lower interest rates, which weighs on the Greenback.
In extreme situations, the Federal Reserve can also print more Dollars and enact quantitative easing (QE). QE is the process by which the Fed substantially increases the flow of credit in a stuck financial system. It is a non-standard policy measure used when credit has dried up because banks will not lend to each other (out of the fear of counterparty default). It is a last resort when simply lowering interest rates is unlikely to achieve the necessary result. It was the Fed’s weapon of choice to combat the credit crunch that occurred during the Great Financial Crisis in 2008. It involves the Fed printing more Dollars and using them to buy US government bonds predominantly from financial institutions. QE usually leads to a weaker US Dollar.
Quantitative tightening (QT) is the reverse process whereby the Federal Reserve stops buying bonds from financial institutions and does not reinvest the principal from the bonds it holds maturing in new purchases. It is usually positive for the US Dollar.
- The Euro dives on a combination of a dovish ECB and a hawkish Fed
- The pair is on track to its weakest weekly performance in more than one year.
- Upside attempts are expected to be limited below 1.0725 and 1.0755.
The Euro has been falling like a stone over the last two days, crushed by the combination of a hawkish Federal Reserve and a dovish European Central Bank. The pair has lost nearly 2% in the last three days and is set to close its worst weekly performance in more than one year.
The ECB left rates unchanged at the 4% level in a contested decision, as some committee members were in favour of a rate cut. This, and the dovish tilt on the monetary statement has boosted expectations that the bank will start easing its monetary policy soon. Investors have marked June in their calendars.
This would put the ECB on the unprecedented position of shifting its monetary policy ahead of the Federal Reserve. The Fed is in a polar opposite, as the shock of the US inflation and the strong macroeconomic data is forcing the bank to dial down its monetary easing plans.
In this scenario, it is difficult to see any support for the Euro. The pair might see some correction from strongly oversold levels on intra-day charts, although upside attempts are expected to be limited. Supports are 1.0630 and 1.0525. Resistances lie at 1.0725 and 1.0755.
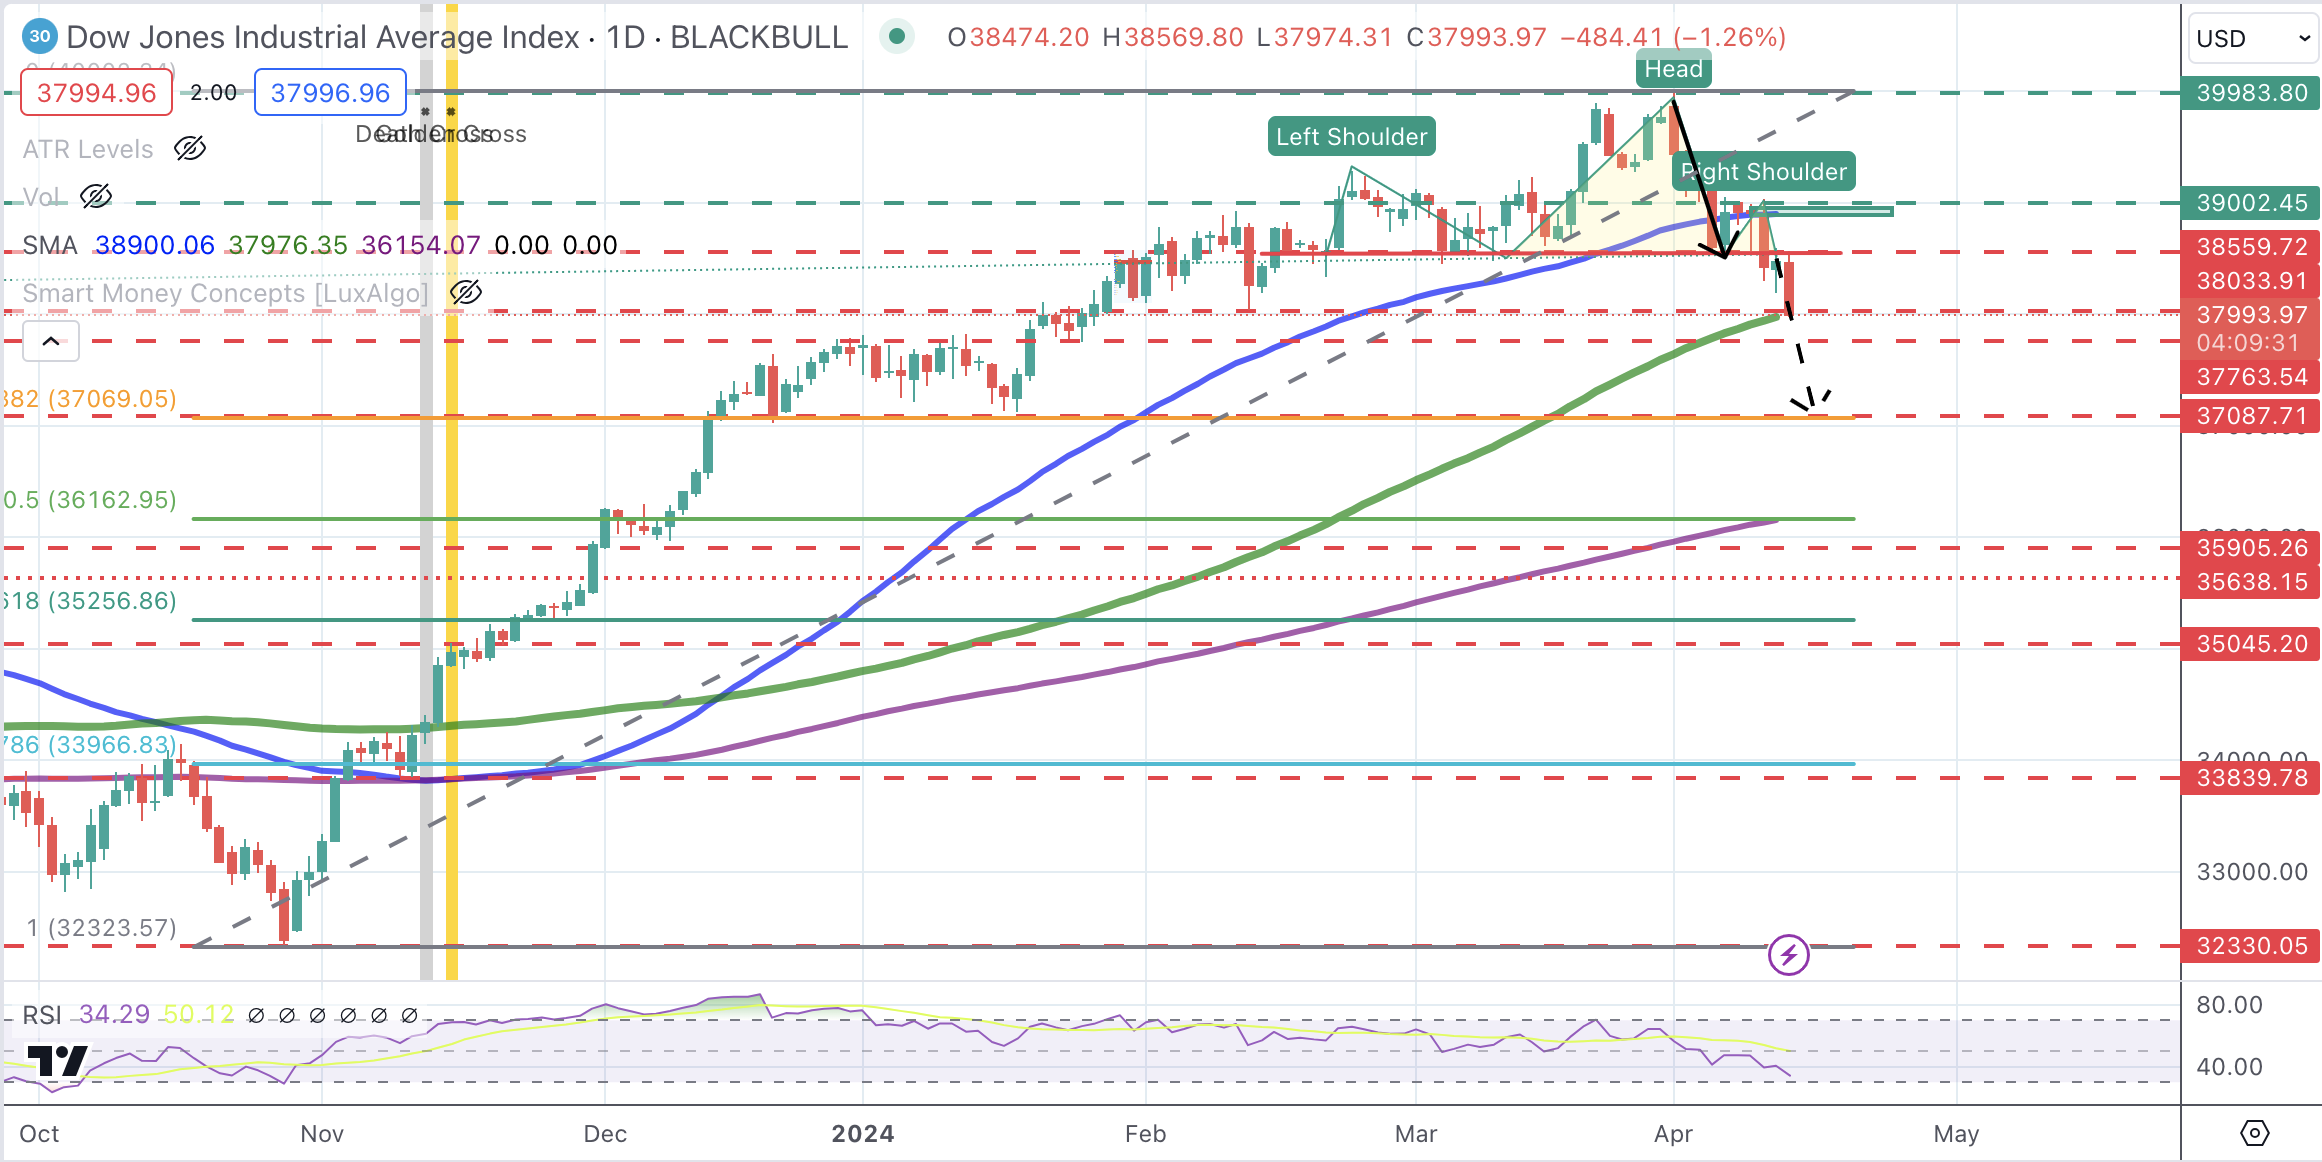
- Dow Jones index drops for fourth session this week, on track to post nearly 4.5% reversal from late March highs near 40,000.
- JPMorgan leads losses as quarterly earnings failed to meet expectations.
- News that China has told tech firms to phase out foreign chips hammers chipmakers.
The Dow Jones Industrial Average (DJIA) is reversing Thursday’s gains on a negative session opening on Friday. The quarterly earnings of some of the largest US banks have failed to cheer investors, who are already feeling frail sentiment on lower hopes of monetary easing by the Federal Reserve (Fed).
JPMorgan (JPM) and Wells Fargo (WFC) have posted softer-than-expected results in the first quarter, which is weighing on the financial sector. Beyond that, mega-caps and chipmakers are suffering on the back of news reporting that China has told telecom firms to phase out foreign chips.
The NASDAQ is leading losses on Friday, down 1.1% to 16,258, the S&P 500 drops 0.96% to 5,149, and the Dow Jones trades with a 0.8% loss at 38,148 halfway through the North American morning session.
Dow Jones news
All the Wall Street sectors are posting losses on Friday. The Technology sector posts a 1.23% decline, the weakest performance, followed by the Consumer Discretionary, 1.25% lower. The Energy and Utilities sectors, practically flat, are the best-performing ones.
JPMorgan is taking the biggest blow on Friday with a 5.34% decline to $184.96 following disappointing quarterly data, while Intel (INTC), which has been crushed by news about China’s decision, is 3.8% lower to $36.19.
On the positive side, Nike (NKE) advances 0.53% to $92.51 after Bank of America (BAC) upgraded its price target. Next is Apple (AAPL), up 0.51% to $175.95.
Dow Jones technical outlook
The Dow Jones index keeps drifting away from the historic highs reached in March. The move below 38,560 has activated a bearish Head & Shoulders pattern that might anticipate a sharper decline.
The next bearish targets are 38,000 and 37,750. The measured target of the H&S pattern is the mid-January low and 38.6% Fibonacci retracement at 37,087. A bullish reaction above 38,540 might find some more supply ahead of 39,000 (order block).
Dow Jones Index Daily Chart
Nasdaq FAQs
The Nasdaq is a stock exchange based in the US that started out life as an electronic stock quotation machine. At first, the Nasdaq only provided quotations for over-the-counter (OTC) stocks but later it became an exchange too. By 1991, the Nasdaq had grown to account for 46% of the entire US securities’ market. In 1998, it became the first stock exchange in the US to provide online trading. The Nasdaq also produces several indices, the most comprehensive of which is the Nasdaq Composite representing all 2,500-plus stocks on the Nasdaq, and the Nasdaq 100.
The Nasdaq 100 is a large-cap index made up of 100 non-financial companies from the Nasdaq stock exchange. Although it only includes a fraction of the thousands of stocks in the Nasdaq, it accounts for over 90% of the movement. The influence of each company on the index is market-cap weighted. The Nasdaq 100 includes companies with a significant focus on technology although it also encompasses companies from other industries and from outside the US. The average annual return of the Nasdaq 100 has been 17.23% since 1986.
There are a number of ways to trade the Nasdaq 100. Most retail brokers and spread betting platforms offer bets using Contracts for Difference (CFD). For longer-term investors, Exchange-Traded Funds (ETFs) trade like shares that mimic the movement of the index without the investor needing to buy all 100 constituent companies. An example ETF is the Invesco QQQ Trust (QQQ). Nasdaq 100 futures contracts allow traders to speculate on the future direction of the index. Options provide the right, but not the obligation, to buy or sell the Nasdaq 100 at a specific price (strike price) in the future.
Many different factors drive the Nasdaq 100 but mainly it is the aggregate performance of the component companies revealed in their quarterly and annual company earnings reports. US and global macroeconomic data also contributes as it impacts on investor sentiment, which if positive drives gains. The level of interest rates, set by the Federal Reserve (Fed), also influences the Nasdaq 100 as it affects the cost of credit, on which many corporations are heavily reliant. As such the level of inflation can be a major driver too as well as other metrics which impact on the decisions of the Fed.
Expectations of a later-than-expected interest rate cut by the Federal Reserve lent further legs to the Greenback, lifting the DXY to multi-month tops. There was no news at the ECB meeting, while FX intervention fears kept hovering around the Japanese yen.
The Greenback extended further its rally and advanced to fresh tops on the back of shrinking bets of a rate cut by the Fed in June. Retail Sales will take centre stage along with Business Inventories, the New York Empire State Manufacturing Index and the NAHB Housing Market Index on April 15. On April 16, the focus of attention will be on Building Permits, Housing Starts and Industrial Production, while the Fed Beige Book is due on April 17. Usual Initial Jobless Claims, the Philly Fed Manufacturing Index, the CB Leading Index and Exiting Home Sales are all expected on April 18.
EUR/USD collapsed to levels last seen in November well south of the 1.0700 support on the back of increasing Dollar's strength. The weekly calendar kicks in with Industrial Production in the euro area on April 15, seconded by the Economic Sentiment tracked by the ZEW survey in Germany and the euro bloc on April 16. On April 17, final Inflation Rate in the euro area is due.
GBP/USD accelerated its losses and retreated to yearly lows in the vicinity of the 1.2400 support amidst rising selling pressure in the risk complex. The UK docket will see the publication of the labour market report on April 16 ahead of the Inflation Rate on April 17 and Retail Sales on April 19.
USD/JPY rose to 34-year highs north of the 153.00 level following the Dollar's buying pressure and higher US yields. On April 15 comes the Machinery Orders followed by the Reuters Tankan Index and Balance of Trade results on April 17. Foreign Bond Investment is due on April 18 and the Inflation Rate and the Tertiary Industry Index are due on April 19.
Extra downward bias saw AUD/USD revisit multi-week lows in the sub-0.6500 region amidst a favourable context for the Greenback. The Westpac Leading Index is due on April 17 followed by the labour market report on April 18.
In China, the Q1 GDP Growth Rate, Industrial Production, Retail Sales and the Unemployment Rate are all due on April 16 along with FDI figures on April 17. USD/CNH extended its corrective upside to monthly highs near 7.2700.
Anticipating Economic Perspectives: Voices on the Horizon
- BoE's Breeden speaks on April 15.
- Fed's Daly and Jefferson speak on April 16 along with BoE's Bailey and BoC's Macklem.
- BoE's Greene, Haskel and Bailey are all due to speak on April 17 along with Fed's Mester.
- Fed's Bowman, Williams, Bostic and SNB's Martin speak on April 18.
- BoE's Breeden and Ramsden will speak on April 19.
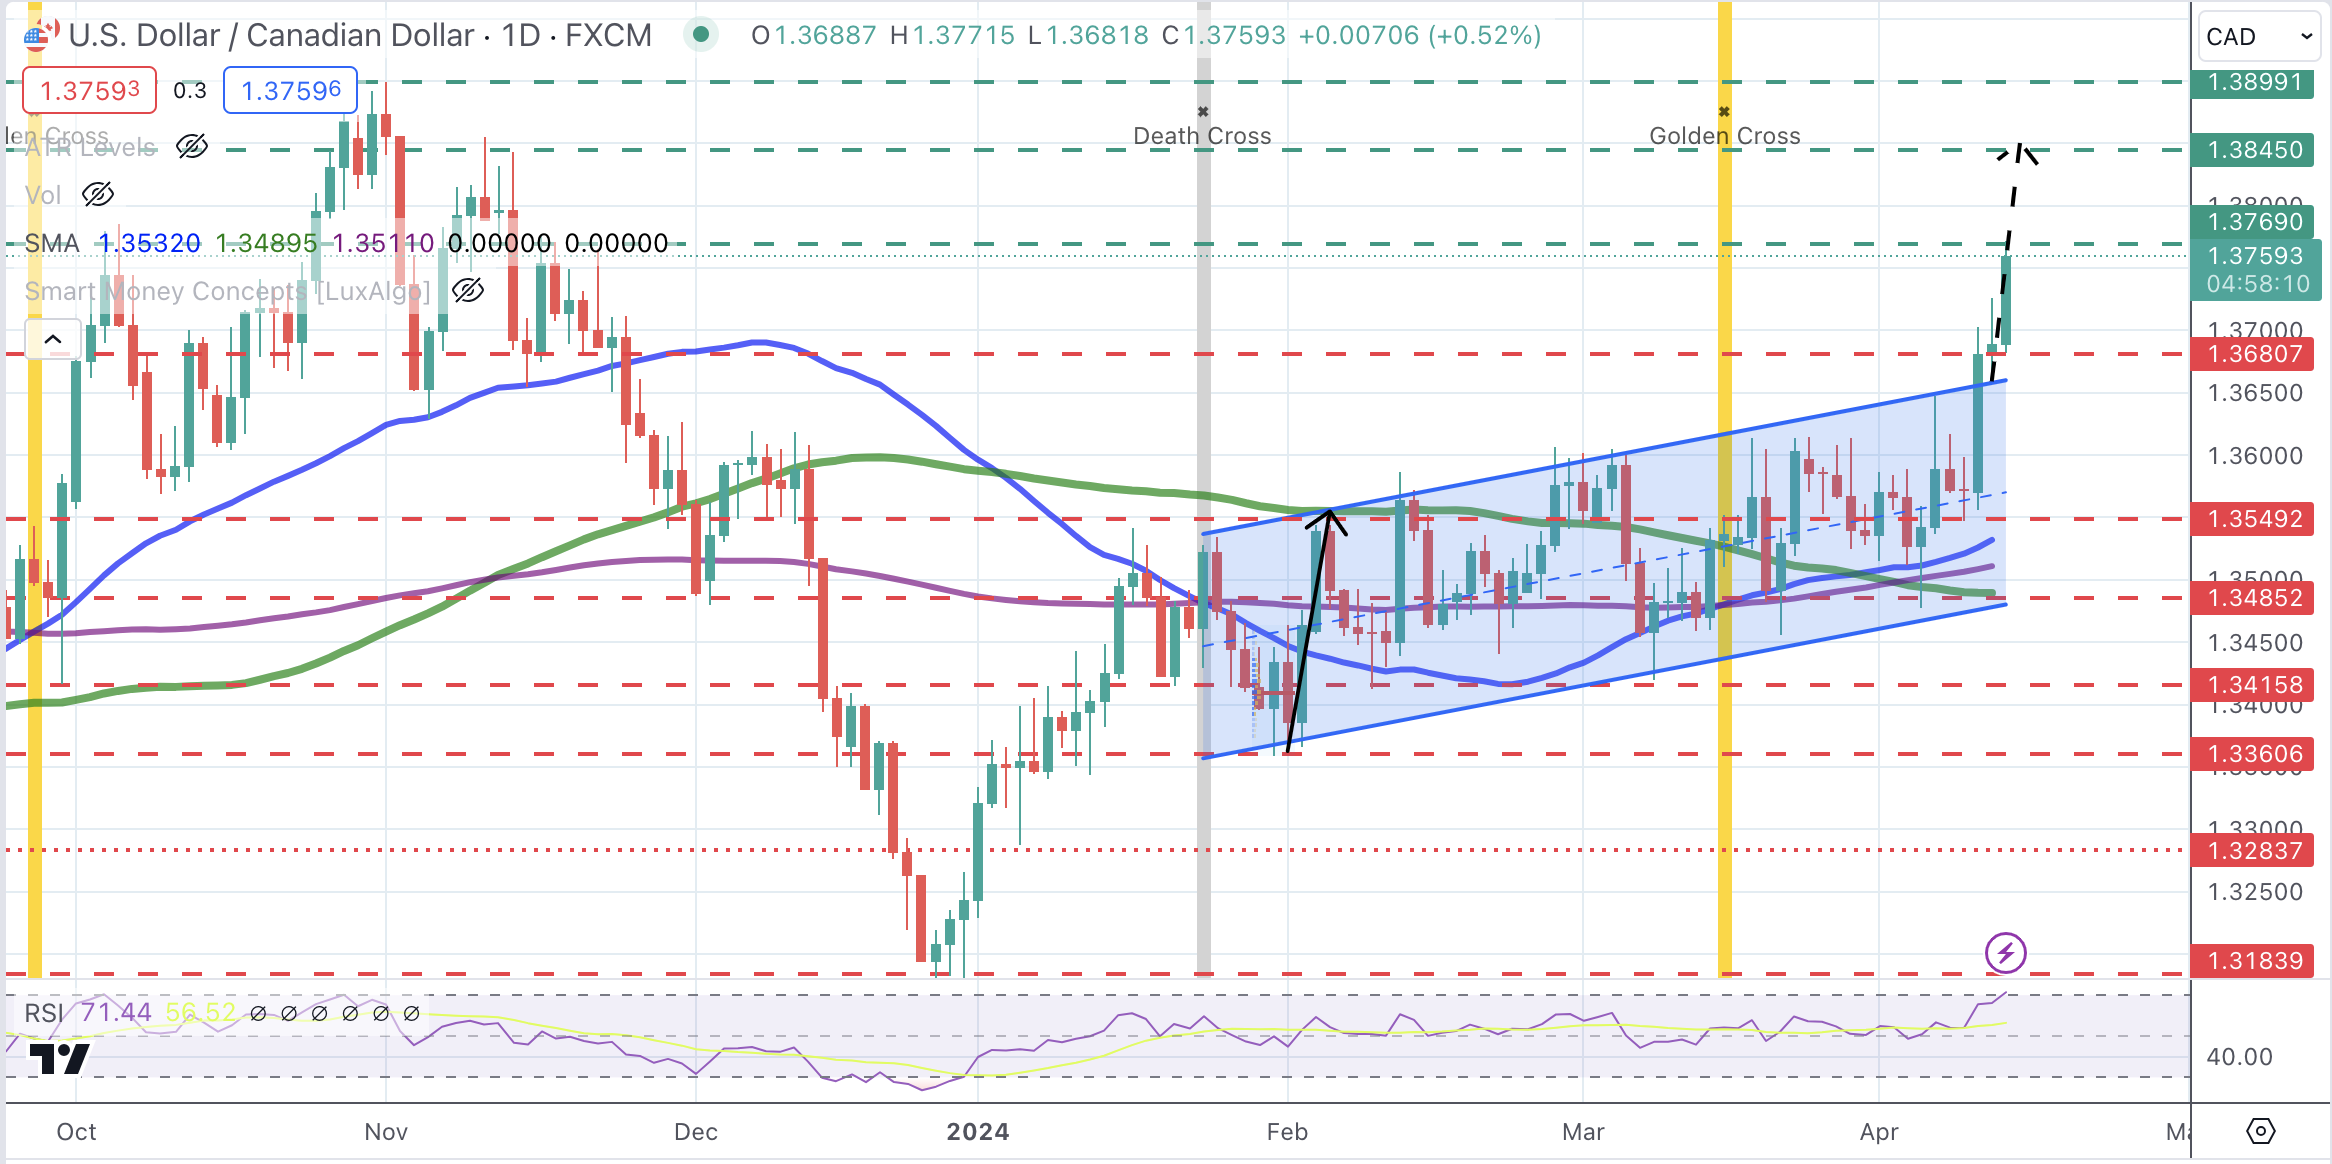
- Canadian Dollar dives further with the USD rallying across the board.
- The CAD has depreciated about 1.23% this week, on its worst weekly performance in almost a year.
- USD/CAD is on a steady bullish trend, focusing on 1.3770 and 1.3845
The Canadian Dollar (CAD) is selling off for the third day in a row on Friday, on track to post its worst weekly performance in almost a year. The US Dollar is marching higher, fueled by higher US yields, as the market reassesses the timing and the size of the US Federal Reserve’s (Fed) easing cycle.
The Michigan Consumer Sentiment Index deteriorated beyond expectations, although the Consumer Inflation Expectations have ticked up. These data have failed to weigh on the US Dollar, which has received additional support from the European Central Bank’s (ECB) dovish monetary policy statement.
Somewhat earlier, on Friday, Boston Fed President Susan Collins anticipated a delay on the monetary easing kick-off, hinting at September, and pointed to just two cuts in 2024.
Daily digest market movers: USD/CAD remains firm with investors reassessing Fed easing expectations
- Canadian Dollar keeps heading south and is on track to a 1.25% sell-off this week, its worst weekly performance since May 2023.
- US Michigan Consumer Sentiment Index declined to 77.9 in April from 79.4 in March. The market had anticipated a 79.0 reading.
- University of Michigan Consumer 5-year Inflation Expectations have ticked up to 3% from 2.8% in April.
- US 10-year yields have pulled back from highs, although they remain above the key 4.5% level, their highest levels since last November.
- Investors have trimmed their Fed easing expectations to 60 basis points in 2024 from the 150 basis points foreseen in January. The first rate cut is expected only in September. This is acting as a tailwind for the US Dollar.
- Later today Fed’s Schmid, Bostic, and Daly, all in the hawkish side of the committee are meeting the press. They might provide further support for the USD.
Canadian Dollar price this week
The table below shows the percentage change of Canadian Dollar (CAD) against listed major currencies this week. Canadian Dollar was the weakest against the US Dollar.
| USD | EUR | GBP | CAD | AUD | JPY | NZD | CHF | |
| USD | 1.66% | 1.32% | 1.11% | 1.42% | 0.94% | 0.91% | 0.94% | |
| EUR | -1.69% | -0.34% | -0.58% | -0.23% | -0.74% | -0.76% | -0.73% | |
| GBP | -1.35% | 0.34% | -0.22% | 0.10% | -0.39% | -0.42% | -0.39% | |
| CAD | -1.12% | 0.56% | 0.22% | 0.33% | -0.16% | -0.19% | -0.17% | |
| AUD | -1.43% | 0.26% | -0.09% | -0.32% | -0.48% | -0.50% | -0.49% | |
| JPY | -0.94% | 0.73% | 0.41% | 0.18% | 0.50% | 0.00% | 0.01% | |
| NZD | -0.93% | 0.73% | 0.41% | 0.18% | 0.50% | 0.02% | 0.03% | |
| CHF | -0.96% | 0.71% | 0.37% | 0.16% | 0.49% | -0.01% | -0.04% |
The heat map shows percentage changes of major currencies against each other. The base currency is picked from the left column, while the quote currency is picked from the top row. For example, if you pick the Euro from the left column and move along the horizontal line to the Japanese Yen, the percentage change displayed in the box will represent EUR (base)/JPY (quote).
Technical analysis: USD/CAD keeps marching higher, with 1.3770 and 1.3845 in the bulls’ focus
The US Dollar is under a strong bullish momentum after confirming above the last two months’ channel top with no sight of a trend shift.
The reverse trendline has provided support, triggering another bull run to the 1.3770 resistance area, which has been tested on Friday. The USD/CAD pair is at overbought levels but not at extremes, with the measured target of the broken channel at the mid-November high of 1.3845. On the downside, supports are 1.3680-1.3660 and below here, at 1.3545.
USD/CAD Daily Chart
Central banks FAQs
Central Banks have a key mandate which is making sure that there is price stability in a country or region. Economies are constantly facing inflation or deflation when prices for certain goods and services are fluctuating. Constant rising prices for the same goods means inflation, constant lowered prices for the same goods means deflation. It is the task of the central bank to keep the demand in line by tweaking its policy rate. For the biggest central banks like the US Federal Reserve (Fed), the European Central Bank (ECB) or the Bank of England (BoE), the mandate is to keep inflation close to 2%.
A central bank has one important tool at its disposal to get inflation higher or lower, and that is by tweaking its benchmark policy rate, commonly known as interest rate. On pre-communicated moments, the central bank will issue a statement with its policy rate and provide additional reasoning on why it is either remaining or changing (cutting or hiking) it. Local banks will adjust their savings and lending rates accordingly, which in turn will make it either harder or easier for people to earn on their savings or for companies to take out loans and make investments in their businesses. When the central bank hikes interest rates substantially, this is called monetary tightening. When it is cutting its benchmark rate, it is called monetary easing.
A central bank is often politically independent. Members of the central bank policy board are passing through a series of panels and hearings before being appointed to a policy board seat. Each member in that board often has a certain conviction on how the central bank should control inflation and the subsequent monetary policy. Members that want a very loose monetary policy, with low rates and cheap lending, to boost the economy substantially while being content to see inflation slightly above 2%, are called ‘doves’. Members that rather want to see higher rates to reward savings and want to keep a lit on inflation at all time are called ‘hawks’ and will not rest until inflation is at or just below 2%.
Normally, there is a chairman or president who leads each meeting, needs to create a consensus between the hawks or doves and has his or her final say when it would come down to a vote split to avoid a 50-50 tie on whether the current policy should be adjusted. The chairman will deliver speeches which often can be followed live, where the current monetary stance and outlook is being communicated. A central bank will try to push forward its monetary policy without triggering violent swings in rates, equities, or its currency. All members of the central bank will channel their stance toward the markets in advance of a policy meeting event. A few days before a policy meeting takes place until the new policy has been communicated, members are forbidden to talk publicly. This is called the blackout period.
- Mexican Peso faces sharp decline as geopolitical risks escalate, hawkish comments from Boston Fed's Susan Collins weigh on market mood.
- Speculations of imminent Iranian attack on Israel prompt flight to safety.
- Fed's Susan Collins revises rate cut expectations, suggesting a cautious approach to monetary easing.
The Mexican Peso plummets sharply against the US Dollar on Friday amid a risk-off impulse on speculation that Iran might attack Israel over the weekend. Alongside surprisingly hawkish comments by Boston Federal Reserve President Susan Collins, these worries derailed the emerging market currency, which could end the week with losses. The USD/MXN trades at 16.68, after hitting a daily low of 16.40, up 1.50%.
US equities are tumbling as sentiment sours. According to CBS News, Israel is bracing for a direct attack on its soil by Iran in retaliation for a strike that killed seven Iranian military officers two weeks ago.
Elsewhere, Boston Fed President Susan Collins said that due to the latest inflation numbers, she expects the Federal Reserve (Fed) to make its first rate cut later than previously thought. She added that she foresees two rate cuts this year instead of the three projected in the Federal Open Market Committee (FOMC) Summary of Economic Projections (SEP).
Daily digest market movers: Mexican Peso falls on risk aversion
- According to CBS News, two US officials commented “that a major Iranian attack against Israel was expected as soon as Friday, possibly to include more than 100 drones and dozens of missiles aimed at military targets inside the country.”
- The University of Michigan's preliminary April Consumer Sentiment deteriorated to 7.9, below estimates of 79.0. Inflation expectations for one year rose to 3.1% from forecasts and the previous reading of 2.9%. For five years, they increased from 2.8% to 3.0%.
- Mexico’s economic docket was scarce on Friday, though crucial data was revealed during the week. On Tuesday, Mexico's Consumer Price Index (CPI) continued its disinflation trend, with both the overall and core CPI decelerating monthly and yearly. This supported the Bank of Mexico's (Banxico) decision to lower interest rates on March 21, although the yearly CPI slightly exceeded expectations.
- On Thursday, Mexico’s Industrial Production dipped by 0.1% MoM in February, falling short of the expected 0.3% growth. However, it increased by 3.3% in the twelve months to February, missing forecasts by a narrow margin.
- Across the border, US inflation data was revealed. On Wednesday, US CPI data indicated higher-than-expected inflation, while underlying CPI, excluding food and energy, was steady compared to February’s figures. On Thursday, prices paid by producers, also known as the Producer Price Index (PPI), decreased on monthly and annual figures from the previous month.
- Initial jobless claims for the week ending April 6 were 211K, lower than the anticipated 215K and the previous week's 222K.
- This data, coupled with Wednesday's inflation report showing a monthly CPI rise of 0.4% and a yearly increase of 3.5%, has led traders to anticipate two rate cuts by the Federal Reserve in 2024. Data from the Chicago Board of Trade indicates the fed funds rate is expected to finish the year at 4.92%.
Technical analysis: Mexican Peso succumbs to the Greenback, USD/MXN rallies toward 16.60s
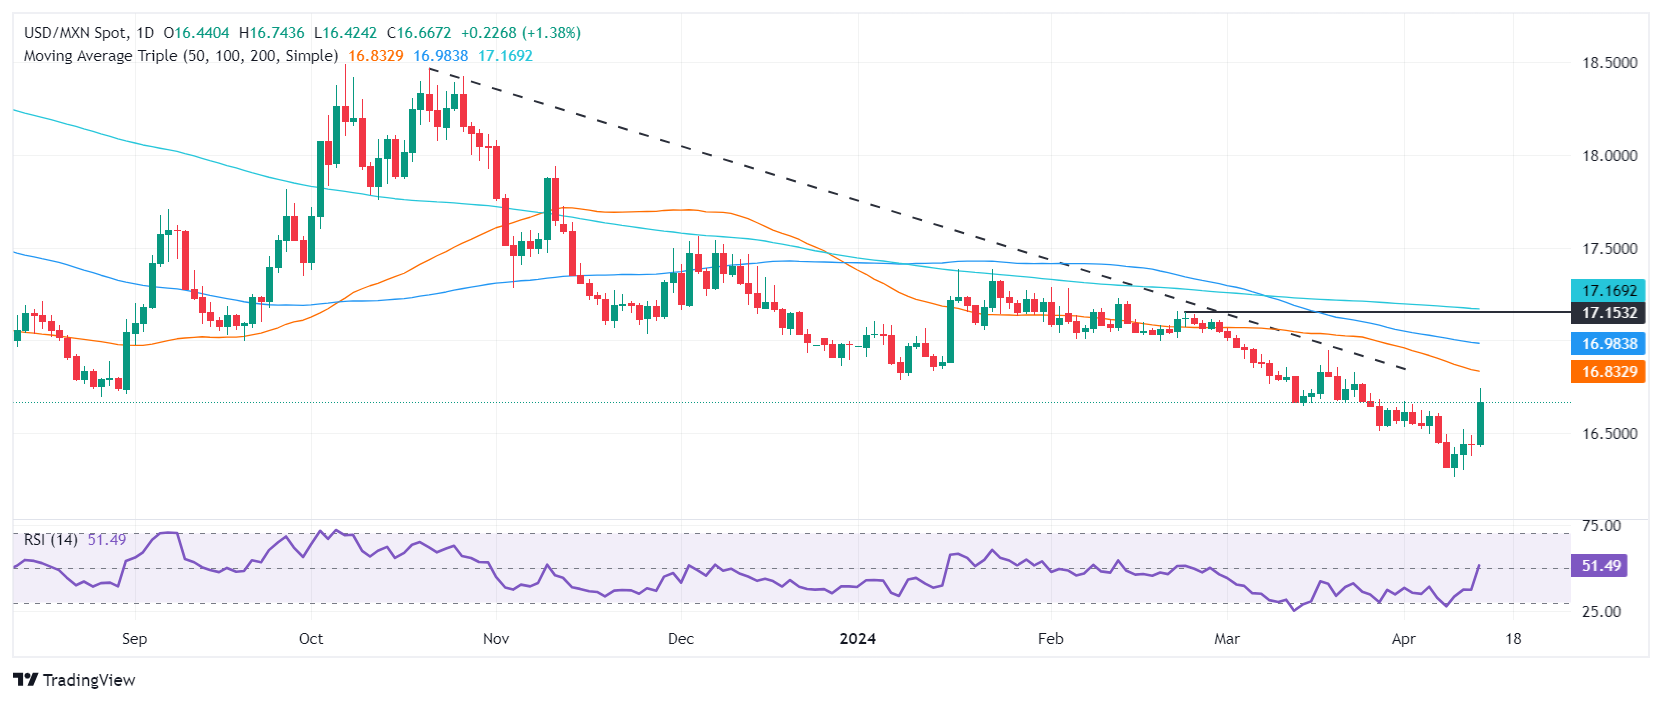
The USD/MXN remains downwardly biased despite printing a leg up toward the 16.70 area. Although buyers have lifted the exchange rate to current levels, they must reclaim the 50-day Simple Moving Average (SMA) at 16.82 to have a chance of challenging the 17.00 figure. Once those two levels are cleared, the next stop would be the 200-day SMA at 17.16 before aiming toward the psychological 17.50 mark.
On the other hand, if the USD/MXN tumbles below 16.50, that could pave the way to challenging October’s 2015 low of 16.32 before retesting the year-to-date (YTD) low of 16.25.
Mexican Peso FAQs
The Mexican Peso (MXN) is the most traded currency among its Latin American peers. Its value is broadly determined by the performance of the Mexican economy, the country’s central bank’s policy, the amount of foreign investment in the country and even the levels of remittances sent by Mexicans who live abroad, particularly in the United States. Geopolitical trends can also move MXN: for example, the process of nearshoring – or the decision by some firms to relocate manufacturing capacity and supply chains closer to their home countries – is also seen as a catalyst for the Mexican currency as the country is considered a key manufacturing hub in the American continent. Another catalyst for MXN is Oil prices as Mexico is a key exporter of the commodity.
The main objective of Mexico’s central bank, also known as Banxico, is to maintain inflation at low and stable levels (at or close to its target of 3%, the midpoint in a tolerance band of between 2% and 4%). To this end, the bank sets an appropriate level of interest rates. When inflation is too high, Banxico will attempt to tame it by raising interest rates, making it more expensive for households and businesses to borrow money, thus cooling demand and the overall economy. Higher interest rates are generally positive for the Mexican Peso (MXN) as they lead to higher yields, making the country a more attractive place for investors. On the contrary, lower interest rates tend to weaken MXN.
Macroeconomic data releases are key to assess the state of the economy and can have an impact on the Mexican Peso (MXN) valuation. A strong Mexican economy, based on high economic growth, low unemployment and high confidence is good for MXN. Not only does it attract more foreign investment but it may encourage the Bank of Mexico (Banxico) to increase interest rates, particularly if this strength comes together with elevated inflation. However, if economic data is weak, MXN is likely to depreciate.
As an emerging-market currency, the Mexican Peso (MXN) tends to strive during risk-on periods, or when investors perceive that broader market risks are low and thus are eager to engage with investments that carry a higher risk. Conversely, MXN tends to weaken at times of market turbulence or economic uncertainty as investors tend to sell higher-risk assets and flee to the more-stable safe havens.
- The UoM Sentiment Index slipped to 77.9, indicating a weakening in US consumer confidence.
- The US Dollar seems to consolidate weekly gains following hot inflation data.
- The Greenback will close a 1.60% winning week.
The USD/JPY pair, currently trading at 152.95 with a modest loss of 0.17%. Despite a drop in consumer confidence in the US, indicated by the University of Michigan's (UoM) Consumer Sentiment Index the Greenback will close a winning week, on the back of hot inflation data reported on Wednesday and Thursday.
Consumer confidence in the US weakened in early April, with the UoM's Consumer Sentiment Index edging lower to 77.9 from 79.4 in March. This reading came in below the market expectation of 79. The Current Conditions Index declined to 79.3 from 82.5 and the Consumer Expectations Index fell to 77 from 77.4. The details of the survey also revealed that the one-year inflation outlook climbed to 3.1% from 2.9% in April, while the five-year inflation outlook rose to 3% from 2.8%.
That being said, the US Bureau of Labor Statistics revealed a rise in inflation this week, with the Consumer Price Index (CPI), rising to 3.5% year-over-year in March, up from February's 3.2%. The core CPI, also increased to 3.8% Yoy, matching February's level. In that sense, hot inflation figures fueled a sharp rise in hawkish bets on the Federal Reserve (Fed) and in the US Treasury yields which benefited the USD during the week. As for now, markets seem to have given up on the hopes of a June rate cut and if data validated those bets, the USD may see further upside. Next Monday, the US will release Retail Sales figures from March.
USD/JPY technical analysis
On the daily chart, the USD/JPY pair reveals a sustained trend in positive territory on the Relative Strength Index (RSI). Even with the slight decrease observed back below 70, the dominant trend is bullish and buyers just seem to be correcting overbought conditions. Simultaneously, a reading of green bars on the Moving Average Convergence Divergence (MACD) histogram consolidates the buying momentum thesis.
USD/JPY daily chart
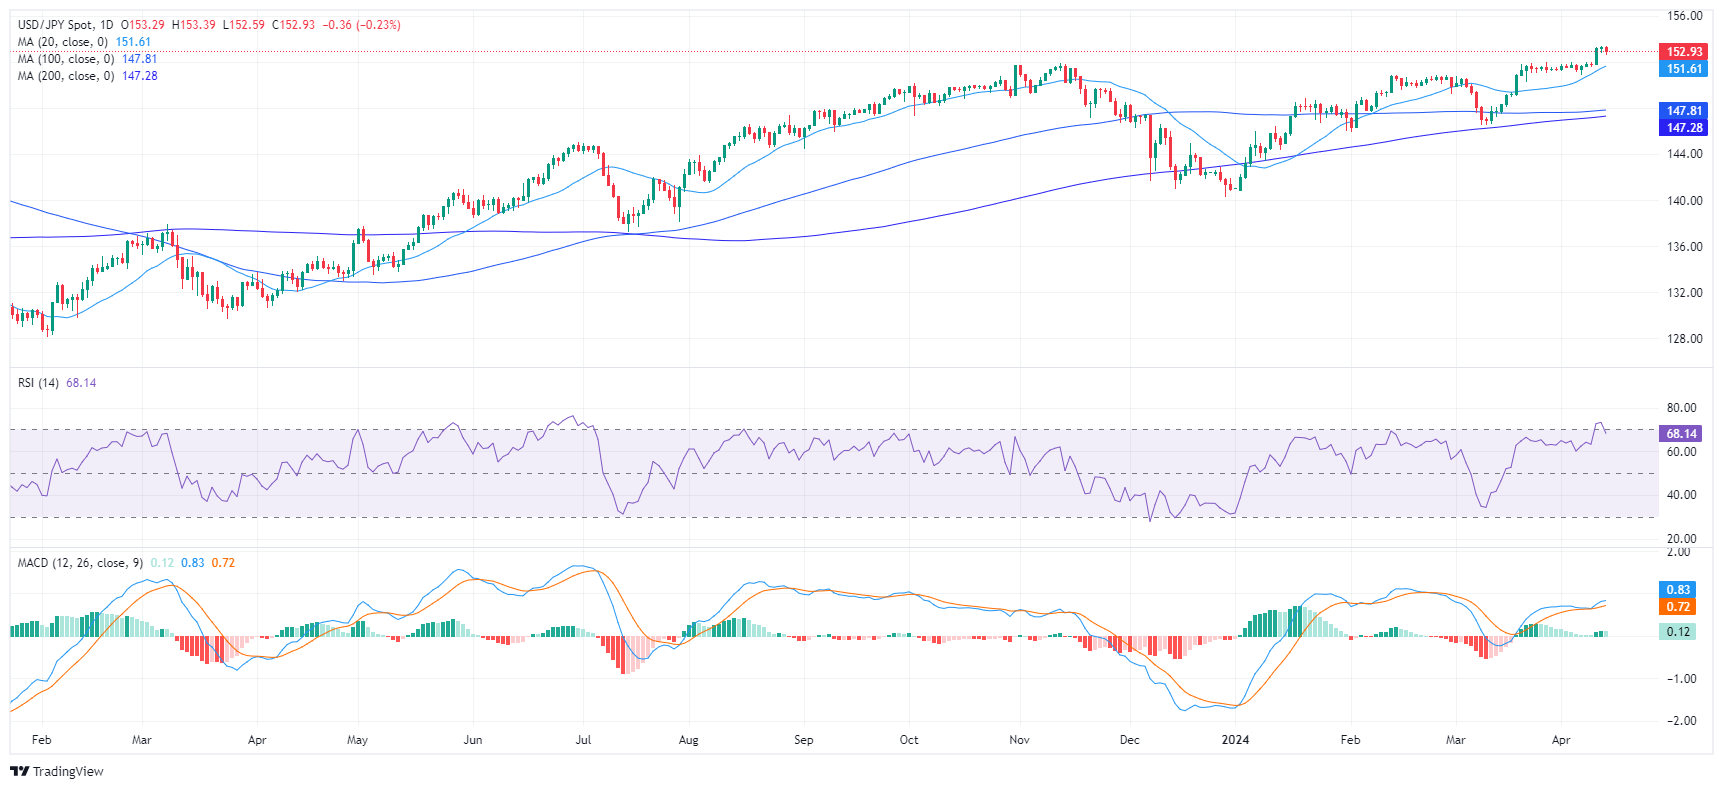
On examining the broader outlook, the USD/JPY reveals a bullish posture. The pair's position above the 20-day, 100-day, and 200-day Simple Moving Average (SMA) portrays a positive short-term and long-term trend.
Analysts at ABN Amro share an update to their Federal Reserve (Fed) policy outlook following the latest inflation data.
Total of three 25bp cuts expected in 2024
"We now expect the Fed to start cutting rates in July (previously June), with a pause in September, and a total of three 25bp cuts expected in 2024 (previously five). Rates are expected to fall to the estimated neutral level of 3% by November 2025."
"We do not think the Fed is wedded to changing policy in quarterly projection months, and nor do we think the election timing is a significant factor. Our ECB view is unchanged; it would take a much sharper move in the euro to affect ECB cuts. Rates forecast update: The change in Fed view raises our near-term short-end yield forecasts for the US, but long-end yield forecasts are much less impacted. Our euro rates forecasts are mostly unchanged."
- Consumer confidence in the US weakened in early April.
- UoM survey showed one-year and five-year inflation expectations edged higher.
Consumer confidence in the US weakened in early April, with the University of Michigan's Consumer Sentiment Index edging lower to 77.9 from 79.4 in March. This reading came in below the market expectation of 79.
The Current Conditions Index declined to 79.3 from 82.5 and the Consumer Expectations Index fell to 77 from 77.4.
The details of the survey revealed that the one-year inflation outlook climbed to 3.1% from 2.9% in April, while the five-year inflation outlook rose to 3% from 2.8%.
Market reaction
The US Dollar preserves its strength after this report. At the time of press, the US Dollar Index was up 0.65% on the day at 105.95.
Reviewing the European Central Bank's (ECB) monetary policy announcements following the April meeting, Rabobank analysts noted that the ECB gave some strong hints that there will be a reduction in the policy rate in June.
ECB is now more concerned of falling behind the curve
"Although persistent price pressures in services remain somewhat of a concern, this doesn’t appear to be in the way of a first cut at the next policy meeting. As we explain here, the Council seems to have made up its mind now that i) the data (in the form of a weak economy and disinflationary forces) have continued to move in the right direction and that ii) a few cuts (let’s start with one) would still keep policy sufficiently restrictive so as to not derail the disinflation process."
"Despite its mantra of ‘data dependence’ and inflation not having reached its target yet, the Council seems pretty convinced that a cut would be appropriate. “We will not wait for everything to be 2% before we cut”, captures the idea that ECB is now more concerned of falling behind the curve at some point than making an policy error by easing too quickly and sustaining the stickiness services inflation and/or tightness in the labor market. But by emphasizing its data dependence and that it is not pre-committing to any kind of easing trajectory, it probably believes that it can keep the risk of that second scenario materializing at an acceptable level."
Analysts at TD Securities assess the latest Gross Domestic Product (GDP) data from the UK.
Quarterly GDP on track to surprise the MPC to the upside
"UK GDP rose 0.1% m/m in February, following an upwardly revised 0.3% m/m expansion in January. While both hospital and food services fell sharply, as we expected, a notable 6.5% m/m surge in “land transport services and transport services via pipelines” coupled with a 1.5% m/m rise in telecommunications were enough to drive up services 0.1% m/m. Moreover, a sharp 1.2% m/m increase in manufacturing output also helped drive the upside surprise, largely on the back of transport equipment, which rose by 3.7% m/m."
"Overall, the better than projected increase in February together with a 0.1ppts upside revision to the January data leaves quarterly GDP on track to surprise the MPC to the upside in Q1 (BoE: 0.1% q/q)."
Nick Kounis, Head of Financial Markets and Sustainability Research at ABN Amro, notes that the European Central Bank (ECB) President asserted that while the Governing Council would be ‘data dependent’ it was ‘not Fed dependent.’
ECB will cut policy rates at each and every meeting from June on wards
"Overall, we think the ECB’s communication is consistent with a start of a rate cut cycle at the June Governing Council meeting. A large majority of officials seemed to be minded to support a June rate cut and the ‘few’ that did not thought that the data already justified a decision at this meeting. Looking further forward, the ECB would not pre-commit ‘to a particular rate path’ but would ‘follow a data-dependent and meeting-by-meeting approach’."
"Our own base case is that the ECB will cut policy rates at each and every meeting from June onwards. We take the view that interest rates are currently deeply in restrictive territory. Estimates of the neutral rate are half or less than the current level of the deposit rate. Given that the eurozone economy has been stagnating for more than a year, the only justification for restrictive monetary policy has been above-target inflation. However, the inflation picture is changing fast. Even assuming 125bp of rate cuts this year, monetary policy would still be restrictive at the end of 2024."
- GBP/USD plunges below 1.2500 as faded Fed rate cut hopes strengthen the US Dollar.
- The market sentiment is risk-off as the Fed is expected to delay rate cuts later this year.
- The UK economy is on course to come out of a technical recession.
The GBP/USD pair dips below the psychological support of 1.2500 in Friday’s London session. The Cable weakens due to firm US Dollar. The demand for the US Dollar remains buoyant as stubbornly higher United States inflation data for March forced traders to price out market expectations for rate cuts by the Federal Reserve (Fed), which were anticipated in the June and July meetings.
The market sentiment is downbeat as the Fed is now projected to start reducing interest rates from the September meeting. Also, investors expect that there will be only two rate cuts this year instead of three. There were expectations of six rate cuts at the start of the year.
S&P 500 futures have generated some losses in the European session. The US Dollar Index (DXY) rallies to near 106.00 amid hopes that the Fed will begin reducing interest rates later than other central banks from developed economies. 10-year US Treasury yields fell slightly from four-month high around 4.60%.
Going forward, the US Dollar will be guided by the monthly Retail Sales data of March which will be published on Friday. The monthly Retail Sales data that represents households’ spending is forecasted to have grown at a slower pace of 0.3% from the former reading of 0.6%. This would ease fears of inflation remaining persistently higher.
On the United Kingdom front, the Pound Sterling fails to find bid despite upbeat factory data and expected increase in monthly Gross Domestic Product (GDP) for February. The UK GDP expanded by 0.1% as expected after rising 0.2% in January. Proof of expansion in first two months indicate that the technical recession recorded in the second half of 2023 was shallow.
Next week, the US Consumer Price Index (CPI) and labor market data will significantly influence speculation for the Bank of England (BoE) to begin reducing interest rates, which financial markets are currently expecting from August.
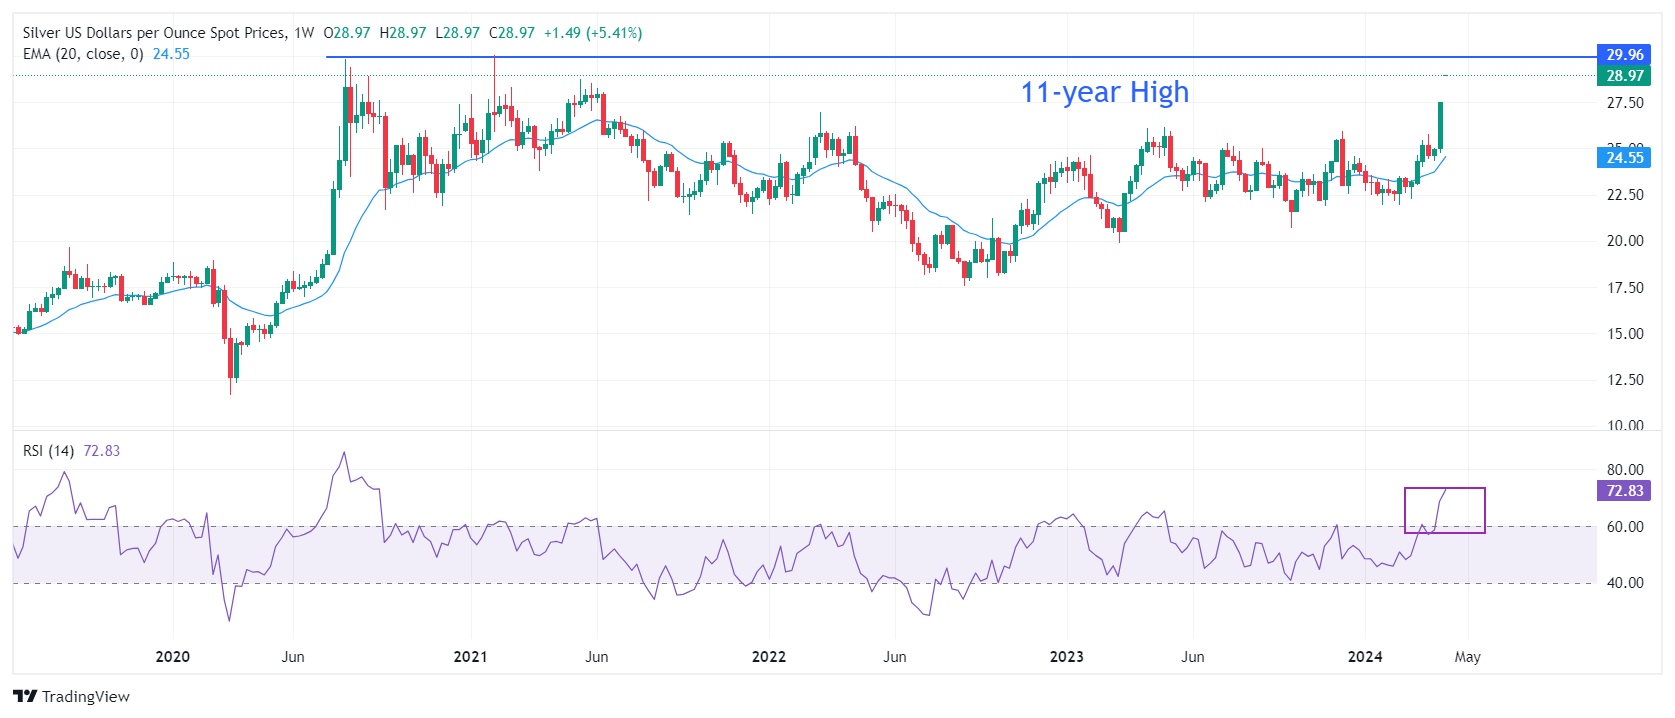
- Silver price rallies to $29, boosted by safe-haven demand due to geopolitical tensions.
- A decline in US yields has reinforced demand for non-yielding assets.
- The US Dollar advances as speculation for Fed rate cuts wanes.
Silver price (XAG/USD) looks set for a positive weekly close for the third time in a row. The precious metal strengthens as geopolitical tensions and China’s weak economic outlook strengthen safe-haven demand.
Iran promised to retaliate against Israel’s air strike on their embassy near Damascus in which seven members of its Islamic Revolutionary Guard Corps (IRGC), including two generals, were killed. The war situation in Gaza between Israel and Palestine could further escalate after the direct intervention of Iran. Meanwhile, the Israeli administration vowed to invade Rafah where displaced Palestinians have been sheltered. Investors channel their funds into non-yielding assets, such as Silver, amid geopolitical uncertainty.
Meanwhile, a sharp decline in US Treasury yields has reduced the opportunity cost of investment in non-yielding assets. 10-year US Treasury yields retreat to 4.55% from a more than four-month high of 4.60%. The US Dollar Index (DXY) is an inch away from recapturing a five-month high at 106.00.
The US Dollar strengthens as stubbornly higher consumer price inflation and strong Nonfarm Payrolls (NFP) data for March have forced traders to unwind their bets leaned toward the Federal Reserve (Fed) to begin reducing interest rates in the June and July policy meetings. Now, investors see the Fed pivoting to rate cuts from September. Also, investors expect that the Fed will reduce interest rates only two times by the year-end instead of three projected by Fed policymakers in the latest dot plot.
Silver technical analysis
Silver price approaches an 11-month high near $30, plotted from 27 July 2020 high on a weekly timeframe. The long-term outlook is bullish as the 20-week Exponential Moving Average (EMA) at $24.56 is sloping higher. The 14-period Relative Strength Index (RSI) rises to 73.00, suggesting strong buying momentum. More upside remains favored amid the absence of divergence signals.
Silver weekly chart
- WTI trades back above $85 after whipsawing around it this week.
- Oil price rises near 1% despite EIA calls for a negative outlook on Oil demand.
- The US Dollar Index surges close to 106.00 and sets forth a fresh five-month high.
Oil prices are jumping higher again on Friday after the small 0.75% decline from Thursday. The move comes as commodities are soaring again fueled by geopolitical tensions and despite the fact that the US Dollar is stretching higher for a fourth straight day in a row this week. Meanwhile, the International Energy Agency (IEA) has cut its Oil demand forecast for this year and the next one, anticipating slower growth in 2025, due to a lacklustre economic outlook and the increasing market share of electric vehicles in the global car market
The US Dollar meanwhile is printing a staggering 1.8% rally in the US Dollar Index (DXY) after markets are increasingly expecting a bigger interest-rate differential between the Federal Reserve (Fed) and other central banks. This rate differential is separating the countries (and ergo the local currency) where central banks are in dire need to cut against countries from those countries where cuts are currently not needed. Robust US economic data points to the US as the leader of the countries where rate cuts under current conditions are not needed at all.
Crude Oil (WTI) trades at $85.63 and Brent Crude at $90.19 at the time of writing.
Oil news and market movers: IEA against OPEC
- The outlook for Oil demand from OPEC and IEA diverge substantially. While the IEA is calling for less demand in 2024 and 2025, OPEC on Thursday said it is watching summer demand very closely as it would not be able to handle any unforeseen uptick in demand.
- Furthermore in the IEA report from this Friday: more than 3 million barrels per day will be added coming from non-OPEC projects, with Brazil as the biggest contributor
- OPEC output increased by 110,000 barrels per day against February’s data. Saudi Arabia and Kuwait accounted for the small uptick, according to Bloomberg.
Oil Technical Analysis: Non-OPEC inflow
Oil prices remain elevated with tensions in the Middle East nearing a new dynamic. After Iran vowed to retaliate against Israel or any US asset in the region, tensions are getting high as such an attack could drag the whole region back into a long drawn-out dispute with the risk of Oil delivery disruptions. Meanwhile, the bearish IEA report said that Brazil soon will add substantially more non-OPEC Oil to the markets. Although Brazil was set to join OPEC from the beginning of this year, that inauguration still needs to happen.
If the high of last week at $87.12 gets broken, the $90 handle should come into grasp. One small barrier in the way is $89.64, the peak from October 20. In case of further escalating tensions in the Middle East, expect even $94 to become a possibility, and a fresh 18-month high could be on the cards.
On the downside, $83.34 is the first level to have a look for after a very clean break and test for support on April 1 and 2. Should it not hold, $80.63 is the next best candidate as a pivotal supportive level. A touch softer, the convergence with the 55-day and the 200-day Simple Moving Averages (SMAs) at $79.32 should halt any further downturn.
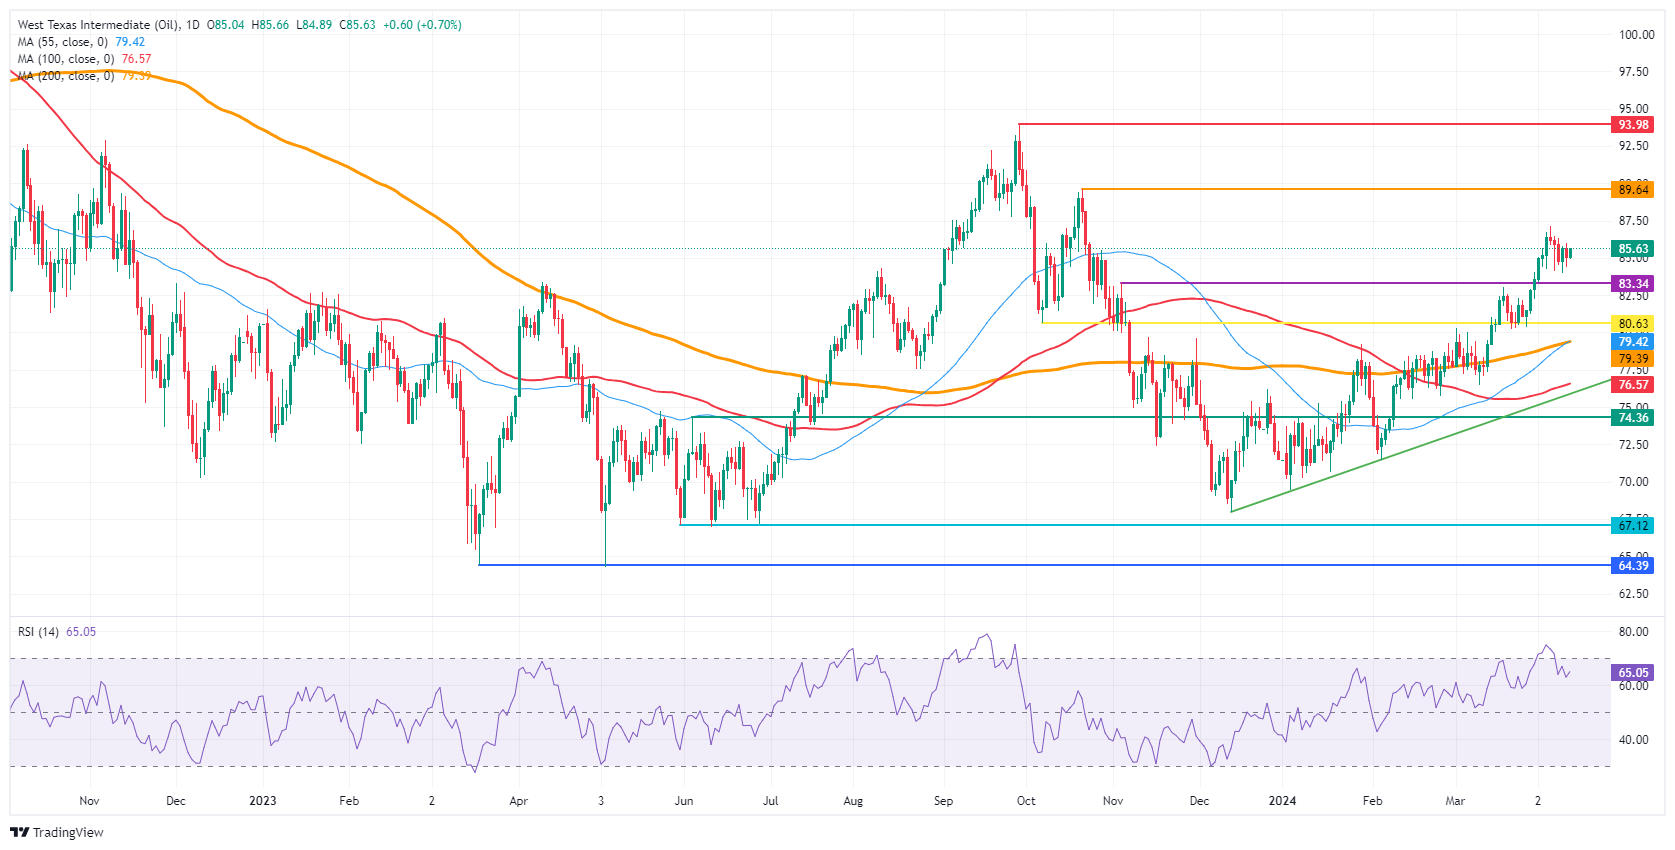
US WTI Crude Oil: Daily Chart
WTI Oil FAQs
WTI Oil is a type of Crude Oil sold on international markets. The WTI stands for West Texas Intermediate, one of three major types including Brent and Dubai Crude. WTI is also referred to as “light” and “sweet” because of its relatively low gravity and sulfur content respectively. It is considered a high quality Oil that is easily refined. It is sourced in the United States and distributed via the Cushing hub, which is considered “The Pipeline Crossroads of the World”. It is a benchmark for the Oil market and WTI price is frequently quoted in the media.
Like all assets, supply and demand are the key drivers of WTI Oil price. As such, global growth can be a driver of increased demand and vice versa for weak global growth. Political instability, wars, and sanctions can disrupt supply and impact prices. The decisions of OPEC, a group of major Oil-producing countries, is another key driver of price. The value of the US Dollar influences the price of WTI Crude Oil, since Oil is predominantly traded in US Dollars, thus a weaker US Dollar can make Oil more affordable and vice versa.
The weekly Oil inventory reports published by the American Petroleum Institute (API) and the Energy Information Agency (EIA) impact the price of WTI Oil. Changes in inventories reflect fluctuating supply and demand. If the data shows a drop in inventories it can indicate increased demand, pushing up Oil price. Higher inventories can reflect increased supply, pushing down prices. API’s report is published every Tuesday and EIA’s the day after. Their results are usually similar, falling within 1% of each other 75% of the time. The EIA data is considered more reliable, since it is a government agency.
OPEC (Organization of the Petroleum Exporting Countries) is a group of 13 Oil-producing nations who collectively decide production quotas for member countries at twice-yearly meetings. Their decisions often impact WTI Oil prices. When OPEC decides to lower quotas, it can tighten supply, pushing up Oil prices. When OPEC increases production, it has the opposite effect. OPEC+ refers to an expanded group that includes ten extra non-OPEC members, the most notable of which is Russia.
- USD/CAD jumps to 1.3735 as the Canadian Dollar weakens on dismal market sentiment.
- Investors turn risk-averse as trades priced out Fed rate cut hopes for June.
- BoC Macklen sees expectations for the Fed pivoting to rate cuts in June as reasonable.
The USD/CAD pair is advancing towards 1.3750 in Friday’s London session. The Loonie asset extends its winning spell for the third trading session as investors see the Federal Reserve (Fed) pivoting to rate cuts by the third quarter of this year.
Speculation about the Fed delivering rate cuts has waned as consumer price inflation in the United States turned sticky in March. Also, the core Producer Price Index (PPI) data, which shows an increase or decrease in the prices of goods and services, excluding food and energy prices, by owners at factory gates, remains hotter than expected. The annual core PPI grew by 2.4% from estimates of 2.3% and the prior reading of 2.0%.
For now, investors anticipate that the Fed could begin reducing interest rates after the September meeting. Also, investors expect that there will be two rate cuts instead of three, as projected by Fed policymakers in the latest dot plot.
Faded expectations for the Fed lowering interest rates from the June meeting have dented appeal for risk-sensitive assets. S&P 500 futures have posted some losses in the European session. The US Dollar Index (DXY) extends its upside to 105.85. The scenario of the Fed keeping interest rates higher for a longer period bodes well for the US Dollar.
On the Loonie front, the Canadian dollar has weakened due to firm market expectations that the Bank of Canada (BoC) will start lowering borrowing rates in June. After maintaining the status quo on Wednesday, BoC Governor Tiff Macklem said a rate cut in June is possible.
Going forward, expectations of more upside in global oil prices due to escalating geopolitical tensions could support the Canadian Dollar. Fears of Iran’s confrontation with Israel heightened after air strikes on the Iranian embassy in Damascus by the Israeli forces. Also, Israel is preparing to invade Rafae where displaced Palestinians have sheltered.
It is worth noting that Canada is the leading oil exporter to the United States, and higher oil prices support the Canadian Dollar.
- The US Dollar extends gains on Friday, trading at the strongest level since mid-November.
- Traders are pushing the Greenback higher as the interest-rate divergence between the Fed and other central banks looms large.
- The US Dollar Index rallies towards 106.00.
The US Dollar (USD) continues to strengthen on Friday and is set for the best week this year so far, snapping out of the tight bandwidth it had traded this 2024. Investors don’t seem to be taking profits despite the recent rally, which could mean that more US Dollar strength is on the cards for next week. The main driver for the move is the breakdown in European bonds, with yields sinking against very steady ones in the US, as the rate differential between both sides of the Atlantic expands.
On the economic data front, traders are starting to applaud good data under the label of US exceptionalism. Equities could well be set to rally as well despite higher interest rates, buying the idea that there is no landing taking place in the economy and that the current level of high rates is even good to keep it from overheating. The University of Michigan numbers this afternoon could build up a case further for the above narrative.
Daily digest market movers: All comes into play for USD
- The Import and Export Price Indexes data for March is due 12:30 GMT:
- The monthly Export Price Index is expected to increase 0.3%, down from 0.8% a month earlier. .
- The monthly Import Price Index is expected to grow 0.3%, steady from the previous month.
- The University of Michigan preliminary numbers for April will be released at 14:00 GMT:
- Consumer Sentiment is expected to decline a touch to 79 from 79.4.
- Inflation expectations were at 2.8% previous, with an uptick expected after the recent Consumer Price Index (CPI) numbers.
- Three US Federal Reserve Speakers take the stage later on Friday:
- At 17:00 GMT, Federal Reserve Bank of Kansas City President Jeffrey Schmid will deliver a keynote speech.
- Around 18:30 GMT, Federal Reserve Bank of Atlanta President Raphael Bostic delivers a speech on the Housing Crisis.
- Finally, at 19:30 GMT, Federal Reserve Bank of San Francisco President Mary Daly will participate in a debate at a Fintech Conference.
- European equities are jumping higher, with the inverse correlation in EUR/USD. Both the Dax and Stoxx 50 are up over 1%. US Futures are still looking for direction with hesitant buyers.
- The CME FedWatch Tool prices in a 93.4% probability of no changes in the policy rate for May 1. For now, odds are the highest for September 18 with a 44.7% chance of a first rate cut against 28.5% for an unchanged stance.
- The benchmark 10-year US Treasury Note trades around 4.54%, retreating a touch after hitting 4.59% overnight on Thursday.
US Dollar Index Technical Analysis: Game-changing moment for 2024
The US Dollar Index (DXY) performance shows that markets are still trembling after this week’s shocks. Hot US price pressures for a third consecutive month are quickly shifting Fed rate cut bets to later this year, breaking the governing dynamics for this year thus far.
From now on, it becomes clear that whichever central bank – and accordingly the currency – needs to start cutting its benchmark rate will face severe punity from markets. On the contrary, central banks keeping rates steadier for longer are likely to be rewarded with a further appreciation in their currency provided that their economy is robust despite the current high rate regimes. The pack is being split in half: while weaker economies are set to get their currencies exposed, stronger ones are expected to rally further.
On the upside, the first level for the DXY is the November 10 high at 106.01, just above the 106.00 figure. Further up and above the 107.00 round level, the DXY Index could meet resistance at 107.35, the October 3 high.
On the downside, fresh support levels need to be pencilled in as well, with the first important level at the 105.00 big figure. Further down, 104.60 should also act as a support, ahead of the region with both the 55-day and the 200-day Simple Moving Averages (SMAs) at 103.97 and 103.84, respectively.
Interest rates FAQs
Interest rates are charged by financial institutions on loans to borrowers and are paid as interest to savers and depositors. They are influenced by base lending rates, which are set by central banks in response to changes in the economy. Central banks normally have a mandate to ensure price stability, which in most cases means targeting a core inflation rate of around 2%. If inflation falls below target the central bank may cut base lending rates, with a view to stimulating lending and boosting the economy. If inflation rises substantially above 2% it normally results in the central bank raising base lending rates in an attempt to lower inflation.
Higher interest rates generally help strengthen a country’s currency as they make it a more attractive place for global investors to park their money.
Higher interest rates overall weigh on the price of Gold because they increase the opportunity cost of holding Gold instead of investing in an interest-bearing asset or placing cash in the bank. If interest rates are high that usually pushes up the price of the US Dollar (USD), and since Gold is priced in Dollars, this has the effect of lowering the price of Gold.
The Fed funds rate is the overnight rate at which US banks lend to each other. It is the oft-quoted headline rate set by the Federal Reserve at its FOMC meetings. It is set as a range, for example 4.75%-5.00%, though the upper limit (in that case 5.00%) is the quoted figure. Market expectations for future Fed funds rate are tracked by the CME FedWatch tool, which shapes how many financial markets behave in anticipation of future Federal Reserve monetary policy decisions.
Boston Federal Reserve (Fed) President Susan Collins said on Friday, she sees 'in the range of two' rate cuts for 2024.
Additional quotes
Still expecting inflation pressures to wane later this year.
Can’t pre-judge when the Fed can start cutting rates.
Sees progress in bolstering bank discount window access.
A rate hike not part of baseline but can’t be fully ruled out.
Market reaction
The US Dollar is paying little heed to the above comments, rising 0.51% on the day to trade at 105.85 against its major counterparts, as the Middle East geopolitical tensions escalate.
Fed FAQs
Monetary policy in the US is shaped by the Federal Reserve (Fed). The Fed has two mandates: to achieve price stability and foster full employment. Its primary tool to achieve these goals is by adjusting interest rates. When prices are rising too quickly and inflation is above the Fed’s 2% target, it raises interest rates, increasing borrowing costs throughout the economy. This results in a stronger US Dollar (USD) as it makes the US a more attractive place for international investors to park their money. When inflation falls below 2% or the Unemployment Rate is too high, the Fed may lower interest rates to encourage borrowing, which weighs on the Greenback.
The Federal Reserve (Fed) holds eight policy meetings a year, where the Federal Open Market Committee (FOMC) assesses economic conditions and makes monetary policy decisions. The FOMC is attended by twelve Fed officials – the seven members of the Board of Governors, the president of the Federal Reserve Bank of New York, and four of the remaining eleven regional Reserve Bank presidents, who serve one-year terms on a rotating basis.
In extreme situations, the Federal Reserve may resort to a policy named Quantitative Easing (QE). QE is the process by which the Fed substantially increases the flow of credit in a stuck financial system. It is a non-standard policy measure used during crises or when inflation is extremely low. It was the Fed’s weapon of choice during the Great Financial Crisis in 2008. It involves the Fed printing more Dollars and using them to buy high grade bonds from financial institutions. QE usually weakens the US Dollar.
Quantitative tightening (QT) is the reverse process of QE, whereby the Federal Reserve stops buying bonds from financial institutions and does not reinvest the principal from the bonds it holds maturing, to purchase new bonds. It is usually positive for the value of the US Dollar.
- EUR/USD slumps to 1.0660 as ECB rate cut bets for June strengthen.
- The US Dollar strengthens as the Fed is anticipated to start reducing interest rates later this year.
- Investors shift focus to the US Retail Sales data that will be published on Monday.
The EUR/USD pair extends its downside to near five-month low around 1.0660 in Friday’s European session. The major currency pair falls sharply on firm speculation that the European Central bank (ECB) will begin reducing interest rates from the June meeting.
The ECB kept its key borrowing rates unchanged on Thursday at 4.5% to maintain downward pressure on the consumer price inflation. In the monetary policy statement, the ECB said that restrictive financial conditions and interest rate hikes yet made are weighing on the overall demand and pushing downward pressure on inflation.
Also, the ECB said that it will remain data-dependent to determine how long interest rates are needed to remain restrictive. The central bank refrained from committing to any particular rate path.
The speculation for ECB pivoting to rate cuts from June strengthen after ECB President Christine Lagarde said that if a fresh assessment increased policymakers' confidence that inflation is heading back to target, then it "would be appropriate" to cut interest rates, Reuters reported.
Meanwhile, the market sentiment is downbeat as traders pare big bets leaning to Federal Reserve (Fed) beginning to reduce interest rates from the June meeting. S&P 500 futures have posted losses in the European session. 10-year US Treasury yields falls slightly after refreshing more than four-month high near 4.60%. The US Dollar Index (DXY), which tracks the US Dollar’s value against six major currencies, jumps to near five-month high around 106.00.
Going forward, investors will shift focus to the monthly Retail Sales data, which will be published on Monday. The Retail Sales data is a leading indicator of consumer spending. Higher Retail Sales suggests robust consumer spending, which leads to a stubborn inflation outlook.
Silver prices (XAG/USD) rose on Friday, according to FXStreet data. Silver trades at $29.11 per troy ounce, up 2.30% from the $28.46 it cost on Thursday.
Silver prices have increased by 14.29% since the beginning of the year.
| Unit measure | Today Price |
|---|---|
| Silver price per troy ounce | $29.11 |
| Silver price per gram | $0.94 |
The Gold/Silver ratio, which shows the number of troy ounces of Silver needed to equal the value of one troy ounce of Gold, stood at 82.27 on Friday, down from 83.37 on Thursday.
Investors might use this ratio to determine the relative valuation of Gold and Silver. Some may consider a high ratio as an indicator that Silver is undervalued – or Gold is overvalued – and might buy Silver or sell Gold accordingly. Conversely, a low ratio might suggest that Gold is undervalued relative to Silver.
Global Market Movers: Comex Silver price rises above $29 as buying remains unabated
- Comex Silver price keeps rallying, especially after the release of prices paid by producers in the United States (US) showed that factory inflation continues to decelerate, contrasting Wednesday’s red-hot Consumer Price Index (CPI).
- Investors capitalized on that, taking advantage of the dip in precious metals and lifting their prices near year-to-date peaks.
- Further, escalation in the geopolitical tensions between Israel and Iran offers support to the safe-haven Gold price, in turn, bolstering the Silver price rally.
(An automation tool was used in creating this post.)
Silver FAQs
Silver is a precious metal highly traded among investors. It has been historically used as a store of value and a medium of exchange. Although less popular than Gold, traders may turn to Silver to diversify their investment portfolio, for its intrinsic value or as a potential hedge during high-inflation periods. Investors can buy physical Silver, in coins or in bars, or trade it through vehicles such as Exchange Traded Funds, which track its price on international markets.
Silver prices can move due to a wide range of factors. Geopolitical instability or fears of a deep recession can make Silver price escalate due to its safe-haven status, although to a lesser extent than Gold's. As a yieldless asset, Silver tends to rise with lower interest rates. Its moves also depend on how the US Dollar (USD) behaves as the asset is priced in dollars (XAG/USD). A strong Dollar tends to keep the price of Silver at bay, whereas a weaker Dollar is likely to propel prices up. Other factors such as investment demand, mining supply – Silver is much more abundant than Gold – and recycling rates can also affect prices.
Silver is widely used in industry, particularly in sectors such as electronics or solar energy, as it has one of the highest electric conductivity of all metals – more than Copper and Gold. A surge in demand can increase prices, while a decline tends to lower them. Dynamics in the US, Chinese and Indian economies can also contribute to price swings: for the US and particularly China, their big industrial sectors use Silver in various processes; in India, consumers’ demand for the precious metal for jewellery also plays a key role in setting prices.
Silver prices tend to follow Gold's moves. When Gold prices rise, Silver typically follows suit, as their status as safe-haven assets is similar. The Gold/Silver ratio, which shows the number of ounces of Silver needed to equal the value of one ounce of Gold, may help to determine the relative valuation between both metals. Some investors may consider a high ratio as an indicator that Silver is undervalued, or Gold is overvalued. On the contrary, a low ratio might suggest that Gold is undervalued relative to Silver.
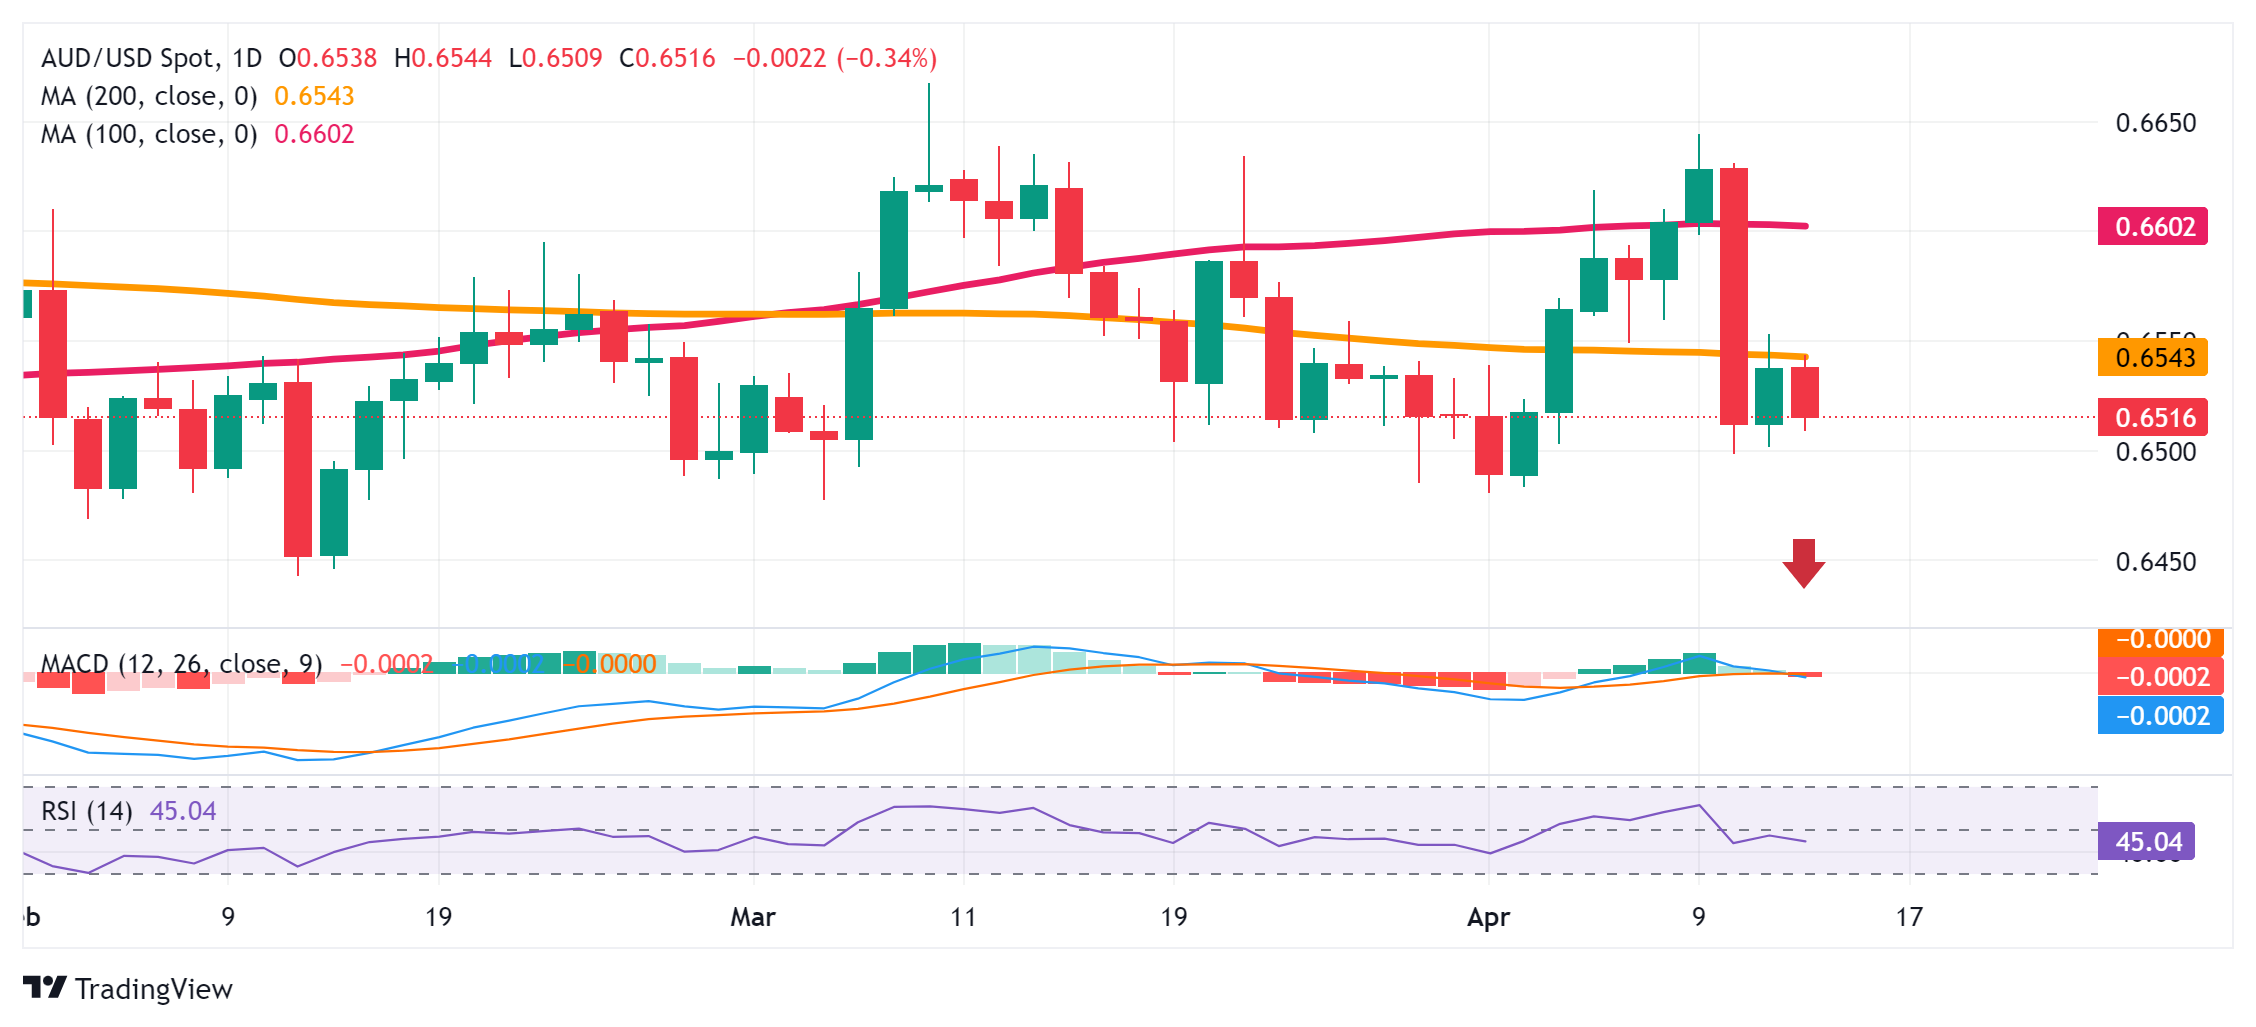
- AUD/USD meets with a fresh supply on Friday and drops back closer to the weekly low.
- Weaker Chinese trade data undermine the Aussie amid strong follow-through USD buying.
- The technical setup favours bearish traders and supports prospects for additional losses.
The AUD/USD pair comes under some renewed selling pressure on Friday and extends its steady intraday descent through the early part of the European session. Spot prices touch a fresh daily low following the release of weaker Chinese trade data, albeit manage to hold above the 0.6500 psychological mark and rebound a few pips in the last hour.
Any meaningful recovery, however, still seems elusive in the wake of strong follow-through US Dollar (USD) buying, bolstered by expectations that the Federal Reserve (Fed) will keep interest rates higher for longer amid sticky US inflation. Apart from this, persistent geopolitical tensions stemming from conflicts in the Middle East benefit the safe-haven Greenback and might further contribute to capping the risk-sensitive Aussie.
From a technical perspective, the AUD/USD pair, so far, has managed to defend the 0.6500 mark, which should now act as a key pivotal point. Given that oscillators on the daily chart have just started gaining negative traction, a convincing break below will be seen as a fresh trigger for bearish traders and set the stage for an extension of the recent sharp pullback from the 0.6645 area, or a one-month high touched earlier this week.
Some follow-through selling below the 0.6480 area, or the monthly low, will reaffirm the negative bias and allow the AUD/USD pair to aim back to challenge the YTD trough, around the 0.6445-0.6440 region touched in February. The downward trajectory could extend further towards the 0.6400 mark en route to the next relevant support near the 0.6355-0.6350 zone.
On the flip side, any attempted recovery is likely to confront stiff resistance near the 0.6545-0.6555 region, which coincides with the very important 200-day Simple Moving Average (SMA). This is followed by the 100-day SMA, currently pegged near the 0.6600 mark, above which a bout of a short-covering move has the potential to lift the AUD/USD pair back towards the 0.6640-0.6645 area, or the monthly swing high.
AUD/USD daily chart
The findings from the European Central Bank’s (ECB) Survey of Professional Forecasters (SPF) showed on Friday that all inflation forecasts across the time horizons are left unchanged from the previous round of the poll conducted three months earlier.
Key takeaways
Inflation is seen at 2.4% this year and 2.0% in 2025, 2026 and in the longer term.
Core inflation seen at 2.6% in 2024, 2.1% in 2025, 2.0% in 2026.
Revisions to economic growth forecasts were minimal, with GDP seen expanding by 0.5% this year, 1.4% next year and in 2026, and 1.3% thereafter.
Market reaction
EUR/USD remains under intense selling pressure so far this Friday, losing 0.45% to trade at 1.0675.
In its monthly oil market report published on Friday, the International Energy Agency (IEA) lowered the 2024 global oil demand growth forecast by 130,000 bpd to 1.2 million (mln) barrels per day (bpd).
Additional takeaways
Global observed oil inventories rose by 43.3 mln barrels in February to a seven-month high.
2024 global oil output set to rise by 770,000 bpd to 102.9 mln bpd, led by non-OPEC+ and the US.
Sees 2025 oil demand growth at 1.1 mln bpd due to sub-par economic outlook of 2.9% GDP growth next year.
China's share of global oil demand increase will slump from 79% in 2023 to 45% in 2024 and 27% in 2025.
China’s 2023 post-covid release of pent-up demand has effectively run its course.
Warm weather curtailed OECD heating fuel use and factory slump in advanced economies hit industrial fuel demand.
Market reaction
At the time of writing, WTI is challenging intraday highs at $85.50, up 0.34% on the day.
WTI Oil FAQs
WTI Oil is a type of Crude Oil sold on international markets. The WTI stands for West Texas Intermediate, one of three major types including Brent and Dubai Crude. WTI is also referred to as “light” and “sweet” because of its relatively low gravity and sulfur content respectively. It is considered a high quality Oil that is easily refined. It is sourced in the United States and distributed via the Cushing hub, which is considered “The Pipeline Crossroads of the World”. It is a benchmark for the Oil market and WTI price is frequently quoted in the media.
Like all assets, supply and demand are the key drivers of WTI Oil price. As such, global growth can be a driver of increased demand and vice versa for weak global growth. Political instability, wars, and sanctions can disrupt supply and impact prices. The decisions of OPEC, a group of major Oil-producing countries, is another key driver of price. The value of the US Dollar influences the price of WTI Crude Oil, since Oil is predominantly traded in US Dollars, thus a weaker US Dollar can make Oil more affordable and vice versa.
The weekly Oil inventory reports published by the American Petroleum Institute (API) and the Energy Information Agency (EIA) impact the price of WTI Oil. Changes in inventories reflect fluctuating supply and demand. If the data shows a drop in inventories it can indicate increased demand, pushing up Oil price. Higher inventories can reflect increased supply, pushing down prices. API’s report is published every Tuesday and EIA’s the day after. Their results are usually similar, falling within 1% of each other 75% of the time. The EIA data is considered more reliable, since it is a government agency.
OPEC (Organization of the Petroleum Exporting Countries) is a group of 13 Oil-producing nations who collectively decide production quotas for member countries at twice-yearly meetings. Their decisions often impact WTI Oil prices. When OPEC decides to lower quotas, it can tighten supply, pushing up Oil prices. When OPEC increases production, it has the opposite effect. OPEC+ refers to an expanded group that includes ten extra non-OPEC members, the most notable of which is Russia.
- A combination of factors prompts fresh selling around NZD/USD on Friday.
- Reduced Fed rate cut bets and geopolitical tensions lift the USD to YTD top.
- Weaker Chinese trade data drives flow away from antipodean currencies.
The NZD/USD pair meets with a fresh supply on Friday and drops to a fresh daily low following the release of weaker Chinese trade data during the early European session. Spot prices reverse the previous day's modest recovery gains and currently trade near the lower end of the weekly range, around the 0.5970-0.5975 region.
Data published by the Customs General Administration of China showed that exports declined sharply, by the 7.5% YoY rate in March as compared to the 3.0% fall expected and the 7.1% growth registered in the January-February period. Adding to this, imports fell by the 1.9% YoY rate during the reported month against the 1.2% rise anticipated and the 3.5% previous. This points to weak global as well as domestic demand and adds to concerns about recovery in the world's second-largest economy, which, in turn, undermines antipodean currencies, including the Kiwi.
The US Dollar (USD), on the other hand, gains strong follow-through positive traction and hits a fresh YTD peak in the wake of expectations that the Federal Reserve (Fed) will delay cutting interest rates amid sticky inflation. Apart from this, persistent geopolitical tensions turn out to be another factor benefiting the safe-haven buck, which, in turn, is seen exerting downward pressure on the NZD/USD pair. The fundamental backdrop, meanwhile, suggests that the path of least resistance for spot prices is to the downside and any attempted recovery is likely to get sold into.
Market participants now look forward to the release of the Preliminary Michigan Consumer Sentiment Index. This, along with speeches by influential FOMC members, will drive the USD demand later during the early North American session and provide some impetus to the NZD/USD pair. Nevertheless, spot prices remain on track to register weekly losses, though manage to hold above the YTD trough, around the 0.5940 region touched last week.
European Central Bank (ECB) policymaker Madis Muller said on Friday that “slower inflation rises the chances of a June rate cut.”
Muller added that “there are more signs the economy is strengthening.”
Market reaction
At the time of writing, EUR/USD is testing lows near 1.0675, down 0.42% on the day.
Euro price today
The table below shows the percentage change of Euro (EUR) against listed major currencies today. Euro was the weakest against the US Dollar.
| USD | EUR | GBP | CAD | AUD | JPY | NZD | CHF | |
| USD | 0.42% | 0.32% | 0.27% | 0.41% | 0.06% | 0.40% | 0.28% | |
| EUR | -0.43% | -0.11% | -0.16% | -0.01% | -0.37% | -0.04% | -0.15% | |
| GBP | -0.32% | 0.09% | -0.08% | 0.09% | -0.29% | 0.07% | -0.06% | |
| CAD | -0.27% | 0.17% | 0.08% | 0.12% | -0.20% | 0.15% | 0.01% | |
| AUD | -0.42% | 0.00% | -0.06% | -0.15% | -0.35% | -0.02% | -0.14% | |
| JPY | -0.06% | 0.35% | 0.25% | 0.21% | 0.34% | 0.34% | 0.22% | |
| NZD | -0.42% | 0.01% | -0.09% | -0.15% | -0.02% | -0.35% | -0.14% | |
| CHF | -0.30% | 0.16% | 0.08% | -0.02% | 0.14% | -0.21% | 0.12% |
The heat map shows percentage changes of major currencies against each other. The base currency is picked from the left column, while the quote currency is picked from the top row. For example, if you pick the Euro from the left column and move along the horizontal line to the Japanese Yen, the percentage change displayed in the box will represent EUR (base)/JPY (quote).
China's Trade Balance for March, in Chinese Yuan terms, came in at CNY415.86 billion, widening from the previous figure of CNY281.97 billion.
Exports fell 3.8% YoY in March vs. 10.6% seen in February. The country’s imports rose 2% YoY in the same period vs. -3.9% registered previously.
In US Dollar terms, China’s trade surplus shrank in March.
Trade Balance came in at +58.55B versus +70.20B expected and +125.16B previous.
Exports (YoY): -7.5% vs.-3.0% expected and 7.1% previous.
Imports (YoY): -1.9% vs. 1.2% expected and 3.5% last.
Additional takeaways
China Jan-March USD-denominated exports +1.5% YoY.
China Jan-March USD-denominated Imports +1.5% YoY.
China Jan-March USD-denominated trade balance 183.66 billion.
China March trade surplus with the United States $22.94 billion.
China Jan-March trade surplus with the United States $70.22 billion.
FX implications
AUD/USD is holding the recent losses on mixed China’s trade figures. The pair is down 0.32% on the day, trading at 0.6514, at the time of writing.
Here is what you need to know on Friday, April 12:
The US Dollar (USD) gathers strength against its major rivals in the European session on Friday, with the US Dollar Index climbing to a fresh 2024-high above 105.50. Export Price Index and Import Price Index data for March will be featured in the US economic docket and the University of Michigan will release the preliminary Consumer Sentiment Index for April ahead of the weekend.
Mixed macroeconomic data releases from the US made it difficult for the USD to build on Wednesday's upsurge that was fuelled by strong inflation data. Hawkish comments from Federal Reserve (Fed) officials, however, helped the currency hold its ground. Meanwhile, escalating geopolitical tensions seem to be providing an additional boost to the safe-haven USD. Late Thursday, a US official said that they were expecting Iran to attack Israel and that they warned Iran against escalating the conflict in the Middle East further, per Reuters.
US Dollar price this week
The table below shows the percentage change of US Dollar (USD) against listed major currencies this week. US Dollar was the strongest against the Euro.
| USD | EUR | GBP | CAD | AUD | JPY | NZD | CHF | |
| USD | 1.40% | 0.91% | 0.86% | 0.89% | 1.08% | 0.54% | 1.02% | |
| EUR | -1.44% | -0.51% | -0.56% | -0.52% | -0.34% | -0.88% | -0.41% | |
| GBP | -0.92% | 0.51% | -0.05% | -0.02% | 0.16% | -0.39% | 0.11% | |
| CAD | -0.87% | 0.55% | 0.05% | 0.03% | 0.21% | -0.33% | 0.16% | |
| AUD | -0.90% | 0.52% | 0.02% | -0.03% | 0.19% | -0.37% | 0.11% | |
| JPY | -1.09% | 0.34% | -0.15% | -0.21% | -0.18% | -0.52% | -0.05% | |
| NZD | -0.54% | 0.86% | 0.37% | 0.32% | 0.36% | 0.54% | 0.47% | |
| CHF | -1.04% | 0.39% | -0.11% | -0.16% | -0.13% | 0.05% | -0.49% |
The heat map shows percentage changes of major currencies against each other. The base currency is picked from the left column, while the quote currency is picked from the top row. For example, if you pick the Euro from the left column and move along the horizontal line to the Japanese Yen, the percentage change displayed in the box will represent EUR (base)/JPY (quote).
Following Wednesday's decline, Gold gathered bullish momentum and gained over 1.5% on Thursday. XAU/USD continues to push higher and was last seen trading at a new record high within a touching distance of $2,400.
The European Central Bank (ECB) left its monetary policy settings unchanged as expected following the April policy meeting. Although EUR/USD managed to erase a portion of its daily losses during the American trading hours on Thursday, it came under renewed bearish pressure early Friday amid dovish comments from ECB officials. The pair was last seen trading at its lowest level since December below 1.0700.
The UK's Office for National Statistics reported on Friday that the real Gross Domestic product (GDP) expanded 0.1% on a monthly basis in February. This reading followed the 0.3% growth recorded in January and matched the market expectation. GBP/USD stays on the back foot after the data and trades at a fresh 2024-low near 1.2500.
USD/JPY stays relatively calm above 153.00 early Friday. The Japanese Yen seems to be benefiting from the souring risk mood. Additionally, investors might be refraining from betting on another leg higher in the pair on growing expectations for a Bank of Japan intervention.
Risk sentiment FAQs
In the world of financial jargon the two widely used terms “risk-on” and “risk off'' refer to the level of risk that investors are willing to stomach during the period referenced. In a “risk-on” market, investors are optimistic about the future and more willing to buy risky assets. In a “risk-off” market investors start to ‘play it safe’ because they are worried about the future, and therefore buy less risky assets that are more certain of bringing a return, even if it is relatively modest.
Typically, during periods of “risk-on”, stock markets will rise, most commodities – except Gold – will also gain in value, since they benefit from a positive growth outlook. The currencies of nations that are heavy commodity exporters strengthen because of increased demand, and Cryptocurrencies rise. In a “risk-off” market, Bonds go up – especially major government Bonds – Gold shines, and safe-haven currencies such as the Japanese Yen, Swiss Franc and US Dollar all benefit.
The Australian Dollar (AUD), the Canadian Dollar (CAD), the New Zealand Dollar (NZD) and minor FX like the Ruble (RUB) and the South African Rand (ZAR), all tend to rise in markets that are “risk-on”. This is because the economies of these currencies are heavily reliant on commodity exports for growth, and commodities tend to rise in price during risk-on periods. This is because investors foresee greater demand for raw materials in the future due to heightened economic activity.
The major currencies that tend to rise during periods of “risk-off” are the US Dollar (USD), the Japanese Yen (JPY) and the Swiss Franc (CHF). The US Dollar, because it is the world’s reserve currency, and because in times of crisis investors buy US government debt, which is seen as safe because the largest economy in the world is unlikely to default. The Yen, from increased demand for Japanese government bonds, because a high proportion are held by domestic investors who are unlikely to dump them – even in a crisis. The Swiss Franc, because strict Swiss banking laws offer investors enhanced capital protection.
European Central Bank (ECB) Governing Council member Yannis Stournaras said on Friday that he supports divergence from the Fed's policies.
Stournaras added that “the ECB's monetary policy is too cautious and that might ultimately drive inflation to under the 2% target.”
The policymaker called for four rate cuts in 2024.
Market reaction
EUR/USD is falling hard on these comments and was last seen trading at 1.0682, down 0.38% on the day.
ECB FAQs
The European Central Bank (ECB) in Frankfurt, Germany, is the reserve bank for the Eurozone. The ECB sets interest rates and manages monetary policy for the region. The ECB primary mandate is to maintain price stability, which means keeping inflation at around 2%. Its primary tool for achieving this is by raising or lowering interest rates. Relatively high interest rates will usually result in a stronger Euro and vice versa. The ECB Governing Council makes monetary policy decisions at meetings held eight times a year. Decisions are made by heads of the Eurozone national banks and six permanent members, including the President of the ECB, Christine Lagarde.
In extreme situations, the European Central Bank can enact a policy tool called Quantitative Easing. QE is the process by which the ECB prints Euros and uses them to buy assets – usually government or corporate bonds – from banks and other financial institutions. QE usually results in a weaker Euro. QE is a last resort when simply lowering interest rates is unlikely to achieve the objective of price stability. The ECB used it during the Great Financial Crisis in 2009-11, in 2015 when inflation remained stubbornly low, as well as during the covid pandemic.
Quantitative tightening (QT) is the reverse of QE. It is undertaken after QE when an economic recovery is underway and inflation starts rising. Whilst in QE the European Central Bank (ECB) purchases government and corporate bonds from financial institutions to provide them with liquidity, in QT the ECB stops buying more bonds, and stops reinvesting the principal maturing on the bonds it already holds. It is usually positive (or bullish) for the Euro.
- GBP/USD trades on a softer note around 1.2530 following UK GDP numbers on Friday.
- UK monthly Gross Domestic Product (GDP) grew 0.1% MoM in February vs. the 0.1% expected.
- The lower speculation of Fed rate cuts this year lifts the Greenback and weighs on the pair.
The GBP/USD pair remains on the defensive near 1.2530 during the early European trading hours on Friday. The major pair remains vulnerable despite the stronger-than-expected UK monthly GDP numbers and improved Industrial Production data.
The latest data released from the Office for National Statistics on Friday showed that the UK monthly Gross Domestic Product (GDP) grew 0.1% MoM in February, compared to an expansion of 0.3% in the previous reading, matching the estimation of a 0.1% expansion. Additionally, UK Industrial Production for February came in better than the market expectation, improving to 1.1% MoM from a 0.3% decline in January. Finally, the UK Goods Trade Balance arrived at GBP-14.212 billion MoM in February from GBP-14.097 billion prior, better than GBP-14.5B expected. The upbeat UK economic data failed to boost the Pound Sterling (GBP) as the markets anticipate the Bank of England (BoE) will cut its interest rate sooner than the US Federal Reserve (Fed).
On the other hand, the recent hotter-than-expected CPI inflation reading and stronger Nonfarm Payrolls (NFP) trigger speculation that the Fed will have to push back the number and timing of interest rate cuts this year. This, in turn, provides some support to the Greenback and creates a headwind for the GBP/USD pair. Investors will take more cues from the preliminary US Michigan Consumer Sentiment Index for April, along with the Fed's Bostic and Daly speeches later on Friday.
FX option expiries for Apr 12 NY cut at 10:00 Eastern Time, via DTCC, can be found below
- EUR/USD: EUR amounts
- 1.0700 3.09b
- 1.0780 1.04b
- 1.0950 1.02b
- GBP/USD: GBP amounts
- 1.2750 1.44b
- 1.2600 674.1m
- 1.2650 643.7m
- USD/JPY: USD amounts
- 149.50 1.85b
- 152.00 1.03b
- 150.00 1.02b
- AUD/USD: AUD amounts
- 0.6520 1b
- 0.6500 697.6m
- 0.6450 675m
- USD/CAD: USD amounts
- 1.3685 913.1m
- 1.3650 504.2m
- 1.3727 466.2m
- NZD/USD: NZD amounts
- 0.5750 610m
- 0.6050 550.4m
- 0.6000 330m
- USD/CNY: USD amounts
- 7.0150 1.51b
- 7.0000 1.46b
- 7.2500 1.41b
- UK GDP expanded 0.1% MoM in February vs. 0.1% estimate.
- GBP/USD remains below 1.2650 after the UK data.
The UK economy expanded 0.1% in February, having rebounded 0.3% in January, the latest data published by the Office for National Statistics (ONS) showed on Friday. The market consensus was for an expansion of 0.1% in the reported period.
Meanwhile, the Index of services (February) came in at 0.2% 3M/3M vs. January’s 0% print.
Other data from the UK showed that Industrial Production and Manufacturing Production rose 1.1% and 1.2%, respectively, on a monthly basis, in February.
Separately, the UK Goods Trade Balance came in at GBP-14.212 billion MoM in February vs. GBP-14.50B expected and GBP-14.097 previous.
Market reaction to the UK data
The Pound Sterling is feeling the pull of gravity on the mixed UK economic data. At the press time, GBP/USD is trading 0.10% lower on the day at 1.2535.
Pound Sterling price today
The table below shows the percentage change of Pound Sterling (GBP) against listed major currencies today. Pound Sterling was the weakest against the US Dollar.
| USD | EUR | GBP | CAD | AUD | JPY | NZD | CHF | |
| USD | 0.19% | 0.13% | 0.17% | 0.27% | 0.02% | 0.22% | 0.15% | |
| EUR | -0.20% | -0.06% | -0.03% | 0.08% | -0.18% | 0.02% | -0.05% | |
| GBP | -0.14% | 0.06% | 0.03% | 0.14% | -0.12% | 0.08% | 0.00% | |
| CAD | -0.17% | 0.03% | -0.01% | 0.10% | -0.15% | 0.05% | -0.02% | |
| AUD | -0.27% | -0.08% | -0.14% | -0.11% | -0.26% | -0.06% | -0.13% | |
| JPY | -0.02% | 0.17% | 0.11% | 0.15% | 0.24% | 0.20% | 0.12% | |
| NZD | -0.22% | -0.02% | -0.08% | -0.05% | 0.06% | -0.20% | -0.07% | |
| CHF | -0.15% | 0.05% | -0.01% | 0.03% | 0.15% | -0.12% | 0.07% |
The heat map shows percentage changes of major currencies against each other. The base currency is picked from the left column, while the quote currency is picked from the top row. For example, if you pick the Euro from the left column and move along the horizontal line to the Japanese Yen, the percentage change displayed in the box will represent EUR (base)/JPY (quote).
- WTI drifts lower to $85.00 on Friday.
- The higher-for-longer US rate narrative weighs on the black gold.
- The fear of Middle East geopolitical tensions might cap the WTI’s downside for the time being.
Western Texas Intermediate (WTI), the US crude oil benchmark, is trading around $85.00 on Friday. The black gold edges lower on the day as the elevated inflation dampened the expectation for US interest rate cuts this year. Nonetheless, the escalating geopolitical tensions in the Middle East might cap the downside of WTI prices in the near term.
The recent US inflation and employment reports indicated that the path of easing inflation remains extremely bumpy and the Federal Reserve (Fed) might need to delay the interest rate cuts. According to the FOMC minutes released on Wednesday, participants noted their uncertainty about the elevated high inflation and recent data had not increased their confidence that inflation was moving sustainably down to 2%.” Financial markets have priced in only two rate cuts this year, which will most likely start in September, per the CME FedWatch Tool. The higher-for-longer US rate narrative could exert some selling pressure on black gold as it translates to less demand for oil as the cost of storing crude increases.
Additionally, WTI prices lose traction after the release of the EIA report. Crude oil stockpiles in the United States for the week ending April 5 increased by 5.841 million barrels from a build of 3.21 million barrels in the previous week. The market consensus estimated that stocks would rise by about 2.366 million barrels, according to the US Energy Information Administration report on Wednesday.
On the other hand, the fear of geopolitical risks in the Middle East might boost WTI prices. Israel and Hamas began a fresh round of negotiations in their more than six-month-old Gaza war this week, but those talks have yielded no agreement. Additionally, a potential Iranian strike on Israel for a suspected air strike on its embassy in Syria on April 1 is likely to cap the downside of WTI prices for the time being.
- AUD/USD comes under some renewed selling pressure and erodes a part of the overnight gains.
- Reduced Fed rate cut bets, along with geopolitics, underpin the USD and drag spot prices lower.
- Chinese trade data, the US consumer sentiment index and Fedspeak eyed for a fresh impetus.
The AUD/USD pair meets with a fresh supply during the Asian session on Friday and erodes a part of the previous day's goodish intraday move up from the 0.6500 psychological mark. Spot prices currently trade around the 0.6530-0.6525 area, though the downside seems cushioned amid mixed fundamental cues.
The South China Morning Post reported that Chinese Premier Li Qiang will visit Australia in June. This is seen as a sign of improving relations between Australia and China, which, in turn, is seen acting as a tailwind for the Aussie. Any meaningful appreciating move for the AUD/USD pair, however, seems elusive in the wake of the underlying bullish sentiment surrounding the US Dollar (USD), bolstered by hawkish Federal Reserve (Fed) expectations.
The hotter-than-expected US consumer inflation figures released on Wednesday forced investors to push back their bets about the timing of the first interest rate cut to September from June. The outlook keeps the US Treasury bond yields elevated, which, along with persistent geopolitical tensions, assists the USD to stand tall near the YTD peak. This, in turn, might continue to act as a headwind for the AUD/USD pair and warrants some caution for bulls.
Market participants now keenly await the release of Chinese trade balance data, which might influence the China-proxy Australian Dollar (AUD). Later during the early North American session, the Preliminary Michigan Consumer Sentiment Index and speeches by influential FOMC members will drive the USD demand, which, in turn, should provide some impetus to the AUD/USD pair. Nevertheless, spot prices seem poised to register weekly losses, though hold above the monthly swing low, around the 0.6480 region touched on April 1.
- Gold price continues to scale new record highs amid persistent geopolitical tensions.
- The strong move up seems unaffected by reduced Fed rate cut bets and bullish USD.
- Extremely overbought conditions might prompt some profit-taking around the metal.
Gold price (XAU/USD) prolongs the recent well-established uptrend and climbs to the $2,400 neighborhood, or a fresh all-time high during the Asian session on Friday. Investors remain concerned about the risk of a further escalation of geopolitical tensions in the Middle East, which, in turn, is seen as a key factor benefiting the safe-haven precious metal. Apart from this, expectations that major central banks will cut interest rates this year offer additional support to the non-yielding yellow metal and contribute to the positive move.
Bulls, meanwhile, seem rather unaffected by the recent US Dollar (USD) bullish run, bolstered by reduced bets for interest rate cuts by the Federal Reserve (Fed), which tends to undermine demand for the Gold price. Investors pushed back expectations about the timing of the first rate cut to September from June following the release of hot US consumer inflation figures on Wednesday. Market participants also pared their bets for the number of interest rate cuts this year to fewer than two from about three or four a few weeks ago.
That said, extremely overstretched conditions on daily, weekly and monthly charts might hold back traders from placing fresh bullish bets around the Gold price. Nevertheless, the XAU/USD remains on track to register gains for the fourth straight week, also marking the seventh in the previous eight. Moving ahead, the release of the Preliminary Michigan Consumer Sentiment Index, which, along with speeches by influential FOMC members, will drive the USD demand and produce short-term trading opportunities around the precious metal.
Daily Digest Market Movers: Gold price benefits from the worsening Middle East crisis
- Heightened tensions in the Middle East, amid a possible Iranian retaliation over a suspected Israeli strike on its embassy in Syria, lift the safe-haven Gold price to a fresh all-time high on Friday.
- The cooler-than-expected US Producer Price Index released on Thursday keeps alive hopes for an imminent interest rate cut by the Federal Reserve and provides an additional boost to the XAU/USD
- According to the CME Group's FedWatch tool, traders see a greater chance that the Fed will not start its rate-cutting cycle before the September policy meeting and fewer than two rate cuts this year.
- New York Fed President John Williams noted that inflation setbacks are not a surprise and that the central bank does not need to change policy in the near term, though eventually will need to cut rates.
- Richmond Fed President Thomas Barkin said that the central bank is not yet where it wants to be on inflation and this week's CPI report did not increase his confidence that disinflation is spreading.
- The hawkish outlook keeps the US Treasury bond yields elevated, which allows the US Dollar to stand tall near the YTD top, albeit does little to dent the bullish sentiment surrounding the XAU/USD.
Technical Analysis: Gold price bulls retain control despite overbought conditions
From a technical perspective, the strong positive momentum remains uninterrupted despite the extremely overbought Relative Strength Index (RSI) on the daily chart. Bulls, however, might opt to take some profits near the $2,400 mark heading into the weekend, warranting some caution before positioning for any further appreciating move. Any meaningful corrective slide below the Asian session low, around the $2,370 area, however, is likely to find decent support near the $2,352-2,350 region. Some follow-through selling could expose the next relevant support near the $2,332 area before the Gold price eventually drops to the $2,300 neighborhood, or the weekly low.
Gold FAQs
Gold has played a key role in human’s history as it has been widely used as a store of value and medium of exchange. Currently, apart from its shine and usage for jewelry, the precious metal is widely seen as a safe-haven asset, meaning that it is considered a good investment during turbulent times. Gold is also widely seen as a hedge against inflation and against depreciating currencies as it doesn’t rely on any specific issuer or government.
Central banks are the biggest Gold holders. In their aim to support their currencies in turbulent times, central banks tend to diversify their reserves and buy Gold to improve the perceived strength of the economy and the currency. High Gold reserves can be a source of trust for a country’s solvency. Central banks added 1,136 tonnes of Gold worth around $70 billion to their reserves in 2022, according to data from the World Gold Council. This is the highest yearly purchase since records began. Central banks from emerging economies such as China, India and Turkey are quickly increasing their Gold reserves.
Gold has an inverse correlation with the US Dollar and US Treasuries, which are both major reserve and safe-haven assets. When the Dollar depreciates, Gold tends to rise, enabling investors and central banks to diversify their assets in turbulent times. Gold is also inversely correlated with risk assets. A rally in the stock market tends to weaken Gold price, while sell-offs in riskier markets tend to favor the precious metal.
The price can move due to a wide range of factors. Geopolitical instability or fears of a deep recession can quickly make Gold price escalate due to its safe-haven status. As a yield-less asset, Gold tends to rise with lower interest rates, while higher cost of money usually weighs down on the yellow metal. Still, most moves depend on how the US Dollar (USD) behaves as the asset is priced in dollars (XAU/USD). A strong Dollar tends to keep the price of Gold controlled, whereas a weaker Dollar is likely to push Gold prices up.
- Indian Rupee trades on a positive note on Friday.
- Rising oil prices and higher US Treasury bond yields could weigh on the INR, limiting the downside of USD/INR.
- The Indian March CPI inflation report and US April Michigan Consumer Sentiment Index will be in the spotlight on Friday.
Indian Rupee (INR) posts modest gains on Friday amid strong selling interest in the US Dollar (USD) and light demand from importers. The recovery of INR is bolstered by the robust Indian economic performance and positive longer-term outlook. However, the rise in oil prices and higher US Treasury bond yields might drag the INR lower and cap the downside of USD/INR.
Investors will keep an eye on the Indian CPI inflation report for March and Industrial Production for February, due on Friday. A hotter-than-expected Indian inflation data could further boost the INR. On the US docket, the preliminary US Michigan Consumer Sentiment Index for April will be released later, along with the Fed's Bostic and Daly speech.
Daily Digest Market Movers: Indian Rupee remains strong due to the robust Indian economy
- Sanjeev Sanyal, a member of the Economic Advisory Council to the Prime Minister (EAC-PM), said that India's economic growth performance is 'good' and that efforts are needed to maintain it since worries about global factors remain unresolved.
- India's CPI inflation is expected to show an increase of 4.91% in March, according to a Reuters poll. The figure remains above the Reserve Bank of India's (RBI) 4% medium-term target as persistent food price increases.
- The US Producer Price Index (PPI) data for March rose by 2.1% YoY, missing the estimation of 2.2%. The core PPI, excluding volatile food and energy prices, climbed by 2.4% YoY, compared to the market consensus of 2.3%.
- The recent US CPI inflation data and Nonfarm Payrolls (NFP) triggered the speculation that the Fed will have to push back the number and timing of interest rate cuts this year.
- Investors are now pricing in only two rate cuts this year, which will most likely begin in September, according to CME FedWatch Tool.
Technical analysis: USD/INR keeps bullish bias in the longer term
The Indian Rupee trades stronger on the day. USD/INR prospects remain positive in the long term since the pair has risen above a nearly four-month-old descending trend channel since March 22.
In the near term, USD/INR is above the key 100-day Exponential Moving Average (EMA) on the daily timeframe. The upward momentum is backed by the 14-day Relative Strength Index (RSI), which holds in bullish territory around 55.00, suggesting that further upside looks favorable.
The immediate resistance level of the pair will emerge near a high of April 11 at 83.40. The next hurdle is located at an all-time high of 83.70, en route to the 84.00 psychological level. On the flip side, the potential support level is seen near the congestion of the round figure and the 100-period EMA at the 83.00–83.10 region. A decisive break below this zone might pave the way to a low of March 14 at 82.80, followed by a low of March 11 at 82.65.
US Dollar price today
The table below shows the percentage change of US Dollar (USD) against listed major currencies today. US Dollar was the weakest against the New Zealand Dollar.
| USD | EUR | GBP | CAD | AUD | JPY | NZD | CHF | |
| USD | 0.05% | 0.02% | 0.06% | 0.07% | 0.00% | -0.04% | 0.05% | |
| EUR | -0.05% | -0.01% | 0.00% | 0.02% | -0.04% | -0.09% | -0.01% | |
| GBP | -0.02% | 0.02% | 0.03% | 0.05% | -0.02% | -0.07% | 0.02% | |
| CAD | -0.06% | -0.01% | 0.00% | 0.01% | -0.06% | -0.10% | -0.01% | |
| AUD | -0.07% | -0.03% | -0.04% | -0.02% | -0.07% | -0.12% | -0.03% | |
| JPY | 0.00% | 0.04% | 0.02% | 0.05% | 0.05% | -0.04% | 0.04% | |
| NZD | 0.03% | 0.09% | 0.08% | 0.10% | 0.12% | 0.04% | 0.09% | |
| CHF | -0.05% | 0.01% | -0.01% | 0.01% | 0.03% | -0.04% | -0.09% |
The heat map shows percentage changes of major currencies against each other. The base currency is picked from the left column, while the quote currency is picked from the top row. For example, if you pick the Euro from the left column and move along the horizontal line to the Japanese Yen, the percentage change displayed in the box will represent EUR (base)/JPY (quote).
Indian economy FAQs
The Indian economy has averaged a growth rate of 6.13% between 2006 and 2023, which makes it one of the fastest growing in the world. India’s high growth has attracted a lot of foreign investment. This includes Foreign Direct Investment (FDI) into physical projects and Foreign Indirect Investment (FII) by foreign funds into Indian financial markets. The greater the level of investment, the higher the demand for the Rupee (INR). Fluctuations in Dollar-demand from Indian importers also impact INR.
India has to import a great deal of its Oil and gasoline so the price of Oil can have a direct impact on the Rupee. Oil is mostly traded in US Dollars (USD) on international markets so if the price of Oil rises, aggregate demand for USD increases and Indian importers have to sell more Rupees to meet that demand, which is depreciative for the Rupee.
Inflation has a complex effect on the Rupee. Ultimately it indicates an increase in money supply which reduces the Rupee’s overall value. Yet if it rises above the Reserve Bank of India’s (RBI) 4% target, the RBI will raise interest rates to bring it down by reducing credit. Higher interest rates, especially real rates (the difference between interest rates and inflation) strengthen the Rupee. They make India a more profitable place for international investors to park their money. A fall in inflation can be supportive of the Rupee. At the same time lower interest rates can have a depreciatory effect on the Rupee.
India has run a trade deficit for most of its recent history, indicating its imports outweigh its exports. Since the majority of international trade takes place in US Dollars, there are times – due to seasonal demand or order glut – where the high volume of imports leads to significant US Dollar- demand. During these periods the Rupee can weaken as it is heavily sold to meet the demand for Dollars. When markets experience increased volatility, the demand for US Dollars can also shoot up with a similarly negative effect on the Rupee.
- USD/CAD lacks firm intraday direction and consolidates below the YTD top set on Thursday.
- An uptick in Oil prices underpins the Loonie and caps the upside amid subdued USD demand.
- Reduced Fed rate cut bets favors USD bulls and support prospects for further near-term gains.
The USD/CAD pair oscillates in a narrow trading band during the Asian session on Friday and for now, seems to have stalled the previous day's late pullback from its highest level since November 22. Spot prices currently trade just below the 1.3700 mark, nearly unchanged for the day, though this week's breakout through the 1.3600-1.3610 supply zone favors bulls and supports prospects for a further near-term appreciating move.
Crude Oil prices edge higher amid heightened tensions in the Middle East on the back of a possible Iranian retaliation over a suspected Israeli strike on its embassy in Syria. This, in turn, is seen underpinning the commodity-linked Loonie, which, along with subdued US Dollar (USD) price action, acts as a headwind for the USD/CAD pair. That said, jitters about growing non-OPEC output, led by the US, might cap gains for the black liquid. Apart from this, expectations that the Federal Reserve (Fed) may delay cutting interest rates favor the USD bulls and should limit the downside for the currency pair.
The hotter-than-expected US consumer inflation figures released on Wednesday forced investors to push back their expectations about the timing of the first interest rate cut by the Fed to September from June. Investors also pared their bets for the number of rate cuts of 25 basis points (bps) this year to fewer than two, or roughly 42 bps, from about three or four a few weeks ago. This remains supportive of elevated US Treasury bond yields and assists the USD to stand tall near its highest level since November touched on Thursday, validating the near-term positive outlook for the USD/CAD pair.
Even from a technical perspective, the post-US CPI strength above the 1.3600-1.3610 barrier and the subsequent move up suggests that the path of least resistance for spot prices is to the upside. Market participants now look to the release of the Preliminary Michigan Consumer Sentiment Index, due later during the North American session. Apart from this, speeches by FOMC members will drive the USD demand. This, along with Oil price dynamics, should produce short-term trading opportunities around the USD/CAD pair, which seems poised to register gains for the second straight week.
| Raw materials | Closed | Change, % |
|---|---|---|
| Silver | 28.447 | 2.03 |
| Gold | 2374.69 | 1.74 |
| Palladium | 1045.46 | 0.14 |
- The Japanese Yen ticks higher amid intervention warnings, albeit with a lack of bullish conviction.
- The divergent Fed-BoJ policy expectations keep a lid on any meaningful JPY appreciation.
- USD/JPY seems poised to register strong gains and end in the green for the fifth straight week.
The Japanese Yen (JPY) is seen oscillating in a narrow trading band against its American counterpart during the Asian session on Friday and consolidating this week's heavy losses to the lowest level since 1990. The Bank of Japan (BoJ) has offered few cues on when it will increase interest rates further, while the markets are now betting that the Federal Reserve (Fed) will not cut interest rates, at least before the September policy meeting. This, in turn, suggests that the large difference in rates between the US and Japan will stay for some time, which, along with a stable performance around the equity markets, continues to undermine the safe-haven JPY.
The US Dollar (USD), on the other hand, holds steady near the YTD peak in the wake of expectations that the Fed will keep rates higher for longer on the back of still-sticky inflation. This turns out to be another factor acting as a tailwind for the USD/JPY pair, though bulls seem reluctant to place aggressive bets amid the recent verbal warnings from Japanese officials that they would intervene in the markets to stem any further JPY weakness. Nevertheless, the fundamental backdrop suggests that the path of least resistance for the currency pair is to the upside, and any meaningful corrective decline is more likely to be seen as a buying opportunity.
Daily Digest Market Movers: Japanese Yen struggles to register any meaningful recovery amid the BoJ’s dovish outlook
- The Japanese Yen continues to be weighed down by the Bank of Japan's cautious approach and uncertain outlook for future rate hikes, which, along with a bullish US Dollar, lifted the USD/JPY pair to a fresh 34-year peak on Thursday.
- The USD climbed to its highest level since November 14 as investors pushed back the expected timing of the first interest rate cut by the Fed to September from June following the release of hot US consumer inflation figures on Wednesday.
- Investors also pared their bets for the number of rate cuts of 25 basis points (bps) this year to fewer than two, or roughly 42 bps, from about three or four a few weeks ago in the wake of hawkish comments by several Fed officials.
- Richmond Fed President Thomas Barkin said on Thursday that the latest data did not increase his confidence that disinflation is spreading in the economy and that the central bank is not yet where it wants to be on inflation.
- Furthermore, New York Fed President John Williams noted that inflation setbacks are not a surprise and that the central bank does not need to change policy in the very near term, though eventually it will need to cut rates.
- The yield on the rate-sensitive two-year and the benchmark 10-year US government bonds held steady near a five-month peak after data on Thursday showed that the US Producer Price Index (PPI) rose by a modest 0.2% in March.
- The recent jawboning from Japanese authorities, showing readiness to intervene in the markets to address any excessive falls in the domestic currency, and persistent geopolitical tensions lend some support to the safe-haven JPY.
- Japan's Finance Minister Shunichi Suzuki reiterated on Friday that he will closely watch FX moves with a high sense of urgency as a weak JPY could push up import prices and have a negative impact on consumers and firms.
- The USD/JPY pair remains on track to register strong weekly gains, up for the fifth straight week, as market participants now look to the release of the Preliminary Michigan Consumer Sentiment Index for short-term trading impetus.
Technical Analysis: USD/JPY needs to consolidate before the next leg up, 152.00 resistance-turned-support holds the key for bulls
From a technical perspective, the post-US CPI breakout through a two-week-old trading range resistance near the 152.00 mark favors bullish traders. That said, the Relative Strength Index (RSI) on the daily chart – though it has eased from higher levels – is hovering near overbought territory. This makes it prudent to wait for some near-term consolidation or a modest pullback before positioning for any further appreciating move. In the meantime, the multi-decade high, around the 153.25-153.30 region, now seems to act as an immediate hurdle, above which the USD/JPY pair could aim to reclaim the 154.00 round figure.
On the flip side, any meaningful corrective decline below the overnight swing low, around the 152.75 zone, is more likely to attract fresh buyers and remain limited near the trading range breakout point, now turned support, near the 152.00 mark. The said handle should now act as a strong base for the USD/JPY pair, which, if broken decisively, might prompt some profit-taking and pave the way for a slide towards the 151.40 intermediate support en route to the 151.00 round figure. Some follow-through selling will suggest that spot prices have topped out in the near term and shift the bias in favor of bearish traders.
Japanese Yen FAQs
The Japanese Yen (JPY) is one of the world’s most traded currencies. Its value is broadly determined by the performance of the Japanese economy, but more specifically by the Bank of Japan’s policy, the differential between Japanese and US bond yields, or risk sentiment among traders, among other factors.
One of the Bank of Japan’s mandates is currency control, so its moves are key for the Yen. The BoJ has directly intervened in currency markets sometimes, generally to lower the value of the Yen, although it refrains from doing it often due to political concerns of its main trading partners. The current BoJ ultra-loose monetary policy, based on massive stimulus to the economy, has caused the Yen to depreciate against its main currency peers. This process has exacerbated more recently due to an increasing policy divergence between the Bank of Japan and other main central banks, which have opted to increase interest rates sharply to fight decades-high levels of inflation.
The BoJ’s stance of sticking to ultra-loose monetary policy has led to a widening policy divergence with other central banks, particularly with the US Federal Reserve. This supports a widening of the differential between the 10-year US and Japanese bonds, which favors the US Dollar against the Japanese Yen.
The Japanese Yen is often seen as a safe-haven investment. This means that in times of market stress, investors are more likely to put their money in the Japanese currency due to its supposed reliability and stability. Turbulent times are likely to strengthen the Yen’s value against other currencies seen as more risky to invest in.
Japanese Prime Minister Fumio Kishida said on Friday that he “discussed strengthening supply chains, diplomatic and security issues during the summit with US and Filipino leaders.”
Additional quotes
No decision on whether to hold the trilateral summit regularly but agreed that these meetings are important.
US President Biden and I shared the view that promoting investment in both countries is crucial as we lead the global economy together.
Market reaction
Amidst Japanese verbal intervention, USD/JPY is dropping 0.13% on the day to 153.06, at the time of writing.
Gold prices (XAU/USD) climbs to a record high near $2,390 during the early Asian session on Friday.
The market expectation that the US Federal Reserve (Fed) will cut its benchmark interest rate this year is the main driver for the yellow metal. Additionally, the gold purchase by the Chinese central bank and the ongoing geopolitical tensions in the Middle East boost safe-haven flows, benefiting the gold price.
Market reaction
Gold price (XAU/USD) attracts some buyers and has reached a record high near $2,390. At the time of writing, the gold price is trading around $2,385.60, up 0.52% on the day.
-638484818416011810.png)
Gold FAQs
Gold has played a key role in human’s history as it has been widely used as a store of value and medium of exchange. Currently, apart from its shine and usage for jewelry, the precious metal is widely seen as a safe-haven asset, meaning that it is considered a good investment during turbulent times. Gold is also widely seen as a hedge against inflation and against depreciating currencies as it doesn’t rely on any specific issuer or government.
Central banks are the biggest Gold holders. In their aim to support their currencies in turbulent times, central banks tend to diversify their reserves and buy Gold to improve the perceived strength of the economy and the currency. High Gold reserves can be a source of trust for a country’s solvency. Central banks added 1,136 tonnes of Gold worth around $70 billion to their reserves in 2022, according to data from the World Gold Council. This is the highest yearly purchase since records began. Central banks from emerging economies such as China, India and Turkey are quickly increasing their Gold reserves.
Gold has an inverse correlation with the US Dollar and US Treasuries, which are both major reserve and safe-haven assets. When the Dollar depreciates, Gold tends to rise, enabling investors and central banks to diversify their assets in turbulent times. Gold is also inversely correlated with risk assets. A rally in the stock market tends to weaken Gold price, while sell-offs in riskier markets tend to favor the precious metal.
The price can move due to a wide range of factors. Geopolitical instability or fears of a deep recession can quickly make Gold price escalate due to its safe-haven status. As a yield-less asset, Gold tends to rise with lower interest rates, while higher cost of money usually weighs down on the yellow metal. Still, most moves depend on how the US Dollar (USD) behaves as the asset is priced in dollars (XAU/USD). A strong Dollar tends to keep the price of Gold controlled, whereas a weaker Dollar is likely to push Gold prices up.
The People’s Bank of China (PBoC) set the USD/CNY central rate for the trading session ahead on Friday at 7.0967 as compared to the previous day's fix of 7.0968 and 7.2365 Reuters estimates.
- GBP/USD remains on the defensive around 1.2550 in Friday’s early Asian session.
- The US Producer Price Index (PPI) increased by 2.1% YoY in March, missing the estimation of 2.2%.
- BoE’s Greene said the rate cuts in the UK should remain "a way off" amid the persistence of inflation pressure.
The GBP/USD pair remains on the backfoot near 1.2550 during the early Asian session on Friday. The market expects that the Bank of England (BoE) will cut its interest rate sooner than the US Federal Reserve (Fed) weighs on the Pound Sterling (GBP) and the major pair. Later on Friday, investors will monitor the UK monthly Gross Domestic Product (GDP) for February and the preliminary US Michigan Consumer Sentiment Index for April.
The hotter-than-expected CPI inflation reading this week triggers speculation that the Fed will have to push back the number and timing of interest rate cuts this year. Fed officials believe the US central bank had reached the peak of the current rate-tightening cycle and monetary policy was well positioned to react to the economic outlook, including the possibility of keeping rates higher for longer if inflation declines gradually. The hawkish remarks from the Fed lift the Greenback and drag the GBP/USD pair lower.
On Thursday, the US Producer Price Index (PPI) data for March increased by 2.1% YoY, missing the estimation of 2.2%. The core PPI, which excludes volatile food and energy prices, rose by 2.4% YoY, compared to the market consensus of 2.3%.
On the other hand, the hawkish comments from BoE policymaker Megan Greene failed to boost the GBP. Greene stated that the interest rate cuts in the UK should remain "a way off" due to the persistence of inflation pressure, which is still more of a threat than in the US. Greene added that markets were wrong to expect that the BoE to cut rates earlier than the Fed this year. The UK GDP numbers for February might offer some hints about the UK economy. If the report shows stronger-than-expected data, this could provide some support to the GBP and cap the downside of the GBP/USD pair.
| Index | Change, points | Closed | Change, % |
|---|---|---|---|
| NIKKEI 225 | -139.18 | 39442.63 | -0.35 |
| Hang Seng | -44.14 | 17095.03 | -0.26 |
| KOSPI | 1.8 | 2706.96 | 0.07 |
| ASX 200 | -34.9 | 7813.6 | -0.44 |
| DAX | -142.82 | 17954.48 | -0.79 |
| CAC 40 | -21.64 | 8023.74 | -0.27 |
| Dow Jones | -2.43 | 38459.08 | -0.01 |
| S&P 500 | 38.42 | 5199.06 | 0.74 |
| NASDAQ Composite | 271.84 | 16442.2 | 1.68 |
| Pare | Closed | Change, % |
|---|---|---|
| AUDUSD | 0.65369 | 0.43 |
| EURJPY | 164.339 | 0.05 |
| EURUSD | 1.07265 | -0.13 |
| GBPJPY | 192.347 | 0.34 |
| GBPUSD | 1.25536 | 0.15 |
| NZDUSD | 0.59965 | 0.38 |
| USDCAD | 1.36898 | 0.04 |
| USDCHF | 0.90962 | -0.34 |
| USDJPY | 153.214 | 0.19 |
Japanese Finance Minister Shunichi Suzuki offered some verbal intervention on Friday. Suzuki said that a weak Japanese Yen (JPY) could push up import prices and have a negative impact on consumers and firms. Suzuki added that he will closely watch foreign exchange (FX) moves with a high sense of urgency.
Key quotes
“Weak yen has pros and cons.”
“Weak yen could push up import prices and have negative impact on consumers, firms.”
“Rapid FX moves undesirable.”
“Closely watching FX moves with a high sense of urgency.”
“Desirable for FX to move stably reflecting fundamentals
Disorderly FX moves.”
“In close communication with top currency diplomat Kanda.”
“We are analysing background of what is driving FX moves.”
“There is a chance FX will be discussed at next week's G20 meeting.”
“Govt hopes to take appropriate steps to minimise impact of weak yen on households.”
Market reaction
At the time of writing, USD/JPY is trading 0.02% lower on the day to trade at 153.25.
Japanese Yen FAQs
The Japanese Yen (JPY) is one of the world’s most traded currencies. Its value is broadly determined by the performance of the Japanese economy, but more specifically by the Bank of Japan’s policy, the differential between Japanese and US bond yields, or risk sentiment among traders, among other factors.
One of the Bank of Japan’s mandates is currency control, so its moves are key for the Yen. The BoJ has directly intervened in currency markets sometimes, generally to lower the value of the Yen, although it refrains from doing it often due to political concerns of its main trading partners. The current BoJ ultra-loose monetary policy, based on massive stimulus to the economy, has caused the Yen to depreciate against its main currency peers. This process has exacerbated more recently due to an increasing policy divergence between the Bank of Japan and other main central banks, which have opted to increase interest rates sharply to fight decades-high levels of inflation.
The BoJ’s stance of sticking to ultra-loose monetary policy has led to a widening policy divergence with other central banks, particularly with the US Federal Reserve. This supports a widening of the differential between the 10-year US and Japanese bonds, which favors the US Dollar against the Japanese Yen.
The Japanese Yen is often seen as a safe-haven investment. This means that in times of market stress, investors are more likely to put their money in the Japanese currency due to its supposed reliability and stability. Turbulent times are likely to strengthen the Yen’s value against other currencies seen as more risky to invest in.


© 2000-2026. All rights reserved.
This site is managed by Teletrade D.J. LLC 2351 LLC 2022 (Euro House, Richmond Hill Road, Kingstown, VC0100, St. Vincent and the Grenadines).
The information on this website is for informational purposes only and does not constitute any investment advice.
The company does not serve or provide services to customers who are residents of the US, Canada, Iran, The Democratic People's Republic of Korea, Yemen and FATF blacklisted countries.
Making transactions on financial markets with marginal financial instruments opens up wide possibilities and allows investors who are willing to take risks to earn high profits, carrying a potentially high risk of losses at the same time. Therefore you should responsibly approach the issue of choosing the appropriate investment strategy, taking the available resources into account, before starting trading.
Use of the information: full or partial use of materials from this website must always be referenced to TeleTrade as the source of information. Use of the materials on the Internet must be accompanied by a hyperlink to teletrade.org. Automatic import of materials and information from this website is prohibited.
Please contact our PR department if you have any questions or need assistance at pr@teletrade.global.
transfers