- Analytics
- News and Tools
- Market News
CFD Markets News and Forecasts — 15-04-2024
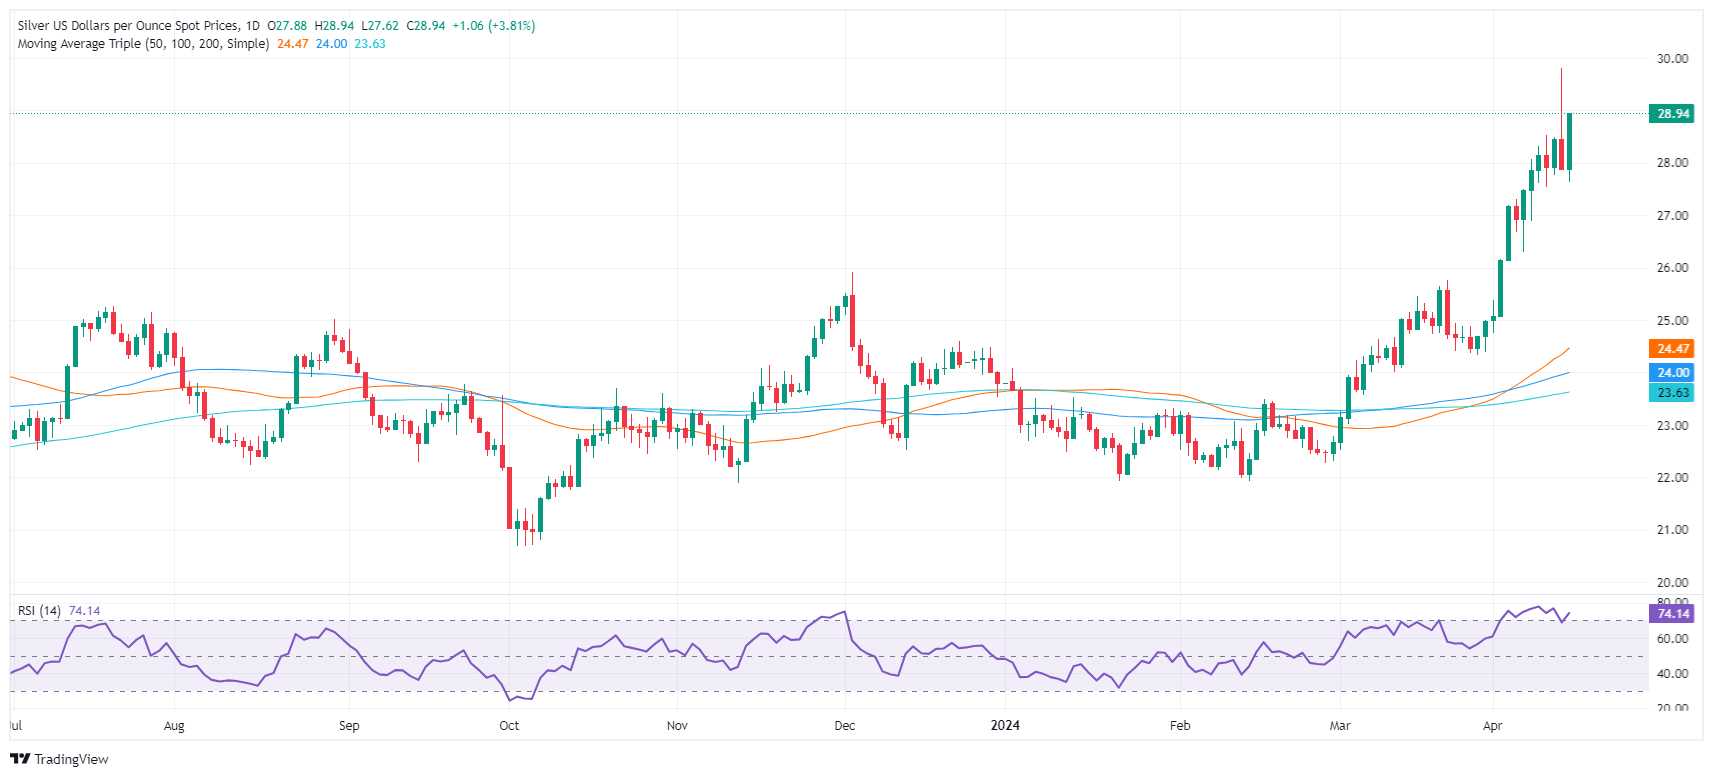
- XAG/USD climbs 3.61%, nearing $29.00 due to robust demand in the precious metals sector.
- Technical analysis suggests further upside potential, with aims at the April 12 high of $29.79 and the key $30.00 level.
- Key supports are at the May 18, 2021, high of $28.75, the June 10, 2021, high of $28.28, and the crucial $28.00 psychological level.
Silver's price rose past $28.00, extending its gains close to the $29.00 threshold, which was briefly pierced last Friday, but buyers failed to hold the price above that level. At the time of writing, XAG/USD trades at $28.85, up by 3.61%.
XAG/USD Price Analysis: Technical outlook
Silver’s daily chart portrays the grey metal is bullish, shy of reclaiming the $29.00 handle. Once cleared, the next resistance would be the April 12 high of $29.79 before aiming toward the $30.00 threshold, last seen in February 2013. The next resistance would be February’s monthly high at $32.15.
Conversely, XAG/USD’s first support would be the May 18, 2021, high turned support at $28.75, followed by the June 10, 2021, high at $28.28. Once those two levels are surpassed, the $28.00 psychological level will be next.
XAG/USD Price Action – Daily Chart
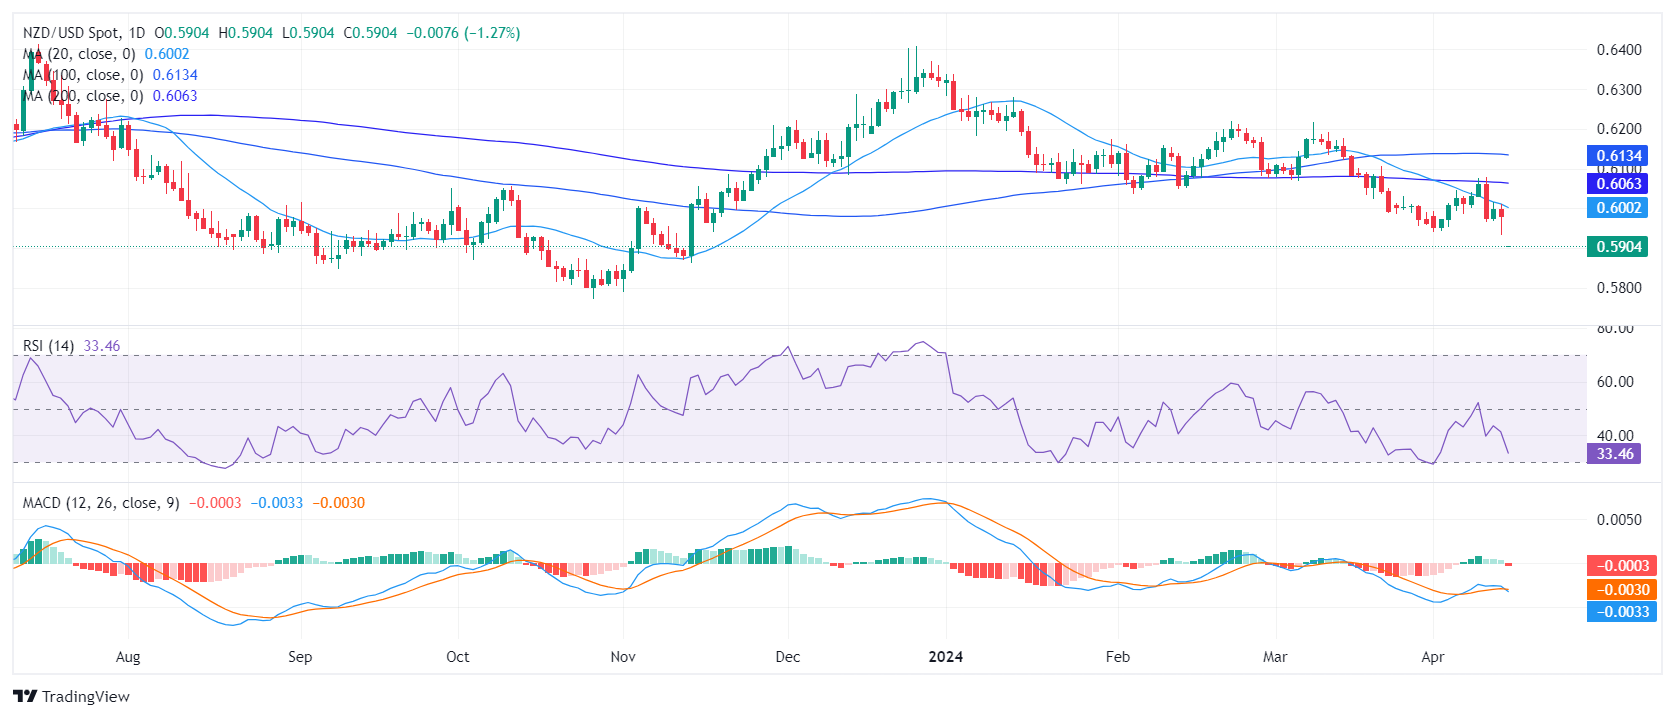
- The daily RSI reveals a negative trend for NZD/USD, suggesting prevalent selling pressure.
- As the RSI stands near oversold conditions, the daily chart hints at a potential consolidation in the next sessions.
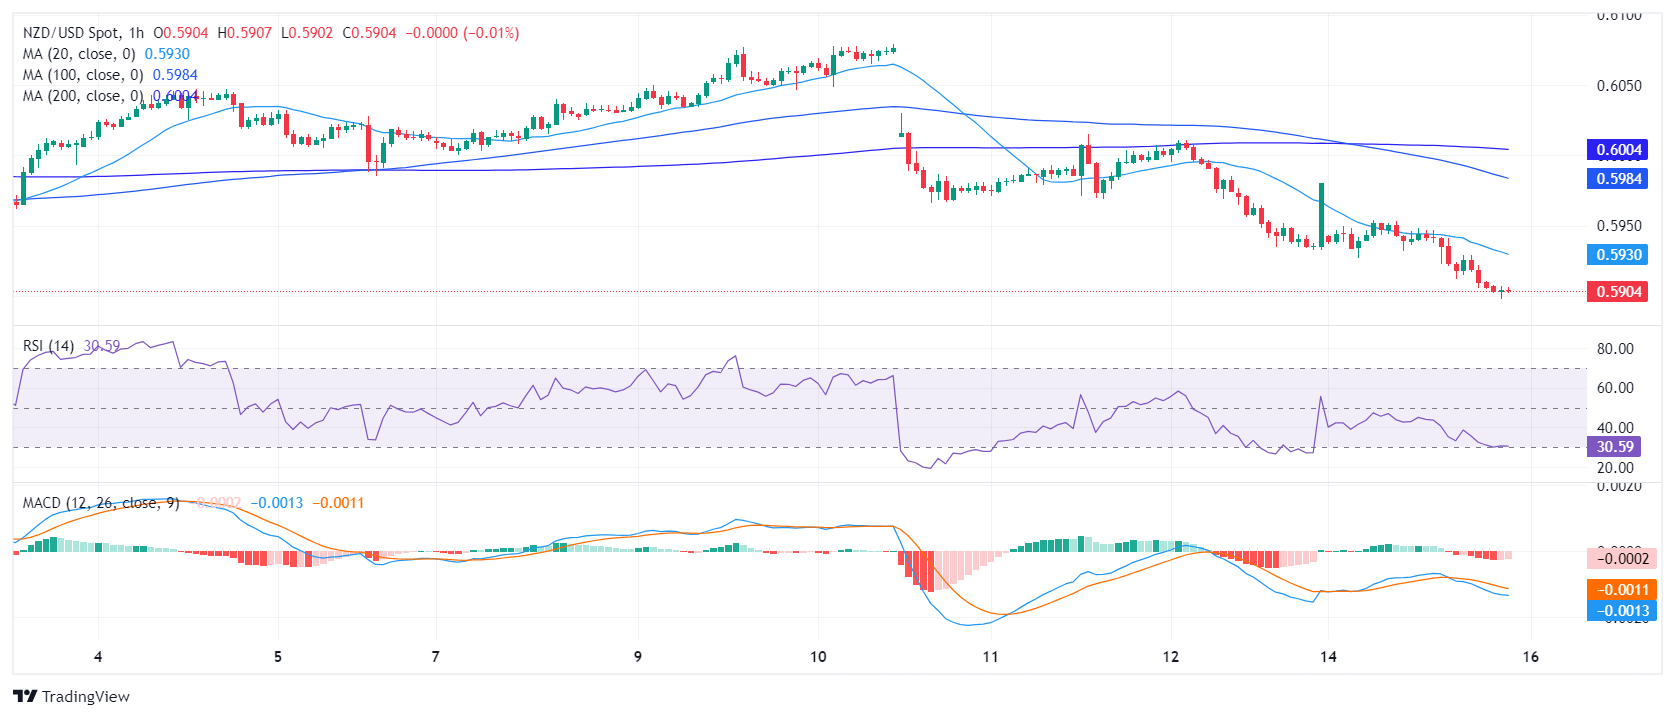
- Indicators on the hourly chart corroborate the selling bias, while subtly highlighting signs of imminent recovery.
The NZD/USD pair is currently trading at around 0.5903, suggesting a stronghold of the sellers in the market. The pair's tendency to trade below the short-term Simple Moving Averages (SMAs) indicates a short-term bearish outlook. However, with the oversold conditions looming, a possible reversal may not be too far off.
On the daily chart, the Relative Strength Index (RSI) readings have remained under a negative trend with the RSI sitting at 35, indicating a nearing oversold condition. This suggests that sellers have dominated the market in recent sessions. The negative momentum is also represented by the fresh red bar of the Moving Average Convergence Divergence (MACD), suggesting a current bearish bias. However, the nearing oversold condition signals the possibility of a trend reversal.
NZD/USD daily chart
Comparing this to the hourly chart, it is observed that the RSI values are still in the negative range and dangerously near the oversold threshold. The MACD histogram presents a flat red bar, indicating negative momentum, and essentially reaffirms the conclusion drawn from the daily charts, that the market has a prevalent selling bias, but there are signs of potential recovery.
NZD/USD hourly chart
Inspecting the broader outlook, the NZD/USD shows a negative outlook as it sits below its 20,100 and 200-day Simple Moving Average (SMA).
In conclusion, both the daily and the hourly technical outlooks suggest a bearish bias for the NZD/USD pair. However, traders should remain cautious of potential reversals given the nearing oversold condition based on the RSI readings.
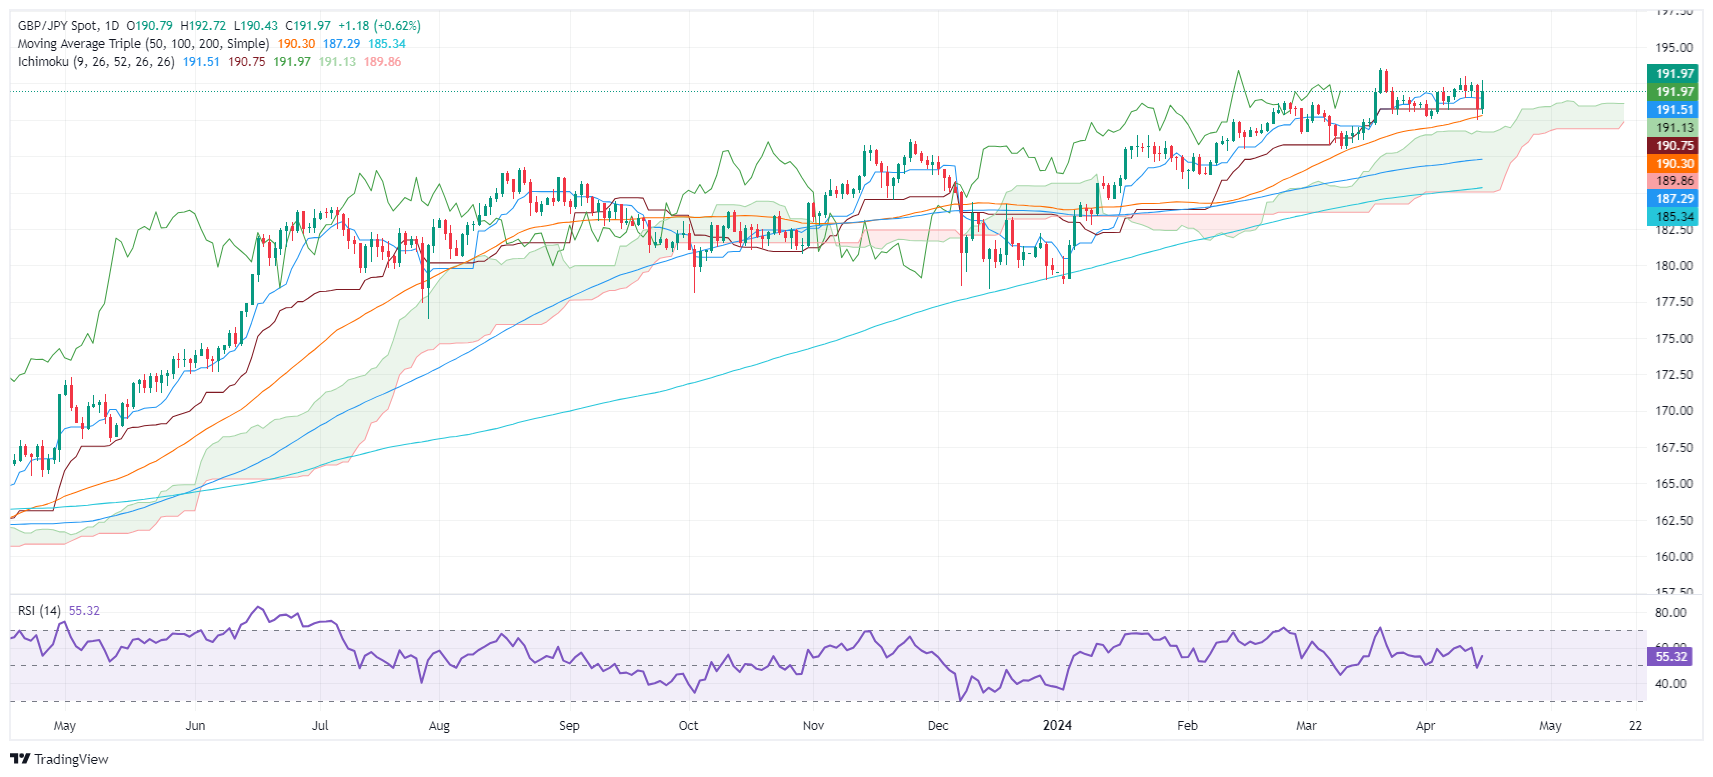
- GBP/JPY climbs 0.60%, nearing the 192.00 resistance as the Japanese Yen weakens.
- The pair has fluctuated between 190.00 and 193.00 for 17 days, with significant moves restricted by crucial technical points.
- Possible intervention from Japanese authorities may drive GBP/JPY down, aiming for initial support at the Ichimoku Cloud's top at 189.00.
The GBP/JPY edges higher during the North American session, up by 0.60%, as the Japanese Yen (JPY) remains the weakest currency on Monday. At the time of writing, the cross-pair exchanges hands at 191.92, shy of cracking 192.00.
GBP/JPY Price Analysis: Technical outlook
During the latest 17-day span, GBP/JPY price action has remained within the 190.00-193.00 boundaries, unable to break below/above the first key support and resistance levels, keeping the pair range bound.
In the event of Japanese authority's intervention, the GBP/JPY might drop below 190.00, sending the pair tumbling toward the top of the Ichimoku Cloud (Kumo) at 189.00, closely followed by the 100-day moving average (DMA) at 187.29.
On the other hand, buyers reclaiming 193.00 look for a challenge of the year-to-date (YTD) high at 193.54, ahead of 194.00.
GBP/JPY Price Action – Daily Chart
Pound Sterling FAQs
The Pound Sterling (GBP) is the oldest currency in the world (886 AD) and the official currency of the United Kingdom. It is the fourth most traded unit for foreign exchange (FX) in the world, accounting for 12% of all transactions, averaging $630 billion a day, according to 2022 data. Its key trading pairs are GBP/USD, aka ‘Cable’, which accounts for 11% of FX, GBP/JPY, or the ‘Dragon’ as it is known by traders (3%), and EUR/GBP (2%). The Pound Sterling is issued by the Bank of England (BoE).
The single most important factor influencing the value of the Pound Sterling is monetary policy decided by the Bank of England. The BoE bases its decisions on whether it has achieved its primary goal of “price stability” – a steady inflation rate of around 2%. Its primary tool for achieving this is the adjustment of interest rates. When inflation is too high, the BoE will try to rein it in by raising interest rates, making it more expensive for people and businesses to access credit. This is generally positive for GBP, as higher interest rates make the UK a more attractive place for global investors to park their money. When inflation falls too low it is a sign economic growth is slowing. In this scenario, the BoE will consider lowering interest rates to cheapen credit so businesses will borrow more to invest in growth-generating projects.
Data releases gauge the health of the economy and can impact the value of the Pound Sterling. Indicators such as GDP, Manufacturing and Services PMIs, and employment can all influence the direction of the GBP. A strong economy is good for Sterling. Not only does it attract more foreign investment but it may encourage the BoE to put up interest rates, which will directly strengthen GBP. Otherwise, if economic data is weak, the Pound Sterling is likely to fall.
Another significant data release for the Pound Sterling is the Trade Balance. This indicator measures the difference between what a country earns from its exports and what it spends on imports over a given period. If a country produces highly sought-after exports, its currency will benefit purely from the extra demand created from foreign buyers seeking to purchase these goods. Therefore, a positive net Trade Balance strengthens a currency and vice versa for a negative balance.
- Gold prices surged over 1% as US Retail Sales data indicates sustained economic robustness.
- Escalating geopolitical tensions between Iran and Israel heighten demand for safe-haven assets, boosting Gold.
- Strong US economic figures aside, Gold gains from physical demand and its safe-haven appeal amid geopolitical uncertainty.
Gold price climbed more than 1% in the mid-North American session following solid economic data from the United States (US). Consumer spending was stronger than expected, which could prevent the US Federal Reserve (Fed) from cutting borrowing costs, which would be a tailwind for the golden metal. Nevertheless, physical demand for Gold and risk aversion might keep the precious metal at around current levels.
XAU/USD trades at $2,384 after hitting a daily low of $2,324. Investors remain concerned about possible Israeli retaliation following Iran’s missile and drone attack over the weekend. Even though the White House urged Israel against retaliation, Israel's military chief said, “There will be a response to Iranian missiles and drones launched toward Israeli territory.”
That might underpin safe-haven assets, including Gold and the US Dollar. It wouldn’t be strange if they moved in tandem.
Elsewhere, US Retail Sales in March were robust. What grabbed the headlines was that sales in the control group—used to calculate the Gross Domestic Product (GDP)—skyrocketed sharply, which could be a prelude to strong growth in the first quarter of 2024.
Following the data release, Gross Domestic Product (GDP) estimates for Q1 2024 show that the US economy is expected to grow 2.8%, up from 2.4% estimated on April 10, according to the Atlanta GDPNow model.
Daily digest market movers: Gold shrugs off strong US Retail Sales and elevated US yields
- March's US Retail Sales saw a 0.7% MoM increase, surpassing the expected 0.4%. This rise contributes to a 2.1% growth in Q1 2024 compared to last year's period, signaling strong consumer activity.
- Retail Sales in the control group, which provides a more accurate measure by excluding volatile items, surged from 0.3% in February to 1.1% MoM in March, significantly exceeding expectations of a 0.4% increase.
- Gold’s price remains high even though US Treasury yields surged more than 10 basis points (bps) in the belly and long end of the yield curve.
- In addition, the US Dollar Index (DXY), which tracks the buck’s performance against a basket of six other currencies, gains 0.20% to 106.22, levels last seen in November 2023.
- New York Fed President John Williams said that his baseline scenario projects rate cuts “will likely start this year.” He thinks the policy is restrictive, adding that strong fundamentals are driving consumer spending.
- Data from the Chicago Board of Trade (CBOT) suggests that traders expect the Fed funds rate to finish at 4.965% in 2024.
Technical analysis: Gold remains bullish despite RSI being in overbought levels
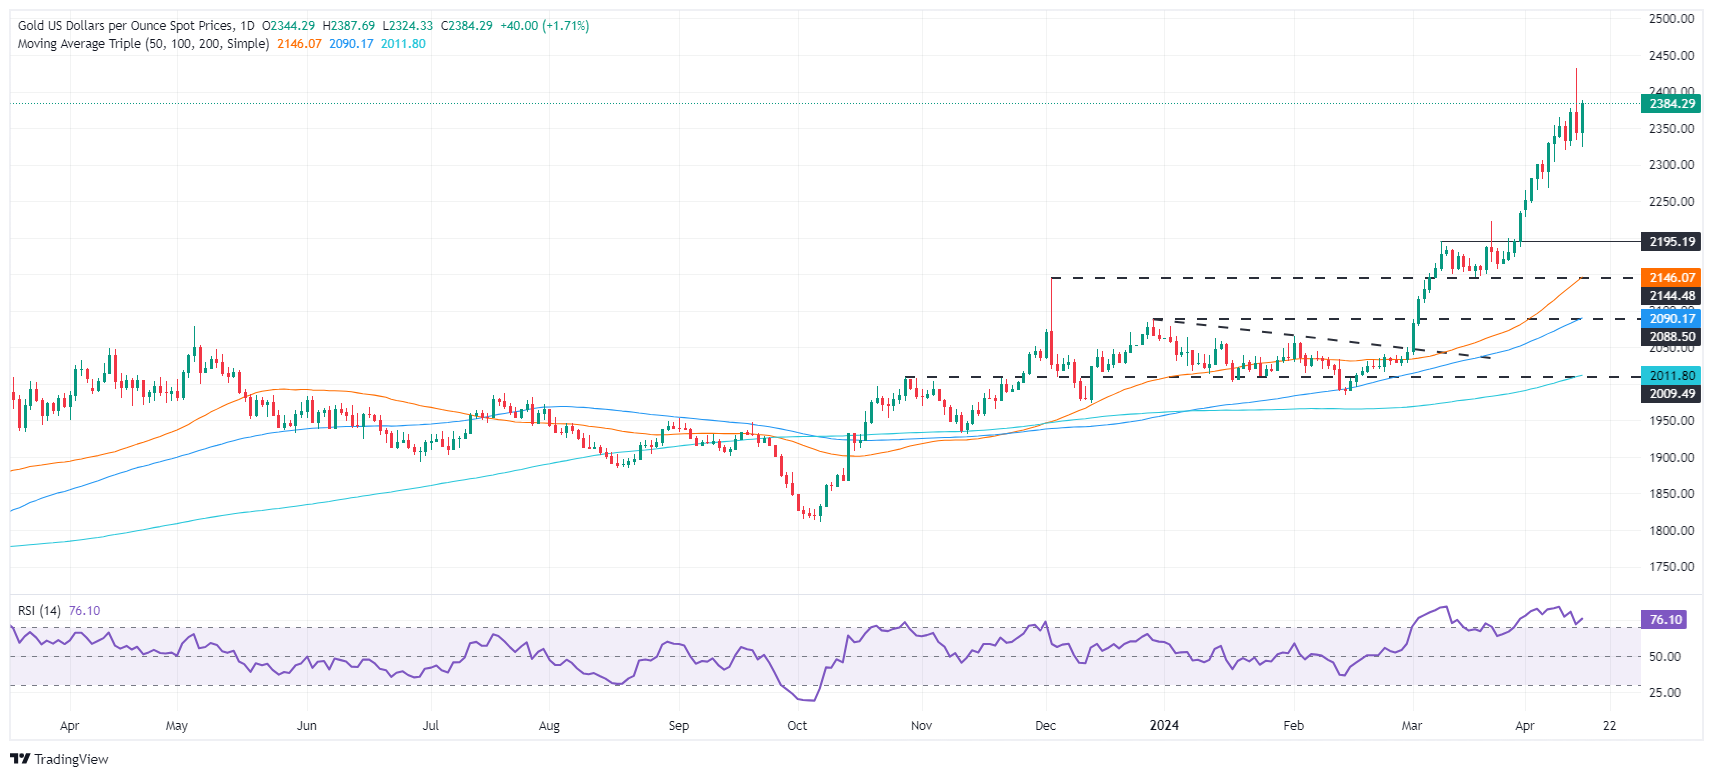
From a technical standpoint, Gold remains upwardly-biased, even though the uptrend is overextended, which is further confirmed by the Relative Strength Index (RSI). The RSI is overbought according to regular “rules,” but traders should be aware that the 80 level is usually seen as the most extreme overbought condition in a strong bullish uptrend. With the RSI at 75.82, XAU/USD’s retest of $2,400 is not off the table. The next resistance would be the all-time high at $2,431, followed by $2,450.
On the flip side, a daily close below the April 12 close of $2,343 could open the door to push Gold’s price toward the $2,300 mark. Once cleared, the next support would be the April 5 swing low of $2,267.
Gold FAQs
Gold has played a key role in human’s history as it has been widely used as a store of value and medium of exchange. Currently, apart from its shine and usage for jewelry, the precious metal is widely seen as a safe-haven asset, meaning that it is considered a good investment during turbulent times. Gold is also widely seen as a hedge against inflation and against depreciating currencies as it doesn’t rely on any specific issuer or government.
Central banks are the biggest Gold holders. In their aim to support their currencies in turbulent times, central banks tend to diversify their reserves and buy Gold to improve the perceived strength of the economy and the currency. High Gold reserves can be a source of trust for a country’s solvency. Central banks added 1,136 tonnes of Gold worth around $70 billion to their reserves in 2022, according to data from the World Gold Council. This is the highest yearly purchase since records began. Central banks from emerging economies such as China, India and Turkey are quickly increasing their Gold reserves.
Gold has an inverse correlation with the US Dollar and US Treasuries, which are both major reserve and safe-haven assets. When the Dollar depreciates, Gold tends to rise, enabling investors and central banks to diversify their assets in turbulent times. Gold is also inversely correlated with risk assets. A rally in the stock market tends to weaken Gold price, while sell-offs in riskier markets tend to favor the precious metal.
The price can move due to a wide range of factors. Geopolitical instability or fears of a deep recession can quickly make Gold price escalate due to its safe-haven status. As a yield-less asset, Gold tends to rise with lower interest rates, while higher cost of money usually weighs down on the yellow metal. Still, most moves depend on how the US Dollar (USD) behaves as the asset is priced in dollars (XAU/USD). A strong Dollar tends to keep the price of Gold controlled, whereas a weaker Dollar is likely to push Gold prices up.
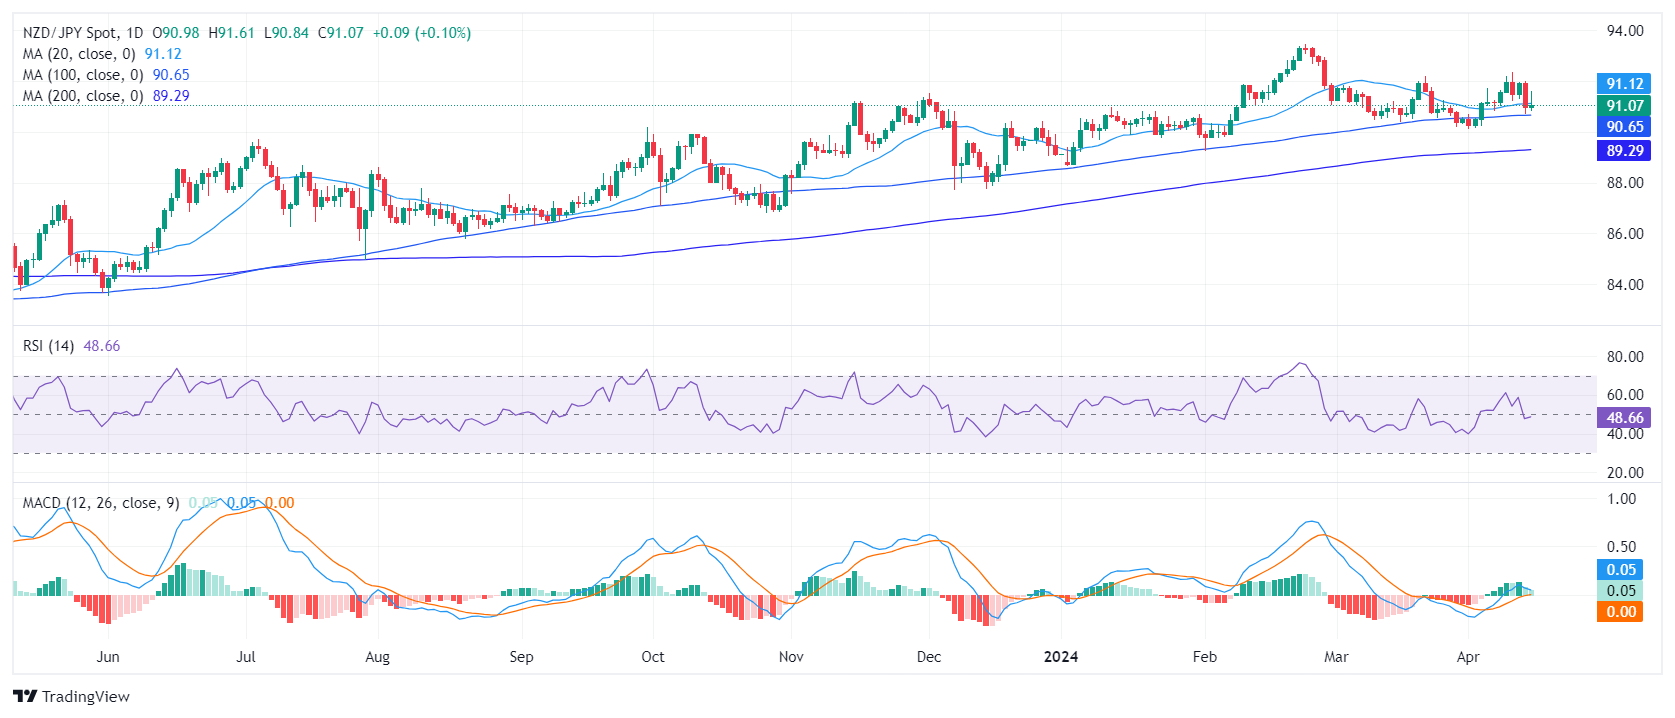
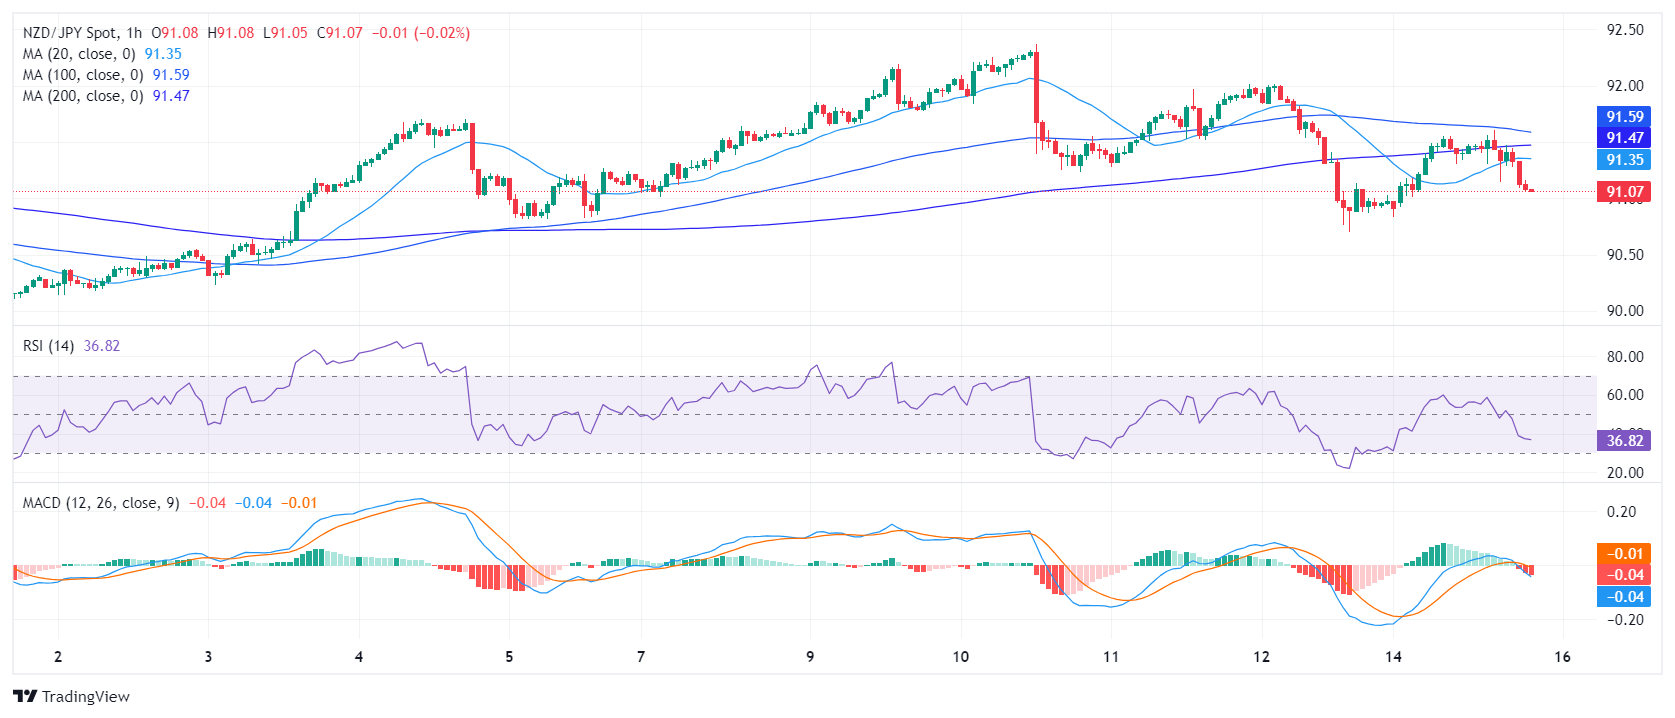
- The daily RSI and MACD reveal a weaker NZD/JPY, pointing towards bearish momentum.
- The negative trend is stronger on the hourly chart.
- Despite short-term bearish inclination, the cross position above main SMAs signifies a bullish sentiment in the longer term.
The NZD/JPY is trading at the 91.14 level, securing some daily gains after peaking at a daily high of 91.60. Despite a bearish short-term trend, the pair maintains a bullish position over the longer term, being positioned above key Simple Moving Averages (SMAs). For the short term, bears seem to be gearing up and bulls starting to weaken.
On the daily chart, the Relative Strength Index (RSI) is currently trending in negative territory, with the latest reading of 49. This, coupled with decreasing green bars on the Moving Average Convergence Divergence (MACD) histogram, indicates a slowdown in positive momentum, suggesting that sellers are currently dominating the market.
NZD/JPY daily chart
Switching to the hourly chart, the RSI similarly shows lower readings, with the latest value at 43, signaling a stronger negative trend in this time frame. Additionally, the MACD histogram shows an increase in red bars, reinforcing the negative momentum. This shift could indicate an increase in selling pressure during recent trading sessions and that the cross may see further downside ahead of the Asian session.
NZD/JPY hourly chart
The broader inspection of NZD/JPY illustrates a mixed technical scenario according to its position relative to its Simple Moving Averages (SMAs). In the short term, bearish tendencies are apparent as the NZD/JPY fell below the 20-day SMA last week and failed to re-conquer it. This move might trigger selling pressure from a short-term perspective. However, the position of NZD/JPY above the 100-day and 200-day SMAs shows a more bullish underlying structure in longer-term horizons.
In case the bulls fail to regain the 20-day SMA, the cross might be exposed to further downside in the coming sessions.
The upside momentum in the Greenback remained unabated, extending the move to fresh yearly highs around 106.20 amidst rising yields in a week that appears to be dominated by increasing geopolitical tensions, particularly in the Middle East.
Here is what you need to know on Tuesday, April 16:
The Greenback maintained its bullish bias and advanced to new 2024 highs near 106.20 when gauged by the USD Index (DXY) on Monday. On April 16, Building Permits, Housing Starts and Industrial Production are all due.
EUR/USD remained on the defensive and slipped back to fresh yearly lows near 1.0620. The Economic Sentiment measured by the ZEW survey in Germany and the euro bloc are expected on April 16.
GBP/USD closed Monday’s session barely changed around the 1.2450 zone. In the UK, the February labour market report is due on April 16.
Further gains propelled USD/JPY to a new 34-year peaks well past the 154.00 barrier. Next on tap in Japan will be the Reuters Tankan Index and Balance of Trade results on April 17.
AUD/USD maintained its negative sentiment well in place and challenged the 2024 lows in the 0.6450-0.6440 band. The next release of note in Oz will be the Westpac Leading Index on April 17.
USD/CAD kept the move higher well and sound, reaching new highs near the 1.3800 yardstick. On April 16, Canadian Inflation Rate and the BoC’s Core Inflation Rate will take centre stage.
USD/CNH extended its consolidative mood near 7.2600, resuming the downside following Friday’s decent advance. On the Chinese calendar, the Q1 GDP Growth Rate, Industrial Production, Retail Sales and the Unemployment Rate are all due on April 16.
WTI dropped for the third straight session on dwindling geopolitical jitters and shrinking probability of a Fed’s rate cut in the summer.
Gold prices rapidly left behind Friday’s pullback and re-focused on the area of the all-time high past $2,400 per troy ounce. The rally in Silver prices resumed its uptrend and retargeted Friday’s peaks near the $30.00 mark per ounce.
- Aussie Dollar falls to 0.6452 after higher-than-expected US Retail Sales show strong consumer activity.
- Rising US Treasury yields suggest diminishing hopes for Federal Reserve rate cuts, shifting market expectations.
- Middle East tensions and forthcoming Chinese economic data will shape AUD/USD's short-term path.
The Aussie Dollar extended its losses against the Greenback during the North American session, dropping some 0.08% after hitting a daily high of 0.6493. The AUD/USD trades at 0.6452 following the release of strong US Retail Sales data.
Australian Dollar weakens as robust US economic data dampen rate cut expectations
The US Department of Labor revealed that Sales in March smashed estimates of 0.4% and rose by 0.7% MoM. At the same time, Retail Sales in the control group– used to calculate the Gross Domestic Product (GDP) – jumped from 0.3% in February to 1.1% MoM in March, crushing forecasts of a 0.4% expansion.
Following the data, US Treasury yields soared, a reflection that investors expected fewer interest rate cuts by the Federal Reserve. Data from the Chicago Board of Trade (CBOT) shows traders expecting two rate cuts instead of three toward the end of the year, an indication that rates would end at the 4.75%-5.00% range.
Other data showed that the National Association of Home Builders (NAHB) Housing Market Index remained unchanged at 51 in April due to mortgage rates standing at 7%. NAHB Chairman Carl Harris said, "April’s flat reading suggests potential for demand growth is there, but buyers are hesitating until they can better gauge where interest rates are headed.”
Risk appetite is significantly impacting the AUD/USD, courtesy of tensions arising in the Middle East. The recent offensive by Iran against Israel, which finished without casualties, has underscored the potential volatility in the region and its potential impact on the AUD/USD.
Earlier, New York Fed President John Williams commented that he expects the US central bank to begin to ease policy in 2024 while emphasizing that current policy is restrictive. Regarding the robust retail sales data, he added that strong fundamentals are driving consumer spending.
The lack of economic data from Australia, would keep investors focused on upcoming Chinese data. China’s schedule would feature Industrial Production, GDP, and Retail Sales. If the data proves to be weak, it could undermine the prospects of the AUD/USD and open the door to test 0.6400.
AUD/USD Price Analysis: Technical outlook
The daily chart confirms the AUD/USD is bearishly biased, with traders eyeing a clear break of the February 13 low of 0.6442, once cleared, would refresh yearly lows and open the door to challenge 0.6400. Further downsides are seen below that level, like the November 10, 2023, low at 0.6336. On the other hand, if buyers lift the AUD/USD past 0.6450, look for an impulse move toward 0.6500.
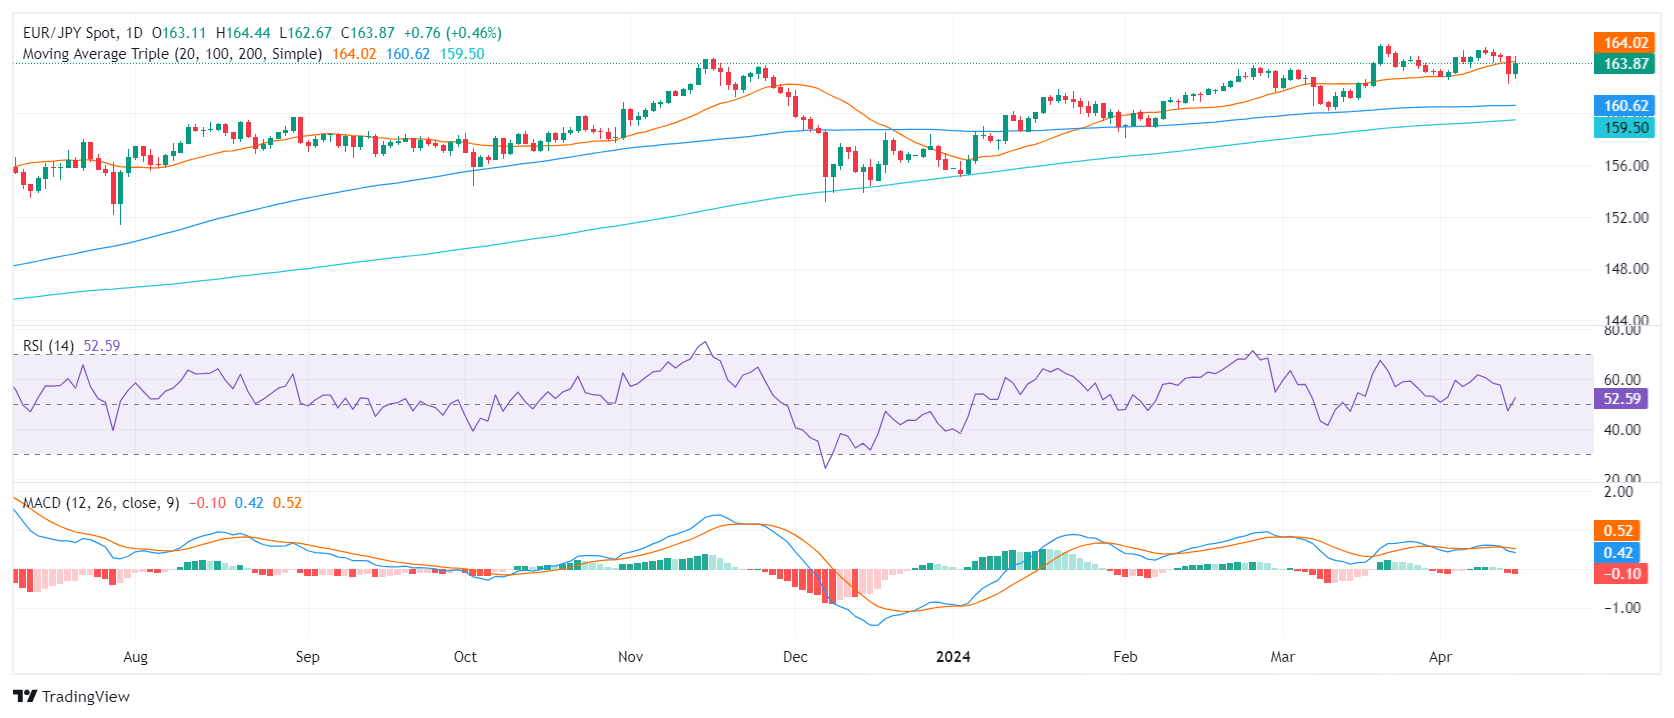
- The daily EUR/JPY chart reveals a cautiously optimistic tone, despite a somewhat weakened RSI.
- Indicators on the hourly chart also suggest weakening buying momentum.
- If bulls fail to recapture the 20-day SMA, additional downside may be incoming.
The EUR/JPY pair is currently trading at 163.80, indicating a rise of 0.46%. The cross maintains a positive long-term outlook, despite the short-term bearish impulses from sellers which breached through the 20-day Simple Moving Average (SMA). For the session, bulls seem to have already given all as indicators lose traction in the shorter timeframes.
The latest daily EUR/JPY chart session has shown a Relative Strength Index (RSI) in the positive territory, reflecting a mildly bullish sentiment. However, the fluctuating RSI observed in the last sessions and the recent dip into the negative territory suggests that bears are gearing up. Concurrently, the Moving Average Convergence Divergence (MACD) histogram reveals an uptrend with rising red bars, highlighting bearish momentum.
EUR/JPY daily chart
Turning to the hourly EUR/JPY chart, the RSI appears predominantly positive with a current reading of 57 but points downwards. The MACD Histogram on this timeframe shows diminishing green bars, further indicating lessening bullish momentum.
EUR/JPY hourly chart
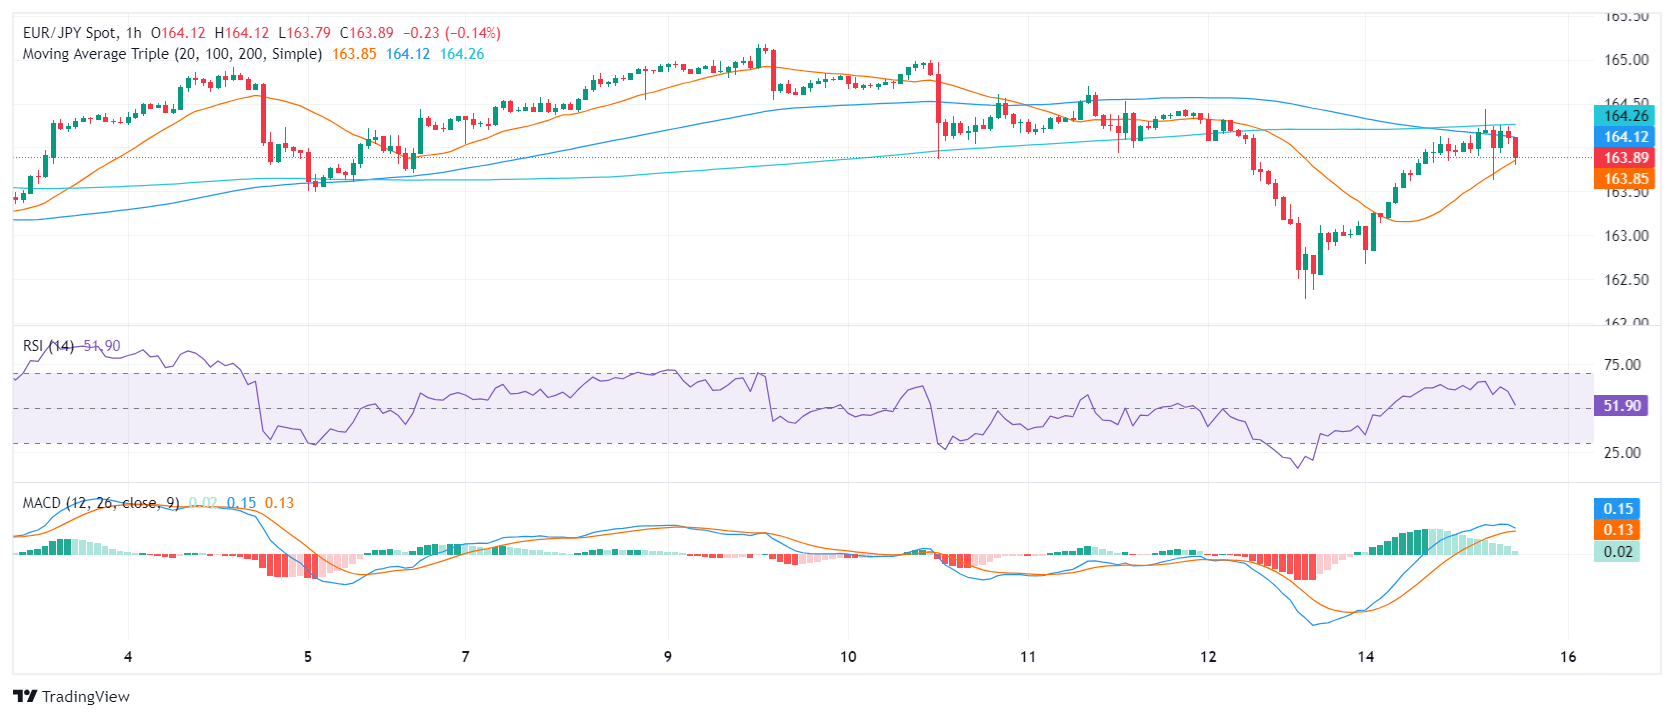
From a broader perspective, the EUR/JPY is giving mixed signals. Notably, it has fallen below its 20-day Simple Moving Average (SMA) today which may be seen as a bearish short-term indicator. However, it stays above both its 100-day and 200-day SMAs, suggesting a persisting long-term bullish trend.
In summary, the technical indicators on both the daily and hourly charts present a mixed outlook for the EUR/JPY pair. The short-term bearish signals are juxtaposed with a sustained long-term bullish trend, signifying prospective market volatility. Buyers seem to have made one last stride on Monday, but their momentum is weakening, and unless the buyers regain the 20-day SMA, the outlook might shift in favor of the bears.
- The Euro resumes its decline following strong US Retail Sales data
- The divergence between the ECB and the Fed's rate outlook is expected to weigh on the Euro.
- Geopolitical concerns are an additional support for the safe-haven USD.
The Euro’s mild upside bias seen during Monday’s European session has been hammered during US trading. The release of better-than-expected US Retail Sales has pushed US Treasury yields to fresh mid-term highs, bringing the US Dollar up with them.
Data released by the US Commerce Department revealed that retail consumption increased by 0.7% in March from 0.9% in February, beating expectations of a 0.3% rise. Excluding autos, total retail and food sales increased 1.1%, their best reading since January 2023.
Fed and ECB’s monetary divergence is weighing on the Euro
These figures highlight the strong US economic outlook and endorse the view that the Fed will have to keep rates at high levels for a longer time. This is underpinning demand for the USD.
The Eurozone context is the polar opposite, with inflation trending lower and the economy stalling. This has prompted the ECB to hint towards interest rate cuts, probably in June, putting the European Central Bank in the pole position for monetary easing and weighing on demand for the Euro.
Beyond that, investors’ concerns about an escalation of the Middle East conflict, as Israel weighs the options to retaliate from Iran’s missile attack is an additional support for the safe-haven US Dollar.
- Mexican Peso falls against strengthening US Dollar, driven by unexpectedly robust US Retail Sales for March.
- Mexico’s absence of significant data leaves USD/MXN pair more responsive to US economic data, risk appetite.
- Forecasts for US economic growth look promising, Atlanta GDP Now predicting 2.4% growth rate in Q1 2024.
The Mexican Peso (MXN) depreciates against the US Dollar on Monday, courtesy of strong economic data from the United States (US) and higher US Treasury yields. Retail Sales in March were solid, keeping the Greenback bid and poised to test the highs of November 2023, according to the US Dollar Index (DXY). At the time of writing, the USD/MXN trades at 16.68, a gain of 0.23%.
With Mexico’s economic calendar relatively light, the focus for USD/MXN traders shifts to US Dollar dynamics and overall market sentiment. The next significant data release for Mexico, the Retail Sales data, is scheduled for April 19, 2024.
March’s Retail Sales in the US smashed estimates, an indication that Americans continued to spend despite higher interest rates set by the US Federal Reserve (Fed). It should be noted that sales in the control group – used to calculate the Gross Domestic Product (GDP) – skyrocketed sharply, which could be a prelude to strong growth in the first quarter of 2024.
Atlanta GDP Now estimates the US economy will grow 2.4% in Q1 2024, according to its latest update on April 10, 2024. The model will be updated later on Monday.
Daily digest market movers: Mexican Peso hurt by strong US Retail Sales
- March’s US Retail Sales increased by 0.7% MoM, exceeding estimates of 0.4%. This shows an increase of 2.1% in Q1 2024 compared to last year's first quarter, an indication of consumer strength.
- Retail Sales in the control group jumped from 0.3% in February to 1.1% MoM in March, crushing forecasts of a 0.4% expansion.
- Geopolitical tensions in the Middle East would likely weigh on the Mexican currency. USD/MXN traders must be aware that any escalation could prompt traders to ditch the Mexican Peso and buy US Dollars.
- Following the data release in the US, Treasury yields surged more than 10 basis points (bps) in the belly and long end of the yield curve. That underpins the Greenback, which, according to the DXY, is up a modest 0.09% at 106.17.
- New York Fed President John Williams said that his baseline scenario projects rate cuts “will likely start this year.” He thinks the policy is restrictive, adding that strong fundamentals are driving consumer spending.
- Data from the Chicago Board of Trade (CBOT) suggests that traders expect the fed funds rate to finish 2024 at 4.975%.
Technical analysis: Mexican Peso consolidates as USD/MXN hovers around 16.62
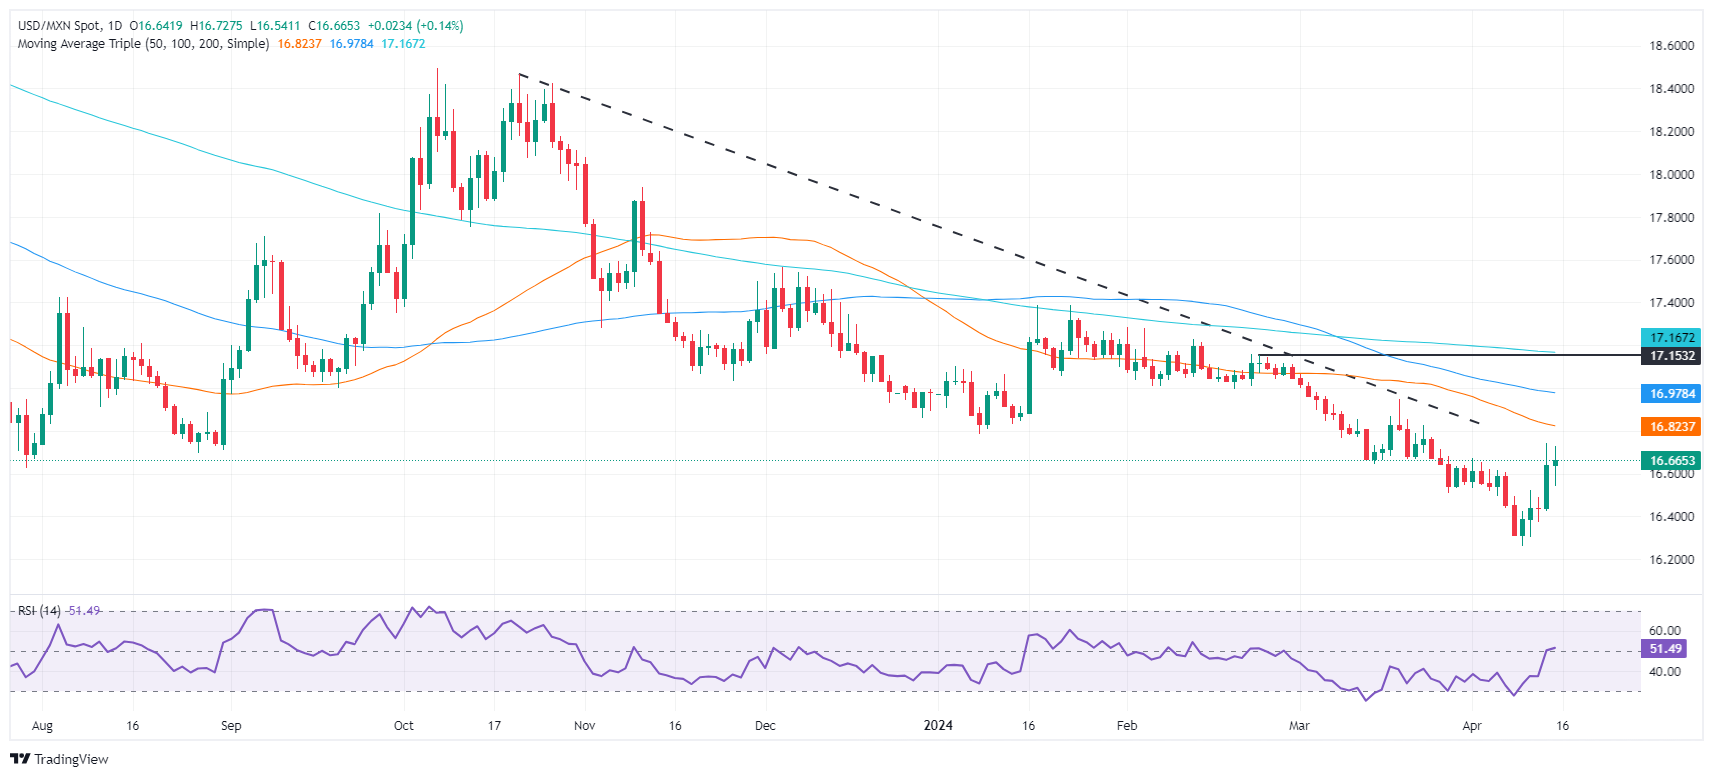
The USD/MXN daily chart portrays the pair as neutrally biased, after achieving a daily close near the 2023 low of 16.62. Despite that, downside risks remain as the latest cycle high at 16.94 reared its head on March 19. Once it’s cleared, the exotic pair would shift to neutral-bullish.
On the upside, the first resistance would be the April 12 high at 16.74. A breach of that level would expose the 50-day Simple Moving Average (SMA) at 16.78, followed by the 100-day SMA at 16.97, before testing 17.00. On the other hand, if USD/MXN slides below 16.62, look for a test of the April 12 low of 16.40.
Mexican Peso FAQs
The Mexican Peso (MXN) is the most traded currency among its Latin American peers. Its value is broadly determined by the performance of the Mexican economy, the country’s central bank’s policy, the amount of foreign investment in the country and even the levels of remittances sent by Mexicans who live abroad, particularly in the United States. Geopolitical trends can also move MXN: for example, the process of nearshoring – or the decision by some firms to relocate manufacturing capacity and supply chains closer to their home countries – is also seen as a catalyst for the Mexican currency as the country is considered a key manufacturing hub in the American continent. Another catalyst for MXN is Oil prices as Mexico is a key exporter of the commodity.
The main objective of Mexico’s central bank, also known as Banxico, is to maintain inflation at low and stable levels (at or close to its target of 3%, the midpoint in a tolerance band of between 2% and 4%). To this end, the bank sets an appropriate level of interest rates. When inflation is too high, Banxico will attempt to tame it by raising interest rates, making it more expensive for households and businesses to borrow money, thus cooling demand and the overall economy. Higher interest rates are generally positive for the Mexican Peso (MXN) as they lead to higher yields, making the country a more attractive place for investors. On the contrary, lower interest rates tend to weaken MXN.
Macroeconomic data releases are key to assess the state of the economy and can have an impact on the Mexican Peso (MXN) valuation. A strong Mexican economy, based on high economic growth, low unemployment and high confidence is good for MXN. Not only does it attract more foreign investment but it may encourage the Bank of Mexico (Banxico) to increase interest rates, particularly if this strength comes together with elevated inflation. However, if economic data is weak, MXN is likely to depreciate.
As an emerging-market currency, the Mexican Peso (MXN) tends to strive during risk-on periods, or when investors perceive that broader market risks are low and thus are eager to engage with investments that carry a higher risk. Conversely, MXN tends to weaken at times of market turbulence or economic uncertainty as investors tend to sell higher-risk assets and flee to the more-stable safe havens.
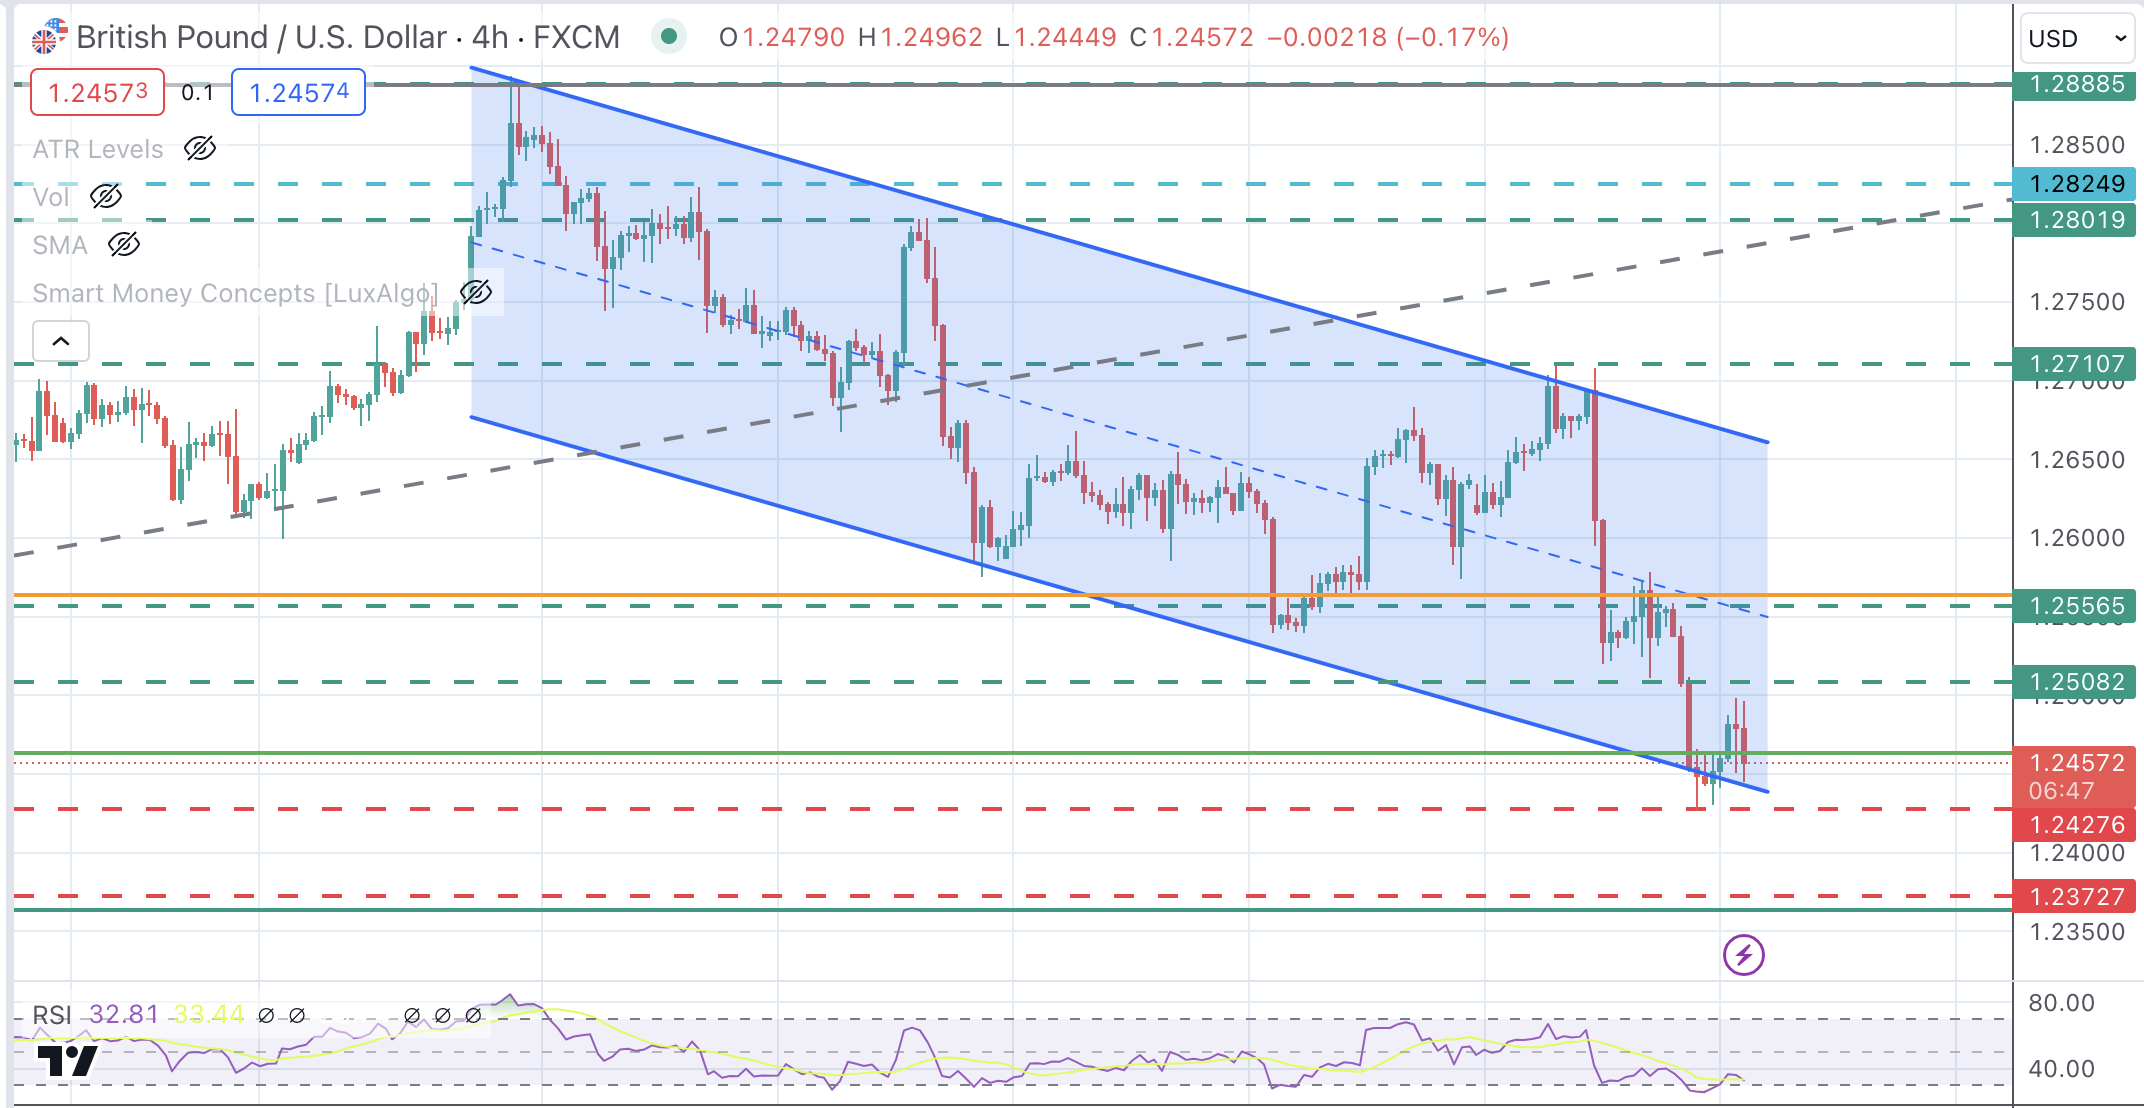
- Pound’s failure to break resistance at 1.2500 leaves bears in control.
- Strong US retail sales figures have pushed the pair back to the bottom of the monthly channel, at 1.2440.
- Below 2.1430, the next support levels are 1.2370 and 1.2220.
Sterling’s recovery attempts have failed to find a significant acceptance above the 1.2500 level earlier on Monday. The pair has succumbed to the broad-based US Dollar strength after the release of upbeat US retail sales figures.
US Consumer spending has beaten expectations in MArch adding to the evidence of a strong US economic outlook. Beyond that, growing concerts about the consequences of an escalation in the Middle East conflict are additional support for the safe-haven USD.
GBP/USD Price Analysis: Technical outlook
Bears have pushed the pair back to the bottom of the monthly descending channel, at 1.2440, which is being tested at the moment. Last Friday’s low is right below there, at 1.2430. A clear break of that support area clears the path towards 1.2370. Further down there is no support until 1.2220.
On the upside 1.2505 level should be cleared to advance towards 1.2565, where an unmitigated order block may provide a fresh boost for bears.
GBP/USD 4-Hour Chart
- DXY Index notes a slight uptick, currently trading near 106.00 mark.
- March Retail Sales exceed forecasts, bolstering bond yields and the US Dollar.
- Fed appears hawkish, adjustments to easing expectations produced Greenback rally last week.
The US Dollar Index (DXY) is currently trading higher near 106.05 on Monday, slightly down from its peak of 106.10 hit last week. Strong economic data continues to favor the hawkish rhetoric from the Federal Reserve (Fed), and the Greenback benefits from rising US Treasury yields. Tensions between Israel and Iran also contribute to a cautious market mood, which tends to favor the US Dollar.
The US economy shows robustness with Q1 growth indicating resilience and rising consumer spending backed by sturdy labour demand. The Fed's stance leans toward hawkishness, adjusting its easing expectations and starting to signal a delay in rate cuts, buoyed by continuous robust growth and persistent inflation.
Daily digest market movers: DXY gains some ground as US Retail Sales surpass expectations
- The US Census Bureau revealed that March's Retail Sales grew by 0.7% growth YoY, which is more than double the anticipated yearly growth rate of 0.3%.
- In reflection of the Fed position, hawkish sentiment continues to dominate as last week officials started to hint at a delay of rate cuts.
- Regarding expectations, the likelihood of a June cut fell to 25%, marking a decline from the previous week's 60%. Concurrently, the probability for a July cut fell below 60%, in stark contrast to its previous full certainty.
- The market now predicts the first cut in September, with only a 75% likelihood of a second cut in December.
- US Treasury bond yields remain high, the 2-year yield stands at 4.94%, the 5-year yield at 4.65%, and the 10-year yield is set at 4.63%.
DXY technical analysis: DXY shows overbought conditions, might correct in the next sessions
The technical indicators on the daily chart reflect overbought conditions through the Relative Strength Index (RSI). This signifies that buyers have been dominating recently, driving up the value of DXY. However, this can often precede a correction if buyers become exhausted.
Simultaneously, the Moving Average Convergence Divergence (MACD) corroborates this leaning, exhibiting rising green bars. Such a pattern usually signals that the buyers have considerable momentum at their back.
US Dollar FAQs
The US Dollar (USD) is the official currency of the United States of America, and the ‘de facto’ currency of a significant number of other countries where it is found in circulation alongside local notes. It is the most heavily traded currency in the world, accounting for over 88% of all global foreign exchange turnover, or an average of $6.6 trillion in transactions per day, according to data from 2022. Following the second world war, the USD took over from the British Pound as the world’s reserve currency. For most of its history, the US Dollar was backed by Gold, until the Bretton Woods Agreement in 1971 when the Gold Standard went away.
The most important single factor impacting on the value of the US Dollar is monetary policy, which is shaped by the Federal Reserve (Fed). The Fed has two mandates: to achieve price stability (control inflation) and foster full employment. Its primary tool to achieve these two goals is by adjusting interest rates. When prices are rising too quickly and inflation is above the Fed’s 2% target, the Fed will raise rates, which helps the USD value. When inflation falls below 2% or the Unemployment Rate is too high, the Fed may lower interest rates, which weighs on the Greenback.
In extreme situations, the Federal Reserve can also print more Dollars and enact quantitative easing (QE). QE is the process by which the Fed substantially increases the flow of credit in a stuck financial system. It is a non-standard policy measure used when credit has dried up because banks will not lend to each other (out of the fear of counterparty default). It is a last resort when simply lowering interest rates is unlikely to achieve the necessary result. It was the Fed’s weapon of choice to combat the credit crunch that occurred during the Great Financial Crisis in 2008. It involves the Fed printing more Dollars and using them to buy US government bonds predominantly from financial institutions. QE usually leads to a weaker US Dollar.
Quantitative tightening (QT) is the reverse process whereby the Federal Reserve stops buying bonds from financial institutions and does not reinvest the principal from the bonds it holds maturing in new purchases. It is usually positive for the US Dollar.
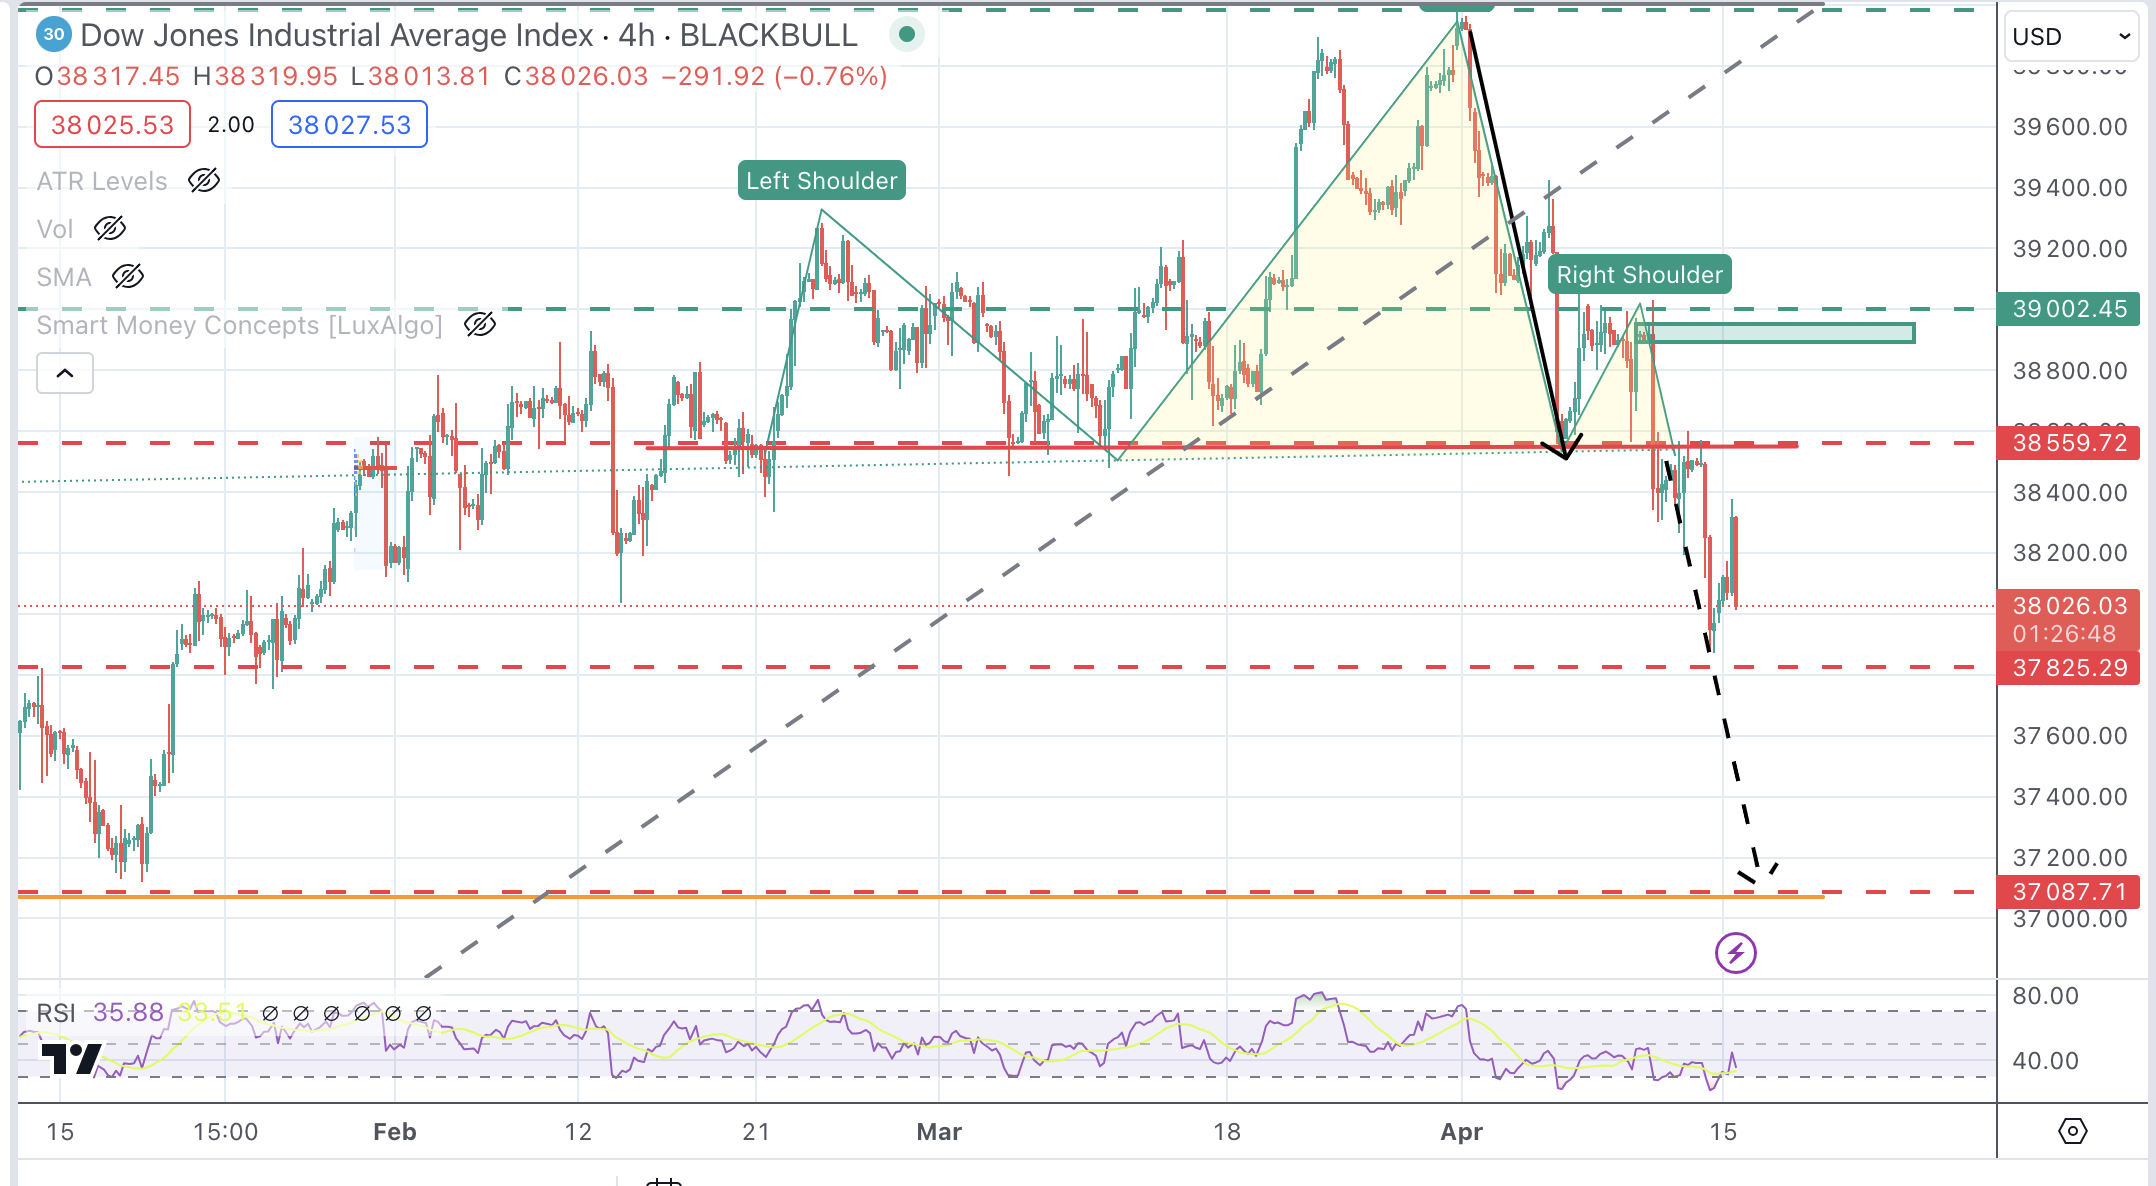
- Dow Jones index ticks up after upbeat US Retail Sales with Middle East tensions limiting gains.
- Goldman Sachs is leading gains, following better-than-expected quarterly results.
- The technical picture remains bearish with DJIA drifting away from March high.
The Dow Jones Industrial Average (DJIA) has opened the week with mild gains, retracing some ground following last Friday’s sell-off. Investors, however, are taking a cautious stance wary that the Middle East conflict might escalate into a regional war involving Iran.
Traders are holding their breath as Israel considers its options to retaliate against Iran, with right-wing ministers calling for an immediate response.
Retail Sales data from the US has beaten expectations, confirming the strong momentum of the US economy. This is positive for market sentiment, although its consequences for monetary policy push back on hopes of interest rate cuts by the Federal Reserve (Fed), creating negative pressure on stocks.
All in all, Wall Street is trading higher. The Dow Jones leads gains, 0.31% higher, to 38,097. The S&P 500 trades up 0.21% at 5,134, and the NASDAQ is practically flat at 16,175 during the US morning session.
Dow Jones news
Most of the Wall Street sectors are posting gains on Monday as the Health sector leads with a 0.8% advance. That sector is followed by the Financials, up 0.6%, and Materials, gaining 0.5%. Only Real Estate and Utilities are losing value, down 0.93% and 0.23%, respectively.
Goldman Sachs (GS) is leading gains on Monday with a 3.7% rally to $403.85, fuelled by better-than-expected quarterly results. Next is Intel (INTC), which rises 2.6% to $36.44. On the losing end, Salesforce (CRM) drops 5.4% as news reports suggest that the software firm is in talks to acquire Informatica.
Dow Jones technical outlook
The technical picture shows the bears in control as the Dow Jones index drifts away from the historic highs reached in March. The move below 38,560 has activated a bearish Head & Shoulders pattern that might hint toward a sharper decline.
The next bearish target is 37,825. Below here the measured target of the H&S pattern, which meets the mid-January low and 38.6% Fibonacci retracement, comes at 37,087. A bullish reaction should overcome the 38,540 to open the path toward 39,000 (order block).
Dow Jones Index 4 -Hour Chart
S&P 500 FAQs
The S&P 500 is a widely followed stock price index which measures the performance of 500 publicly owned companies, and is seen as a broad measure of the US stock market. Each company’s influence on the computation of the index is weighted based on market capitalization. This is calculated by multiplying the number of publicly traded shares of the company by the share price. The S&P 500 index has achieved impressive returns – $1.00 invested in 1970 would have yielded a return of almost $192.00 in 2022. The average annual return since its inception in 1957 has been 11.9%.
Companies are selected by committee, unlike some other indexes where they are included based on set rules. Still, they must meet certain eligibility criteria, the most important of which is market capitalization, which must be greater than or equal to $12.7 billion. Other criteria include liquidity, domicile, public float, sector, financial viability, length of time publicly traded, and representation of the industries in the economy of the United States. The nine largest companies in the index account for 27.8% of the market capitalization of the index.
There are a number of ways to trade the S&P 500. Most retail brokers and spread betting platforms allow traders to use Contracts for Difference (CFD) to place bets on the direction of the price. In addition, that can buy into Index, Mutual and Exchange Traded Funds (ETF) that track the price of the S&P 500. The most liquid of the ETFs is State Street Corporation’s SPY. The Chicago Mercantile Exchange (CME) offers futures contracts in the index and the Chicago Board of Options (CMOE) offers options as well as ETFs, inverse ETFs and leveraged ETFs.
Many different factors drive the S&P 500 but mainly it is the aggregate performance of the component companies revealed in their quarterly and annual company earnings reports. US and global macroeconomic data also contributes as it impacts on investor sentiment, which if positive drives gains. The level of interest rates, set by the Federal Reserve (Fed), also influences the S&P 500 as it affects the cost of credit, on which many corporations are heavily reliant. Therefore, inflation can be a major driver as well as other metrics which impact the Fed decisions.
- Canadian Dollar gives away gains as USD bounces up following strong Retail Sales data.
- Investors’ concern that Middle East conflict might escalate provides additional support to the safe-haven US Dollar.
- Oil prices have depreciated nearly 3.5% from early April highs, adding negative pressure to CAD.
The Canadian Dollar (CAD) recovery attempt seen during Monday’s European session has been short-lived. The US Dollar has resumed its bullish trend as better-than-expected retail consumption data has confirmed the strong momentum of the US economy.
The strong Retail Sales figures come after last week’s sticky inflation numbers, strengthening the view that the Federal Reserve (Fed) will be keeping rates higher for longer. This is supporting the US Dollar, which has additional support from the volatile situation in the Middle East. Israel is considering retaliating against Iran, which could spark a regional conflict, which ultimately increases demand for the USD on the back of its safe-haven status.
In Canada, February’s Manufacturing Sales data improved, as expected, although Wholesale Sales stalled. Furthermore, Oil prices, Canada’s main export, are pulling back from last week’s highs, adding pressure to the Loonie.
Daily digest market movers: USD/CAD maintains its bullish tone on bright US data and risk aversion
- Canadian Dollar retraces previous gains, with the USD bouncing up on upbeat consumption data. The daily chart is practically flat.
- US Retail Sales increased 0.7% in March from 0.9% in February, well above the 0.3% increment expected by the market.
- Excluding autos, total sales of retail and food stores have risen 1.1%, their best reading since January 2023. The market had expected a 0.4% advance.
- NY Fed President John Williams has acknowledged the importance of the recent inflation levels but assured that he expects rate cuts to come this year.
- Canada’s Manufacturing Sales increased 0.7% in February from 0% in the previous month, in line with the market forecasts.
- Canadian Wholesale Sales, however, stalled in February against market expectations of a 0.8% increase.
- WTI Oil prices have retreated to two-week lows at the mid-range of $84, down from the $87.60 high reached over the previous weeks.
Canadian Dollar price today
The table below shows the percentage change of Canadian Dollar (CAD) against listed major currencies today. Canadian Dollar was the weakest against the Pound Sterling.
| USD | EUR | GBP | CAD | AUD | JPY | NZD | CHF | |
| USD | 0.08% | 0.00% | -0.03% | 0.18% | 0.66% | 0.38% | 0.00% | |
| EUR | -0.07% | -0.08% | -0.10% | 0.10% | 0.58% | 0.30% | -0.07% | |
| GBP | -0.01% | 0.08% | -0.03% | 0.17% | 0.66% | 0.37% | 0.01% | |
| CAD | 0.03% | 0.11% | 0.02% | 0.20% | 0.68% | 0.40% | 0.02% | |
| AUD | -0.18% | -0.11% | -0.19% | -0.21% | 0.47% | 0.19% | -0.18% | |
| JPY | -0.65% | -0.57% | -0.63% | -0.68% | -0.47% | -0.25% | -0.65% | |
| NZD | -0.38% | -0.31% | -0.39% | -0.40% | -0.21% | 0.28% | -0.37% | |
| CHF | 0.00% | 0.07% | -0.01% | -0.04% | 0.16% | 0.65% | 0.37% |
The heat map shows percentage changes of major currencies against each other. The base currency is picked from the left column, while the quote currency is picked from the top row. For example, if you pick the Euro from the left column and move along the horizontal line to the Japanese Yen, the percentage change displayed in the box will represent EUR (base)/JPY (quote).
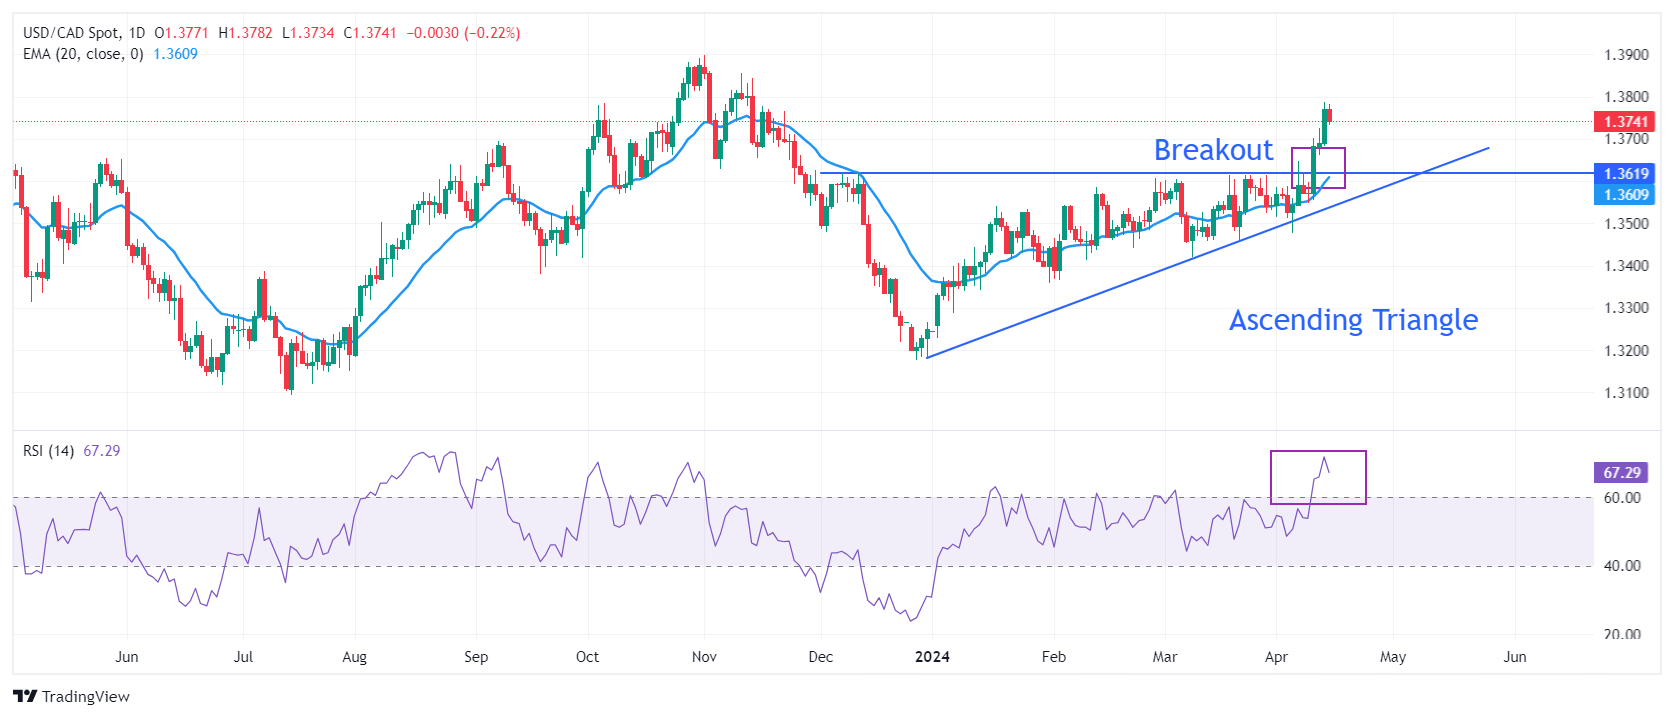
Technical analysis: USD/CAD remains bullish, with downside attempts limited above 1.3700
The US Dollar maintains the bullish bias intact, with the Loonie’s recovery attempt capped well above previous highs in the 1.3700 area so far.
The pair broke the top of last month’s trading channel last week and is now testing the resistance area at 1.3780. The USD/CAD pair is at overbought levels but not at extremes, with the measured target of the broken channel at the mid-November high of 1.3845. On the downside, supports are 1.3680-1.3660 and below there at 1.3545.
USD/CAD Daily Chart
Risk sentiment FAQs
In the world of financial jargon the two widely used terms “risk-on” and “risk off'' refer to the level of risk that investors are willing to stomach during the period referenced. In a “risk-on” market, investors are optimistic about the future and more willing to buy risky assets. In a “risk-off” market investors start to ‘play it safe’ because they are worried about the future, and therefore buy less risky assets that are more certain of bringing a return, even if it is relatively modest.
Typically, during periods of “risk-on”, stock markets will rise, most commodities – except Gold – will also gain in value, since they benefit from a positive growth outlook. The currencies of nations that are heavy commodity exporters strengthen because of increased demand, and Cryptocurrencies rise. In a “risk-off” market, Bonds go up – especially major government Bonds – Gold shines, and safe-haven currencies such as the Japanese Yen, Swiss Franc and US Dollar all benefit.
The Australian Dollar (AUD), the Canadian Dollar (CAD), the New Zealand Dollar (NZD) and minor FX like the Ruble (RUB) and the South African Rand (ZAR), all tend to rise in markets that are “risk-on”. This is because the economies of these currencies are heavily reliant on commodity exports for growth, and commodities tend to rise in price during risk-on periods. This is because investors foresee greater demand for raw materials in the future due to heightened economic activity.
The major currencies that tend to rise during periods of “risk-off” are the US Dollar (USD), the Japanese Yen (JPY) and the Swiss Franc (CHF). The US Dollar, because it is the world’s reserve currency, and because in times of crisis investors buy US government debt, which is seen as safe because the largest economy in the world is unlikely to default. The Yen, from increased demand for Japanese government bonds, because a high proportion are held by domestic investors who are unlikely to dump them – even in a crisis. The Swiss Franc, because strict Swiss banking laws offer investors enhanced capital protection.
- USD/JPY continues its ascent, breaking past 154.00, driven by strong US economic data and risk aversion from Middle East tensions.
- March's robust US Retail Sales highlight ongoing consumer strength, pushing up US Treasury yields.
- Japanese officials voice worries over swift currency fluctuations, staying in close contact with global partners on financial and FX market developments.
The US Dollar extended its gains versus the Japanese Yen in early trading in the North American session, climbing above the 154.00 figure, although Japanese officials remain wary of the fast advance of the currency. Nevertheless, the USD/JPY exchanges hand at 154.37, up by 0.71, refreshing 34-year highs.
US Dollar strengthens against Yen, despite verbal intervention by Japanese officials
Over the weekend, developments in the Middle East spurred risk aversion in the financial markets. Due to remaining closed, Bitcoin was the main loser, though it has trimmed some of the pain inflicted on risk appetite. Iran’s offensive against Israel finished without casualties, though Tehran made its point that they would not remain arms crossed if Israel escalated the conflict.
According to Bloomberg, some US officials speaking anonymously said that the White House is urging Israel against retaliation.
Aside from these developments, economic data from the United States (US) sponsored the USD/JPY last leg-up, though it remains shy of cracking the 150.00 mark.
The US Department of Labor revealed that Retail Sales in March rose by 0.7% MoM, above expectations of 0.4%. This shows an increase of 2.1% in Q1 2024 compared to last year's first quarter, an indication of consumers' strength.
Following the data, US Treasury yields are skyrocketing, with the short and long end of the curve rising more than 10 basis points (bps).
Fed’s Williams look for cuts in 2024
In the meantime, New York Fed President John Williams said that his baseline scenario projects rate cuts “will likely start this year.” He thinks the policy is restrictive, adding that strong fundamentals are driving consumer spending.
On the Japanese front, officials remain vocal, emphasizing that fast Forex moves are undesirable and should reflect fundamentals. Recently, a Senior Japan MoF Official said they’re in frequent and regular talks with the US and other countries' authorities on financial and FX market moves.
USD/JPY Price Analysis: Technical outlook
From a technical standpoint, the USD/JPY rally might continue if not for Japanese authorities jawboning, capping the uptrend. If the pair remains bid, it could test 155.00, seen as the line of the sand that might increase tension in the major, and it could trigger intervention by authorities. Conversely, if USD/JPY dips below 154.00, look for a test of the April 12 high turned support at 153.39, followed by the 153.00 mark.
- Silver price bounces back to $28.50 even though investors expect Middle East tensions won’t escalate further.
- US bond yields rally amid uncertainty over Fed rate cut timing.
- Upbeat US Retail Sales boost demand for the US Dollar.
Silver price (XAG/USD) finds strong buying interest near $27.50 after correcting from fresh highs of $29.80. The white metal rebounds to $28.50 in Monday’s American session but struggles to extend recovery as investors expect that Middle East tensions will not escalate further.
Iran said we don’t want to raise tensions in the Middle East further. Their administration added, “the matter deemed to be closed.” However, should the Israeli regime make another mistake, Iran’s response will be considerably more severe, the Wall Street Journal reported. Meanwhile, US President Joe Biden said it won’t support the counterattack from Israel. On Saturday, Iran launched hundreds of drones and missile on the Israeli state.
Meanwhile, higher bond yields due to deepening uncertainty about when the Federal Reserve (Fed) will pivot to rate cuts is barricading the Silver price from further upside. 10-year US Treasury yields rise to 4.65%.
The US Dollar Index (DXY) extends its upside to 106.20 after upbeat US Retail Sales data for March. The US Census Bureau reported that Retail Sales rose strongly by 0.7% from expectations of 0.3% but the pace was slower than the prior reading of 0.9%, upwardly revised from 0.6%.
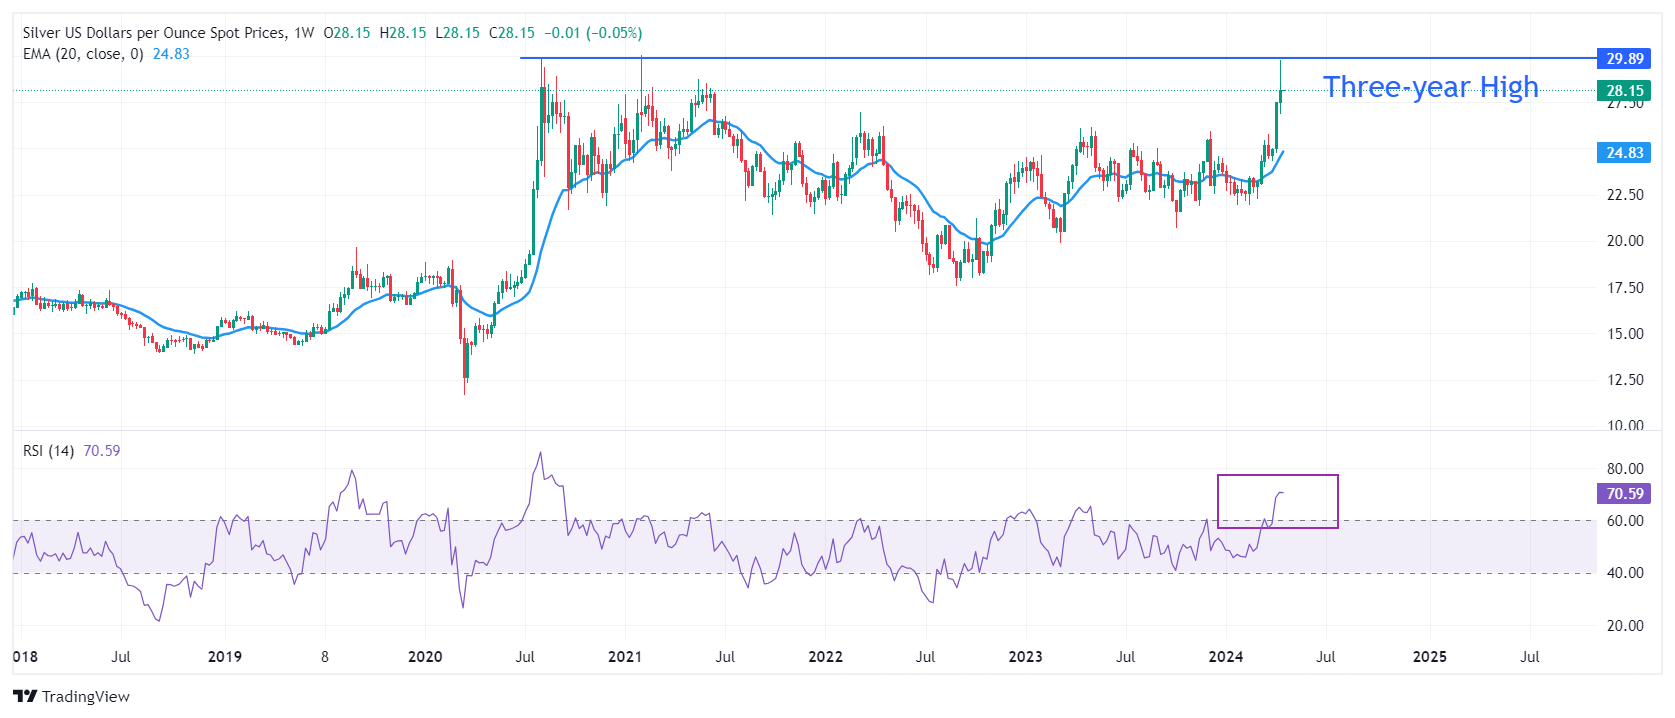
Silver technical analysis
Silver price recaptures a three-year high near $30.00. The long-term outlook of the Silver price is extremely bullish as the 20-week Exponential Moving Average (EMA) near $25.00, is sloping higher. The 14-period Relative Strength Index (RSI) shifts into the bullish range of 60.00-80.00, suggesting that a bullish momentum is active.
Silver weekly chart
Analysts at Rabobank share their view on the Pound Sterling's short-term outlook against the Euro and the US Dollar.
EUR/GBP to dip to 0.84 in the second half of 2024
"It has been our view for some time that EUR/GBP could break below the 0.85 level this year. This view is based on the forecast of a slower start to BoE rate cuts. It also assumes that the UK election, which is expected before the end of the year, is unlikely to create many shockwaves. Opinion polls strongly suggest that a Labour government will be entering Downing St after the election. While the shadow cabinet has kept its cards close to its chest in terms of policy details, the Starmer leadership has been keen to woo the business sector. Additionally, the poor state of public finances suggests little room for manoeuvre for the new Chancellor. The latter implies that the election could be a reassuringly boring event for markets."
"The weeks and months ahead could bring more geopolitical induced volatility for asset prices and in particular for the safe haven USD. This risk, combined with the resilience of the US economy, suggests a strong probability of further dips in the value of GBP/USD. EUR/GBP, however, should be less impacted. We continue to expect that EUR/GBP will dip to the 0.84 level in the second half of this year. That said, the EUR/GBP0.8530 level is likely to offer near-term support."
- EUR/USD is expected to witness more downside as the appeal for the US Dollar strengthens.
- Fed Daly said there is absolutely no urgency for the Fed to pivot to rate cuts.
- The ECB is expected to begin reducing interest rates from the June meeting.
The EUR/USD pair sees more downside below the immediate support of 1.0620 in Monday’s early American session. The major currency pair weakens as robust spending by United States households at retail stores in March has improved the US Dollar’s appeal.
The US Census Bureau reported that monthly Retail Sales grew strongly by 0.7% from expectations of 0.3%. In February, Retail Sales data rose by 0.9%, upwardly revised from 0.6%. The Retail Sales data is one of leading indicators of consumer spendings, which accounts for more than two-thirds of the US economy. Higher spending by households indicates a stubborn inflation outlook.
Upbeat Retail Sales data would allow Federal Reserve (Fed) policymakers to keep the monetary policy stance restrictive for a longer period.
Fed policymakers have been reiterating the need for maintaining interest rates higher until they get convinced that inflation will return to the desired rate of 2%. San Francisco Fed Bank President Mary Daly said on Friday that there is absolutely no urgency to start reducing interest rates. Daly added that there is still more work to do to make sure that inflation is on course to return to the desired rate of 2%.
In Monday’s early New York session, New York President John Williams said he is more optimistic about potential growth but see rate cuts starting later this year.
On the Eurozone front, European Central Bank (ECB) policymaker Peter Kazimir see possibility of rate cuts starting from the June meeting if inflation continues to fall. For the longer-term outlook, Kazmir said the ECB is not committed to any policy path beyond June, noting that they must maintain flexibility.
Last week, the ECB kept its Main Refinancing Operations Rate unchanged at 4.5% as expected. In a monetary policy conference, ECB President Christine Lagarde said if a fresh assessment increase policymakers' confidence that inflation is heading back to target, then it "would be appropriate" to cut interest rates, Reuters reported.
- Retail Sales in the US grew at a stronger pace than expected in March
- US Dollar Index stays in positive territory above 106.00.
Retail Sales in the US rose 0.7% in March to $709.6 billion, the US Census Bureau reported on Monday. This reading followed the 0.9% increase (revised from 0.6%) recorded in January and came in better than the market expectation of 0.3%. Retail Sales ex Autos grew 1.1% in the same period.
"Total sales for the January 2024 through March 2024 period were up 2.1% from the same period a year ago," the press release read. "Retail trade sales were up 0.8% from February 2024, and up 3.6% above last year."
Market reaction
The US Dollar Index edged higher with the immediate reaction and was last seen rising 0.12% on the day at 106.14.
"There has been much less progress in relation to domestic inflation compared to broader inflation measures," European Central Bank (ECB) chief economist Philip Lane said, per Reuters.
Key takeaways
"Even if the near-term inflation outlook is somewhat bumpy, the projected convergence of inflation to the target in 2025 will be underpinned."
"Deceleration in wage growth is necessary in order for services inflation to converge to a rate that is consistent with meeting the 2% target."
"While services inflation should decline somewhat in the near term, it is expected to remain relatively elevated for most of this year."
"Wage pressures are gradually moderating but remain elevated."
"Headline inflation is expected to fluctuate around current levels in the near term."
"It should be recognized that the current phase of disinflation is necessarily bumpy."
Market reaction
The EUR/USD pair showed no reaction to these comments and was last seen trading at 1.0656, rising 0.14% on the day.
European Central Bank policymaker Peter Kazimir said on Monday that the ECB can gradually relax restriction by lowering the key rates in June, given the persistent fall in inflation.
Kazimir added that the ECB is not committed to any policy path beyond June, noting that they must maintain flexibility.
Market reaction
These comments failed to influence the Euro's valuation against its major rivals in a noticeable way. At the time of press, the EUR/USD pair was trading at 1.0658, where it was up 0.15% on a daily basis.
- The US Dollar faces some selling pressure after the de-escalation of tensions in the Middle East.
- Traders brace for US Retail Sales data on Monday.
- The US Dollar Index falls below 106.00 and looks for nearby support.
The US Dollar (USD) retraces on Monday after a very strong week in which the Greenback seemed to be on steroids. Markets are breathing a sigh of relief after Iran carried out a well-communicated attack against Israel without significant casualties and issued a statement on Monday saying that it is not looking for further escalation of tensions in the Middle East. The easing of safe-haven demand triggers some inflow into risk assets, with equities firmly in the green in Europe and the US, and weighs on the US Dollar.
On the economic data front, traders will face some key data at the start of the week. The main event on Monday is the US Retail Sales report for March. As always, any negative print in the actual number or a revision for the previous data will push the Greenback lower. Traders are thus warned that the revised numbers will be as important as the actual numbers.
Daily digest market movers: Retail Sales lookout
- At 12:30 GMT, most of the US data will be released:
- The NY Empire Manufacturing Index for April is expected to rise to -9, from the -20.9 reading of the previous month.
- The US Census Bureau will publish the Retail Sales for March:
- Retail Sales are expected to increase 0.3% on a monthly basis in March following the 0.6% increase seen in February.
- Retail Sales excluding transportation are expected to increase 0.4% in the month, slightly higher than the 0.3% registered in February.
- At 14:00 GMT, the February Business Inventories data will be released. Markets are expecting a 0.3% increase from the previous month.
- At 15:30 GMT, the US Treasury will auction a 3-month and a 6-month bill.
- Equities are in the green in Europe, with the German Dax up over 1%. US equity futures are also in the green, over 0.50% ahead of the US opening bell.
- According to the CME Group’s FedWatch Tool, expectations for a Fed pause in the May meeting are at 97.4%, while chances of a rate cut stand at 2.6%. The odds of a September rate cut have increased and are now higher than a cut at the June meeting.
- The benchmark 10-year US Treasury Note trades around 4.56%, slightly higher than the opening price for this week at 4.53%.
US Dollar Index Technical Analysis: Correcting a touch
The US Dollar Index (DXY) is easing on Monday ahead of the US Retail Sales numbers. The main driver for the retracement comes after Iran issued a statement this Monday saying that it does not want to seek any escalation in the Middle East. Markets are sending European and US equities higher, while safe-haven currencies are easing a touch, with the DXY Index retreating below 106.00.
On the upside, the first level for the DXY is the November 10 high at 106.01, just above the 106.00 figure. Further up and above the 107.00 round level, the DXY Index could meet resistance at 107.35, the October 3 high.
On the downside, the first important level is 105.88, a pivotal level since March 2023. Further down, 105.12 and 104.60 should also act as a support, ahead of the region with both the 55-day and the 200-day Simple Moving Averages (SMAs) at 103.97 and 103.84, respectively.
US Dollar FAQs
The US Dollar (USD) is the official currency of the United States of America, and the ‘de facto’ currency of a significant number of other countries where it is found in circulation alongside local notes. It is the most heavily traded currency in the world, accounting for over 88% of all global foreign exchange turnover, or an average of $6.6 trillion in transactions per day, according to data from 2022. Following the second world war, the USD took over from the British Pound as the world’s reserve currency. For most of its history, the US Dollar was backed by Gold, until the Bretton Woods Agreement in 1971 when the Gold Standard went away.
The most important single factor impacting on the value of the US Dollar is monetary policy, which is shaped by the Federal Reserve (Fed). The Fed has two mandates: to achieve price stability (control inflation) and foster full employment. Its primary tool to achieve these two goals is by adjusting interest rates. When prices are rising too quickly and inflation is above the Fed’s 2% target, the Fed will raise rates, which helps the USD value. When inflation falls below 2% or the Unemployment Rate is too high, the Fed may lower interest rates, which weighs on the Greenback.
In extreme situations, the Federal Reserve can also print more Dollars and enact quantitative easing (QE). QE is the process by which the Fed substantially increases the flow of credit in a stuck financial system. It is a non-standard policy measure used when credit has dried up because banks will not lend to each other (out of the fear of counterparty default). It is a last resort when simply lowering interest rates is unlikely to achieve the necessary result. It was the Fed’s weapon of choice to combat the credit crunch that occurred during the Great Financial Crisis in 2008. It involves the Fed printing more Dollars and using them to buy US government bonds predominantly from financial institutions. QE usually leads to a weaker US Dollar.
Quantitative tightening (QT) is the reverse process whereby the Federal Reserve stops buying bonds from financial institutions and does not reinvest the principal from the bonds it holds maturing in new purchases. It is usually positive for the US Dollar.
- Gold price dips from fresh highs near $2,430 as investors don’t see Middle East tensions escalating further.
- US bond yields soar as the Fed seems to initiate the rate cut cycle from September.
- The US Dollar exhibits strength ahead of the monthly United States Retail Sales data for March.
Gold price (XAU/USD) struggles for a firm footing near $2,350 in Monday’s European session after posting hefty losses on Friday. The precious metal loses shine in the very-short term as investors expect that geopolitical tensions will not escalate further. United States President Joe Biden said that his nation will not support the counterattack from Israel on Iran.
Receding Federal Reserve (Fed) rate cut bets for the June and July meetings, combined with less fears of further escalating Iran-Israel tensions, have put some pressure on Gold. The 10-year US Treasury yields rally to 4.55% as Fed policymakers support keeping interest rates restrictive before they get convinced that inflation will return to the required rate of 2%. Higher bond yields weigh on the Gold price as they increase the opportunity cost of holding an investment in it.
The US Dollar Index (DXY), which tracks the US Dollar’s value against six major currencies, prints a fresh five-month high near 106.00 ahead of the monthly Retail Sales data for March, which will be published at 12:30 GMT. Robust spending by US households remains a major catalyst to higher inflation, allowing businesses to charge higher from consumers. The monthly Retail Sales are expected to have grown modestly by 0.3% compared to the prior reading of 0.6%.
Daily digest market movers: Gold price drops as investors see Isran-Israel tensions stalling
- Gold price retreats from fresh all-time highs near $2,430 as investors see Iran’s air strike on the Israeli state only as a retaliation to the attack on their embassy in Syria near Damascus. Tensions between Iran and Israel are not expected to escalate further as Tehran said, “the matter deemed to be closed.” However, should the Israeli regime make another mistake, Iran’s response will be considerably more severe, the Wall Street Journal reported.
- The statement from the United States that it will not support the counterattack from Israel has boosted confidence among investors that Middle East tensions will not escalate further. Over the weekend, Iran launched hundreds of drones and missiles aimed at Israel.
- Meanwhile, uncertainty over the Federal Reserve (Fed) pivoting to rate cuts has weighed heavily on Gold. Financial markets have shifted their expectations for Fed rate cuts to the September meeting as the United States Consumer Price Index (CPI) report turned out hotter than expected in March.
- San Francisco Fed Bank President Mary Daly said on Friday that there is no urgency to reduce interest rates. Daly added that there is still more work to do to ensure that inflation is on course to return to the desired rate of 2%. She also emphasised keeping interest rates restrictive as long as inflation is necessary to return to the 2% target.
- Separately, Boston Fed Bank President Susan Collins said she hopes demand will start slowing and will support bringing down inflation later this year. Collins said she forecasted two rate cuts in the latest dot plot, in which most Fed members projected the central bank reducing interest rates three times by year-end.
Technical Analysis: Gold edges down from fresh highs near $2,430
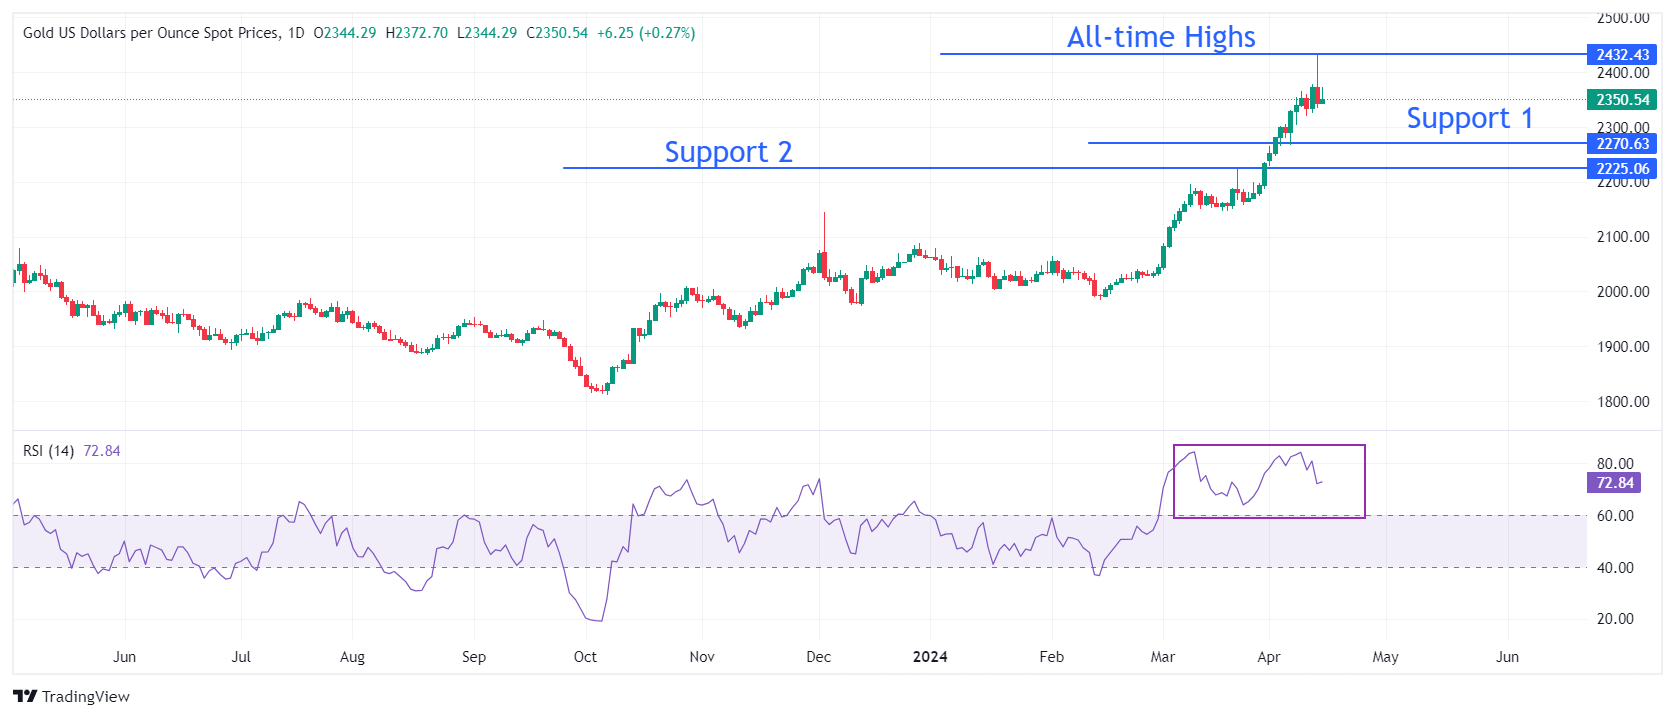
Gold price corrects from new all-time highs formed around $2,430. The precious metal faces pressure as momentum oscillators are overheated. The 14-period Relative Strength Index (RSI) drops slightly after peaking around 85.00. The near-term demand is intact as the RSI remains in the bullish range of 60.00-80.00. However, momentum oscillators are cooling down after turning extremely overbought.
On the downside, April 5 low near $2,268 and March 21 high at $2,223 will be major support areas for the Gold price.
Gold FAQs
Gold has played a key role in human’s history as it has been widely used as a store of value and medium of exchange. Currently, apart from its shine and usage for jewelry, the precious metal is widely seen as a safe-haven asset, meaning that it is considered a good investment during turbulent times. Gold is also widely seen as a hedge against inflation and against depreciating currencies as it doesn’t rely on any specific issuer or government.
Central banks are the biggest Gold holders. In their aim to support their currencies in turbulent times, central banks tend to diversify their reserves and buy Gold to improve the perceived strength of the economy and the currency. High Gold reserves can be a source of trust for a country’s solvency. Central banks added 1,136 tonnes of Gold worth around $70 billion to their reserves in 2022, according to data from the World Gold Council. This is the highest yearly purchase since records began. Central banks from emerging economies such as China, India and Turkey are quickly increasing their Gold reserves.
Gold has an inverse correlation with the US Dollar and US Treasuries, which are both major reserve and safe-haven assets. When the Dollar depreciates, Gold tends to rise, enabling investors and central banks to diversify their assets in turbulent times. Gold is also inversely correlated with risk assets. A rally in the stock market tends to weaken Gold price, while sell-offs in riskier markets tend to favor the precious metal.
The price can move due to a wide range of factors. Geopolitical instability or fears of a deep recession can quickly make Gold price escalate due to its safe-haven status. As a yield-less asset, Gold tends to rise with lower interest rates, while higher cost of money usually weighs down on the yellow metal. Still, most moves depend on how the US Dollar (USD) behaves as the asset is priced in dollars (XAU/USD). A strong Dollar tends to keep the price of Gold controlled, whereas a weaker Dollar is likely to push Gold prices up.
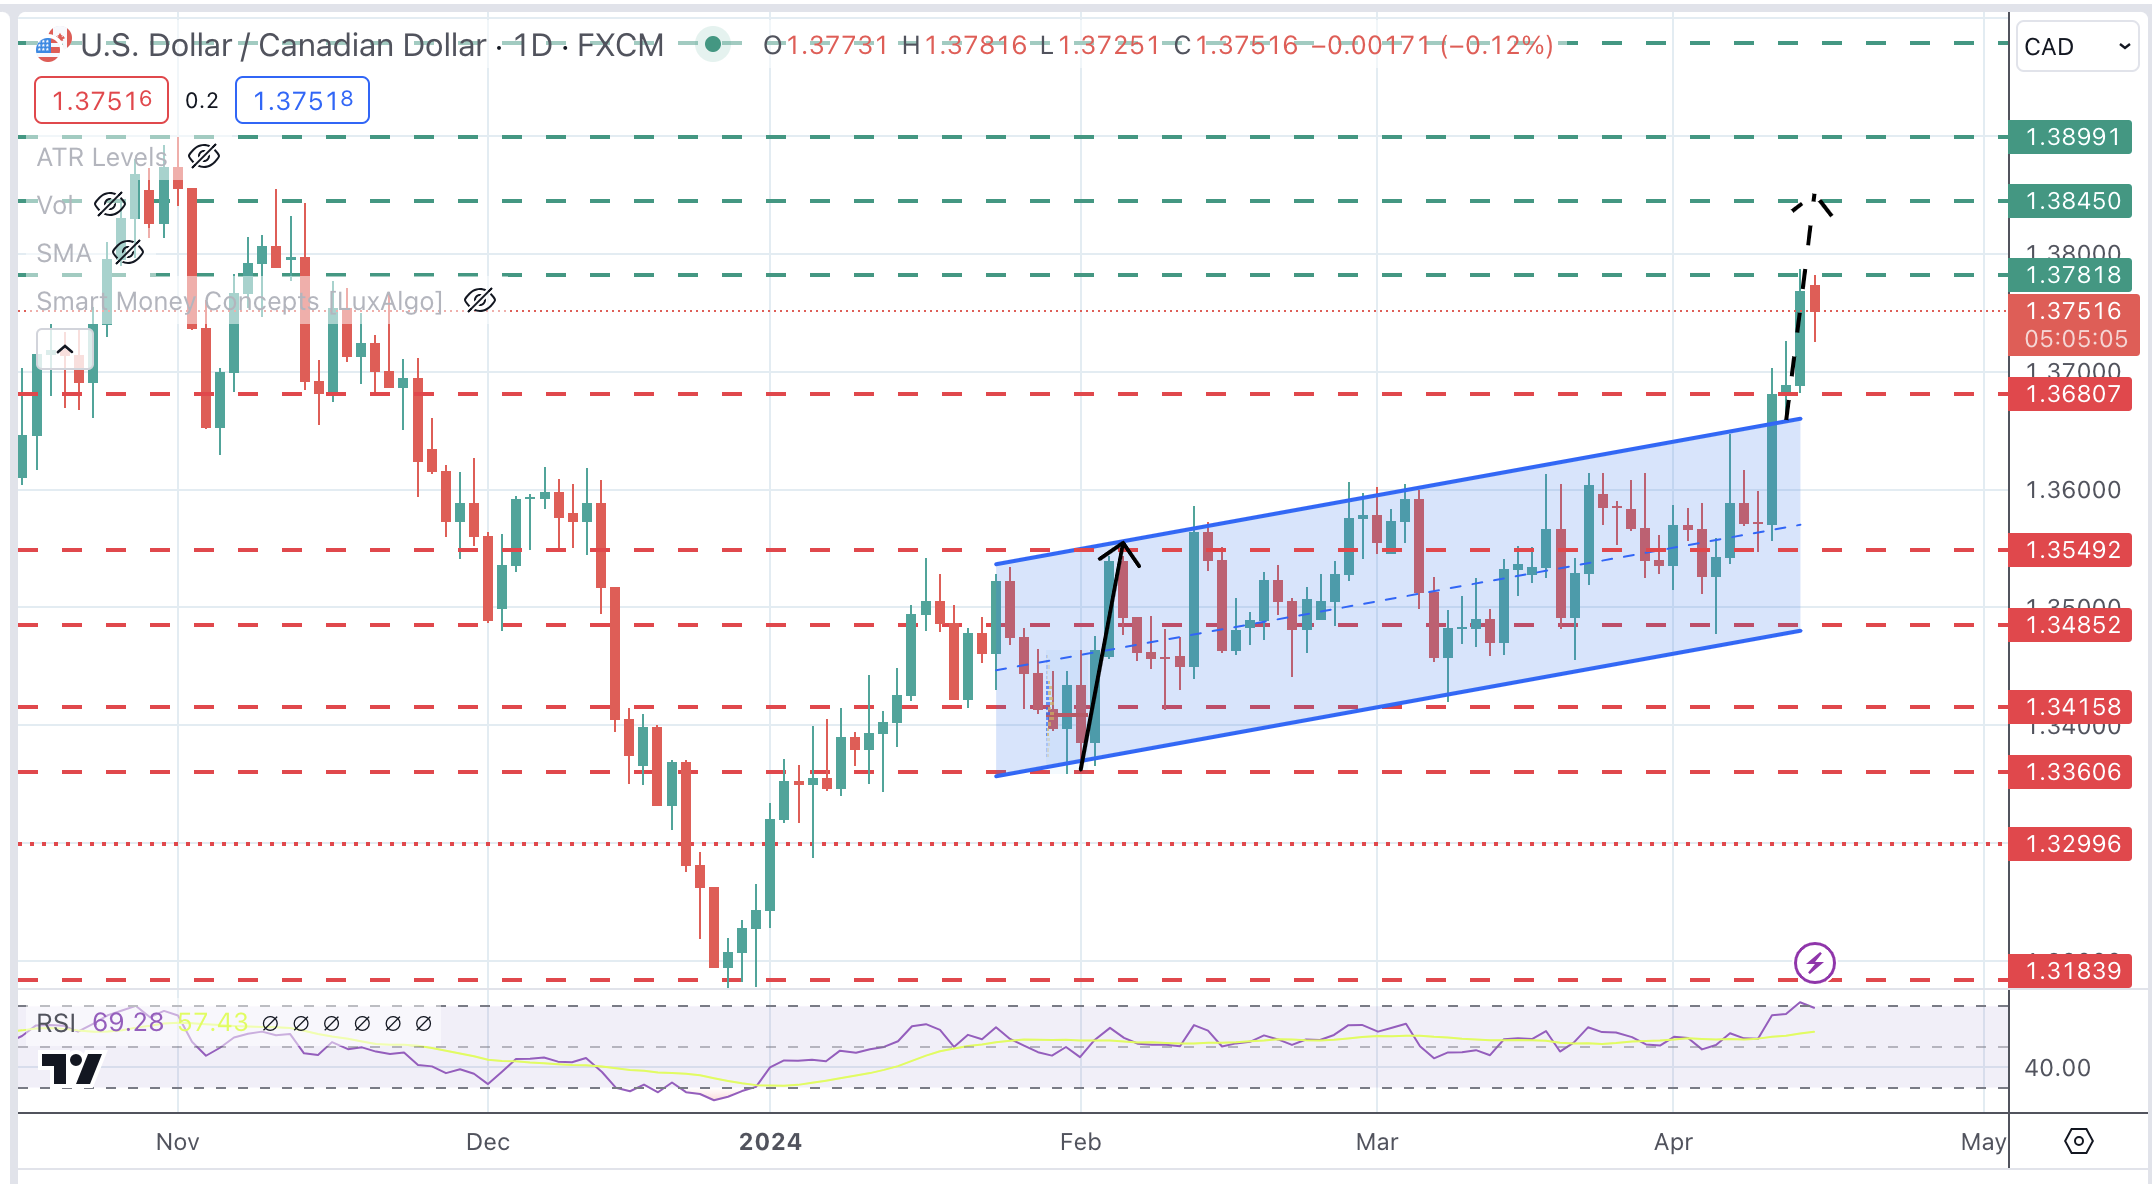
- USD/CAD falls modestly to 1.3730 after refreshing a five-month high near 1.3800.
- The US Dollar consolidates near 106.00 as the focus shifts to US Retail Sales data.
- Canada’s inflation data will influence speculation for BoC rate cuts.
The USD/CAD pair drops to 1.3730 in Monday’s European session. The Loonie asset falls while the US Dollar consolidates in a tight range, indicating some strength in the Canadian Dollar. The US Dollar Index (DXY) trades sideways in a range near a six-month high around 106.00.
The near-term demand for the Loonie asset remains strong as the Federal Reserve (Fed) is expected to keep interest rates restrictive for a longer period. Fed policymakers see no urgency for rate cuts as the consumer price inflation is persistently higher.
Meanwhile, investors await the United States Retail Sales data for March, which will impact speculation for Fed rate cuts. The monthly Retail Sales are estimated to have grown at a slower pace of 0.3% against the prior reading of 0.6%. An upbeat Retail Sales data will strengthen the inflation outlook that could negatively influence market expectations to Fed rate cuts, which are currently anticipated in the September meeting.
Going forward, the Canadian Dollar will dance to the tunes of Consumer Price Index (CPI) data for March, which will be published on Tuesday. The inflation data will provide cues about when the Bank of Canada (BoC) could begin reducing interest rates.
USD/CAD delivers a stalwart rally after a breakout of the Ascending Triangle chart pattern formed on a daily timeframe. An ascending triangle formation demonstrates a sharp volatility contraction that exhibits small ticks and low volume. While a breakout in the same results in wider ticks towards the upside and heavy buying volume.
Upward-sloping 20-day Exponential Moving Average (EMA) near 1.3610 indicates more upside ahead.
The 14-period Relative Strength Index (RSI) shifts into the bullish range of 60.00-80.00, signalling a bullish momentum has been triggered.
The Loonie asset would observe a fresh upside if it breaks above April 12 high at 1.3787. This will drive the asset towards November 4 high at 1.3844, followed by November high at 1.3900.
On the contrary, a downside move below April 9 low at 1.3547 would expose the asset to the psychological support of 1.3500. A breakdown below the latter would extend downside towards February 22 low at 1.3441.
USD/CAD daily chart
- WTI Oil drops below $85 after Iran’s drone attack on Israel ended without any massive effects.
- Oil price set to test support at $84.25 ahead of headline-driven week.
- The US Dollar Index slides below 106.00 as risk on sentiment seems to be taking over.
Oil prices retreat on Monday as markets heaved a big sigh of relief after the Iranian retaliation against Israel was well-communicated and led to very little damage, with investors hopeful that any escalation will prove contained. During the weekend, the attack took place, consisting of a drone and missile attack, from which more than 99% got neutralised by defence systems. Meanwhile, Iran has said it is not seeking further escalation and even the US has already been in touch with Iran, which means the diplomatic machine is working to avoid further escalation.
The US Dollar, meanwhile, is sliding below 106.00 with some outflows out of the Greenback. Global markets seem to be recovering, with all equities across the board in the green, weighing on safe-haven assets such as the US Dollar. Looking at the economic calendar, traders can gear up for the US Retail Sales numbers on Monday.
Crude Oil (WTI) trades at $84.29 and Brent Crude at $89.07 at the time of writing.
Oil news and market movers: Sigh of relief
- Goldman Sachs Analyst Daan Struyven said to Bloomberg that a $5 to $10 risk premium should be added into the Oil prices when the Israel-Iran situation further escalates.
- Iran has already come out on Monday morning to say it is not looking for further escalation of tensions in the Middle East.
- Overall risk on sentiment rolls through markets after tensions in the Middle East are easing.
- Upside risk to Oil prices remain in the coming weeks in case of any Oil embargoes against Iran as the country is the third-largest producer within OPEC.
Oil Technical Analysis: Easing for now with tail risk in mind
Oil prices are easing on Monday after markets scale back the risk premium in Oil that got priced in ahead of the weekend. With investors applauding the deescalation, a test towards $83.34 (purple line) is key. In case that line snaps, expect to see further falls towards $80 as more risk premium is priced out.
In case tensions escalate again and last week’s high at $87.12 gets broken, the $90 handle should come into grasp. One small barrier in the way is $89.64, the peak from October 20. In case of further escalating tensions in the Middle East, expect even $94 to become a possibility, and a fresh 18-month high could be on the cards.
On the downside, $83.34 is the first level to have a look for after a very clean break and test for support on April 1 and 2. Should it not hold, $80.63 is the next best candidate as a pivotal supportive level. A touch softer, the convergence with the 55-day and the 200-day Simple Moving Averages (SMAs) at $79.32 should halt any further downturn.
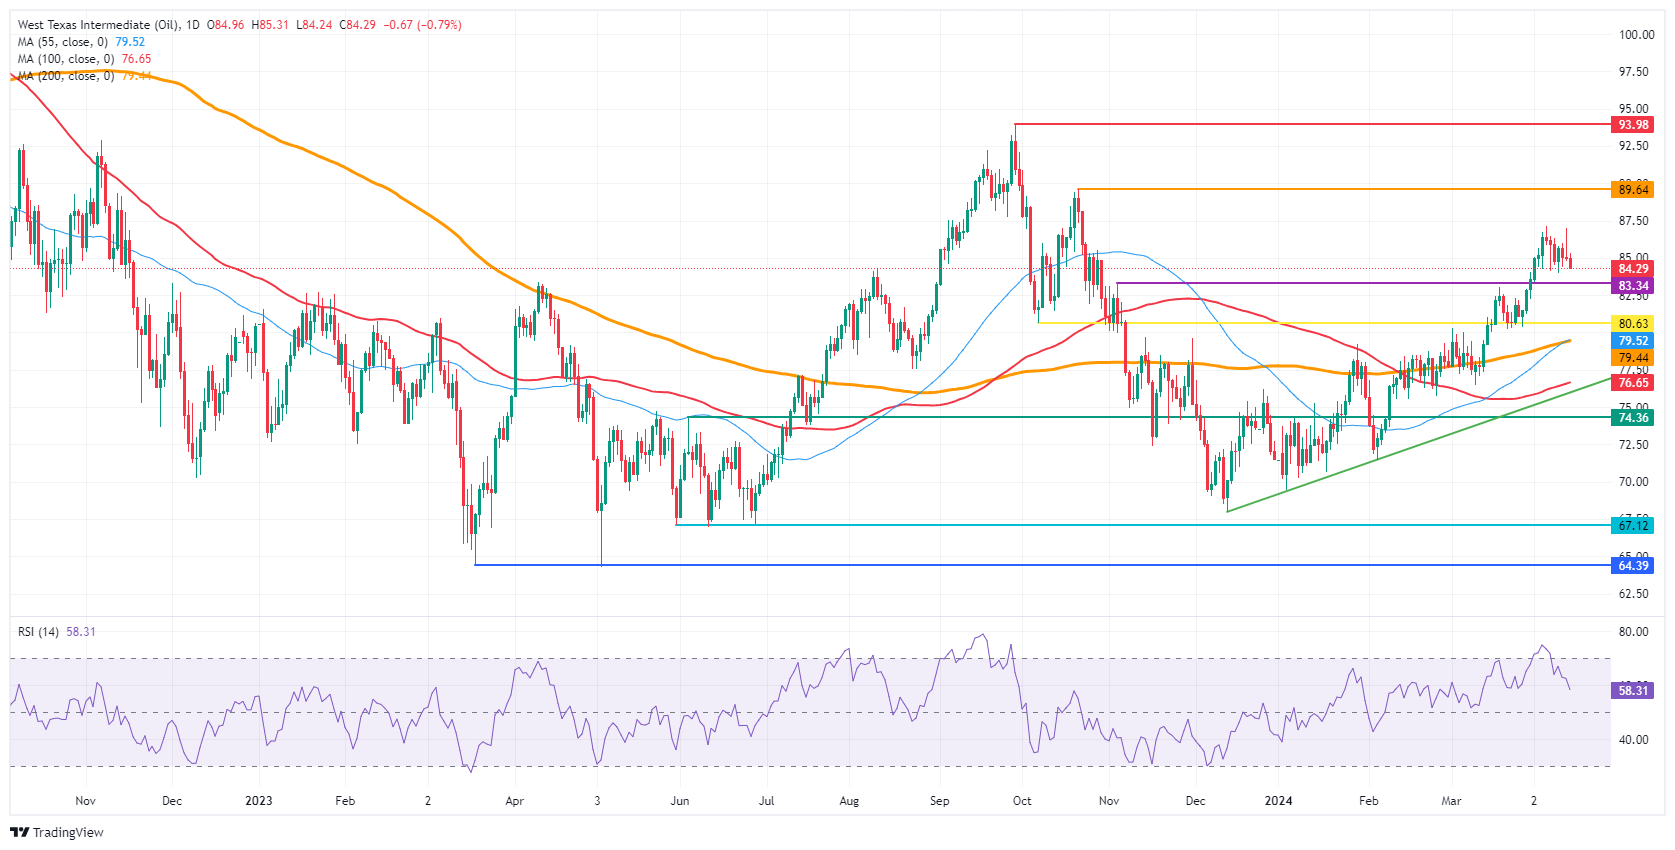
US WTI Crude Oil: Daily Chart
WTI Oil FAQs
WTI Oil is a type of Crude Oil sold on international markets. The WTI stands for West Texas Intermediate, one of three major types including Brent and Dubai Crude. WTI is also referred to as “light” and “sweet” because of its relatively low gravity and sulfur content respectively. It is considered a high quality Oil that is easily refined. It is sourced in the United States and distributed via the Cushing hub, which is considered “The Pipeline Crossroads of the World”. It is a benchmark for the Oil market and WTI price is frequently quoted in the media.
Like all assets, supply and demand are the key drivers of WTI Oil price. As such, global growth can be a driver of increased demand and vice versa for weak global growth. Political instability, wars, and sanctions can disrupt supply and impact prices. The decisions of OPEC, a group of major Oil-producing countries, is another key driver of price. The value of the US Dollar influences the price of WTI Crude Oil, since Oil is predominantly traded in US Dollars, thus a weaker US Dollar can make Oil more affordable and vice versa.
The weekly Oil inventory reports published by the American Petroleum Institute (API) and the Energy Information Agency (EIA) impact the price of WTI Oil. Changes in inventories reflect fluctuating supply and demand. If the data shows a drop in inventories it can indicate increased demand, pushing up Oil price. Higher inventories can reflect increased supply, pushing down prices. API’s report is published every Tuesday and EIA’s the day after. Their results are usually similar, falling within 1% of each other 75% of the time. The EIA data is considered more reliable, since it is a government agency.
OPEC (Organization of the Petroleum Exporting Countries) is a group of 13 Oil-producing nations who collectively decide production quotas for member countries at twice-yearly meetings. Their decisions often impact WTI Oil prices. When OPEC decides to lower quotas, it can tighten supply, pushing up Oil prices. When OPEC increases production, it has the opposite effect. OPEC+ refers to an expanded group that includes ten extra non-OPEC members, the most notable of which is Russia.
TD Securities analysts preview the upcoming data releases from China.
Authorities may step up more fiscal action soon
"We expect China industrial production and retail sales to miss to the downside in March despite the seemingly upbeat March PMIs. We pencil in a 5.1% y/y growth in industrial production, below consensus at 6% and tracking the big downside surprise in March exports. The exports outturn suggest that production may retreat as the Lunar New Year distortion fades and underlying production momentum may not be as strong as initially predicted. While March manufacturing PMI jumped back to expansion, it could take some time for manufacturers to translate that optimism into action."
"We also anticipate retail sales to print at 4% y/y (cons: 5%) as the contraction in imports and weak core inflation in March suggest downbeat spending over the month."
"Factoring in our March forecasts, we project Q1 GDP at 4.5% y/y (cons: 5%), which could reignite speculation that China's official 2024 growth target of 5% is indeed a very ambitious target and the authorities may step up more fiscal action soon."
Deutsche Bank analysts note that developments in the Middle East will be the main market focus this week and add that geopolitical tensions could impact the global economy through several channels.
There is risk that geopolitical shock hurts growth
"Most directly, the effects of higher oil prices will be felt globally, and this is coming at a time when there’s already concern about sticky inflation in several countries. That’s something that could create a dilemma for central banks, as we also found out after Russia’s invasion of Ukraine in 2022."
"On the one hand, there is the risk that a geopolitical shock hurts growth, bringing forward the timing of rate cuts. Indeed, markets were clearly pricing that risk on Friday, with the chance of a Fed rate cut by June moving up from 24% to 30%, although that’s since moved back to 24% this morning. But then again, if higher oil prices lead to more inflation and there are second round effects on other prices, then that could mean monetary policy has to stay in restrictive territory for longer. So the potential effects can work both ways."
Analysts at Rabobank assess the details of the CFTC's latest Commitment of Traders Report.
US CPI data bolstered USD significantly in spot market
"USD net short positions decreased, due to an increase in long positions. This week we saw a stellar NFP print of 303K new jobs added to the US economy against expectations of only 214K. Last week’s stronger than expected US CPI inflation data bolstered the USD significantly in the spot market, suggesting another increase in USD longs is likely in the next set of speculators’ data."
"EUR net long positions increased, driven by a decrease in short positions. That said, Eurozone aggregate CPI inflation printed this week at a slightly softer than expected m/m reading of 0.8%, paired with contractionary retail sales. Positioning in response to the ECB’s decision to hold rates flat and Lagarde’s rhetoric in the accompanying press conference will be reflected in next week’s report, but the EUR has been under pressure in the spot market."
"GBP net long positions have decreased, driven by a fall in long positions. Minimal data printed from the UK this week. Investors are pricing in a 30% likelihood of a June cut into the GB OIS curve as the UK battles stubborn inflation."
Analysts at TD Securities share a brief preview of the upcoming March Retail Sales data from the US.
Retail Sales to continue to recover from January contraction
"We expect retail sales to rise for a second consecutive month in March (TD: 0.5% m/m, consensus: 0.4%), as they continue to recover from the large 1.1% contraction registered in January."
"Volatile auto and gasoline stations sales will likely modestly boost growth, with the control group acting as the main driver as it recovers from a soft start to the year (TD & consensus: 0.4% m/m). Separately, we project sales in bars/restaurants —the report's only services component— to remain firm in March."
Silver prices (XAG/USD) rose on Monday, according to FXStreet data. Silver trades at $28.24 per troy ounce, up 1.29% from the $27.88 it cost on Friday.
Silver prices have increased by 10.88% since the beginning of the year.
| Unit measure | Today Price |
|---|---|
| Silver price per troy ounce | $28.24 |
| Silver price per gram | $0.91 |
The Gold/Silver ratio, which shows the number of troy ounces of Silver needed to equal the value of one troy ounce of Gold, stood at 83.14 on Monday, down from 84.09 on Friday.
Investors might use this ratio to determine the relative valuation of Gold and Silver. Some may consider a high ratio as an indicator that Silver is undervalued – or Gold is overvalued – and might buy Silver or sell Gold accordingly. Conversely, a low ratio might suggest that Gold is undervalued relative to Silver.
Silver FAQs
Silver is a precious metal highly traded among investors. It has been historically used as a store of value and a medium of exchange. Although less popular than Gold, traders may turn to Silver to diversify their investment portfolio, for its intrinsic value or as a potential hedge during high-inflation periods. Investors can buy physical Silver, in coins or in bars, or trade it through vehicles such as Exchange Traded Funds, which track its price on international markets.
Silver prices can move due to a wide range of factors. Geopolitical instability or fears of a deep recession can make Silver price escalate due to its safe-haven status, although to a lesser extent than Gold's. As a yieldless asset, Silver tends to rise with lower interest rates. Its moves also depend on how the US Dollar (USD) behaves as the asset is priced in dollars (XAG/USD). A strong Dollar tends to keep the price of Silver at bay, whereas a weaker Dollar is likely to propel prices up. Other factors such as investment demand, mining supply – Silver is much more abundant than Gold – and recycling rates can also affect prices.
Silver is widely used in industry, particularly in sectors such as electronics or solar energy, as it has one of the highest electric conductivity of all metals – more than Copper and Gold. A surge in demand can increase prices, while a decline tends to lower them. Dynamics in the US, Chinese and Indian economies can also contribute to price swings: for the US and particularly China, their big industrial sectors use Silver in various processes; in India, consumers’ demand for the precious metal for jewellery also plays a key role in setting prices.
Silver prices tend to follow Gold's moves. When Gold prices rise, Silver typically follows suit, as their status as safe-haven assets is similar. The Gold/Silver ratio, which shows the number of ounces of Silver needed to equal the value of one ounce of Gold, may help to determine the relative valuation between both metals. Some investors may consider a high ratio as an indicator that Silver is undervalued, or Gold is overvalued. On the contrary, a low ratio might suggest that Gold is undervalued relative to Silver.
Gold prices fell in India on Monday, according to data from India's Multi Commodity Exchange (MCX).
Gold price stood at 72,319 Indian Rupees (INR) per 10 grams, down INR 582 compared with the INR 72,901 it cost on Friday.
As for futures contracts, Gold prices decreased to INR 71,790 per 10 gms from INR 71,843 per 10 gms.
Prices for Silver futures contracts increased to INR 83,273 per kg from INR 82,813 per kg.
| Major Indian city | Gold Price |
|---|---|
| Ahmedabad | 74,965 |
| Mumbai | 74,760 |
| New Delhi | 74,870 |
| Chennai | 74,970 |
| Kolkata | 74,935 |
Global Market Movers: Comex Gold price cheers haven demand amid Iran-Israel conflict
- Iran's unprecedented direct attack on Israeli territory raised the threat of a wider regional conflict in the Middle East, which, in turn, assists the safe-haven (Comex) Gold price to regain some positive traction on Monday.
- Israeli officials are in favor of retaliation, though the US clarified that it will not take part in any offensive action against Iran, limiting any immediate market reaction and capping further gains for the XAU/USD.
- Investors pushed back their expectations for the first interest rate cut by the Federal Reserve to September from June following the release of hotter-than-expected US consumer inflation figures last week.
- Moreover, traders are now pricing in the possibility of less than two rate cuts in 2024 as compared to the three projected by the Fed, allowing the US Dollar to stand tall near its highest level since early November.
- The Fed's hawkish outlook, along with the bullish USD, might hold back bulls from placing aggressive bets around the precious metal ahead of the US data – Retail Sales and the Empire State Manufacturing Index.
(An automation tool was used in creating this post.)
Gold FAQs
Gold has played a key role in human’s history as it has been widely used as a store of value and medium of exchange. Currently, apart from its shine and usage for jewelry, the precious metal is widely seen as a safe-haven asset, meaning that it is considered a good investment during turbulent times. Gold is also widely seen as a hedge against inflation and against depreciating currencies as it doesn’t rely on any specific issuer or government.
Central banks are the biggest Gold holders. In their aim to support their currencies in turbulent times, central banks tend to diversify their reserves and buy Gold to improve the perceived strength of the economy and the currency. High Gold reserves can be a source of trust for a country’s solvency. Central banks added 1,136 tonnes of Gold worth around $70 billion to their reserves in 2022, according to data from the World Gold Council. This is the highest yearly purchase since records began. Central banks from emerging economies such as China, India and Turkey are quickly increasing their Gold reserves.
Gold has an inverse correlation with the US Dollar and US Treasuries, which are both major reserve and safe-haven assets. When the Dollar depreciates, Gold tends to rise, enabling investors and central banks to diversify their assets in turbulent times. Gold is also inversely correlated with risk assets. A rally in the stock market tends to weaken Gold price, while sell-offs in riskier markets tend to favor the precious metal.
The price can move due to a wide range of factors. Geopolitical instability or fears of a deep recession can quickly make Gold price escalate due to its safe-haven status. As a yield-less asset, Gold tends to rise with lower interest rates, while higher cost of money usually weighs down on the yellow metal. Still, most moves depend on how the US Dollar (USD) behaves as the asset is priced in dollars (XAU/USD). A strong Dollar tends to keep the price of Gold controlled, whereas a weaker Dollar is likely to push Gold prices up.
- NZD/USD consolidates amid heightened geopolitical tensions after Iranian attack on Israel.
- Technical analysis suggests a confirmation of a tepid momentum for the pair.
- The level of 0.5950 appears as the immediate barrier followed by the 23.6% Fibo level of 0.5996 and the psychological level of 0.6000.
NZD/USD moves back and forth amid heightened geopolitical tensions in the Middle East after Iran attacked potential Israel military on Saturday by launching explosive drones and missiles targeting military installations in Israel. However, Israel successfully intercepted most of the incoming projectiles, according to Reuters. The NZD/USD pair consolidates around 0.5940 during the European session on Monday.
According to the Moving Average Convergence Divergence (MACD) analysis, a prevailing downward sentiment is indicated for the NZD/USD pair. This is evidenced by the MACD line positioned below the centerline and the signal line, signaling a bearish trend.
Furthermore, the 14-day Relative Strength Index (RSI) is below the 50 level, providing additional confirmation of the bearish sentiment, which could prompt traders of the NZD/USD pair to navigate the region around the psychological level of 0.5900. A break below the latter could influence the NZD/USD pair to approach further support at the major level of 0.5850.
On the upside, the NZD/USD pair could find immediate resistance at the major level of 0.5950. A breakthrough above this level could lead the pair to test a strong resistance area around the 23.6% Fibonacci retracement level of 0.5996, aligned with the psychological level of 0.6000 and 14-day Exponential Moving Average (EMA) of 0.6001.
NZD/USD: Daily Chart
- EUR/GBP continues to lose ground despite improved Eurozone manufacturing data.
- Eurozone Industrial Production (MoM) rose by 0.8% in February, swinging from a 3.0% decrease in January.
- The Pound Sterling might have received support from the hawkish remarks from BoE’s policymaker.
EUR/GBP moves downward to near 0.8540 during the European trading hours on Monday. The Euro (EUR) failed to react to the improved data from the Eurozone’s manufacturing sector. The seasonally adjusted Industrial Production increased by 0.8% MoM in February, swinging from the previous decline of 3.0%. The annual index reduced by 6.4% for the said period, lower than the previous decrease of 6.6%.
The EUR encountered struggles against the GBP following the European Central Bank's (ECB) indication that there might be a consideration to lower policy rates in June if underlying inflation continues to decelerate as anticipated.
According to Reuters, Gediminas Šimkus, a member of the ECB Governing Council, suggested on Monday above 50% probability of witnessing more than three rate cuts throughout the year.
The Pound Sterling (GBP) appreciates on adjusting market forecasts for interest rate cuts by the Bank of England (BoE). The policy rate is now expected to decline to around 4.75% by the end of 2024, down from the current rate of 5.25%. This marks a shift from the previous expectation of a drop to 4.5% by December.
Additionally, the hawkish remarks from BoE’s policymaker, Megan Greene have supported the British Pound (GBP), which might have contributed to pressure on the EUR/GBP cross. She emphasized that rate cuts in the United Kingdom (UK) should still be considered distant, pointing to a greater risk of persistent inflation in the country.
Traders will likely pay close attention to the speech by Sarah Breeden, BoE's Deputy Governor for Financial Stability, at the Innovate Finance Global Summit 2024 on Monday.
- Silver regains positive traction and reverses a part of Friday’s retracement slide from the YTD peak.
- The RSI on the daily chart is flashing overbought conditions and warrants caution for bullish traders.
- Any meaningful slide might continue to attract fresh buyers and is more likely to remain cushioned.
Silver (XAG/USD) catches fresh bids on the first day of a new week and stalls its retracement slide from the vicinity of the $29.80 region, or the highest level since February 2021 touched on Friday. The white metal sticks to intraday gains through the early part of the European session and is currently placed just below mid-$28.00s.
From a technical perspective, the recent breakout through the $25.60-$25.70 horizontal resistance and the subsequent move up was seen as a fresh trigger for bullish traders. That said, the Relative Strength Index (RSI) is flashing overbought conditions on the daily chart and makes it prudent to wait for some near-term consolidation or a modest pullback before positioning for any further appreciating move.
Meanwhile, any corrective decline below the $28.00 round figure is likely to find decent support near the $27.80-$27.75 region, below which the XAG/USD could accelerate the fall towards the $27.25 area en route to the $27.00 mark. Some follow-through selling might expose the next relevant support near the $26.35-$26.30 region before the white metal drops to the $26.00 mark and the $25.70-$25.60 resistance breakpoint.
On the flip side, sustained strength back above the $28.50 level should allow the XAG/USD to reclaim the $29.00 mark. The momentum could extend further towards the $29.80 zone, or the YTD peak, above which bulls are likely to aim back towards conquering the $30.00 psychological mark.
Silver daily chart
- USD/CHF gathers strength to break above 0.9150 as geopolitical tensions improve safe-haven demand.
- US bond yields soar as the Fed is expected to maintain a restrictive monetary policy for a longer period.
- Easing Swiss producer inflation boosts expectations of more rate cuts by the SNB.
The USD/CHF pair hovers near six-month high around 0.9150 in Monday’s European session. The Swiss Franc asset is expected to extend upside as the US Dollar strengthens due to potential risks of further escalation in Middle East tensions and receded hopes of Federal Reserve (Fed) lowering interest rates from the June meeting.
S&P 500 futures have posted significant gains in the European session, portraying some improvement in investors’ risk appetite. Though risky assets could retreat amid fears that Israel could retaliate to airstrike by Iran in which hundreds of drones and missiles were launched.
10-year US Treasury yields soar to 4.55% as the Federal Reserve (Fed) has no urgency to reduce interest rates with inflation remaining persistently higher. The speculation for the Fed reducing interest rates in the June and July meetings has faded and investors are now anticipating rate cuts in the September meeting.
The US Dollar Index (DXY) turns sideways after refreshing five-month high near 106.00. In today’s session, investors will focus on the monthly Retail Sales data for March, which will be published at 12:30 GMT. The Retail Sales data is estimated to have grown at a slower pace of 0.3% against the prior reading of 0.6%. A slowdown in Retail Sales would release some heat from the stubborn inflation outlook.
Meanwhile, the Swiss Franc remains on the backfoot as the Swiss National Bank (SNB) is expected to cut interest rates again in the June meeting, keeping in mind that inflation has come down sustainably below 2%.
The confidence in price pressures slowing further has deepened after the Swiss Producer and Import Prices grew moderately in March. Monthly producer inflation grew steadily by 0.1%. Annually, Producer and Import prices contracted at a higher pace of 2.1% from the former reading of 2.0%.
- EUR/USD rebounds from five-month lows despite hawkish tone surrounding the Fed’s monetary policy outlook.
- ECB member Gediminas Šimkus indicated that there is a probability of more than 50% for more than three rate cuts to occur in 2024.
- Traders may seek refuge in the safe-haven US Dollar due to escalated tensions in the Middle East.
EUR/USD rebounds from a five-month low of 1.0622 reached last Friday, hovering around 1.0660 during early European trading hours on Monday. The EUR/USD pair faced downward pressure as the European Central Bank (ECB) and the Federal Reserve (Fed) revealed diverging monetary policy outlooks.
Investors await the release of Eurozone Industrial Production data for March on Monday. Furthermore, the investors’ focus will shift to US Retail Sales figures due to be released later in the day.
The ECB signaled that if underlying inflation continues to decelerate as anticipated, there's a possibility of contemplating a reduction in policy rates in June. Meanwhile, the Federal Reserve (Fed) appears to be reassessing its monetary easing strategies in light of persistent US inflation and strong macroeconomic indicators. Thursday's data revealed that core producer inflation in the United States (US) surged year-over-year in March, surpassing expectations for the increase.
Traders adopt a cautious approach amidst heightened geopolitical tensions, which may prompt them to seek refuge in the safe-haven US Dollar (USD), potentially putting pressure on the EUR/USD pair. There's the possibility of Israel retaliating against Iran's attack. On Saturday, Iran launched explosive drones and missiles targeting military installations in Israel. Israel successfully intercepted most of the incoming projectiles, according to Reuters.
On Monday, Gediminas Šimkus, a member of the European Central Bank (ECB) Governing Council, stated that there is a greater than 50% likelihood of more than three rate cuts occurring this year, as per Reuters. Šimkus also mentioned that geopolitical events, such as an escalation of the Israel-Iran conflict, could potentially postpone the first rate cut to July from June.
- The Pound Sterling faces pressure as geopolitical tensions improve the appeal for safe-haven assets.
- UK’s employment and inflation data will influence speculation over BoE rate cuts.
- The UK economy is on track to come out of a technical recession.
The Pound Sterling (GBP) shows a modest recovery against the US Dollar in Monday’s London session. However, the near-term demand of the GBP/USD pair remains downbeat due to deepening Middle East tensions and speculation that the Bank of England (BoE) will start reducing interest rates sooner than the Federal Reserve (Fed).
Currently, financial markets anticipate that the BoE will begin lowering borrowing costs from August while the Fed is expected to follow the same from the September meeting.
This week, the United Kingdom’s employment and inflation data will freshly guide market expectations for the BoE as markets wonder when it could start its much-awaited rate-cut cycle. Investors will keenly focus on the wage growth data for three months ending February, which will be released on Tuesday, as it remains a key driver to the UK’s stubborn price pressures.
Daily digest market movers: Pound Sterling eyes downside, focus shifts to UK Employment
- The Pound Sterling finds interim support after diving to a more than four-month low near 1.2430. Escalating Middle East tensions and receded bets that the Federal Reserve (Fed) will pivot to rate cuts in the June meeting have dented the appeal of risk-sensitive currencies.
- Hundreds of air strikes from Iran on Israel in retaliation to its attack on the Iranian embassy in Syria near Damascus, in which seven members of its Islamic Revolutionary Guard Corps (IRGC), including two generals, were killed, have spooked demand for risk-perceived currencies.
- Both scenarios—escalation in geopolitical tensions and faded Fed rate cut hopes—are favorable for the US Dollar, which is considered a safe-haven asset. The US Dollar Index (DXY), which tracks the US Dollar’s value against six major currencies, hovers near a fresh five-month high at 106.10.
- In Monday’s session, investors will focus on the United States monthly Retail Sales data for March, which will be published at 12:30 GMT. The Retail Sales data, representing households’ spending is forecasted to have grown by 0.3%, half the pace of February’s 0.6%.
- On the United Kingdom’s front, improved monthly Gross Domestic Product (GDP) numbers have relieved Bank of England (BoE) policymakers. As expected, the monthly GDP for February rose by 0.1%, confirming that the economy is on course to come out of a technical recession registered in the second half of 2023. The economy also expanded by 0.3% in January, revised higher from 0.2%.
- Due to the improving economic outlook, the BoE could maintain a restrictive policy until they gain confidence that inflation will sustainably return to the 2% target.
Technical Analysis: Pound Sterling remains below 1.2500
The Pound Sterling experiences a sharp sell-off after a breakdown of the psychological support at1.2500. The long-term trend of the GBP/USD pair has turned bearish as it has dropped below the 200-day Exponential Moving Average (EMA), which trades around 1.2570.
A breakdown of the Head and Shoulder chart pattern on a daily timeframe has indicated a bearish reversal. The neckline of the aforementioned chart pattern is plotted from December 8 low near 1.2500.
The 14-period Relative Strength Index (RSI) slips sharply below 40.00, indicating that a fresh bearish momentum has been triggered.
Pound Sterling FAQs
The Pound Sterling (GBP) is the oldest currency in the world (886 AD) and the official currency of the United Kingdom. It is the fourth most traded unit for foreign exchange (FX) in the world, accounting for 12% of all transactions, averaging $630 billion a day, according to 2022 data. Its key trading pairs are GBP/USD, aka ‘Cable’, which accounts for 11% of FX, GBP/JPY, or the ‘Dragon’ as it is known by traders (3%), and EUR/GBP (2%). The Pound Sterling is issued by the Bank of England (BoE).
The single most important factor influencing the value of the Pound Sterling is monetary policy decided by the Bank of England. The BoE bases its decisions on whether it has achieved its primary goal of “price stability” – a steady inflation rate of around 2%. Its primary tool for achieving this is the adjustment of interest rates. When inflation is too high, the BoE will try to rein it in by raising interest rates, making it more expensive for people and businesses to access credit. This is generally positive for GBP, as higher interest rates make the UK a more attractive place for global investors to park their money. When inflation falls too low it is a sign economic growth is slowing. In this scenario, the BoE will consider lowering interest rates to cheapen credit so businesses will borrow more to invest in growth-generating projects.
Data releases gauge the health of the economy and can impact the value of the Pound Sterling. Indicators such as GDP, Manufacturing and Services PMIs, and employment can all influence the direction of the GBP. A strong economy is good for Sterling. Not only does it attract more foreign investment but it may encourage the BoE to put up interest rates, which will directly strengthen GBP. Otherwise, if economic data is weak, the Pound Sterling is likely to fall.
Another significant data release for the Pound Sterling is the Trade Balance. This indicator measures the difference between what a country earns from its exports and what it spends on imports over a given period. If a country produces highly sought-after exports, its currency will benefit purely from the extra demand created from foreign buyers seeking to purchase these goods. Therefore, a positive net Trade Balance strengthens a currency and vice versa for a negative balance.
European Central Bank (ECB) Governing Council member Gediminas Šimkus said on Monday that there was a greater than 50% probability of more than three rate cuts this year, per Reuters.
Šimkus further noted that geopolitical shocks, such as an escalation of the Israel-Iran conflict, could cause them to delay the first rate cut to July from June.
Market reaction
EUR/USD showed no immediate reaction to these comments. At the time of press, the pair was trading modestly higher on the day above 1.0650.
Here is what you need to know on Monday, April 15:
Growing expectations for a delay in the Federal Reserve's (Fed) policy pivot and escalating geopolitical tensions fuelled an impressive US Dollar (USD) rally last week. After rising over 1.5% in the previous week and touching its highest level since early November, the USD Index stays in a consolidation phase at around 106.00 early Monday. NY Empire State Manufacturing Index and Retail Sales data will be featured in the US economic docket.
Over the weekend, Iran launched an assault with dozens of drones in retaliation to the suspected Israeli attack on Iran’s consulate in Damascus on 1 April. "Iran, if necessary, will not hesitate to take further defensive measures to safeguard its legitimate interests against any military aggressions and unlawful use of force," the Iranian Foreign Ministry said in a statement. Meanwhile, UN Secretary-General Antonio Guterres condemned Iran’s drone attacks targeting Israel as a “serious escalation” and called on all sides to show restraint to avoid a devastating regional conflagration.
Following Friday's sharp decline seen in Wall Street, US stock index futures trade modestly higher to start the new week.
US Dollar price in the last 7 days
The table below shows the percentage change of US Dollar (USD) against listed major currencies in the last 7 days. US Dollar was the strongest against the Euro.
| USD | EUR | GBP | CAD | AUD | JPY | NZD | CHF | |
| USD | 1.65% | 1.27% | 1.12% | 1.37% | 1.45% | 1.11% | 1.08% | |
| EUR | -1.68% | -0.38% | -0.54% | -0.28% | -0.20% | -0.54% | -0.59% | |
| GBP | -1.28% | 0.39% | -0.15% | 0.11% | 0.18% | -0.16% | -0.20% | |
| CAD | -1.13% | 0.54% | 0.16% | 0.25% | 0.34% | 0.00% | -0.04% | |
| AUD | -1.39% | 0.28% | -0.10% | -0.26% | 0.08% | -0.26% | -0.31% | |
| JPY | -1.45% | 0.22% | -0.15% | -0.31% | -0.06% | -0.30% | -0.35% | |
| NZD | -1.13% | 0.53% | 0.15% | 0.00% | 0.27% | 0.33% | -0.05% | |
| CHF | -1.08% | 0.58% | 0.20% | 0.05% | 0.30% | 0.38% | 0.04% |
The heat map shows percentage changes of major currencies against each other. The base currency is picked from the left column, while the quote currency is picked from the top row. For example, if you pick the Euro from the left column and move along the horizontal line to the Japanese Yen, the percentage change displayed in the box will represent EUR (base)/JPY (quote).
Middle East tensions escalate over the weekend after Iran attacks Israel.
Gold opened higher and advanced above $2,370 in the early Asian session before retreating below $2,360 by the European morning.
EUR/USD suffered heavy losses on Friday and broke below 1.0700. The pair seems to have stabilized at around 1.0650 in the early European session. Eurostat will release Industrial Production data for February later in the day.
GBP/USD lost 1.5% last week and registered its largest one-week decline since July. The pair stays relatively quiet below 1.2500 on Monday.
Japanese Finance Minister Shunichi Suzuki repeated on Monday that he is “watching FX moves closely," adding that he wants to be fully-prepared when asked about the broad Yen weakness. USD/JPY closed the previous week decisively higher and continued to push higher early Monday. At the time of press, the pair was trading at its highest level in over three decades near 154.00.
Risk sentiment FAQs
In the world of financial jargon the two widely used terms “risk-on” and “risk off'' refer to the level of risk that investors are willing to stomach during the period referenced. In a “risk-on” market, investors are optimistic about the future and more willing to buy risky assets. In a “risk-off” market investors start to ‘play it safe’ because they are worried about the future, and therefore buy less risky assets that are more certain of bringing a return, even if it is relatively modest.
Typically, during periods of “risk-on”, stock markets will rise, most commodities – except Gold – will also gain in value, since they benefit from a positive growth outlook. The currencies of nations that are heavy commodity exporters strengthen because of increased demand, and Cryptocurrencies rise. In a “risk-off” market, Bonds go up – especially major government Bonds – Gold shines, and safe-haven currencies such as the Japanese Yen, Swiss Franc and US Dollar all benefit.
The Australian Dollar (AUD), the Canadian Dollar (CAD), the New Zealand Dollar (NZD) and minor FX like the Ruble (RUB) and the South African Rand (ZAR), all tend to rise in markets that are “risk-on”. This is because the economies of these currencies are heavily reliant on commodity exports for growth, and commodities tend to rise in price during risk-on periods. This is because investors foresee greater demand for raw materials in the future due to heightened economic activity.
The major currencies that tend to rise during periods of “risk-off” are the US Dollar (USD), the Japanese Yen (JPY) and the Swiss Franc (CHF). The US Dollar, because it is the world’s reserve currency, and because in times of crisis investors buy US government debt, which is seen as safe because the largest economy in the world is unlikely to default. The Yen, from increased demand for Japanese government bonds, because a high proportion are held by domestic investors who are unlikely to dump them – even in a crisis. The Swiss Franc, because strict Swiss banking laws offer investors enhanced capital protection.
- NZD/USD rebounds from five-month lows despite hawkish tone surrounding the Fed.
- Business NZ PSI decreased to 47.5 for March, from the previous reading of 52.6.
- Fed Kansas President Lorie K. Logan will speak in a panel discussion at the BoJ-IMF conference on Monday.
NZD/USD rebounds from a five-month low of 0.5927 reached on Monday, hovering around 0.5950 during the Asian trading hours. The New Zealand Dollar (NZD) might have faced a struggle as New Zealand’s services sector fell back into contraction during March. Business NZ Performance of Services Index (PSI) report posted a reading of 47.5 for March, as compared to 52.6 prior.
According to BNZ’s Senior Economist Doug Steel, when today’s weak PSI activity is combined with last week’s similarly weak PMI activity, the composite reading suggests that GDP could decline by more than 2% compared to year-earlier levels. This projection is significantly weaker than what most analysts are forecasting.
Furthermore, market participants will likely closely observe a slew of key data from top trading partner China on Tuesday, including Q1 Gross Domestic Product (GDP) readings and Retail Sales and Industrial Output for March. Traders will shift their focus to the release of New Zealand’s Consumer Price Index (CPI) data on Wednesday.
On the other side, the Federal Reserve (Fed) seems to reevaluate its monetary easing plans due to ongoing US inflation and robust macroeconomic indicators. Core US Producer Price Index (PPI) report showed on Thursday, an increase of 2.4% YoY in March. The market was expecting a rise to 2.3% from 2.1% prior.
Market participants are expected to closely watch the US Retail Sales figures due to be released on Monday. Additionally, Federal Reserve Bank of Kansas President Lorie K. Logan will participate in a panel discussion at the BoJ-IMF conference on Monday.
- USD/CAD retreats from the YTD peak, albeit the downside remains cushioned.
- Reduced Fed rate cut bets continue to act as a tailwind for the USD and the pair.
- Softer Crude Oil prices could undermine the Loonie and help limit the downside.
The USD/CAD pair comes under some selling pressure on the first day of a new week and erodes a part of Friday's strong move up to the 1.3785 region, or its highest level since November 14. Spot prices currently trade around the 1.3760-1.3755 zone, though any meaningful corrective decline still seems elusive in the wake of the underlying strong bullish sentiment surrounding the US Dollar (USD).
Investors pushed back their expectations for the first interest rate cut by the Federal Reserve (Fed) to September from June after data released from the US last week pointed to a still-sticky inflation. Moreover, market participants are now pricing in less than two rate cuts in 2024 as compared to three projected by the Fed. This remains supportive of elevated US Treasury bond yields, which allows the USD Index (DXY) to stand tall near the YTD peak and should act as a tailwind for the USD/CAD pair.
Meanwhile, Crude Oil prices struggle to lure buyers despite Iran's attack on Israel over the weekend, which raised the risk of a broader region conflict and could affect Oil supply from the Middle East. This, in turn, could undermine the commodity-linked Loonie and contribute to limiting the downside for the USD/CAD pair. Hence, any subsequent fall might still be seen as a buying opportunity and remain limited, warranting caution before confirming that spot prices have formed a near-term top.
Market participants now look to the US economic docket, featuring the release of monthly Retail Sales and the Empire State Manufacturing Index later during the early North American session. Apart from this, Fedspeak and the broader risk sentiment will drive the USD demand. This, along with Oil price dynamics, should produce short-term trading opportunities around the USD/CAD pair.
- Gold price regains positive traction in reaction to Iran’s attack on Israel over the weekend.
- The upside remains capped amid hawkish Federal Reserve expectations and a bullish USD.
- The US Retail Sales and Empire State Manufacturing Index are eyed for short-term impetus.
Gold price (XAU/USD) attracts some dip-buying on the first day of a new week and stalls its retracement slide from a fresh all-time peak, around the $2,431-2,432 area touched on Friday. Iran's attack on Israel over the weekend fueled concerns about a further escalation of conflicts in the Middle East, which, in turn, benefits the traditional safe-haven precious metal. Apart from this, subdued US Dollar (USD) price action is seen as another factor lending some support to the commodity.
The downside for the USD, meanwhile, remains cushioned in the wake of expectations that the Federal Reserve (Fed) may delay cutting interest rates in the wake of still-sticky inflation in the US. The hawkish outlook keeps the US Treasury bond yields elevated, which should continue to act as a tailwind for the buck and cap any further gains for the non-yielding Gold price. Traders now look to the US macro data and Fedspeak for some impetus later during the North American session.
Daily Digest Market Movers: Gold price draws support from geopolitical risks; hawkish Fed expectations cap gains
- Iran's unprecedented direct attack on Israeli territory raised the threat of a wider regional conflict in the Middle East, which, in turn, assists the safe-haven Gold price to regain some positive traction on Monday.
- Israeli officials are in favor of retaliation, though the US clarified that it will not take part in any offensive action against Iran, limiting any immediate market reaction and capping further gains for the XAU/USD.
- Investors pushed back their expectations for the first interest rate cut by the Federal Reserve to September from June following the release of hotter-than-expected US consumer inflation figures last week.
- Moreover, traders are now pricing in the possibility of less than two rate cuts in 2024 as compared to the three projected by the Fed, allowing the US Dollar to stand tall near its highest level since early November.
- The Fed's hawkish outlook, along with the bullish USD, might hold back bulls from placing aggressive bets around the precious metal ahead of the US data – Retail Sales and the Empire State Manufacturing Index.
Technical Analysis: Gold price could extend the corrective slide from an all-time peak once $2,334-2,332 horizontal support is broken
From a technical perspective, the Relative Strength Index (RSI) on the daily chart – despite easing from higher levels – is still holding in the overbought territory. Hence, any subsequent move beyond the Asian session peak, around the $2,371-2,372 area, is more likely to confront stiff resistance and remain capped near the $2,400 mark. The subsequent move up, however, has the potential to lift the Gold price back towards the record peak, around the $2,431-2,432 region touched last Friday.
On the flip side, the $2,334-2,332 horizontal zone is likely to protect the immediate downside, below which the Gold price could extend the corrective fall towards the $2,300 round figure. Some follow-through selling will suggest that the precious metal has topped out in the near term and set the stage for some meaningful depreciating move towards the $2,220 zone with some intermediate support near the $2,250 region.
Gold FAQs
Gold has played a key role in human’s history as it has been widely used as a store of value and medium of exchange. Currently, apart from its shine and usage for jewelry, the precious metal is widely seen as a safe-haven asset, meaning that it is considered a good investment during turbulent times. Gold is also widely seen as a hedge against inflation and against depreciating currencies as it doesn’t rely on any specific issuer or government.
Central banks are the biggest Gold holders. In their aim to support their currencies in turbulent times, central banks tend to diversify their reserves and buy Gold to improve the perceived strength of the economy and the currency. High Gold reserves can be a source of trust for a country’s solvency. Central banks added 1,136 tonnes of Gold worth around $70 billion to their reserves in 2022, according to data from the World Gold Council. This is the highest yearly purchase since records began. Central banks from emerging economies such as China, India and Turkey are quickly increasing their Gold reserves.
Gold has an inverse correlation with the US Dollar and US Treasuries, which are both major reserve and safe-haven assets. When the Dollar depreciates, Gold tends to rise, enabling investors and central banks to diversify their assets in turbulent times. Gold is also inversely correlated with risk assets. A rally in the stock market tends to weaken Gold price, while sell-offs in riskier markets tend to favor the precious metal.
The price can move due to a wide range of factors. Geopolitical instability or fears of a deep recession can quickly make Gold price escalate due to its safe-haven status. As a yield-less asset, Gold tends to rise with lower interest rates, while higher cost of money usually weighs down on the yellow metal. Still, most moves depend on how the US Dollar (USD) behaves as the asset is priced in dollars (XAU/USD). A strong Dollar tends to keep the price of Gold controlled, whereas a weaker Dollar is likely to push Gold prices up.
- GBP/USD rebounds from lows since November amid expectations of the Fed delaying rate cuts.
- The escalated Middle-East tension could bolster the demand for the US Dollar.
- BoE could reduce policy rates to around 4.75% by 2024, down from the current rate of 5.25%.
GBP/USD gains ground amid a stable US Dollar (USD), trading around 1.2460 during Asian hours on Monday. The US Dollar (USD) maintains its position below its peak since November 2023, potentially restricting the upward momentum of the GBP/USD pair.
US Dollar Index (DXY) hovers around 106.00, with the 2-year and 10-year yields on US Treasury bonds standing at 4.91% and 4.55%, respectively, by the press time. The elevated US yields may offer support to bolster the US Dollar (USD).
Meanwhile, the Federal Reserve (Fed) seems to reevaluate its monetary easing plans due to ongoing US inflation and robust macroeconomic indicators. According to the CME FedWatch Tool, there has been a notable increase in the likelihood of interest rates remaining unchanged at the June meeting, rising to 63.5% from 46.8% the previous week.
Investors will likely observe Federal Reserve Bank of Kansas President Lorie Logan while participating in a panel discussion at the BoJ-IMF conference on Monday. Furthermore, US Retail Sales figures will be eyed later in the North American session.
On the other side, on Friday, the Pound Sterling (GBP) dipped against the US Dollar to its lowest level since November, reaching 1.2426. Heightened tensions in the Middle East likely prompted traders to seek refuge in the US Dollar.
However, market forecasts for interest rate cuts by the Bank of England (BoE) have been adjusted, with the policy rate now expected to decline to around 4.75% by the end of 2024, down from the current rate of 5.25%. This marks a shift from the previous expectation of a drop to 4.5% by December.
BoE’s policymaker, Megan Greene emphasized that rate cuts in the United Kingdom (UK) should still be considered distant, pointing to a greater risk of persistent inflation in the UK compared to the US. Additionally, traders will likely pay close attention to the speech by Sarah Breeden, BoE's Deputy Governor for Financial Stability, at the Innovate Finance Global Summit 2024 on Monday.
Japanese Finance Minister Shunichi Suzuki said on Monday that he is “watching FX moves closely.”
He added that he “wants to be fully prepared re the movement in FX.”
Market reaction
USD/JPY has paused its upsurge on the above comments, holding near 34-year highs of 153.75. The pair is up 0.28% on the day, as of writing.
- Australian Dollar gains ground amid an escalated geopolitical tension in the Middle East.
- Australian currency could face challenges following the lower ASX 200 Index.
- US Dollar receives support as traders express concerns about a potential reaction from Israel following Iran's attack.
The Australian Dollar (AUD) rebounds on Monday from the eight-week low of 0.6456 reached last Friday. However, the AUD/USD pair encountered obstacles as traders sought refuge in the US Dollar (USD) amidst heightened tensions in the Middle East.
The Australian Dollar may encounter further challenges as the ASX 200 Index declined, reflecting investor concerns about a possible retaliatory response from Israel to Iran's attack on Saturday. Iran deployed explosive drones and missiles targeting military sites in Israel, with Israel reportedly intercepting nearly all of the incoming projectiles, as per Reuters' report.
The US Dollar Index (DXY) edges lower following the subdued US Treasury yields, despite the hawkish sentiment surrounding the Federal Reserve’s (Fed) monetary policy outlook. Strong US inflation and positive macroeconomic indicators are causing the Fed to reassess its stance on monetary easing. Market participants are expected to closely watch the US Retail Sales figures due to be released on Monday, along with Fedspeak.
Daily Digest Market Movers: Australian Dollar rebounds amid a hawkish sentiment surrounding Fed
- Australia’s Consumer Inflation Expectations released on Thursday, showed an increase of 4.6% in April against the previous increase of 4.3%.
- Australian labor market data is due on Thursday, including seasonally adjusted Employment Change and Unemployment Rate for March.
- As anticipated, the People's Bank of China (PBoC) maintained the 1-year medium-term lending facility (MLF) interest rate at 2.5%. The PBoC injected 100 billion Yuan through a one-year MLF operation, resulting in a net drain of 70 billion Yuan.
- Chinese Gross Domestic Product (GDP) and Industrial Production data are scheduled to be released on Tuesday.
- Boston Federal Reserve (Fed) President Susan Collins stated on Friday that she foresees 'approximately two' rate cuts for 2024, while also expecting inflationary pressures to ease later in the year. She emphasized that while a rate hike is not currently included in the baseline scenario, it cannot be completely discounted.
- According to the CME FedWatch Tool, the likelihood of interest rates remaining unchanged in the June meeting has been increased to 63.5% from the previous week of 46.8%.
- US Michigan Consumer Sentiment Index decreased to 77.9 in April, from the previous reading of 79.4 and market expectation of 79.0.
- Core US Producer Price Index (PPI) report showed on Friday, an increase of 2.4% YoY in March. The market was expecting a rise to 2.3% from 2.1% prior.
Technical Analysis: Australian Dollar remains above 0.6450; next barrier at 23.6% Fibo level
The Australian Dollar trades around 0.6480 on Monday. Technical analysis suggests a bearish sentiment for the AUD/USD pair as the Moving Average Convergence Divergence (MACD) is positioned below the centerline and shows a divergence below the signal line. Key support appears at the major level of 0.6450. A break below this level could prompt the pair to navigate the region around the psychological level of 0.6400. On the upside, the AUD/USD pair could find resistance around the psychological level of 0.6500, aligned with the 23.6% Fibonacci retracement level of 0.6501. A breakthrough above the latter could lead the pair to test the 14-day Exponential Moving Average (EMA) at 0.6535, followed by the major barrier at 0.6550.
AUD/USD: Daily Chart
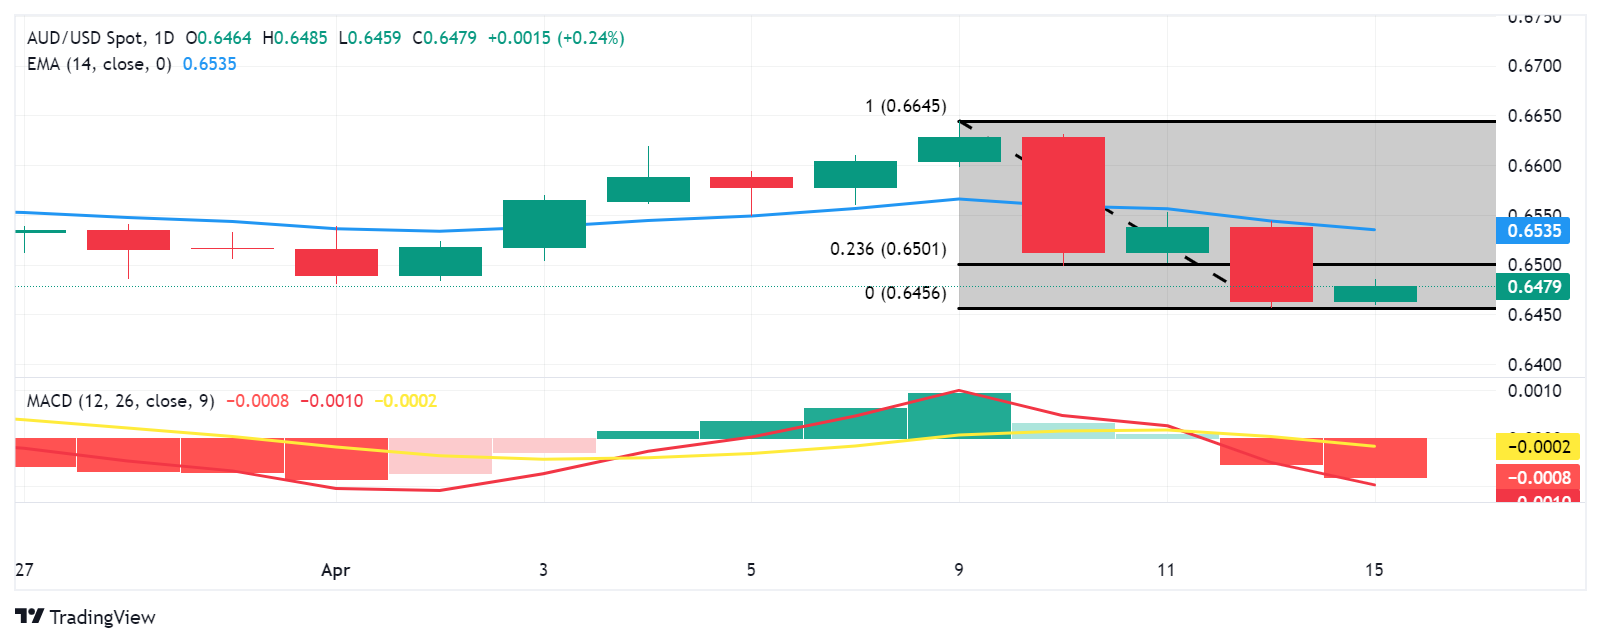
Australian Dollar price today
The table below shows the percentage change of the Australian Dollar (AUD) against listed major currencies today. The Australian Dollar was the strongest against the Japanese Yen.
| USD | EUR | GBP | CAD | AUD | JPY | NZD | CHF | |
| USD | -0.03% | 0.00% | -0.01% | -0.07% | 0.26% | 0.01% | 0.05% | |
| EUR | 0.04% | 0.03% | 0.03% | -0.03% | 0.29% | 0.04% | 0.07% | |
| GBP | -0.01% | -0.03% | -0.01% | -0.07% | 0.25% | 0.00% | 0.04% | |
| CAD | 0.00% | -0.03% | 0.00% | -0.06% | 0.26% | 0.01% | 0.04% | |
| AUD | 0.07% | 0.03% | 0.05% | 0.06% | 0.32% | 0.07% | 0.10% | |
| JPY | -0.24% | -0.29% | -0.23% | -0.26% | -0.32% | -0.23% | -0.22% | |
| NZD | -0.01% | -0.04% | -0.02% | -0.01% | -0.07% | 0.25% | 0.03% | |
| CHF | -0.04% | -0.07% | -0.03% | -0.04% | -0.10% | 0.22% | -0.03% |
The heat map shows percentage changes of major currencies against each other. The base currency is picked from the left column, while the quote currency is picked from the top row. For example, if you pick the Euro from the left column and move along the horizontal line to the Japanese Yen, the percentage change displayed in the box will represent EUR (base)/JPY (quote).
Australian Dollar FAQs
One of the most significant factors for the Australian Dollar (AUD) is the level of interest rates set by the Reserve Bank of Australia (RBA). Because Australia is a resource-rich country another key driver is the price of its biggest export, Iron Ore. The health of the Chinese economy, its largest trading partner, is a factor, as well as inflation in Australia, its growth rate, and Trade Balance. Market sentiment – whether investors are taking on more risky assets (risk-on) or seeking safe havens (risk-off) – is also a factor, with risk-on positive for AUD.
The Reserve Bank of Australia (RBA) influences the Australian Dollar (AUD) by setting the level of interest rates that Australian banks can lend to each other. This influences the level of interest rates in the economy as a whole. The main goal of the RBA is to maintain a stable inflation rate of 2-3% by adjusting interest rates up or down. Relatively high interest rates compared to other major central banks support the AUD, and the opposite for relatively low. The RBA can also use quantitative easing and tightening to influence credit conditions, with the former AUD-negative and the latter AUD-positive.
China is Australia’s largest trading partner so the health of the Chinese economy is a major influence on the value of the Australian Dollar (AUD). When the Chinese economy is doing well it purchases more raw materials, goods and services from Australia, lifting demand for the AUD, and pushing up its value. The opposite is the case when the Chinese economy is not growing as fast as expected. Positive or negative surprises in Chinese growth data, therefore, often have a direct impact on the Australian Dollar and its pairs.
Iron Ore is Australia’s largest export, accounting for $118 billion a year according to data from 2021, with China as its primary destination. The price of Iron Ore, therefore, can be a driver of the Australian Dollar. Generally, if the price of Iron Ore rises, AUD also goes up, as aggregate demand for the currency increases. The opposite is the case if the price of Iron Ore falls. Higher Iron Ore prices also tend to result in a greater likelihood of a positive Trade Balance for Australia, which is also positive of the AUD.
The Trade Balance, which is the difference between what a country earns from its exports versus what it pays for its imports, is another factor that can influence the value of the Australian Dollar. If Australia produces highly sought after exports, then its currency will gain in value purely from the surplus demand created from foreign buyers seeking to purchase its exports versus what it spends to purchase imports. Therefore, a positive net Trade Balance strengthens the AUD, with the opposite effect if the Trade Balance is negative.
| Raw materials | Closed | Change, % |
|---|---|---|
| Silver | 27.937 | -1.82 |
| Gold | 2344.77 | -1.22 |
| Palladium | 1049.49 | 0.34 |
- WTI kicks off the new week on a subdued note and reacts little to Iran’s attack on Israel.
- Worries about cooling fuel demand turn out to be a key factor capping the black liquid.
- The risk of a further escalation of tensions in the Middle East to help limit the downside.
West Texas Intermediate (WTI) US crude Oil prices fail to lure buyers despite Iran's attack on Israel over the weekend and seesaws between tepid gains/minor losses during the Asian session on Monday. The commodity currently trades just below the $85.00/barrel mark, nearly unchanged for the day as traders now await Israel's response to the Iranian strike before placing fresh directional bets.
Iran launched explosive drones and missiles at Israel late on Saturday in retaliation for a suspected Israeli attack on its consulate in Syria earlier this month. This marks the first attack on Israel from another country in more than three decades and raises the risk of a broader region conflict, which could affect Oil supply from the Middle East. Meanwhile, Israeli officials are in favor of retaliation, though the US has said that it will not take part in any offensive action against Iran. This, in turn, is seen as a key reason behind the muted market reaction and acts as a headwind for Crude Oil prices.
The black liquid is further undermined by the fact that the International Energy Agency lowered the 2024 global oil demand growth forecast by 130,000 bpd to 1.2 million barrels per day (bpd) on Friday. This comes on top of the official US data published by the Energy Information Administration last week, which showed an unexpected build in gasoline inventories and pointed to signs of cooling in fuel demand. Furthermore, bets that the Federal Reserve (Fed) may delay cutting interest rates in the wake of still-sticky inflation could hamper economic activity and dent fuel consumption.
Nevertheless, the aforementioned mixed fundamental backdrop keeps traders on the sidelines and leads to subdued/range-bound price action on the first day of a new week. WTI Crude Oil prices, meanwhile, remain well within the striking distance of a multi-month peak, around the $87.10-$87.15 area touched on April 5, which should act as a key pivotal point. A sustained strength beyond will be seen as a fresh trigger for bullish traders and set the stage for an extension of the recent well-established uptrend witnessed over the past month or so.
- EUR/USD attempts to recover from five-month lows amid escalated Middle-East tension.
- Iran launched explosive drones and missiles at Israel late Saturday.
- The pair received downward pressure by diverging policy scenarios for the ECB and Fed.
EUR/USD edges up to near 1.0650 during the Asian session on Monday, recovering from a five-month low of 1.0622 reached last Friday. The US Dollar (USD) gained ground due to increased dollar-buying due to geopolitical turmoil, which contributed to downward pressure on the EUR/USD pair.
Over the weekend, Iran retaliated against a suspected Israeli attack on its consulate in Syria by launching explosive drones and missiles at Israel. Despite this escalation, the markets remained relatively calm, possibly due to Iran's advance notice of the attack, which helped mitigate the risk of further escalation.
According to reports from Reuters, officials from Turkey, Jordan, and Iraq stated that Iran had provided advanced notice days before the attack, allowing measures to prevent mass casualties and a worsening of the situation. However, a US official denied this claim. Additionally, US President Joe Biden told Israel that the United States would not participate in any retaliatory actions.
The EUR/USD pair faced downward pressure as the European Central Bank (ECB) and the Federal Reserve (Fed) revealed diverging monetary policy outlooks. The ECB indicated that if underlying inflation continues to slow as expected, there could be a consideration to lower policy rates in June.
In contrast, robust US inflation and strong macroeconomic indicators are prompting the Fed to reconsider its plans for monetary easing. The probability of interest rates remaining unchanged at the June meeting has increased to 63.5% according to the CME FedWatch Tool, up from 46.8% the previous week. Investors will closely monitor seasonally adjusted Eurozone Industrial Production data and US Retail Sales figures on Monday.
Boston Federal Reserve (Fed) President Susan Collins remarked on Friday that she anticipates 'around two' rate cuts for 2024, while still expecting inflation pressures to diminish later this year. She emphasized the uncertainty surrounding the timing of potential rate cuts and noted that while a rate hike is not currently part of the baseline scenario, it cannot be entirely ruled out.
- The Japanese Yen continues to be undermined by the BoJ’s uncertain outlook about future rate hikes.
- Intervention fears and persistent geopolitical tensions could help limit losses for the safe-haven JPY.
- Reduced Fed rate cut bets favor the USD and support prospects for a further move up for USD/JPY.
The Japanese Yen (JPY) continues with its struggle to register any meaningful recovery against its American counterpart and drops to a fresh multi-decade low during the Asian session on Monday. The Bank of Japan's (BoJ) dovish outlook, indicating that it is in no rush in terms of policy normalization, continues to undermine the JPY. Bearish traders, however, remain on alert and refrain from placing aggressive bets in the wake of the recent warnings by Japanese authorities, showing readiness to intervene in the market to prop up the domestic currency.
Adding to this, persistent geopolitical tensions stemming from a further escalation of conflicts in the Middle East turn out to be another factor lending some support to the safe-haven JPY. The US Dollar (USD), on the other hand, is seen consolidating its recent strong gains to the highest level since early November amid expectations that the Federal Reserve (Fed) may delay cutting interest rates. This, in turn, suggests that the difference in rates between the US and Japan will stay wide for some time, which, in turn, should act as a tailwind for the USD/JPY pair.
Daily Digest Market Movers: Japanese Yen remains depressed amid the divergent BoJ-Fed policy expectations
- The Bank of Japan's cautious approach, indicating that accommodative financial conditions will be maintained for an extended period, fails to assist the Japanese Yen in registering any meaningful recovery from a multi-decade low.
- Japanese government officials continued with their jawboning to defend the domestic currency, which, along with geopolitical developments over the weekend, held back the JPY bears from placing fresh bets and helping limit losses.
- Iran launched explosive drones and missiles at Israel in retaliation for a suspected Israeli attack on its consulate in Syria, raising the risk of a broader conflict in the Middle East region and lending support to the safe-haven JPY.
- Data released from the US last week did little to ease market concerns about still-sticky inflation and forced investors to push back their expectations for the first interest rate cut by the Federal Reserve to September from June.
- Moreover, the current market pricing indicates the possibility of less than two rate cuts in 2024 as against three projected by the Fed, keeping the US Treasury bond yields elevated and acting as a tailwind for the US Dollar.
- The divergent BoJ-Fed policy outlook, meanwhile, suggests that the path of least resistance for the USD/JPY pair remains to the upside and supports prospects for an extension of last week's breakout momentum.
- Traders now look to the US economic docket, featuring Retail Sales figures and the Empire State Manufacturing Index, which, along with Fedspeak, should influence the USD demand and provide a fresh impetus to the major.
Technical Analysis: USD/JPY bulls retain control near multi-decade high, could aim to conquer the 154.00 mark
From a technical perspective, last week's sustained break through a short-term trading range hurdle near the 152.00 mark was seen as a fresh trigger for bulls. The subsequent move-up validates the constructive outlook, though the overbought Relative Strength Index (RSI) on the daily chart makes it prudent to wait for some near-term consolidation before positioning for any further appreciating move. Nevertheless, the USD/JPY pair seems poised to prolong its recent well-established uptrend and aim towards reclaiming the 154.00 round figure.
On the flip side, any meaningful corrective decline below the 153.00 mark is likely to attract fresh buyers and remain limited near Friday's swing low, around the 152.60 region. A convincing break below, however, could prompt some technical selling and drag the USD/JPY pair to the 152.00 mark en route to the 151.40 intermediate support and the 151.00 round figure. The latter should act as a key pivotal point, which if broken will suggest that spot prices have topped out in the near term and shift the bias in favor of bearish traders.
Japanese Yen FAQs
The Japanese Yen (JPY) is one of the world’s most traded currencies. Its value is broadly determined by the performance of the Japanese economy, but more specifically by the Bank of Japan’s policy, the differential between Japanese and US bond yields, or risk sentiment among traders, among other factors.
One of the Bank of Japan’s mandates is currency control, so its moves are key for the Yen. The BoJ has directly intervened in currency markets sometimes, generally to lower the value of the Yen, although it refrains from doing it often due to political concerns of its main trading partners. The current BoJ ultra-loose monetary policy, based on massive stimulus to the economy, has caused the Yen to depreciate against its main currency peers. This process has exacerbated more recently due to an increasing policy divergence between the Bank of Japan and other main central banks, which have opted to increase interest rates sharply to fight decades-high levels of inflation.
The BoJ’s stance of sticking to ultra-loose monetary policy has led to a widening policy divergence with other central banks, particularly with the US Federal Reserve. This supports a widening of the differential between the 10-year US and Japanese bonds, which favors the US Dollar against the Japanese Yen.
The Japanese Yen is often seen as a safe-haven investment. This means that in times of market stress, investors are more likely to put their money in the Japanese currency due to its supposed reliability and stability. Turbulent times are likely to strengthen the Yen’s value against other currencies seen as more risky to invest in.
On Monday, the People’s Bank of China (PBoC) set the USD/CNY central rate for the trading session ahead at 7.0979 as compared to Friday's fix of 7.0967 and 7.2478 Reuters estimates.
| Index | Change, points | Closed | Change, % |
|---|---|---|---|
| NIKKEI 225 | 80.92 | 39523.55 | 0.21 |
| Hang Seng | -373.34 | 16721.69 | -2.18 |
| KOSPI | -25.14 | 2681.82 | -0.93 |
| ASX 200 | -25.5 | 7788.1 | -0.33 |
| DAX | -24.16 | 17930.32 | -0.13 |
| CAC 40 | -12.91 | 8010.83 | -0.16 |
| Dow Jones | -475.84 | 37983.24 | -1.24 |
| S&P 500 | -75.65 | 5123.41 | -1.46 |
| NASDAQ Composite | -267.11 | 16175.09 | -1.62 |
| Pare | Closed | Change, % |
|---|---|---|
| AUDUSD | 0.64612 | -1.2 |
| EURJPY | 163.117 | -0.74 |
| EURUSD | 1.0641 | -0.81 |
| GBPJPY | 190.852 | -0.77 |
| GBPUSD | 1.24498 | -0.84 |
| NZDUSD | 0.59361 | -1.07 |
| USDCAD | 1.37705 | 0.62 |
| USDCHF | 0.91438 | 0.54 |
| USDJPY | 153.287 | 0.07 |


© 2000-2026. All rights reserved.
This site is managed by Teletrade D.J. LLC 2351 LLC 2022 (Euro House, Richmond Hill Road, Kingstown, VC0100, St. Vincent and the Grenadines).
The information on this website is for informational purposes only and does not constitute any investment advice.
The company does not serve or provide services to customers who are residents of the US, Canada, Iran, The Democratic People's Republic of Korea, Yemen and FATF blacklisted countries.
Making transactions on financial markets with marginal financial instruments opens up wide possibilities and allows investors who are willing to take risks to earn high profits, carrying a potentially high risk of losses at the same time. Therefore you should responsibly approach the issue of choosing the appropriate investment strategy, taking the available resources into account, before starting trading.
Use of the information: full or partial use of materials from this website must always be referenced to TeleTrade as the source of information. Use of the materials on the Internet must be accompanied by a hyperlink to teletrade.org. Automatic import of materials and information from this website is prohibited.
Please contact our PR department if you have any questions or need assistance at pr@teletrade.global.
transfers