- Analytics
- News and Tools
- Market News
CFD Markets News and Forecasts — 17-04-2024
Federal Reserve (Fed) Governor Michelle Bowman said Wednesday that inflation progress slows and possibly halts. Bowman further stated that monetary policy is currently restrictive and time will tell if it is "sufficiently" restrictive.
Key quotes
“Inflation progress slows and possibly halts.”
“Strength of consumer spending tied to ongoing job growth.”
“Monetary policy currently restrictive; time will tell if it is "sufficiently" restrictive.”
“Consumers are turning to cheaper goods, but still spending heavily on travel for eclipse viewing.”
Market reaction
The US Dollar Index (DXY) is trading 0.01% higher on the day at 105.95, as of writing.
Fed FAQs
Monetary policy in the US is shaped by the Federal Reserve (Fed). The Fed has two mandates: to achieve price stability and foster full employment. Its primary tool to achieve these goals is by adjusting interest rates. When prices are rising too quickly and inflation is above the Fed’s 2% target, it raises interest rates, increasing borrowing costs throughout the economy. This results in a stronger US Dollar (USD) as it makes the US a more attractive place for international investors to park their money. When inflation falls below 2% or the Unemployment Rate is too high, the Fed may lower interest rates to encourage borrowing, which weighs on the Greenback.
The Federal Reserve (Fed) holds eight policy meetings a year, where the Federal Open Market Committee (FOMC) assesses economic conditions and makes monetary policy decisions. The FOMC is attended by twelve Fed officials – the seven members of the Board of Governors, the president of the Federal Reserve Bank of New York, and four of the remaining eleven regional Reserve Bank presidents, who serve one-year terms on a rotating basis.
In extreme situations, the Federal Reserve may resort to a policy named Quantitative Easing (QE). QE is the process by which the Fed substantially increases the flow of credit in a stuck financial system. It is a non-standard policy measure used during crises or when inflation is extremely low. It was the Fed’s weapon of choice during the Great Financial Crisis in 2008. It involves the Fed printing more Dollars and using them to buy high grade bonds from financial institutions. QE usually weakens the US Dollar.
Quantitative tightening (QT) is the reverse process of QE, whereby the Federal Reserve stops buying bonds from financial institutions and does not reinvest the principal from the bonds it holds maturing, to purchase new bonds. It is usually positive for the value of the US Dollar.
- EUR/USD posts modest gains near 1.0672 on the softer USD on Thursday.
- Fed’s Powell said the central bank might take longer than expected to achieve the 2% target.
- ECB policymaker said a rate cut looks increasingly likely in its June meeting.
The EUR/USD pair edges higher to 1.0672 on Thursday during the early Asian session. The recovery of that major pair is bolstered by renewed selling pressure in the US Dollar (USD) and a risk-friendly environment. Investors will monitor the usual weekly Initial Jobless Claims, the Philly Fed Manufacturing Index, the CB Leading Index, and Existing Home Sales, due later on Thursday.
The Federal Reserve's (Fed) rate cut hopes were faded. Fed Chairman Jerome Powell commented on Tuesday that the recent data have clearly not given Fed greater confidence and indicate that it's likely to take longer than expected to achieve the central bank's 2% target. The hawkish comments from the Fed’s Powell might provide some support to the Greenback and cap the upside of the EUR/USD in the near term. Investors see a nearly 71% chance that the Fed will cut interest rates in September, according to the CME FedWatch Tool.
On the other hand, investors increase their bets that the European Central Bank (ECB) will cut the interest rate in June. The ECB policymaker Joachim Nagel said on Wednesday that a rate cut looks increasingly likely for June, but certain parts of the incoming inflation data still look higher than desired. Meanwhile, ECB policymaker Bostjan Vasle said that the deposit rate should be lower to 3% by the end of the year from a record high of 4% currently if disinflation continues as expected. Interest rate differentials have been a primary driver of the major pair. The dovish stance from the ECB drags the Euro (EUR) lower and creates a headwind for the EUR/USD pair.
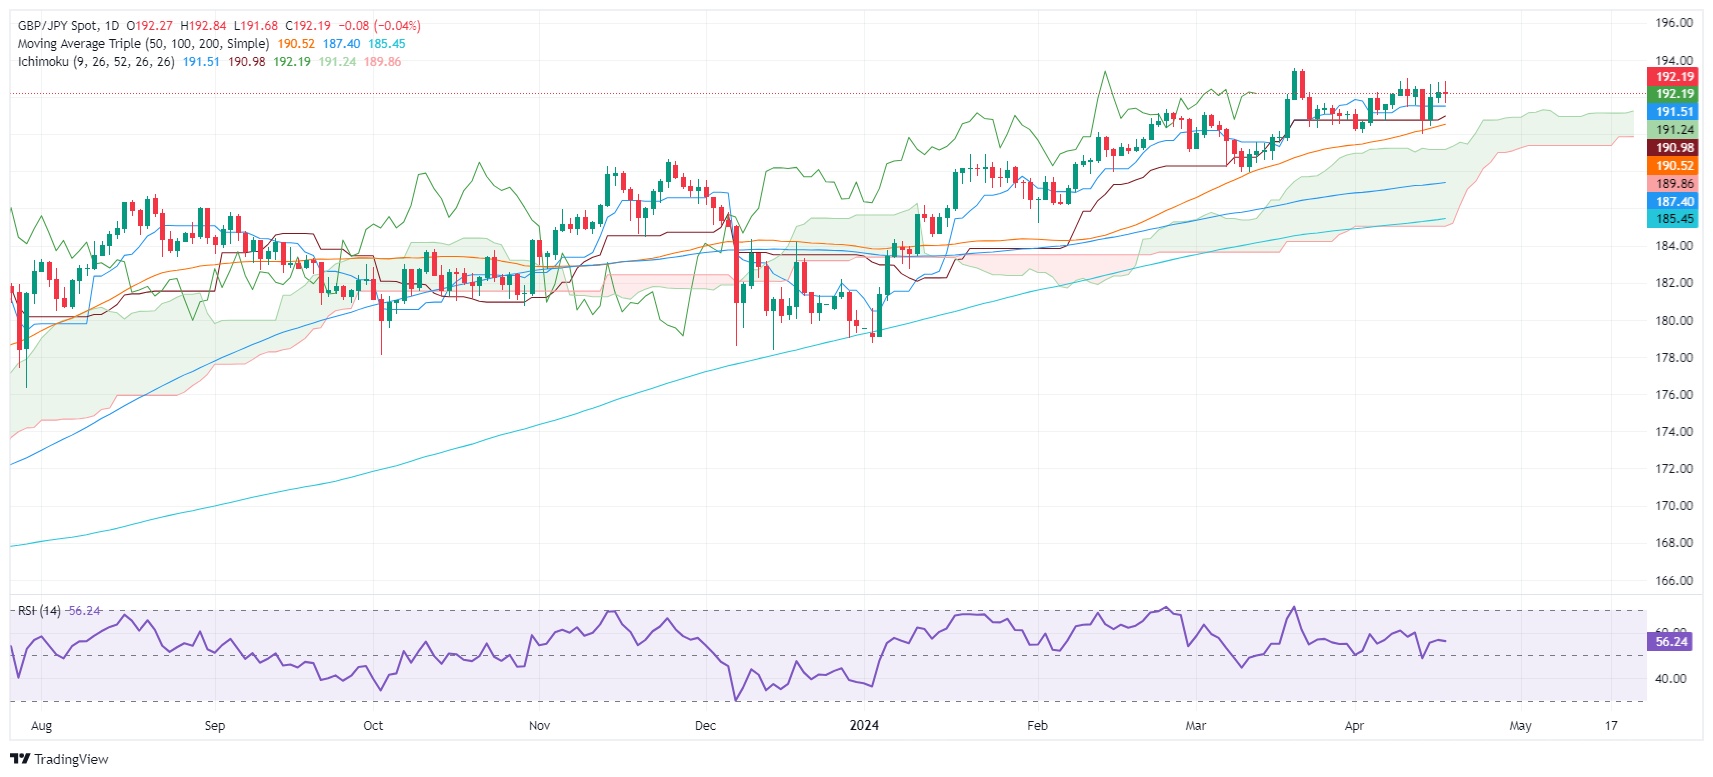
- GBP/JPY remains confined between 191.60 and 192.80, unable to break through key resistance at 193.00.
- Technical analysis highlights potential decline towards strong support at 190.00, with key indicators aligning.
- Immediate technical supports to watch include the Tenkan-Sen at 191.46 and the Kijun-Sen at 191.06.
The GBP/JPY consolidates at around current exchange rates, unable to break above/below the 191.60/192.80 range, following an inflation report in the UK that sparked a rally in the GBP/USD pair. Therefore, after finishing Wednesday's session around familiar levels, the cross-currency pair trades at 192.22, virtually unchanged.
GBP/JPY Price Analysis: Technical outlook
The daily chart shows the pair has peaked, as buyers remained unable to crack the 193.00 figure to challenge the year-to-date (YTD) high of 193.53. That opened the door for a dip toward the 190.00 mark, a strong support level, as key technical indicators converged around that area. The April 2 low of 190.03, the 50-day moving average (DMA), and the top of the Ichimoku Cloud (Kumo).
Since then, the GBP/JPY remains subdued. The first resistance would be 193.00, followed by the YTD high. On the flip side, the first support would be 190.00, followed by key support levels. Up next would be the Tenkan-Sen at 191.46, the Senkou Span A at 191.26, and the Kijun-Sen at 191.06.
GBP/JPY Price Action – Daily Chart
The European Central Bank (ECB) policymaker Bostjan Vasle said on Wednesday that the deposit rate should be "much closer" to 3% by the end of the year from a record high of 4% currently if disinflation continues as expected.
Key quotes
"We should be much closer to 3% towards the end of the year if everything goes according to plan.”
"Some worrying developments in the Middle East.”
Market reaction
These comments have little to no market reaction to the Euro. The EUR/USD pair is trading at 1.0672, unchanged on the day.
ECB FAQs
The European Central Bank (ECB) in Frankfurt, Germany, is the reserve bank for the Eurozone. The ECB sets interest rates and manages monetary policy for the region. The ECB primary mandate is to maintain price stability, which means keeping inflation at around 2%. Its primary tool for achieving this is by raising or lowering interest rates. Relatively high interest rates will usually result in a stronger Euro and vice versa. The ECB Governing Council makes monetary policy decisions at meetings held eight times a year. Decisions are made by heads of the Eurozone national banks and six permanent members, including the President of the ECB, Christine Lagarde.
In extreme situations, the European Central Bank can enact a policy tool called Quantitative Easing. QE is the process by which the ECB prints Euros and uses them to buy assets – usually government or corporate bonds – from banks and other financial institutions. QE usually results in a weaker Euro. QE is a last resort when simply lowering interest rates is unlikely to achieve the objective of price stability. The ECB used it during the Great Financial Crisis in 2009-11, in 2015 when inflation remained stubbornly low, as well as during the covid pandemic.
Quantitative tightening (QT) is the reverse of QE. It is undertaken after QE when an economic recovery is underway and inflation starts rising. Whilst in QE the European Central Bank (ECB) purchases government and corporate bonds from financial institutions to provide them with liquidity, in QT the ECB stops buying more bonds, and stops reinvesting the principal maturing on the bonds it already holds. It is usually positive (or bullish) for the Euro.
Federal Reserve Bank of Cleveland President Loretta Mester spoke on "An update from the Federal Reserve” on Wednesday. Mester said that inflation is higher than expected and the US Fed needs more confidence in trajectory.
Key quotes
“More information needed before confirming 2% inflation sustainability.”
“Inflation slightly higher than anticipated this year.”
“Confidence needed that inflation is decreasing.”
“Strong labor markets, solid economic growth.”
“Watching and gathering more information before taking action.”
“Monetary policy well-positioned.”
“Possible rate cut if labor markets worsen.”
“Anticipates a shift to eased policy.”
“Watching risks to both mandates.”
Market reaction
The US Dollar Index (DXY) is trading 0.02% lower on the day at 105.92, as of writing.
Fed FAQs
Monetary policy in the US is shaped by the Federal Reserve (Fed). The Fed has two mandates: to achieve price stability and foster full employment. Its primary tool to achieve these goals is by adjusting interest rates. When prices are rising too quickly and inflation is above the Fed’s 2% target, it raises interest rates, increasing borrowing costs throughout the economy. This results in a stronger US Dollar (USD) as it makes the US a more attractive place for international investors to park their money. When inflation falls below 2% or the Unemployment Rate is too high, the Fed may lower interest rates to encourage borrowing, which weighs on the Greenback.
The Federal Reserve (Fed) holds eight policy meetings a year, where the Federal Open Market Committee (FOMC) assesses economic conditions and makes monetary policy decisions. The FOMC is attended by twelve Fed officials – the seven members of the Board of Governors, the president of the Federal Reserve Bank of New York, and four of the remaining eleven regional Reserve Bank presidents, who serve one-year terms on a rotating basis.
In extreme situations, the Federal Reserve may resort to a policy named Quantitative Easing (QE). QE is the process by which the Fed substantially increases the flow of credit in a stuck financial system. It is a non-standard policy measure used during crises or when inflation is extremely low. It was the Fed’s weapon of choice during the Great Financial Crisis in 2008. It involves the Fed printing more Dollars and using them to buy high grade bonds from financial institutions. QE usually weakens the US Dollar.
Quantitative tightening (QT) is the reverse process of QE, whereby the Federal Reserve stops buying bonds from financial institutions and does not reinvest the principal from the bonds it holds maturing, to purchase new bonds. It is usually positive for the value of the US Dollar.
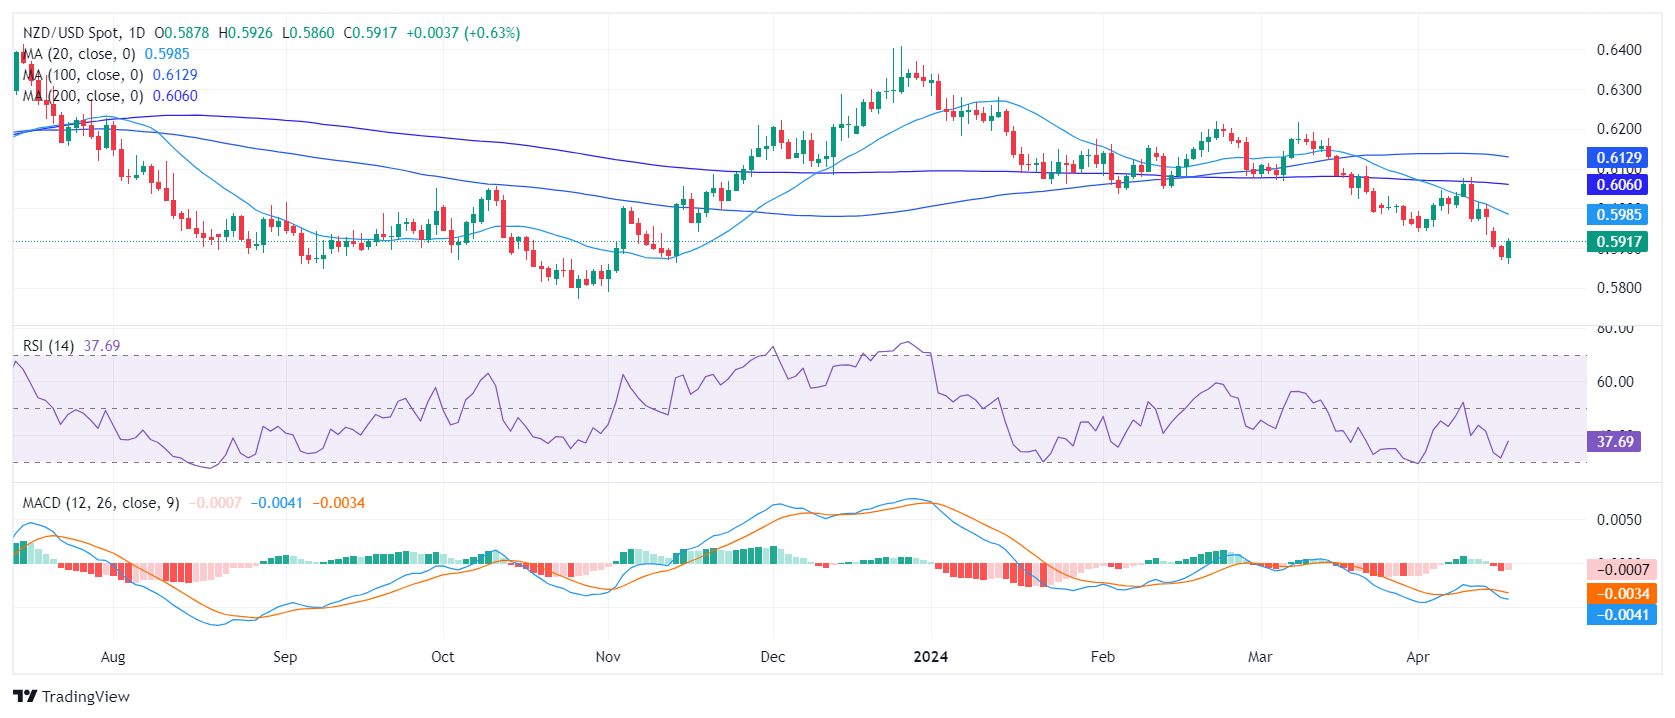
- The RSI on the daily chart lies deep in negative terrain but recovered.
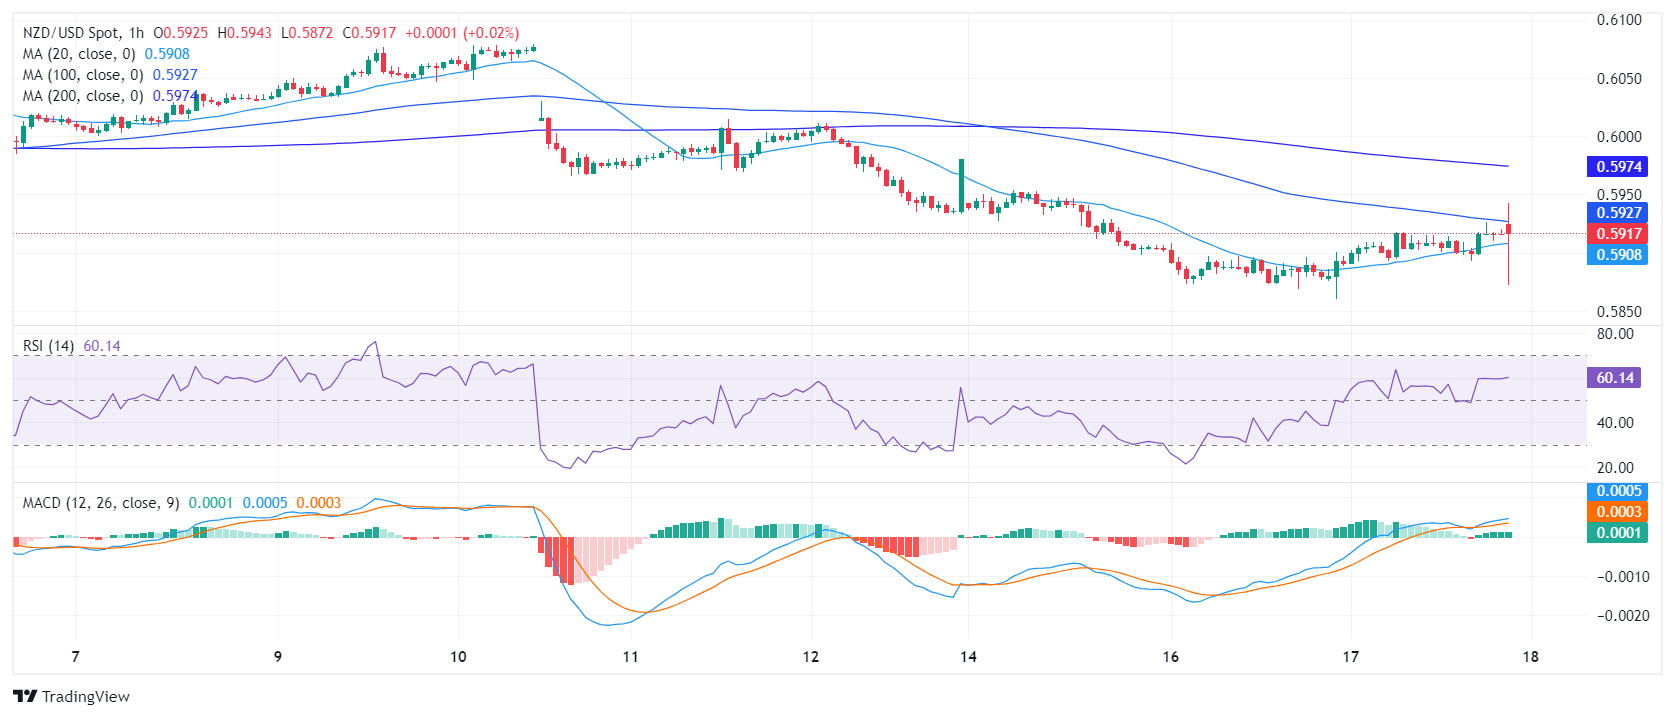
- The hourly RSI paints a growing buying momentum, trending the positive territory.
- The MACD on both charts signals a less intense selling momentum.
The NZD/USD stands recovered to 0.5919, it seeing 0.60% gains. The dominant sentiment remains bearish, subtly dominated by sellers due to the consistent positioning beneath key Simple Moving Averages (SMAs). However, indicators on the daily and hourly charts seem to be recovering.
On the daily chart, the Relative Strength Index (RSI) demonstrates a negative sentiment as it continues an under-50 trend. Although there was a slight uptick from the recent low point seen on Monday, the RSI remains in deep in negative territory. Moreover, the Moving Average Convergence Divergence (MACD) displays falling red bars, reinforcing a weakening bearish momentum.
NZD/USD daily chart
The hourly chart presents an interesting contrast. Here, recent RSI readings consistently float above 50, marking a positive territory. The latest reading is 57, revealing that buyers are taking the reins on the hourly scale. The MACD histogram echoes the buying momentum printing rising green bars.
NZD/USD hourly chart
Upon examining the long-term trend, it becomes apparent that the NZD/USD exhibits bearish momentum as it slots below the 20-day, 100-day, and 200-day Simple Moving Average (SMA) indicators. So any movements which keeps the pair beneath these levels shouldn't be considered as a clear buying signal.
- The Australian Unemployment Rate is expected to have ticked higher in March.
- Employment Change is foreseen losing momentum after the outstanding February figure.
- AUD/USD corrective advance may provide bears the chance to sell at higher levels.
Australia will publish its monthly employment report first thing Thursday. The Australian Bureau of Statistics (ABS) is expected to announce the country added measly 7.2K new positions in March after the outstanding 116.5K jobs created in February. The Unemployment Rate is foreseen at 3.9% after dropping to a six-month low of 3.7% in the previous month. In February, the trend unemployment rate remained at 3.8% for the sixth month in a row.
Australia reports the monthly Employment Change split into full-time and part-time positions. Generally speaking, full-time jobs imply working 38 hours per week or more and usually include additional benefits, but they mostly represent consistent income. On the other hand, part-time employment generally means higher hourly rates but lacks consistency and benefits. That’s why the economy prefers full-time jobs.
Scrutinizing the impressive February headline, Australia created 38.3K part-time roles and added a whopping 78.2K full-time ones. “The large increase in employment in February followed larger-than-usual numbers of people in December and January who had a job that they were waiting to start or to return to. This translated into a larger-than-usual flow of people into employment in February and even more so than February last year,” according to the official ABS report.
Australian unemployment rate expected to bounce back in March
Market analysts anticipate the Australian Unemployment Rate increased to 3.9% in March after declining to 3.7% in February. As mentioned before, the country is expected to have added 7.2K new jobs following 116.5K positions added in February.
The labor sector in Australia has remained relatively strong over the past few months, although, opposite to other major counterparts, the Reserve Bank of Australia (RBA) does not seem to care about whether the job market remains tight.
As widely anticipated, the RBA kept its policy rate unchanged for the third straight meeting at 4.35% when it met in March. For a change, policymakers scrapped any reference to possible further increases, pushing AUD/USD lower.
“If our forecasts come true, and I really hope we’re on that narrow path that Phil (Lowe - former RBA Governor) used to talk about, then we can slow the economy enough that it preserves a lot of the gains in employment and brings inflation down,” Governor Michele Bullock noted, following the central bank meeting. The Board is hopeful they will head into a soft landing as long as inflation remains subdued.
The Australian Bureau of Statistics (ABS) publishes the Consumer Price Index (CPI) quarterly. According to the latest release, the CPI rose 0.6% in the last quarter of 2023 and 4.1% in the 12 months to December 2023. The RBA’s inflation goal is between 2% and 3%.
It is worth mentioning that wage growth is reported separately. The ABS also offers a quarterly report, with the latest showing the seasonally adjusted Wage Price Index (WPI) rose 0.9% in the last quarter of 2023 and 4.2% over the year. At this point, wage growth continues to outstrip inflation, but it's not something to care about today.
When will the Australian employment report be released, and how could it affect AUD/USD?
The ABS will publish the February employment report on Thursday. As previously stated, Australia is expected to have created 7.2K new jobs in March, while the Unemployment Rate is foreseen at 3.9%. The Participation Rate was reported at 66.7% in February.
The tepid job creation and the modest uptick in the Unemployment Rate should not be a problem for the RBA. A much stronger than-anticipated report, however, may be read as a delay in rate cuts. The market isn’t rushing to bet on it, which means the Aussie will likely take advantage against the US Dollar in such a scenario.
A poor outcome on the contrary, and given broad USD strength, AUD/USD may fall to fresh 2024 lows.
From a technical perspective, Valeria Bednarik, Chief Analyst at FXStreet, notes: “The AUD/USD pair set a fresh 2024 low on Tuesday at 0.6388, as broad US Dollar demand in a risk-averse environment dominates financial boards. The pair is up ahead of the announcement, but the advance seems corrective. Speculative interest is adjusting rate-cut expectations while digesting the latest Middle East developments. The modest improvement in sentiment is short of confirming fears are gone, which means the case for a lower low is alive and kicking.”
Bednarik adds: “AUD/USD is bearish, given that it is developing below all its moving averages in the daily chart. The 20 Simple Moving Average (SMA) heads firmly south below the 100 and 200 SMAs and over 100 pips above the current level, reflecting bears’ strength. Technical indicators recovered modestly from oversold readings but lack momentum enough to confirm an interim bottom. AUD/USD has near-term support at 0.6410, followed by the aforementioned 2024 low. Once below the latter, the slide could extend initially towards 0.6350, en route to 0.6315. On the contrary, immediate resistance can be found at 0.6470, followed by the 0.6530 pierce zone. It is worth adding that, once the dust settles and in the case of a bullish run, sellers may take their chances to keep the pair in the bearish path.”
Australian Dollar FAQs
One of the most significant factors for the Australian Dollar (AUD) is the level of interest rates set by the Reserve Bank of Australia (RBA). Because Australia is a resource-rich country another key driver is the price of its biggest export, Iron Ore. The health of the Chinese economy, its largest trading partner, is a factor, as well as inflation in Australia, its growth rate and Trade Balance. Market sentiment – whether investors are taking on more risky assets (risk-on) or seeking safe-havens (risk-off) – is also a factor, with risk-on positive for AUD.
The Reserve Bank of Australia (RBA) influences the Australian Dollar (AUD) by setting the level of interest rates that Australian banks can lend to each other. This influences the level of interest rates in the economy as a whole. The main goal of the RBA is to maintain a stable inflation rate of 2-3% by adjusting interest rates up or down. Relatively high interest rates compared to other major central banks support the AUD, and the opposite for relatively low. The RBA can also use quantitative easing and tightening to influence credit conditions, with the former AUD-negative and the latter AUD-positive.
China is Australia’s largest trading partner so the health of the Chinese economy is a major influence on the value of the Australian Dollar (AUD). When the Chinese economy is doing well it purchases more raw materials, goods and services from Australia, lifting demand for the AUD, and pushing up its value. The opposite is the case when the Chinese economy is not growing as fast as expected. Positive or negative surprises in Chinese growth data, therefore, often have a direct impact on the Australian Dollar and its pairs.
Iron Ore is Australia’s largest export, accounting for $118 billion a year according to data from 2021, with China as its primary destination. The price of Iron Ore, therefore, can be a driver of the Australian Dollar. Generally, if the price of Iron Ore rises, AUD also goes up, as aggregate demand for the currency increases. The opposite is the case if the price of Iron Ore falls. Higher Iron Ore prices also tend to result in a greater likelihood of a positive Trade Balance for Australia, which is also positive of the AUD.
The Trade Balance, which is the difference between what a country earns from its exports versus what it pays for its imports, is another factor that can influence the value of the Australian Dollar. If Australia produces highly sought after exports, then its currency will gain in value purely from the surplus demand created from foreign buyers seeking to purchase its exports versus what it spends to purchase imports. Therefore, a positive net Trade Balance strengthens the AUD, with the opposite effect if the Trade Balance is negative.
Economic Indicator
Unemployment Rate s.a.
The Unemployment Rate, released by the Australian Bureau of Statistics, is the number of unemployed workers divided by the total civilian labor force, expressed as a percentage. If the rate increases, it indicates a lack of expansion within the Australian labor market and a weakness within the Australian economy. A decrease in the figure is seen as bullish for the Australian Dollar (AUD), while an increase is seen as bearish.
Read more.Next release: Thu Apr 18, 2024 01:30
Frequency: Monthly
Consensus: 3.9%
Previous: 3.7%
Source: Australian Bureau of Statistics
The Australian Bureau of Statistics (ABS) publishes an overview of trends in the Australian labour market, with unemployment rate a closely watched indicator. It is released about 15 days after the month end and throws light on the overall economic conditions, as it is highly correlated to consumer spending and inflation. Despite the lagging nature of the indicator, it affects the Reserve Bank of Australia’s (RBA) interest rate decisions, in turn, moving the Australian dollar. Upbeat figure tends to be AUD positive.
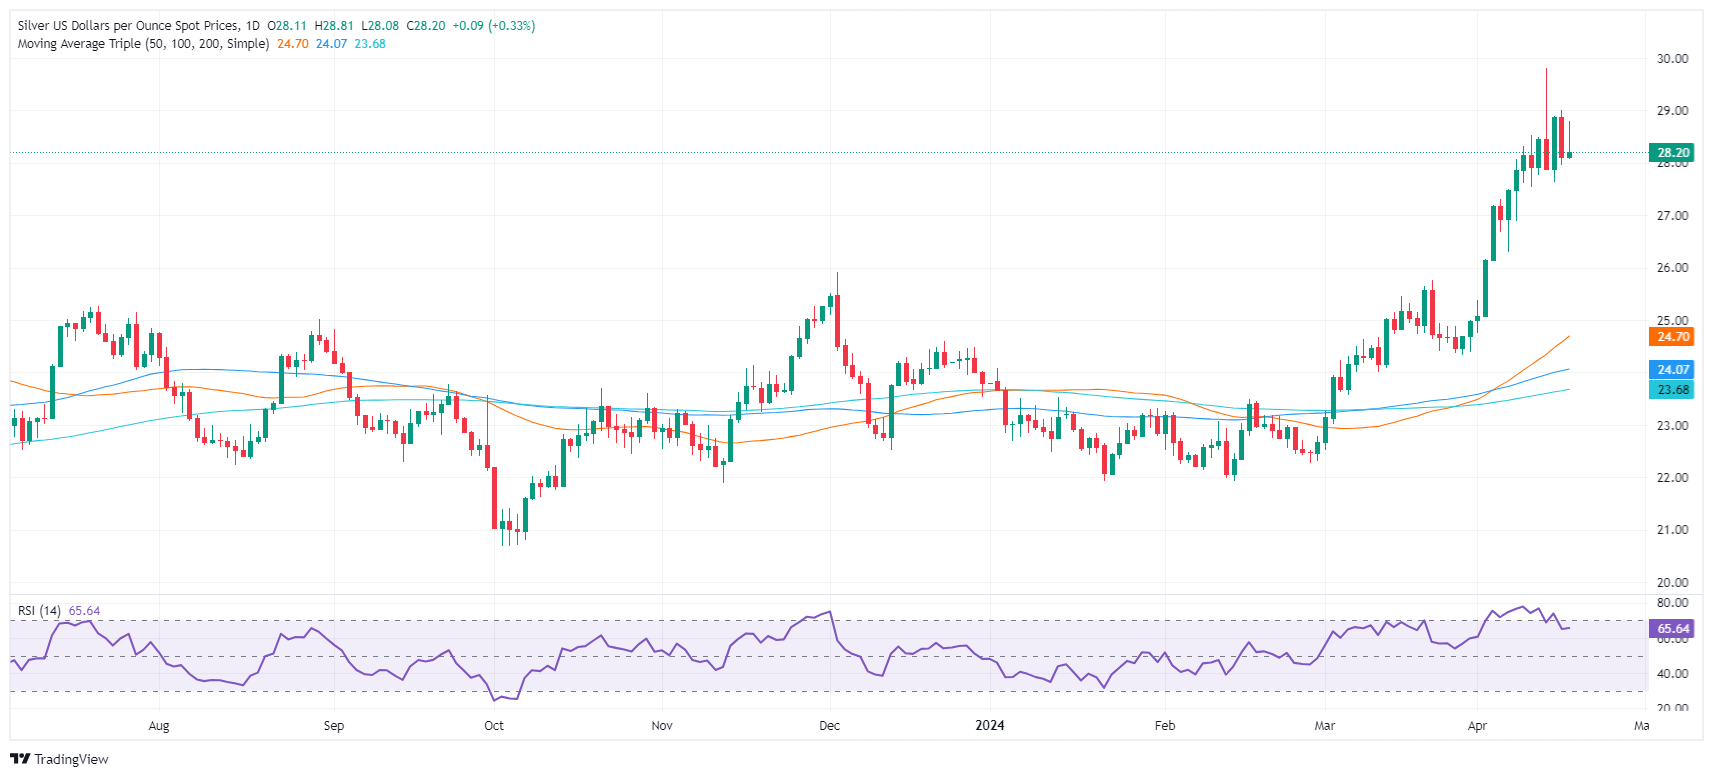
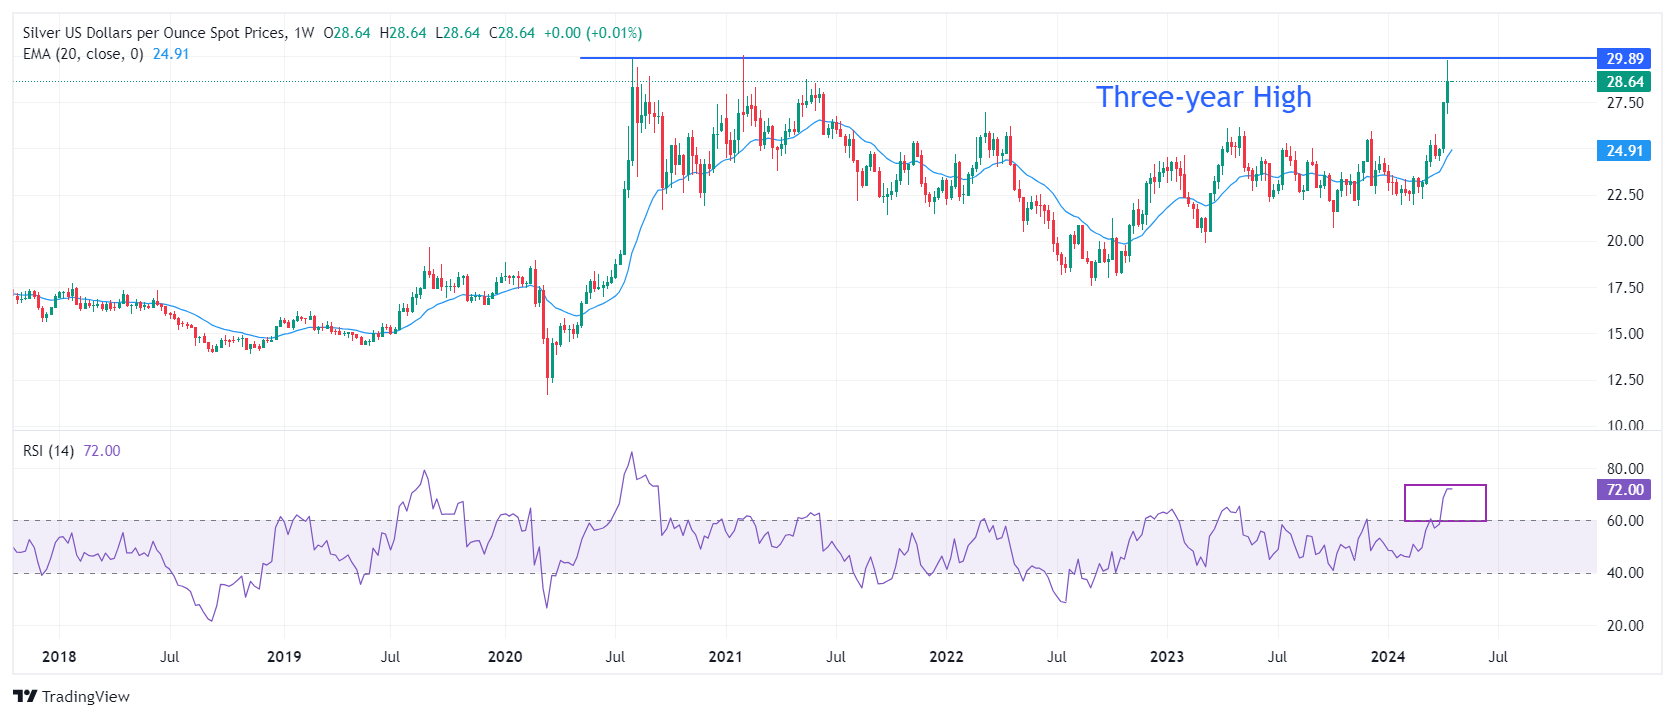
- Silver edges higher, showing resilience with a 0.50% gain, yet faces tough resistance near $28.74.
- Technical analysis suggests potential pullback risks with $28.00 as a pivotal level; further support at $27.59 and $27.00.
- Upside momentum could resume if prices surpass $28.28, targeting higher resistance points at $28.74 and potentially $29.00.
Silver’s prices remain in positive territory but continued to register higher tails in the daily chart, signaling buyers' failure to commit to higher prices above the May 18, 2021, high of $28.74. At the time of writing, XAG/USD trades at $28.21 and gains 0.50%.
XAG/USD Price Analysis: Technical outlook
The daily chart depicts the grey metal as upward biased even though it’s retreating below the crucial resistance level, exposing the significant $28.00 figure. Once that level is cleared, it could potentially lead to a significant shift in the market dynamics. Silver’s next support would be the April 15 low of $27.59 ahead of $27.00. Once that level is taken out, the next demand zone would be the December 4, 2023, high turned support at $25.91.
On the other hand, if buyers lift XAG/USD prices back above June 10, 2021, high at $28.28, it could clear the path to test $28.74. A breach of the latter will expose $29.00, followed by the year-to-date (YTD) high at $29.79.
XAG/USD Price Action – Daily Chart
- Markets are pushing the start of the easing cycle from the BoE to September.
- Fed Chair Powell's hawkish stance on Tuesday strengthened the US Dollar.
- As the BoE and Fed’s policies align, the Pound may see additional gains.
The GBP/USD pair is currently trading slightly higher at 1.2448, tallying daily gains. Meanwhile, the USD’s rally was halted due to US Treasury yields declining, but the Greenback’s outlook is bright as the US economy remains strong and markets bet on a more aggressive Federal Reserve (Fed).
Earlier in the session, the UK's Consumer Price Index (CPI) for March reported a slight increase, indicating ongoing inflationary pressures. As a reaction, markets readjusted their expectations on the next decisions from the British bank, and the initial cut is now anticipated for September, a delay from previously expected August. Furthermore, the likelihood of a second reduction in December has decreased to 60% from being fully anticipated earlier in the week. This recalibration of expectations has benefited the Pound on Wednesday.
In line with that, the US continues to see robust inflation and economic figures, underpinning the Fed’s decision to maintain a restrictive policy stance longer than initially expected. So as both bank's policies align, the GBP may see further gains or the pace of the pair may be dictated by how wide the US and GBP’s yield spreads get.
GBP/USD technical analysis
On the daily chart, the Relative Strength Index (RSI) is edging towards oversold territory. On Wednesday, there was a positive movement from 31 to 34 which suggests that the market is currently dominated by sellers, and the pair might be due for a price correction or reversal as sellers take a breather.
When assessing the wider scenario, it's noticeable that the GBP/USD has been trading below the Simple Moving Averages (SMAs) for 20-day, 100-day, and 200-day periods which suggests that the overall trend remains bearish. That being said, traders should pay close attention to an impending bearish crossover at 1.2570 between the 20 and 200-day SMA, which could add further downside pressure on the GBP/USD.
- Gold price drops from daily highs as better global risk sentiment diminishes safe-haven demand.
- A dip in US Treasury yields places additional pressure on the US Dollar amidst hawkish Fed remarks.
- Easing Middle East tensions sway Gold market, forthcoming US sanctions on Iran could influence future precious metal prices.
Gold prices retreated from close to weekly highs during the North American session on Wednesday amid an improvement in risk appetite. The bullish impulse arrived despite hawkish commentary by US Federal Reserve (Fed) officials. US Treasury bond yields dropped and undermined the Greenback, capping Gold’s plunge.
XAU/USD trades at $2,375, down 0.34%, after hitting a daily high of $2,395, just shy of surpassing $2,400. Tensions in the Middle East had subsided after Israeli officials commented that they considered striking Iran on Monday but decided to wait, according to Axios. In the meantime, the US will impose new sanctions on Iran in the upcoming days, said Jake Sullivan, the White House National Security Advisor.
Back to economic themes, Fed Chair Jerome Powell said the US economy has performed quite strongly while acknowledging that recent data shows the lack of further progress on inflation.
Daily digest market movers: Gold slides amid falling US yields, soft US Dollar
- Powell added, "The recent data have clearly not given us greater confidence and instead indicate that it is likely to take longer than expected to achieve that confidence,” that inflation is on the path to 2%. He said, “Given the strength of the labor market and progress on inflation so far, it is appropriate to allow restrictive policy further time to work and let the data and the evolving outlook guide us.”
- Recent US economic data indicates a robust economy, highlighted by February's Retail Sales, which outperformed expectations, and steady Industrial Production figures. These positive indicators have helped to mitigate concerns raised by weaker-than-anticipated housing data released on Wednesday.
- In the meantime, the CME FedWatch Tool shows the first rate cut could happen in September, with odds for a quarter percentage point cut standing at 71%.
- Despite decent US economic data, market participants seem to be focused on geopolitical risks. Sources cited by The Jerusalem Post revealed that Israel has reportedly finalized plans for a counter strike against Iran.
- US Dollar Index (DXY), which tracks the buck’s performance against a basket of six other currencies, loses 0.15% to 105.96.
- Gross Domestic Product (GDP) estimates for Q1 2024 show that the US economy is expected to grow 2.9%, up from 2.8% estimated on April 15, according to the Atlanta GDPNow model.
Technical analysis: Gold dives as RSI nearly exits overbought levels
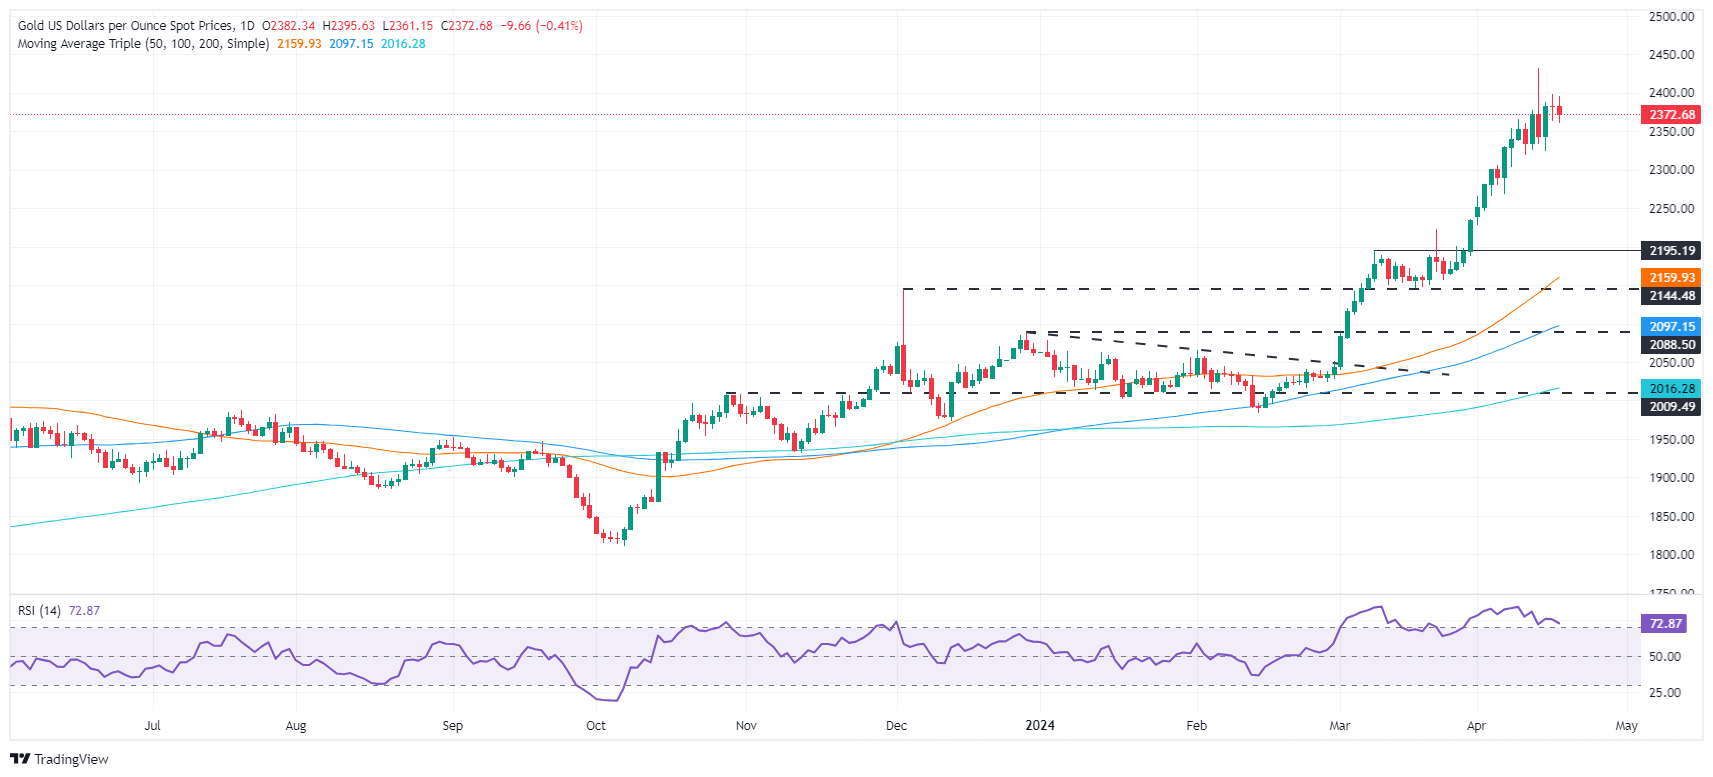
Gold’s daily chart depicts the yellow metal as upwardly biased despite retreating toward the $2,370 region. The formation of a Doji on Tuesday suggests that buyers lack the momentum to extend the precious metal's gains, opening the door for a pullback.
In addition, the Relative Strength Index (RSI has fallen below the 80 level and hasn’t looked back, as it is nearly crossing below the 70 level, suggesting that buying pressure is fading.
That said, XAU/USD is headed for a correction. The first support would be the $2,350 mark, followed by the April 15 daily low of $2,324. Once surpassed, Gold might test $2,300.
On the other hand, if buyers drag prices toward $2,400, a test of the all-time high of $2,431 is on the cards.
Gold FAQs
Gold has played a key role in human’s history as it has been widely used as a store of value and medium of exchange. Currently, apart from its shine and usage for jewelry, the precious metal is widely seen as a safe-haven asset, meaning that it is considered a good investment during turbulent times. Gold is also widely seen as a hedge against inflation and against depreciating currencies as it doesn’t rely on any specific issuer or government.
Central banks are the biggest Gold holders. In their aim to support their currencies in turbulent times, central banks tend to diversify their reserves and buy Gold to improve the perceived strength of the economy and the currency. High Gold reserves can be a source of trust for a country’s solvency. Central banks added 1,136 tonnes of Gold worth around $70 billion to their reserves in 2022, according to data from the World Gold Council. This is the highest yearly purchase since records began. Central banks from emerging economies such as China, India and Turkey are quickly increasing their Gold reserves.
Gold has an inverse correlation with the US Dollar and US Treasuries, which are both major reserve and safe-haven assets. When the Dollar depreciates, Gold tends to rise, enabling investors and central banks to diversify their assets in turbulent times. Gold is also inversely correlated with risk assets. A rally in the stock market tends to weaken Gold price, while sell-offs in riskier markets tend to favor the precious metal.
The price can move due to a wide range of factors. Geopolitical instability or fears of a deep recession can quickly make Gold price escalate due to its safe-haven status. As a yield-less asset, Gold tends to rise with lower interest rates, while higher cost of money usually weighs down on the yellow metal. Still, most moves depend on how the US Dollar (USD) behaves as the asset is priced in dollars (XAU/USD). A strong Dollar tends to keep the price of Gold controlled, whereas a weaker Dollar is likely to push Gold prices up.
The Greenback saw its recent rally run out of steam, prompting a corrective move in the USD Index (DXY) and some recovery in the risk-linked galaxy amidst persistent geopolitical concerns and a firm conviction of an ECB rate cut in the summer.
Here is what you need to know on Thursday, April 18:
The Greenback came under pressure and forced the USD Index (DXY) to retreat from recent peaks. On April 18, the usual weekly Initial Jobless Claims are due along with the Philly Fed Manufacturing Index, the CB Leading Index and Existing Home Sales. In addition, Fed’s Bowman, Bostic and Williams are also due to speak.
EUR/USD rose to three-day highs on the back of the renewed selling pressure in the greenback and a risk-friendly environment in the global markets.
GBP/USD regained the smile and revisited the upper 1.2400s on risk-on sentiment and following expectations of a BoE’s rate cut later in the year.
USD/JPY traded on the defensive after two consecutive sessions of gains, although managing well to keep the trade north of 154.00. In Japan, the weekly Foreign Bond Investment and the speech by BoJ Noguchi are scheduled for April 18.
AUD/USD set aside a three-session negative streak and rebounded from recent yearly lows in the sub-0.6400 area. The release of the Australian labour market report takes centre stage on April 18.
WTI dropped markedly and flirted with the $82.00 mark per barrel on easing geopolitical concerns and a larger-than-estimated weekly build in US crude oil inventories.
Gold prices retreated modestly below the $2,400 mark per troy ounce pari passu with shrinking geopolitical jitters. Silver prices left behind Tuesday’s strong decline and rebounded past the $28.00 mark per ounce.
European Central Bank’s President Christine Lagarde speaks in Washington, DC.
Key Quotes
Growth in Europe is mediocre, much slower than in the US
We’re clearly seeing timid signs of recovery
The game (of fighting inflation) is not over
Market Reaction
A firmer upside momentum now lifts EUR/USD to the area of daily highs near 1.0680.
- The daily RSI for the AUD/JPY demonstrates a modest uptrend, maintaining above the middle ground.
- The Hourly chart reveals mixed sentiment, with frequent RSI changes and negative momentum portrayed by the MACD bars.
- The 20-day SMA at 99.30 is the main target for the bulls.
The AUD/JPY showed a stronger stance by posting a gain of 0.27% and settling at 99.24 in Wednesday’s session. Despite the recent downside, the pair indicates a dominant bullish outlook, firmly standing above the key Simple Moving Averages (SMAs). However, the recent dip below the 20-day SMA brightened the outlook for the bears for the short term.
On the daily chart, the Relative Strength Index (RSI) pair indicates a slight positive trend. Despite dipping close to the 50 level, it recovered and retained its position in positive territory, hovering around 52. Meanwhile, the Moving Average Convergence Divergence (MACD) shows rising red bars, signaling a potential shift in momentum.
AUD/JPY daily chart
The hourly RSI reveals a mixed trend. The latest reading was 53, indicating a positive trend, while previous readings varied between positive and negative territories, revealing fluctuating market momentum. The hourly MACD shows flat red bars, signifying a steady negative momentum.
AUD/JPY hourly chart
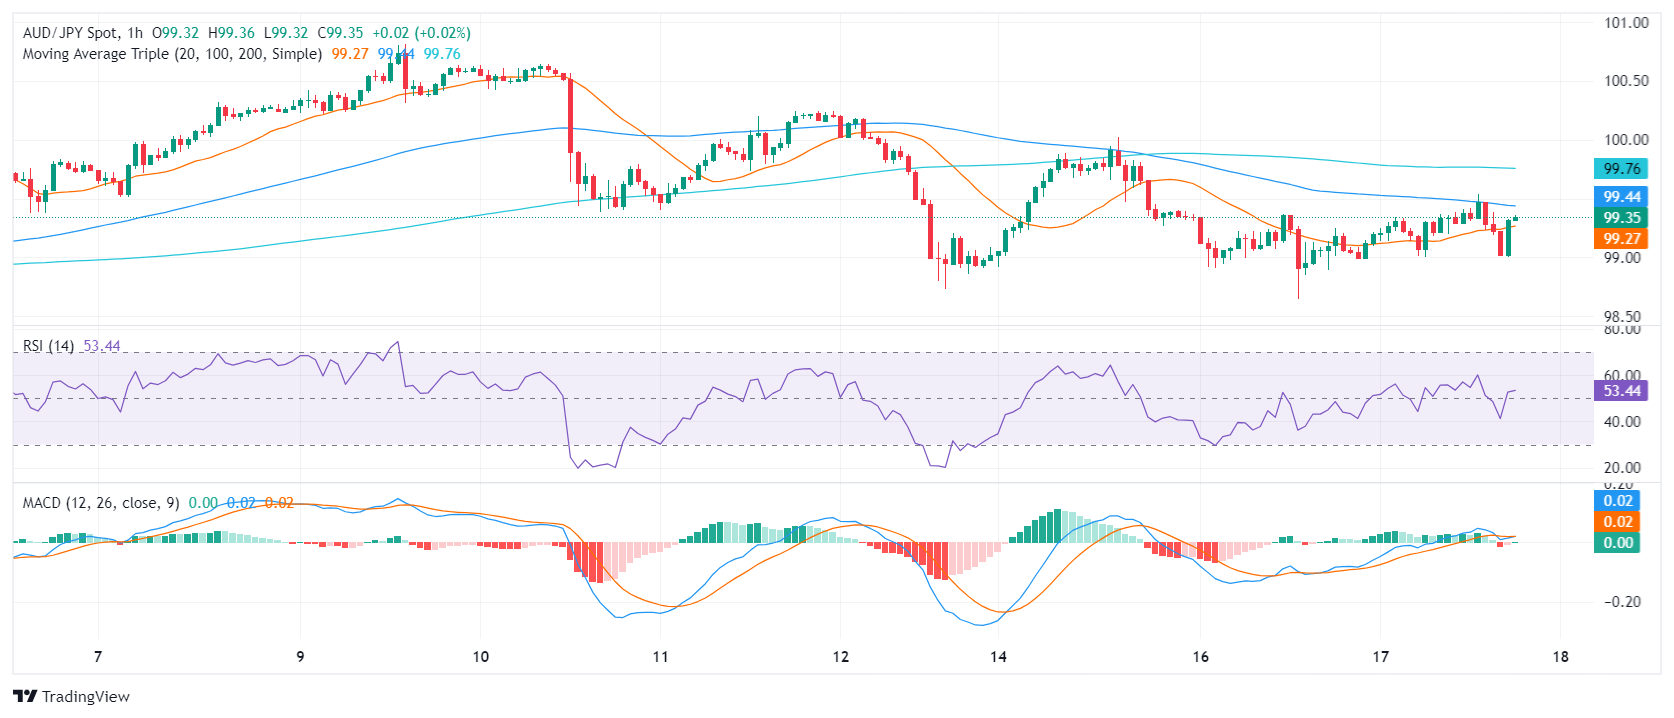
Observing the broader prospect, the AUD/JPY's position above the 100-day and 200-day SMA reveals a robust long-term bullish trend. Any significant movements today that keep the cross above these levels won’t threaten the positive outlook, but as the bears gather momentum, some downside in the short term should be expected.
- Mexican Peso regains ground, trading at 16.98 against the US Dollar following Banxico Deputy Governor's comments on maintaining high rates.
- Banxico Deputy Governor Jonathan Heath indicates possible "fine adjustments" to interest rates to combat persistent inflation.
- Fed Chair Jerome Powell hinting at prolonged high US rates due to stagnant inflation progress.
The Mexican Peso trims some of its losses against the US Dollar, but it’s not out of the woods despite remarks from Bank of Mexico (Banxico) Deputy Governor Jonathan Heath suggesting that rates would likely need to remain higher.
That and an improvement in risk appetite was a relief for the Mexican currency, which weakened to levels last seen in February 2024. The USD/MXN trades at 16.99, down 0.47%.
During an interview with Banorte’s Podcast, Heath said the central bank would likely make “fine adjustments” to the main reference rate to ensure “that the restrictive monetary stance remains at these levels for as long as necessary until we see progress on inflation.”
He added that although inflation’s downward trajectory remains in place, it stalled near the 4.4% threshold for five months. Heath added that “prices of services” are to blame for inflation's stickiness.
Across the border, Heath’s colleague, Fed Chair Jerome Powell, said rates could remain higher for longer in remarks at the Wilson Center on Tuesday. Powell said that the lack of progress on inflation would likely require keeping rates steady for “as long as needed.”
Daily digest market movers: Mexican Peso underpinned by Heath comments
- Mexico’s economic docket remains absent, though February’s Retail Sales report for February is scheduled for April 19.
- On Tuesday, the International Monetary Fund (IMF) updated its expectations for economic growth in Mexico, from 2.7% to 2.4% in 2024 and from 1.5% to 1.4% in 2025. The IMF reduced its 2025 forecast, arguing that the fiscal expansion that will drive progress this year will be reversed in the next year because the new administration will have to tighten its belt, reversing existing spending policy.
- US economic data revealed during the week suggests the economy remains solid. A better-than-expected Retail Sales report for February, along with firm Industrial Production, overshadowed weaker-than-expected housing figures on Wednesday.
- Powell added, “Given the strength of the labor market and progress on inflation so far, it is appropriate to allow restrictive policy further time to work and let the data and the evolving outlook guide us.”
- Geopolitical tensions in the Middle East would likely weigh on the Mexican currency. USD/MXN traders must be aware that any escalation could prompt traders to ditch the Mexican Peso and buy US Dollars.
- US Treasury yields are sliding close to eight basis points (bps) in the belly and long end of the yield curve. That underpins the Greenback, which is up a modest 0.09% at 106.17 on the DXY.
- Data from the Chicago Board of Trade (CBOT) suggests that traders expect the Fed funds rate to finish 2024 at 4.95%, down from 4.97% a day ago.
Technical analysis: Mexican Peso cuts some losses but remains pressured

The USD/MXN daily chart suggests the pair shifted to a neutral/upward bias as the Mexican currency tumbles and depreciates past the 17.00 figure. However, buyers must keep the pair above the 100-day Simple Moving Average (SMA) at 16.97, to remain hopeful of higher prices. That would the 17.00 figure in sight, followed by the current weekly high of 17.08. Once surpassed, the next stop would be the 200-day SMA at 17.16, followed by the January 17 high at 17.38, before testing the 17.50 psychological level.
On the other hand, if USD/MXN slides below 16.97, look for a pullback toward last year’s low of 16.62, followed by the April 12 low of 16.40.
Mexican Peso FAQs
The Mexican Peso (MXN) is the most traded currency among its Latin American peers. Its value is broadly determined by the performance of the Mexican economy, the country’s central bank’s policy, the amount of foreign investment in the country and even the levels of remittances sent by Mexicans who live abroad, particularly in the United States. Geopolitical trends can also move MXN: for example, the process of nearshoring – or the decision by some firms to relocate manufacturing capacity and supply chains closer to their home countries – is also seen as a catalyst for the Mexican currency as the country is considered a key manufacturing hub in the American continent. Another catalyst for MXN is Oil prices as Mexico is a key exporter of the commodity.
The main objective of Mexico’s central bank, also known as Banxico, is to maintain inflation at low and stable levels (at or close to its target of 3%, the midpoint in a tolerance band of between 2% and 4%). To this end, the bank sets an appropriate level of interest rates. When inflation is too high, Banxico will attempt to tame it by raising interest rates, making it more expensive for households and businesses to borrow money, thus cooling demand and the overall economy. Higher interest rates are generally positive for the Mexican Peso (MXN) as they lead to higher yields, making the country a more attractive place for investors. On the contrary, lower interest rates tend to weaken MXN.
Macroeconomic data releases are key to assess the state of the economy and can have an impact on the Mexican Peso (MXN) valuation. A strong Mexican economy, based on high economic growth, low unemployment and high confidence is good for MXN. Not only does it attract more foreign investment but it may encourage the Bank of Mexico (Banxico) to increase interest rates, particularly if this strength comes together with elevated inflation. However, if economic data is weak, MXN is likely to depreciate.
As an emerging-market currency, the Mexican Peso (MXN) tends to strive during risk-on periods, or when investors perceive that broader market risks are low and thus are eager to engage with investments that carry a higher risk. Conversely, MXN tends to weaken at times of market turbulence or economic uncertainty as investors tend to sell higher-risk assets and flee to the more-stable safe havens.
- Oil prices accelerate their reversal as US stocks increase beyond expectations
- The outlook of higher rates for a longer time is increasing concerns about a lower demand for oil
- These fears have offset the impact of geopolitical risks.
Oil prices are going through a sharp reversal on Wednesday, to pare some of the gains taken over the last tree months. WTI crude futures broke lower on Wednesday after a period of hesitation hammered by the higher-for-longer Fed outlook coupled with larger-than-expected US oil stocks.
The weekly EIA report revealed that US Oil stocks increased by 2.735 million barrels. in the week of April 12, against expectations of 1.65 million, and from the 5,841 million barrels reported in the previous week.
This increase in crude stocks comes after Fed Chair, Jerome Powell, warned that the bank might still have work to do to bring inflation to the 2% target. These comments suggest that interest rates will remain at restrictive levels for a longer time, which is expected to depress economic growth and weigh on demand for Oil.
This has offset the positive impact on Crude from the increasing geopolitical risks and from news reporting a US threat to reimpose the ban on Venezuelan Oil if President Maduro fails to meet his commitment to fair elections this year.
The broader trend remains bullish although today’s bearish reaction is suggesting a deeper correction. A confirmation below previous highs at $82.85 puts the $80.50 area on the bears’ focus. On the upside, bulls should regain the $84.90 level to shift the focus back toward the YTD high, at $87.60.
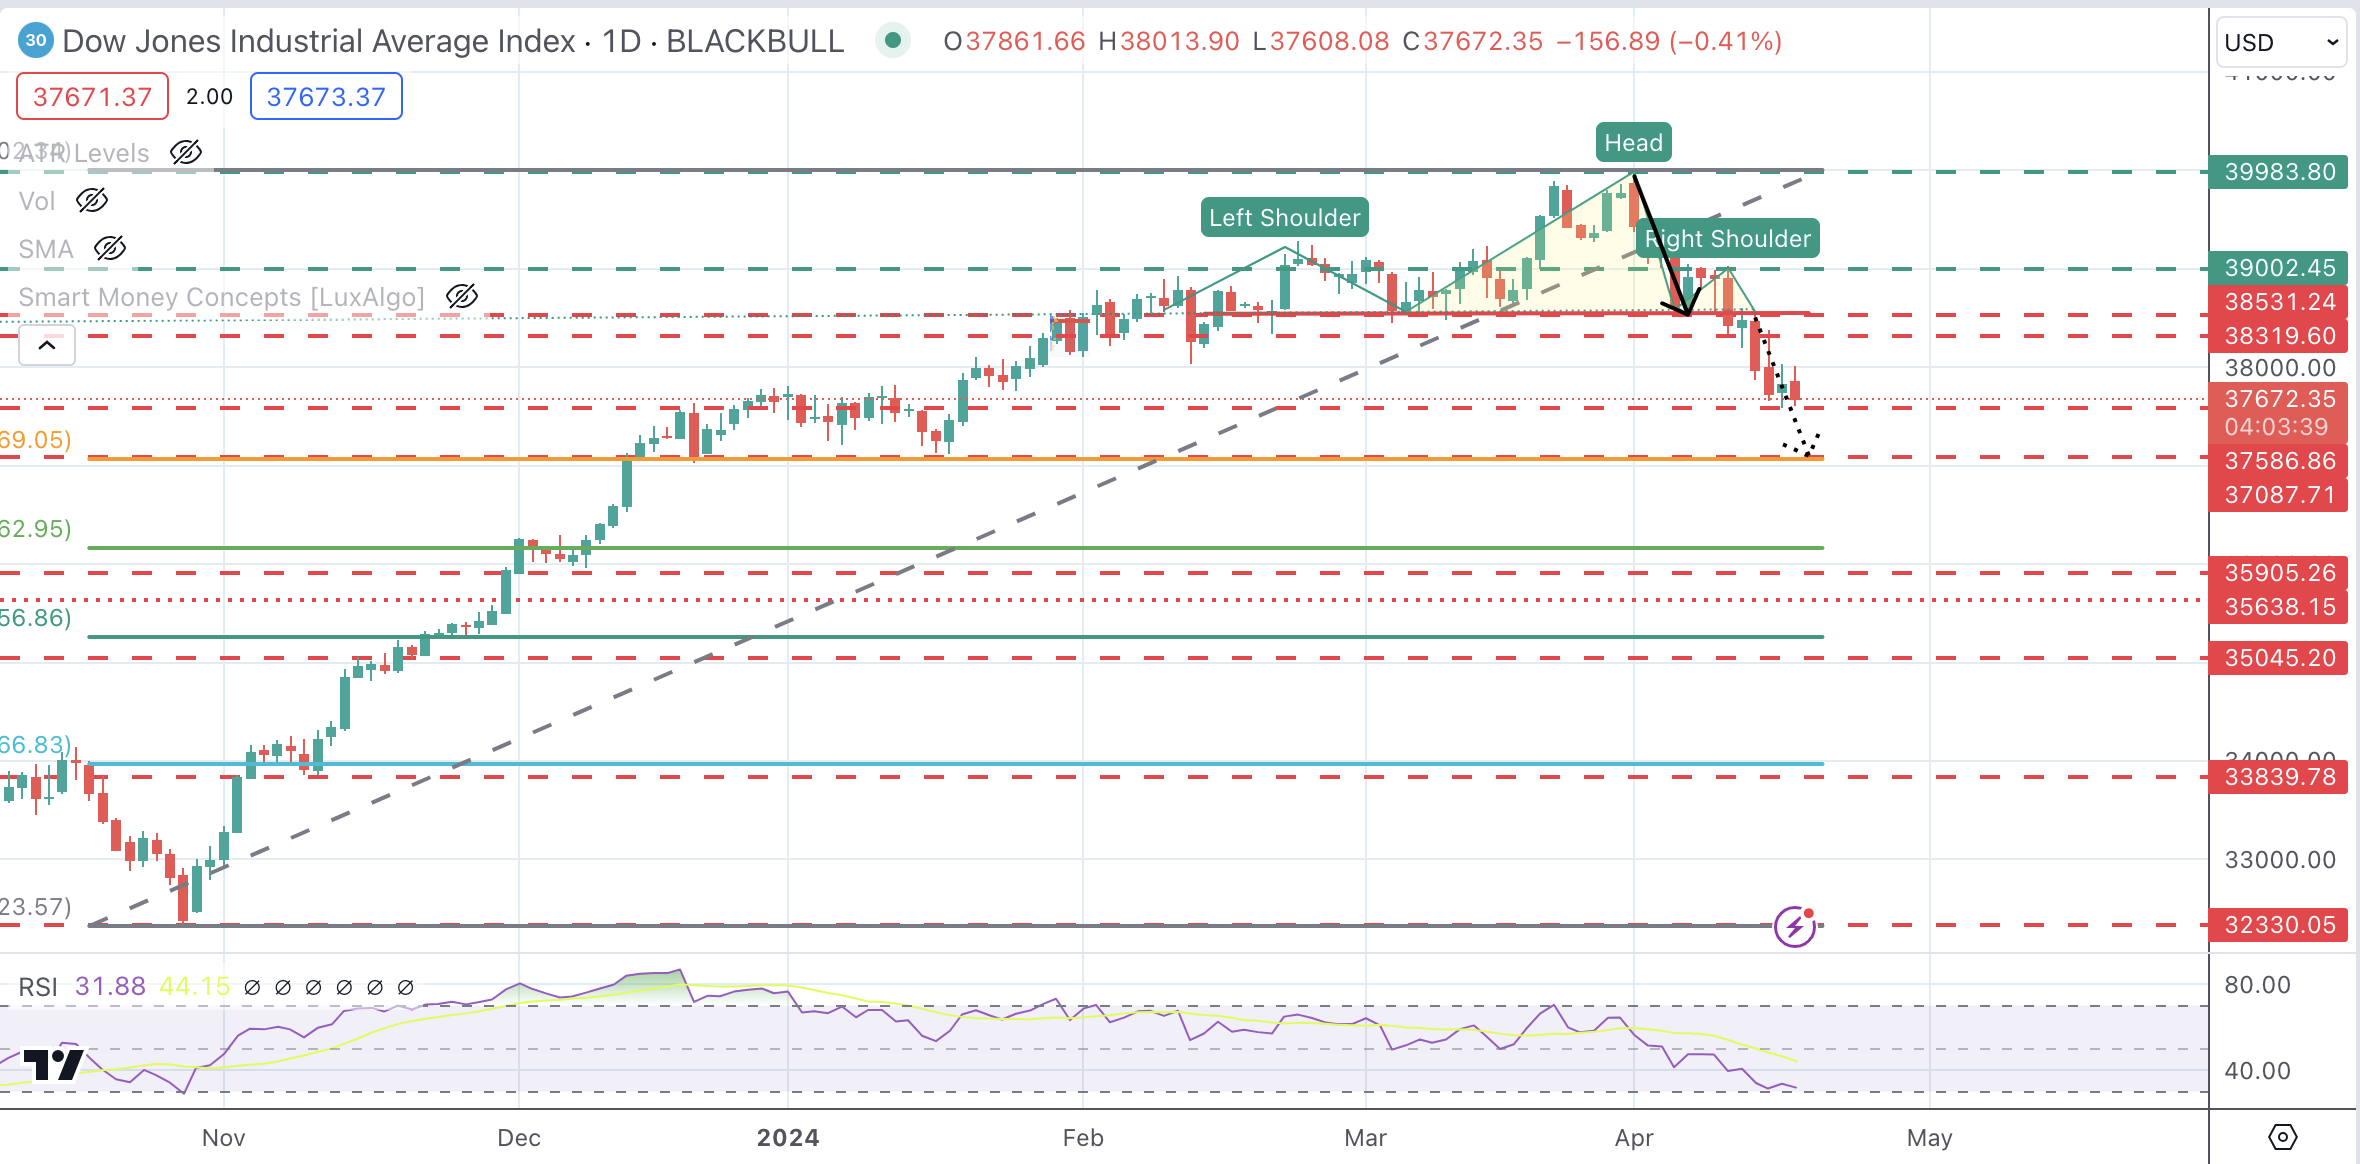
- Dow Jones index dips into losses following positive market opening.
- Investors’ concerns about the Fed’s “higher for longer” stance are weighing on risk appetite.
- Technical picture remains bearish with DJIA retreating from historic highs reached in March.
The Dow Jones Industrial Average (DJIA) is posting losses after a positive opening on Wednesday. Investors’ concerns about the hawkish comments by Federal Reserve (Fed) Chair Jerome Powell on Tuesday and a string of downbeat quarterly earrings have soured market sentiment.
Powell observed the lack of progress on inflation on Tuesday and resumed the “higher for longer” monetary policy outlook, which is acting to dampen investors’ appetite for risk.
Beyond that, quarterly earnings data disappointed on Wednesday with Travelers Companies (TRV) reporting profits below estimates, while US Bancorp’s (USB) net interest income fell by 14% in Q1.
The main Wall Street indices are in the red. The NASDAQ is leading losses with a 0.63% decline to 15,769, followed by the S&P 500, down 0.44% to 5,028, and the Dow Jones, off 0.3% to 37,693.
Dow Jones news
The Technology sector is the worst performer on Wednesday, dropping 1.1%, weighed down by the outlook of high rates for a longer time. Industrials are following on Wednesday with a 0.75% decline. On the positive side, Utilities are up 0.8%, while Materials appreciate 0.2%.
Travelers Companies (TRV) plunges 8.2% to $204.99 following downbeat quarterly earnings. Intel (INTC)l is next with a 1.9% drop to $35.57. United Health is the best performer, with a 2.7% rally to $481.53, followed by Goldman Sachs (GS) with a 1.38% gain to $402.33.
Dow Jones technical outlook
The DJIA index has reversed earlier gains and maintains an overall bearish picture intact. The move below 38,560 has activated a Head & Shoulders pattern that points toward a sharper decline.
Immediate support is 37,586, followed by the measured target of the H&S pattern, which meets the mid-January low and 38.6% Fibonacci retracement at 37,087. A bullish reaction might find resistance at the 38,531 previous support ahead of the 39,000 region (order block).
Dow Jones Index Daily Chart
Nasdaq FAQs
The Nasdaq is a stock exchange based in the US that started out life as an electronic stock quotation machine. At first, the Nasdaq only provided quotations for over-the-counter (OTC) stocks but later it became an exchange too. By 1991, the Nasdaq had grown to account for 46% of the entire US securities’ market. In 1998, it became the first stock exchange in the US to provide online trading. The Nasdaq also produces several indices, the most comprehensive of which is the Nasdaq Composite representing all 2,500-plus stocks on the Nasdaq, and the Nasdaq 100.
The Nasdaq 100 is a large-cap index made up of 100 non-financial companies from the Nasdaq stock exchange. Although it only includes a fraction of the thousands of stocks in the Nasdaq, it accounts for over 90% of the movement. The influence of each company on the index is market-cap weighted. The Nasdaq 100 includes companies with a significant focus on technology although it also encompasses companies from other industries and from outside the US. The average annual return of the Nasdaq 100 has been 17.23% since 1986.
There are a number of ways to trade the Nasdaq 100. Most retail brokers and spread betting platforms offer bets using Contracts for Difference (CFD). For longer-term investors, Exchange-Traded Funds (ETFs) trade like shares that mimic the movement of the index without the investor needing to buy all 100 constituent companies. An example ETF is the Invesco QQQ Trust (QQQ). Nasdaq 100 futures contracts allow traders to speculate on the future direction of the index. Options provide the right, but not the obligation, to buy or sell the Nasdaq 100 at a specific price (strike price) in the future.
Many different factors drive the Nasdaq 100 but mainly it is the aggregate performance of the component companies revealed in their quarterly and annual company earnings reports. US and global macroeconomic data also contributes as it impacts on investor sentiment, which if positive drives gains. The level of interest rates, set by the Federal Reserve (Fed), also influences the Nasdaq 100 as it affects the cost of credit, on which many corporations are heavily reliant. As such the level of inflation can be a major driver too as well as other metrics which impact on the decisions of the Fed.
- The DXY Index is recording mild gains, hitting a high since early November at 106.1.
- Investors are focusing on Fed Chair Powell's hawkish stance and US Treasury yields at multi-month highs.
- The Fed’s Beige books, set to be released later in the session, will be closely watched.
The US Dollar Index (DXY) stands at 106.10, showing mild gains. The shift in the index's trend appears influenced by several factors including strong growth and persistent inflation in the US, as well as increased hawkishness from Federal Reserve (Fed) officials.
The US economy is seeing sticky inflation and robust growth. Fed Chair Powell's hawkish stance shows that instead of another rate hike, the Fed favors market tightening through higher yields and wider spreads, which strengthens the USD. However, with financial conditions still loose, further tightening is required and Powell commented on Tuesday that the monetary policy may need additional time to work.
Daily digest market movers: DXY holds its ground on hawkish Fed bets
- Federal Reserve Chair Powell was seen hawkish on Tuesday and warned that there is little progress on inflation. He also stated that the bank remains data-dependent.
- The possibility of a rate cut in the next meeting in June stands at around 15%, a huge drop compared to the previous week's 60%. Also, the chances for a July rate cut have fallen below 50%.
- The first-rate cut is expected to take place in September with a 95% probability, followed by another in December at a 70% probability.
- The US Treasury yields for the 2-year, 5-year and 10-year Treasury bonds are currently standing at 4.93%, 4.63% and 4.61%, respectively, down on the day. Despite the recent decrease, the 2-year and 10-year yields are at their highest since November.
DXY technical analysis: DXY displays bulls' stronghold despite overbought conditions.
On the daily chart, the Relative Strength Index (RSI) continues exhibiting overbought conditions, hinting at an upcoming correction or consolidation phase. The Moving Average Convergence Divergence (MACD) shows decreasing green bars, implying that the buying momentum is losing steam and that the bears may soon take charge.
However, the pair is comfortably positioned above its 20, 100 and 200-day Simple Moving Averages (SMAs), indicating the bulls' dominance in the current scenario. This suggests a positive medium to long-term outlook, with the bulls defending their ground despite the technical indicators pointing toward a short-term bearish influence.
US Dollar FAQs
The US Dollar (USD) is the official currency of the United States of America, and the ‘de facto’ currency of a significant number of other countries where it is found in circulation alongside local notes. It is the most heavily traded currency in the world, accounting for over 88% of all global foreign exchange turnover, or an average of $6.6 trillion in transactions per day, according to data from 2022. Following the second world war, the USD took over from the British Pound as the world’s reserve currency. For most of its history, the US Dollar was backed by Gold, until the Bretton Woods Agreement in 1971 when the Gold Standard went away.
The most important single factor impacting on the value of the US Dollar is monetary policy, which is shaped by the Federal Reserve (Fed). The Fed has two mandates: to achieve price stability (control inflation) and foster full employment. Its primary tool to achieve these two goals is by adjusting interest rates. When prices are rising too quickly and inflation is above the Fed’s 2% target, the Fed will raise rates, which helps the USD value. When inflation falls below 2% or the Unemployment Rate is too high, the Fed may lower interest rates, which weighs on the Greenback.
In extreme situations, the Federal Reserve can also print more Dollars and enact quantitative easing (QE). QE is the process by which the Fed substantially increases the flow of credit in a stuck financial system. It is a non-standard policy measure used when credit has dried up because banks will not lend to each other (out of the fear of counterparty default). It is a last resort when simply lowering interest rates is unlikely to achieve the necessary result. It was the Fed’s weapon of choice to combat the credit crunch that occurred during the Great Financial Crisis in 2008. It involves the Fed printing more Dollars and using them to buy US government bonds predominantly from financial institutions. QE usually leads to a weaker US Dollar.
Quantitative tightening (QT) is the reverse process whereby the Federal Reserve stops buying bonds from financial institutions and does not reinvest the principal from the bonds it holds maturing in new purchases. It is usually positive for the US Dollar.
Bank of England’s Governor Andrew Bailey speaks in the wake of the pick up in UK inflation figures in March.
Key Quotes
We’re pretty much on track for where we thought we would be in february on inflation.
I expect next month's inflation number will show quite a strong drop
Oil prices haven't leaped as much as expected
The effect of middle East conflict is less than feared
Market Reaction
GBP/USD keeps the tight range in the low 1.2400s, fading the initial bullish move to the 1.2480 zone on the back of the ongoing bounce in the Dollar.
Pound Sterling price today
The table below shows the percentage change of Pound Sterling (GBP) against listed major currencies today. Pound Sterling was the weakest against the Euro.
| USD | EUR | GBP | CAD | AUD | JPY | NZD | CHF | |
| USD | -0.15% | 0.02% | -0.04% | 0.04% | -0.08% | -0.03% | -0.03% | |
| EUR | 0.16% | 0.16% | 0.15% | 0.22% | 0.08% | 0.13% | 0.14% | |
| GBP | -0.04% | -0.19% | -0.04% | 0.02% | -0.12% | -0.07% | -0.07% | |
| CAD | 0.01% | -0.14% | 0.04% | 0.06% | -0.08% | -0.03% | -0.02% | |
| AUD | -0.02% | -0.20% | -0.02% | -0.06% | -0.14% | -0.10% | -0.08% | |
| JPY | 0.09% | -0.07% | 0.11% | 0.06% | 0.11% | 0.04% | 0.06% | |
| NZD | 0.08% | -0.10% | 0.09% | 0.05% | 0.11% | -0.02% | 0.02% | |
| CHF | 0.04% | -0.13% | 0.06% | 0.02% | 0.04% | -0.06% | 0.00% |
The heat map shows percentage changes of major currencies against each other. The base currency is picked from the left column, while the quote currency is picked from the top row. For example, if you pick the Euro from the left column and move along the horizontal line to the Japanese Yen, the percentage change displayed in the box will represent EUR (base)/JPY (quote).
- Canadian Dollar advances moderately as market sentiment improves.
- USD/CAD is pulling back despite the Fed’s hawkish stance and lower oil prices.
- Current Canadian Dollar recovery is likely to be short-lived.
The Canadian Dollar (CAD) is trading higher on Wednesday to snap a five-day sell-off that has sent the Loonie 1.7% lower. A positive risk sentiment, coupled with lower US yields, is hurting the safe-haven US Dollar and offsetting the CAD’s adverse fundamental background.
The absence of key US releases in the US of Canada is allowing the Canadian Dollar to regain some of the ground lost over the previous days. Upside attempts, however, are likely to be short-lived. The “higher for longer” Federal Reserve (Fed) stance, in opposition to the Bank of Canada’s (BoC) dovish outlook, is expected to support the US Dollar. Beyond that, the lower Oil prices are an extra weight for the commodity-linked Loonie.
On Wednesday, the release of the Fed’s beige book and speeches from Fed members Mester and Bowman are the only events worth mentioning. After Tuesday’s speech by Fed Chair Jerome Powell, their impact on the pair is limited.
Daily digest market movers: USD/CAD loses steam at five-month highs
Canadian Dollar is trading 0.2% higher on Wednesday after having lost nearly 2% in a five-day sell-off.
The hawkish Fed stance, confirmed on Wednesday by Fed Chair Powell, and the dovish outlook of the BoC, which is expected to start cutting rates in June, are acting as a headwind for the CAD.
On Wednesday, Fed Chair Powell warned about the lack of progress on inflation, suggesting that the bank will have to keep rates at restrictive levels for a longer time.
Bets for a Fed rate cut in July have dropped to 37% from 50% at the beginning of the week. Investors are now pricing in 40 bps of cuts in 2024, down from 150 BP in January.
EIA Crude Oil stocks have increased by 2.735 million barrels. against expectations of 1.65 million. Incrementally, this is weighing further on Crude prices and also on the CAD.
On Tuesday, Canadian inflation data showed mixed figures. Headline CPI accelerated to a 2.9% yearly rate from 2.8% in the previous month. The Core CPI eased to 2%, its lowest level in three years.
These figures endorse the view that the Bank of Canada will be able to cut rates soon, probably in June, and increase negative pressure on the pair.
Canadian Dollar price today
The table below shows the percentage change of Canadian Dollar (CAD) against listed major currencies today. Canadian Dollar was the weakest against the Japanese Yen.
| USD | EUR | GBP | CAD | AUD | JPY | NZD | CHF | |
| USD | -0.15% | 0.01% | -0.05% | 0.05% | -0.09% | -0.02% | -0.03% | |
| EUR | 0.17% | 0.18% | 0.13% | 0.21% | 0.05% | 0.11% | 0.11% | |
| GBP | -0.04% | -0.18% | -0.08% | 0.03% | -0.14% | -0.07% | -0.07% | |
| CAD | 0.02% | -0.13% | 0.03% | 0.08% | -0.08% | -0.02% | -0.01% | |
| AUD | -0.05% | -0.18% | -0.02% | -0.08% | -0.16% | -0.10% | -0.07% | |
| JPY | 0.09% | -0.07% | 0.09% | 0.05% | 0.12% | 0.04% | 0.06% | |
| NZD | 0.05% | -0.13% | 0.03% | 0.01% | 0.09% | -0.07% | -0.01% | |
| CHF | 0.04% | -0.11% | 0.07% | 0.01% | 0.10% | -0.06% | 0.00% |
The heat map shows percentage changes of major currencies against each other. The base currency is picked from the left column, while the quote currency is picked from the top row. For example, if you pick the Euro from the left column and move along the horizontal line to the Japanese Yen, the percentage change displayed in the box will represent EUR (base)/JPY (quote).
Technical analysis: USD/CAD in corrective pullback with 1.3785 holding bears for now
The broader US Dollar trend remains intact, although the pair is going through a corrective pullback from overbought levels, following a five-day rally.
Bears are expected to be challenged at 1.3785, ahead of the intra-week low at 1.3728. The 38.2% Fibonacci retracement level of April’s rally is at 1.3705. On the upside, the immediate resistance is at 1.3845. Further up, the next target would be November 2023 high at 1.3900.
USD/CAD 4-Hour Chart
Risk sentiment FAQs
In the world of financial jargon the two widely used terms “risk-on” and “risk off'' refer to the level of risk that investors are willing to stomach during the period referenced. In a “risk-on” market, investors are optimistic about the future and more willing to buy risky assets. In a “risk-off” market investors start to ‘play it safe’ because they are worried about the future, and therefore buy less risky assets that are more certain of bringing a return, even if it is relatively modest.
Typically, during periods of “risk-on”, stock markets will rise, most commodities – except Gold – will also gain in value, since they benefit from a positive growth outlook. The currencies of nations that are heavy commodity exporters strengthen because of increased demand, and Cryptocurrencies rise. In a “risk-off” market, Bonds go up – especially major government Bonds – Gold shines, and safe-haven currencies such as the Japanese Yen, Swiss Franc and US Dollar all benefit.
The Australian Dollar (AUD), the Canadian Dollar (CAD), the New Zealand Dollar (NZD) and minor FX like the Ruble (RUB) and the South African Rand (ZAR), all tend to rise in markets that are “risk-on”. This is because the economies of these currencies are heavily reliant on commodity exports for growth, and commodities tend to rise in price during risk-on periods. This is because investors foresee greater demand for raw materials in the future due to heightened economic activity.
The major currencies that tend to rise during periods of “risk-off” are the US Dollar (USD), the Japanese Yen (JPY) and the Swiss Franc (CHF). The US Dollar, because it is the world’s reserve currency, and because in times of crisis investors buy US government debt, which is seen as safe because the largest economy in the world is unlikely to default. The Yen, from increased demand for Japanese government bonds, because a high proportion are held by domestic investors who are unlikely to dump them – even in a crisis. The Swiss Franc, because strict Swiss banking laws offer investors enhanced capital protection.
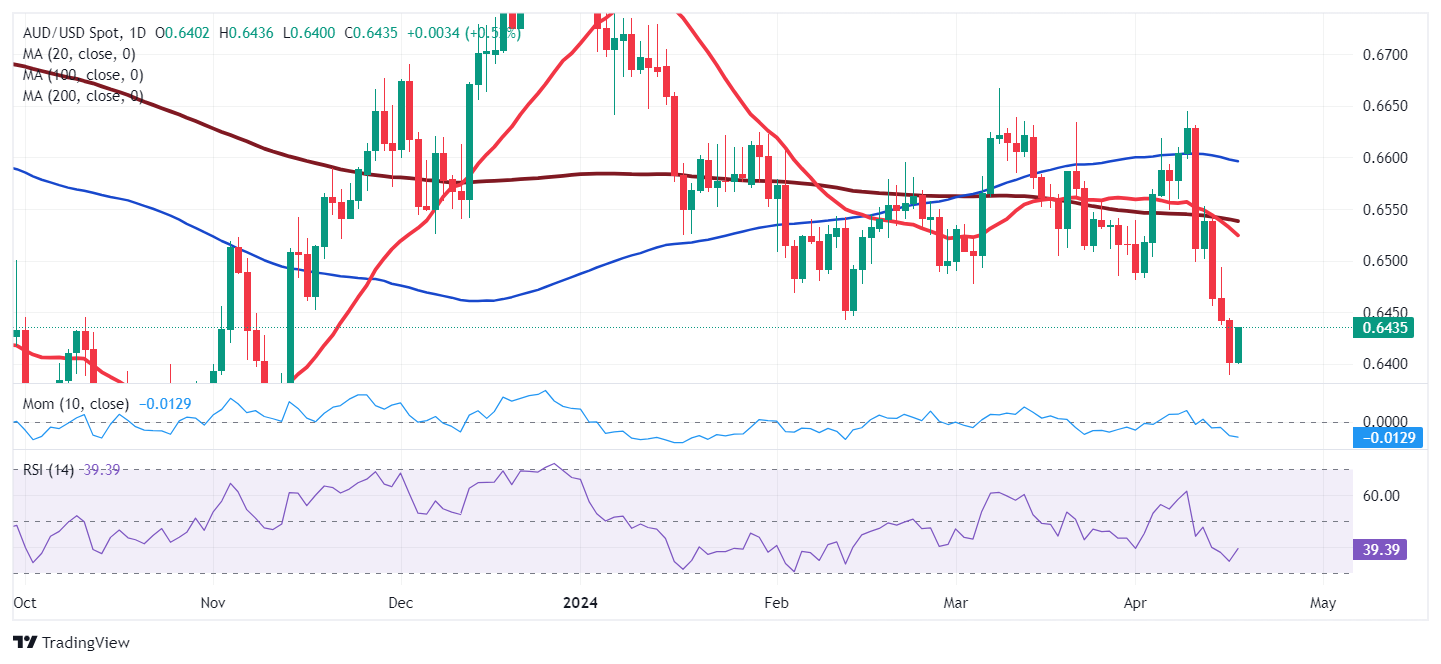
- AUD/USD is buoyed by an improved risk sentiment and a sluggish US economic calendar.
- Wall Street opens higher, influencing currencies despite a slight increase in the US Dollar Index.
- Upcoming Australian employment data could impact AUD strength, with forecasts suggesting modest job growth.
The Australian Dollar makes a U-turn and rises against the US Dollar in early trading during the North American session, gaining 0.33% amid an improvement in risk appetite. A scarce economic calendar in the United States (US) and hawkish comments from Federal Reserve Chair Jerome Powell failed to boost the Greenback. The AUD/USD trades at 0.6423.
AUD/USD gains despite hawkish Fed comments; focus on Australian jobs data
Wall Street is setting the tone, opening with gains. US Treasury yields tumble but do not undermine the buck, which stays firm, as depicted by the US Dollar Index (DXY). The DXY is up 0.11%, at 106.24.
US data revealed during the week showed that American consumers remain resilient while Industrial Production stands tall. On the negative front, US Building Permits and Housing Starts plunged due to higher mortgage rates. The Mortgage Bankers Association (MBA) revealed that rates for 30-year mortgages edged up from 7.01% to 7.13%.
In addition to the data, Fed Chair Jerome Powell said that the lack of progress on inflation would likely require keeping rates steady for “as long as needed.” The markets perceived Powell as hawkish, though Wednesday’s price action suggests the opposite.
In December 2023, the Fed revealed in its projections that most officials expected to cut rates three times due to the evolution of the disinflation process. Nevertheless, three months of higher inflation than expected via the Consumer Price Index (CPI) sparked Powell’s tilt and a repricing of fewer rate cuts than foreseen.
On the Australian front, it would feature the release of jobs data. The Employment Change is expected to add 7.2K jobs to the workforce, well below the 116.5K created in February, while the Unemployment Rate is foreseen to edge close to 4%. If the data comes weak, that would warrant a more accommodative policy by the Reserve Bank of Australia. Hence, AUD/USD traders could push the pair lower.
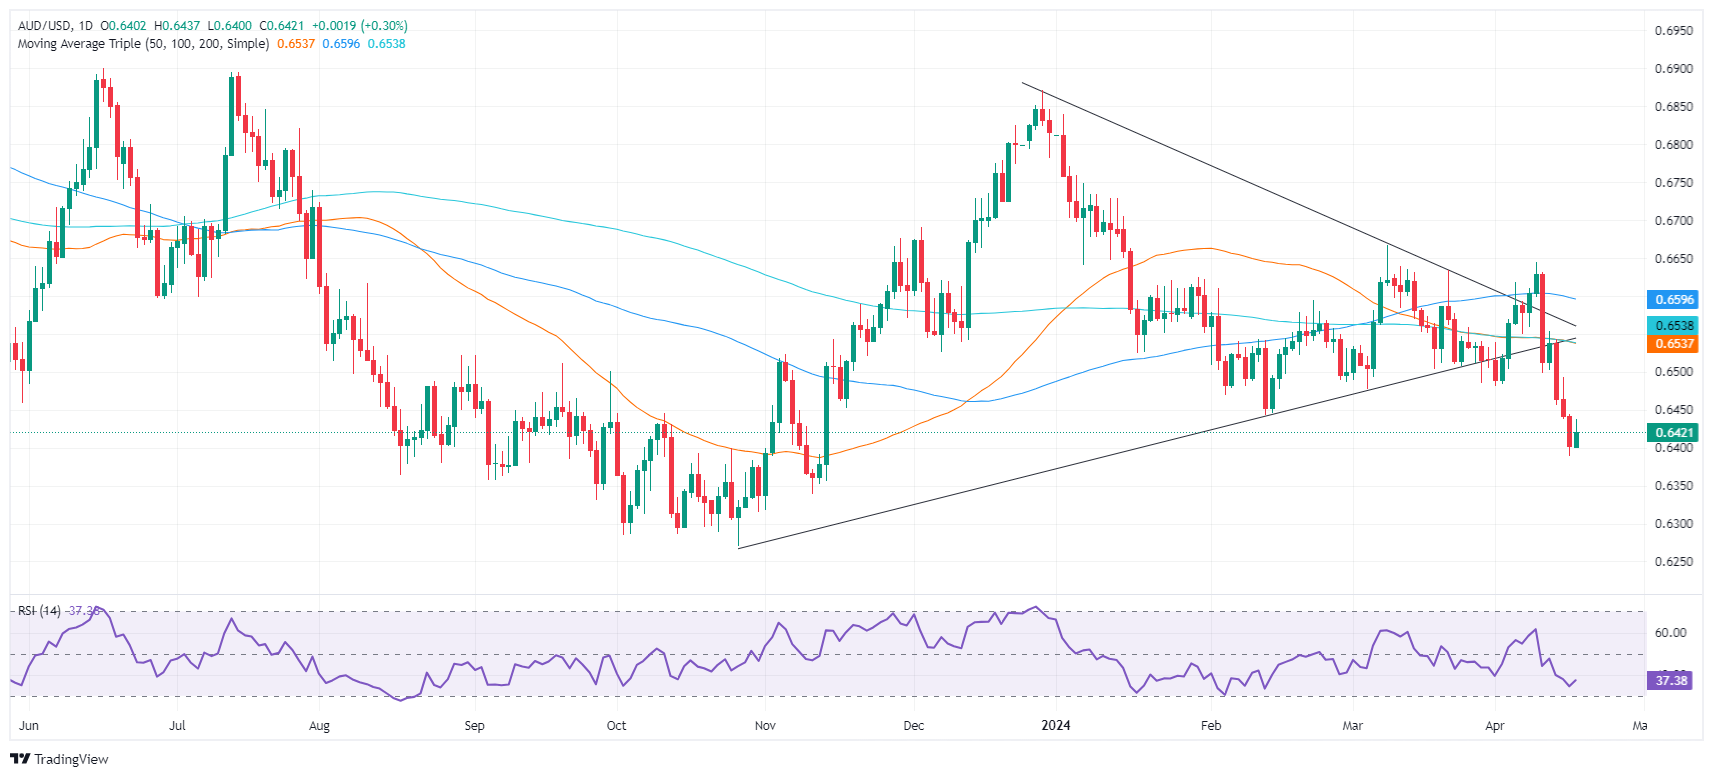
AUD/USD Price Analysis: Technical outlook
Despite recovering, the AUD/USD is bearishly biased, and it would require buyers to achieve a daily close above the February 13 low of 0.6442. Otherwise, the pair's first support would be the 0.6400 mark, followed by the April 16 daily low of 0.6389. The next support would be 0.6350, followed by the 0.6300 mark.
In an interview with WiWo on Wednesday, European Central Bank (ECB) policymaker and Bundesbank Chief Joachim Nagel said that price pressures in the Eurozone could continue for some time, per Reuters.
"It's not completely clear if the inflation rate will reach 2% target next year and stay at this level," Nagel added and noted that he expects a "slight growth" in German economy in 2024.
Market reaction
These comments don't seem to be impacting the Euro's valuation in a noticeable way. At the time of press, EUR/USD was up 0.15% on the day at 1.0635.
- Silver price jumps higher to $28.60, driven by worsening geopolitical tensions.
- Israel’s response to Iran’s attack will escalate fears of Middle East tensions spreading beyond Gaza.
- US bond yields edge down despite Fed lean towards higher interest rates for a longer period.
Silver price (XAG/USD) advances to $28.60 in Wednesday’s early New York session. The white metal witnesses significant buying interest as deepening Middle East tensions keep safe-haven bid firm. Investors are worried that tensions in the Middle East region could spread beyond Gaza as Israel said it will respond to Iran’s attack on their territory.
The Iranian military launched hundreds of missiles and drones on Saturday in retaliation to Israel’s attack on the Iranian embassy near Damascus in Syria in which two high-rank generals were killed. After Iran’s attack on Israel Tehran said, “the matter deemed to be closed.” However, should the Israeli regime make another mistake, Iran’s response will be considerably more severe, Wall Street Journal reported. The appeal for bullions strengthens when investors see geopolitical tensions escalating further.
Meanwhile, 10-year US Treasury yields fall to 4.63% despite Federal Reserve (Fed) sees interest rates remaining higher for a longer period. A decline in yields on interest-bearing assets eases the opportunity cost of holding an investment in non-yielding assets, such as Silver.
The US Dollar Index (DXY) exhibits strength near 106.20 as robust US Retail Sales data for March has improved the economic outlook. Higher spendings by households are done when labor market conditions remain tight, suggest strong economic outlook.
Silver technical analysis
Silver price faces selling pressure while attempting to break above horizontal resistance plotted from 3 August 2020 high at $29.86. The long-term outlook of the white metal is bullish as the 20-week Exponential Moving Average (EMA) at $24.85 is sloping higher.
The 14-period Relative Strength Index (RSI) shifts into the bullish range of 60.00-80.00, suggesting a strong upside momentum.
Silver weekly chart
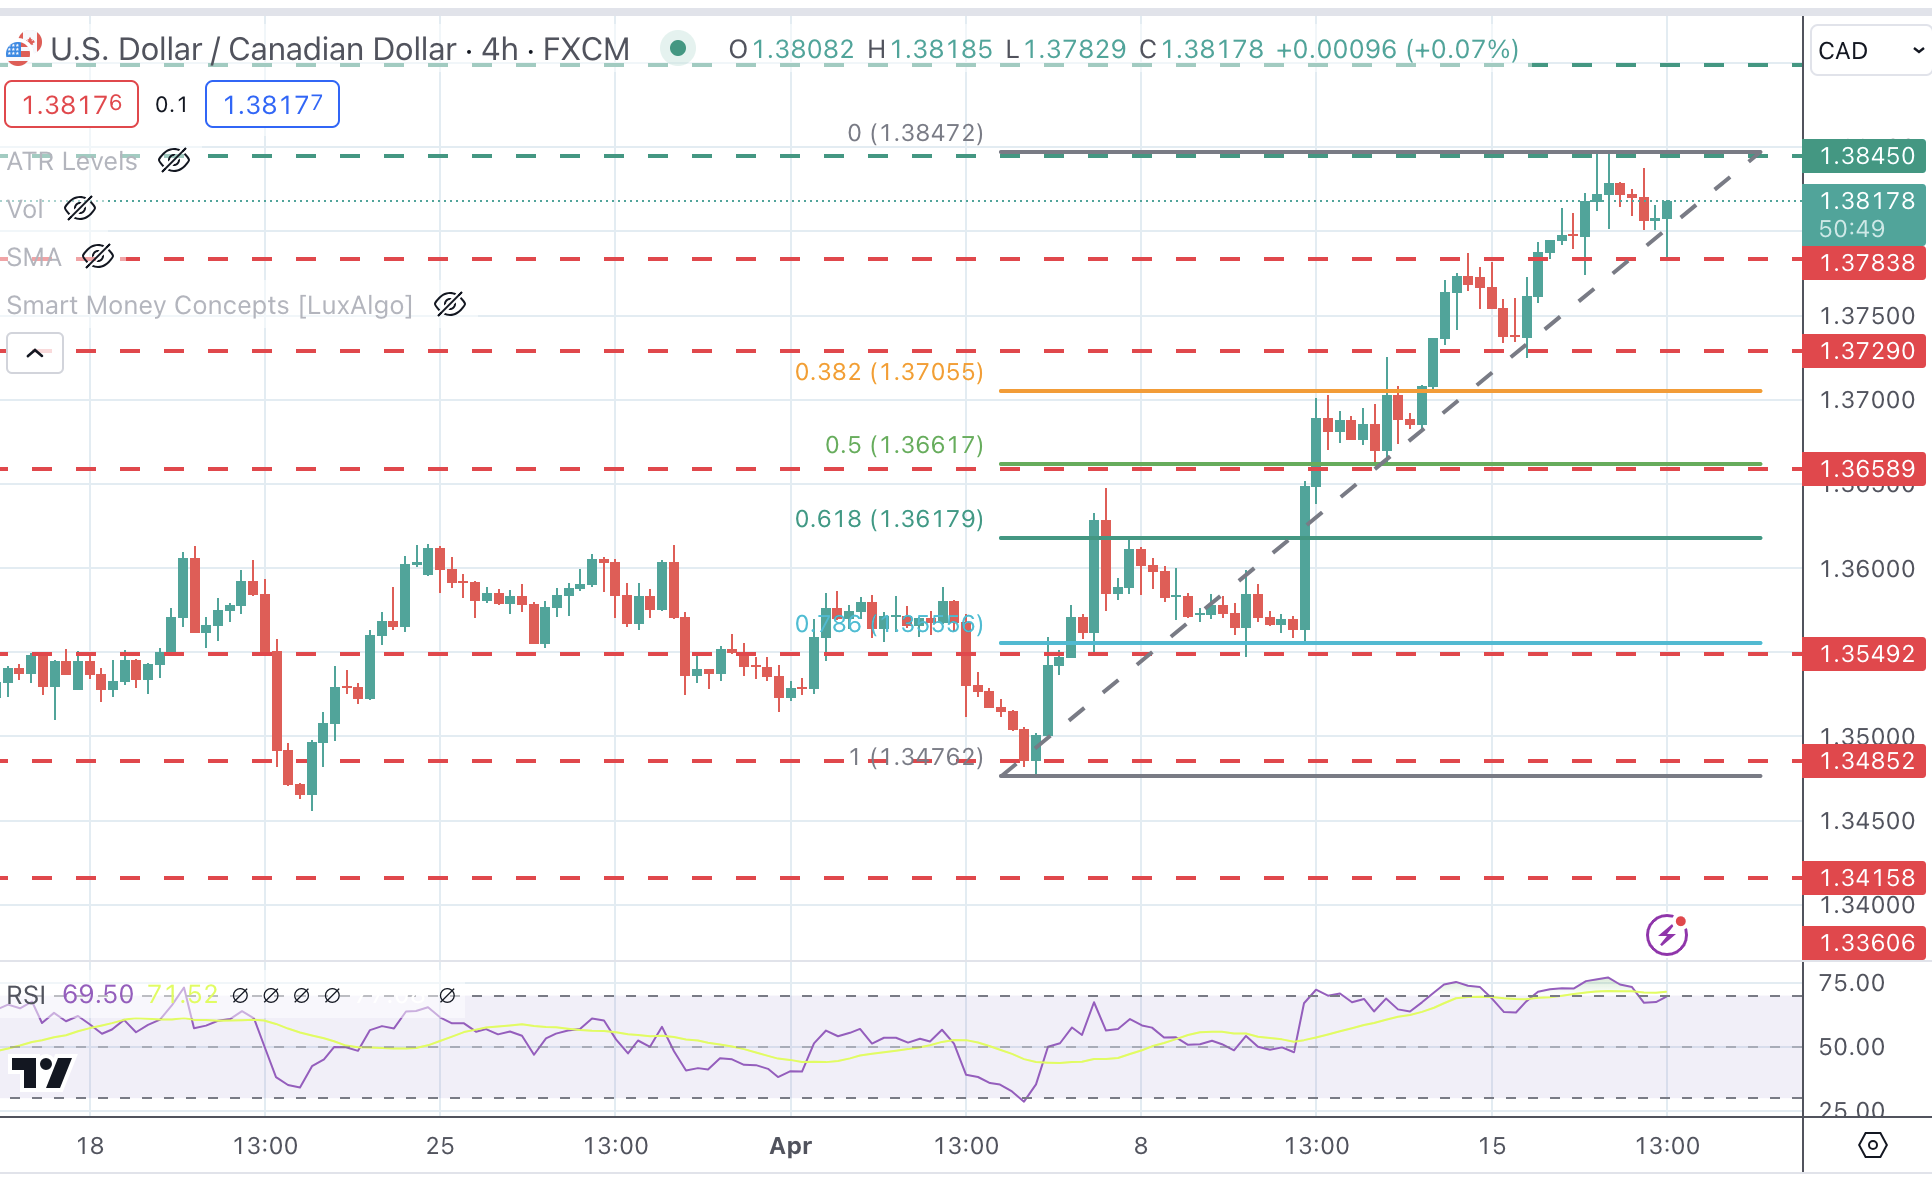
- USD/CAD slumps to 1.3800 even though the US Dollar exhibits strength.
- Investors see the BoC choosing the June meeting as their earliest point for pivoting to rate cuts.
- Oil prices weaken as Fed Powell’s hawkish guidance raises doubts over global economic outlook.
The USD/CAD pair dipped to round-level support of 1.3800 in Wednesday’s early American session. The Loonie asset faces pressure despite multiple tailwinds, such as higher Bank of Canada (BoC) rate cut hopes, a sharp decline in the Oil price, and hawkish guidance from Federal Reserve (Fed) Chair Jerome Powell.
The S&P 500 opens on a positive note, suggesting an improvement in the risk appetite of the market participants. 10-year US Treasury yields edge down to 4.64% but are still close to a five-month high as Fed Powell supported the argument of keeping interest rates higher for a longer period.
Meanwhile, the US Dollar Index (DXY), which tracks the Greenback’s value against six major currencies, turns sideways above 106.00.
Traders are pricing in a rate cut by the BoC in the June meeting as inflation remains on course towards the required rate of 2%. The BoC’s preferred inflation measure, the Core Consumer Price Index (CPI), which excludes eight volatile items, softened to 2.0% from the prior reading of 2.1%.
Last week, BoC Governor Tiff Macklem acknowledged that a rate cut in June is possible if inflation continues to decelerate sustainably after keeping interest rates unchanged at 5%.
Meanwhile, West Texas Intermediate (WTI), futures on NYMEX, have dropped to $84.00 as the dismal global economic outlook outweighs tight supply fears. Higher prospects for the Fed maintaining the monetary policy framework for a longer period weigh on the Oil price. Investors fear the global oil supply remaining tight amid deepening Middle East tensions.
- USD/JPY extends its uptrend into the 154.00s.
- It may be forming a Measured Move pattern with an end target of 156.11.
- RSI is overbought, however, warning a correction may be on the horizon.
USD/JPY is trading in the upper 154.00s. It has formed what looks like a Measured Move price pattern composed of three waves, commonly labeled A, B and C.
In the case of Measured Moves, the end of wave C can be reliably predicted because it is often at the point where wave C is equal in length to wave A, or a Fibonacci ratio of wave A. At the very least wave C normally extends to a 0.618 ratio of A.
USD/JPY Daily Chart
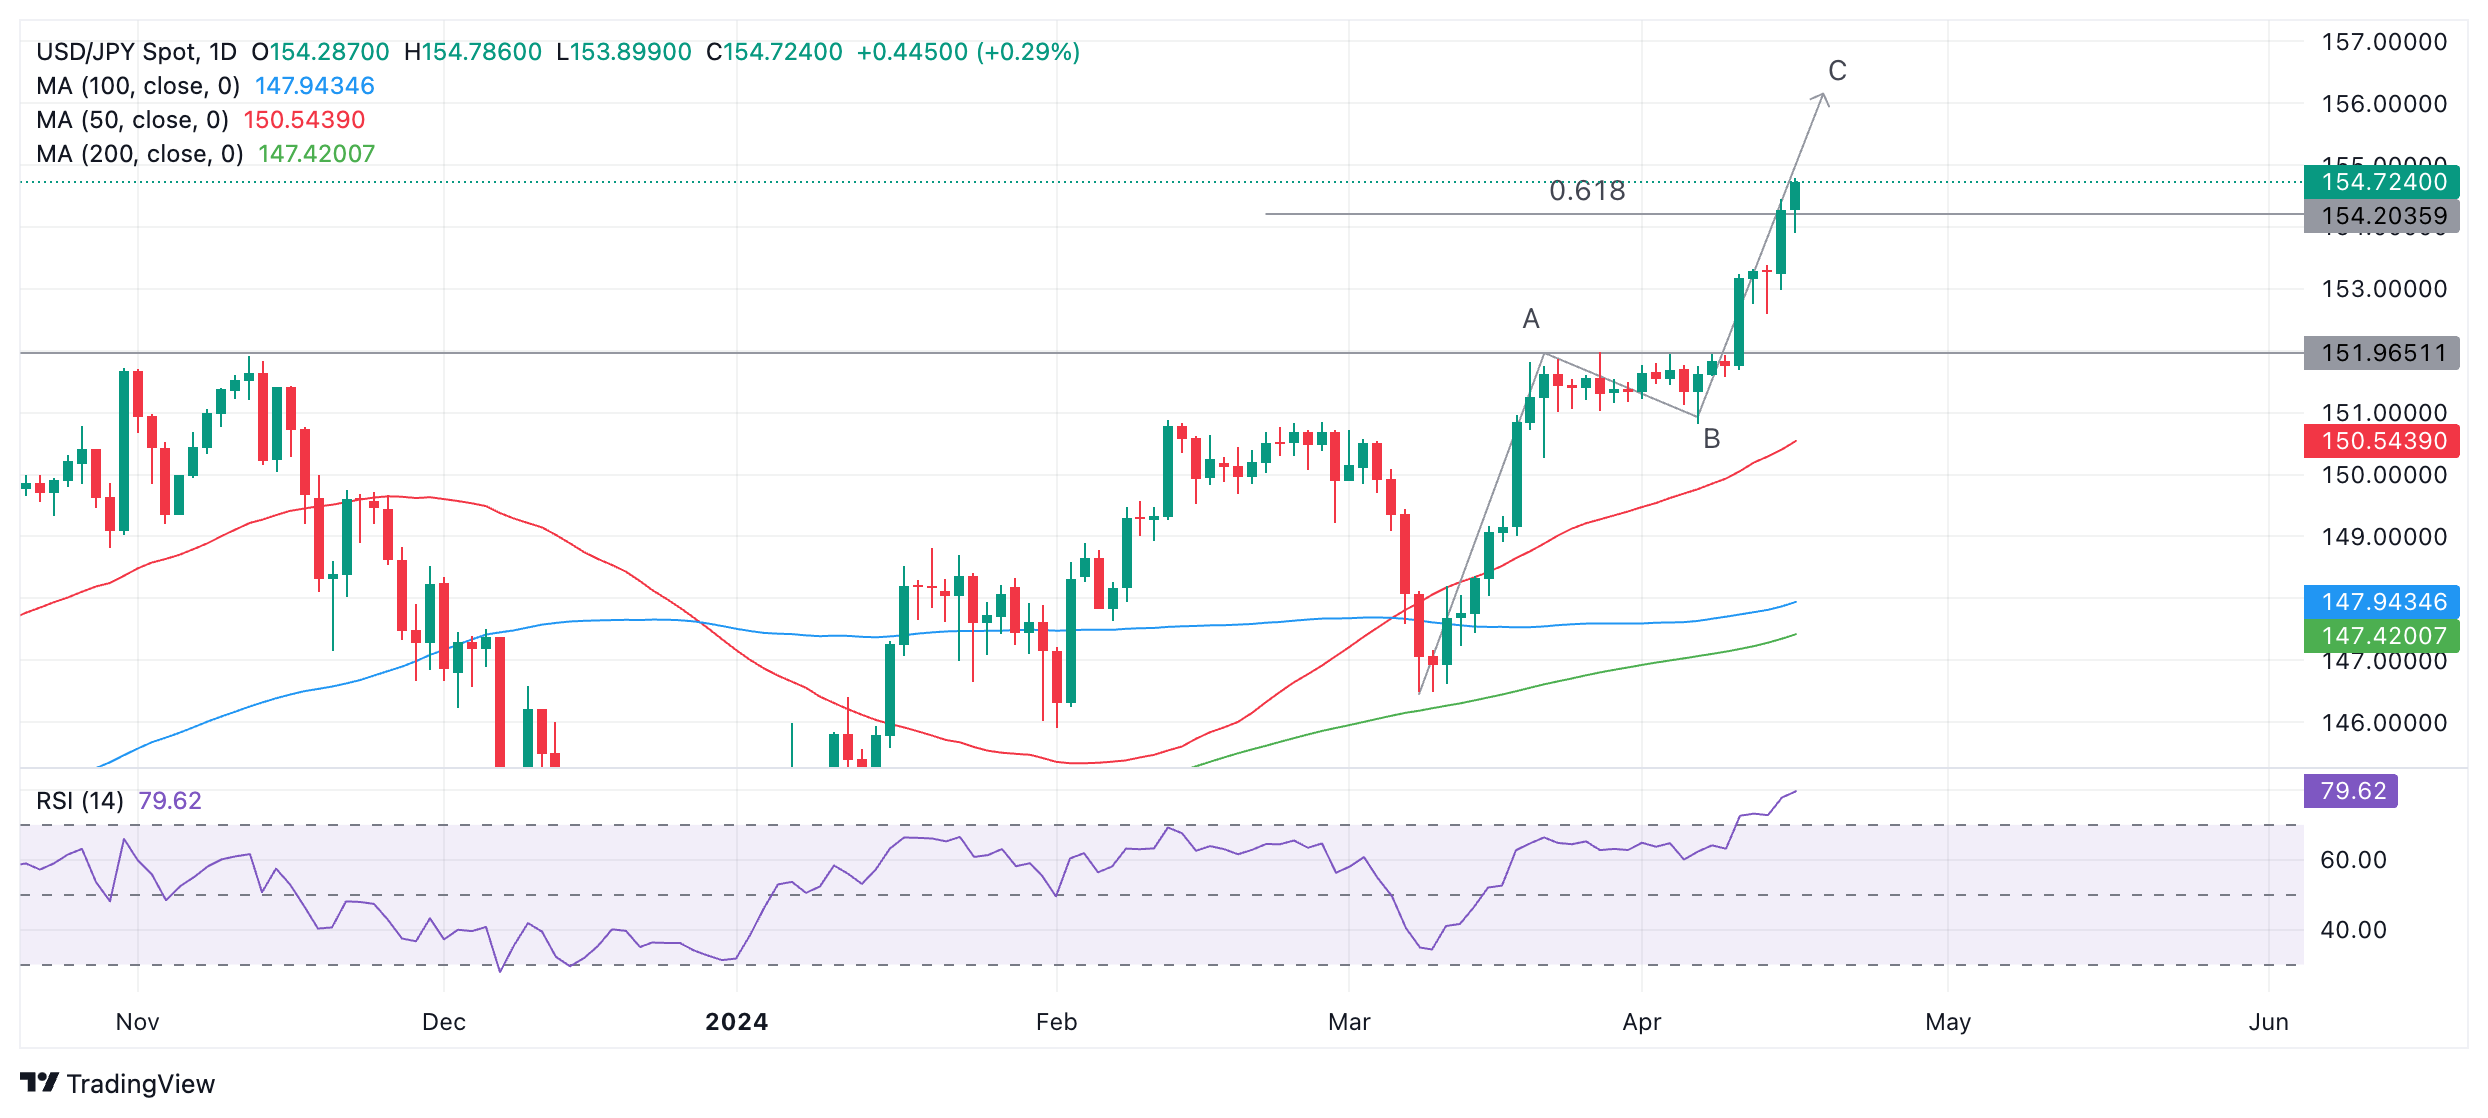
The end of C if it ends equal to A it will reach roughly 156.11 and there is a chance the rally could extend that high.
However, it is also the case that price has already reached the conservative target for the end of wave C at the Fib. 0.618 extension of A, at 154.20, which means there is a possibility it may have unfolded to its limit.
In addition, the Relative Strength Index (RSI) is well into overbought territory, recommending bullish traders with a medium-term outlook should not increase their long bets. If RSI exits overbought it may be a sign USD/JPY is pulling back.
For USD/JPY bulls the important thing is that price itself continues to rise and as long as it does the uptrend is likely to continue.
- AUD/USD recovers from 0.6400 amid improved market sentiment.
- The Aussie Employment data will guide market expectations for RBA rate cuts.
- It is forecasted that Australian employers hired mere 7.2K workers in March.
The AUD/USD pair finds a cushion near the round-level support of 0.6400 in Wednesday’s early American session. A three-day losing spell in the Aussie asset has concluded for now as investors expect that nations other than the United States are also facing stubborn inflation issues.
The Consumer Price Index (CPI) data for the United Kingdom and the New Zealand economies released in Wednesday’s session indicated that the last mile for inflation to return to the 2% target is bumpy. UK’s inflation softened slower than estimated in March while NZ inflation grew as expected in the first quarter of 2024.
This has forced traders to reprice their expectations for initial rate cuts. For the Bank of England (BoE) and the Reserve Bank of New Zealand (RBNZ), investors are now expecting that they will pivot to rate cuts from the November meeting instead of September.
Meanwhile, the market sentiment has improved. Considering bullish overnight futures, the S&P 500 is expected to open on a positive note. 10-year US Treasury yields fall slightly to 4.64% after refreshing a five-month high at 4.7%. The US Dollar Index (DXY) turns sideways after printing a fresh five-month high at 106.40. The US Dollar holds strength as Federal Reserve (Fed) Chair Jerome Powell leaned for keeping interest rates higher for a longer period as inflation data for March was not encouraging.
On the Australian Dollar front, investors await the Employment data for March, which will be published on Thursday. The Unemployment Rate is forecasted to have increased to 3.9% from 3.7% in February. In the same period, Australian employers are estimated to have hired 7.2K workers, significantly lower from 116.5K. Weak employment numbers would lift expectations for rate cuts by the Reserve Bank of Australia (RBA).
European Central Bank (ECB) Executive Board member Piero Cipollone said on Wednesday that they are seeing some signs of economic recovery in the Euro area, citing the latest PMI data.
Cipollone said that they expect inflation to resume on its path toward 2% next year and reach the target in 2025.
"If the incoming data in June and July confirm that confidence about the target improves, it will be appropriate to remove some restrictive measures imposed in 2023," he added, per Reuters, but noted that the impact of the Middle East conflict on energy costs is a major risk.
Market reaction
These comments don't seem to be having a significant impact on the Euro's performance against its rivals. At the time of press, EUR/USD was up 0.22% on the day at 1.0640.
- USD/CHF is trending higher within a rising channel.
- The trend is expected to continue to the next set of targets.
- A break below the lower channel line would be required to signal a reversal.
USD/CHF is rallying in an ascending channel on the daily chart. It is in a short and medium-term uptrend which is expected to continue higher given the old adage that the “trend is your friend.”
USD/CHF Daily Chart
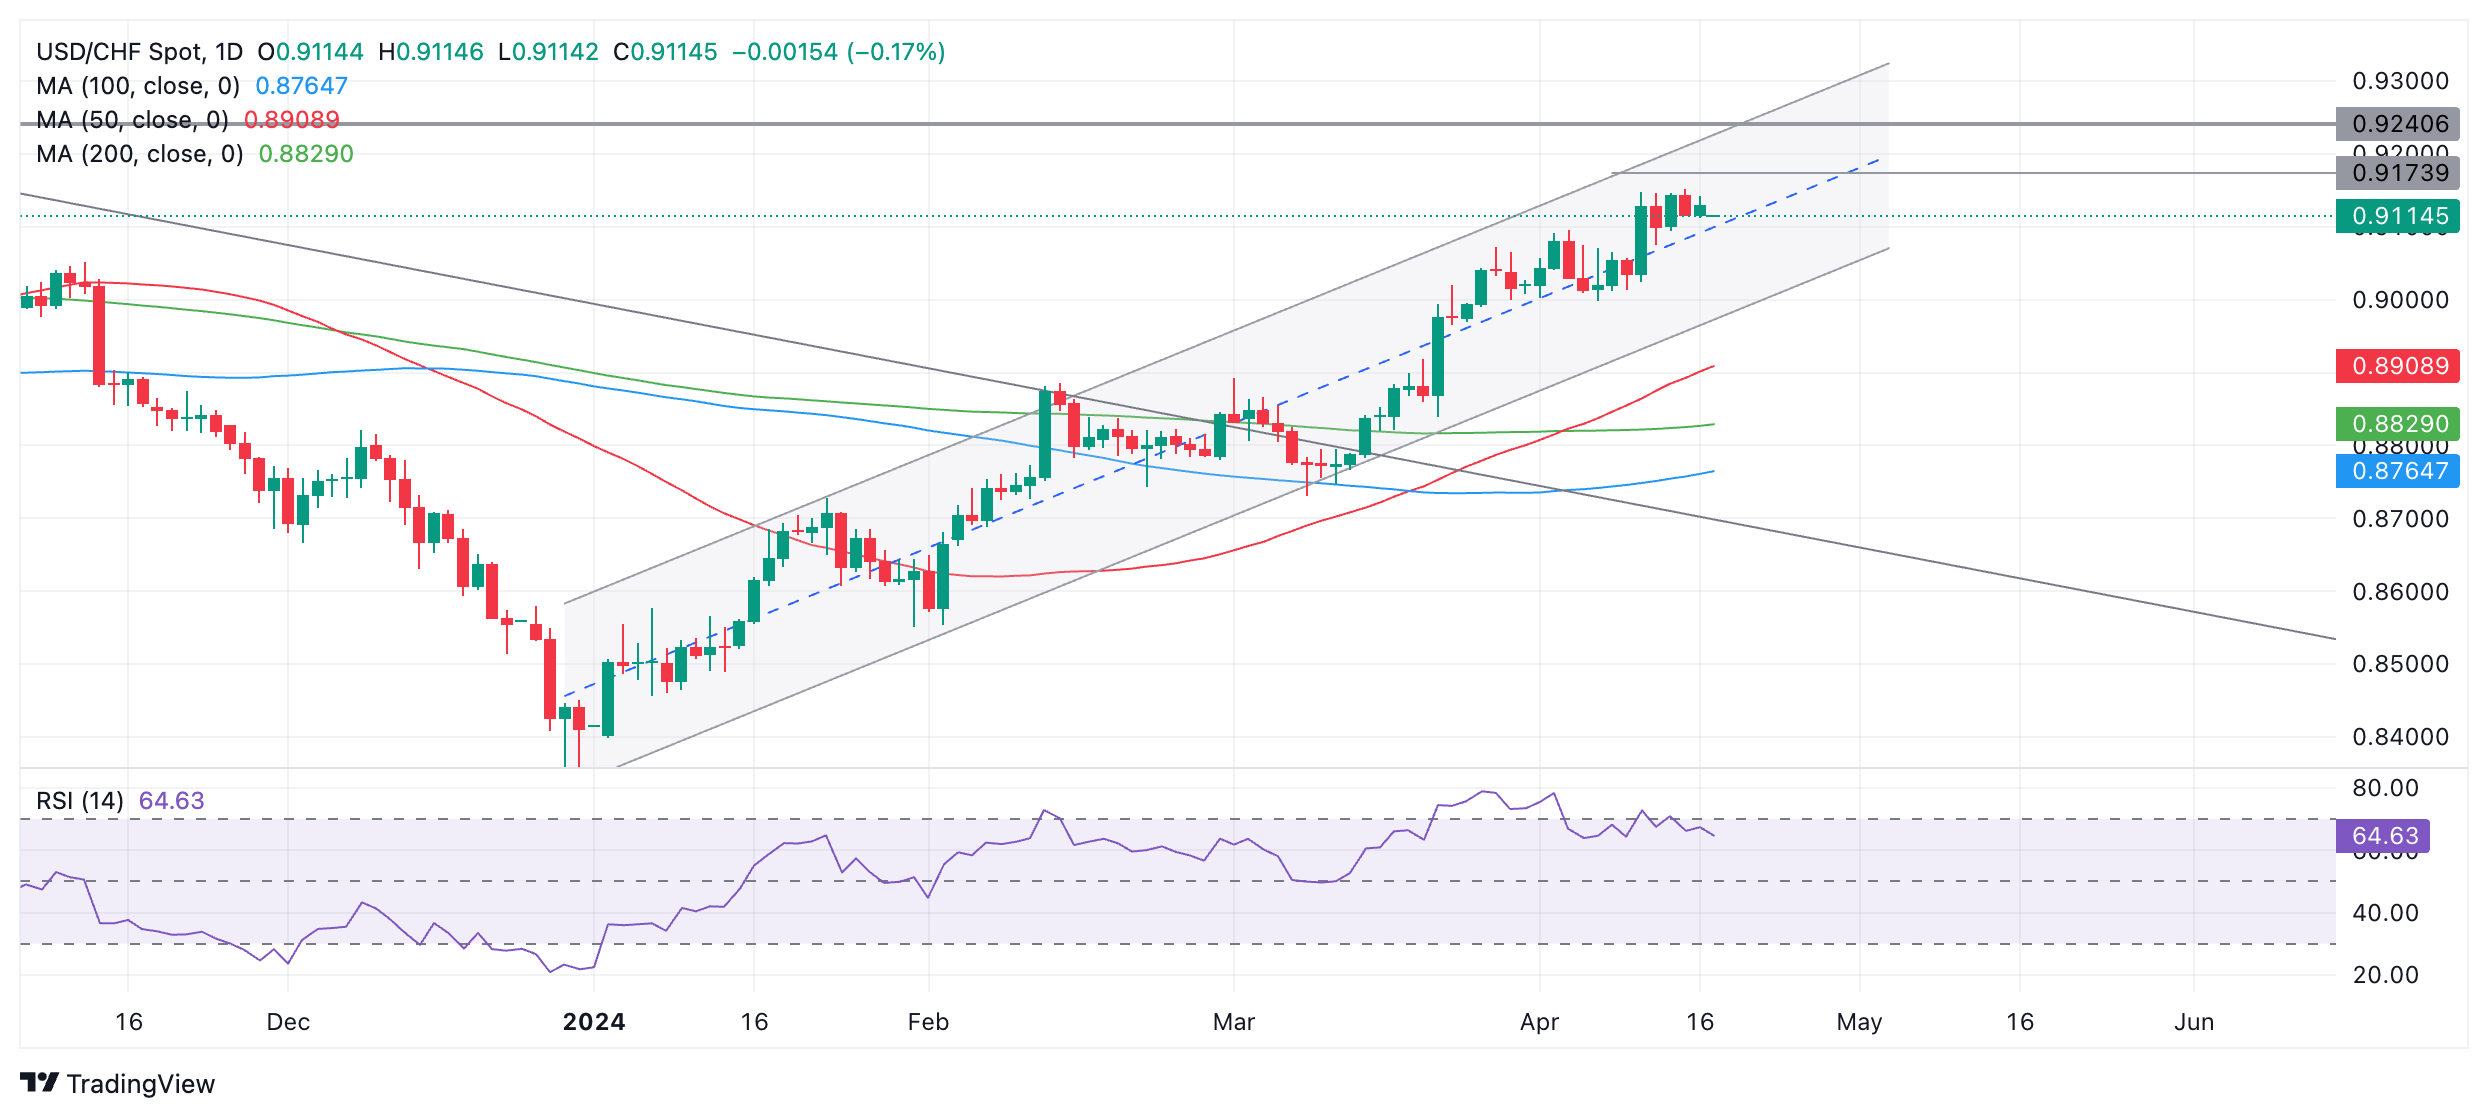
USD/CHF has been consolidating over the past few days in the lower 0.9100s but it will probably eventually break higher in accordance with the dominant uptrend. A break above the 0.9152 April highs would confirm more upside.
The next target to the upside comes in at around 0.9173 where some major moving averages converge on higher time-frame charts.
Following that, the next upside target would be located at 0.9240 the level of previous major swing highs made in October 2023.
The Relative Strength Index (RSI) is not overbought any longer, suggesting scope for further upside.
A decisive break below the lower boundary of the channel, currently at roughly 0.9020, would reverse the outlook and bring into question the direction of the intermediate trend.
A decisive break would be one characterized by a breach with a longer-than-average red candlestick or three consecutive red candlesticks.
"Achieving inflation target has been a bumpy ride, it was always going to be and that last mile is the hardest work,"Bank of England (BoE) Monetary Policy Committee (MPC) member Megan Greene said on Wednesday.
"We're closer to target than we were just a few months ago, so the news has been encouraging," Greene added and noted that she is worried about what an energy price shock and other supply side shocks might do to inflation expectations.
Market reaction
GBP/USD showed no reaction to these comments and the pair was last seen rising 0.25% on the day at 1.2457.
- EUR/GBP declines after the release of higher-than-expected UK inflation data suggests UK interest rates could stay high.
- “This is not what the BoE wants to see,” says TD Securities analyst.
- Eurozone inflation data comes out in line with expectations, lifting the Euro amid dovish market expectations.
The EUR/GBP edges lower a fraction on Wednesday to trade at about the 0.8540 level, after the release of macroeconomic data from both the UK and Eurozone.
In the UK, inflation rose slightly higher than expected in March, according to data from the Office of National Statistics (ONS), on Wednesday. The Consumer Price Index (CPI) in March rose 3.2% year-on-year when a 3.1% rise had been expected. That said it was below the 3.6% of the previous month.
Core CPI rose 4.2% versus the 4.1% expected reading but was also lower than the previous month. The same was true of the Retail Price Index (RPI) whilst the Producer Price Index showed results either inline with expectations or slightly below them.
The data gave a lift to the Pound Sterling, perhaps because it reduces the probabilities that the Bank of England (BoE) will be able to start reducing interest rates.
“Overall, this is not what the BoE wants to see, in particular after the stronger than expected wage numbers out yesterday," said analysts at TD Securities, responding to the data.
It means the BoE may need to keep interest rates higher for longer in order to combat stickier-than-expected inflation. Higher interest rates tend to appreciate a currency as they lead to higher foreign capital inflows.
EUR/GBP recovered some lost ground following the release of the final estimate for the March Eurozone Harmonized Index of Consumer Prices (HICP), on Wednesday.
The data showed no change from the flash reading, which showed a 2.4% YoY rise in HICP and 2.9% in core HICP. Both readings were still below the 2.6% and 3.1% readings respectively for February.
The Euro (EUR) may have been lifted because market expectations had overall declined in relation to Eurozone inflation. Recent dovish comments from European Central Bank (ECB) officials, have suggested an increasing willingness to cut interest rates because of falling inflation and stuttering growth, and this could have been responsible for the lower outlook.
ECB President Christine Lagarde, for example, said on Tuesday that the ECB will cut rates soon, bar a surprise, and that the ECB was keeping a close eye on Oil prices due to Middle East tensions.
Analysts at TD Securities think that the Bank of Canada (BoC) remains on track to start lowering the policy rate before the Federal Reserve (Fed) following the latest inflation data.
Third consecutive miss for headline CPI weighed on CAD
"Headline CPI edged higher to 2.9% y/y in March, in line with the market consensus, but details were considerably softer with further progress across the Bank of Canada's preferred measures of core inflation and inflation breadth. CPI-trim/median edged lower to 2.95% y/y on average, as another 0.1% m/m increase saw 3m core inflation rates fall to just 1.3%."
"Today's report provides the Bank of Canada with some additional evidence that recent inflation progress was sustained through March, but we would note the ex. food/energy aggregate saw a much stronger performance, and there is still the risk that recent progress is unwound in April. We do not think today's report is enough to lock in a June cut and still think July is the more likely start to the BoC's easing cycle, but today's report will add to the risk of an earlier move."
"The third consecutive miss for headline CPI weighed on CAD and leaves the Bank of Canada on track to start cutting comfortably before the Fed."
Analysts at BBH share their near-term outlook for the US Dollar Index (DXY).
Chair Powell and other Fed officials have taken a more hawkish turn
"The dollar rally is taking a breather. DXY is trading lower for the first time since last Monday near 106.165 after making a new cycle yesterday near 106.517. It remains on track to test the November 1 high near 107.113."
"The euro is trading higher near $1.0645 but the clean break below $1.0755 sets up a test of the November 1 low near $1.0515. Elsewhere, sterling is trading higher near $1.2465 after higher-than-expected CPI data. USD/JPY is trading lower near 154.60 after making a new cycle high near 154.80 yesterday."
"The dollar rally should continue as recent data confirm persistent inflation and robust growth in the U.S. In turn, Chair Powell and other Fed officials have taken a more hawkish turn. This should keep upward pressure on U.S. yields, and this is what the Fed wants in lieu of another hike. We believe that while market easing expectations have adjusted violently after CPI and now Powell, there is still room to go. When the market finally capitulates on the Fed, the dollar should gain further."
- The US Dollar consolidates ahead of a very light day in the economic calendar.
- Markets digest Fed Chairman Powell hawkish remarks.
- The US Dollar Index trades deep into the 106.00 area though, although a small pullback could be at hand.
The US Dollar Index (DXY) eases slightly on Wednesday as it becomes increasingly clear that markets won the arm wrestling match with the US Federal Reserve (Fed). The recent upward moves in both US bond yields and the US Dollar were enough to twist the arm of US Fed Chairman Jerome Powell. Powell said on Tuesday that recent data shows a lack of further progress in taming inflation, and that it will take longer before having enough confidence that price growth is coming down to target before considering the first rate cut.
On the economic data front, no market-moving data is expected besides some second-tier numbers. More importantly, Fed speakers will take the stage right at the end of the US session, with Federal Reserve Bank of Cleveland President Loretta Mester and Federal Reserve Governor Michelle Bowman to speak.
Daily digest market movers: Powell upheaval
- The weekly Mortgage Bankers Applications have be released for the week of April 12. Last week the index printed 0.1% with this week at 3.3% despite elevated rate levels.
- The US Treasury is holding a longer-term bond auction at 17:00 GMT for a 20-year bond.
- The Fed’s Beige Book will be released at 18:00 GMT.
- At 20:00 GMT, the Treasury International Capital (TIC) Flows will be released for February:
- Net Long-Term TIC Flows expected to head from $36.1 billion to $40.2 billion.
- Total Net TIC Flows were in January at $-8.8 billion with no forecast available for February.
- Two scheduled Fed speakers are scheduled for Wednesday:
- Federal Reserve Bank of Cleveland President Loretta Mester, around 21:30 GMT, participating in the South Franklin Circle Dialogues.
- Federal Reserve Governor Michelle Bowman is due to speak around 23:15 GMT at the Institute for International Finance in Washington D.C.
- Equities are in the red again, though the losses are starting to get smaller. US equity futures might even flip into the green later into this session.
- According to the CME Group’s FedWatch Tool, expectations for a Fed pause in the May meeting are at 94.6%, while chances of a rate cut stand at 5.4%. It looks like markets are easing off their most hawkish outlook.
- The benchmark 10-year US Treasury Note trades around 4.65%. The benchmark is retreating from the highs at 4.69% seen on Tuesday.
US Dollar Index Technical Analysis: Small retreat, broader picture still bullish
The US Dollar Index (DXY) eases a touch on Wednesday. With Fed Chairman Powell confirming that it will take longer than expected to start lowering interest rates, some unwinding of the rally that took place in the DXY since last week’s Consumer Price Index numbers is likely. Expect a bit of a pullback, although the substantial wider rate differential between higher US rates and the rest of the world should keep the DXY at higher levels above 104.00.
On the upside, the fresh high of Tuesday at 106.52 is the level to beat first. Further up and above the 107.00 round level, the DXY Index could meet resistance at 107.35, the October 3 high.
On the downside, the first important level is 105.88, a pivotal level since March 2023, which proved its importance on Monday by holding as a support. Further down, 105.12 and 104.60 should also act as a support ahead of the region with both the 55-day and the 200-day Simple Moving Averages (SMAs) at 104.17 and 103.91, respectively.
US Dollar FAQs
The US Dollar (USD) is the official currency of the United States of America, and the ‘de facto’ currency of a significant number of other countries where it is found in circulation alongside local notes. It is the most heavily traded currency in the world, accounting for over 88% of all global foreign exchange turnover, or an average of $6.6 trillion in transactions per day, according to data from 2022. Following the second world war, the USD took over from the British Pound as the world’s reserve currency. For most of its history, the US Dollar was backed by Gold, until the Bretton Woods Agreement in 1971 when the Gold Standard went away.
The most important single factor impacting on the value of the US Dollar is monetary policy, which is shaped by the Federal Reserve (Fed). The Fed has two mandates: to achieve price stability (control inflation) and foster full employment. Its primary tool to achieve these two goals is by adjusting interest rates. When prices are rising too quickly and inflation is above the Fed’s 2% target, the Fed will raise rates, which helps the USD value. When inflation falls below 2% or the Unemployment Rate is too high, the Fed may lower interest rates, which weighs on the Greenback.
In extreme situations, the Federal Reserve can also print more Dollars and enact quantitative easing (QE). QE is the process by which the Fed substantially increases the flow of credit in a stuck financial system. It is a non-standard policy measure used when credit has dried up because banks will not lend to each other (out of the fear of counterparty default). It is a last resort when simply lowering interest rates is unlikely to achieve the necessary result. It was the Fed’s weapon of choice to combat the credit crunch that occurred during the Great Financial Crisis in 2008. It involves the Fed printing more Dollars and using them to buy US government bonds predominantly from financial institutions. QE usually leads to a weaker US Dollar.
Quantitative tightening (QT) is the reverse process whereby the Federal Reserve stops buying bonds from financial institutions and does not reinvest the principal from the bonds it holds maturing in new purchases. It is usually positive for the US Dollar.
- EUR/JPY continues rising after the release of final Eurozone inflation data shows no change from estimates.
- Comments from the Japanese Cabinet Secretary suggest the authorities may be close to an FX market intervention.
- Further commentary from ECB speakers could cause fluctuations for EUR/JPY.
The EUR/JPY is trading in the mid 164.00s on Wednesday, up by over a tenth of a percent. The pair’s fluctuations seem to have been mainly driven by a combination of Eurozone inflation data and comments from a Japanese government official designed to support the Japanese Yen (JPY).
EUR/JPY rose following the release of the final figure for March Eurozone Harmonized Index of Consumer Prices (HICP) by Eurostat. The final estimate showed no change from the initial release, which showed a 2.4% YoY rise in HICP and 2.9% in core HICP. This also meant both readings were still below the 2.6% and 3.1% readings respectively of the previous month.
Whilst the data showed no change, the Euro (EUR) rose in most pairs following the release, perhaps because market expectations had fallen. Recent dovish comments from European Central Bank (ECB) officials, have suggested an increasing willingness to cut interest rates because of falling inflation and stuttering growth, and this could have been responsible for the lower outlook.
On Tuesday, for example, ECB President Christine Lagarde said that the ECB will cut rates soon, bar a surprise, and that the ECB was keeping a close eye on Oil prices due to tensions in the Middle East.
EUR/JPY upside has likely been tempered by comments from Japan’s Chief Cabinet Secretary Yishimasa Hayashi, who issued a verbal intervention on Wednesday to prop up the Yen. Hayashi said that “we are closely watching FX moves” and are “prepared for full measures.”
This may indicate the Japanese authorities are seriously considering a direct intervention in FX markets in which they would sell their FX reserves to buy JPY in the hope of strengthening it. The knock-on effect of such an intervention, though felt most keenly in USD/JPY, would probably result in a weakening in the EUR/JPY pair.
His intervention may have come on the back of recent comments from Federal Reserve Chairman Jerome Powell, in which he said “Recent data shows a lack of further progress on inflation this year,” adding, “If higher inflation persists the Fed can maintain current rate as long as needed.”
His comments led to an appreciation of the US Dollar because the maintenance of higher interest rates tends to be positive for a currency. This is due to the fact that it increases foreign capital inflows. Powell’s remarks resulted in USD/JPY rising to above 154.00. This is above the ideal 150.00 threshold beyond which the Japanese do not like to see their currency devalue.
A string of speeches by key ECB members during Wednesday, including ECB Executive Board Member Piero Cipollone, ECB Executive Board Member Isabel Schnabel and President Christine Lagarde herself could also impact the EUR/JPY’s volatility.
The release of Japanese trade data overnight had little effect on the exchange rate. The data showed only a slight moderation in Exports, which continued to grow by above 7.0% year-on-year in March, a fall in Imports by 4.9% (after a 0.5% rise in the preceding month), and a surplus trade balance of ¥366.5 billion from a ¥377.8 billion deficit in February.
- NZD/USD moves higher to 0.5900 as traders see the RBNZ reducing key interest rates from November.
- NZ Q1 inflation grew by 0.6% as expected.
- Fed Powell returns to the “higher for longer interest rates” argument.
The NZD/USD pair extends its recovery to the round-level resistance of 0.5900 in Wednesday’s European session. The Kiwi asset strengthens as traders repriced bets supporting rate cuts by the Reserve Bank of New Zealand (RBNZ).
Investors now see the RBNZ beginning to lower borrowing rates from the November meeting instead of the October meeting. Market expectations for the RBNZ starting to reduce its Official Cash Rate (OCR) have been significantly influenced by the expected rise in New Zealand’s Q1 Consumer Price Index (CPI) data released in Wednesday’s early Asian session.
Stats NZ showed that NZ inflation rose by 0.6% as expected, higher from 0.5% growth recorded in the last quarter of 2023. The annual inflation data decelerated to 4.0% against the prior reading of 4.7%. Currently, the RBNZ has been maintaining its Official Cash Rate (OCR) at 5.5%.
A sharp improvement in market sentiment has also boosted demand for the New Zealand Dollar. S&P 500 futures have posted significant gains in the European session. 10-year US Treasury yields have dropped slightly to 4.64%. The rally in the US Dollar Index (DXY) seems stalled near 106.40 as investors had priced in that the Federal Reserve (Fed) will lean towards keeping interest rates higher for a longer period.
On Tuesday, Fed Chair Jerome Powell said, “The recent data have clearly not given us greater confidence, and instead indicate that it’s likely to take longer than expected to achieve that confidence” reported Reuters. In this statement, the recent data is hot consumer price inflation data for March.
Currently, financial markets are anticipating that the Fed will start reducing interest rates from the September meeting.
- Natural Gas prices are steady on Wednesday but futures on European markets jump.
- Markets see tensions simmer amid uncertainty about Israel’s retaliation against Iran.
- The US Dollar Index consolidates after Fed Chairman Powell confirms delay in interest-rate cuts.
Natural Gas (XNG/USD) trades flat in a narrow range on Wednesday, digesting the overnight headlines that came out about lingering tensions in the Middle East. White House National Security Advisor Jake Sullivan said to Bloomberg that the outline of the sanctions against Iran will come in the following days and will specifically target the country’s drone plan. Meanwhile, in the Middle East, Saudi Arabia’s Crown Prince Mohammed Bin Salman and UAE President Mohammed Bin Zayed Al Nahyan issued a rare joint statement calling for self-restraint and pointed to the dangers of war.
Meanwhile, the US Dollar Index (DXY) is weakening after its staggering five-day winning streak. Some further easing is in the cards with a very light economic calendar ahead and markets no longer looking to force the US Federal Reserve to change its stance. US Federal Reserve Chairman Jerome Powell said on Tuesday that current inflation levels do not call for a rate cut, suggesting that interest rates will stay steady for longer until inflation comes down.
Natural Gas is trading at $1.90 per MMBtu at the time of writing.
Natural Gas news and market movers: A war that no one wants
- The Barrow North LNG terminal in the United kingdom is undergoing an unplanned maintenance call. Meanwhile, Gas flows from Norway to Europe are recovering after a series of unforeseen outages at some of its major fields.
- Local European Gas Futures have risen by 20% in just five days. Prices are likely to ease, though, as Norwegian flows pick up to normal volumes again.
- European Gas storages are filled up by 62% and are set to get refueled over the summer period.
- Headline risks are still in the balance on Wednesday as markets await details over Israel’s retaliatory measures against Iran.
Natural Gas Technical Analysis: A short breather, enjoy it while it lasts
Natural Gas prices are in a soft patch on Wednesday, for as long as no clear headlines out of Israel hit the wires on what the next steps will be on Iran. The breather should give prices some room for a small retrace, though nothing substantial. With headline risk at hand, expect the main support barriers to remain unchallenged.
On the upside, the red descending trend line at $1.99-$2.00 looks ready for another test. Should Gas prices snap above it, a quick rally to $2.11 could be seen. Not that far off, $2.15 in the form of the 100-day Simple Moving Average (SMA) becomes the main resistance level.
On the downside, the 55-day SMA around $1.88 should be a safety net. Next, the green ascending trend line near $1.83 should support the rally since mid-February. Should even that level break, a dive to $1.60 and $1.53 would not be impossible.
Natural Gas: Daily Chart
Natural Gas FAQs
Supply and demand dynamics are a key factor influencing Natural Gas prices, and are themselves influenced by global economic growth, industrial activity, population growth, production levels, and inventories. The weather impacts Natural Gas prices because more Gas is used during cold winters and hot summers for heating and cooling. Competition from other energy sources impacts prices as consumers may switch to cheaper sources. Geopolitical events are factors as exemplified by the war in Ukraine. Government policies relating to extraction, transportation, and environmental issues also impact prices.
The main economic release influencing Natural Gas prices is the weekly inventory bulletin from the Energy Information Administration (EIA), a US government agency that produces US gas market data. The EIA Gas bulletin usually comes out on Thursday at 14:30 GMT, a day after the EIA publishes its weekly Oil bulletin. Economic data from large consumers of Natural Gas can impact supply and demand, the largest of which include China, Germany and Japan. Natural Gas is primarily priced and traded in US Dollars, thus economic releases impacting the US Dollar are also factors.
The US Dollar is the world’s reserve currency and most commodities, including Natural Gas are priced and traded on international markets in US Dollars. As such, the value of the US Dollar is a factor in the price of Natural Gas, because if the Dollar strengthens it means less Dollars are required to buy the same volume of Gas (the price falls), and vice versa if USD strengthens.
- The Mexican Peso has reversed its entrenched uptrend in the short term.
- The move comes after the IMF revised down their economic growth forecasts for Mexico.
- USD/MXN is rising after comments from Fed Chair Jerome Powell suggest interest-rate cuts could be further delayed.
The Mexican Peso (MXN) is trending lower in the majority of its most heavily traded pairs on Wednesday. This is due to a combination of factors, including the decision by the International Monetary Fund (IMF) to downgrade its economic growth forecasts for Mexico in 2024-2025, as well as fading Oil prices – a key export for the country.
The impact of stubbornly high inflation in the US and recent remarks from the Chairman of the Federal Reserve (Fed), Jerome Powell, that suggest the Fed may not cut interest rates until September (from previous expectations of June), were further factors posited as influencing the Mexican Peso’s reversal in fortunes.
Mexican Peso declines after IMF revises down growth
The Mexican Peso is taking another step lower after the IMF downgraded its growth forecasts for Mexico over the next two years on Tuesday. It reduced its 2024 forecast to 2.4% from 2.7% and 1.4% in 2025 from 1.5% previously estimated.
“The forecast for Mexico is revised downward on account of weaker-than-expected outcomes for end-2023 and early 2024, with a contraction in manufacturing,” the IMF said in its latest World Economic Outlook report.
This follows similar downgrades from the Banxico in February, when it reduced its growth forecast to 2.8% from 3.0% in 2024, as per The Wall Street Journal.
The fall off in growth is anticipated as a result of lower government spending in an effort to bring down the budget deficit.
“Mexico’s Ministry of Finance expects the fiscal deficit to decrease from 5% to 2.5% of the Gross Domestic Product (GDP) next year, which would imply a cut in spending of 833.6 billion Pesos, according to the Pre-General Policy Criteria Economic 2025,” says Christian Borjon Valencia, Editor at FXStreet.com
In its March meeting, the Banxico reduced interest rates from 11.25% to 11.00% due to evidence of lower inflation and growth. However, the move failed to completely reverse the Mexican Peso’s long-term uptrend.
Higher inflation in the US and recent comments from Fed Chairman Powell, however, may have reversed the trend for the Peso – in particular against the US Dollar.
On Tuesday, Powell said, “Recent data shows a lack of further progress on inflation this year,” adding, “If higher inflation persists the Fed can maintain current rate as long as needed.”
Higher interest rates tend to be positive for a currency as they increase foreign capital inflows. The opposite is true for lower interest rates. Given the divergence in the two country’s monetary policy stances, with Banxico cutting and the Fed holding, the Mexican Peso’s long-term appreciation versus the Buck looks at risk of breaking down.
Technical Analysis: USD/MXN reverses trend in the short-term
USD/MXN – the value of one US Dollar in Mexican Pesos – has probably reversed its short-term downtrend.
The peaks and troughs of price are rising on the 4-hour chart used by many analysts to assess the short-term trend. This suggests the pair is now in an uptrend, favoring bulls.
USD/MXN 4-hour Chart
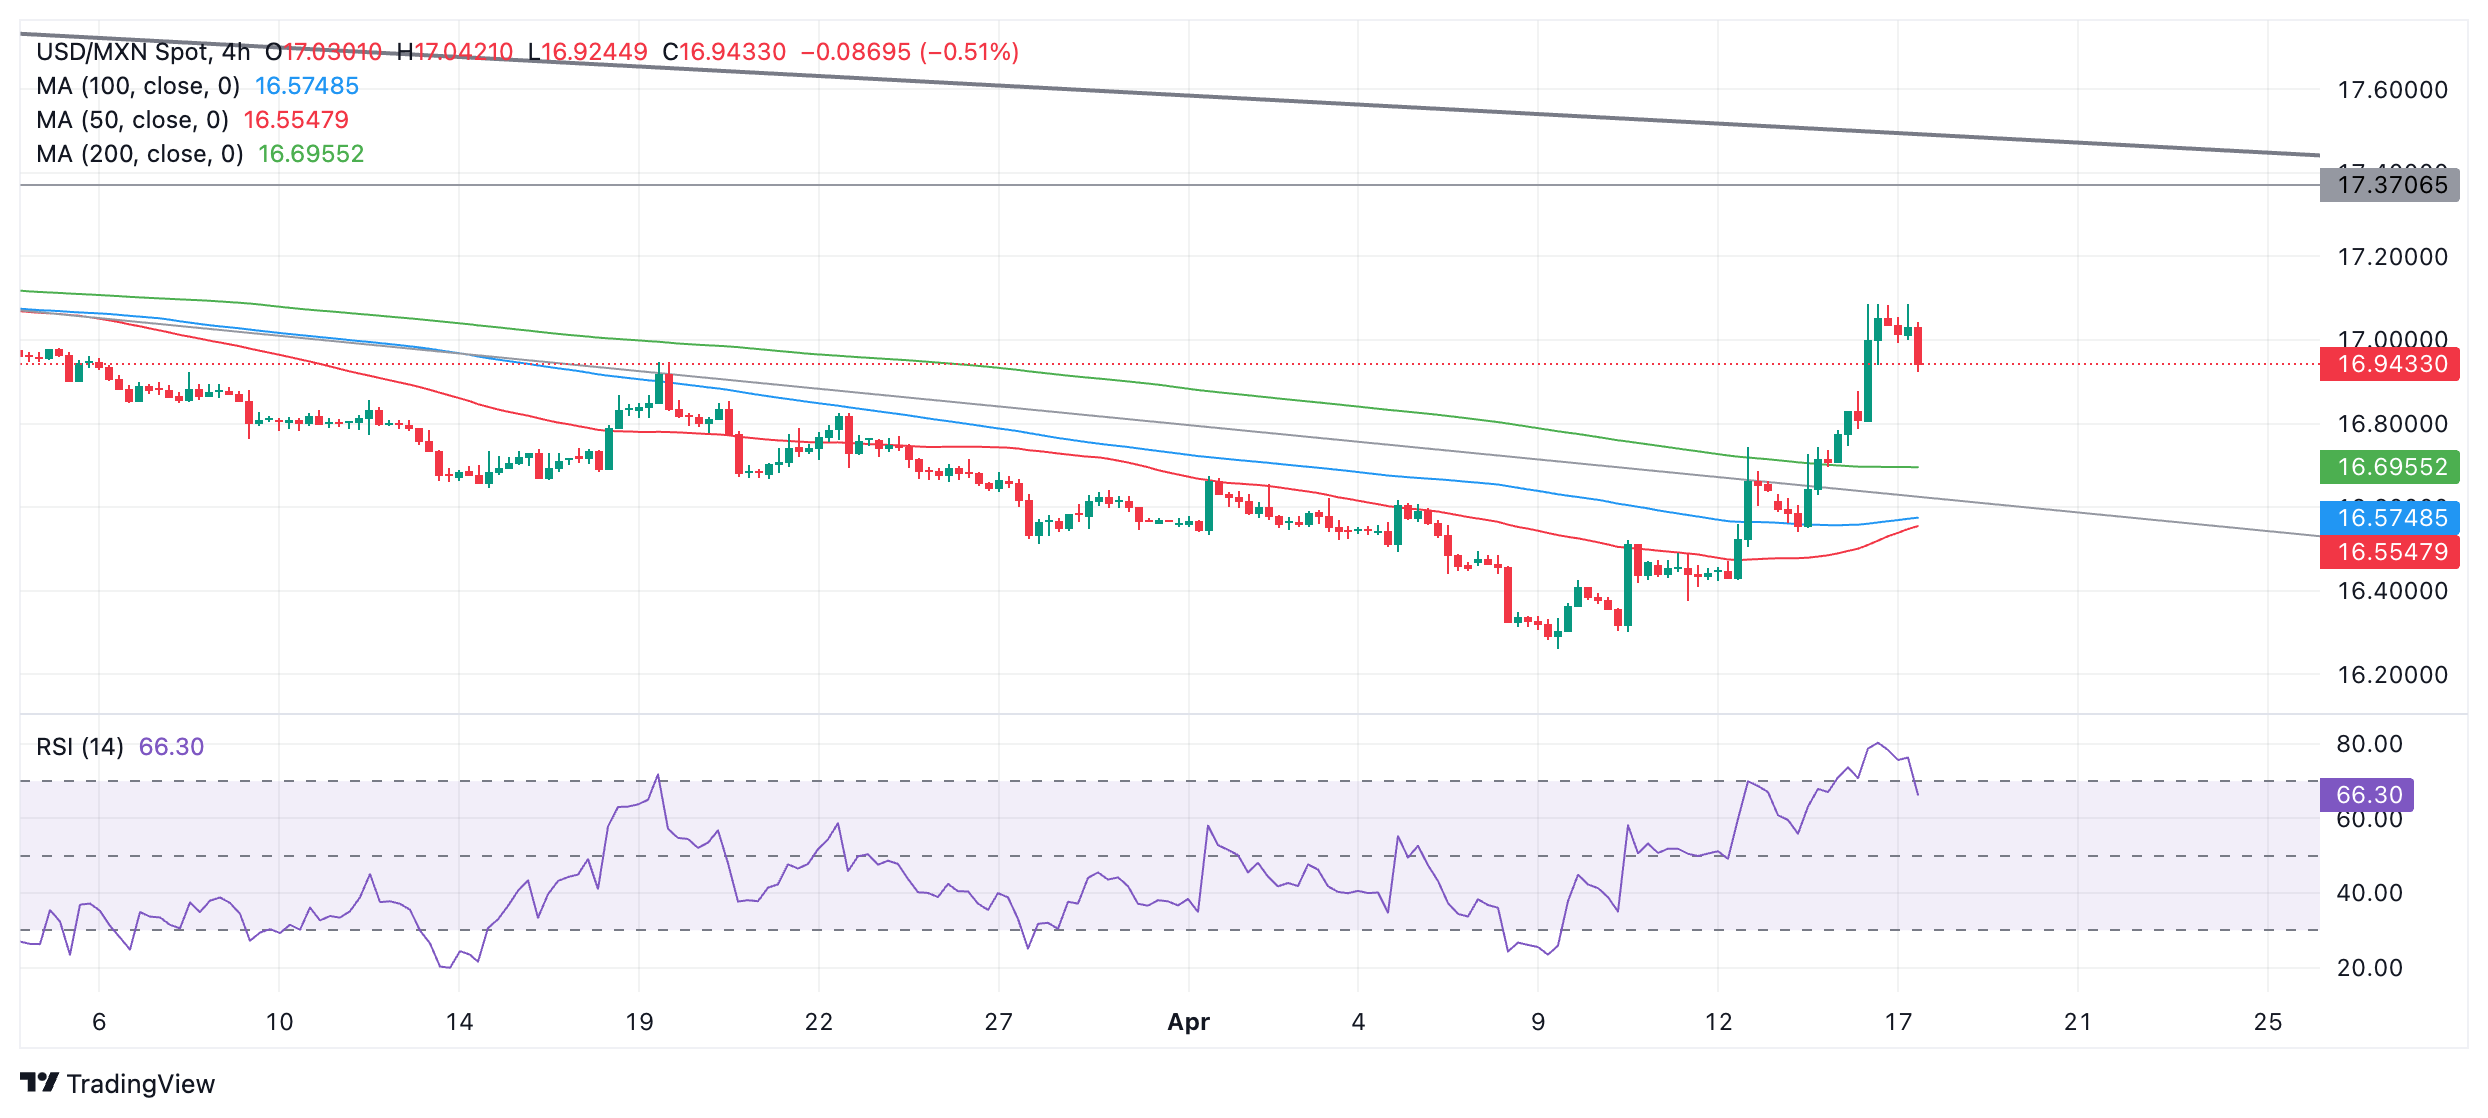
One caveat to the bullish outlook is that the Relative Strength Index (RSI) is pulling back from overbought into neutral territory. Given price is also declining, the two taken together could be signaling the start of a correction. When the RSI moves out of overbought territory it is a signal for short-term time horizon traders to close long positions and open short trades.
If the pair continues pulling back it could fall to the 50-day Simple Moving Average (SMA) at 16.82 and find support there. Given the dominance of the short-term uptrend, however, it is likely to eventually recover and start going higher.
A break above Tuesday’s high at 17.09 would indicate a continuation of the uptrend to the next target, possibly located at 17.17 where the 200-day SMA is situated, followed by resistance from a long-term trendline and resistance level at around 17.37.
Mexican Peso FAQs
The Mexican Peso (MXN) is the most traded currency among its Latin American peers. Its value is broadly determined by the performance of the Mexican economy, the country’s central bank’s policy, the amount of foreign investment in the country and even the levels of remittances sent by Mexicans who live abroad, particularly in the United States. Geopolitical trends can also move MXN: for example, the process of nearshoring – or the decision by some firms to relocate manufacturing capacity and supply chains closer to their home countries – is also seen as a catalyst for the Mexican currency as the country is considered a key manufacturing hub in the American continent. Another catalyst for MXN is Oil prices as Mexico is a key exporter of the commodity.
The main objective of Mexico’s central bank, also known as Banxico, is to maintain inflation at low and stable levels (at or close to its target of 3%, the midpoint in a tolerance band of between 2% and 4%). To this end, the bank sets an appropriate level of interest rates. When inflation is too high, Banxico will attempt to tame it by raising interest rates, making it more expensive for households and businesses to borrow money, thus cooling demand and the overall economy. Higher interest rates are generally positive for the Mexican Peso (MXN) as they lead to higher yields, making the country a more attractive place for investors. On the contrary, lower interest rates tend to weaken MXN.
Macroeconomic data releases are key to assess the state of the economy and can have an impact on the Mexican Peso (MXN) valuation. A strong Mexican economy, based on high economic growth, low unemployment and high confidence is good for MXN. Not only does it attract more foreign investment but it may encourage the Bank of Mexico (Banxico) to increase interest rates, particularly if this strength comes together with elevated inflation. However, if economic data is weak, MXN is likely to depreciate.
As an emerging-market currency, the Mexican Peso (MXN) tends to strive during risk-on periods, or when investors perceive that broader market risks are low and thus are eager to engage with investments that carry a higher risk. Conversely, MXN tends to weaken at times of market turbulence or economic uncertainty as investors tend to sell higher-risk assets and flee to the more-stable safe havens.
Analysts at TD Securities note that UK inflation data came in stronger than expected in March, with headline inflation falling to 3.2% y/y and core declining to 4.2% y/y.
This is not what the BoE wants to see
"Services, which matters the most to the Bank of England (BoE), edged down just 0.1ppts to 6.0% y/y (TDS/mkt/BoE: 5.8%). Surprisingly enough, airfares were not a key driver of the print—prices rose just 0.1% m/m, which especially when factoring in the early Easter this year, makes it quite a weak increase."
"Instead, stronger than expected food prices drove part of the surprise, but a sharp 3.8% m/m surge in accommodation prices also put notable upside pressure on the print. Moreover, volatile components like books and video games also contributed to the upside surprise. Book prices rose a substantial 4.9% m/m—the largest m/m increase on record—and video games surged 2.3% m/m. These sorts of effects are prone to reverting after a month or two. Overall, this is not what the BoE wants to see, in particular after the stronger than expected wage numbers out yesterday."
- Oil prices edge down to $85 as Fed Powell’s hawkish guidance cast doubts over global demand outlook.
- The US warns to levy fresh sanctions on Iran in response to its attack on Israel.
- Worsening geopolitical tensions will firm the oil price outlook.
West Texas Intermediate (WTI), futures on NYMEX, drop slightly to the crucial support of $85.00 in the European session on Wednesday. The Oil price comes under pressure on weak demand outlook amid expectations that the Federal Reserve (Fed) will keep interest rates higher for a longer period.
Stubbornly higher consumer price inflation and strong labor market data for March have dented Fed’s confidence in price pressures declining to the desired rate of 2%. On Tuesday, Fed Chair Jerome Powell said, “The recent data have clearly not given us greater confidence, and instead indicate that it’s likely to take longer than expected to achieve that confidence” reported Reuters.
Apart from that, expectations for higher crude Oil inventories for the week ending April 12 have weighed on the Oil price. The United States Energy Information Administration (EIA) is forecasted to have shown a rise in in Oil stockpiles by 1.6 million barrels.
In the Middle East region, fears of oil supply tightening further have deepened as Israel prepares to respond to Iran’s attack on their territory. After aiming hundreds of drones and missiles on Israel, Tehran said, “the matter deemed to be closed.” However, should the Israeli regime make another mistake, Iran’s response will be considerably more severe, Wall Street Journal reported.
The spread of war situation beyond Gaza will disrupt the Oil supply chain. Iran is the third largest Oil exporting member of the OPEC and his involvement in war with Israel will significantly fluctuate global Oil prices. The long-term outlook of the Oil price remains strong if geopolitical tensions worsen further.
Meanwhile, fears of fresh sanctions from the US on Iran has further escalated prospects of tight Oil supply. US Treasury Secretary Janet Yellen said that their administration intends to levy new sanctions on Iran against its attack on Israel. Fresh sanctions on Iran would impact their capacity of exporting oil.
US Rates Strategists at TD Securities (TDS) express their concerns over ballooning US deficits and their impact on the Treasury market.
Key quotes
“While Treasury is likely to hold auction sizes steady starting in May, investors remain concerned about the long-term US deficit trajectory. We believe it would take a combination of stronger economic data and a refocusing of market attention on the deficit outlook to produce a repeat of the 2023-style bear steepening in Treasuries.”
“US deficits are on one of the worst trajectories on record and are set to deteriorate further as the 2017 tax cuts are likely to be renewed next year.”
“The reinstatement of the debt ceiling in early 2025 should ensure that the budget and debt ceiling are politically coupled once again. Next year's negotiation is likely to be one the most contentious showdowns since 2011, and we see a risk of yet another downgrade to the US credit rating.”
“The ongoing rise in deficits and declining dealer balance sheet capacity have led some investors to conclude that the Fed would intervene in markets if liquidity conditions deteriorate sharply. However, we believe the bar for the Fed intervention is quite high, and it would take a true shock for the Fed to step in.”
“The Treasury market is likely to remain focused on inflation and growth in the near term. However, rising deficits should continue to push term premium higher, the curve steeper, long-end swap spreads tighter, and keep real rates elevated.”
- Gold price struggles for a direction as the Fed’s “higher for longer” interest-rates stance offsets safe-haven demand.
- Fed Powell supports keeping interest rates at high levels until there is confidence that inflation will ease to 2%.
- The US warns about sanctions on Iran in response to their attack on Israel.
Gold price (XAU/USD) balances below $2,400 in Wednesday’s European session. The precious metal struggles to recapture new all-time highs around $2,430 as Federal Reserve (Fed) Chair Jerome Powell emphasised maintaining the restrictive policy framework for a longer period. Powell and his colleagues seem to be leaning towards keeping interest rates higher for longer as inflation has remained stubborn and the labor demand remained strong.
The prospects for the Fed keeping interest rates higher for longer bodes well for the US Dollar and US bond yields. 10-year US Treasury yields fell slightly but remained close to a five-month high around 4.70%. The US Dollar Index (DXY), which measures the Greenback’s value against six major currencies, turns sideways after refreshing a five-month high near 106.40.
Meanwhile, deepening Middle East tensions hold strong ground for Gold. Israel prepares to respond to Iran’s attack. However, US President Joe Biden said it won’t support the counterattack from Israel. US Treasury Secretary Janet Yellen said on Tuesday that the US administration intends to levy new sanctions on Iran after its attack on Israel. Fresh sanctions on Iran could impact their capacity to export Oil.
Daily digest market movers: Gold price struggles for direction
- Gold price trades below the crucial resistance of $2,400. The precious metal consolidates as a hawkish interest rate outlook from Federal Reserve Chair Jerome Powell has limited the upside while escalating Middle East tensions continue to offer firm ground.
- On Tuesday, Jerome Powell supported keeping interest rates higher for a longer period as current inflation data is not giving confidence that price pressures will return to the desired rate of 2%. “The recent data have clearly not given us greater confidence, and instead indicate that it’s likely to take longer than expected to achieve that confidence,” Powell said, according to Reuters.
- Powell added that strong labor demand and slowing disinflation progress in the first three months of this year suggest that the restrictive monetary policy framework should be given more time to work to bring inflation down to 2%.
- The Fed’s confidence in progress in inflation easing to the required rate of 2% was questioned after the March Consumer Price Index (CPI) data surprisingly rose more than estimated. Also, robust Retail Sales data for March have reinforced expectations that the inflation outlook will remain stubborn.
- On the geopolitical front, escalating Middle East tensions keep the safe-haven bid firm. Fears of Middle East tensions spreading beyond Gaza have escalated as Israel prepares to retaliate for the airstrike by Iran on their territory on Saturday. Iran aimed hundreds of drones and missiles at Israel in response to their attack on the Iranian embassy near Damascus in Syria, in which two high-ranked generals were killed. The appeal for Gold as a safe-haven asset strengthens when investors see geopolitical tensions worsening further.
- Meanwhile, Fed policymakers are lined up to provide fresh guidance on interest rates this week. Policymakers are expected to maintain the argument that interest rates need to remain higher for long enough until they get evidence that inflation will sustainably return to the desired rate of 2%.
Technical Analysis: Gold price trades below $2,400
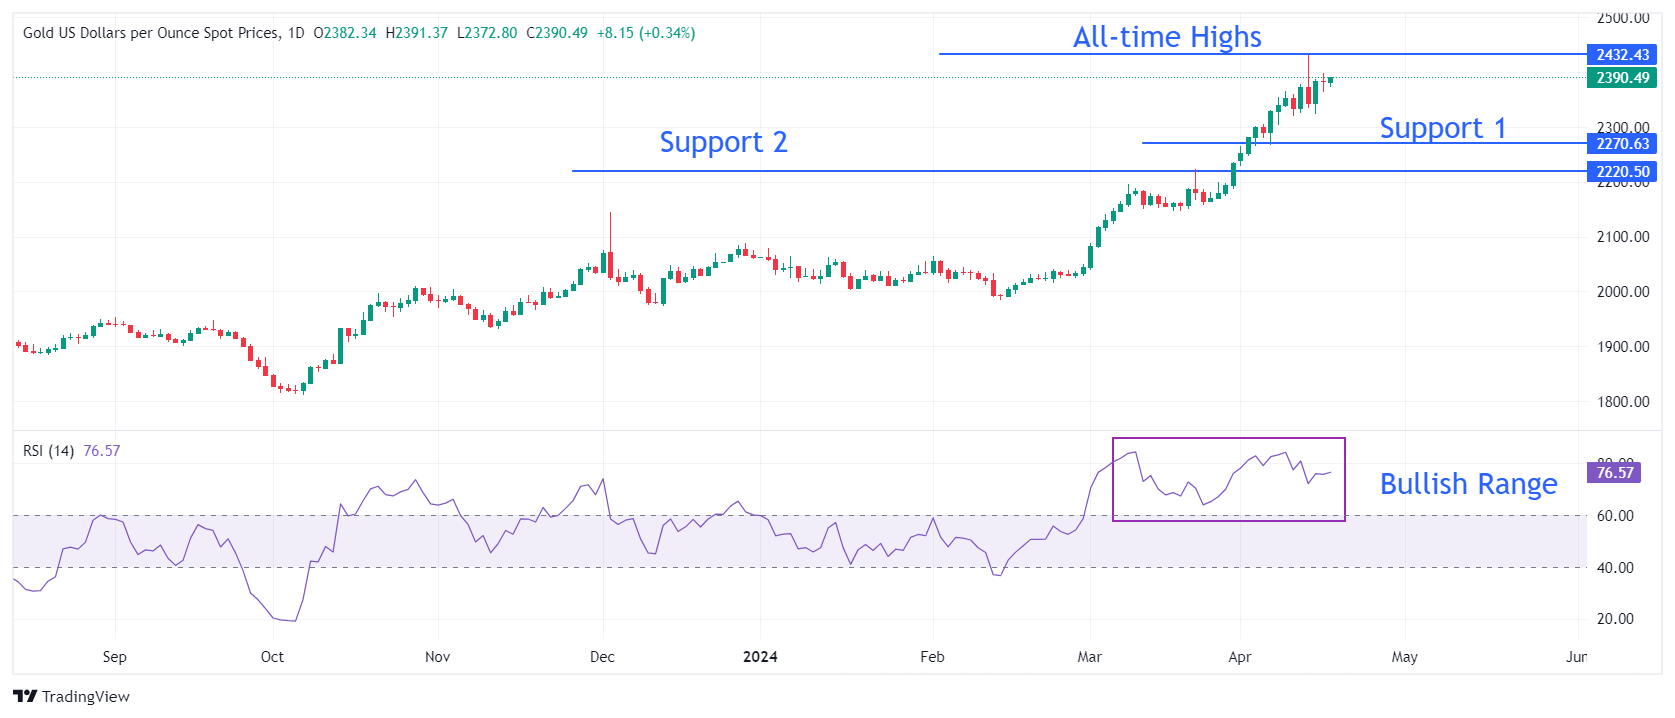
Gold price trades sideways inside Tuesday’s trading range around $2,380. The upside in the precious metal remains limited as momentum oscillators are cooling down after turning extremely overbought. The 14-period Relative Strength Index (RSI) on the daily chart drops slightly after peaking around 85.00. however, the broader-term demand is intact as the RSI remains in the bullish range of 60.00-80.00.
On the downside, April 5 low near $2,268 and March 21 high at $2,223 will be major support areas.
Gold FAQs
Gold has played a key role in human’s history as it has been widely used as a store of value and medium of exchange. Currently, apart from its shine and usage for jewelry, the precious metal is widely seen as a safe-haven asset, meaning that it is considered a good investment during turbulent times. Gold is also widely seen as a hedge against inflation and against depreciating currencies as it doesn’t rely on any specific issuer or government.
Central banks are the biggest Gold holders. In their aim to support their currencies in turbulent times, central banks tend to diversify their reserves and buy Gold to improve the perceived strength of the economy and the currency. High Gold reserves can be a source of trust for a country’s solvency. Central banks added 1,136 tonnes of Gold worth around $70 billion to their reserves in 2022, according to data from the World Gold Council. This is the highest yearly purchase since records began. Central banks from emerging economies such as China, India and Turkey are quickly increasing their Gold reserves.
Gold has an inverse correlation with the US Dollar and US Treasuries, which are both major reserve and safe-haven assets. When the Dollar depreciates, Gold tends to rise, enabling investors and central banks to diversify their assets in turbulent times. Gold is also inversely correlated with risk assets. A rally in the stock market tends to weaken Gold price, while sell-offs in riskier markets tend to favor the precious metal.
The price can move due to a wide range of factors. Geopolitical instability or fears of a deep recession can quickly make Gold price escalate due to its safe-haven status. As a yield-less asset, Gold tends to rise with lower interest rates, while higher cost of money usually weighs down on the yellow metal. Still, most moves depend on how the US Dollar (USD) behaves as the asset is priced in dollars (XAU/USD). A strong Dollar tends to keep the price of Gold controlled, whereas a weaker Dollar is likely to push Gold prices up.
- USD/CAD pulls back from the high level of 1.3846, which has not been seen since mid-November.
- The US Dollar may strengthen further on the likelihood of the Fed extending its tight monetary policy.
- The lower WTI price could limit the advance of the Canadian Dollar.
USD/CAD retreats from a five-month high of 1.3846 reached on Tuesday. The pair trades around 1.3800 during the European hours on Wednesday. The minor decline in the US Dollar (USD) adds to the downward pressure on the USD/CAD pair.
However, the US Dollar Index (DXY) remains close to its five-month peak of 106.51 achieved on Tuesday. At the time of writing, the 2-year and 10-year yields on US Treasury bonds stand at 4.94% and 4.63%, respectively.
The hawkish remarks from the Federal Reserve Chair Jerome Powell, could have supported the US Dollar (USD). According to Reuters, Powell remarked that recent data suggests minimal advancement in inflation this year, implying a prolonged period before reaching the 2% target.
The lower crude Oil prices weaken the Canadian Dollar (CAD), given that Canada is the largest oil exporter to the United States (US). West Texas Intermediate (WTI) Oil price dips to nearly $84.40 per barrel, at the time of writing.
The concerns over Oil supply stemming from heightened tensions in the Middle East have been overshadowed by worries about global demand. Sluggish economic growth in China and the anticipated rise in US commercial stockpiles have heightened concerns regarding the global demand for crude Oil
The Canadian inflation data has provided support for the Bank of Canada (BoC) to contemplate easing borrowing conditions in its upcoming June meeting. Particularly, the closely monitored core inflation indicator exhibited signs of sustained moderation, which may influence the BoC's decision-making regarding monetary policy adjustments.
Consumer Price Index (CPI) rose by 0.6% MoM, lower than the expected 0.7% in March but higher than the previous increase of 0.3%. Meanwhile, Core CPI (YoY) increased by 2.0% at a slower pace compared to the previous rise of 2.1%.
Silver prices (XAG/USD) rose on Wednesday, according to FXStreet data. Silver trades at $28.49 per troy ounce, up 1.37% from the $28.11 it cost on Tuesday.
Silver prices have increased by 11.86% since the beginning of the year.
| Unit measure | Today Price |
|---|---|
| Silver price per troy ounce | $28.49 |
| Silver price per gram | $0.92 |
The Gold/Silver ratio, which shows the number of troy ounces of Silver needed to equal the value of one troy ounce of Gold, stood at 83.97 on Wednesday, down from 84.77 on Tuesday.
Investors might use this ratio to determine the relative valuation of Gold and Silver. Some may consider a high ratio as an indicator that Silver is undervalued – or Gold is overvalued – and might buy Silver or sell Gold accordingly. Conversely, a low ratio might suggest that Gold is undervalued relative to Silver.
Global Market Movers: Comex Silver price resumes uptrend as geopolitical risks loom
- Silver price appreciates as traders adopt caution on expectations of Israel responding to Iran's attack.
- The decline in the US Dollar (USD) provides support to advance Silver demand.
- The price of the white metal could struggle as the Fed may adopt a hawkish stance on its monetary tightening.
- On Tuesday, Federal Reserve Chair Powell remarked that recent data suggests minimal advancement in inflation this year, implying a prolonged period before reaching the 2% target.
- A stronger US Dollar tends to make silver more expensive to buy for investors using other currencies, which could impact the demand for the white metal.
(An automation tool was used in creating this post.)
Silver FAQs
Silver is a precious metal highly traded among investors. It has been historically used as a store of value and a medium of exchange. Although less popular than Gold, traders may turn to Silver to diversify their investment portfolio, for its intrinsic value or as a potential hedge during high-inflation periods. Investors can buy physical Silver, in coins or in bars, or trade it through vehicles such as Exchange Traded Funds, which track its price on international markets.
Silver prices can move due to a wide range of factors. Geopolitical instability or fears of a deep recession can make Silver price escalate due to its safe-haven status, although to a lesser extent than Gold's. As a yieldless asset, Silver tends to rise with lower interest rates. Its moves also depend on how the US Dollar (USD) behaves as the asset is priced in dollars (XAG/USD). A strong Dollar tends to keep the price of Silver at bay, whereas a weaker Dollar is likely to propel prices up. Other factors such as investment demand, mining supply – Silver is much more abundant than Gold – and recycling rates can also affect prices.
Silver is widely used in industry, particularly in sectors such as electronics or solar energy, as it has one of the highest electric conductivity of all metals – more than Copper and Gold. A surge in demand can increase prices, while a decline tends to lower them. Dynamics in the US, Chinese and Indian economies can also contribute to price swings: for the US and particularly China, their big industrial sectors use Silver in various processes; in India, consumers’ demand for the precious metal for jewellery also plays a key role in setting prices.
Silver prices tend to follow Gold's moves. When Gold prices rise, Silver typically follows suit, as their status as safe-haven assets is similar. The Gold/Silver ratio, which shows the number of ounces of Silver needed to equal the value of one ounce of Gold, may help to determine the relative valuation between both metals. Some investors may consider a high ratio as an indicator that Silver is undervalued, or Gold is overvalued. On the contrary, a low ratio might suggest that Gold is undervalued relative to Silver.
Japan’s Chief Cabinet Secretary Yishimasa Hayashi said on Wednesday that we are “closely watching FX moves” and are “prepared for full measures.”
Additional quotes
- Important for currencies to move in a stable manner, reflecting fundamentals.
- Rapid FX moves are undesirable.
Market reaction
USD/JPY is holding its corrective trait intact near 154.50 on the Japanese verbal intervention, down 0.15% on the day.
Japanese Yen FAQs
The Japanese Yen (JPY) is one of the world’s most traded currencies. Its value is broadly determined by the performance of the Japanese economy, but more specifically by the Bank of Japan’s policy, the differential between Japanese and US bond yields, or risk sentiment among traders, among other factors.
One of the Bank of Japan’s mandates is currency control, so its moves are key for the Yen. The BoJ has directly intervened in currency markets sometimes, generally to lower the value of the Yen, although it refrains from doing it often due to political concerns of its main trading partners. The current BoJ ultra-loose monetary policy, based on massive stimulus to the economy, has caused the Yen to depreciate against its main currency peers. This process has exacerbated more recently due to an increasing policy divergence between the Bank of Japan and other main central banks, which have opted to increase interest rates sharply to fight decades-high levels of inflation.
The BoJ’s stance of sticking to ultra-loose monetary policy has led to a widening policy divergence with other central banks, particularly with the US Federal Reserve. This supports a widening of the differential between the 10-year US and Japanese bonds, which favors the US Dollar against the Japanese Yen.
The Japanese Yen is often seen as a safe-haven investment. This means that in times of market stress, investors are more likely to put their money in the Japanese currency due to its supposed reliability and stability. Turbulent times are likely to strengthen the Yen’s value against other currencies seen as more risky to invest in.
- Silver price appreciates as traders adopt caution on expectations of Israel responding to Iran's attack.
- The decline in the US Dollar provides support to advance Silver demand.
- The price of the white metal could struggle as the Fed may adopt a hawkish stance on its monetary tightening.
Silver price edges higher to near $28.50 per troy ounce during the European trading hours on Wednesday. The safe-haven bullion like Silver gains ground on the market caution. Investors are cautiously monitoring Israel's response to Iran's air strike on Saturday.
A Reuters article reported that the rescheduling of the third meeting of Israel's war cabinet, initially slated for Tuesday, has been moved to Wednesday. The purpose of this meeting is to discuss and deliberate on Israel's response to Iran's unprecedented direct attack.
Additionally, the mild downward correction in the US Dollar adds to the upside of the Silver demand. However, the US Dollar Index (DXY) maintains a position near its five-month high of 106.51 reached on Tuesday. 2-year and 10-year US yields on US Treasury bonds stand at 4.96% and 4.65%, respectively, by the press time.
The expectations of the Federal Reserve (Fed) maintaining elevated interest rates for a longer duration, buoyed by a robust US economy and persistent inflation. Additionally, the hawkish remarks from the Federal Reserve Chair Jerome Powell, could support the US Dollar (USD). A stronger US Dollar (USD) tends to make silver more expensive to buy for investors using other currencies, which could impact the demand for the white metal.
On Tuesday, Federal Reserve Chair Powell remarked that recent data suggests minimal advancement in inflation this year, implying a prolonged period before reaching the 2% target. This statement potentially fostered a more hawkish sentiment and lent support to the US Dollar, according to Reuters.
- EUR/USD edges down ahead of HICP inflation data for the Eurozone.
- Speeches by several key ECB governing council members could also impact EUR/USD.
- EUR/USD enters oversold levels on the daily chart, indicating risk of a pullback.
EUR/USD trades slightly down on Wednesday in the lower 1.0600s, as it clocks up a sixth consecutive day of losses.
The pair is entering the oversold zone on charts, suggesting traders may be operating with more caution. Whilst this does not definitively indicate an end to the downtrend itself, it does up the odds of an upward correction potentially evolving on the horizon.
In terms of volatility, the main events on the calendar for EUR/USD on Wednesday are the final estimates for Eurozone March inflation data, and several speeches by European Central Bank (ECB) officials.
EUR/USD: Traders await final estimates, ECB speeches
EUR/USD could see some volatility after the release of the final estimates for Eurozone March Inflation data at 9:00 GMT on Wednesday. Levels of inflation inform the decisions of the ECB regarding the setting of interest rates, a key driver in the FX markets.
If the revisions deviate from the initial estimates the pair may fluctuate.
Flash estimates for the Harmonized Index of Consumer Prices (HICP) in March, showed a 2.4% rise year-on-year, down from 2.6% previously. The final estimate is also expected to show 2.4%.
The flash estimate for Core HICP showed a 2.9% rise YoY from 3.1% previous, and 0.8% month-on-month from 1.1% in February. Again, in both cases, the final estimate is expected to remain unchanged.
Any deviation in the data, however, is likely to move EUR/USD.
A lower-than-expected final estimate would solidify expectations that the ECB will go ahead and cut interest rates in the near-term, probably in June. Since lower interest rates, or their expectation, tend to reduce foreign capital inflows, such a result would probably depreciate to the Euro (EUR) and push down EUR/USD.
If HICP is revised up, this might raise some doubt about whether the ECB will go ahead with a rate cut in June, which could strengthen the Euro and see EUR/USD recover.
Speeches by key ECB members throughout the day, including ECB Executive Board Member Piero Cipollone, ECB Executive Board Member Isabel Schnabel and President Christine Lagarde herself could also impact the pair’s volatility.
The case for an imminent cut in interest rates – the ECB’s key main refinancing operations rate stands at 4.50% – was strengthened on Tuesday after ECB President Christine Lagarde said that the ECB will cut rates soon, bar a surprise, and that the ECB was keeping a close eye on Oil prices due to tensions in the Middle East.
Technical Analysis: EUR/USD bears are oversold
The EUR/USD pair is firmly in a downtrend on both its short and medium-term time frames, since peaking and rolling over at 1.1139 in December.
EUR/USD Daily Chart
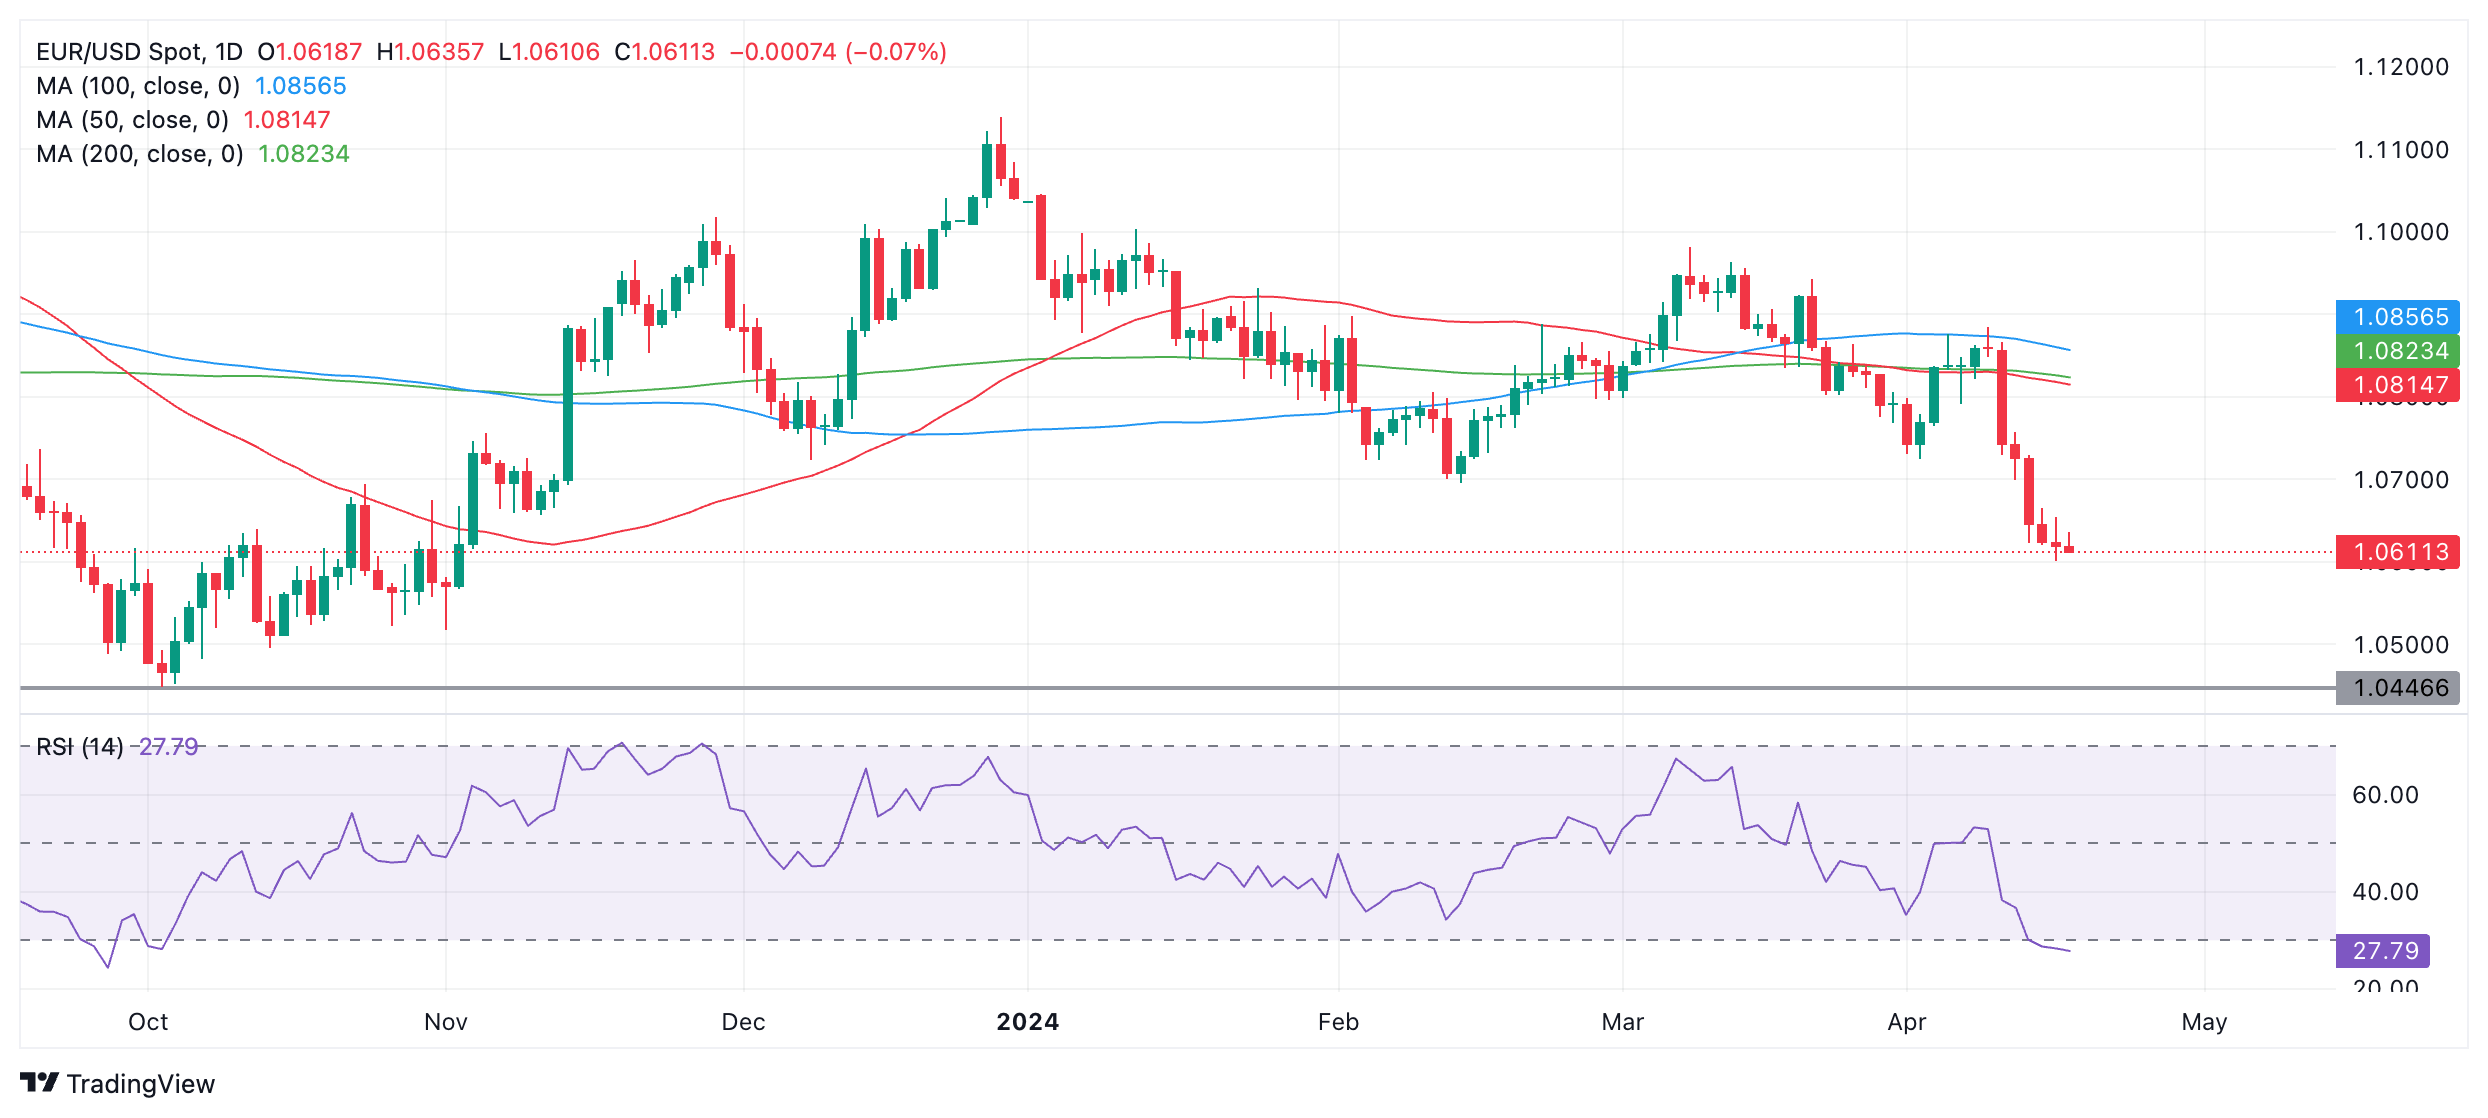
The downtrend thesis is supported by the fact that the pair is trading below all its key major moving averages – the 50-day, 100-day and 200-day Simple Moving Averages (SMA).
It is making lower lows and lower highs and this trend is biased to continue – with one caveat.
The Relative Strength Index (RSI) momentum indicator is flashing oversold on the daily chart. At the moment this is only a warning for short-traders not to add to their positions, however, if the RSI were to exit oversold and rise back above 30, it would be a sign the pair was correcting and for short-traders to close their positions and open longs.
As things stand it is still possible the pair could continue lower and even if there is a correction the dominant downtrend is still likely to resume. The next key downside target for the pair is the 2023 lows at 1.0446.
If a pullback evolves, meanwhile, a possible target could be the swing low at 1.0700.
Euro FAQs
The Euro is the currency for the 20 European Union countries that belong to the Eurozone. It is the second most heavily traded currency in the world behind the US Dollar. In 2022, it accounted for 31% of all foreign exchange transactions, with an average daily turnover of over $2.2 trillion a day. EUR/USD is the most heavily traded currency pair in the world, accounting for an estimated 30% off all transactions, followed by EUR/JPY (4%), EUR/GBP (3%) and EUR/AUD (2%).
The European Central Bank (ECB) in Frankfurt, Germany, is the reserve bank for the Eurozone. The ECB sets interest rates and manages monetary policy. The ECB’s primary mandate is to maintain price stability, which means either controlling inflation or stimulating growth. Its primary tool is the raising or lowering of interest rates. Relatively high interest rates – or the expectation of higher rates – will usually benefit the Euro and vice versa. The ECB Governing Council makes monetary policy decisions at meetings held eight times a year. Decisions are made by heads of the Eurozone national banks and six permanent members, including the President of the ECB, Christine Lagarde.
Eurozone inflation data, measured by the Harmonized Index of Consumer Prices (HICP), is an important econometric for the Euro. If inflation rises more than expected, especially if above the ECB’s 2% target, it obliges the ECB to raise interest rates to bring it back under control. Relatively high interest rates compared to its counterparts will usually benefit the Euro, as it makes the region more attractive as a place for global investors to park their money.
Data releases gauge the health of the economy and can impact on the Euro. Indicators such as GDP, Manufacturing and Services PMIs, employment, and consumer sentiment surveys can all influence the direction of the single currency. A strong economy is good for the Euro. Not only does it attract more foreign investment but it may encourage the ECB to put up interest rates, which will directly strengthen the Euro. Otherwise, if economic data is weak, the Euro is likely to fall. Economic data for the four largest economies in the euro area (Germany, France, Italy and Spain) are especially significant, as they account for 75% of the Eurozone’s economy.
Another significant data release for the Euro is the Trade Balance. This indicator measures the difference between what a country earns from its exports and what it spends on imports over a given period. If a country produces highly sought after exports then its currency will gain in value purely from the extra demand created from foreign buyers seeking to purchase these goods. Therefore, a positive net Trade Balance strengthens a currency and vice versa for a negative balance.
- USD/JPY maintains its position around the high of 154.78 marked on Tuesday.
- US Dollar strengthens on expectations of the Fed prolonging higher policy rates for a longer duration.
- Japan’s Merchandise Trade Balance Total rose to a surplus of ¥366.5 billion in March, from the previous deficit of ¥377.8 billion.
USD/JPY trades around 154.60 during the early European session on Wednesday, hovering near its peak at 154.78, a level not seen since June 1990. The downward correction in the US Dollar (USD) puts pressure on the USD/JPY pair. However, expectations of the Federal Reserve (Fed) maintaining elevated interest rates for a longer duration, buoyed by a robust US economy and persistent inflation, counterbalance the downward trend in the USD/JPY pair.
Federal Reserve Chair Jerome Powell's remarks on Tuesday at the Washington Forum might have bolstered the greenback. Powell noted that recent data indicates limited progress on inflation this year, suggesting a prolonged period before reaching the 2% target. This commentary possibly contributed to a more hawkish stance and provided support to the US Dollar, as reported by Reuters.
On the other side, the Japanese Yen (JPY) might have found support from the country's trade balance swinging to a surplus in March. The Merchandise Trade Balance Total improved to ¥366.5 billion from the previous deficit of ¥377.8 billion. Additionally, a private survey revealed that sentiment among manufacturers in Japan softened in April due to a weaker Yen driving up import expenses.
Furthermore, the Japanese Yen could see bolstering from safe-haven inflows, likely prompted by risk aversion. Investors are cautiously monitoring Israel's response to Iran's air strike on Saturday. A Reuters report mentioned the postponement of a third meeting of Israel's war cabinet, initially scheduled for Tuesday, to Wednesday, to deliberate on a reaction to Iran's unprecedented direct attack.
Traders eagerly await the release of Japan's National Consumer Price Index (CPI) data by the Statistics Bureau of Japan on Friday. Market expectations point towards a moderation in Consumer Prices in March.
- The Pound Sterling recovers above 1.2400 against the US Dollar as UK inflation rose higher than expected in March.
- UK’s annual headline and core CPI grew by 3.2% and 4.2% in March, respectively.
- Fed Powell’s hawkish guidance on interest rates has strengthened the US Dollar’s appeal.
The Pound Sterling (GBP) rebounds strongly in Wednesday’s London session as the United Kingdom Office for National Statistics (ONS) reported that the Consumer Price Index (CPI) for March grew more than what economists had expected. Despite beating estimates, inflation has softened from February, suggesting that higher interest rates by the Bank of England (BoE) contribute to abate price pressures.
Meanwhile, producer price inflation has also slowed, indicating prices of goods and services at factory gates are easing. Business owners generally slash their prices when they expect demand to remain subdued.
Slightly hot inflation figures could question expectations that the BoE will cut rates in November, although Tuesday’s employment data suggested that the UK’s job market is cooling. The labor market report showed that the Unemployment Rate rose sharply to 4.2% in three months ending February from expectations of 4.0% and the prior release of 3.9%. The number of employed people fell by 156K in the three months to February, more than the 89K jobs lost in the quarter to January.
Daily digest market movers: Pound Sterling recovers even as US Dollar remains firm
- The Pound Sterling bounces back to 1.2460 as the United Kingdom ONS reports a higher-than-expected inflation rate for March. Annual headline inflation rose 3.2%, higher than expectations of 3.1% but slowed from the prior reading of 3.4%. Monthly headline inflation grew steadily by 0.6%.
- UK’s annual core CPI data, which strips off volatile food and energy prices, grew by 4.2%, more than the expected 4.1% but significantly decelerating from February’s reading of 4.5%. The core inflation data is the Bank of England’s preferred inflation measure for decision-making on interest rates. Even as the measure came in slightly higher than expected, it clearly shows that price pressures are on course to return to the BoE’s desired rate of 2%.
- March’s inflation data is unlikely to significantly influence speculation for the BoE pivoting to rate cuts, which financial markets are currently expecting from November, according to rate future markets, Reuters reports.
- On the global front, dismal market sentiment due to worsening Middle East tensions and a hawkish interest rate guidance from Federal Reserve Chair Jerome Powell has been maintaining downward pressure on risk-sensitive assets. S&P 500 futures are posting some losses.
- Fears of further escalation in Iran-Israel tensions have deepened as Israel vowed to retaliate against Iran’s attack. The US said it is prepared to impose sanctions on Iran.
- The US Dollar Index (DXY), which measures the US Dollar’s value against six major currencies, hovers near a fresh five-month high around 106.40. The USD Index is expected to extend its upside, as Fed Powell said on Tuesday that there is a need to hold interest rates higher for longer, given the strong labor demand and slow progress in inflation, which is declining to the desired rate of 2%.
Technical Analysis: Pound Sterling finds cushion near 1.2400
The Pound Sterling exhibits a firm footing after the release of the UK inflation report for March. The GBP/USD pair sees strong buying near the crucial support at 1.2400. The upside in the Cable is seen limited near the psychological resistance of 1.2500. This coincides with the breakdown region of the Head and Shoulder chart formation on the daily time frame.
The long-term outlook turns bearish as the Cable drops below the 200-day Exponential Moving Average (EMA), which trades around 1.2560.
The 14-period Relative Strength Index (RSI) shifts into the bearish range of 20.00-40.00, suggesting an active downside momentum.
Pound Sterling FAQs
The Pound Sterling (GBP) is the oldest currency in the world (886 AD) and the official currency of the United Kingdom. It is the fourth most traded unit for foreign exchange (FX) in the world, accounting for 12% of all transactions, averaging $630 billion a day, according to 2022 data. Its key trading pairs are GBP/USD, aka ‘Cable’, which accounts for 11% of FX, GBP/JPY, or the ‘Dragon’ as it is known by traders (3%), and EUR/GBP (2%). The Pound Sterling is issued by the Bank of England (BoE).
The single most important factor influencing the value of the Pound Sterling is monetary policy decided by the Bank of England. The BoE bases its decisions on whether it has achieved its primary goal of “price stability” – a steady inflation rate of around 2%. Its primary tool for achieving this is the adjustment of interest rates. When inflation is too high, the BoE will try to rein it in by raising interest rates, making it more expensive for people and businesses to access credit. This is generally positive for GBP, as higher interest rates make the UK a more attractive place for global investors to park their money. When inflation falls too low it is a sign economic growth is slowing. In this scenario, the BoE will consider lowering interest rates to cheapen credit so businesses will borrow more to invest in growth-generating projects.
Data releases gauge the health of the economy and can impact the value of the Pound Sterling. Indicators such as GDP, Manufacturing and Services PMIs, and employment can all influence the direction of the GBP. A strong economy is good for Sterling. Not only does it attract more foreign investment but it may encourage the BoE to put up interest rates, which will directly strengthen GBP. Otherwise, if economic data is weak, the Pound Sterling is likely to fall.
Another significant data release for the Pound Sterling is the Trade Balance. This indicator measures the difference between what a country earns from its exports and what it spends on imports over a given period. If a country produces highly sought-after exports, its currency will benefit purely from the extra demand created from foreign buyers seeking to purchase these goods. Therefore, a positive net Trade Balance strengthens a currency and vice versa for a negative balance.
- USD/CHF edges lower to 0.9105 amid the softer USD on Wednesday.
- The uncertainties and escalating tensions in the Middle East might benefit the Swiss Franc (CHF).
- Fed’s Powell stated that monetary policy needs to be restrictive for longer, triggering the hope of delaying interest rate cuts.
The USD/CHF pair faces some selling pressure to 0.9105 on Wednesday during the early European session. The downtick of the pair is supported by the decline of the US Dollar Index (DXY) to 106.20. Additionally, the ongoing geopolitical tensions in the Middle East continue to support the Swiss Franc (CHF), a traditional safe-haven currency.
Late Tuesday, National Security Advisor Jake Sullivan said that new sanctions targeting Iran and sanctions against entities supporting the Islamic Revolutionary Guard Corps and Iran's Defense Ministry will be imposed in the coming days. Sullivan added that these new measures will "continue a steady drumbeat of pressure" to contain and degrade Iran's military capacity and effectiveness and confront the full range of its problematic behaviors. Meanwhile, western leaders have urged Israel to exercise restraint against escalation. Market players will closely monitor the development surrounding Israel and Iran tensions. Any escalating tensions might boost safe-haven assets like CHF and create a headwind for the USD/CHF pair.
On the other hand, strong US economic data and hawkish comments from the US central bank remain to support the Greenback for the time being. The Federal Reserve's Jerome Powell stated that the US economy has not seen inflation come back to the 2% target and that monetary policy needs to be restrictive for longer. These remarks further dampen investors' hopes for meaningful rate cuts this year and lift the USD against its rivals. According to the CME FedWatch Tool, financial markets have priced in 67% odds that the Fed will cut interest rates in September.
Here is what you need to know on Wednesday, April 17:
The US Dollar holds steady against its major rivals after ending Tuesday on a bullish note. The US economic docket will not offer any high-impact data releases but several Federal Reserve (Fed) policymakers will be delivering speeches on Wednesday. Eurostat will release revisions to March inflation data during the European trading hours.
US Dollar price this week
The table below shows the percentage change of US Dollar (USD) against listed major currencies this week. US Dollar was the strongest against the Australian Dollar.
| USD | EUR | GBP | CAD | AUD | JPY | NZD | CHF | |
| USD | 0.21% | -0.05% | 0.42% | 0.84% | 0.80% | 0.65% | -0.20% | |
| EUR | -0.21% | -0.27% | 0.22% | 0.63% | 0.60% | 0.45% | -0.43% | |
| GBP | 0.05% | 0.27% | 0.49% | 0.92% | 0.86% | 0.71% | -0.17% | |
| CAD | -0.43% | -0.22% | -0.49% | 0.41% | 0.38% | 0.22% | -0.64% | |
| AUD | -0.83% | -0.63% | -0.90% | -0.40% | -0.02% | -0.18% | -1.04% | |
| JPY | -0.79% | -0.59% | -0.84% | -0.38% | 0.03% | -0.13% | -1.03% | |
| NZD | -0.64% | -0.43% | -0.71% | -0.21% | 0.20% | 0.17% | -0.86% | |
| CHF | 0.21% | 0.42% | 0.16% | 0.64% | 1.04% | 1.01% | 0.85% |
The heat map shows percentage changes of major currencies against each other. The base currency is picked from the left column, while the quote currency is picked from the top row. For example, if you pick the Euro from the left column and move along the horizontal line to the Japanese Yen, the percentage change displayed in the box will represent EUR (base)/JPY (quote).
The UK's Office for National Statistics reported early Wednesday that annual inflation, as measured by the change in the Consumer Price Index (CPI), edged lower to 3.2% in March from 3.4% in February. Additionally, core CPI rose 4.2% in the same period. Both of these readings came in above analysts' estimates and helped Pound Sterling gather strength. After spending the Asian session in a tight channel slightly above 1.2400, GBP/USD gained traction and rose toward 1.2450.
UK CPI inflation cools down to 3.2% in March vs. 3.1% estimate.
Hawkish comments from Fed officials and the cautious market stance helped the USD find demand in the American session and the USD Index closed the fifth consecutive day in positive territory on Tuesday. Early Wednesday, the benchmark 10-year US Treasury bond yield moves sideways above 4.65% and US stock index futures trade marginally lower. Israel said that it will retaliate against Iran and a war cabinet meeting to decide on the appropriate response will be reportedly held on Wednesday.
EUR/USD recovered modestly after falling toward 1.0600 on Tuesday and closed the day virtually unchanged. The pair stays relatively quiet and moves up and down in a narrow band above 1.0600 in the European morning.
Gold failed to make a decisive move in either direction on Tuesday as rising US Treasury bond yields made it difficult for the precious metal to benefit from the cautious market mood. XAU/USD continues to move sideways above $2,370 early Wednesday.
Gold Price Forecast: XAU/USD remains steady above $2,350 amid market caution.
The data from New Zealand showed in the early Asian session on Wednesday that the CPI rose 4% on a yearly basis in the first quarter, down sharply from the 4.7% increase recorded in the previous quarter. On a quarterly basis, the CPI was up 0.6%. NZD/USD stretched higher after this report and was last seen trading in positive territory slightly above 0.5900.
USD/JPY touched a yet another multi-decade high near 154.80 on Tuesday. The pair retreated slightly in the Asian session and seems to have stabilized at around 154.50.
Central banks FAQs
Central Banks have a key mandate which is making sure that there is price stability in a country or region. Economies are constantly facing inflation or deflation when prices for certain goods and services are fluctuating. Constant rising prices for the same goods means inflation, constant lowered prices for the same goods means deflation. It is the task of the central bank to keep the demand in line by tweaking its policy rate. For the biggest central banks like the US Federal Reserve (Fed), the European Central Bank (ECB) or the Bank of England (BoE), the mandate is to keep inflation close to 2%.
A central bank has one important tool at its disposal to get inflation higher or lower, and that is by tweaking its benchmark policy rate, commonly known as interest rate. On pre-communicated moments, the central bank will issue a statement with its policy rate and provide additional reasoning on why it is either remaining or changing (cutting or hiking) it. Local banks will adjust their savings and lending rates accordingly, which in turn will make it either harder or easier for people to earn on their savings or for companies to take out loans and make investments in their businesses. When the central bank hikes interest rates substantially, this is called monetary tightening. When it is cutting its benchmark rate, it is called monetary easing.
A central bank is often politically independent. Members of the central bank policy board are passing through a series of panels and hearings before being appointed to a policy board seat. Each member in that board often has a certain conviction on how the central bank should control inflation and the subsequent monetary policy. Members that want a very loose monetary policy, with low rates and cheap lending, to boost the economy substantially while being content to see inflation slightly above 2%, are called ‘doves’. Members that rather want to see higher rates to reward savings and want to keep a lit on inflation at all time are called ‘hawks’ and will not rest until inflation is at or just below 2%.
Normally, there is a chairman or president who leads each meeting, needs to create a consensus between the hawks or doves and has his or her final say when it would come down to a vote split to avoid a 50-50 tie on whether the current policy should be adjusted. The chairman will deliver speeches which often can be followed live, where the current monetary stance and outlook is being communicated. A central bank will try to push forward its monetary policy without triggering violent swings in rates, equities, or its currency. All members of the central bank will channel their stance toward the markets in advance of a policy meeting event. A few days before a policy meeting takes place until the new policy has been communicated, members are forbidden to talk publicly. This is called the blackout period.
- EUR/GBP moves negatively after paring intraday gains amid mixed UK inflation figures.
- UK CPI MoM remained stable at a 0.6% increase in March, while the YoY index rose by 3.2%, exceeding expectations.
- Traders shift their focus on the Eurozone Harmonized Index of Consumer Prices, set to be released Wednesday.
EUR/GBP faces downward pressure following mixed Consumer Price Index (CPI) data from the United Kingdom (UK). The EUR/GBP pair dips to near 0.8540 during the Asian session on Wednesday. Market attention now turns to the Eurozone Harmonized Index of Consumer Prices (HICP) for March, set to be released later in the day.
In March, UK CPI (MoM) maintained a steady pace of 0.6%, while year-over-year Consumer Inflation increased by 3.2%, slightly above the expectations of 3.1% but lower than the previous 3.4%. Meanwhile, Core CPI YoY rose by 4.2%, surpassing expectations of 4.1% but lower than the previous 4.5%.
The Pound Sterling (GBP) faces downward pressure as investors anticipate two rate cuts by the Bank of England (BoE) this year, with the initial move likely in August or September. BoE Governor Andrew Bailey stated on Tuesday that there is compelling evidence indicating a decline in UK inflation. The key question for BoE policymakers, according to Bailey, is how much additional evidence is needed before considering interest rate cuts.
On the other side, the Euro faces challenges amid growing speculation that the European Central Bank (ECB) will commence interest rate cuts in June, driven by a tepid Eurozone economic outlook and moderating core inflationary pressures.
During an interview with CNBC on Tuesday, ECB President Christine Lagarde suggested that rate cuts are imminent, barring any significant unforeseen developments. Lagarde remarked that the ECB is observing a disinflationary trend that aligns with expectations. Additionally, she noted that geopolitical events' influence on commodity prices has been relatively limited thus far.
- GBP/JPY holds positive ground near 192.20 after the release of the UK inflation report.
- UK CPI rose 3.2% YoY in March vs. 3.1% expected.
- The BoJ’s cautious stance weighs on the Japanese Yen (JPY) against the GBP.
The GBP/JPY pair snaps the two-day winning streak around 192.20 during the early European session on Wednesday. The Pound Sterling (GBP) edges higher to an intraday high of 192.40 and then retreats following the hotter-than-expected UK Inflation data.
The headline annual UK Consumer Price Index rose 3.2% in March, softer than a 3.4% increase in February. This reading came in above the market consensus of 3.1%, but still higher than the BoE’s 2.0% target, according to the Office for National Statistics on Wednesday. Furthermore, the core CPI inflation dropped to 4.2% YoY in March from 4.5% in February. Meanwhile, the UK monthly CPI rose 0.6% in March, the same pace seen in February. The GBP gains traction as investors push back market expectations of a September BoE rate cut.
On the Japanese Yen front, the Bank of Japan (BoJ) has been cautious in normalizing its policy. Japanese CPI inflation is expected to remain above 2% through fiscal year 2024 and decelerate in fiscal year 2025, according to the BoJ’s quarterly outlook report. This triggers the anticipation that interest rates will remain extremely low for some time, which weighs on the Japanese Yen (JPY). Investors will monitor the fresh quarterly growth and price projections due at its April 25–26 policy meeting for any hints about the path of interest rate.
- EUR/USD rebounds to 1.0625 in Wednesday’s early European session.
- The pair keeps the negative outlook unchanged below the key EMA; RSI indicator holds in bearish territory.
- The initial support level is seen at the 1.0600–1.0605 zone; the immediate resistance level will emerge at 1.0710.
The EUR/USD pair posts modest gains around 1.0625 after bouncing off the fresh yearly low of 1.0600 on Wednesday during the early European trading hours. However, the further upside might be limited amid the hawkish comments from Federal Reserve (Fed) Chairman Jerome Powell and growing speculation that the European Central Bank (ECB) will start lowering interest rates in June. Investors await the Eurozone Harmonized Index of Consumer Prices (HICP) for March and ECB President Lagarde's speech for fresh catalysts.
Technically, EUR/USD maintains the bearish stance unchanged as the major pair is below the key 100-period Exponential Moving Average (EMA) on the four-hour chart. The downward momentum is backed by the Relative Strength Index (RSI), which holds in bearish territory around 32, indicating that further downside looks favorable.
The 1.0600–1.0605 region acts as an initial support level for the major pair, portraying the confluence of the lower limit of the Bollinger Band and psychological level. Further south, the next contention level to watch is a low of November 2 at 1.0565, followed by the 1.0500 round mark.
On the upside, the immediate resistance level of EUR/USD will emerge near the 50-period EMA at 1.0710. The additional upside filter to watch is the 100-period EMA at 1.0756. A decisive break above this level will expose a low of March 22 and the round figure at 1.0800, en route to a high of April 9 at 1.0885.
EUR/USD four-hour chart
-638489275916280539.png)
FX option expiries for Apr 17 NY cut at 10:00 Eastern Time, via DTCC, can be found below
- EUR/USD: EUR amounts
- 1.0550 445m
- 1.0605 630m
- 1.0630 1.3b
- 1.0635 455m
- 1.0650 483m
- 1.0700 2.1b
- GBP/USD: GBP amounts
- 1.2500 938m
- USD/JPY: USD amounts
- 153.00 936m
- 153.50 722m
- USD/CHF: USD amounts
- 0.9100 1.2b
- AUD/USD: AUD amounts
- 0.6470 1b
- USD/CAD: USD amounts
- 1.3800 1.5b
- NZD/USD: NZD amounts
- 0.5900 1b
- EUR/GBP: EUR amounts
- 0.8480 429m
- WTI drifts lower to $84.25 on the hawkish Fed remarks on Wednesday.
- The possibility that the Fed will delay the interest rate cut weighs on the black gold.
- The Middle East geopolitical tension and higher China's crude oil imports boost WTI prices.
Western Texas Intermediate (WTI), the US crude oil benchmark, is trading around $84.25 on Wednesday. The black gold edges lower on the day as hawkish comments from Federal Reserve (Fed) Chairman Jerome Powell offset the escalating geopolitical tensions in the Middle East.
Investors place lower bets on the Fed rate cuts this year as the US economy remains robust and inflation is still elevated. The Fed Chair Jerome Powell said Tuesday that it will take "longer than expected" to achieve the confidence needed to bring inflation to the central bank’s 2% target. It's worth noting that the higher-for-longer US interest rate narrative may put some selling pressure on WTI prices since it translates to less demand for oil as the cost of holding crude oil rises.
Furthermore, Crude oil stockpiles in the United States for the week ending April 12 increased by 4.09 million barrels from a build of 3.03 million barrels in the previous week. The market consensus estimated that stocks would rise by about 600,000 barrels, according to the American Petroleum Institute on Tuesday.
The ongoing geopolitical tension in the Middle East continues to boost WTI prices. National Security Advisor Jake Sullivan said in a statement late Tuesday that new sanctions targeting Iran and sanctions against entities supporting the Islamic Revolutionary Guard Corps and Iran's Defense Ministry will be imposed in the coming days. In case of further escalation, $100 oil is possible, Citigroup analysts said.
Apart from this, China's crude oil imports reached a new high in 2023, jumping by 10% YoY and shattering the previous record set in 2020. This benefits black gold, as China is the world's largest crude oil importer.
- Gold price hovers close to record highs amid market caution ahead of Israel's response to Iran's assault.
- Israel's third meeting of the war cabinet, initially scheduled for Tuesday, was postponed until Wednesday.
- Gold demand may encounter hurdles as Fed Chair Powell emphasized that reaching the 2% inflation target will require more time than previously expected.
Gold price holds ground near $2,380 per troy ounce on Wednesday, hovering close to record highs as traders exercise caution ahead of Israel's response to Iran's air strike on Saturday. A Reuters report indicated that a third meeting of Israel's war cabinet, initially scheduled for Tuesday to decide on a reaction to Iran's unprecedented direct attack, was postponed until Wednesday.
Furthermore, sources cited by The Jerusalem Post disclosed that Israel has purportedly finalized plans for a counterstrike against Iran. US National Security Advisor Jake Sullivan announced late on Tuesday that new sanctions targeting Iran, alongside sanctions against entities supporting the Islamic Revolutionary Guard Corps and Iran's Defense Ministry, will be enforced in the coming days.
Meanwhile, Federal Reserve (Fed) Chairman Jerome Powell, speaking at the Wilson Center in Washington on Tuesday, tempered expectations for rate cuts. Powell noted that the US economy has shown significant strength and recent data indicates a lack of substantial progress on inflation this year. He emphasized that achieving the 2% inflation target will take "longer than expected." The prospect of higher interest rates typically reduces the appeal of non-yielding assets such as Gold.
According to the CME FedWatch Tool, the likelihood of interest rates remaining unchanged in the June meeting has risen to 84.8% from Monday’s 78.7%. Investors will closely monitor speeches from Federal Reserve officials this week, as well as Thursday's US Initial Jobless Claims, for further insight into the direction of monetary policy.
Following the conclusion of the fourth meeting of the Financial Working Group between China and the US in Washington on Wednesday, the Chinese Finance Ministry said that China expressed concern over the US economic and trade restrictions against China and made further responses on the issue of production capacity.
Meanwhile, the People’s Bank of China (PBOC) said that “both sides conducted professional, pragmatic, candid and constructive communication on monetary policy and financial stability, financial regulatory cooperation.”
Market reaction
Amidst a broad US Dollar retreat and an improvement in risk sentiment, AUD/USD is bouncing back to near 0.6420, up 0.30% on the day.
Australian Dollar FAQs
One of the most significant factors for the Australian Dollar (AUD) is the level of interest rates set by the Reserve Bank of Australia (RBA). Because Australia is a resource-rich country another key driver is the price of its biggest export, Iron Ore. The health of the Chinese economy, its largest trading partner, is a factor, as well as inflation in Australia, its growth rate and Trade Balance. Market sentiment – whether investors are taking on more risky assets (risk-on) or seeking safe-havens (risk-off) – is also a factor, with risk-on positive for AUD.
The Reserve Bank of Australia (RBA) influences the Australian Dollar (AUD) by setting the level of interest rates that Australian banks can lend to each other. This influences the level of interest rates in the economy as a whole. The main goal of the RBA is to maintain a stable inflation rate of 2-3% by adjusting interest rates up or down. Relatively high interest rates compared to other major central banks support the AUD, and the opposite for relatively low. The RBA can also use quantitative easing and tightening to influence credit conditions, with the former AUD-negative and the latter AUD-positive.
China is Australia’s largest trading partner so the health of the Chinese economy is a major influence on the value of the Australian Dollar (AUD). When the Chinese economy is doing well it purchases more raw materials, goods and services from Australia, lifting demand for the AUD, and pushing up its value. The opposite is the case when the Chinese economy is not growing as fast as expected. Positive or negative surprises in Chinese growth data, therefore, often have a direct impact on the Australian Dollar and its pairs.
Iron Ore is Australia’s largest export, accounting for $118 billion a year according to data from 2021, with China as its primary destination. The price of Iron Ore, therefore, can be a driver of the Australian Dollar. Generally, if the price of Iron Ore rises, AUD also goes up, as aggregate demand for the currency increases. The opposite is the case if the price of Iron Ore falls. Higher Iron Ore prices also tend to result in a greater likelihood of a positive Trade Balance for Australia, which is also positive of the AUD.
The Trade Balance, which is the difference between what a country earns from its exports versus what it pays for its imports, is another factor that can influence the value of the Australian Dollar. If Australia produces highly sought after exports, then its currency will gain in value purely from the surplus demand created from foreign buyers seeking to purchase its exports versus what it spends to purchase imports. Therefore, a positive net Trade Balance strengthens the AUD, with the opposite effect if the Trade Balance is negative.
The Reserve Bank of New Zealand (RBNZ) released its Sectoral Factor Model Inflation gauge for the first quarter of 2024 after the publication of the official Consumer Price Index (CPI) by the NZ Stats early Wednesday.
The inflation measure rose 4.3% YoY in Q1 2024 vs. 4.7% in Q4 2023.
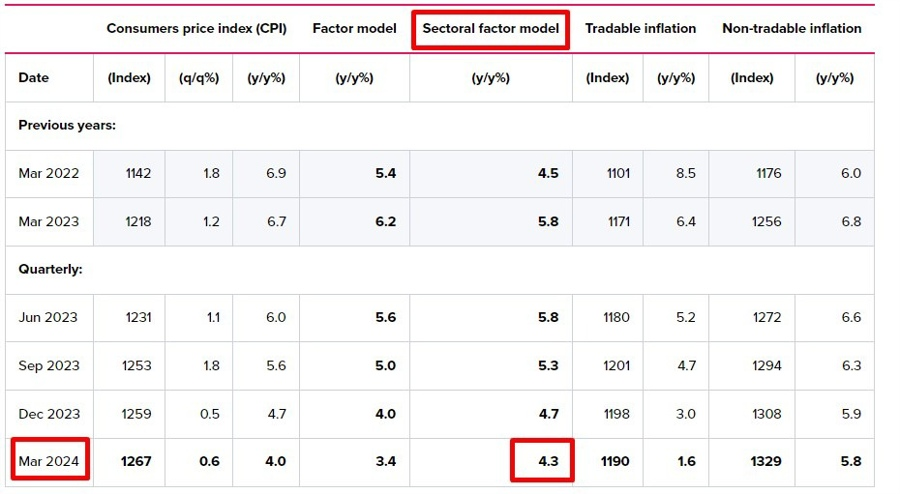
The inflation measures are closely watched by the RBNZ, which has a monetary policy goal of achieving 1% to 3% inflation.
FX implications
The Kiwi Dollar holds its bounce above 0.5900 after the RBNZ’s inflation data. At the time of writing, NZD/USD is adding 0.47% on the day to trade at 0.5906.
About the RBNZ Sectoral Factor Model Inflation
The Reserve Bank of New Zealand has a set of models that produce core inflation estimates. The sectoral factor model estimates a measure of core inflation based on co-movements - the extent to which individual price series move together. It takes a sectoral approach, estimating core inflation based on two sets of prices: prices of tradable items, which are those either imported or exposed to international competition, and prices of non-tradable items, which are those produced domestically and not facing competition from imports.
- USD/CAD retreats from a five-month high of 1.3846 reached on Tuesday.
- The decline in crude Oil prices might have contributed to undermining the Canadian Dollar.
- Fed Chair Powell highlighted that recent data indicates the timeframe for achieving the 2% inflation target will be longer than initially anticipated.
USD/CAD snaps its five-day winning streak, trading around 1.3820 during the Asian session on Wednesday. The mild correction in the US Dollar (USD) contributes to downward pressure on the USD/CAD pair. However, the weaker crude Oil prices could put pressure on the Canadian Dollar (CAD), consequently, limiting the losses of the pair.
The latest Canadian inflation figures provided support for the Bank of Canada (BoC) to consider easing borrowing conditions in its June meeting, as the closely monitored core inflation showed signs of sustained easing.
Consumer Price Index (CPI) increased by 0.6% month-over-month, slightly below the expected 0.7% in March but higher than the previous increase of 0.3%. CPI (YoY) rose by 2.9% against 2.8% prior. Meanwhile, Core CPI (YoY) rose by 2.0% at a slower pace compared to the previous 2.1% rise. The monthly Core index showed an increase of 0.5%, higher than the previous 0.1%.
On the other side, hawkish remarks from Federal Reserve (Fed) officials and the influx of safe-haven flows could bolster the US Dollar (USD) and potentially limit the downside of the USD/CAD pair. The US Dollar Index (DXY) pulls back from a five-month high of 106.51 reached on Tuesday. This decline could be attributed to a slight decline in US Treasury yields.
Federal Reserve (Fed) Chairman Jerome Powell remarked on Tuesday that the US economy has exhibited notable strength. However, Powell also noted that recent data suggests insufficient progress on inflation this year, and achieving the confidence that inflation will reach the 2% target will take "longer than expected." This hawkish stance by Powell might have lent some support to the US Dollar.
- NZD/USD pair holds positive ground around 0.5905 following New Zealand inflation data.
- The New Zealand CPI inflation rose to 0.6% QoQ in Q1 from 0.5% in the previous reading, as expected.
- Powell said recent data have not given Fed greater confidence, likely to take longer than expected to achieve its target.
The NZD/USD pair rebounds to 0.5905, bouncing off the yearly low of 0.5860 on Wednesday during the early Asian session. The expectation that the Reserve Bank of New Zealand is unlikely to lower its Official Cash Rate (OCR) soon lift the New Zealand Dollar (NZD) against the US Dollar (USD).
The annual rate of inflation in New Zealand has continued to fall, according to figures released by Stats NZ today. The Consumer Price Index (CPI) rose 4.0% YoY in the first quarter of 2024. Stats NZ’s consumer prices senior manager Nicola Growden said, "Price increases this quarter are the smallest since June 2021. However, they remain above the Reserve Bank of New Zealand’s target range of 1 to 3 percent,”
Inflationary pressures in New Zealand eased further in the March quarter, although domestic prices remained uncomfortably sticky, keeping rate cuts by the Reserve Bank of New Zealand unlikely to happen soon. This, in turn, provides some support to the NZD.
On the USD’s front, the hawkish comments from Federal Reserve (Fed) Jerome Powell might lift the US Dollar (USD) in the near term. Fed Chair Powell stated that the US economy has not seen inflation come back to the central bank’s target, suggesting that interest rate cuts are unlikely to be seen in the near future. Investors see a nearly 67% chance that the Fed will cut interest rates in September, according to the CME FedWatch Tool.
Furthermore, the safe-haven flows amid the rising geopolitical tensions in the Middle East might boost the Greenback and cap the upside of the NZD/USD pair. National Security Advisor Jake Sullivan said in a statement late Tuesday that new sanctions targeting Iran and sanctions against entities supporting the Islamic Revolutionary Guard Corps and Iran's Defense Ministry will be imposed in the coming days.
| Raw materials | Closed | Change, % |
|---|---|---|
| Silver | 28.059 | -2.85 |
| Gold | 2378.67 | -0.17 |
| Palladium | 1012.83 | -2.05 |
- The March UK CPI report will be released by the Office for National Statistics on Wednesday.
- United Kingdom’s headline and core annual inflation are set to ease in March.
- The UK CPI report could hint at the BoE’s interest rate cut, rocking the Pound Sterling.
The highly-anticipated United Kingdom’s (UK) Consumer Price Index (CPI) data will be published by the Office for National Statistics (ONS) at 06:00 GMT on Wednesday.
Pound Sterling could witness a big reaction to the UK CPI inflation report, as the data could prompt the Bank of England (BoE) to signal an interest rate cut earlier than the market expectations.
What to expect from the next UK inflation report?
The headline annual UK Consumer Price Index is set to rise 3.1% in March, slower than a 3.4% increase in February. The reading would remain at its lowest since September 2021 but still higher than the BoE’s 2.0% target.
The core CPI inflation is seen easing to 4.1% YoY in March from 4.5% in February, also reaching the lowest level in more than two years. Meanwhile, the British monthly CPI rose 0.6% in the previous month.
A main factor that could contribute to easing inflation is weaker growth in food prices.
The latest monitor from the British Retail Consortium (BRC) trade body and the market research firm NielsenIQ showed earlier this month that food inflation fell to 3.7% from 5.0%. Meanwhile, the UK shop prices rose at an annual rate of 1.3% in March, down from a rate of 2.5% in February, registering the slowest pace since December 2021.
Helen Dickinson, the chief executive of the BRC, explained the reason behind the fall in food price inflation by saying that “while Easter treats were more expensive than in previous years due to high global cocoa and sugar prices, retailers provided cracking deals on popular chocolates, which led to price falls compared to the previous month.”
“Dairy prices also fell on the month as farm gate prices eased, and retailers worked hard to lower prices for many essentials. In non-food, prices of electricals, clothing and footwear fell as retailers increased promotions to entice consumer spending,” she added.
Furthermore, Average Earnings excluding Bonus, a measure of wage inflation, rose 6.0% 3M YoY in February, slowing from January’s 6.1% growth.
However, economists expect services inflation to remain elevated at 5.8% YoY even though slowing from a 6.1% increase in February. This could hold the Bank of England (BoE) from signaling a policy pivot. Markets are pricing in the first BoE full quarter-point rate reduction by September. Money markets now wager a 49 basis points (bps) of easing in 2024.
The BoE delivered a dovish hold at its March policy meeting after two of the Bank’s most ardent hawks dropped their demands for hikes. BoE Monetary Policy Committee (MPC) members Catherine Mann and Jonathan Haskel joined an 8-1 majority to keep rates at a 16-year high of 5.25%.
Previewing the UK inflation data, analysts at TD Securities (TDS) noted that “headline inflation likely continued to slightly undershoot the MPC's forecast in March, though services should be in line at 5.8%.”
“Weak food and core goods inflation will exert further downside pressure on the print, while the early Easter adds some upside risk to services. Looking ahead, we continue to expect headline to be below target from April until the end of the year,” the TDS analysts said.
When will the UK Consumer Price Index report be released and how could it affect GBP/USD?
The UK docket will feature the CPI data on Wednesday at 06:00 GMT. The Pound Sterling is attempting a tepid recovery against the US Dollar heading into the inflation showdown. At the same time, the US Dollar Index consolidates near five-month highs, above 106.00.
A hotter-than-expected headline and core inflation data could help push back the market expectations of a September BoE rate cut, providing a fresh boost to the Pound Sterling rebound. In such a case, GBP/USD could see a sustained turnaround toward the 1.2600 level. On the other hand, GBP/USD could resume its downtrend toward 1.2375 if the UK CPI data show a notable cooling off in services inflation, suggesting that the BoE may not wait until September to announce a policy pivot.
Dhwani Mehta, Asian Session Lead Analyst at FXStreet, offers a brief technical outlook for the major and explains: “The GBP/USD pair closed below the static support of 1.2450 on Monday, reinforcing the bearish interests. The 14-day Relative Strength Index (RSI) stays vulnerable below the midline, near 32.0, suggesting that there is more room to the downside for the Pound Sterling.”
Dhwani adds: “A decisive break below the 1.2400 threshold could intensify the selling pressure, pushing GBP/USD toward the 1.2375 demand area. Around that level, the November 16 and 17 lows align. Further south, the 1.2300 round figure could be retested. On the other hand, any corrective upside will challenge the 1.2500 hurdle, above which a meaningful recovery toward the 200-day Simple Moving (SMA) at 1.2579 could be in the offing,” Dhwani adds.
Economic Indicator
Consumer Price Index (YoY)
The United Kingdom (UK) Consumer Price Index (CPI), released by the Office for National Statistics on a monthly basis, is a measure of consumer price inflation – the rate at which the prices of goods and services bought by households rise or fall – produced to international standards. It is the inflation measure used in the government’s target. The YoY reading compares prices in the reference month to a year earlier. Generally, a high reading is seen as bullish for the Pound Sterling (GBP), while a low reading is seen as bearish.
Read more.Next release: Wed Apr 17, 2024 06:00
Frequency: Monthly
Consensus: 3.1%
Previous: 3.4%
Source: Office for National Statistics
The Bank of England is tasked with keeping inflation, as measured by the headline Consumer Price Index (CPI) at around 2%, giving the monthly release its importance. An increase in inflation implies a quicker and sooner increase of interest rates or the reduction of bond-buying by the BOE, which means squeezing the supply of pounds. Conversely, a drop in the pace of price rises indicates looser monetary policy. A higher-than-expected result tends to be GBP bullish.
Inflation FAQs
Inflation measures the rise in the price of a representative basket of goods and services. Headline inflation is usually expressed as a percentage change on a month-on-month (MoM) and year-on-year (YoY) basis. Core inflation excludes more volatile elements such as food and fuel which can fluctuate because of geopolitical and seasonal factors. Core inflation is the figure economists focus on and is the level targeted by central banks, which are mandated to keep inflation at a manageable level, usually around 2%.
The Consumer Price Index (CPI) measures the change in prices of a basket of goods and services over a period of time. It is usually expressed as a percentage change on a month-on-month (MoM) and year-on-year (YoY) basis. Core CPI is the figure targeted by central banks as it excludes volatile food and fuel inputs. When Core CPI rises above 2% it usually results in higher interest rates and vice versa when it falls below 2%. Since higher interest rates are positive for a currency, higher inflation usually results in a stronger currency. The opposite is true when inflation falls.
Although it may seem counter-intuitive, high inflation in a country pushes up the value of its currency and vice versa for lower inflation. This is because the central bank will normally raise interest rates to combat the higher inflation, which attract more global capital inflows from investors looking for a lucrative place to park their money.
Formerly, Gold was the asset investors turned to in times of high inflation because it preserved its value, and whilst investors will often still buy Gold for its safe-haven properties in times of extreme market turmoil, this is not the case most of the time. This is because when inflation is high, central banks will put up interest rates to combat it. Higher interest rates are negative for Gold because they increase the opportunity-cost of holding Gold vis-a-vis an interest-bearing asset or placing the money in a cash deposit account. On the flipside, lower inflation tends to be positive for Gold as it brings interest rates down, making the bright metal a more viable investment alternative.
- Australian Dollar recovers recent losses on improved market sentiment on Wednesday.
- Australian labor data for March are scheduled to be released on Thursday.
- US Dollar Index (DXY) maintains its position close to a five-month high of 106.51.
The Australian Dollar (AUD) ends its three-day decline on Wednesday, bouncing back from levels not seen since mid-November. Nevertheless, hawkish remarks from Federal Reserve (Fed) officials and the influx of safe-haven flows could bolster the US Dollar (USD) and potentially limit the upside of AUD/USD in the short term.
The Australian Dollar gains upward momentum as the ASX 200 Index rebounds after three consecutive days of losses. However, AUD encountered obstacles, possibly due to risk aversion as investors awaited Israel's response to Iran's air strike on Saturday with caution. A Reuters report indicated that a third meeting of Israel's war cabinet, scheduled for Tuesday to determine a reaction to Iran's unprecedented direct attack, was postponed until Wednesday. Meanwhile, Western allies are considering swift imposition of new sanctions against Tehran to dissuade Israel from escalating the situation further.
The US Dollar Index (DXY) remains close to a five-month high of 106.51, despite slight declines in US Treasury yields. Fed Chairman Jerome Powell's remarks on Tuesday, stating that recent data suggests little progress on inflation this year and that it will take longer than anticipated to reach the 2% target, may have contributed to a hawkish stance and provided some backing to the US Dollar.
Daily Digest Market Movers: Australian Dollar recovers losses on improved sentiment
- Westpac Leading Index declined by 0.1% month-over-month in March, as compared to February’s increase of 0.8%.
- Australian Employment Change and Unemployment Rate for March are scheduled to be released on Thursday.
- China’s Gross Domestic Product (GDP) rose by 1.6% QoQ in the first quarter of 2024, against the previous quarter’s increase of 1.0%. GDP year-over-year rose by 5.3%, exceeding the expected 5.0% and 5.2% prior.
- China’s Industrial Production (YoY) increased by 4.5% in March, against the market expectations of 5.4% and 7.0% prior.
- Late on Tuesday, US National Security Advisor Jake Sullivan announced that new sanctions targeting Iran, along with sanctions against entities supporting the Islamic Revolutionary Guard Corps and Iran's Defense Ministry, will be implemented in the coming days.
- Federal Reserve (Fed) Bank of San Francisco President Mary Daly has emphasized that although there has been significant progress regarding inflation, there is still more to be done. She stressed the necessity of being assured that inflation is heading towards the target before making any decisions.
- According to the CME FedWatch Tool, the likelihood of interest rates remaining unchanged in the June meeting has been increased to 84.8% from Monday’s 78.7%.
- US Building Permits (MoM) fell to 1.458 million in March, compared to the expected 1.514 million and 1.523 million prior. Housing Starts declined to 1.321 million MoM from 1.549 million, falling short of the expected 1.480 million.
- US Retail Sales (MoM) increased by 0.7% in March, exceeding the market expectations of 0.3%. The previous reading was revised to 0.9% from 0.6% in February.
Technical Analysis: Australian Dollar holds ground above the support level of 0.6400
The Australian Dollar trades around 0.6420 on Wednesday. The 14-day Relative Strength Index (RSI) indicates a bearish sentiment for the AUD/USD pair as it sits below the 50 level. Key resistance for the pair could be encountered at the 23.6% Fibonacci retracement level of 0.6449, coinciding with the significant level of 0.6450. A breach above the latter could bolster the pair's momentum towards testing the nine-day Exponential Moving Average (EMA) at 0.6480, and subsequently, the psychological barrier of 0.6500. On the downside, notable support is observed at the psychological level of 0.6400. A breach below this level may intensify downward pressure on the AUD/USD pair, potentially leading it toward the major support level at 0.6350, followed by November's low at 0.6318.
AUD/USD: Daily Chart
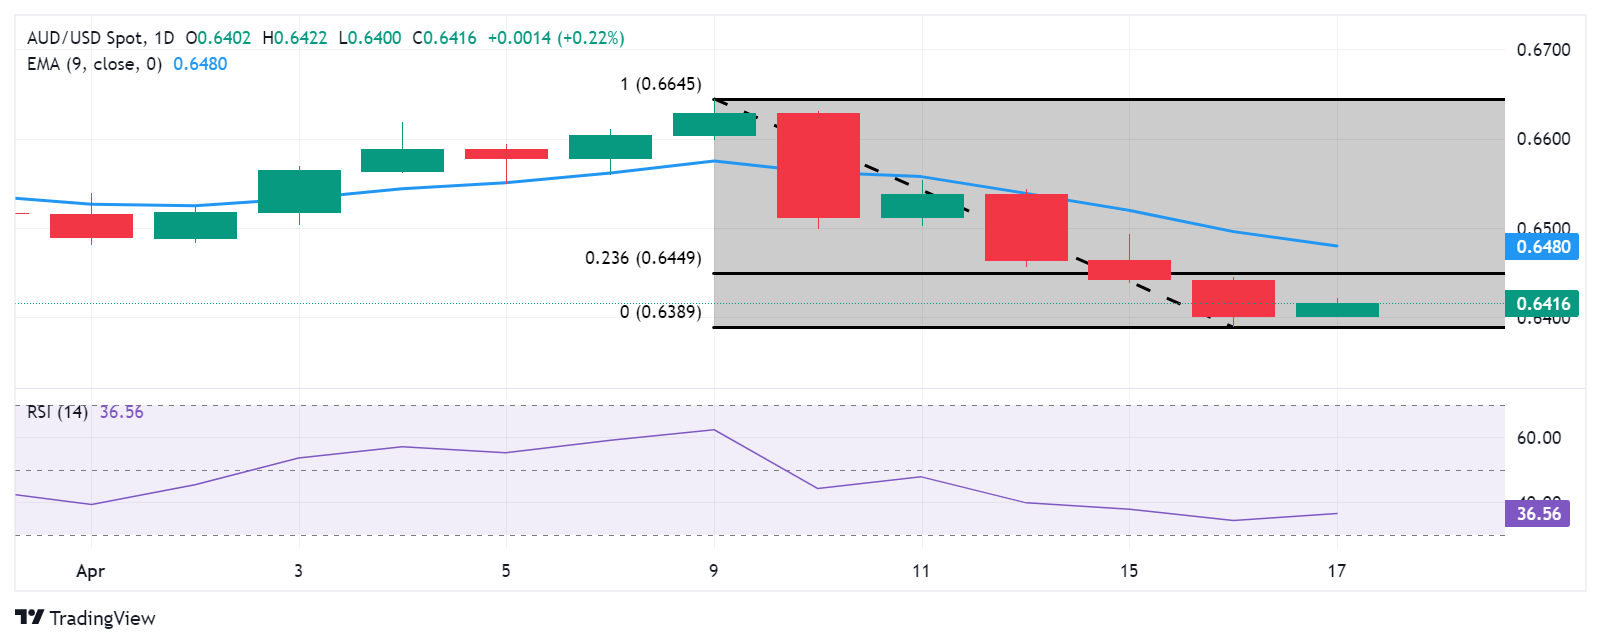
Australian Dollar price today
The table below shows the percentage change of Australian Dollar (AUD) against listed major currencies today. Australian Dollar was the strongest against the Pound Sterling.
| USD | EUR | GBP | CAD | AUD | JPY | NZD | CHF | |
| USD | -0.03% | 0.00% | 0.00% | -0.04% | -0.01% | -0.14% | -0.01% | |
| EUR | 0.04% | 0.04% | 0.04% | 0.00% | 0.01% | -0.12% | 0.02% | |
| GBP | -0.01% | -0.05% | -0.01% | -0.04% | -0.03% | -0.16% | -0.03% | |
| CAD | 0.00% | -0.03% | 0.01% | -0.04% | -0.02% | -0.16% | -0.02% | |
| AUD | 0.04% | 0.02% | 0.06% | 0.05% | 0.02% | -0.10% | 0.04% | |
| JPY | 0.01% | -0.02% | 0.02% | 0.02% | -0.05% | -0.14% | 0.01% | |
| NZD | 0.16% | 0.12% | 0.17% | 0.14% | 0.11% | 0.12% | 0.14% | |
| CHF | 0.02% | -0.02% | 0.03% | 0.01% | -0.04% | -0.01% | -0.16% |
The heat map shows percentage changes of major currencies against each other. The base currency is picked from the left column, while the quote currency is picked from the top row. For example, if you pick the Euro from the left column and move along the horizontal line to the Japanese Yen, the percentage change displayed in the box will represent EUR (base)/JPY (quote).
Australian Dollar FAQs
One of the most significant factors for the Australian Dollar (AUD) is the level of interest rates set by the Reserve Bank of Australia (RBA). Because Australia is a resource-rich country another key driver is the price of its biggest export, Iron Ore. The health of the Chinese economy, its largest trading partner, is a factor, as well as inflation in Australia, its growth rate, and Trade Balance. Market sentiment – whether investors are taking on more risky assets (risk-on) or seeking safe havens (risk-off) – is also a factor, with risk-on positive for AUD.
The Reserve Bank of Australia (RBA) influences the Australian Dollar (AUD) by setting the level of interest rates that Australian banks can lend to each other. This influences the level of interest rates in the economy as a whole. The main goal of the RBA is to maintain a stable inflation rate of 2-3% by adjusting interest rates up or down. Relatively high interest rates compared to other major central banks support the AUD, and the opposite for relatively low. The RBA can also use quantitative easing and tightening to influence credit conditions, with the former AUD-negative and the latter AUD-positive.
China is Australia’s largest trading partner so the health of the Chinese economy is a major influence on the value of the Australian Dollar (AUD). When the Chinese economy is doing well it purchases more raw materials, goods and services from Australia, lifting demand for the AUD, and pushing up its value. The opposite is the case when the Chinese economy is not growing as fast as expected. Positive or negative surprises in Chinese growth data, therefore, often have a direct impact on the Australian Dollar and its pairs.
Iron Ore is Australia’s largest export, accounting for $118 billion a year according to data from 2021, with China as its primary destination. The price of Iron Ore, therefore, can be a driver of the Australian Dollar. Generally, if the price of Iron Ore rises, AUD also goes up, as aggregate demand for the currency increases. The opposite is the case if the price of Iron Ore falls. Higher Iron Ore prices also tend to result in a greater likelihood of a positive Trade Balance for Australia, which is also positive of the AUD.
The Trade Balance, which is the difference between what a country earns from its exports versus what it pays for its imports, is another factor that can influence the value of the Australian Dollar. If Australia produces highly sought after exports, then its currency will gain in value purely from the surplus demand created from foreign buyers seeking to purchase its exports versus what it spends to purchase imports. Therefore, a positive net Trade Balance strengthens the AUD, with the opposite effect if the Trade Balance is negative.
- USD/JPY snaps the two-day winning streak around 154.65 in Wednesday’s early Asian session.
- Fed’s Powell emphasized that the current level of policy will likely stay in place until inflation gets closer to target.
- BoJ is shifting to a more discretionary policy-setting approach, with less focus on inflation.
The USD/JPY pair trades with mild losses near 154.65 on Wednesday during the early Asian trading hours. The robust US economy and sticky inflation data have triggered the expectation that the Federal Reserve (Fed) might delay the easing cycle to September from June, which provides some support to the US Dollar (USD) against the Japanese Yen (JPY). However, the escalating tensions in the Middle East might boost safe-haven assets like JPY and cap the pair’s upside.
Data released by the US Census Bureau showed on Tuesday that US Housing Starts fell 14.7% in March from a 12.7% increase in February (revised from 10.7%). The Building Permits declined 4.3% from a 2.3% rise (revised from 1.9%) in the previous reading. Industrial Production came in line with market expectation, rising 0.4% MoM in March from the 0.4% increase in February.
Several Fed officials, including Chairman Jerome Powell, emphasized the data-dependent stance of policy and have not committed to beginning the interest rate cuts. Fed Chair Jerome Powell said the US central bank has not seen inflation come back to the 2% target, indicating that interest rate cuts are unlikely anytime soon.
On the other hand, the Bank of Japan (BoJ) is shifting to a more discretionary approach in setting policy, with less emphasis on inflation. This, in turn, continues to weigh on the JPY and create a tailwind for the USD/JPY pair. Investors will take more cues from the BOJ's fresh quarterly growth and price projections due at its April 25–26 policy meeting, for fresh impetus.
Meanwhile, the geopolitical tensions in the Middle East might lift the JPY and limit the upside of the USD/JPY pair. Late Tuesday, National Security Advisor Jake Sullivan said in a statement that new sanctions targeting Iran and sanctions against entities supporting the Islamic Revolutionary Guard Corps and Iran's Defense Ministry will be imposed in the coming days. Sullivan stated that the White House will not hesitate to continue to take action against the Iranian government. Tensions between Israel and Iran escalated after an attack on the Iranian embassy in Syria earlier this month, which killed two senior Iranian Revolutionary Guard Corps leaders. Iran blamed Israel for the attack, but Israel did not claim responsibility.
The People’s Bank of China (PBoC) set the USD/CNY central rate for the trading session ahead on Tuesday at 7.1025 as compared to the previous day's of 7.1028 and 7.2404 Reuters estimates.
- EUR/USD remains on the defensive around 1.0615 in Wednesday’s early Asian session.
- Fed’s Powell said it's appropriate to allow restrictive policy to continue to work, given the strength of the labor market.
- ECB’s Lagarde noted the central bank remains on course to cut rates in the near term, subject to any major shocks.
The EUR/USD pair extends its downside near 1.0620, bouncing off the Year-To-Date (YTD) low of 1.0600 during the early Asian session on Wednesday. However, the hawkish comments from the Federal Reserve (Fed) officials and the safe-haven flows might boost the US Dollar (USD) and cap the upside of EUR/USD in the near term.
On Tuesday, Fed Chairman Jerome Powell said that the US economy's performance has been quite robust. Powell further stated that recent data indicates a lack of significant progress on inflation this year and it will take "longer than expected" to achieve the confidence that inflation will get down to the 2% target. A hawkish tilt by Fed’s Powell provides some support to the Greenback and drags the EUR/USD pair lower.
About the data, Housing Starts in the US fell 14.7% in March to 1.32 million units from the previous reading of a 12.7% increase (revised from 10.7%). The US Building Permits dropped 4.3% from a rising 2.3% (revised from 1.9%) in February. Finally, Industrial Production rose 0.4% MoM in March, compared to the 0.4% increase recorded in February, in line with market expectation.
Across the pond, there is growing speculation that the European Central Bank (ECB) will start lowering interest rates in June due to a weak Eurozone economic outlook and cooling core inflationary pressures. ECB President Christine Lagarde said on Tuesday that the central bank remains on course to cut interest rates in the near term, subject to any major shocks. Lagarde added that the ECB will closely monitor oil prices amid the rising tensions in the Middle East. Later on Wednesday, the Eurozone Harmonized Index of Consumer Prices (HICP) for March will be due. Also, the ECB’s Cipollone, Schnabel and President Lagarde are set to speak.
| Index | Change, points | Closed | Change, % |
|---|---|---|---|
| NIKKEI 225 | -761.6 | 38471.2 | -1.94 |
| Hang Seng | -351.49 | 16248.97 | -2.12 |
| KOSPI | -60.8 | 2609.63 | -2.28 |
| ASX 200 | -140 | 7612.5 | -1.81 |
| DAX | -260.35 | 17766.23 | -1.44 |
| CAC 40 | -112.5 | 7932.61 | -1.4 |
| Dow Jones | 63.86 | 37798.97 | 0.17 |
| S&P 500 | -10.41 | 5051.41 | -0.21 |
| NASDAQ Composite | -19.77 | 15865.25 | -0.12 |
| Pare | Closed | Change, % |
|---|---|---|
| AUDUSD | 0.63996 | -0.66 |
| EURJPY | 164.179 | 0.23 |
| EURUSD | 1.06161 | -0.1 |
| GBPJPY | 192.194 | 0.17 |
| GBPUSD | 1.24252 | -0.17 |
| NZDUSD | 0.58787 | -0.43 |
| USDCAD | 1.38264 | 0.3 |
| USDCHF | 0.91242 | 0.09 |
| USDJPY | 154.668 | 0.34 |


© 2000-2026. All rights reserved.
This site is managed by Teletrade D.J. LLC 2351 LLC 2022 (Euro House, Richmond Hill Road, Kingstown, VC0100, St. Vincent and the Grenadines).
The information on this website is for informational purposes only and does not constitute any investment advice.
The company does not serve or provide services to customers who are residents of the US, Canada, Iran, The Democratic People's Republic of Korea, Yemen and FATF blacklisted countries.
Making transactions on financial markets with marginal financial instruments opens up wide possibilities and allows investors who are willing to take risks to earn high profits, carrying a potentially high risk of losses at the same time. Therefore you should responsibly approach the issue of choosing the appropriate investment strategy, taking the available resources into account, before starting trading.
Use of the information: full or partial use of materials from this website must always be referenced to TeleTrade as the source of information. Use of the materials on the Internet must be accompanied by a hyperlink to teletrade.org. Automatic import of materials and information from this website is prohibited.
Please contact our PR department if you have any questions or need assistance at pr@teletrade.global.
transfers