- Analytics
- News and Tools
- Market News
CFD Markets News and Forecasts — 16-04-2024
National Security Advisor Jake Sullivan said in a statement late Tuesday that new sanctions targeting Iran and sanctions against entities supporting the Islamic Revolutionary Guard Corps and Iran's Defense Ministry will be imposed in the coming days. It is expected that US allies and partners will soon follow with their sanctions, according to the statement.
Sullivan further stated that these new sanctions and other measures will "continue a steady drumbeat of pressure" to contain and degrade Iran's military capacity and effectiveness and confront the full range of its problematic behaviors.
Market reaction
Gold price attracts some buyers following the renewed tension between Israel and Iran. XAU/USD was trading 0.08% higher on the day at $2,384, as of writing.
Gold FAQs
Gold has played a key role in human’s history as it has been widely used as a store of value and medium of exchange. Currently, apart from its shine and usage for jewelry, the precious metal is widely seen as a safe-haven asset, meaning that it is considered a good investment during turbulent times. Gold is also widely seen as a hedge against inflation and against depreciating currencies as it doesn’t rely on any specific issuer or government.
Central banks are the biggest Gold holders. In their aim to support their currencies in turbulent times, central banks tend to diversify their reserves and buy Gold to improve the perceived strength of the economy and the currency. High Gold reserves can be a source of trust for a country’s solvency. Central banks added 1,136 tonnes of Gold worth around $70 billion to their reserves in 2022, according to data from the World Gold Council. This is the highest yearly purchase since records began. Central banks from emerging economies such as China, India and Turkey are quickly increasing their Gold reserves.
Gold has an inverse correlation with the US Dollar and US Treasuries, which are both major reserve and safe-haven assets. When the Dollar depreciates, Gold tends to rise, enabling investors and central banks to diversify their assets in turbulent times. Gold is also inversely correlated with risk assets. A rally in the stock market tends to weaken Gold price, while sell-offs in riskier markets tend to favor the precious metal.
The price can move due to a wide range of factors. Geopolitical instability or fears of a deep recession can quickly make Gold price escalate due to its safe-haven status. As a yield-less asset, Gold tends to rise with lower interest rates, while higher cost of money usually weighs down on the yellow metal. Still, most moves depend on how the US Dollar (USD) behaves as the asset is priced in dollars (XAU/USD). A strong Dollar tends to keep the price of Gold controlled, whereas a weaker Dollar is likely to push Gold prices up.
- GBP/USD attracts some sellers to 1.2430 on the stronger USD.
- Fed’s Powell said the US monetary policy needs to be restrictive for longer.
- BoE’s Bailey saw strong evidence that UK inflation was falling.
The GBP/USD pair remains on the defensive around 1.2430 during the early Asian session on Wednesday. The further upside in the US Dollar (USD) from a hawkish tilt by Federal Reserve (Fed) Chair Jerome Powell and upbeat US Retail Sales data weighs on the GBP/USD pair. Investors will take more cues from the UK Consumer Price Index (CPI) on Wednesday.
The Fed Chair Jerome Powell said on Tuesday that monetary policy needs to be restrictive for longer and further dampen investors' hopes for meaningful rate cuts this year. Powell added that the recent economic data have clearly not given the Fed greater confidence and it's likely to take longer than expected to achieve that confidence. The US central bank has kept its benchmark interest rate in a target range between 5.25% and 5.5% since July 2023. Financial markets have had to reset their expectations for rate cuts this year, with the anticipation of one or two reductions that will not start until September.
On the other hand, investors price in two rate cuts by the Bank of England (BoE) this year, with the first move in August or September and earlier rate cuts than the Fed. This, in turn, has exerted some selling pressure on the Pound Sterling (GBP) and created a headwind for the GBP/USD pair.
The BoE Governor Andrew Bailey said on Tuesday there was strong evidence that UK inflation was falling and that the question for BoE policymakers remained how much more evidence was necessary before starting to cut interest rates. Bailey further stated that different inflation paths for the US and Europe this year could lead to somewhat different paths for interest rates.
Inflation in New Zealand, as measured by the change in the Consumer Price Index (CPI), rose to 0.6% QoQ in the first quarter (Q1) of 2024 from 0.5% in the previous reading, Statistics New Zealand reported on Wednesday. The figure was above the market consensus of 0.6%.
Annualized CPI inflation in New Zealand came in at 3.7% YoY compared to the previous period's 4.7%.
Market reaction to New Zealand CPI data
The New Zealand Dollar (NZD) edged higher with the immediate reaction. The NZD/USD pair was last seen rising 0.32% on the day at 0.5898.
New Zealand Dollar FAQs
The New Zealand Dollar (NZD), also known as the Kiwi, is a well-known traded currency among investors. Its value is broadly determined by the health of the New Zealand economy and the country’s central bank policy. Still, there are some unique particularities that also can make NZD move. The performance of the Chinese economy tends to move the Kiwi because China is New Zealand’s biggest trading partner. Bad news for the Chinese economy likely means less New Zealand exports to the country, hitting the economy and thus its currency. Another factor moving NZD is dairy prices as the dairy industry is New Zealand’s main export. High dairy prices boost export income, contributing positively to the economy and thus to the NZD.
The Reserve Bank of New Zealand (RBNZ) aims to achieve and maintain an inflation rate between 1% and 3% over the medium term, with a focus to keep it near the 2% mid-point. To this end, the bank sets an appropriate level of interest rates. When inflation is too high, the RBNZ will increase interest rates to cool the economy, but the move will also make bond yields higher, increasing investors’ appeal to invest in the country and thus boosting NZD. On the contrary, lower interest rates tend to weaken NZD. The so-called rate differential, or how rates in New Zealand are or are expected to be compared to the ones set by the US Federal Reserve, can also play a key role in moving the NZD/USD pair.
Macroeconomic data releases in New Zealand are key to assess the state of the economy and can impact the New Zealand Dollar’s (NZD) valuation. A strong economy, based on high economic growth, low unemployment and high confidence is good for NZD. High economic growth attracts foreign investment and may encourage the Reserve Bank of New Zealand to increase interest rates, if this economic strength comes together with elevated inflation. Conversely, if economic data is weak, NZD is likely to depreciate.
The New Zealand Dollar (NZD) tends to strengthen during risk-on periods, or when investors perceive that broader market risks are low and are optimistic about growth. This tends to lead to a more favorable outlook for commodities and so-called ‘commodity currencies’ such as the Kiwi. Conversely, NZD tends to weaken at times of market turbulence or economic uncertainty as investors tend to sell higher-risk assets and flee to the more-stable safe havens.
- The USD strengthened, propelled by rising US Treasury yields and speculation of a Fed's delaying cuts.
- Escalating geopolitical tensions in the Middle East also drive demand for the Greenback.
- Fed's Powell commented that inflation is showing a lack of progress.
- Soft housing market from the US data failed to trigger a reaction on the pair.
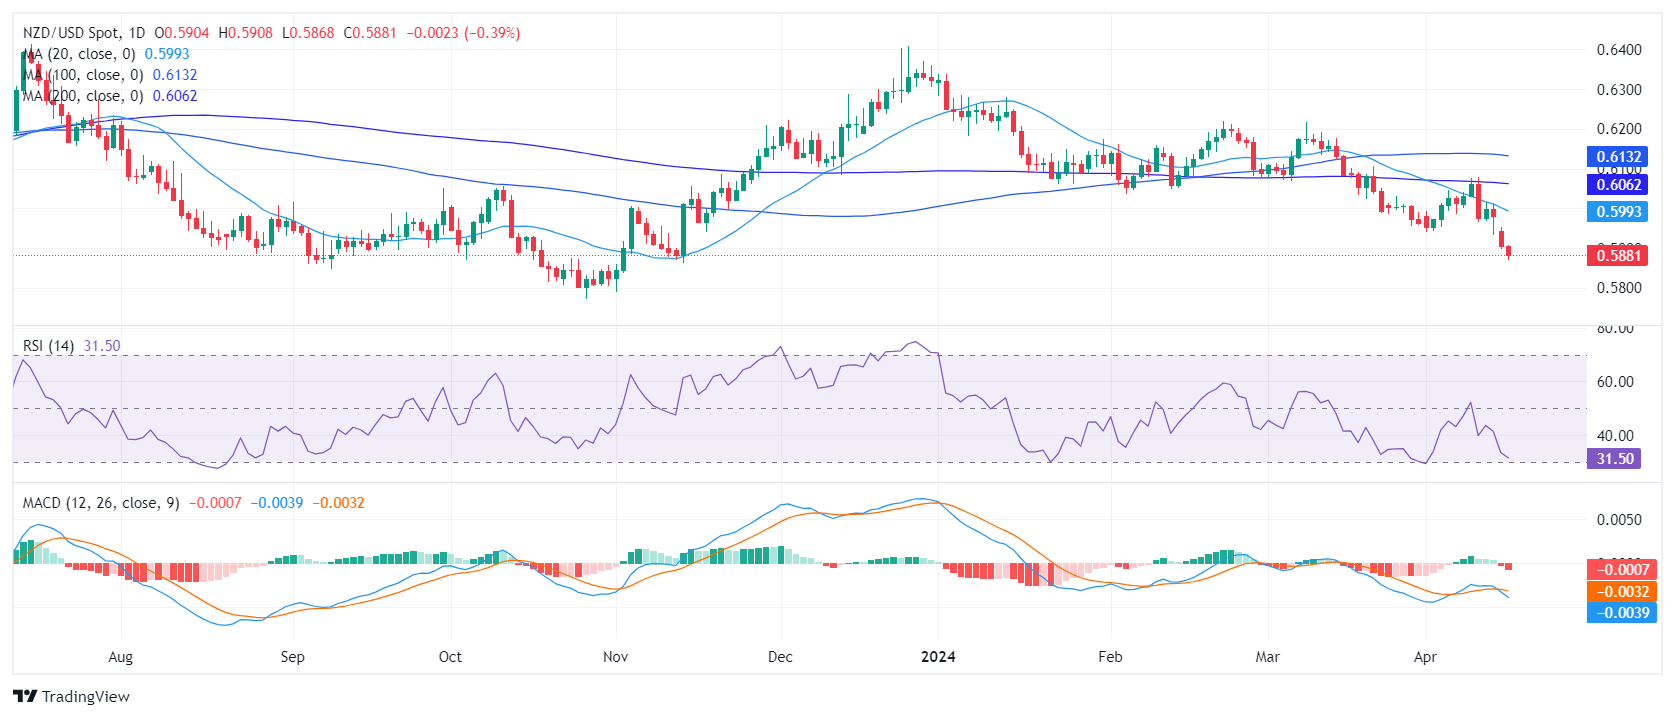
The NZD/USD declined towards 0.5879 on Tuesday reflecting a loss of 0.46%, despite. The pair's movements are largely influenced by the market’s adjustments of their expectations and the delay of a rate cut by the Federal Reserve (Fed) by year-end. Rising Treasury yields are also applying downward pressure on the pair.
On the data front, in March, Building Permits experienced a decline of 4.3%, dropping to 1.458 million, below both projected and February's figures. Housing starts also saw a significant drop of 14.7%, falling short of expectations at 1.321 million. However, industrial production for the same month rose by 0.4%, meeting expectations.
What drives the pair downwards is markets now betting on a more aggressive Fed. Following strong US data, market sentiment adjusted with expectations of an initial rate cut in September, and a 70% probability for a second cut in December. Expectations for a June rate cut have decreased to 25% from 60% the previous week. In addition, on Tuesday, Jerome Powell hinted that he sees no progress on inflation and that he considered that the monetary policy may need some additional time to work. The readjustments in expectations are also propelling US Treasury yields which also benefits the USD over the NZD.
NZD/USD technical analysis
Based on the indicators of the daily chart, the NZD/USD pair is exhibiting negative momentum. The Relative Strength Index (RSI) stands at 33.18, indicating a negative trend and nearing the oversold territory. Additionally, the Moving Average Convergence Divergence (MACD) histogram is exhibiting rising red bars, confirming the negative momentum and suggesting that sellers currently dominate the market.
On the broader outlook, the NZD/USD also shows a negative trend as it trades below its 20, 100, and 200-day Simple Moving Averages (SMA). Unless buyers make a move above these levels, the bears will remain comfortable and dictate the pace of the pair.
NZD/USD daily chart
- Silver retreats to $28.09, unable to hold above the crucial $29 mark, indicating potential further declines.
- The 'dark cloud cover' technical pattern suggests vulnerability and possible downward movement.
- Focus remains on silver's ability to sustain above the $28.00 threshold, with key support and resistance levels closely watched.
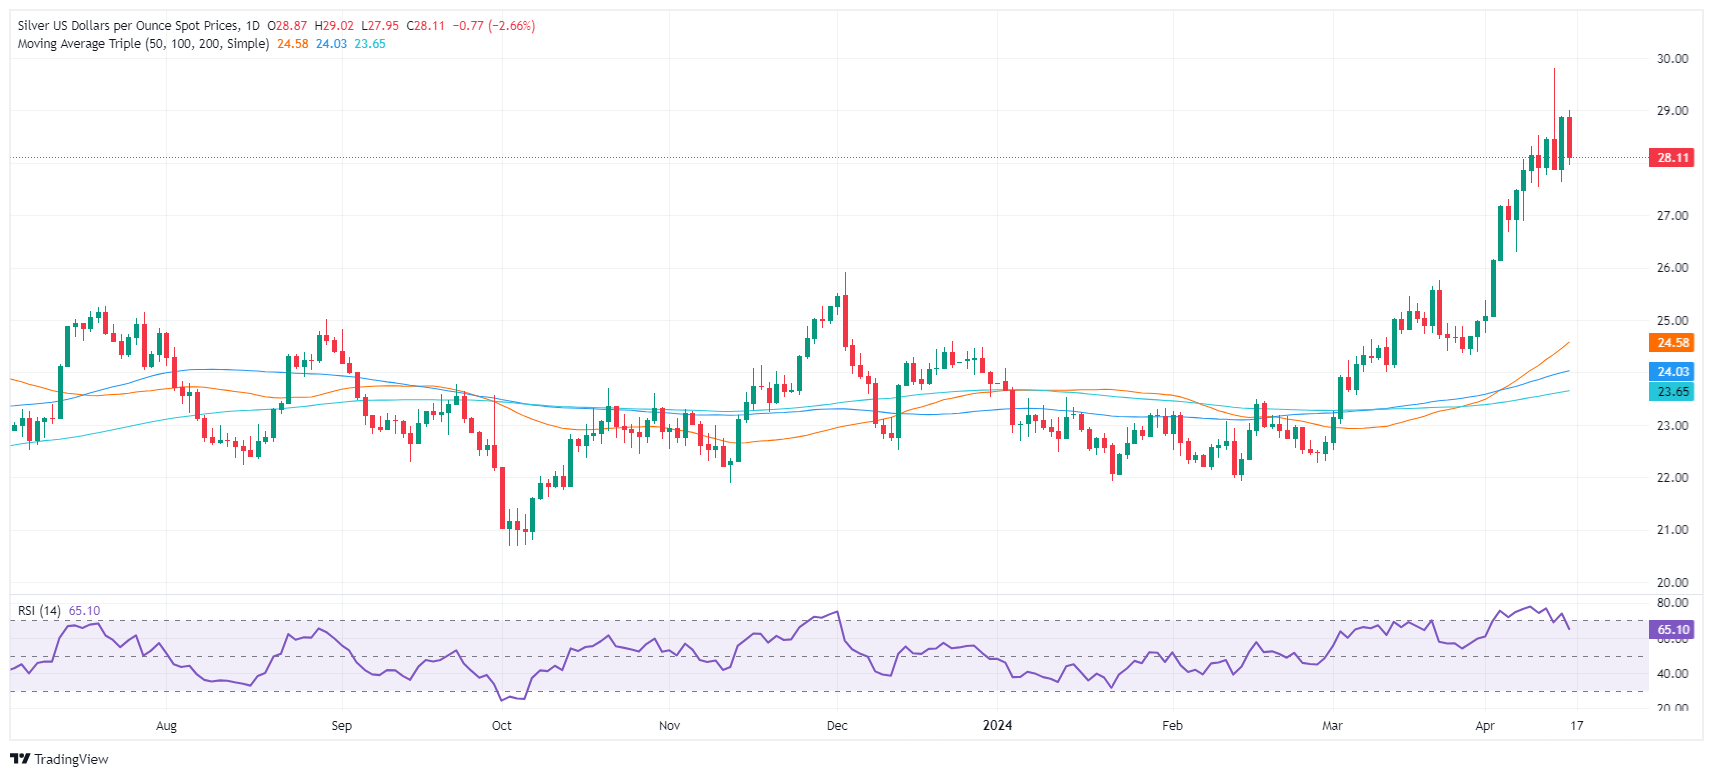
Silver prices retreat from daily highs reached $29.01, dropping 2.63%, affected by high US Treasury yields, and stirring resistance around the $29.00 threshold. The XAG/USD trades at $28.09, breaking key support levels on its way toward current spot prices.
XAG/USD Price Analysis: Technical outlook
From a technical standpoint, XAG/USD buyers failed to hold Siver’s quote above the psychological $29.00 level after reaching a year-to-date (YTD) high of $29.79. That exacerbated the grey’s metal drop toward the $28.00 mark, opening the door for further downside. During the last couple of days, price action formed a ‘dark cloud cover’ that needs confirmation below the April 15 low of $27.59.
Momentum was extremely bullish, though the Relative Strength Index (RSI) exited from overbought conditions during the day, sponsoring a leg-down on Silver. That said, XAG/USD could witness a pullback before buyers attempt to challenge the $29.00 mark.
Given the backdrop, Siver’s first support would be $27.59, followed by the $27.00 mark. Further losses are seen at $26.29, the April 5 low. On the flip side, if buyers keep the XAG/USD spot price above $28.00, the next resistance levels are seen at the June 10, 2021, high at $28.28, followed by the May 18, 2021 high at $28.74.
XAG/USD Price Action – Daily Chart
- The daily RSI reveals that market momentum is currently dominated by sellers.
- The daily MACD presents flat green bars, indicating a lack of buying traction.
- In the hourly chart, the RSI shows slight improvement, suggesting sellers losing some ground.
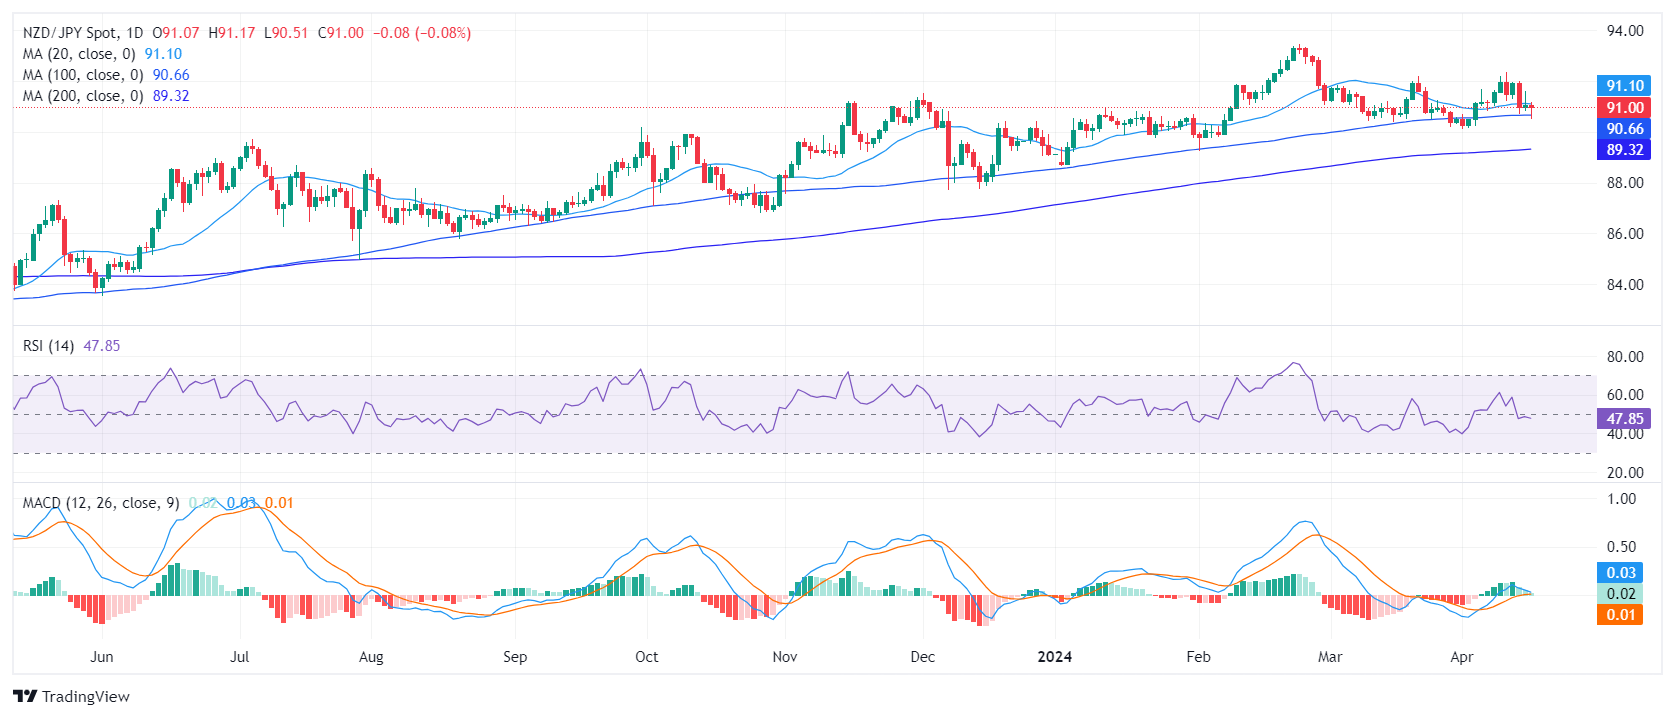
The NZD/JPY stabilized at around 90.94 and managed to clear most of its daily losses. However, in the shorter time frames, there are signs of a bullish recovery.
The daily Relative Strength Index (RSI) hovers in the negative territory. The most recent reading fell to 48, reflecting a market momentum currently dominated by sellers. Furthermore, the Moving Average Convergence Divergence (MACD) histogram prints flat green bars, indicating a lack of positive momentum.
NZD/JPY daily chart
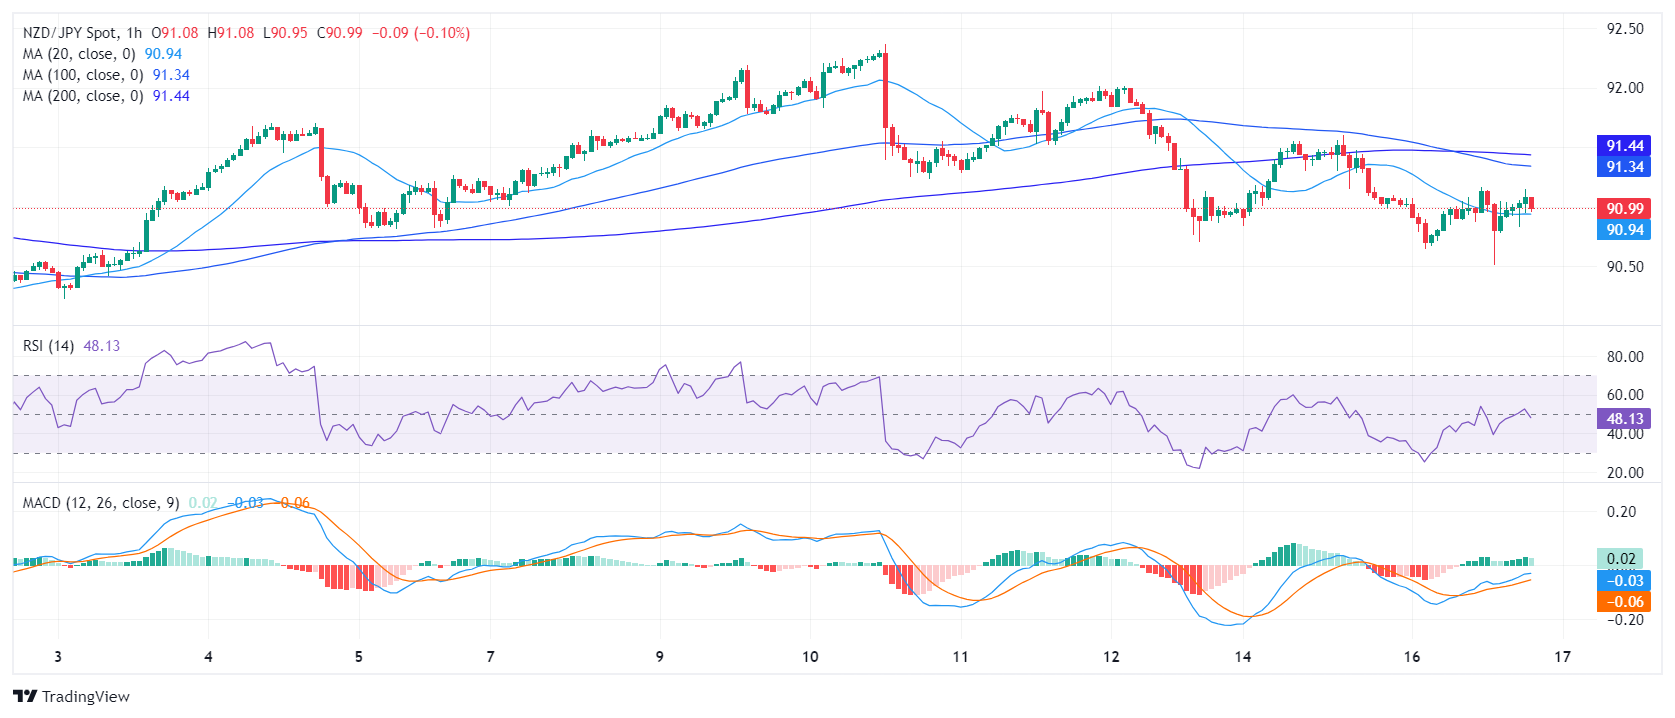
Transitioning to the hourly chart, the RSI seems to confirm the tepid sentiment observed on the daily chart. The most recent reading also lands in the 48 range. Nevertheless, signs of slight improvement towards the positive territory appear in the RSI and the latest session reading climbed from a preceding low of 41. Moreover, the MACD histogram on the hourly chart prints green bars, suggesting a possible pick-up in positive momentum.
NZD/JPY hourly chart
The broader outlook, on the other hand, suggests that the bulls control the overall trend, but as long as the buyers fail to reclaim the 20-day Simple Moving Average (SMA), the short-term outlook will remain tilted in favor of the buyers.
- Gold climbs, reacting to Fed Chair Powell's hawkish comments and mixed US data.
- Tensions in the Middle East escalate, influencing Gold's status as a safe-haven asset.
- Market expectations reduce the likelihood of multiple Fed rate cuts this year.
Gold prices edged higher late in Tuesday’s North American session, gaining 0.22% following a hawkish tilt by Federal Reserve Chair Jerome Powell. Economic data from the United States (US) was mixed, though Monday’s Retail Sales report and Powell’s remarks kept US Treasury yields higher, capping the yellow metal’s advance.
XAU/USD trades at $2,388 after hitting a daily low of $2,363. Risk appetite has deteriorated amid the heightened tensions in the Middle East. Following Iran’s attack on Israel over the weekend, the latter is set to retaliate even though the White House warned that it would not participate.
Given the backdrop, Gold is set to continue advancing, if not because Fed Chair Jerome Powell said that the US economy has performed quite strongly while acknowledging that recent data shows a lack of further progress on inflation.
Following those remarks, traders reduced expectations for the Federal Reserve to cut rates more than once this year, according to Reuters. The CME FedWatch Tools shows the first rate cut could happen in September, with odds for a quarter of a percentage point standing at 71.38%.
Daily digest market movers: Gold traders ignore higher US yields, strong production output data
- In March, US Building Permits saw a decrease of 4.3%, dropping to 1.458 million, which was below the expected 1.514 million and February's figure of 1.523 million. Additionally, Housing Starts experienced a significant drop of 14.7%, falling from 1.549 million to 1.321 million, well under the forecast of 1.48 million.
- The Federal Reserve reported that March’s Industrial Production was stable, meeting both estimates and the previous month’s growth rate of 0.4% MoM.
- Despite mixed economic indicators, market participants remain focused on strong March US Retail Sales data released on Monday. Particularly noteworthy was the control group's performance—essential for GDP calculations—which significantly exceeded both forecasts and the previous month's results.
- Despite decent US economic data, market participants seem to be focused on geopolitical risks. Sources cited by The Jerusalem Post revealed that Israel has reportedly finalized plans for a counterstrike against Iran.
- Gold’s price remains high even though US Treasury yields are climbing more than 5 basis points (bps) in the belly and long end of the yield curve.
- US Dollar Index (DXY), which tracks the buck’s performance against a basket of six other currencies, gains 0.11% to 106.29, levels last seen in November 2023.
- Gross Domestic Product (GDP) estimates for Q1 2024 show that the US economy is expected to grow 2.9%, up from 2.8% estimated on April 15, according to the Atlanta GDPNow model.
Technical analysis: Gold buyers remain in charge despite RSI being in overbought levels
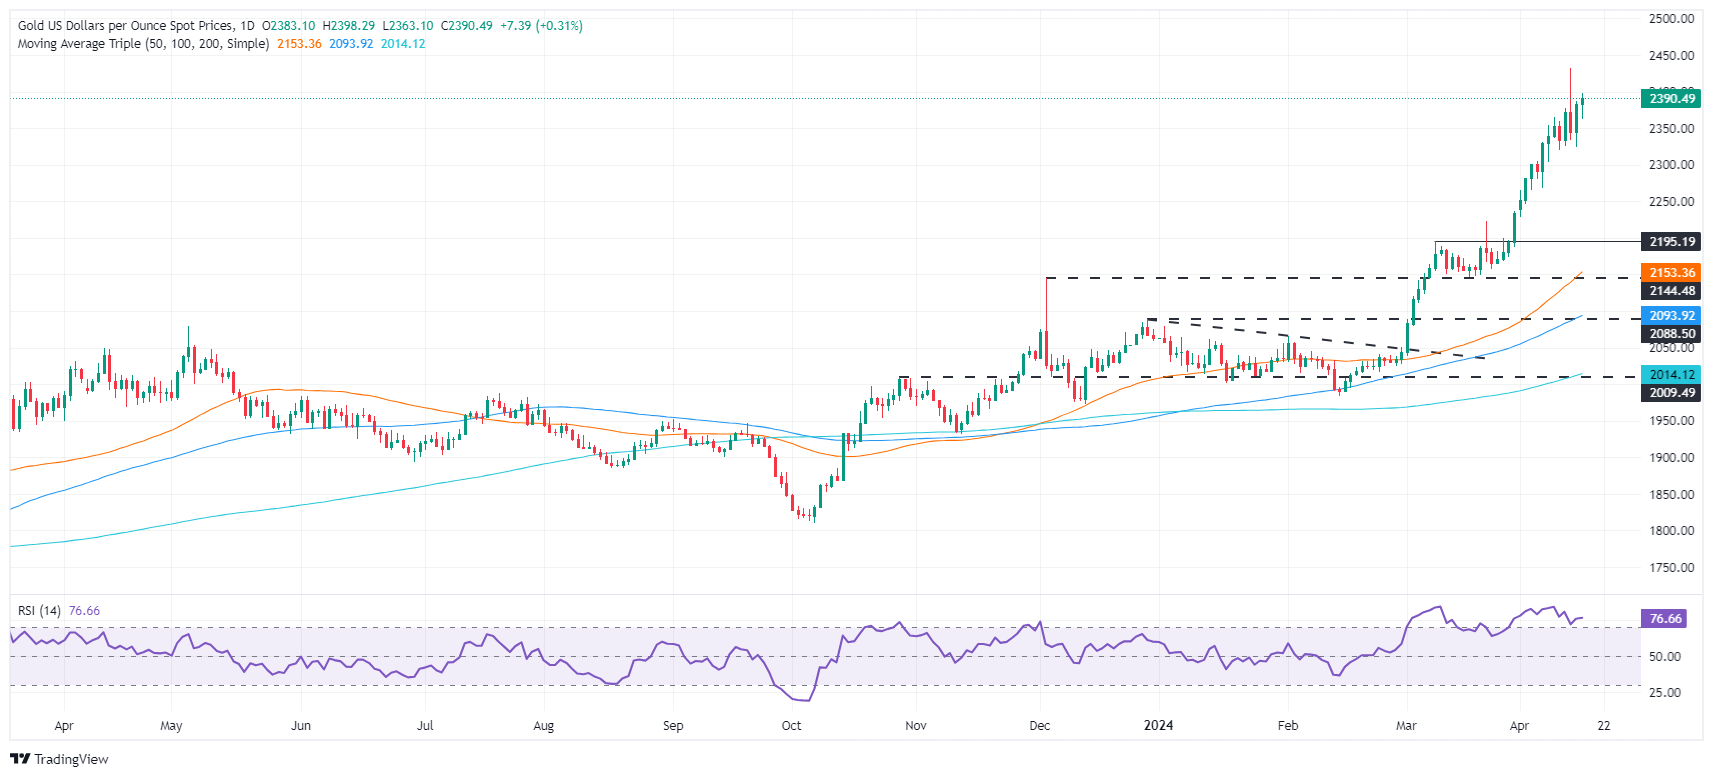
Gold is upwardly biased, though the uptrend seems overextended, increasing the risks of a pullback. Nevertheless, according to Dow Theory, the trend is more likely to continue than reverse. That said, after dipping on Friday, the Relative Strength Index (RSI) is aiming upward again, with buyers stepping in, opening the door to challenge the $2,400 figure. A breach of the latter will expose the all-time high at $2,431, followed by $2,450.
On the flip side, a daily close below the April 12 close of $2,343 could open the door to push Gold’s price toward the $2,300 mark. Once cleared, the next support would be the April 5 swing low of $2,267.
Gold FAQs
Gold has played a key role in human’s history as it has been widely used as a store of value and medium of exchange. Currently, apart from its shine and usage for jewelry, the precious metal is widely seen as a safe-haven asset, meaning that it is considered a good investment during turbulent times. Gold is also widely seen as a hedge against inflation and against depreciating currencies as it doesn’t rely on any specific issuer or government.
Central banks are the biggest Gold holders. In their aim to support their currencies in turbulent times, central banks tend to diversify their reserves and buy Gold to improve the perceived strength of the economy and the currency. High Gold reserves can be a source of trust for a country’s solvency. Central banks added 1,136 tonnes of Gold worth around $70 billion to their reserves in 2022, according to data from the World Gold Council. This is the highest yearly purchase since records began. Central banks from emerging economies such as China, India and Turkey are quickly increasing their Gold reserves.
Gold has an inverse correlation with the US Dollar and US Treasuries, which are both major reserve and safe-haven assets. When the Dollar depreciates, Gold tends to rise, enabling investors and central banks to diversify their assets in turbulent times. Gold is also inversely correlated with risk assets. A rally in the stock market tends to weaken Gold price, while sell-offs in riskier markets tend to favor the precious metal.
The price can move due to a wide range of factors. Geopolitical instability or fears of a deep recession can quickly make Gold price escalate due to its safe-haven status. As a yield-less asset, Gold tends to rise with lower interest rates, while higher cost of money usually weighs down on the yellow metal. Still, most moves depend on how the US Dollar (USD) behaves as the asset is priced in dollars (XAU/USD). A strong Dollar tends to keep the price of Gold controlled, whereas a weaker Dollar is likely to push Gold prices up.
Further gains saw the Greenback clinch new highs against the backdrop of higher yields and firmer speculation of a Fed’s rate cut by year end. In the meantime, persistent geopolitical concerns kept the price action in the risk complex depressed.
Here is what you need to know on Wednesday, April 17:
The Greenback retained its bullish stance and surged to fresh highs for 2024, reaching approximately 106.50 on the USD Index (DXY). On April 17, the usual weekly Mortgage Applications tracked by MBA, the Fed’s Beige Book and Net Long-term TIC Flows are all due.
EUR/USD extended its bearish note to the boundaries of the 1.0600 level, hitting new lows for the year. The final Inflation Rate in the broader euro bloc will take centre stage on April 17.
GBP/USD exchanged gains with losses and approached the 1.2400 region, or fresh YTD lows. In the UK, the Inflation Rate for the month of March is scheduled for April 17.
USD/JPY rose to new highs near 154.80 amidst higher US yields and the slight uptick in the Dollar. In Japan, the Reuters Tankan Index and Balance of Trade readings come on April 17.
AUD/USD dropped for the third session in a row, briefly breaking below the 0.6400 support. The Leading Index gauged by Westpac is due on April 17.
WTI kept the choppiness well in place, always amidst the multi-session consolidative theme around $85.00 per barrel.
Prices of Gold added to Monday’s uptick and flirted with the $2,400 mark per troy ounce. Silver, in the meantime, could not sustain a move to the $29.00 zone per ounce and ended the session with marked losses.
- Fed Powell warns about sticky inflation and sends the US Dollar higher.
- The frail market sentiment on concerns about the Middle East conflict is weighing on the risk-sensitive Kiwi.
- Investors' focus is now on the New Zealand CPI data, due later on Tuesday.
The risk-averse sentiment on concerns about an escalation of the Middle East conflict is hammering the Kiwi this week. The NZD/USD has depreciated about 3.6% in the last few trading days and is about to test the support area at 0.5860.
The US Dollar remains firm, fuelled by rising US bond yields, with investors reassessing their Fed easing calendar. On Tuesday, Fed Chair, Jerome Powell suggested that recent data shows a lack of progress on inflation, which endorses the “higher for longer” Fed outlook.
Earlier on Tuesday, the mixed Chinese data seen on Wednesday failed to provide a significant impulse to the China-proxy Kiwi. China’s GDP accelerated to a 5.3% yearly growth in the first quarter, above expectations of a 5% reading. These figures, however, have been offset by weak consumption and industrial production data.
The focus is now on New Zealand’s Consumer Prices Index report, due later on Tuesday. Price pressures are expected to have ticked up in March, which would support the Kiwi. A negative surprise could accelerate the pair’s downtrend.
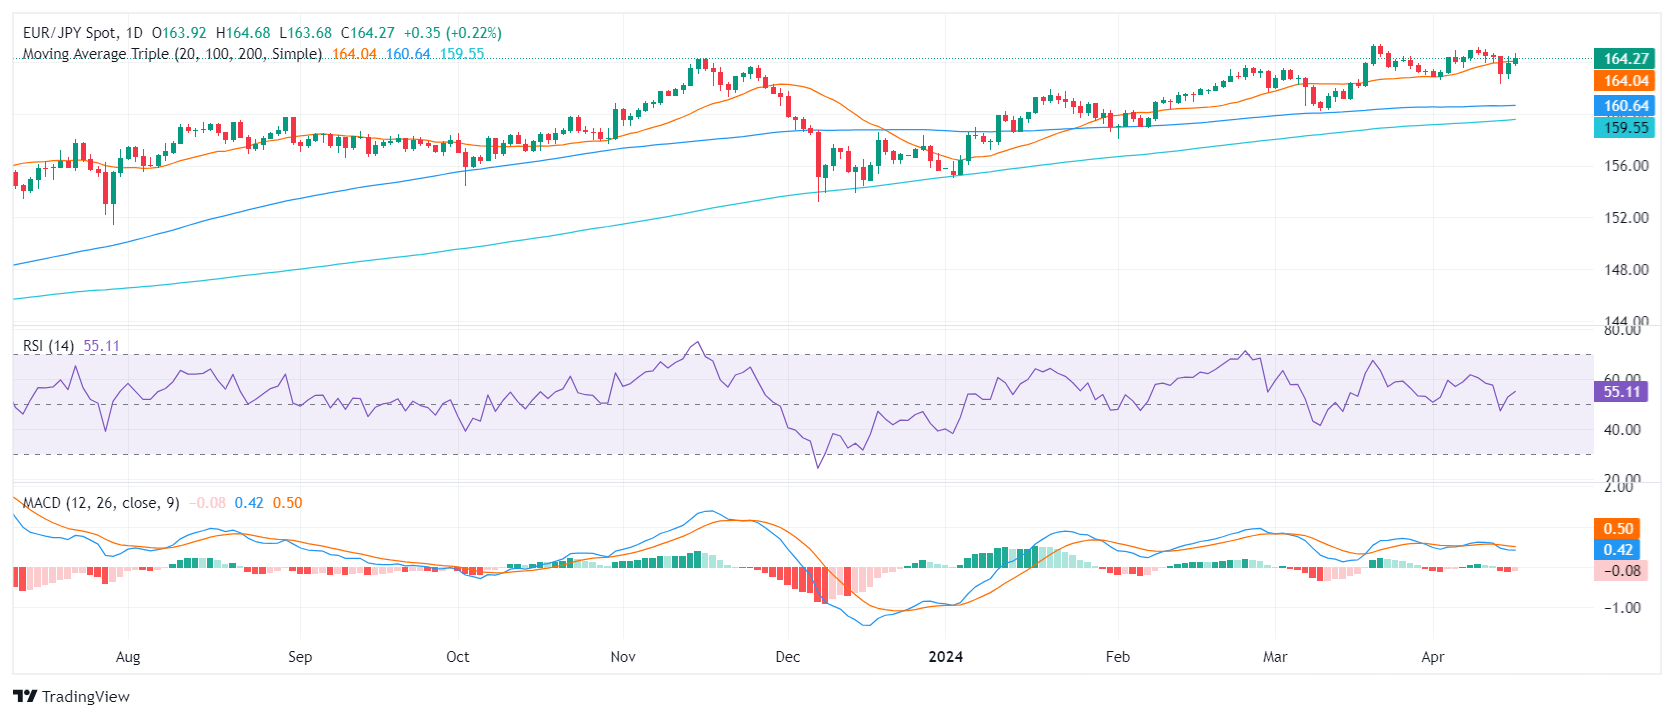
- The daily chart reveals that the EUR/JPY maintains a bullish sentiment, as indicated by the rising RSI and diminishing negative momentum via MACD.
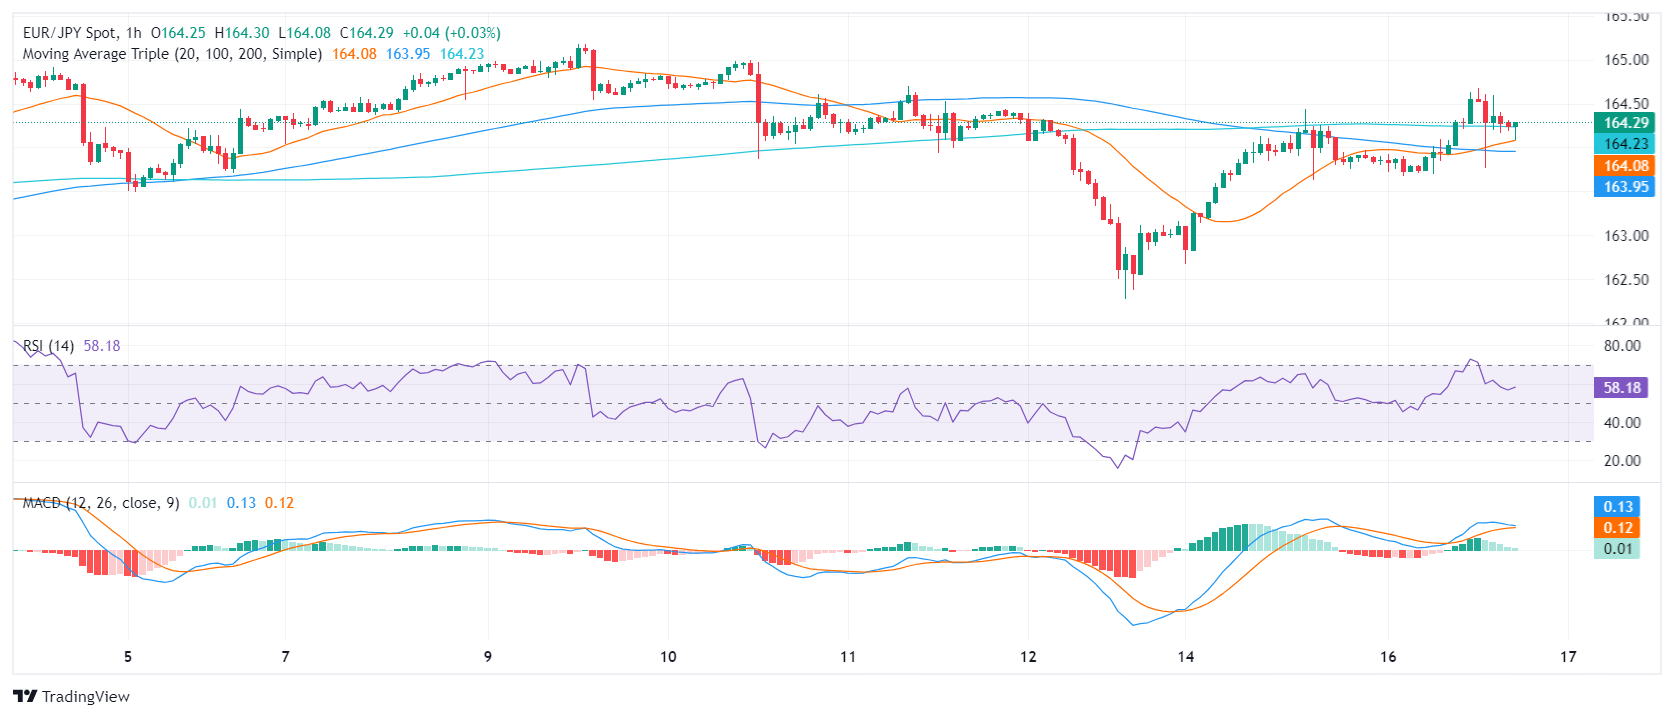
- The hourly chart's RSI shows that the pair is correcting overbought conditions.
The EUR/JPY pair is trading at 164.22, recording a slight uptick on Tuesday’s session. This slight appreciation points towards a continuing strength of the Euro against the Japanese Yen. Despite minor market fluctuations suggesting temporary corrections, the broader technical outlook remains largely bullish. To reinforce this, bulls stepped in and recovered the 20-day Simple Moving Average (SMA) which brightened the outlook for the buyers.
The daily chart reveals that the EUR/JPY pair maintains a bullish momentum, indicated by its Relative Strength Index (RSI) standing at 55, comfortably within the positive trend zone. This is supported by the falling red bars of the Moving Average Convergence Divergence (MACD) histogram, which demonstrates diminishing negative momentum.
EUR/JPY daily chart
Moving to the hourly chart, recent RSI readings oscillate between 71 and 54, suggesting the buyers are taking a quick breather. In addition, the relatively flat green bars of the hourly MACD indicate a nearly stagnant positive momentum.
EUR/JPY hourly chart
The broader outlook of the EUR/JPY based on its position relative to the Simple Moving Average (SMA) provides more insight. The EUR/JPY jump above the 20-day SMA today may signal a sharp short-term uptick, suggesting buy opportunities for traders. Moreover, its position above both the 100-day and 200-day SMA confirms a long-term bullish trend, implying that the Euro retains its strength against the Japanese Yen.
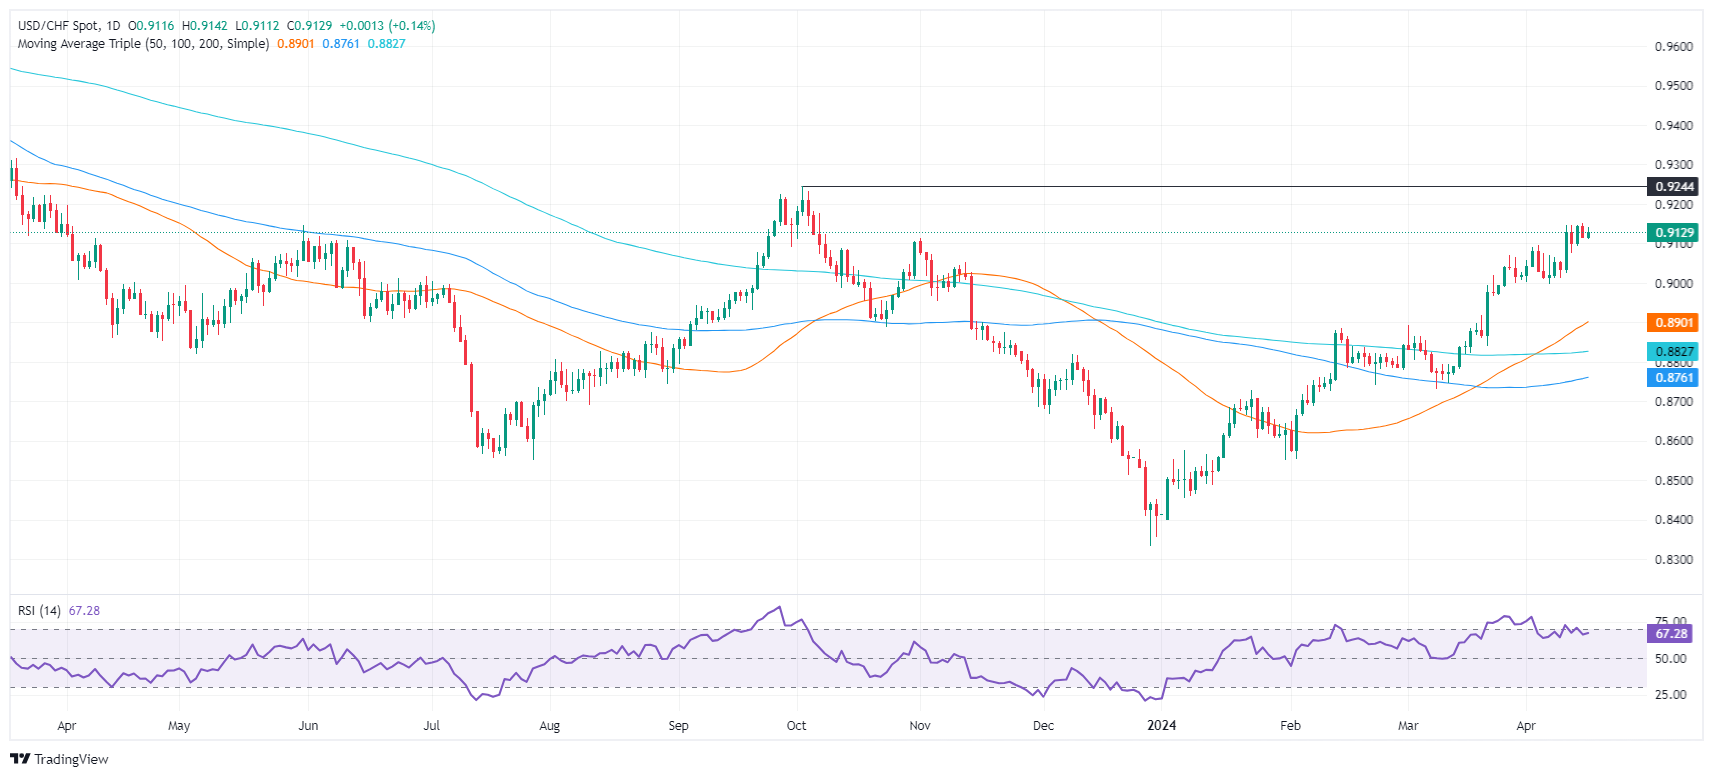
- USD/CHF climbs 0.12% amid global risk aversion, boosting demand for the US Dollar.
- Breaking past the November 1, 2023, high of 0.9112 suggests potential for more gains, targeting the 0.9200 resistance.
- A fallback below 0.9100 could prompt a test of the major support trendline around 0.9040.
The US Dollar posts minimal gains versus the Swiss Franc in the mid-North American session and gains 0.12%, trading at 0.9127 at the time of writing. Risk aversion, higher US Treasury yields, and solid US Retail Sales data boost the Greenback.
USD/CHF Price Analysis: Technical outlook
The pair remains upward biased after cracking the last cycle high of 0.9112 on November 1, 2023, which could pave the way for further upside. The USD/CHF peaked at around 0.9151, which, once surpassed, will expose the 0.9200 mark. A breach of the latter, and the pair could rally towards October 3, 2023, a high of 0.9245, with the next key resistance level seen at 0.9300.
On the other hand, if USD/CHF drops below 0.9100, that could open the door to challenge a three-and-a-half-month-old support trendline that passes around 0.9040. A further downside is seen at 0.9000.
USD/CHF Price Action – Daily Chart
Federal Reserve (Fed) Chairman Jerome Powell participates in a fireside chat about economic trends in North America at the Wilson Center’s Washington Forum in Washington, DC.
Powell said that the U.S. economy's performance has been quite robust. He added that recent data indicates a lack of significant progress on inflation this year. Despite ongoing strength, Powell noted that the labour market is transitioning towards a better equilibrium.
Key Quotes
The performance of the US has been "quite strong"
Recent data shows lack of further progress on inflation this year
The labour market moving into better balance even amidst ongoing strength.
Broader wage pressures are moderating gradually.
Twelve month core PCE inflation was little changed in March, according to estimates.
Fed took a cautious approach to not overreacting to declines last year; recent data have not given greater confidence.
If higher inflation persists the Fed can maintain current rate as long as needed.
Restrictive policy needs further time to work.
Market Reaction
The Greenback maintains its bullish performance unchanged so far on Tuesday, taking the USD Index (DXY) to the area of multi-month peaks around 106.40-106.50.
US Dollar price this week
The table below shows the percentage change of US Dollar (USD) against listed major currencies this week. US Dollar was the weakest against the Swiss Franc.
| USD | EUR | GBP | CAD | AUD | JPY | NZD | CHF | |
| USD | 0.27% | 0.32% | 0.49% | 1.12% | 0.92% | 1.11% | -0.04% | |
| EUR | -0.33% | 0.05% | 0.23% | 0.80% | 0.58% | 0.78% | -0.38% | |
| GBP | -0.34% | -0.01% | 0.17% | 0.79% | 0.58% | 0.77% | -0.38% | |
| CAD | -0.52% | -0.19% | -0.19% | 0.61% | 0.40% | 0.60% | -0.56% | |
| AUD | -1.13% | -0.80% | -0.81% | -0.63% | -0.21% | -0.01% | -1.18% | |
| JPY | -0.89% | -0.57% | -0.56% | -0.41% | 0.22% | 0.16% | -0.95% | |
| NZD | -1.12% | -0.85% | -0.80% | -0.61% | 0.01% | -0.19% | -1.16% | |
| CHF | 0.04% | 0.30% | 0.38% | 0.56% | 1.16% | 0.94% | 1.14% |
The heat map shows percentage changes of major currencies against each other. The base currency is picked from the left column, while the quote currency is picked from the top row. For example, if you pick the Euro from the left column and move along the horizontal line to the Japanese Yen, the percentage change displayed in the box will represent EUR (base)/JPY (quote).
Federal Reserve (Fed) Bank of New York President John William, a permanent voting member of the Federal Open Market Committee (FOMC), said on Tuesday that inflation has fallen across all categories over the last year and a half.
Williams participated in a panel discussion at the Economic Club of New York, and add some interesting comments on monetary policy.
Key takeaways
Inflation has fallen across all categories over the last year and a half.
US potential growth is around 2%, maybe higher.
Unclear what rise of AI does for productivirty, but is a big deal for business.
Market reaction
Williams words had no impact on the markets, overshadowed by concerns about a potential increase in Middle East tensions.
- The Pound drops on weak UK employment data, to retest support area at 1.2430.
- UK Unemployment rate increased to 4.2% in the three months to February against expectations of a 4% reading.
- Investors’ focus is on Wednesday’s UK CPI data for more clues about the BoE’s monetary policy outlook.
The Sterling has resumed its broader bearish trend during Tuesday’s London trading session. The uninspiring UK employment figures have endorsed the theory that the BoE might start cutting rates ahead of schedule, which has punished the GBP.
The Claimant count range increased below expectations but wage growth eased to 6% YoY in the three months before February, from from 6.1% in the previous period. But above all, the unemployment rate increased to 4.2% disappointing the market that had forecasted a 4% rate, unchanged from the previous month.
The US Dollar maintains its bullish trend intact, fuelled by higher US Treasury yields. The 10-year benchmark yield is trading at year-to-date highs near 4.70%. The 2-year yield the most closely related to interest rate expectations remains pinned to the key 5% level.
Later on Tuesday BoE Governor Bailey is expected to meet the press although the highlight of the week in the UK will be Wednesday’s CPI data, which is expected to have cooled significantly. Also on Tuesday, Fed Governor, Jerome Powell is expected to participate in a panel discussion in Washington. His comments about monetary policy might have some impact on US Dollar crosses.
GBP/USD Price Analysis: Technical outlook
Bears have pushed the pair back to the bottom of the monthly descending channel, at 1.2430, which is being tested at the moment. Last Friday’s low is right below there, at 1.2430. A clear break of that support area clears the path towards 1.2370. Further down there is no support until 1.2220.
On the upside 1.2505 level should be cleared to advance towards 1.2565, where an unmitigated order block may provide a fresh boost for bears.
- Mexican Peso depreciates more than 1.8%, driven by Middle East tensions and robust US economic data.
- The IMF cuts Mexico's growth forecast, expecting tighter fiscal policies ahead.
- Mexico aims to reduce its fiscal deficit by half through major spending cuts, potentially dampening growth.
- Market eyes upcoming Mexico’s Retail Sales data and comments from Fed Chair Powell.
The Mexican Peso trips down and plunges more than 1.8% against the US Dollar on Tuesday, courtesy of risk aversion. An escalation of Middle East conflict looms, along with solid economic data from the United States (US) and overall US Dollar strength. The USD/MXN trades at 17.04, bouncing off daily lows of 16.68.
Mexico’s economic docket remains absent, with the next significant data release being March Retail Sales, scheduled for April 19, 2024. In the meantime, the International Monetary Fund (IMF) downwardly revised economic growth in Mexico from 2.7% to 2.4% in 2024 and from 1.5% to 1.4% in 2025.
The IMF reduced its 2025 forecast, arguing that the fiscal expansion that will drive progress this year will be reversed in the next year because the new administration will have to tighten its belt, reversing existing spending policy.
In that regard, Mexico’s Ministry of Finance expects the fiscal deficit to decrease from 5% to 2.5% of the Gross Domestic Product (GDP) next year, which would imply a cut in spending of 833.6 billion Pesos, according to the Pre-General Policy Criteria Economic 2025.
Across the border, US economic data was mixed, with housing figures missing estimates, while Industrial Production stood pat. Traders are bracing for Federal Reserve (Fed) Chair Jerome Powell's speech at 17:15 GMT.
Daily digest market movers: Mexican Peso loses traction on risk aversion
- March’s Building Permits in the US decreased by 4.3%, dipping to 1.458 million, less than the 1.514 million estimates and February’s 1.523 million. Consequently, Housing Starts plunged 14.7%, from 1.549 million to 1.321 million, below forecasts of 1.48 million.
- The Fed revealed that March’s Industrial Production was aligned with estimates and the previous reading of 0.4% MoM.
- Despite posting mixed data, traders continue to digest the strong March US Retail Sales report revealed on Monday. This report was highlighted by the behavior displayed by the control group—used to calculate the GDP—crushing estimates and the previous month's reading.
- Retail Sales in the control group jumped from 0.3% in February to 1.1% MoM in March, surpassing forecasts of a 0.4% expansion.
- Geopolitical tensions in the Middle East would likely weigh on the Mexican currency. USD/MXN traders must be aware that any escalation could prompt traders to ditch the Mexican Peso and buy US Dollars.
- US Treasury yields surged more than 10 basis points (bps) in the belly and long end of the yield curve. That underpins the Greenback, which is up a modest 0.09% at 106.17 on the DXY.
- Data from the Chicago Board of Trade (CBOT) suggests that traders expect the fed funds rate to finish 2024 at 4.97%.
Technical analysis: Mexican Peso depreciates sharply, USD/MXN pierces 17.00
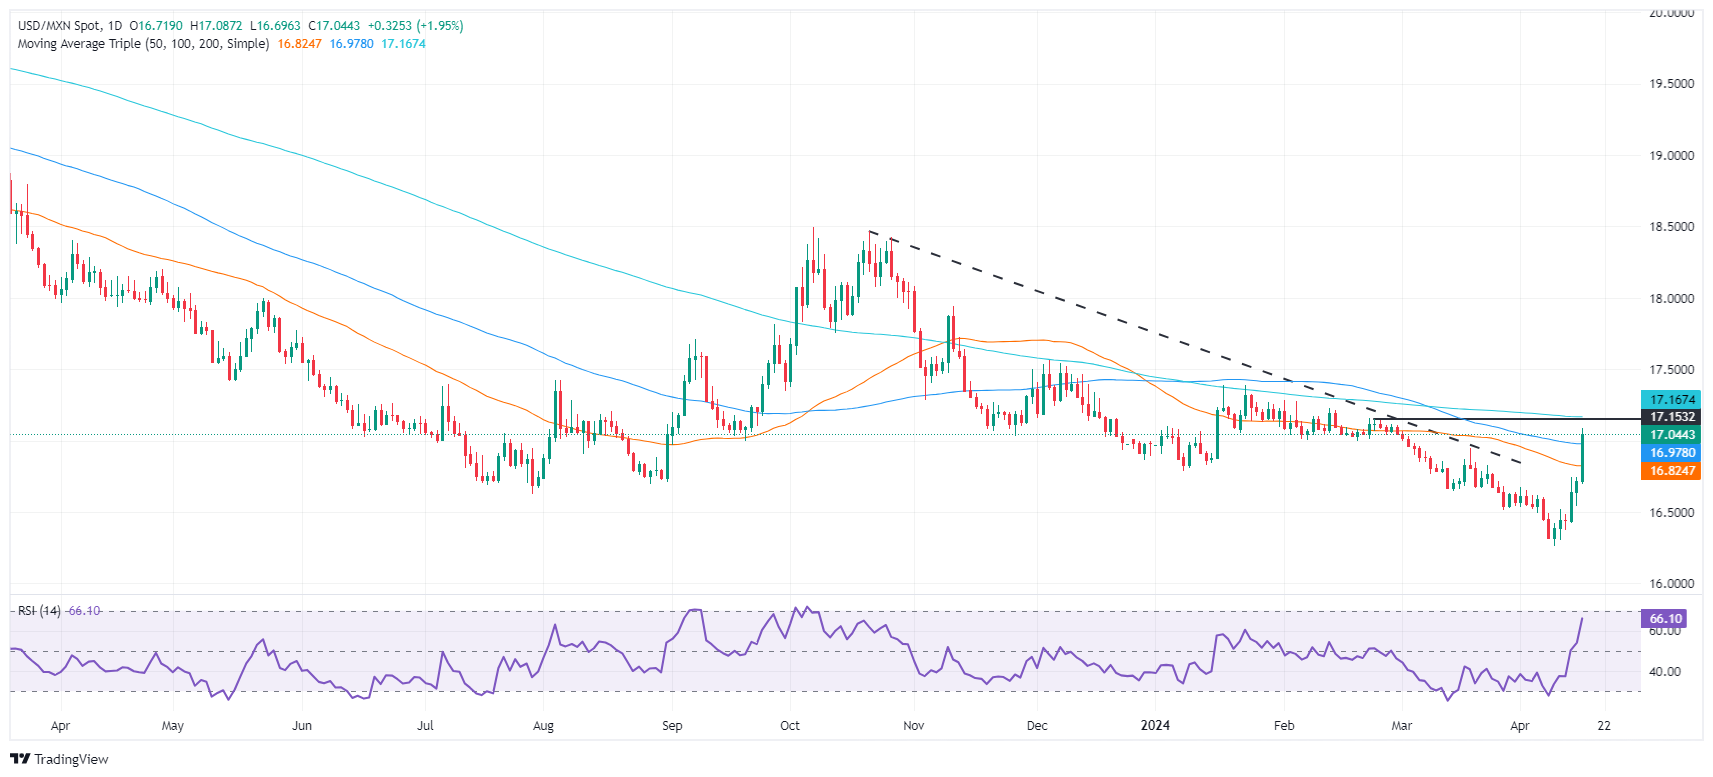
The USD/MXN daily chart shows that the pair has shifted to a neutral/upward bias as the Mexican currency tumbles and depreciates past the 17.00 figure. On its way north, the pair has broken key resistance levels. These include the 50 and 100-day moving averages (DMAs), each at 16.81 and 17.03, which could pave the way for further upside.
The next resistance would be the 200-DMA at 17.16. Once cleared, that could pave the way to challenging the January 17 high at 17.38 before testing the 17.50 psychological level. On the other hand, if USD/MXN slides below 17.00, look for a pullback toward last year’s low of 16.62, followed by the April 12 low of 16.40.
Mexican Peso FAQs
The Mexican Peso (MXN) is the most traded currency among its Latin American peers. Its value is broadly determined by the performance of the Mexican economy, the country’s central bank’s policy, the amount of foreign investment in the country and even the levels of remittances sent by Mexicans who live abroad, particularly in the United States. Geopolitical trends can also move MXN: for example, the process of nearshoring – or the decision by some firms to relocate manufacturing capacity and supply chains closer to their home countries – is also seen as a catalyst for the Mexican currency as the country is considered a key manufacturing hub in the American continent. Another catalyst for MXN is Oil prices as Mexico is a key exporter of the commodity.
The main objective of Mexico’s central bank, also known as Banxico, is to maintain inflation at low and stable levels (at or close to its target of 3%, the midpoint in a tolerance band of between 2% and 4%). To this end, the bank sets an appropriate level of interest rates. When inflation is too high, Banxico will attempt to tame it by raising interest rates, making it more expensive for households and businesses to borrow money, thus cooling demand and the overall economy. Higher interest rates are generally positive for the Mexican Peso (MXN) as they lead to higher yields, making the country a more attractive place for investors. On the contrary, lower interest rates tend to weaken MXN.
Macroeconomic data releases are key to assess the state of the economy and can have an impact on the Mexican Peso (MXN) valuation. A strong Mexican economy, based on high economic growth, low unemployment and high confidence is good for MXN. Not only does it attract more foreign investment but it may encourage the Bank of Mexico (Banxico) to increase interest rates, particularly if this strength comes together with elevated inflation. However, if economic data is weak, MXN is likely to depreciate.
As an emerging-market currency, the Mexican Peso (MXN) tends to strive during risk-on periods, or when investors perceive that broader market risks are low and thus are eager to engage with investments that carry a higher risk. Conversely, MXN tends to weaken at times of market turbulence or economic uncertainty as investors tend to sell higher-risk assets and flee to the more-stable safe havens.
- Dow Jones index advanced moderately with geopolitical tensions limiting gains.
- Good quarterly earnings from United Health and Morgan Stanley provide optimism.
- Technical picture remains bearish with DJIA drifting away from March highs.
The Dow Jones Industrial Average (DJIA) is going through a moderate advance in a cautious session on Tuesday morning. The high US Treasury yields and market concerns about the volatile situation in the Middle East have offset the positive impact of quarterly earnings results.
United Health and Morgan Stanley have reported better-than-expected quarterly earnings on Tuesday, offsetting the disappointing results by Bank of America (BAC) and Johnson & Johnson (JNJ).
Traders, however, remain wary of risk as Israel ponders its response to Iran’s missile attack as the international community pressures its leaders to show restraint.
In this scenario, the main Wall Street indices are mixed, with the Dow Jones 0.4% higher to 37,897, while the S&P 500 and the NASDAQ are practically flat at 5,062 and 15,890, respectively.
Dow Jones news
The Health sector is leading gains for the second consecutive day with a 0.4% advance. That sector’s gains are followed by Technology, 0.3% higher. The Energy sector is the worst performer with a 1.08% decline, and next is the Utilities sector, down 0.95%.
UnitedHealth (UNH) is outperforming with a 6.2% rally to $473.43 after its quarterly report beat expectations. Salesforce (CRM) rises 2% to $278.45. On the negative side, Johnson & Johnson drops 2% to $144.67, and Apple (AAPL) loses another 1.7% to $169.78.
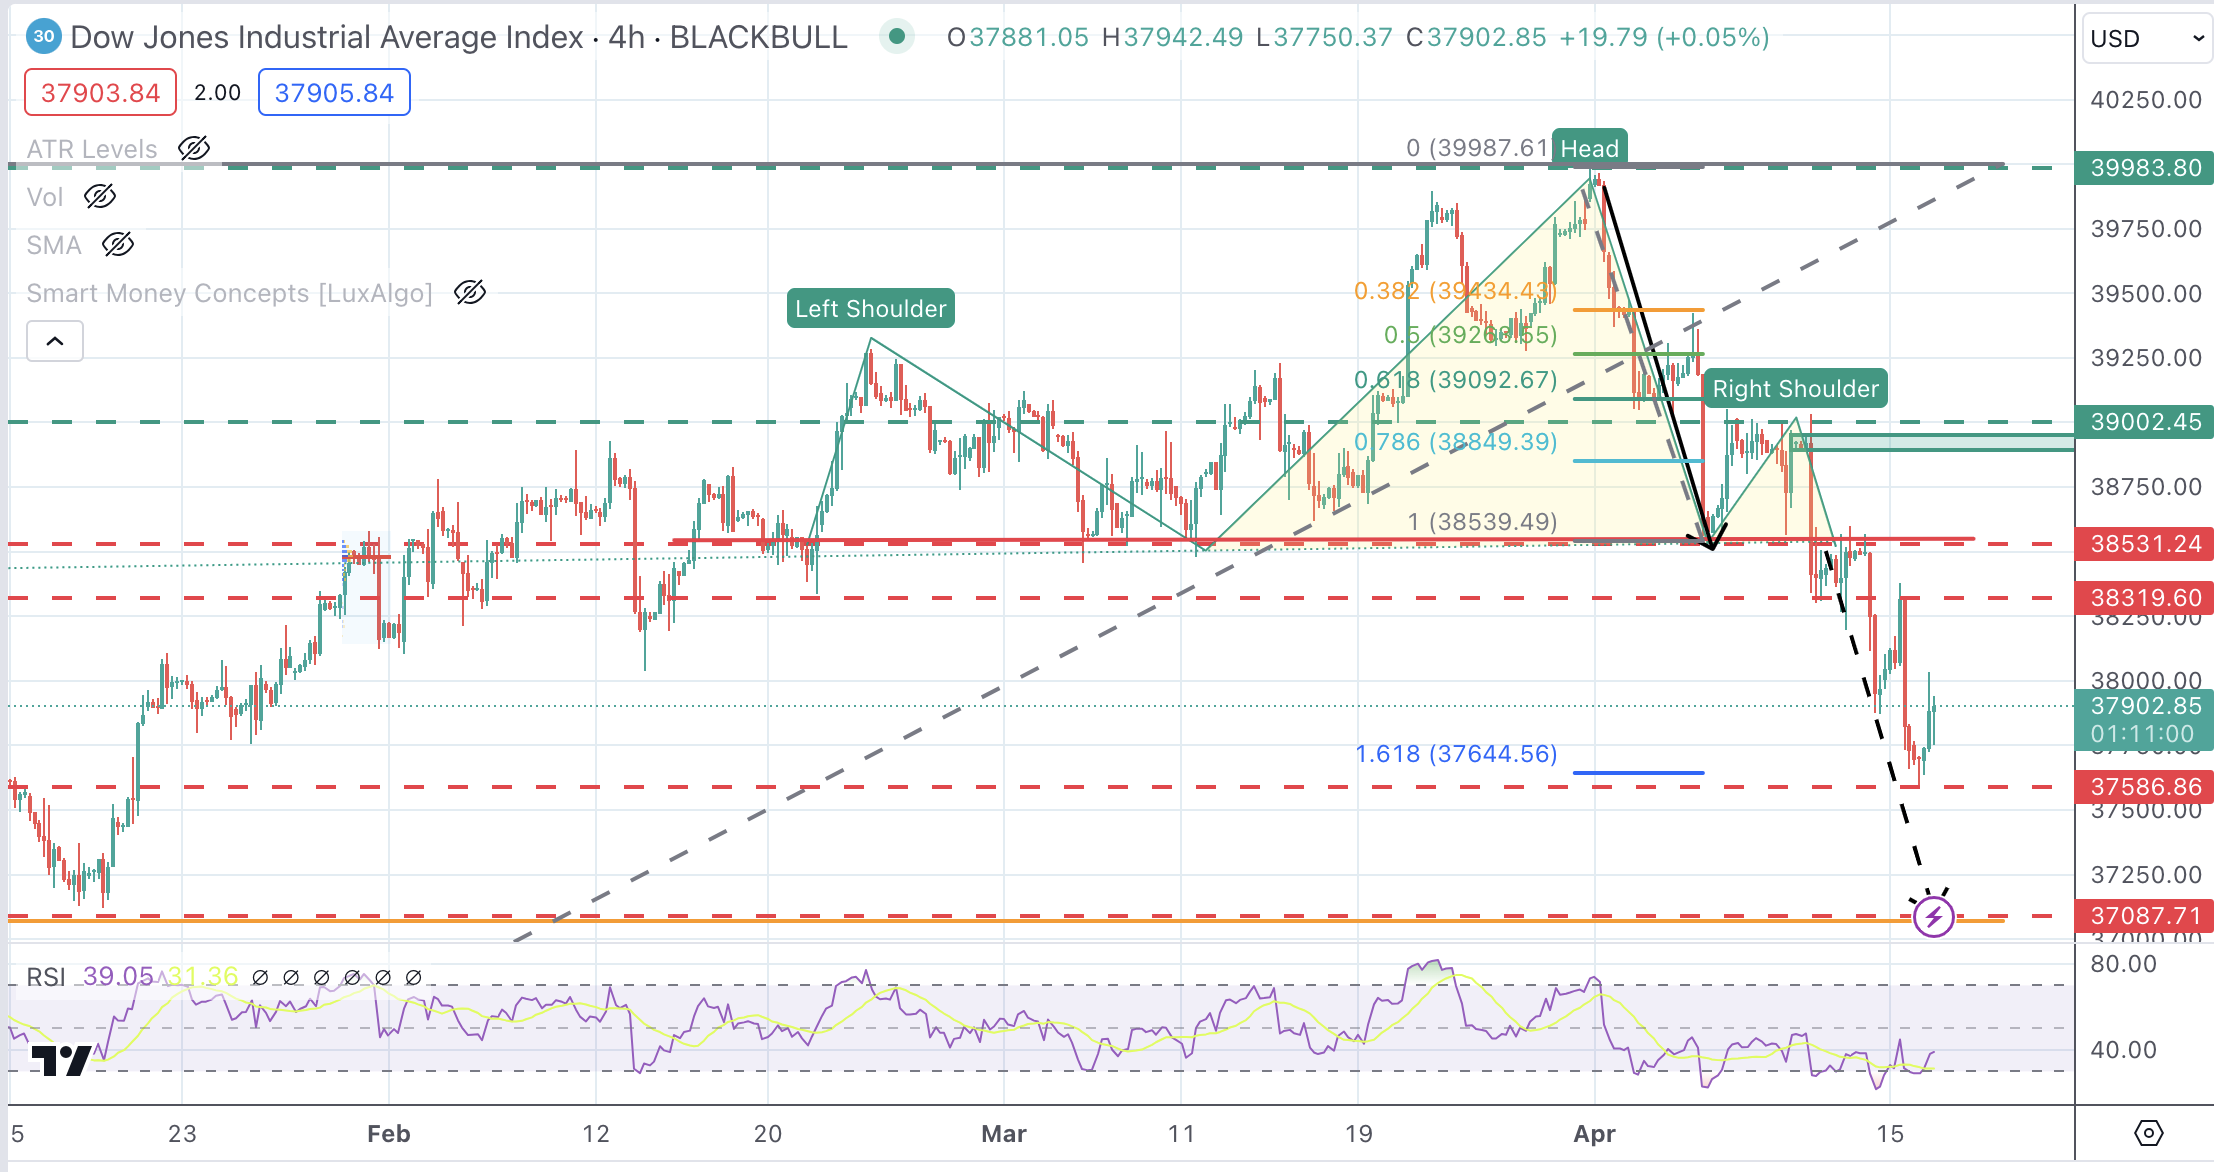
Dow Jones technical outlook
The DJIA index is trimming some loose ends on Tuesday although the overall picture remains bearish. The move below 38,560 has activated a Head & Shoulders pattern that points toward a sharper decline.
Immediate support is 37,586, followed by the measured target of the H&S pattern, which meets the mid-January low and 38.6% Fibonacci retracement at 37,087. A bullish reaction might find resistance at the 38,531 previous support ahead of the 39,000 region (order block).
Dow Jones Index 4-Hour Chart
Dow Jones FAQs
The Dow Jones Industrial Average, one of the oldest stock market indices in the world, is compiled of the 30 most traded stocks in the US. The index is price-weighted rather than weighted by capitalization. It is calculated by summing the prices of the constituent stocks and dividing them by a factor, currently 0.152. The index was founded by Charles Dow, who also founded the Wall Street Journal. In later years it has been criticized for not being broadly representative enough because it only tracks 30 conglomerates, unlike broader indices such as the S&P 500.
Many different factors drive the Dow Jones Industrial Average (DJIA). The aggregate performance of the component companies revealed in quarterly company earnings reports is the main one. US and global macroeconomic data also contributes as it impacts on investor sentiment. The level of interest rates, set by the Federal Reserve (Fed), also influences the DJIA as it affects the cost of credit, on which many corporations are heavily reliant. Therefore, inflation can be a major driver as well as other metrics which impact the Fed decisions.
Dow Theory is a method for identifying the primary trend of the stock market developed by Charles Dow. A key step is to compare the direction of the Dow Jones Industrial Average (DJIA) and the Dow Jones Transportation Average (DJTA) and only follow trends where both are moving in the same direction. Volume is a confirmatory criteria. The theory uses elements of peak and trough analysis. Dow’s theory posits three trend phases: accumulation, when smart money starts buying or selling; public participation, when the wider public joins in; and distribution, when the smart money exits.
There are a number of ways to trade the DJIA. One is to use ETFs which allow investors to trade the DJIA as a single security, rather than having to buy shares in all 30 constituent companies. A leading example is the SPDR Dow Jones Industrial Average ETF (DIA). DJIA futures contracts enable traders to speculate on the future value of the index and Options provide the right, but not the obligation, to buy or sell the index at a predetermined price in the future. Mutual funds enable investors to buy a share of a diversified portfolio of DJIA stocks thus providing exposure to the overall index.
- DXY Index witnesses minor incline, hitting an early November peak at 106.30.
- Prior to Powell's speech, US Dollar gained following strong Retail Sales data.
- US housing data reveals weakness with Building Permits and Housing Starts falling.
- Investors await further economic reports for more clarity on the health of the US economy.
The US Dollar Index (DXY) is trading at 106.30 with gains on Tuesday, and the DXY continues to benefit from robust Retail Sales data revealed on Monday. Weak housing data didn’t trigger any reaction from the USD, and markets await Jerome Powell’s speech later in the session.
The US economy is witnessing robust growth and persistent inflation. Meanwhile, the Federal Reserve (Fed) sends mixed signals: that it's not keen on rate increases but welcomes market-led tightening via higher yields. Following the report of strong March inflation and labor data, easing expectations for June and July have plummeted, which fueled the USD’s rally.
Daily digest market movers: DXY holds strong despite weak housing data, eyes on Powell
- March's Building Permits recorded a decline of 4.3%, descending to 1.458 million, beneath both the projected 1.514 million and February's 1.523 million.
- Housing Starts witnessed a notable descent of 14.7%, collapsing from 1.549 million to 1.321 million, not reaching the expected total of 1.48 million.
- Industrial Production for March rose by 0.4% MoM, matching expectations.
- Powell’s comments later in the session might trigger movements in the market. Any hawkish signals could further benefit the USD.
- After the recent inflow of robust US data, market participants are adjusting their easing anticipations. At present, the market anticipates the initial rate cut to materialize in September with a 70% probability for a second cut in December.
- The investor’s expectations of a June rate cut have diminished to 25% against 60% the previous week.
DXY technical analysis: DXY continues gaining ground, bulls might eventually take breather
The indicators on the daily chart reflect a bullish scenario for the DXY. The Relative Strength Index (RSI) is showing overbought conditions, typically indicating strong upward momentum. Similarly, the Moving Average Convergence Divergence (MACD) has rising green bars, showing a positive momentum in favor of bulls. However, the rally might have become overextended as these indicators flash overbought signals and might correct in the next sessions.
In addition to this, the currency index is trading above all its Simple Moving Averages (SMAs) at 20, 100 and 200 days. The SMAs suggest a long-term bullish trend. Together, these indicators show that buying momentum is dominant over selling momentum.
US Dollar FAQs
The US Dollar (USD) is the official currency of the United States of America, and the ‘de facto’ currency of a significant number of other countries where it is found in circulation alongside local notes. It is the most heavily traded currency in the world, accounting for over 88% of all global foreign exchange turnover, or an average of $6.6 trillion in transactions per day, according to data from 2022. Following the second world war, the USD took over from the British Pound as the world’s reserve currency. For most of its history, the US Dollar was backed by Gold, until the Bretton Woods Agreement in 1971 when the Gold Standard went away.
The most important single factor impacting on the value of the US Dollar is monetary policy, which is shaped by the Federal Reserve (Fed). The Fed has two mandates: to achieve price stability (control inflation) and foster full employment. Its primary tool to achieve these two goals is by adjusting interest rates. When prices are rising too quickly and inflation is above the Fed’s 2% target, the Fed will raise rates, which helps the USD value. When inflation falls below 2% or the Unemployment Rate is too high, the Fed may lower interest rates, which weighs on the Greenback.
In extreme situations, the Federal Reserve can also print more Dollars and enact quantitative easing (QE). QE is the process by which the Fed substantially increases the flow of credit in a stuck financial system. It is a non-standard policy measure used when credit has dried up because banks will not lend to each other (out of the fear of counterparty default). It is a last resort when simply lowering interest rates is unlikely to achieve the necessary result. It was the Fed’s weapon of choice to combat the credit crunch that occurred during the Great Financial Crisis in 2008. It involves the Fed printing more Dollars and using them to buy US government bonds predominantly from financial institutions. QE usually leads to a weaker US Dollar.
Quantitative tightening (QT) is the reverse process whereby the Federal Reserve stops buying bonds from financial institutions and does not reinvest the principal from the bonds it holds maturing in new purchases. It is usually positive for the US Dollar.
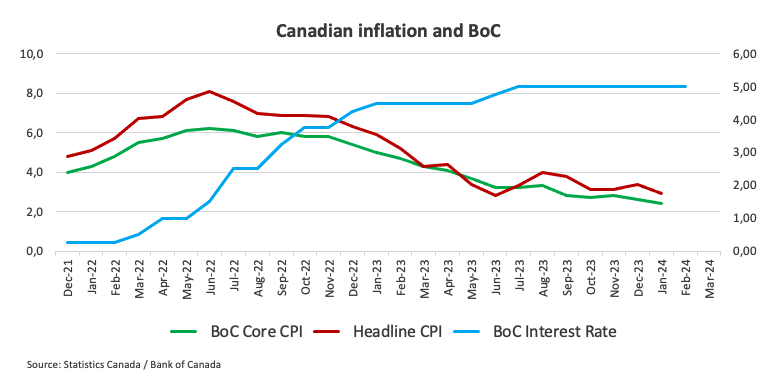
- Canadian Dollar depreciates further after mixed Canadian inflation data.
- Core CPI eases to 2% YoY in March, feeding hopes that BoC might start cutting rates in June.
- Later Tuesday, Fed Chair Powell and BoC President Macklem will speak about Canadian economy in Washington.
The Canadian Dollar (CAD) is going through a sharp depreciation against a stronger Greenback on Tuesday, and the mixed Canadian Consumer Prices Index (CPI) has failed to provide any significant support. Consumer inflation accelerated in March although the Core Bank of Canada CPI rose at a slower pace than in the previous month.
These figures come in line with cooling inflationary trends last seen at the Bank of Canada’s most recent monetary policy meeting, which would allow them to start cutting rates in June. This explains the negative impact on the Canadian Dollar vis-à-vis the Greenback.
Later Tuesday, BoC Governor Tiff Macklem and Federal Reserve (Fed) Chair Jerome Powell are expected to take part in a panel discussion about the Canadian economy in Washington. Any comments about the monetary policy plans of their respective banks are likely to be analyzed with particular interest.
Daily digest market movers: USD/CAD rallies further on monetary policy divergence
- Lower hopes of Fed easing in the coming months and then higher expectations that the BoC will trim rates in June are hammering the Canadian Dollar.
- Canadian CPI accelerated at a 0.6% pace in March and 2.9% YoY, up from 0.3% and 2.8% in the previous month.
- Core CPI, however, eased to a 2.0% yearly rate from 2.1% over the previous month.
- US Construction activity data has disappointed, with Housing Starts and Building Permits declining beyond expectations in March.
- US Industrial Production grew 0.4% in March, in line with market expectations and unchanged from the previous month. Capacity utilization increased to 78.4% from the downwardly revised 78.2% but below the 78.5% forecasted by experts.
- Fed Vice Chair Jefferson has given a neutral speech hinting at rate cuts later this year but also warning that inflation data forces it to keep rates high for a longer time.
Canadian Dollar price this week
The table below shows the percentage change of Canadian Dollar (CAD) against listed major currencies this week. Canadian Dollar was the weakest against the Swiss Franc.
| USD | EUR | GBP | CAD | AUD | JPY | NZD | CHF | |
| USD | 0.20% | 0.22% | 0.48% | 1.03% | 0.83% | 1.00% | -0.10% | |
| EUR | -0.19% | 0.02% | 0.26% | 0.83% | 0.63% | 0.81% | -0.32% | |
| GBP | -0.21% | -0.02% | 0.27% | 0.82% | 0.62% | 0.79% | -0.32% | |
| CAD | -0.48% | -0.29% | -0.27% | 0.56% | 0.35% | 0.52% | -0.60% | |
| AUD | -1.05% | -0.85% | -0.84% | -0.56% | -0.21% | -0.03% | -1.16% | |
| JPY | -0.82% | -0.61% | -0.58% | -0.35% | 0.20% | 0.23% | -0.94% | |
| NZD | -0.99% | -0.84% | -0.82% | -0.52% | 0.03% | -0.17% | -1.12% | |
| CHF | 0.12% | 0.31% | 0.34% | 0.60% | 1.15% | 0.95% | 1.12% |
The heat map shows percentage changes of major currencies against each other. The base currency is picked from the left column, while the quote currency is picked from the top row. For example, if you pick the Euro from the left column and move along the horizontal line to the Japanese Yen, the percentage change displayed in the box will represent EUR (base)/JPY (quote).
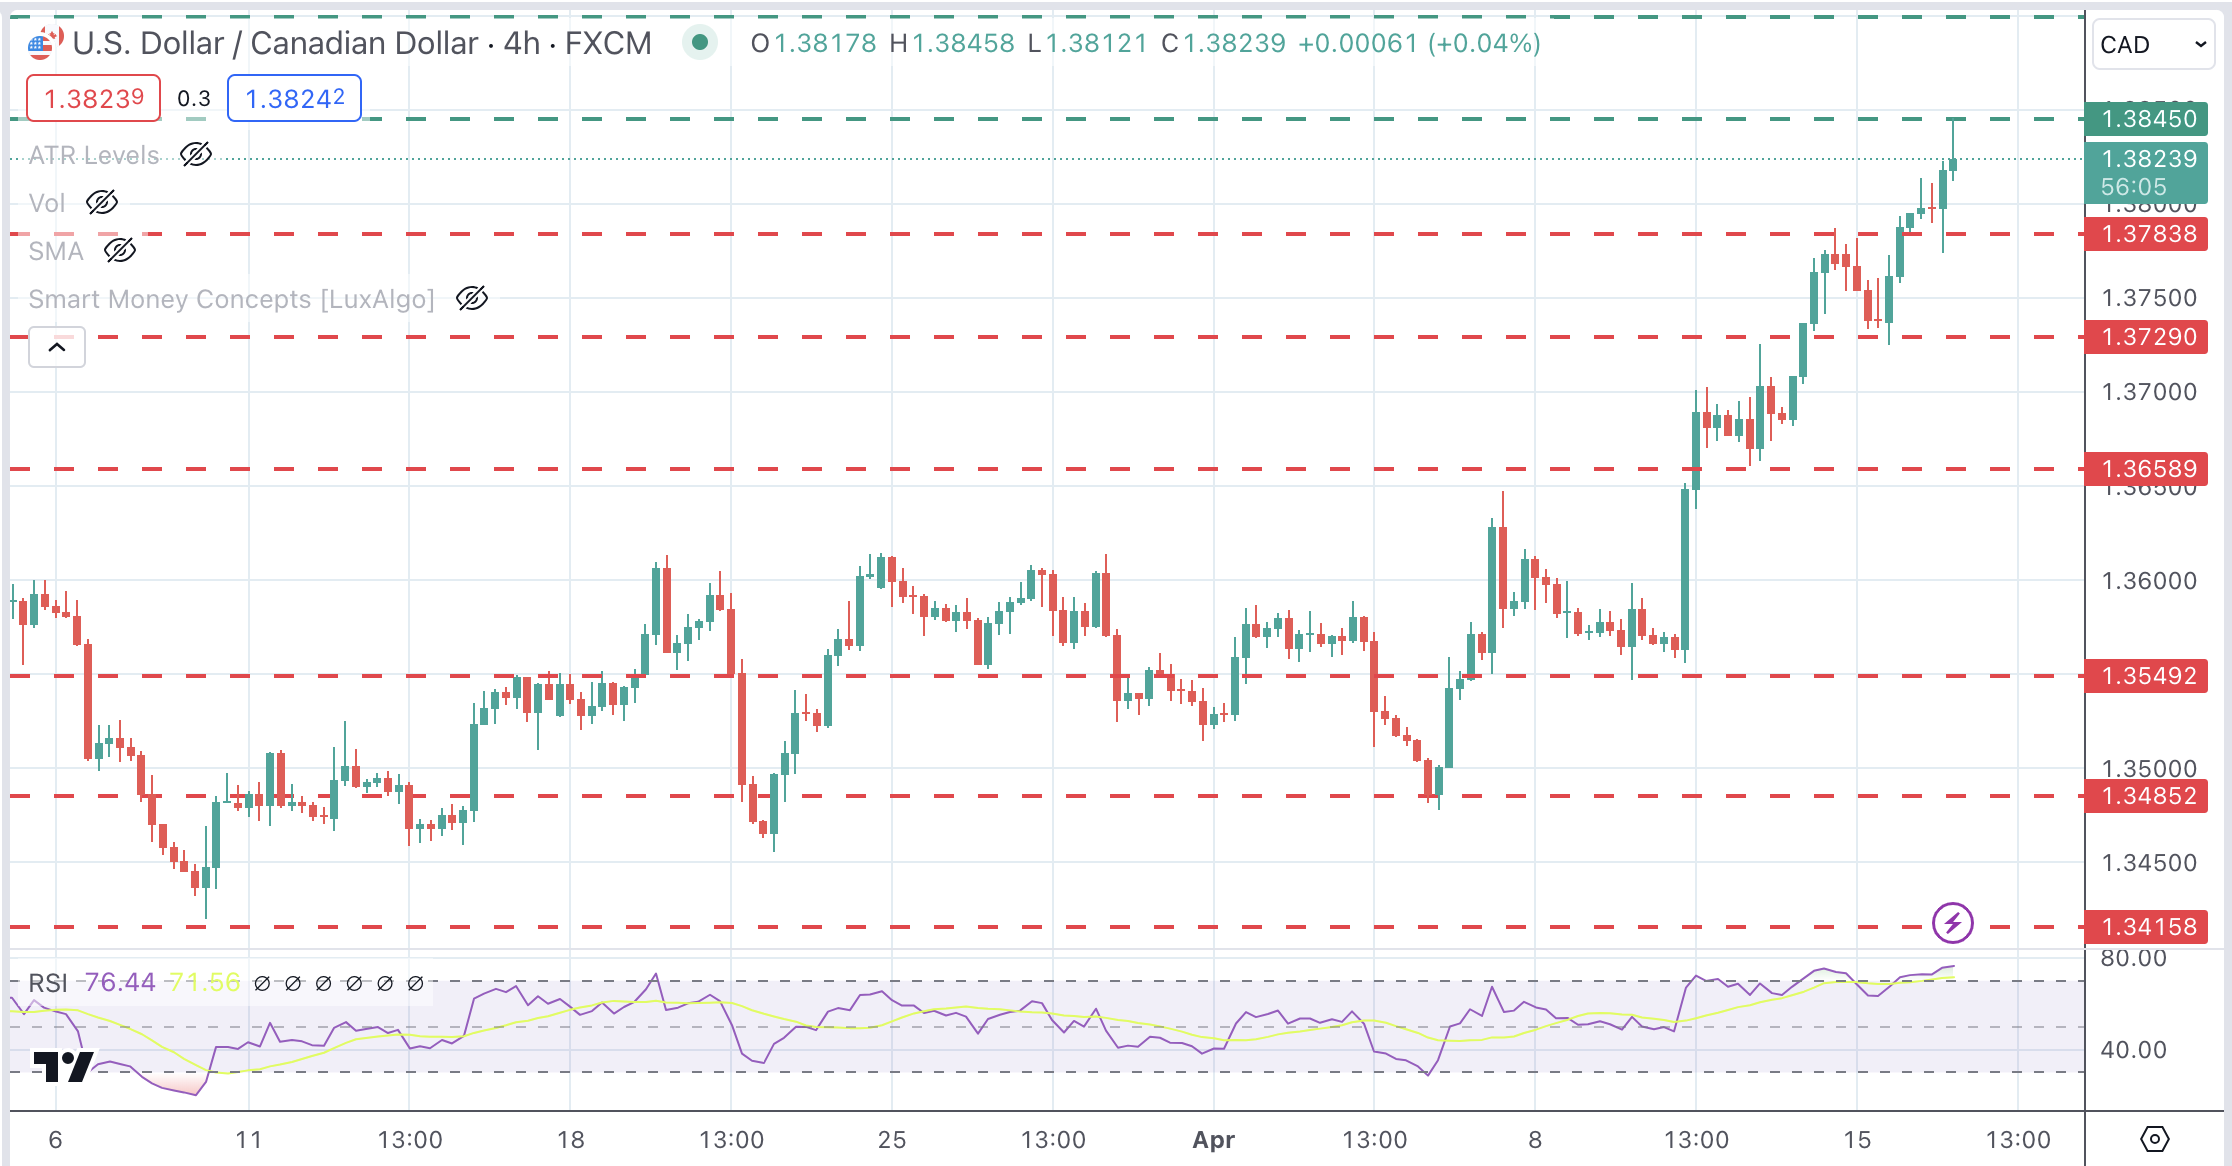
Technical analysis: USD/CAD reaches overbought levels at 1.3845
The US Dollar seems unstoppable. The pair has rallied non-stop during the last six trading days, appreciating nearly 2%. RSI levels are at overbought territory, although with no sign of a reversal in sight.
Bulls have hit resistance at the 1.3845 area, and these conditions suggest the possibility of a bearish correction. In that case, 1.3785 and 1.3730 are likely to provide support. On the upside, above 1.3845, the next target is the November 2023 high at 1.3900.
USD/CAD 4-Hour Chart
Central banks FAQs
Central Banks have a key mandate which is making sure that there is price stability in a country or region. Economies are constantly facing inflation or deflation when prices for certain goods and services are fluctuating. Constant rising prices for the same goods means inflation, constant lowered prices for the same goods means deflation. It is the task of the central bank to keep the demand in line by tweaking its policy rate. For the biggest central banks like the US Federal Reserve (Fed), the European Central Bank (ECB) or the Bank of England (BoE), the mandate is to keep inflation close to 2%.
A central bank has one important tool at its disposal to get inflation higher or lower, and that is by tweaking its benchmark policy rate, commonly known as interest rate. On pre-communicated moments, the central bank will issue a statement with its policy rate and provide additional reasoning on why it is either remaining or changing (cutting or hiking) it. Local banks will adjust their savings and lending rates accordingly, which in turn will make it either harder or easier for people to earn on their savings or for companies to take out loans and make investments in their businesses. When the central bank hikes interest rates substantially, this is called monetary tightening. When it is cutting its benchmark rate, it is called monetary easing.
A central bank is often politically independent. Members of the central bank policy board are passing through a series of panels and hearings before being appointed to a policy board seat. Each member in that board often has a certain conviction on how the central bank should control inflation and the subsequent monetary policy. Members that want a very loose monetary policy, with low rates and cheap lending, to boost the economy substantially while being content to see inflation slightly above 2%, are called ‘doves’. Members that rather want to see higher rates to reward savings and want to keep a lit on inflation at all time are called ‘hawks’ and will not rest until inflation is at or just below 2%.
Normally, there is a chairman or president who leads each meeting, needs to create a consensus between the hawks or doves and has his or her final say when it would come down to a vote split to avoid a 50-50 tie on whether the current policy should be adjusted. The chairman will deliver speeches which often can be followed live, where the current monetary stance and outlook is being communicated. A central bank will try to push forward its monetary policy without triggering violent swings in rates, equities, or its currency. All members of the central bank will channel their stance toward the markets in advance of a policy meeting event. A few days before a policy meeting takes place until the new policy has been communicated, members are forbidden to talk publicly. This is called the blackout period.
- USD/JPY rises propelled by strong US retail data strengthening the Dollar against the Yen.
- US housing indicators falter as Building Permits and Housing Starts underperform, hinting at a construction sector slowdown.
- US Industrial Production remains stable, underlining a mixed yet resilient economic backdrop.
- Japan's Finance Minister Suzuki stresses vigilant Forex market monitoring.
The US Dollar clocks gains versus the Japanese Yen in early trading during the North American session. Strong economic data from the United States (US) and neutral to hawkish comments by US Federal Reserve officials boost the Greenback. The USD/JPY trades at 154.61, 0.22% above its opening price.
USD/JPY moves past 154.00 amidst strong retail sales data and hawkish Fed commentary
US housing data was weaker, revealing that builders may be taking a breather with the high level of inventory. Building Permits in March decreased by 4.3%, with figures dipping to 1.458 million, less than the 1.514 million estimates and February’s 1.523 million. Consequently, Housing Starts plunged -14.7%, from 1.549 million to 1.321 million, below forecasts of 1.48 million.
Other data revealed by the US Federal Reserve (Fed) showed that Industrial Production in March remained unchanged at 0.4% MoM.
Despite that, Monday’s strong Retail Sales data sparked a reaction in the fixed-income market, with US Treasury yields having been rising more than 10 basis points during the week. Traders had trimmed their bets that the Fed might cut rates twice instead of three times, as the Chicago Board of Trade (CBOT) data depicted. The Fed is expected to drive the main reference rate to 4.965% towards the end of 2024.
On Monday, San Francisco Fed President Mary Daly said the US central bank is in no rush to ease policy. Meanwhile, USD/JPY traders await speeches by Fed’s Governor Jefferson, New York Fed John Williams, and Chair Jerome Powell.
According to Finance Minister Suzuki, Japanese authorities have remained vocal about “closely monitoring the latest developments” in the Forex market. Market participants had pushed the exchange rate past the 154.00 threshold, and no reaction by the Bank of Japan (BoJ) or the MoF might keep the rally alive.
USD/JPY Price Analysis: Technical outlook
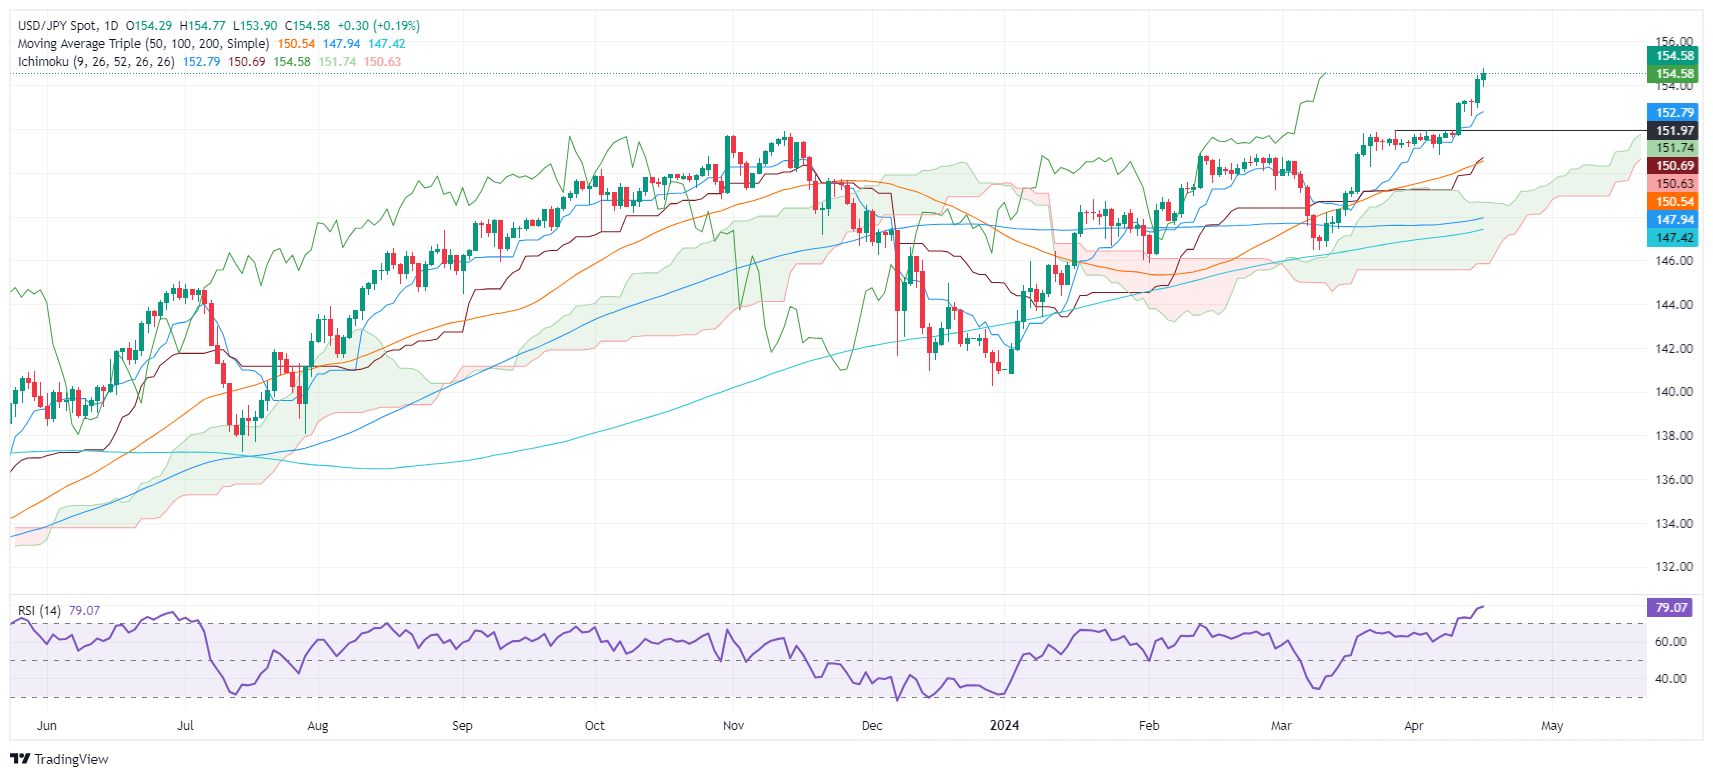
The major remains upward biased, and with no clear signs of intervention, USD/JPY buyers might drive the exchange rate to challenge 155.00. Once cleared, the next stop would be 155.78, followed by the latest cycle high at 160.32. On the flip side, if the pair drops below 154.00, that could open the door for a pullback to April’s 12 high turned support at 153.38 before dropping to 153.00.
Japanese Yen FAQs
The Japanese Yen (JPY) is one of the world’s most traded currencies. Its value is broadly determined by the performance of the Japanese economy, but more specifically by the Bank of Japan’s policy, the differential between Japanese and US bond yields, or risk sentiment among traders, among other factors.
One of the Bank of Japan’s mandates is currency control, so its moves are key for the Yen. The BoJ has directly intervened in currency markets sometimes, generally to lower the value of the Yen, although it refrains from doing it often due to political concerns of its main trading partners. The current BoJ ultra-loose monetary policy, based on massive stimulus to the economy, has caused the Yen to depreciate against its main currency peers. This process has exacerbated more recently due to an increasing policy divergence between the Bank of Japan and other main central banks, which have opted to increase interest rates sharply to fight decades-high levels of inflation.
The BoJ’s stance of sticking to ultra-loose monetary policy has led to a widening policy divergence with other central banks, particularly with the US Federal Reserve. This supports a widening of the differential between the 10-year US and Japanese bonds, which favors the US Dollar against the Japanese Yen.
The Japanese Yen is often seen as a safe-haven investment. This means that in times of market stress, investors are more likely to put their money in the Japanese currency due to its supposed reliability and stability. Turbulent times are likely to strengthen the Yen’s value against other currencies seen as more risky to invest in.
In an interview with CNBC on Tuesday, European Central Bank (ECB) President Christine Lagarde said that the ECB will cut rates soon, barring any major surprises, per Reuters.
"Subject to no development of additional shock, it will be time to moderate restrictive monetary policy in reasonably short order," Lagarde added and said that they are observing a disinflationary process that is moving according to the expectations.
She further noted that geopolitical events' impact on commodity prices are not very significant so far.
Market reaction
EUR/USD came under modest bearish pressure with the immediate reaction. At the time of press, the par was virtually unchanged on the day at 1.0627.
- AUD/USD slips to 0.6400 amid Middle East tensions, faded speculation for Fed rate cuts.
- Fed Daly sees no urgency for rate cuts with high inflation and a strong labor demand.
- The Chinese economy has exhibited a strong footing in the first quarter of this year.
The AUD/USD pair slumps to near the round-level support of 0.6400 in Tuesday’s early American session. The Aussie asset has extended its losing streak for the third trading session on Tuesday as the broader market mood is risk-averse due to worsening Middle East tensions and expectations that the Federal Reserve (Fed) will delay rate cut plans to later this year.
Risk-sensitive currencies have come under pressure as escalating Middle East tensions are expected to disrupt global supply chain. The Israeli military is anticipated to retaliate to Iran for its airstrikes on their territory. Meanwhile, US President Joe Biden said that he wont support the counterattack from Israel.
10-year US Treasury yields jump further to 4.68% as speculation for the Fed reducing interest rates in the June and July policy meeting have receded. Robust US Retail Sales data for March has reinforced expectations that there will be no urgency from the Fed for rate cuts.
San Francisco Fed Bank President said on Monday that “There is "no urgency" to cut US interest rates.” With inflation remaining hot and demand for labor remains strong, the Fed is expected to maintain a restrictive interest rate stance until it gains confidence that inflation will sustainably return to the desired rate of 2%.
In the Asian region, stronger-than-anticipated China’s Q1 Gross Domestic Product (GDP) data failed to improve the market sentiment. In the first quarter of this year, the Chinese economy strongly expanded by 1.6% from 1.2% in the last quarter of 2023, revised higher from 1.0%. The Australian Dollar is expected to get benefitted by China’s improving economic outlook.
On the domestic front, the Australian Dollar will be guided by the Employment data for March, which will be published on Thursday. The Unemployment Rate is forecasted to have increased to 3.9% from 3.7% in February. In the same period, Australian employers are estimated to have hired 7.2K workers, significantly lower from 116.5K.
- USD/CAD rises to 1.3820 as mixed Canadian inflation report keeps BoC rate cut hopes firm.
- BoC’s preferred inflation gauge softens to 2.0% on a year-on-year basis.
- The US Dollar hovers near a six-month high as the Fed is expected to delay rate cut plans.
The USD/CAD pair jumps to 1.3820 in Tuesday’s early New York session after Statistics Canada reported a mixed Consumer Price Index (CPI) report for March. The agency showed that monthly headline CPI grew by 0.6%, slower from expectations of 0.7% but higher than the prior reading of 0.3%. However, the annual headline inflation data accelerated to 2.9% from the prior reading of 2.8%.
The monthly Bank of Canada (BoC) CPI core data, which excludes eight volatile items, rose sharply by 0.5% compared to a meagre 0.1% growth in February. However, the annual core CPI slowed to 2% from the prior reading of 2.1%.
The return of the BoC’s most preferred inflation measure to a desired rate of 2% is expected to allow the Bank of Canada (BoC) to start reducing interest rates, which are currently expected from the June policy meeting.
Last week, BoC Governor Tiff Macklem said a rate cut in June is possible if inflation continues to decelerate sustainably after the BoC keeps interest rates unchanged at 5%. The BoC has kept interest rates steady at 5% since July 2023 to maintain downward pressure on consumer price inflation.
Meanwhile, significant demand for safe-haven assets due to worsening geopolitical tensions and faded speculation for Federal Reserve (Fed) rate cuts for the June and July policy meetings have built pressure on the Canadian Dollar.
The US Dollar Index (DXY) falls slightly from a five-month high of 106.44. The near-term demand for the US Dollar remains intact as investors see the Fed keeping interest rates higher for a longer period. Inflation remaining higher than expectations for three months in a row suggests that there should be no urgency for rate cuts.
- Industrial Production in the US continued to expand at a moderate pace.
- US Dollar Index continues to fluctuate above 106.00.
Industrial Production in the US grew 0.4% on a monthly basis in March, the US Federal Reserve (Fed) reported on Tuesday. This reading followed the 0.4% increase recorded in February and came in line with the market expectation.
"Manufacturing output increased 0.5% in March, boosted in part by a gain of 3.1% in motor vehicles and parts; factory output excluding motor vehicles and parts moved up 0.3%," the Fed said in its press release. "Capacity utilization moved up to 78.4% in March, a rate that is 1.2 percentage points below its long-run (1972–2023) average."
Market reaction
The US Dollar showed no immediate reaction to this report. At the time of press, the US Dollar Index was up 0.1% on the day at 106.27.
Inflation in Canada, as measured by the change in the Consumer Price Index (CPI), rose by 2.9% on a yearly basis in March from 2.8% in February, Statistics Canada reported on Tuesday. This reading came in above market expectations. On a monthly basis, the CPI went up by 0.6%.
The annual Core CPI, which excludes volatile food and energy prices, was up by 2.0% in the same period, down from 2.1% in the previous month.
According to Statistics Canada, "Shelter prices continued to apply upward pressure in March, with the mortgage interest cost and rent indexes contributing the most to the year-over-year gain in the all-items CPI."
In addition, "Prices for services (+4.5%) continued to rise in March compared with February (+4.2%), driven by air transportation and rent, outpacing price growth for goods (+1.1%) which slowed compared with February (+1.2%) on a yearly basis."
Market Reaction
The Canadian Dollar debilitates further and lifts USD/CAD to new 2024 peaks north of 1.3800 the figure amidst the flattish tone in the Greenback.
Canadian Dollar FAQs
The key factors driving the Canadian Dollar (CAD) are the level of interest rates set by the Bank of Canada (BoC), the price of Oil, Canada’s largest export, the health of its economy, inflation and the Trade Balance, which is the difference between the value of Canada’s exports versus its imports. Other factors include market sentiment – whether investors are taking on more risky assets (risk-on) or seeking safe-havens (risk-off) – with risk-on being CAD-positive. As its largest trading partner, the health of the US economy is also a key factor influencing the Canadian Dollar.
The Bank of Canada (BoC) has a significant influence on the Canadian Dollar by setting the level of interest rates that banks can lend to one another. This influences the level of interest rates for everyone. The main goal of the BoC is to maintain inflation at 1-3% by adjusting interest rates up or down. Relatively higher interest rates tend to be positive for the CAD. The Bank of Canada can also use quantitative easing and tightening to influence credit conditions, with the former CAD-negative and the latter CAD-positive.
The price of Oil is a key factor impacting the value of the Canadian Dollar. Petroleum is Canada’s biggest export, so Oil price tends to have an immediate impact on the CAD value. Generally, if Oil price rises CAD also goes up, as aggregate demand for the currency increases. The opposite is the case if the price of Oil falls. Higher Oil prices also tend to result in a greater likelihood of a positive Trade Balance, which is also supportive of the CAD.
While inflation had always traditionally been thought of as a negative factor for a currency since it lowers the value of money, the opposite has actually been the case in modern times with the relaxation of cross-border capital controls. Higher inflation tends to lead central banks to put up interest rates which attracts more capital inflows from global investors seeking a lucrative place to keep their money. This increases demand for the local currency, which in Canada’s case is the Canadian Dollar.
Macroeconomic data releases gauge the health of the economy and can have an impact on the Canadian Dollar. Indicators such as GDP, Manufacturing and Services PMIs, employment, and consumer sentiment surveys can all influence the direction of the CAD. A strong economy is good for the Canadian Dollar. Not only does it attract more foreign investment but it may encourage the Bank of Canada to put up interest rates, leading to a stronger currency. If economic data is weak, however, the CAD is likely to fall.
This section below was published as a preview of the Canadian inflation data at 08:00 GMT.
- The Canadian Consumer Price Index is expected to have risen by 3.1% YoY in February.
- The BoC shows no rush to lower its interest rate.
- The Canadian Dollar maintains its multi-day lows against the US Dollar around 1.3540.
Canada is slated to unveil the always-relevant inflation-related figures on Tuesday. Statistics Canada will release the Consumer Price Index (CPI) for the month of February, with expectations pointing towards a year-on-year rise of 3.1% in the headline print, slightly surpassing January’s 2.9% increase. Monthly projections anticipate a 0.6% increase in the index compared to the previous month's flat reading.
Alongside the CPI data, the Bank of Canada (BoC) will release its Core Consumer Price Index gauge, which excludes volatile elements like food and energy costs. In January, the BoC Core CPI indicated a monthly uptick of 0.1% and a year-on-year rise of 2.4%.
These statistics will be closely monitored as they could influence the trajectory of the Canadian Dollar (CAD) and shape outlooks regarding the Bank of Canada's monetary policy. Speaking about the Canadian Dollar (CAD), it has shown weakness against the US Dollar (USD) in past sessions and presently hovers around multi-session lows well past the 1.3500 yardstick.
What to expect from Canada’s inflation rate?
Analysts expect a pick-up of price pressures throughout Canada during last month. In fact, inflation measured by annual changes in the Consumer Price Index, is forecast to resume its upward trajectory in February, mirroring trends observed in many of Canada's G10 counterparts, notably its neighbour, the US. After reaching 4% in August, the CPI has shown a downward trend, with the exception of the bounce recorded in the last month of the year. All in all, inflation indicators still remain well above the Bank of Canada's 2% target.
Should the forthcoming data confirm the anticipated increase in inflationary pressures, investors might consider the possibility of the central bank keeping the current restrictive stance in place for a longer duration than originally predicted. Still, any additional tightening of monetary conditions seems unlikely, as per comments from the bank’s officials.
The latter situation would necessitate a sudden and sustained resurgence of price pressures and a rapid increase in consumer demand, both of which seem improbable in the foreseeable future.
During his remarks at the latest BoC meeting, Governor Tiff Macklem expressed optimism about the ongoing battle against inflation, noting current progress and anticipating further advancements. He highlighted the significance of core inflation measures, suggesting that if they remain unchanged, the forecasts for overall inflation reduction may not come to fruition. He assessed the risks to the inflation outlook as reasonably balanced and noted that well-anchored inflation expectations are aiding efforts to bring inflation back under control.
When is the Canada CPI data due and how could it affect USD/CAD?
On Tuesday at 12:30 GMT, Canada is set to release the Consumer Price Index for February. The Canadian Dollar's potential response is tied to changes in monetary policy expectations by the Bank of Canada. However, barring any real surprise in either direction, the BoC is unlikely to change its current cautious monetary policy stance, in line with other central banks such as the Federal Reserve (Fed).
The USD/CAD has started the new trading year in quite a bullish fashion, although the uptrend appears to have met a decent barrier around the 1.3600 zone.
Pablo Piovano, Senior Analyst at FXStreet, says: “There is a strong likelihood of USD/CAD maintaining the constructive bias as long as it remains above the significant 200-day Simple Moving Average (SMA) at 1.3479. The bullish sentiment is expected to strengthen even more if there is a sustained break above the so-far yearly tops around 1.3600. On the flip side, the breach of the 200-day SMA could open the door to extra losses and a potential move to the January low of 1.3358 (January 31). South from here, there are no support levels of note prior to the December 2023 bottom of 1.3177, which occurred on December 27”.
Pablo adds: "Significant increases in volatility around CAD would require unexpected inflation figures. If the numbers fall below expectations, it could strengthen the argument for potential interest rate cuts by the BoC in the next few months, further appreciating USD/CAD. However, a rebound in the CPI, similar to trends observed in the US, might provide some support to the Canadian Dollar, although to a limited extent. A higher-than-anticipated inflation reading would intensify pressure on the Bank of Canada to maintain elevated rates for an extended period, potentially resulting in prolonged challenges for many Canadians dealing with higher interest rates, as highlighted by Bank of Canada Governor Macklem."
Economic Indicator
Canada Consumer Price Index (YoY)
The Consumer Price Index (CPI), released by Statistics Canada on a monthly basis, represents changes in prices for Canadian consumers by comparing the cost of a fixed basket of goods and services. The YoY reading compares prices in the reference month to the same month a year earlier. Generally, a high reading is seen as bullish for the Canadian Dollar (CAD), while a low reading is seen as bearish.
Read more.Next release: 03/19/2024 12:30:00 GMT
Frequency: Monthly
Source: Statistics Canada
Bank of Canada FAQs
The Bank of Canada (BoC), based in Ottawa, is the institution that sets interest rates and manages monetary policy for Canada. It does so at eight scheduled meetings a year and ad hoc emergency meetings that are held as required. The BoC primary mandate is to maintain price stability, which means keeping inflation at between 1-3%. Its main tool for achieving this is by raising or lowering interest rates. Relatively high interest rates will usually result in a stronger Canadian Dollar (CAD) and vice versa. Other tools used include quantitative easing and tightening.
In extreme situations, the Bank of Canada can enact a policy tool called Quantitative Easing. QE is the process by which the BoC prints Canadian Dollars for the purpose of buying assets – usually government or corporate bonds – from financial institutions. QE usually results in a weaker CAD. QE is a last resort when simply lowering interest rates is unlikely to achieve the objective of price stability. The Bank of Canada used the measure during the Great Financial Crisis of 2009-11 when credit froze after banks lost faith in each other’s ability to repay debts.
Quantitative tightening (QT) is the reverse of QE. It is undertaken after QE when an economic recovery is underway and inflation starts rising. Whilst in QE the Bank of Canada purchases government and corporate bonds from financial institutions to provide them with liquidity, in QT the BoC stops buying more assets, and stops reinvesting the principal maturing on the bonds it already holds. It is usually positive (or bullish) for the Canadian Dollar.
- Housing Starts and Building Permits in the US declined sharply in March.
- The US Dollar Index holds above 106.00 after housing data.
Housing Starts in the US fell 14.7% in March to 1.32 million units, the monthly data published by the US Census Bureau revealed on Tuesday. This reading followed the 12.7% increase (revised from 10.7%) recorded in February.
In the same period, Building Permits declined 4.3% after rising 2.3% (revised from 1.9%) in January.
Market reaction
The US Dollar Index edged lower with the immediate reaction and was last seen trading flat on the day at 106.15.
Analysts at BBH share their near-term outlook for the US Dollar Index (DXY).
Dollar rally should continue
"The dollar is trading higher in the wake of strong retail sales data. DXY traded at a new cycle near 106.437 earlier today but has since drifted lower to 106.266 currently. It remains on track to test the November 1 high near 107.113."
"The euro is trading flat near $1.0625 but the clean break below $1.0755 sets up a test of the November 1 low near $1.0515. Elsewhere, sterling is trading flat near $1.2445 after mixed U.K. labor market data. USD/JPY traded at a new cycle high near 154.60 as jawboning becomes stale."
"The dollar rally should continue as recent data confirm persistent inflation and robust growth in the U.S. The US data continue to come in mostly firmer and should keep upward pressure on US yields. We believe that while market easing expectations have adjusted violently after CPI, there is still room to go. When the market finally capitulates on the Fed, the dollar should gain further."
- The US Dollar enters a fifth straight day of gains against most major peers.
- Markets are awaiting a change in stance from Fed Chairman Powell on Tuesday.
- The US Dollar Index remains steady above 106.00 targeting now the 2023’s high.
The US Dollar Index (DXY) rallies forward as the King Dollar gains ground against several major peers. The Greenback is enjoying the change in narrative on the rate differential since last week, which got bigger against other currencies in favor of the US Dollar. Additional tailwind comes from Israel, which vowed yet to retaliate against Iran despite diplomatic efforts to ease tensions in the Middle East, now really putting the region back on the brink of war.
On the economic data front, the data points will not really move the needle for the US Dollar on Tuesday. Main event comes in the form of three Federal Reserve (Fed) speakers, with Fed Chairman Jerome Powell being the most important. Powell’s speech could be the game changer, as any change in wording on rate cut expectations or outlook from the Fed Chairman could spark either another leg higher for the Greenback or start a severe pullback.
Daily digest market movers: Forget about the data today
- At 12:30 GMT some Housing data for March is set to be released:
- Building Permits are expected to decrease to 1.514 million from 1.524 million.
- Housing starts are expected to decline to 1.48 million from 1.521 million.
- At 12:55 GMT the year-over-year Redbook Index for the week ending April 12 will be released. The index was at 5.4% the week of April 5.
- At 13:15 GMT the Fed will publish the Capacity and Industrial Production numbers for March:
- Capacity Utilization will head to 78.5% from 78.3%, according to expectations.
- Industrial Production is seen heading to 0.4% from 0.1%.
- A slew of Fed speakers that will try to guide the markets:
- At 13:00 GMT, Federal Reserve Vice Chair Philip Jefferson is due to deliver a keynote speech at the International Research Forum on Monetary Policy in Washington, DC.
- Around 16:30 GMT Federal Reserve Bank of New York President John Williams will moderate a conversation at the Economy Club of New York.
- Near 17:15 GMT, Federal Reserve Chair Jerome Powell will enter a discussion panel with the Bank of Canada governor Tiff Macklem at the Washington Forum.
- Equities nosedive lower after the sharp Monday’s drop, where most of major US indexes lost their initial gains to close more than 1% lower. On Tuesday, both Europe and Asia equities slid lower by more than 1%, while US futures are looking bleak ahead of the US opening bell.
- According to the CME Group’s FedWatch Tool, expectations for a Fed pause in the May meeting are at 98.2%, while chances of a rate cut stand at 1.8%. Although there are calls for a rate hike, those are not being represented in the CME futures yet, and could add to substantial more US Dollar strength once the possibility starts to be priced in as a possibility.
- The benchmark 10-year US Treasury Note trades around 4.64%. Further move upwards could even point to expectations of another rate hike before the easing cycle will start to take place.
US Dollar Index Technical Analysis: Squeeze out the weak
The US Dollar Index (DXY) is rolling through markets and clearly the division between weak and strong currencies becomes very more clear. The Greenback looks to be the ultimate gainer while Europe and China look very bleak in terms of rates and keeping them steady for longer. WIth these main currencies set to devalue substantially further in the coming weeks and months, the end of the King Dollar does not look to be taking place anytime soon, as long as US data keeps outperforming. Bets on a weaker US Dollar will get squeezed out time after time
On the upside, the first level for the DXY is the November 10 high at 106.01, just above the 106.00 figure, which got taken out overnight. Further up and above the 107.00 round level, the DXY Index could meet resistance at 107.35, the October 3 high.
On the downside, the first important level is 105.88, a pivotal level since March 2023 and which proved its importance on Monday holding support. Further down, 105.12 and 104.60 should also act as a support, ahead of the region with both the 55-day and the 200-day Simple Moving Averages (SMAs) at 103.97 and 103.84, respectively.
US Dollar FAQs
The US Dollar (USD) is the official currency of the United States of America, and the ‘de facto’ currency of a significant number of other countries where it is found in circulation alongside local notes. It is the most heavily traded currency in the world, accounting for over 88% of all global foreign exchange turnover, or an average of $6.6 trillion in transactions per day, according to data from 2022. Following the second world war, the USD took over from the British Pound as the world’s reserve currency. For most of its history, the US Dollar was backed by Gold, until the Bretton Woods Agreement in 1971 when the Gold Standard went away.
The most important single factor impacting on the value of the US Dollar is monetary policy, which is shaped by the Federal Reserve (Fed). The Fed has two mandates: to achieve price stability (control inflation) and foster full employment. Its primary tool to achieve these two goals is by adjusting interest rates. When prices are rising too quickly and inflation is above the Fed’s 2% target, the Fed will raise rates, which helps the USD value. When inflation falls below 2% or the Unemployment Rate is too high, the Fed may lower interest rates, which weighs on the Greenback.
In extreme situations, the Federal Reserve can also print more Dollars and enact quantitative easing (QE). QE is the process by which the Fed substantially increases the flow of credit in a stuck financial system. It is a non-standard policy measure used when credit has dried up because banks will not lend to each other (out of the fear of counterparty default). It is a last resort when simply lowering interest rates is unlikely to achieve the necessary result. It was the Fed’s weapon of choice to combat the credit crunch that occurred during the Great Financial Crisis in 2008. It involves the Fed printing more Dollars and using them to buy US government bonds predominantly from financial institutions. QE usually leads to a weaker US Dollar.
Quantitative tightening (QT) is the reverse process whereby the Federal Reserve stops buying bonds from financial institutions and does not reinvest the principal from the bonds it holds maturing in new purchases. It is usually positive for the US Dollar.
- EUR/USD drops to 1.0600 as the Fed is expected to pivot to rate cuts after the ECB.
- Eurozone’s weak economic outlook and cooling inflation fuel ECB rate cut bets.
- Fed policymakers emphasize keeping interest rates higher until they are sure about inflation returning sustainably to 2%.
The EUR/USD pair trades close to more than a five-month low near the round-level support of 1.0600 in the European session on Tuesday. The major currency pair is vulnerable to further downside as investors see the policy divergence between the Federal Reserve (Fed) and the European Central Bank (ECB) extending further.
Market expectations for the European Central Bank (ECB) to begin reducing interest rates from the June meeting have escalated. The weak Eurozone economic outlook and consecutive cooling core inflationary pressures for eight months have increased the likelihood of the ECB pivoting to rate cuts.
Last week, ECB President Christine Lagarde said if a fresh assessment increase policymakers' confidence that inflation is heading back to target, then it "would be appropriate" to cut interest rates, Reuters reported. ECB Lagarde delivered the statement in an interview post policy meeting in which the Main Refinancing Operations Rate was kept unchanged at 4.5%.
Meanwhile, traders have priced out expectations for Federal Reserve (Fed) rate cuts in the June and July policy meetings as core United States inflation remains stronger than expected in three months this year. This has strengthened the argument that the Fed should keep interest rates restrictive for a longer period.
Currently, investors expect that the Fed will start reducing interest rates from the September meeting. The Fed pivoting to rate cuts later than the ECB will stretch the policy divergence.
Going forward, speeches from various Fed policymakers will guide market expectations for Fed rate cuts. Fed policymakers are expected to support keeping interest rates higher until they are convinced that inflation will sustainably return to the desired rate of 2%.
- Natural Gas prices show sensitivity towards the situation in the Middle East.
- Markets were caught by surprise as Israel said it will retaliate against Iran.
- The US Dollar Index pops back above 106.00 and is running into a winning streak.
Natural Gas (XNG/USD) prices are getting some support on Tuesday after Israel issued a harsh statement saying that it has no choice but to retaliate again against Iran, ignoring several diplomatic calls and G7 leaders urging Israel to keep its head cool. The sigh of relief seen on Monday after Iran said it does not want to seek any further escalation of tensions led to a 4% decline in Gas prices, but this proved to be short-lived.
With risks of an escalating war still on the cards, the DXY US Dollar Index is thriving as the main safe haven for investors to park their funds. As if that is not enough, the overall market narrative about US interest rates is changing, with investors pricing in that rates will either stay steady for longer or even rise further even as Federal Reserve (Fed) officials are still seeing a reason to cut this year. The gap between market expectations and the Fed is substantially big, and could mean more US Dollar strength to come should Fed Chairman Jerome Powell this evening admit that cuts will be postponed.
Natural Gas is trading at $1.91 per MMBtu at the time of writing.
Natural Gas news and market movers: Middle East headlines main drivers
- Despite several attempts from US Secretary of State Antony Blinken and several G7 heads of state, Israel is planning to advance with another attack on Iran in retaliation for the drone attacks over the weekend, several sources such as Reuters and Bloomberg report.
- European Gas prices are jumping higher as well on the back of Monday’s headline events out of Israel and Iran.
- Unplanned works at Norway’s Nyhamna and Dvalin facilities are expected to take place for the rest of the week, seeing a lower than average Gas flow from Norway into Europe.
- Swiss MET Group has expanded its LNG trading business with long-term capacities in Germany, Spain and Croatia. This further proves the massive international interest in the European Gas market.
Natural Gas Technical Analysis: Tit for tat
Natural Gas prices are at risk of jumping higher with this tit for tat headline risk. Despite several diplomatic calls for Israel to keep its head calm and be the bigger person in the room, Israel said it has all rights to retaliate. This means more tensions will arise in the region, while attention is diverted away from Gaza, and could see supply disruptions in Gas flows with possible key pipelines being sabotaged.
On the upside, the red descending trend line at $1.99-$2.00 looks ready for another test. Should Gas prices snap above it, a quick rally to $2.11 could be seen. Not that far off, $2.15 in the form of the 100-day Simple Moving Average (SMA) becomes the main resistance level.
On the downside, the 55-day SMA around $1.88 should be a safety net. Next, the green ascending trend line near $1.83 should support the rally since mid-February. Should even that level break, a dive to $1.60 and $1.53 would not be impossible.
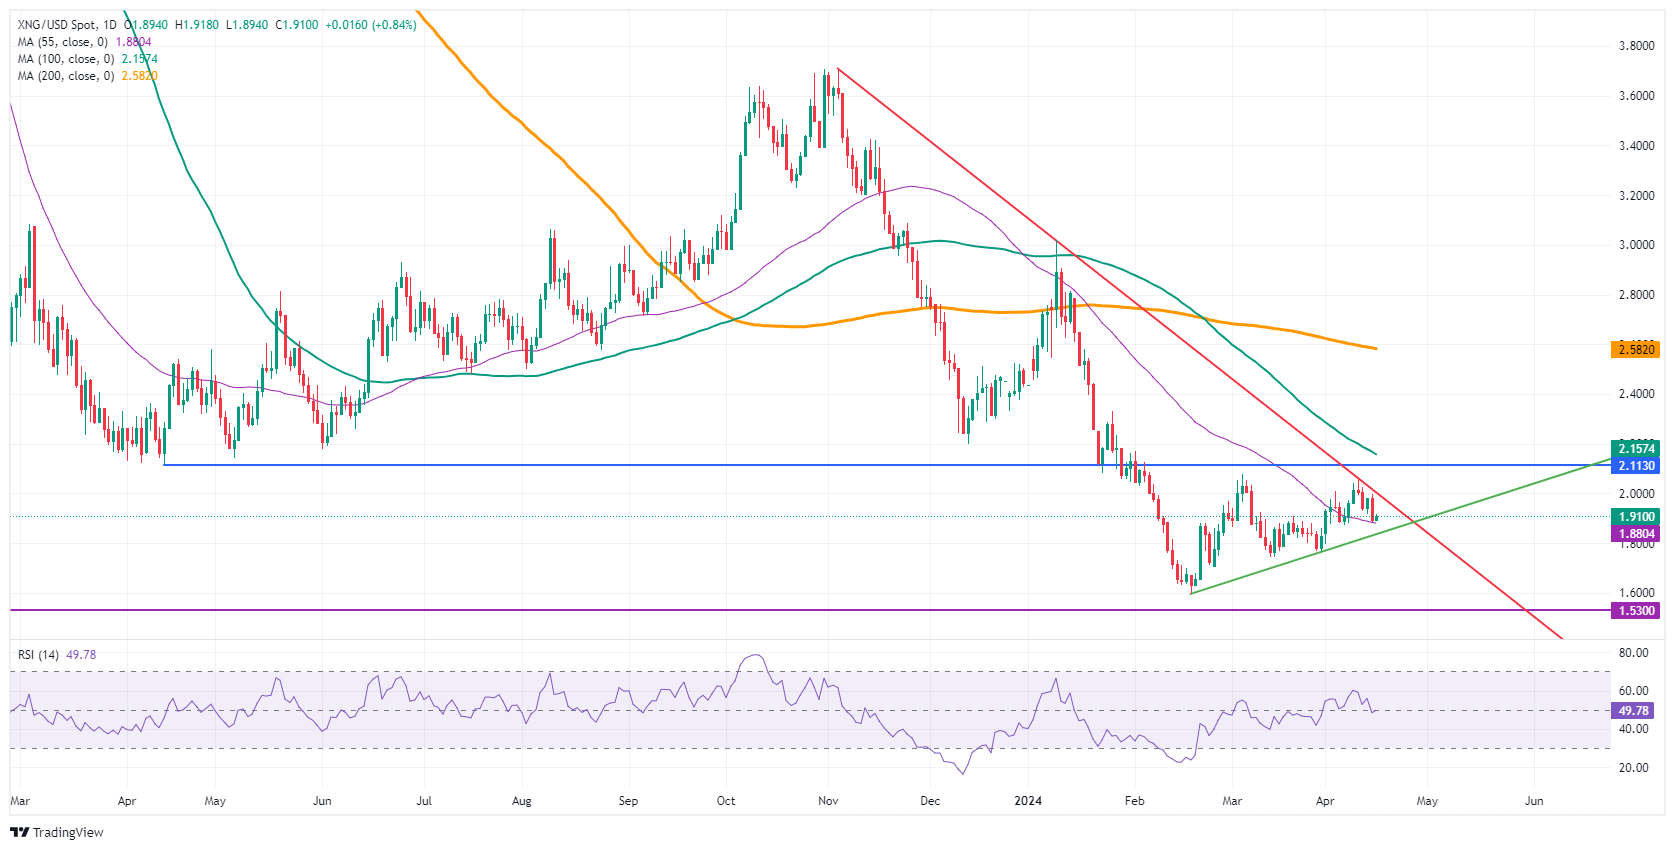
Natural Gas: Daily Chart
Natural Gas FAQs
Supply and demand dynamics are a key factor influencing Natural Gas prices, and are themselves influenced by global economic growth, industrial activity, population growth, production levels, and inventories. The weather impacts Natural Gas prices because more Gas is used during cold winters and hot summers for heating and cooling. Competition from other energy sources impacts prices as consumers may switch to cheaper sources. Geopolitical events are factors as exemplified by the war in Ukraine. Government policies relating to extraction, transportation, and environmental issues also impact prices.
The main economic release influencing Natural Gas prices is the weekly inventory bulletin from the Energy Information Administration (EIA), a US government agency that produces US gas market data. The EIA Gas bulletin usually comes out on Thursday at 14:30 GMT, a day after the EIA publishes its weekly Oil bulletin. Economic data from large consumers of Natural Gas can impact supply and demand, the largest of which include China, Germany and Japan. Natural Gas is primarily priced and traded in US Dollars, thus economic releases impacting the US Dollar are also factors.
The US Dollar is the world’s reserve currency and most commodities, including Natural Gas are priced and traded on international markets in US Dollars. As such, the value of the US Dollar is a factor in the price of Natural Gas, because if the Dollar strengthens it means less Dollars are required to buy the same volume of Gas (the price falls), and vice versa if USD strengthens.
- Gold price falls as receding Fed rate cut hopes limit demand.
- Strong US Retail Sales fuel uncertainty over the timing of the Fed interest-rate cuts.
- Worsening Middle East tensions keep supporting the Gold price.
Gold price (XAU/USD) drops after facing selling pressure near the crucial resistance of $2,400 in Tuesday’s European session. The precious metal comes under pressure as the US Dollar and Treasury yields extend their upside after strong March United States Retail Sales data added to doubts about when the Federal Reserve (Fed) will deliver an initial rate cut.
10-year US Treasury yields rise to 4.63%, refreshing a five-month high. Financial markets anticipate that the Fed will begin reducing its key borrowing rates from September. Also, traders see only two cuts instead of three as projected by the majority of Fed policymakers in the latest dot plot. The US Dollar Index (DXY), which tracks the US Dollar’s value against six major currencies, rises to 106.30.
Higher bond yields weigh on Gold as they increase the opportunity cost of investing in it. However, Gold has performed strongly in the past few weeks despite rising bond yields amid geopolitical tensions in the Middle East region. As a safe-haven asset, Gold demand from investors and central banks increases at times of global economic uncertainty and worsening geopolitical tensions.
Daily digest market movers: Gold price faces pressure after robust US Retail Sales data
- Gold price slides to $2,370 while attempting to recapture new all-time highs around $2,430. Sheer strength in the US Dollar and US bond yields have been acting as a barricade to Gold. The appeal of the US Dollar strengthens and bond yields rise further as robust Retail Sales data for March has deepened the uncertainty about when the Federal Reserve will start lowering its key interest rates.
- The US Retail Sales data for March, released on Monday, indicated a strong demand despite US interest rates remaining higher. The monthly Retail Sales increased by a sharp 0.7%, more than the 0.3% rise expected. Retail Sales in February were revised higher to 0.9% from 0.6%. Retail Sales data is one of the leading indicators of consumer spending, which accounts for more than two-thirds of the US economy. Higher Retail Sales suggest demand from households remains strong, a factor fueling inflation.
- Strong Retail Sales data, combined with robust labor demand and a higher-than-expected Consumer Price Index (CPI) data, has forced traders to unwind expectations for early Fed rate cuts. The CME FedWatch tool shows markets are pricing in that interest rates will remain unchanged in the range of 5.25%- 5.50% in the June and July meetings. The Fed is now anticipated to pivot to rate cuts in September.
- Meanwhile, fears over Middle East tensions spreading beyond Gaza keep the safe-haven demand strong. Investors worry about a further escalation in the Israel-Iran tensions after Israel’s military Chief of Staff Herzi Halev said they would respond to Iran’s attack on their territory, in which hundreds of drones and missiles were fired, AlJazeera reports. US President Joe Biden said it won’t support the counterattack from Israel.
Technical Analysis: Gold price falls to $2,370
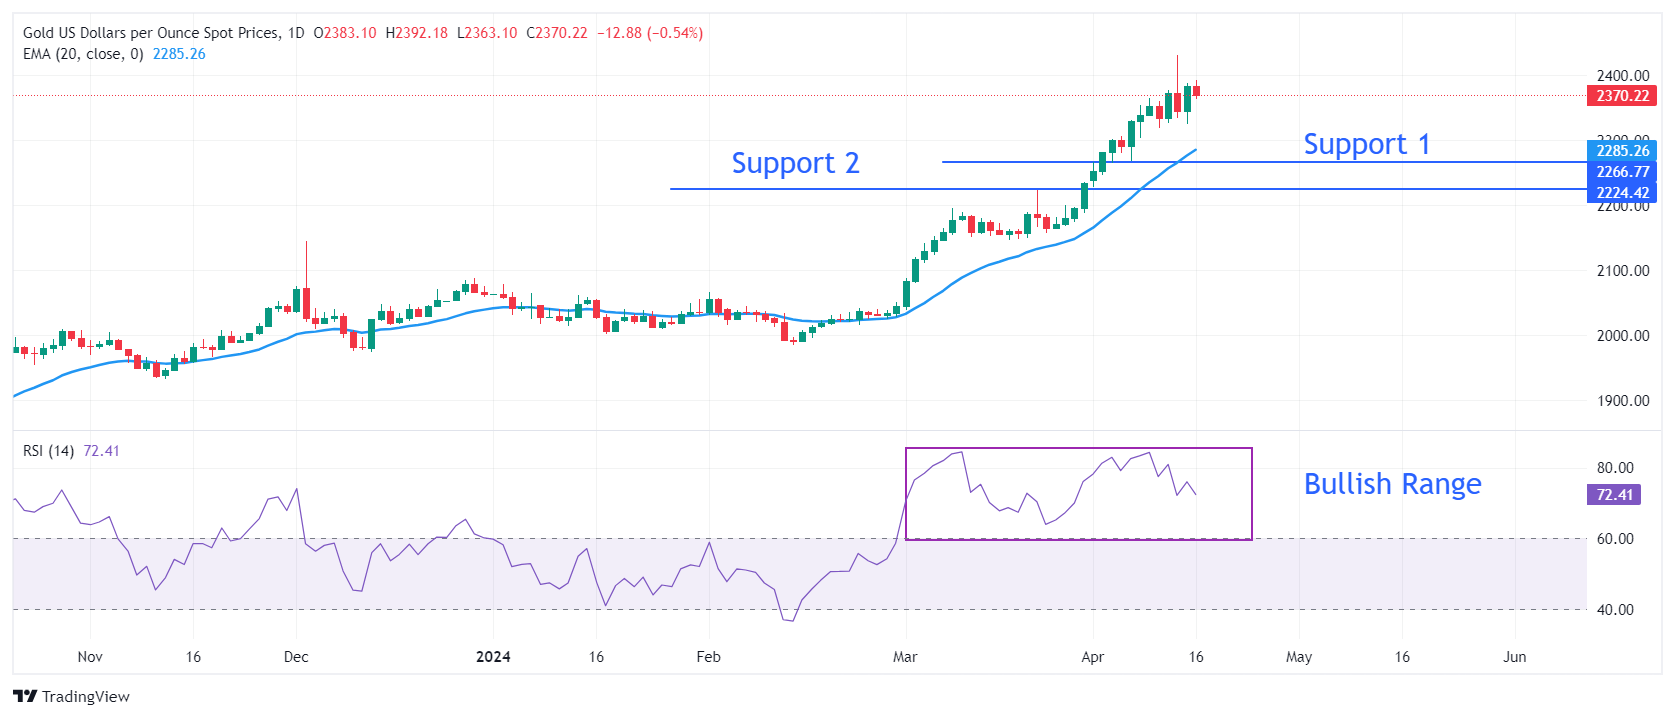
Gold price falls back after failing to recapture fresh lifetime highs near $2,430. The upside in the precious metal remains limited as momentum oscillators are cooling down after turning extremely overbought. The 14-period Relative Strength Index (RSI) on the daily chart drops slightly after peaking around 85.00. The broader-term demand is intact as the RSI remains in the bullish range of 60.00-80.00.
On the downside, April 5 low near $2,268 and March 21 high at $2,223 will be major support areas for the Gold price.
Gold FAQs
Gold has played a key role in human’s history as it has been widely used as a store of value and medium of exchange. Currently, apart from its shine and usage for jewelry, the precious metal is widely seen as a safe-haven asset, meaning that it is considered a good investment during turbulent times. Gold is also widely seen as a hedge against inflation and against depreciating currencies as it doesn’t rely on any specific issuer or government.
Central banks are the biggest Gold holders. In their aim to support their currencies in turbulent times, central banks tend to diversify their reserves and buy Gold to improve the perceived strength of the economy and the currency. High Gold reserves can be a source of trust for a country’s solvency. Central banks added 1,136 tonnes of Gold worth around $70 billion to their reserves in 2022, according to data from the World Gold Council. This is the highest yearly purchase since records began. Central banks from emerging economies such as China, India and Turkey are quickly increasing their Gold reserves.
Gold has an inverse correlation with the US Dollar and US Treasuries, which are both major reserve and safe-haven assets. When the Dollar depreciates, Gold tends to rise, enabling investors and central banks to diversify their assets in turbulent times. Gold is also inversely correlated with risk assets. A rally in the stock market tends to weaken Gold price, while sell-offs in riskier markets tend to favor the precious metal.
The price can move due to a wide range of factors. Geopolitical instability or fears of a deep recession can quickly make Gold price escalate due to its safe-haven status. As a yield-less asset, Gold tends to rise with lower interest rates, while higher cost of money usually weighs down on the yellow metal. Still, most moves depend on how the US Dollar (USD) behaves as the asset is priced in dollars (XAU/USD). A strong Dollar tends to keep the price of Gold controlled, whereas a weaker Dollar is likely to push Gold prices up.
Analysts at TD Securities note that Bank of Canada (BoC) Governor Macklem will add to a number of CAD risk events on Tuesday afternoon when he holds a fireside chat with Federal Reserve Chairman Jerome Powell at 17:15 GMT.
Markets will also watch Chairman Powell's remarks on inflation
"The topic for their discussion will be "Economic trends in North America," but coming just hours after the March CPI report the bigger question for Canadian investors will be to what extent that report adds to the Bank's confidence that recent inflation progress will be sustained, and how far Macklem is willing to lean into that message."
"However, the Bank will still get one more CPI report before its June decision, and with TD and the market looking for headline CPI to push higher in March we could see a more balanced message emerge from Macklem's fireside chat. Markets will also be watching Chairman Powell's remarks for his view on recent inflation dynamics after the upside surprise March CPI, and any implications from a more drawn-out disinflation process in the US."
Economists at Standard Chartered offer their afterthoughts on China’s quarterly growth numbers released on Tuesday.
Key quotes
“China’s economy grew 5.3% y/y or 6.6% annualized in Q1, beating market consensus by a wide margin.”
“Output gap narrowed to -1.6% of GDP in Q1 from -2.2% in Q4; GDP deflator stayed negative at -1.1% y/y.”
“We think it is still too early to sound the all-clear on China’s economy as it continues to battle a sluggish domestic housing market, weak consumer confidence and disinflationary pressure.“
“Further monetary easing is likely still needed in H2, especially if the US Fed starts cutting rates (which would ease CNY depreciation pressure vs the USD). We continue to forecast a 10bps cut in the medium-term lending (MLF) rate in both Q3 and Q4, and a 25bps reserve requirement ratio (RRR) cut in Q3.”
“Our 2024 GDP growth forecast remains intact at 4.8%, slightly higher than consensus 4.7%. We see upside risks to our forecast from effective implementation of the government’s “action plan for large-scale equipment renewal and consumer goods trade-in”, and strengthening external demand.”
Analysts at TD Securities expect the Consumer Price Index in Canada to rise 3% in March.
"We look for headline CPI to bounce 0.2pp higher to 3.0% y/y in March as prices rise by 0.7% m/m (market: 0.7% m/m, 2.9% y/y), underpinned by another large increase for the energy component alongside a partial rebound in food prices and core goods."
"A return to more broad-based price pressures should also translate to a larger increase for the Bank of Canada's (BoC) preferred measures of core inflation, with CPI-trim/median forecast to rise by 0.3% m/m, which would still translate to a modest deceleration on a 3m annualized basis. However, the expected move higher for headline CPI and a larger m/m increase for core measures stand in contrast to the BoC's desire for more evidence that recent progress will be sustained and even though the Bank will have the April CPI report in hand for its next policy decision, we do not expect it to have enough evidence of sustained deceleration until July."
Analysts at Deutsche Bank share their revised outlook for the European Central Bank's (ECB) monetary policy.
New baseline has 75bp of cuts in 2024
"We are updating our ECB baseline to a more gradual – and uncertain – easing cycle. We continue to expect the first rate cut in June. We previously expected 125bp of cuts in 2024 and a further 75bp of cuts in H1 2025 to a terminal rate of 2% in mid-2025. Our new baseline has 75bp of cuts in 2024 (risk skewed to 100bp), 100bp of cuts in 2025 and a final 25bp cut in Q1 2026 to a terminal rate of 2%.
"More gradual: We retain the same baseline terminal rate, but three quarters later than in our previous view. Our previous view of the easing cycle was largely built on back-to-back rate cuts. The new baseline assumes a more gradual, one quarter-point cut per quarter pace, throughout the easing cycle."
"More uncertain: A baseline forecast has limitations in an uncertain environment. Our baseline continues to assume a rebalancing economy and monetary policy returning to neutral. However, there are two stages to the easing cycle — dialling back restrictiveness and normalisation — and we have a lower level of conviction on the second stage of easing next year on account of uncertainties associated with the US election, divergent monetary policy cycles and the level of neutral rates."
Silver prices (XAG/USD) fell on Tuesday, according to FXStreet data. Silver trades at $28.37 per troy ounce, down 1.74% from the $28.87 it cost on Monday.
Silver prices have increased by 11.39% since the beginning of the year.
| Unit measure | Today Price |
|---|---|
| Silver price per troy ounce | $28.37 |
| Silver price per gram | $0.91 |
The Gold/Silver ratio, which shows the number of troy ounces of Silver needed to equal the value of one troy ounce of Gold, stood at 83.53 on Tuesday, up from 82.54 on Monday.
Investors might use this ratio to determine the relative valuation of Gold and Silver. Some may consider a high ratio as an indicator that Silver is undervalued – or Gold is overvalued – and might buy Silver or sell Gold accordingly. Conversely, a low ratio might suggest that Gold is undervalued relative to Silver.
(An automation tool was used in creating this post.)
Silver FAQs
Silver is a precious metal highly traded among investors. It has been historically used as a store of value and a medium of exchange. Although less popular than Gold, traders may turn to Silver to diversify their investment portfolio, for its intrinsic value or as a potential hedge during high-inflation periods. Investors can buy physical Silver, in coins or in bars, or trade it through vehicles such as Exchange Traded Funds, which track its price on international markets.
Silver prices can move due to a wide range of factors. Geopolitical instability or fears of a deep recession can make Silver price escalate due to its safe-haven status, although to a lesser extent than Gold's. As a yieldless asset, Silver tends to rise with lower interest rates. Its moves also depend on how the US Dollar (USD) behaves as the asset is priced in dollars (XAG/USD). A strong Dollar tends to keep the price of Silver at bay, whereas a weaker Dollar is likely to propel prices up. Other factors such as investment demand, mining supply – Silver is much more abundant than Gold – and recycling rates can also affect prices.
Silver is widely used in industry, particularly in sectors such as electronics or solar energy, as it has one of the highest electric conductivity of all metals – more than Copper and Gold. A surge in demand can increase prices, while a decline tends to lower them. Dynamics in the US, Chinese and Indian economies can also contribute to price swings: for the US and particularly China, their big industrial sectors use Silver in various processes; in India, consumers’ demand for the precious metal for jewellery also plays a key role in setting prices.
Silver prices tend to follow Gold's moves. When Gold prices rise, Silver typically follows suit, as their status as safe-haven assets is similar. The Gold/Silver ratio, which shows the number of ounces of Silver needed to equal the value of one ounce of Gold, may help to determine the relative valuation between both metals. Some investors may consider a high ratio as an indicator that Silver is undervalued, or Gold is overvalued. On the contrary, a low ratio might suggest that Gold is undervalued relative to Silver.
Gold prices rose in India on Tuesday, according to data from India's Multi Commodity Exchange (MCX).
Gold price stood at 72,985 Indian Rupees (INR) per 10 grams, up INR 666 compared with the INR 72,319 it cost on Monday.
As for futures contracts, Gold prices increased to INR 72,461 per 10 gms from INR 72,277 per 10 gms.
Prices for Silver futures contracts decreased to INR 83,515 per kg from INR 83,851 per kg.
| Major Indian city | Gold Price |
|---|---|
| Ahmedabad | 75,635 |
| Mumbai | 75,500 |
| New Delhi | 75,605 |
| Chennai | 75,710 |
| Kolkata | 75,720 |
Global Market Movers: Comex Gold price eases on stronger USD, though downside seems limited
- The global risk sentiment remains fragile amid the worsening Middle East crisis and speculations that the Federal Reserve will keep rates higher for longer, which, in turn, acts as a tailwind for the Comex Gold price.
- Investors have been pushing back their expectations about the timing of the first interest rate cut by the Fed to September from June in the wake of concerns about sticky inflation and a resilient US economy.
- The bets were reaffirmed by stronger-than-expected US Retail Sales data released on Monday, which indicated that consumer spending remains strong and could underpin inflation in the coming months.
- The US Census Bureau reported that Retail Sales rose by 0.7% MoM in March as compared to consensus estimates for a 0.3% increase and the previous month's upwardly revised growth of 0.9%.
- The yield on the benchmark 10-year US government bond shot to the highest level since November, though the disappointing release of the Empire State Manufacturing Index capped the upside.
- The US Dollar prolongs its recent upward trajectory and climbs to over a five-month peak, which might hold back bulls from placing fresh bets and keep a lid on any further gains for the XAU/USD.
- Tuesday's US economic docket features the release of housing market data and Industrial Production figures, which along with Fedspeak, might provide some impetus to the non-yielding yellow metal.
(An automation tool was used in creating this post.)
Gold FAQs
Gold has played a key role in human’s history as it has been widely used as a store of value and medium of exchange. Currently, apart from its shine and usage for jewelry, the precious metal is widely seen as a safe-haven asset, meaning that it is considered a good investment during turbulent times. Gold is also widely seen as a hedge against inflation and against depreciating currencies as it doesn’t rely on any specific issuer or government.
Central banks are the biggest Gold holders. In their aim to support their currencies in turbulent times, central banks tend to diversify their reserves and buy Gold to improve the perceived strength of the economy and the currency. High Gold reserves can be a source of trust for a country’s solvency. Central banks added 1,136 tonnes of Gold worth around $70 billion to their reserves in 2022, according to data from the World Gold Council. This is the highest yearly purchase since records began. Central banks from emerging economies such as China, India and Turkey are quickly increasing their Gold reserves.
Gold has an inverse correlation with the US Dollar and US Treasuries, which are both major reserve and safe-haven assets. When the Dollar depreciates, Gold tends to rise, enabling investors and central banks to diversify their assets in turbulent times. Gold is also inversely correlated with risk assets. A rally in the stock market tends to weaken Gold price, while sell-offs in riskier markets tend to favor the precious metal.
The price can move due to a wide range of factors. Geopolitical instability or fears of a deep recession can quickly make Gold price escalate due to its safe-haven status. As a yield-less asset, Gold tends to rise with lower interest rates, while higher cost of money usually weighs down on the yellow metal. Still, most moves depend on how the US Dollar (USD) behaves as the asset is priced in dollars (XAU/USD). A strong Dollar tends to keep the price of Gold controlled, whereas a weaker Dollar is likely to push Gold prices up.
- Germany’s ZEW Economic Sentiment Index jumps to 42.9 in April.
- EUR/USD remains uninspired by the upbeat German and Eurozone ZEW surveys.
The headline German ZEW Economic Sentiment Index jumped from 31.7 in March to 42.9 in April, beating the market expectations of 35.1.
However, the Current Situation Index improved from -80.5 to -79.2 in the same month.
The Eurozone ZEW Economic Sentiment Index arrived at 43.9 in April, much higher than the March reading of 33.5. The data outpaced the market consensus of 37.2.
Key points
A recovering global economy is boosting expectations for Germany, with half of the respondents anticipating the country’s economy to pick up over the next six months.
Further contributing to the heightened optimism are the much-improved assessments of the situation and economic expectations in Germany’s export destinations.
This is reflected, among other things, in the expected appreciation of the us dollar against the Euro.
Market reaction
The EUR/USD pair is little impresseed by encouraging German and Eurozone ZEW surveys. The pair is amost unchanged on the day at 1.0620, at the press time.
- AUD/JPY edges lower on risk aversion as traders expect Israel to respond to Iran’s assault.
- Australian Dollar faced challenges amid apprehensions that the RBA may ease monetary tightening in the foreseeable future.
- Japanese Yen could experience an intervention as Japanese ministers noted to take necessary measures to ensure FX stability.
AUD/JPY relinquishes its recent gains, likely attributable to risk aversion as investors await Israel’s reaction to Iran’s air strike on Saturday with caution. Furthermore, the Australian Dollar (AUD) encounters obstacles amid apprehensions that the Reserve Bank of Australia (RBA) may be compelled to reduce interest rates in the foreseeable future. The AUD/JPY cross trades around 99.10 during the European session on Tuesday.
The Australian Dollar (AUD) faces increased negative sentiment, which contributes to downward pressure for the AUD/JPY cross. This sentiment is driven by divergent monetary policy outlooks between the Reserve Bank of Australia (RBA) and the Federal Reserve (Fed). The “Financial Review” suggests that the RBA may need to ease monetary policy before the Fed. Furthermore, persistent high inflation in the United States (US), the world's largest economy, introduces uncertainty regarding whether the Federal Reserve will take action this year.
Moreover, However, the Australian Dollar pares losses after mixed data from its significant trading partner, China. This rebound may have helped to mitigate the losses of the AUD/JPY cross. China's Gross Domestic Product (GDP) for the first quarter of 2024 increased by 1.6% QoQ, exceeding 1.0% prior. Annual GDP growth came at 5.3%, against the expected 5.0% and the previous reading of 5.2%. However, China's Industrial Production (YoY) in March increased by 4.5%, falling short of market expectations of 5.4% and the previous reading of 7.0%.
Meanwhile, the Japanese Yen might have faced challenges due to the Bank of Japan's (BoJ) dovish outlook, consequently, limiting the downside of the AUD/JPY cross. The BoJ refrained from guiding future policy measures following the cessation of negative interest rates in March.
As per Reuter’s reports on Tuesday, Japan's Chief Cabinet Secretary Yoshimasa Hayashi emphasized the importance of currencies moving in a stable manner that reflects underlying fundamentals. He noted that authorities are closely monitoring foreign exchange (FX) movements and are prepared to take all necessary measures to ensure stability. Similarly, Japanese Finance Minister Shunichi Suzuki reiterated his vigilance regarding FX movements and affirmed his readiness to implement any measures deemed necessary.
If the macroeconomic assessment in June confirms an inflation convergence toward the European Central Bank's (ECB) target, key rates could be lowered in June, European Central Bank (ECB) policymaker Olli Rehn said on Tuesday.
Rehn added that future rate decisions will ensure that policy rates will stay sufficiently restrictive as long as necessary and noted that rate cut assumes there will be no further setbacks, for instance in the geopolitics and energy prices.
Market reaction
These comments don't seem to be having a significant impact on the Euro's valuation. At the time of press, the EUR/USD pair was down 0.05% on the day at 1.0620.
- Silver price plunges to $28.40 as the US Dollar capitalizes on uncertainty over Fed rate cut timing.
- US bond yields rise further as the Fed is expected to consider rate cuts later this year.
- Geopolitical tensions keep safe-haven demand intact.
Silver price (XAG/USD) slumps to $28.40 in Tuesday’s European session. The white metal faces intense selling pressure as the US Dollar extends its upside to more than five-month high around 106.40. The US Dollar strengthens after robust United States Retail Sales data for March deepened uncertainty about when the Federal Reserve (Fed) will start reducing interest rates.
S&P 500 futures have posted some losses in the European session, portraying a decline in the risk appetite of the market participants. 10-year US Treasury yields hover near a fresh five-month high around 4.63%. US bond yields extend their upside on expectations that the Fed will delay rate cuts later this year. The US Dollar Index (DXY) rises to 106.33 and continues its winning streak for the fifth trading session on Tuesday.
Fed policymakers see no urgency for a reduction in interest rates. San Francisco Fed Bank President Mary Daly emphasized keeping the monetary policy restrictive until policymakers get convinced that inflation is on course towards the 2% target.
The near-term outlook of Silver remains strong amid fears that tensions in the Middle East region could spread beyond Gaza. After a cabinet meeting on Monday with Israel Prime Minister Benjamin Netanyahu, Israel’s military Chief of Staff Herzi Halev said they would respond to Iran’s attack on their territory. On Saturday, Iran launched hundreds of drones and missiles to retaliate against Israel’s attack on the Iranian embassy in Syria near Damascus, in which two high-ranked generals died.
Silver technical analysis
Silver price faces selling pressure while attempting to break above horizontal resistance plotted from 3 August 2020 high at $29.86. The long-term outlook of the white metal is bullish as the 20-week Exponential Moving Average (EMA) at $24.85 is sloping higher.
The 14-period Relative Strength Index (RSI) shifts into the bullish range of 60.00-80.00, suggesting a strong upside momentum.
Silver weekly chart
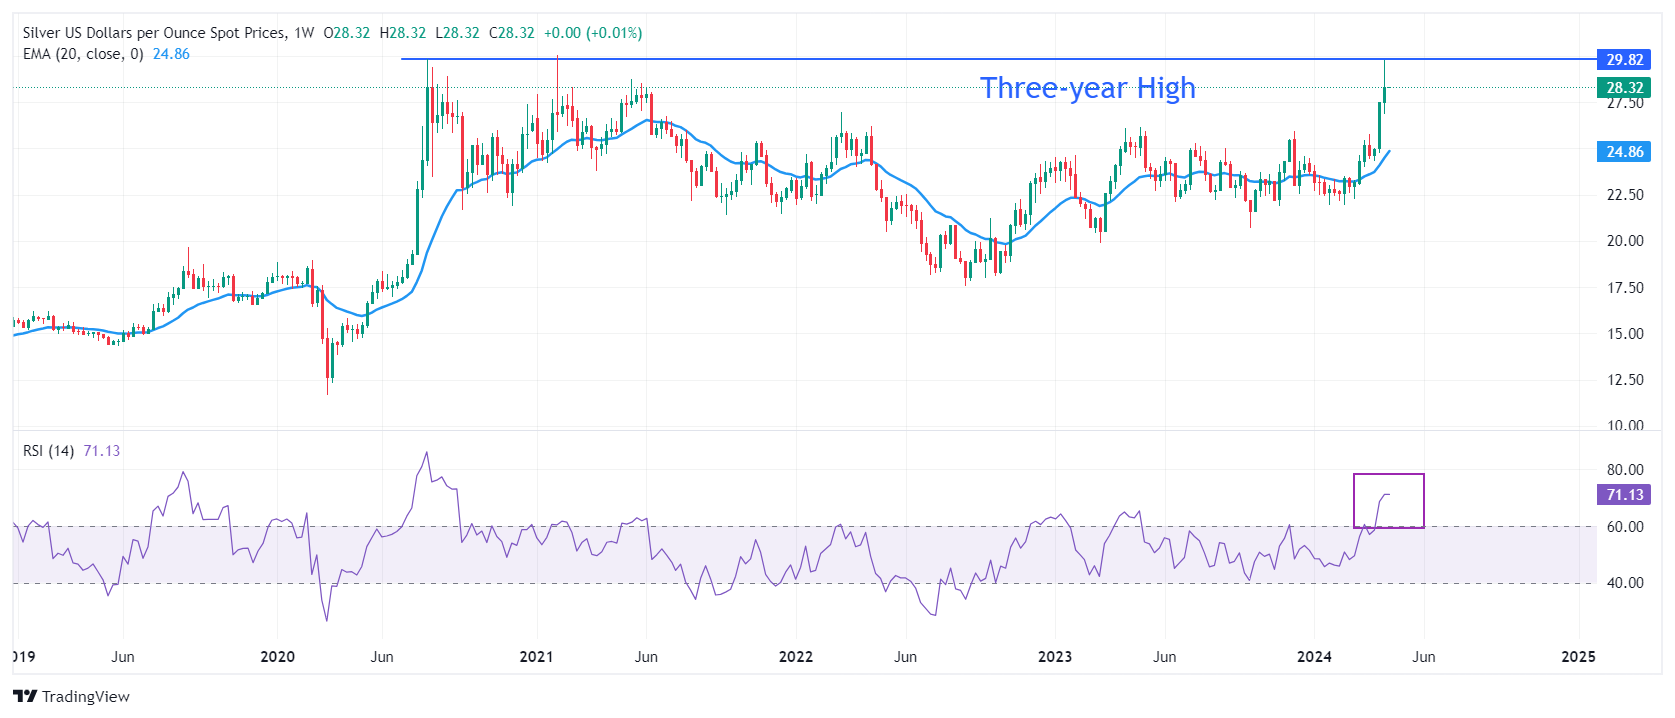
- USD/CHF hovers below 0.9152, the highest since October reached on Monday.
- US Dollar strengthened as higher Retail Sales amplified expectations of the Fed prolonging higher policy rates.
- Swiss Franc faces challenges due to the likelihood of SNB implementing another rate cut in the June meeting.
USD/CHF recovers its recent losses registered in the previous session, trading near 0.9120 during the early European hours on Tuesday. The strength of the US Dollar (USD) provides support to bolster the USD/CHF pair. This strength is fueled by better-than-expected Retail Sales figures from the United States (US), which have increased expectations that the Federal Reserve (Fed) might maintain higher interest rates for an extended period.
Moreover, the US Dollar Index (DXY) extends its gains to near 106.30, while the yields on US Treasury bonds for both the 2-year and 10-year stand at 4.93% and 4.62%, respectively, at the time of writing. Escalating geopolitical tensions in the Middle East prompted investors to seek refuge in the safe-haven US Dollar (USD).
Federal Reserve (Fed) Bank of San Francisco President Mary Daly stated on Monday that while there has been notable progress on inflation, there is still further ground to cover. She emphasized the importance of being confident that inflation is on a path toward the target before taking action.
On the other side, in March, Swiss Producer and Import Prices (MoM) exhibited steady growth, increasing by 0.1%. However, Producer and Import Prices (YoY) experienced a more pronounced contraction, declining at a rate of 2.1% compared to the previous contraction of 2.0%.
The Swiss Franc (CHF) had already undergone a significant depreciation following the Swiss National Bank's (SNB) unexpected rate cut in March. With inflation showing moderation in March and business confidence remaining pessimistic, market speculation suggests that the SNB might implement another rate cut during its upcoming June meeting.
- The Canadian Consumer Price Index is seen gathering some upside traction in March.
- The BoC deems risks to the inflation outlook to be balanced.
- The Canadian Dollar navigates five-month lows against the US Dollar.
Canada is set to disclose the latest inflation figures on Tuesday, with Statistics Canada releasing the Consumer Price Index (CPI) for March. Forecasts suggest a 3.1% year-on-year increase in the headline figure, accelerating from February’s 2.8% rise. Projections for the month anticipate a 0.7% increase in the index compared to the previous month's 0.3% reading.
In addition to the CPI data, the Bank of Canada (BoC) will unveil its core Consumer Price Index measure, which omits volatile components such as food and energy expenses. February’s BoC core CPI showed a 0.1% monthly increase and a year-on-year uptick of 2.1%.
These figures will be closely watched as they have the potential to impact the direction of the Canadian Dollar (CAD) in the very near term and shape perspectives on the Bank of Canada's monetary policy. Regarding the Canadian Dollar (CAD), it has exhibited weakness against the US Dollar (USD) in recent sessions and currently remains near five-month lows significantly beyond the 1.3700 yardstick.
What to expect from Canada’s inflation rate?
Analysts anticipate price pressures across Canada remained sticky in March. Indeed, analysts predict that inflation, as measured by annual changes in the Consumer Price Index, will quicken to 3.1% from its previous reading of 2.8% on a yearly basis, reflecting patterns observed in several of Canada's G10 counterparts, particularly the US. Since August’s 4% inflation rate, price growth has generally trended downward, except for a rebound noted in the final month of the last year. Overall, inflation metrics continue to exceed the Bank of Canada's 2% target.
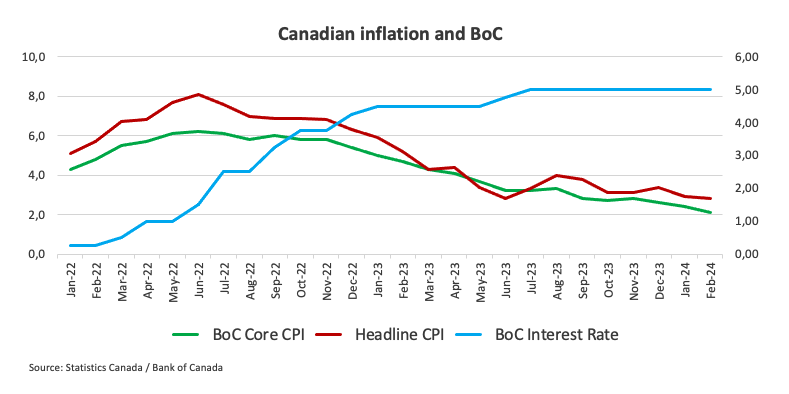
If the upcoming data validates the expected prints, investors may contemplate the central bank maintaining its current restrictive stance for a longer period than initially anticipated. However, further tightening of monetary conditions appears improbable, according to statements from the bank’s officials.
Such a scenario would require a sudden and sustained resurgence of price pressures and a rapid surge in consumer demand, both of which appear unlikely in the foreseeable future.
During his press conference following the latest BoC meeting, Governor Tiff Macklem noted that gas prices have a tendency to fluctuate, which is why they are paying close attention to core inflation. Macklem said the bank has not had the opportunity to thoroughly examine the latest US inflation data yet, while he did not see significant direct imported inflation effects from the US. Additionally, the BoC stated its intention to monitor whether this downward trend continues and is particularly attentive to the evolution of core inflation. The bank also noted that shelter price growth remains significantly high and predicts that overall inflation is expected to hover close to 3% during the first half of 2024, decline below 2.5% in the second half of 2024, and reach the 2% target in 2025.
Analysts at TD Securities argued that: “We look for headline CPI to bounce 0.2pp higher to 3.0% y/y in March as prices rise by 0.7% m/m, underpinned by another large increase for the energy component alongside a partial rebound in food prices and core goods after their muted performance over Jan/Feb”. Analysts added, “The expected move higher for headline CPI and a larger m/m increase for core measures stand in contrast to the Bank of Canada's desire for more evidence that recent progress will be sustained. Even though the Bank will have the April CPI report in hand for its next policy decision, we do not think it will have enough evidence of sustained deceleration until July.”
When is the Canada CPI data due and how could it affect USD/CAD?
On Tuesday at 12:30 GMT, Canada is scheduled to unveil the Consumer Price Index for March. The potential reaction of the Canadian Dollar hinges on shifts in monetary policy expectations by the Bank of Canada. Nonetheless, barring any significant surprises in either direction, the BoC is unlikely to alter its current cautious monetary policy stance, aligning with the approaches of other central banks like the Federal Reserve (Fed).
The USD/CAD has initiated the new trading year with a decent bullish trend, although this uptrend seems to have gathered extra pace since last week, largely surpassing the 1.3700 figure, an area last traded in mid-November 2023.
According to Pablo Piovano, Senior Analyst at FXStreet, there is a strong likelihood of the USD/CAD maintaining its positive bias as long as it remains above the crucial 200-day Simple Moving Average (SMA) at 1.3515. The bullish sentiment now faces the immediate hurdle at the round milestone of 1.3800. Conversely, breaching the 200-day SMA could lead to additional losses and a potential descent to the January 31 low of 1.3358. Beyond this point, notable support levels are scarce until the December 2023 bottom of 1.3177, recorded on December 27.
Pablo emphasizes that significant increases in CAD volatility would necessitate unexpected inflation figures. A below-expectation CPI could reinforce arguments for potential BoC interest rate cuts in the coming months, thereby further boosting USD/CAD. However, a CPI rebound, similar to trends observed in the US, might offer some backing to the Canadian Dollar, albeit to a limited extent. A higher-than-anticipated inflation reading would heighten pressure on the Bank of Canada to sustain elevated rates for an extended period, potentially leading to prolonged challenges for many Canadians grappling with higher interest rates, as highlighted by Bank of Canada Governor Macklem in past weeks.
- EUR/GBP sees a downside below 0.8530 as the ECB is expected to begin reducing interest rates from August.
- Eurozone core CPI has consistently declined in the last eight months.
- The Pound Sterling holds strength against the Euro despite poor UK labor market data.
The EUR/GBP pair struggles to hold an auction above the immediate support of 0.8530 in the early European session on Tuesday. The cross remains under pressure as the Euro weakens amid expectations that the European Central Bank (ECB) will be second among central banks from developed nations that will pivot to rate cuts.
ECB policymakers see market expectations for the central bank starting to reduce borrowing rates from the June meeting as reasonable. The annual core Consumer Price Index (CPI) that excludes volatile food and energy prices has come down significantly to 2.9% in March. Eurozone core CPI is consistently declining from last eight months, suggesting that inflation is sustainably declining to the 2% target.
Last week, the ECB kept its Main Refinancing Operations Rate unchanged at 4.5% as expected. In a monetary policy conference, ECB President Christine Lagarde said if a fresh assessment increases policymakers' confidence that inflation is heading back to target, then it "would be appropriate" to cut interest rates, Reuters reported.
Meanwhile, the Pound Sterling has been underpinned against the Euro due to strong speculation that the ECB will sooner pivot to rate cuts but is performing weak against the US Dollar. The Pound Sterling faces pressure as weak labor market data for the quarter through February has exhibited a poor economic outlook.
The United Kingdom Office for National Statistics (ONS) reported that the Unemployment Rate climbed sharply to 4.2% from expectations of 4.0% and the prior reading of 3.9%. UK employers laid off 156K workers in February, higher from 89K in January.
Going forward, investors will focus on the UK Consumer Price Index (CPI) data for March, which will be published on Wednesday. The inflation data will significantly influence market expectations for Bank of England (BoE) rate cuts, which are currently anticipated from the August meeting.
- The Pound Sterling declines further after the UK ONS reported weaker-than-expected labor market data.
- Employers laid off workers in February, exhibiting the negative impact of higher UK interest rates.
- The market sentiment remains risk-off amid fears of an escalation in Middle East tensions.
The Pound Sterling (GBP) weakens in Tuesday’s London session after the United Kingdom Office for National Statistics (ONS) reported that labor market conditions have significantly cooled down in the three months ending February. The Unemployment Rate grew strongly to 4.2% and the overall labor market witnessed that 156K workers were laid-off.
The labor market data demonstrates uncertainty over the economic outlook, which could force Bank of England (BoE) policymakers to start reducing interest rates earlier than previously expected. Job-seekers and current employees compromise with salary hikes when labor market conditions cool down, which results in slower wage growth that allows high inflation to return to its desired target sustainably.
More volatility is anticipated in the Pound Sterling as the UK ONS will report the consumer and producer inflation data for March, which will be published on Wednesday. The headline Consumer Price Index (CPI) is estimated to rise 3.1%, slower than the prior reading of 3.4%. The core CPI, which strips off volatile food and energy prices, is forecasted to rise 4.1%, slower than 4.5% in February. An expected decline in the inflation data would increase speculation for the BoE beginning to reduce interest rates from the August meeting.
Daily digest market movers: Pound Sterling falls further amid multiple headwinds
- The Pound Sterling extends its downside to 1.2410 as the United Kingdom ONS has reported weak labor market data. The ILO Unemployment Rate for the three months ending February rose sharply to 4.2% from expectations of 4.0% and the prior reading of 4.0% (revised from 3.9%). In February, employers fired 156K workers, higher than the prior reading of 89K, upwardly revised from 21K.
- In March, Claimant Count Change, which indicates the change in number of individuals claiming jobless benefits, was lower at 10.9K vs. expectations of 17.2K and the prior reading of 4.1K (revised from 16.8K).
- In the three months ending February, Average Earnings including bonuses rose steadily by 5.6%, beating the consensus of 5.5%. In the same period, Average Earnings excluding bonuses slowed to 6.0% against the former reading of 6.1%.
- Weak labor demand clearly shows the consequences of interest rates remaining higher by the Bank of England (BoE). The rising jobless rates and poor labor demand exhibit a vulnerable economic outlook, which could force the BoE to pivot to rate cuts sooner than expected.
- The market sentiment remains risk-averse amid fears of further escalation in Middle East tensions and deepening uncertainty about when the Federal Reserve will start reducing interest rates. Eventually, strong demand for safe-haven assets has pushed the US Dollar Index (DXY) to 106.30.
- The Israeli military said it would respond to Iran’s attack in their territory that happened on April 13 in which the latter launched hundreds of missiles and drones. This has deepened fears of war spreading beyond Gaza in the Middle East region.
- United States robust Retail Sales data, combined with strong labor demand and higher consumer price inflation in March have strengthened the argument that Fed policymakers could delay rate cuts later this year.
- San Francisco Fed Bank President Mary Daly said on Friday that there is absolutely no urgency to start reducing interest rates. Daly added that there is still more work to do to make sure that inflation is on course to return to the desired rate of 2%. She emphasized keeping interest rates restrictive for a longer period.
Technical Analysis: Pound Sterling sees downside toward 1.2400
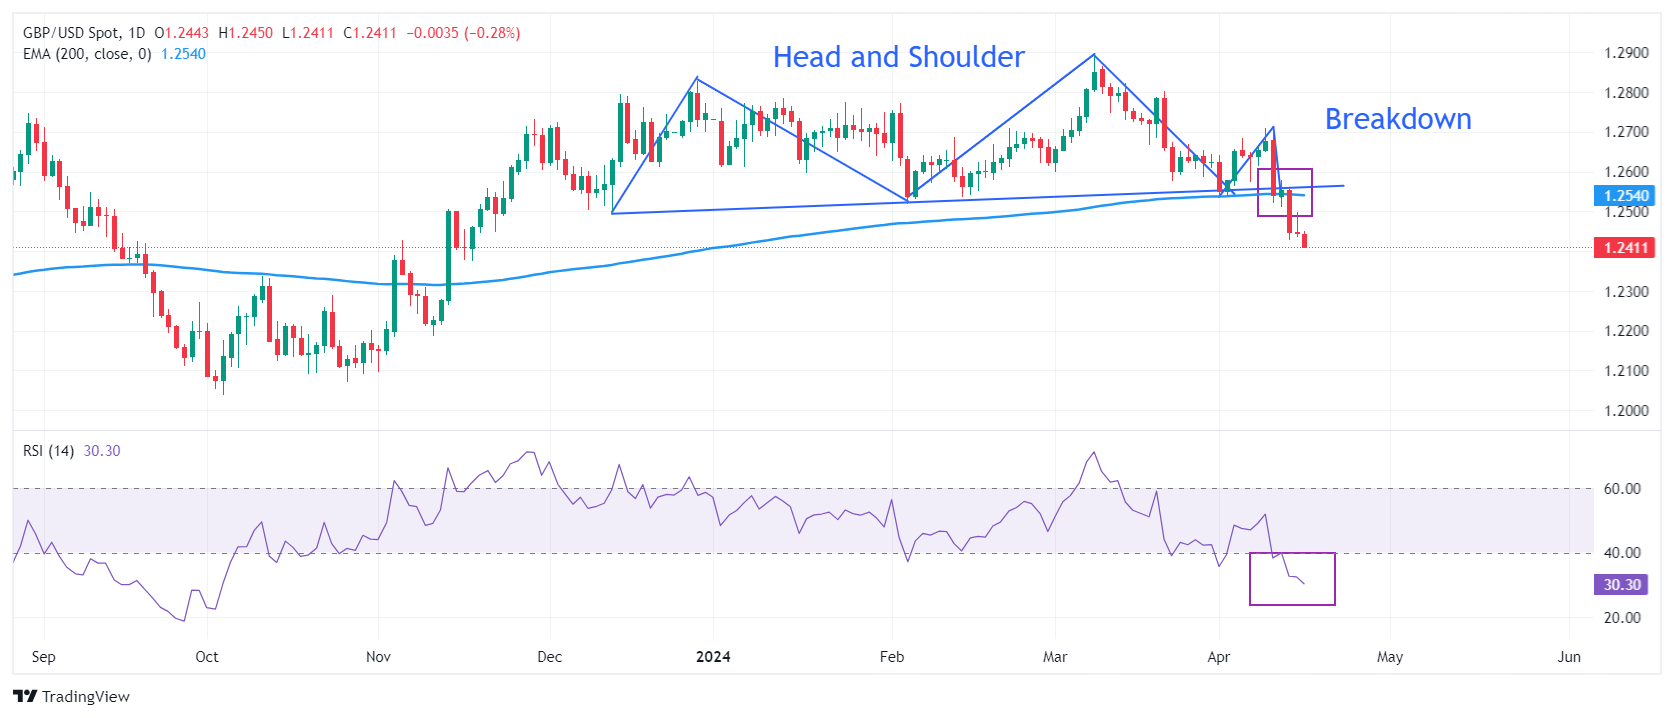
The Pound Sterling declines further to 1.2410 after extending its losing spell for the third trading session on Tuesday. The GBP/USD pair is expected to extend its downside to the round-level support at 1.2400. The Cable remains on the backfoot after a breakdown of the Head and Shoulder chart pattern, which exhibits a bearish reversal. The neckline of the aforementioned chart pattern is plotted from December 8 low near 1.2500.
The long-term outlook turns bearish as the Cable drops below the 200-day Exponential Moving Average (EMA), which trades around 1.2540.
The 14-period Relative Strength Index (RSI) shifts into the bearish range of 20.00-40.00, suggesting an active bearish momentum.
Pound Sterling FAQs
The Pound Sterling (GBP) is the oldest currency in the world (886 AD) and the official currency of the United Kingdom. It is the fourth most traded unit for foreign exchange (FX) in the world, accounting for 12% of all transactions, averaging $630 billion a day, according to 2022 data. Its key trading pairs are GBP/USD, aka ‘Cable’, which accounts for 11% of FX, GBP/JPY, or the ‘Dragon’ as it is known by traders (3%), and EUR/GBP (2%). The Pound Sterling is issued by the Bank of England (BoE).
The single most important factor influencing the value of the Pound Sterling is monetary policy decided by the Bank of England. The BoE bases its decisions on whether it has achieved its primary goal of “price stability” – a steady inflation rate of around 2%. Its primary tool for achieving this is the adjustment of interest rates. When inflation is too high, the BoE will try to rein it in by raising interest rates, making it more expensive for people and businesses to access credit. This is generally positive for GBP, as higher interest rates make the UK a more attractive place for global investors to park their money. When inflation falls too low it is a sign economic growth is slowing. In this scenario, the BoE will consider lowering interest rates to cheapen credit so businesses will borrow more to invest in growth-generating projects.
Data releases gauge the health of the economy and can impact the value of the Pound Sterling. Indicators such as GDP, Manufacturing and Services PMIs, and employment can all influence the direction of the GBP. A strong economy is good for Sterling. Not only does it attract more foreign investment but it may encourage the BoE to put up interest rates, which will directly strengthen GBP. Otherwise, if economic data is weak, the Pound Sterling is likely to fall.
Another significant data release for the Pound Sterling is the Trade Balance. This indicator measures the difference between what a country earns from its exports and what it spends on imports over a given period. If a country produces highly sought-after exports, its currency will benefit purely from the extra demand created from foreign buyers seeking to purchase these goods. Therefore, a positive net Trade Balance strengthens a currency and vice versa for a negative balance.
Here is what you need to know on Tuesday, April 16:
The US Dollar (USD) continues to gather strength early Tuesday after outperforming its major rivals on Monday. The US economic docket will feature Housing Starts and Building Permits data for March. The Federal Reserve (Fed) will release Industrial Production figures and several Fed policymakers, including Chairman Jerome Powell, will be delivering speeches later in the American session.
Although easing geopolitical tensions made it difficult for the USD to find demand in the first half of the day on Monday, the currency gathered bullish momentum after upbeat Retail Sales data. In turn, the USD Index closed in positive territory for the fourth consecutive day. Early Tuesday, the index continues to push higher toward 106.50 and trades at its strongest level since early November. Meanwhile, the benchmark 10-year US Treasury bond yield holds steady above 4.6% after rising nearly 2% on Monday.
US Dollar price in the last 7 days
The table below shows the percentage change of US Dollar (USD) against listed major currencies in the last 7 days. US Dollar was the strongest against the Australian Dollar.
| USD | EUR | GBP | CAD | AUD | JPY | NZD | CHF | |
| USD | 2.36% | 1.91% | 1.73% | 2.88% | 1.74% | 2.47% | 0.92% | |
| EUR | -2.41% | -0.46% | -0.64% | 0.56% | -0.61% | 0.13% | -1.47% | |
| GBP | -1.94% | 0.46% | -0.17% | 1.00% | -0.17% | 0.60% | -0.99% | |
| CAD | -1.76% | 0.63% | 0.18% | 1.17% | 0.01% | 0.75% | -0.84% | |
| AUD | -2.96% | -0.54% | -1.02% | -1.19% | -1.17% | -0.43% | -1.99% | |
| JPY | -1.77% | 0.63% | 0.18% | -0.02% | 1.17% | 0.74% | -0.84% | |
| NZD | -2.54% | -0.12% | -0.57% | -0.77% | 0.41% | -0.74% | -1.60% | |
| CHF | -0.95% | 1.44% | 1.02% | 0.83% | 1.96% | 0.85% | 1.60% |
The heat map shows percentage changes of major currencies against each other. The base currency is picked from the left column, while the quote currency is picked from the top row. For example, if you pick the Euro from the left column and move along the horizontal line to the Japanese Yen, the percentage change displayed in the box will represent EUR (base)/JPY (quote).
Iranian Foreign Minister Hossein Amir-Abdollahian reportedly told his Chinese counterpart in a phone conversation that Iran is willing to "exercise restraint and has no intention of further escalating the situation." Following the sharp decline seen in Wall Street's main indexes on Monday, US stock index futures trade marginally lower early Tuesday.
During the Asian trading hours, the data from China showed that the real Gross Domestic Product (GDP) expanded at an annual rate of 5.3% in the first quarter. This reading followed the 5.2% growth recorded in the fourth quarter of 2023 and came in better than the market expectation of 5%. On a negative note, Retail Sales in China grew 3.1% on a yearly basis in March, falling short of analysts' estimate for an increase of 4.5%.
AUD/USD came under bearish pressure following the mixed Chinese data and was last seen trading at its lowest level in five months, slightly above 0.6400.
Australian Dollar moves back and forth amid risk-off mood, stronger US Dollar.
Japan's Chief Cabinet Secretary Yoshimasa Hayashi said on Tuesday that it's important for currencies to move in a stable manner, reflecting fundamentals. Hayashi refrained from commenting on a possible intervention but reiterated that they are prepared to take all measures. USD/JPY gained 0.6% on Monday and reached its highest level in over 30 years before going into a consolidation phase below 154.50.
Japanese Yen bears turn cautious amid intervention fears and geopolitical tensions.
The UK's Office for National Statistic reported early Tuesday that the ILO Unemployment Rate climbed to 4.2% in the three months to February from 4%. Further details of the report showed that the wage inflation, as measured by the change in the Average Earnings Excluding Bonus, edged lower to 6% from 6.1% on a yearly basis. GBP/USD pushed lower toward 1.2400 after the data and touched its weakest level since mid-November.
Gold declined toward $2,320 in the early American session on Monday, pressured by rising US yields and the broad-based USD strength. The risk-averse market atmosphere, however, helped XAU/USD gather bullish momentum later in the day. After rising more than 1.5% on Monday, Gold seems to have stabilized at around $2,380 early Tuesday.
EUR/USD's recovery attempt remained short-lived on Monday and the pair closed the fifth consecutive day in the red. In the European morning on Tuesday, EUR/USD stays on the back foot and trades within a touching distance of 1.0600.
Later in the day, Statistics Canada will publish the Consumer Price Index data for March. USD/CAD stays in positive territory above 1.3800 in the European morning.
US Dollar FAQs
The US Dollar (USD) is the official currency of the United States of America, and the ‘de facto’ currency of a significant number of other countries where it is found in circulation alongside local notes. It is the most heavily traded currency in the world, accounting for over 88% of all global foreign exchange turnover, or an average of $6.6 trillion in transactions per day, according to data from 2022. Following the second world war, the USD took over from the British Pound as the world’s reserve currency. For most of its history, the US Dollar was backed by Gold, until the Bretton Woods Agreement in 1971 when the Gold Standard went away.
The most important single factor impacting on the value of the US Dollar is monetary policy, which is shaped by the Federal Reserve (Fed). The Fed has two mandates: to achieve price stability (control inflation) and foster full employment. Its primary tool to achieve these two goals is by adjusting interest rates. When prices are rising too quickly and inflation is above the Fed’s 2% target, the Fed will raise rates, which helps the USD value. When inflation falls below 2% or the Unemployment Rate is too high, the Fed may lower interest rates, which weighs on the Greenback.
In extreme situations, the Federal Reserve can also print more Dollars and enact quantitative easing (QE). QE is the process by which the Fed substantially increases the flow of credit in a stuck financial system. It is a non-standard policy measure used when credit has dried up because banks will not lend to each other (out of the fear of counterparty default). It is a last resort when simply lowering interest rates is unlikely to achieve the necessary result. It was the Fed’s weapon of choice to combat the credit crunch that occurred during the Great Financial Crisis in 2008. It involves the Fed printing more Dollars and using them to buy US government bonds predominantly from financial institutions. QE usually leads to a weaker US Dollar.
Quantitative tightening (QT) is the reverse process whereby the Federal Reserve stops buying bonds from financial institutions and does not reinvest the principal from the bonds it holds maturing in new purchases. It is usually positive for the US Dollar.
US Treasury Secretary Janet Yellen warned on Tuesday that the "US will use sanctions and work with allies to keep disrupting Iran's 'malign and destabilizing activity'."
Additional comments
Iran's actions threaten stability in the Middle East and could cause economic spillovers.
It is incumbent on all of us at IMF-World Bank meetings to end the suffering of the Palestinian people.
Treasury has targeted over 500 individuals and entities connected to terrorism by Iran and its proxies since 2021.
- EUR/USD could test the support at the psychological level of 1.0600.
- The pair could extend losses to November’s low at 1.0516 as Technical analysis suggests a bearish confirmation.
- The area around the major level of 1.0650 and the 23.6% Fibo level of 1.0672 appears as the resistance zone.
EUR/USD continues its losing streak for the sixth successive session on Tuesday, hovering near 1.0620 during the Asian trading hours. The US Dollar's (USD) strength put pressure on the EUR/USD pair, possibly driven by increased US Treasury yields. Additionally, stronger-than-anticipated Retail Sales data from the US has raised expectations that the Federal Reserve (Fed) might prolong its stance on higher interest rates.
On the technical side, the analysis suggests a bearish sentiment for the EUR/USD pair as the 14-day Relative Strength Index (RSI) is positioned below the 50 mark. Additionally, the lagging indicator, Moving Average Convergence Divergence (MACD), lies below the centreline and shows a divergence below the signal line, which indicates weakness for the pair.
The EUR/USD pair could find immediate support around the psychological level of 1.0600. A break below this level could exert downward pressure on the pair to navigate the region around the major level of 1.0550, followed by November’s low at 1.0516.
On the upside, the major level 1.0650 appears as the key barrier, followed by the 23.6% Fibonacci retracement level of 1.0672. A breakthrough above the latter could lead the EUR/USD pair to explore the area around the psychological level of 1.0700 and the nine-day Exponential Moving Average (EMA) at 1.0715.
EUR/USD: Daily Chart
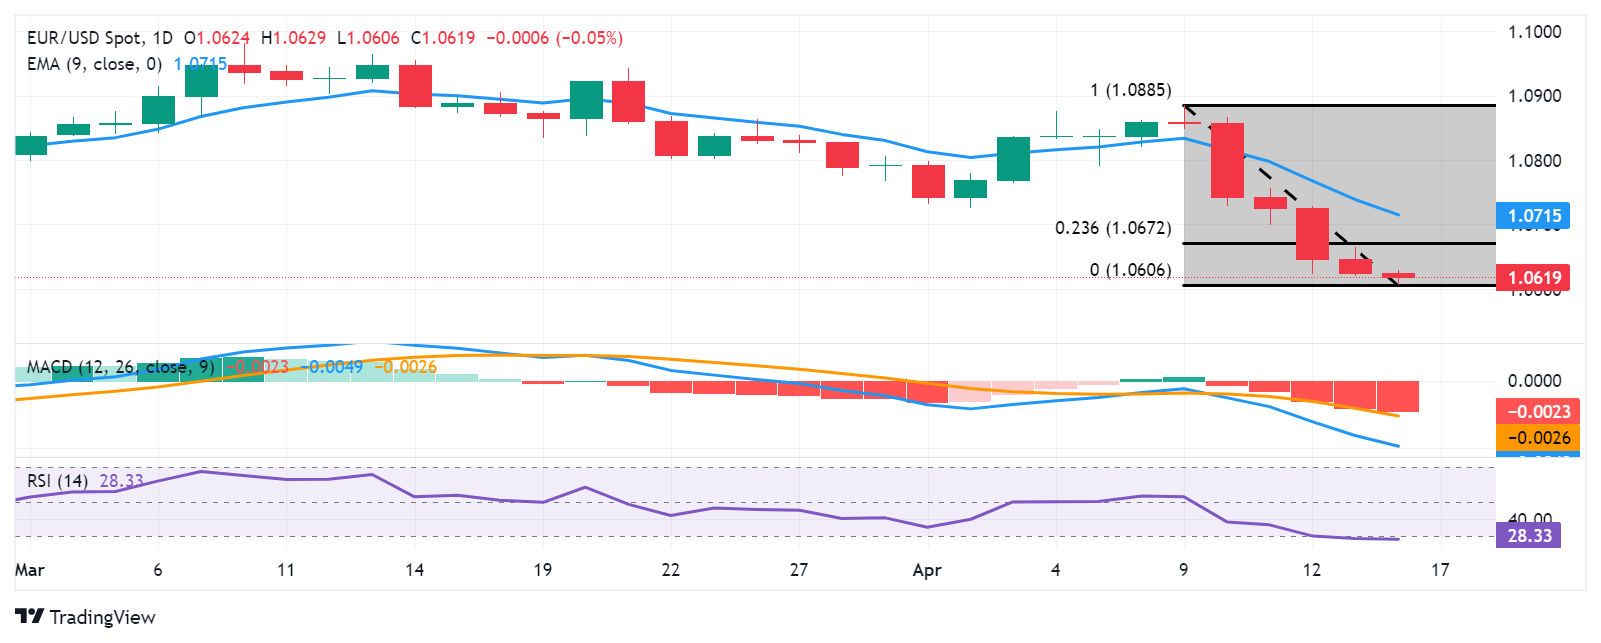
- The UK Unemployment Rate rose to 4.2% in three months to February.
- The Claimant Count Change for Britain stood at 10.9K in March.
- GBP/USD holds the bounce toward 1.2450 after mixed UK jobs data.
The United Kingdom’s (UK) ILO Unemployment Rate came in at 4.2% in the three months to February, rising from 3.9% in the previous period, data published by the Office for National Statistics (ONS) showed Tuesday. The reading missed the market expectations of a 4.0% print.
Additional details of the report showed that the number of people claiming jobless benefits rose by 10.9K in March, as against a revised increase of 4.1K reported in February. The market forecast was for a 17.2K increment in the reported period.
The Employment Change data for February arrived at -156K, compared with January’s -21K.
Average Earnings excluding Bonus in the UK rose 6.0% 3M YoY in February versus January’s 6.1% growth.
Another measure of wage inflation, Average Earnings including Bonus grew 5.6% in the same period, at the same pace seen in the quarter through January and against the expected increase of 5.5%.
GBP/USD reaction to the UK employment report
GBP/USD held on to its modest rebound above 1.2400 after the mixed UK employment data. The pair is trading 0.10% lower on the day at 1.2430, as of writing.
Pound Sterling price today
The table below shows the percentage change of Pound Sterling (GBP) against listed major currencies today. Pound Sterling was the weakest against the US Dollar.
| USD | EUR | GBP | CAD | AUD | JPY | NZD | CHF | |
| USD | 0.06% | 0.08% | 0.05% | 0.26% | 0.07% | 0.19% | 0.05% | |
| EUR | -0.06% | 0.06% | -0.02% | 0.22% | 0.02% | 0.13% | -0.01% | |
| GBP | -0.14% | -0.07% | -0.09% | 0.14% | -0.04% | 0.07% | -0.09% | |
| CAD | -0.06% | 0.00% | 0.07% | 0.19% | 0.01% | 0.13% | -0.02% | |
| AUD | -0.26% | -0.21% | -0.16% | -0.23% | -0.20% | -0.08% | -0.23% | |
| JPY | -0.09% | -0.06% | -0.05% | -0.06% | 0.16% | 0.09% | -0.07% | |
| NZD | -0.20% | -0.14% | -0.07% | -0.14% | 0.08% | -0.11% | -0.14% | |
| CHF | -0.05% | 0.01% | 0.07% | 0.00% | 0.24% | 0.04% | 0.14% |
The heat map shows percentage changes of major currencies against each other. The base currency is picked from the left column, while the quote currency is picked from the top row. For example, if you pick the Euro from the left column and move along the horizontal line to the Japanese Yen, the percentage change displayed in the box will represent EUR (base)/JPY (quote).
- USD/CAD attracts some buyers for the third straight day and climbs to a fresh YTD peak.
- Reduced Fed rate cut bets, along with geopolitical risks, benefit the USD and lend support.
- An uptick in Oil prices underpins the Loonie and keeps a lid on further gains for the major.
The USD/CAD pair builds on last week's breakout momentum through the 1.3600-1.3610 supply zone and gains some positive traction for the fifth successive day on Tuesday. Spot prices climb to the 1.3815 region, or the highest level since November 14 during the Asian session and remain well supported by the underlying strong bullish sentiment surrounding the US Dollar (USD).
The USD Index (DXY), which tracks the Greenback against a basket of currencies, climbs to over a five-month top in the wake of expectations that the Federal Reserve (Fed) will delay cutting interest rates amid sticky inflation. Adding to this, the upbeat US Retail Sales figures released on Monday indicated that strong consumer spending could underpin inflation and force the Fed to keep interest rates higher for longer. The hawkish outlook, meanwhile, remains supportive of elevated US Treasury bond yields, which is seen acting as a tailwind for the buck.
Apart from this, a generally weaker tone around the equity markets, amid persistent geopolitical tensions, turns out to be another factor benefitting the safe-haven Greenback and lending support to the USD/CAD pair. Meanwhile, Israel's military chief said that his country would respond to Iran's weekend missile and drone attack, raising the risk of a further escalation of conflicts in the Middle East. This assists Crude Oil prices to build on the overnight bounce from a two-week low, which could underpin the commodity-linked Loonie and cap the major.
Market participants now look to the release of the Canadian consumer inflation figures, due later during the early North American session. Meanwhile, the US economic docket features the release of housing market data and Industrial Production figures. Apart from this, speeches by influential FOMC, including Fed Chair Jerome Powell, and the broader risk sentiment will drive the USD demand. This, along with Oil price dynamics, should provide some meaningful impetus to the USD/CAD pair and allow traders to grab short-term opportunities.
FX option expiries for Apr 16 NY cut at 10:00 Eastern Time, via DTCC, can be found below
- EUR/USD: EUR amounts
- 1.0610 492m
- 1.0620 495m
- 1.0650 801m
- 1.0670 1b
- 1.0700 1.3b
- USD/JPY: USD amounts
- 154.05 401m
- USD/CHF: USD amounts
- 0.9140 475m
- AUD/USD: AUD amounts
- 0.6500 1.1b
- USD/CAD: USD amounts
- 1.3700 691m
- 1.3715 471m
- WTI price received upward support as investors expect Israel to respond to Iran’s assault.
- Israeli Prime Minister Benjamin Netanyahu has called upon his war cabinet to formulate a response to Iran's direct attack on Israel.
- The crude Oil prices hold ground in the face of mixed Chinese data.
West Texas Intermediate (WTI) Oil price edges higher to near $85.30 per barrel during the Asian trading hours on Tuesday. The crude Oil prices receive upward support due to concerns about the escalating tensions between Israel and Iran, particularly in the wake of Iran's missile and drone attacks on Saturday.
Furthermore, Israeli Prime Minister Benjamin Netanyahu convened his war cabinet for the second time in less than 24 hours on Monday to assess how to respond to Iran's direct attack on Israel, according to Reuters. Additionally, Israel's military chief stated that his country would retaliate against the assault, with reports suggesting that they are targeting strategic sites in Iran.
Iran, as a significant member of the Organization of the Petroleum Exporting Countries (OPEC), produces over 3 million barrels of crude Oil per day. Any escalation of tensions between Israel and Iran could potentially trigger a broader conflict in the Middle East.
On the demand side, crude Oil prices appear to be holding steady in the face of mixed data released by the world's largest oil importer on Tuesday. China's Gross Domestic Product (GDP) for the first quarter of 2024 expanded by 1.6% quarter-on-quarter, surpassing the previous quarter's growth of 1.0%. Year-on-year GDP growth came at 5.3%, exceeding expectations of 5.0% and surpassing the 5.2% figure from the previous period. However, China's Industrial Production (YoY) in March increased by 4.5%, falling short of market expectations of 5.4% and the previous reading of 7.0%.
Meanwhile, according to an African industry official speaking to Reuters, the Organization of the Petroleum Exporting Countries and Russia (OPEC+) considers Namibia for potential membership, given its projected status as Africa's fourth-largest Oil producer by the next decade. The primary aim initially would be for Namibia to become a part of OPEC+'s Charter of Cooperation, a coalition focused on conducting ongoing discussions about energy market dynamics.
- Gold price oscillates in a narrow band on Tuesday and remains close to the all-time peak.
- The worsening Middle East crisis weighs on investors’ sentiment and benefits the metal.
- Reduced Fed rate cut bets lift the USD to a fresh YTD top and cap gains for the XAU/USD.
Gold price (XAU/USD) struggles to capitalize on the overnight goodish bounce from the $2,325-2,324 area, or a multi-day low, and oscillates in a narrow trading band during the Asian session on Tuesday. The precious metal, meanwhile, remains within striking distance of the all-time peak touched last Friday and continues to draw support from persistent geopolitical tensions stemming from the ongoing conflicts in the Middle East. Apart from this, a modest pullback in the US Treasury bond yields is seen as another factor acting as a tailwind for the yellow metal.
That said, expectations that the Federal Reserve (Fed) will delay cutting interest rates in the wake of still-resilient US economic and sticky inflation should act as a tailwind for the US bond yields. Furthermore, hawkish Fed expectations lift the US Dollar (USD) to its highest level since early November, which, in turn, contributes to capping the upside for the non-yielding Gold price. Traders now look forward to speeches by influential FOMC members, including Fed Chair Jerome Powell, to grab short-term opportunities later during the early North American session.
Daily Digest Market Movers: Gold price continues to draw support from persistent geopolitical tensions
- The global risk sentiment remains fragile amid the worsening Middle East crisis and speculations that the Federal Reserve will keep rates higher for longer, which, in turn, acts as a tailwind for the Gold price.
- Investors have been pushing back their expectations about the timing of the first interest rate cut by the Fed to September from June in the wake of concerns about sticky inflation and a resilient US economy.
- The bets were reaffirmed by stronger-than-expected US Retail Sales data released on Monday, which indicated that consumer spending remains strong and could underpin inflation in the coming months.
- The US Census Bureau reported that Retail Sales rose by 0.7% MoM in March as compared to consensus estimates for a 0.3% increase and the previous month's upwardly revised growth of 0.9%.
- The yield on the benchmark 10-year US government bond shot to the highest level since November, though the disappointing release of the Empire State Manufacturing Index capped the upside.
- The US Dollar prolongs its recent upward trajectory and climbs to over a five-month peak, which might hold back bulls from placing fresh bets and keep a lid on any further gains for the XAU/USD.
- Tuesday's US economic docket features the release of housing market data and Industrial Production figures, which along with Fedspeak, might provide some impetus to the non-yielding yellow metal.
Technical Analysis: Gold price bulls still have the upper hand while above the $2,325-2,324 support zone
From a technical perspective, the overnight bounce validated the $2,325-2,324 support zone, which should now act as a key pivotal point. A convincing break below has the potential to drag the Gold price to the $2,300 round figure. Some follow-through selling will suggest that the precious metal has topped out in the near term and set the stage for some meaningful depreciating move towards the $2,220 zone with some intermediate support near the $2,250 region.
On the flip side, bulls might now wait for strength beyond the $2,400 mark before placing fresh bets and positioning for a move back towards retesting the record peak, around the $2,431-2,432 region touched last Friday. Given that the Relative Strength Index (RSI) on the daily chart is still flashing overbought conditions, the Gold price could pause near the all-time peak before resuming its recent well-established uptrend witnessed over the past three weeks or so.
Gold FAQs
Gold has played a key role in human’s history as it has been widely used as a store of value and medium of exchange. Currently, apart from its shine and usage for jewelry, the precious metal is widely seen as a safe-haven asset, meaning that it is considered a good investment during turbulent times. Gold is also widely seen as a hedge against inflation and against depreciating currencies as it doesn’t rely on any specific issuer or government.
Central banks are the biggest Gold holders. In their aim to support their currencies in turbulent times, central banks tend to diversify their reserves and buy Gold to improve the perceived strength of the economy and the currency. High Gold reserves can be a source of trust for a country’s solvency. Central banks added 1,136 tonnes of Gold worth around $70 billion to their reserves in 2022, according to data from the World Gold Council. This is the highest yearly purchase since records began. Central banks from emerging economies such as China, India and Turkey are quickly increasing their Gold reserves.
Gold has an inverse correlation with the US Dollar and US Treasuries, which are both major reserve and safe-haven assets. When the Dollar depreciates, Gold tends to rise, enabling investors and central banks to diversify their assets in turbulent times. Gold is also inversely correlated with risk assets. A rally in the stock market tends to weaken Gold price, while sell-offs in riskier markets tend to favor the precious metal.
The price can move due to a wide range of factors. Geopolitical instability or fears of a deep recession can quickly make Gold price escalate due to its safe-haven status. As a yield-less asset, Gold tends to rise with lower interest rates, while higher cost of money usually weighs down on the yellow metal. Still, most moves depend on how the US Dollar (USD) behaves as the asset is priced in dollars (XAU/USD). A strong Dollar tends to keep the price of Gold controlled, whereas a weaker Dollar is likely to push Gold prices up.
- NZD/USD extends its losing streak as traders adopt cautious stance amid anticipation of Israel's response to Iran's assault.
- US Retail Sales (MoM) rose by 0.7% in March, against the expected 0.3% and 0.9% prior.
- US Dollar extends gains on amplified expectations of the Fed maintaining higher policy rates for an extended period.
NZD/USD depreciates to near 0.5880 during the Asian trading session on Tuesday, as investors turn toward the US Dollar (USD) seeking refuge amid escalated geopolitical tensions in the Middle East. Traders await Israel’s response to Iran’s airstrike over the weekend. Additionally, traders are awaiting New Zealand's Consumer Price Index (CPI) data for the first quarter of 2024, scheduled for release on Wednesday. Market expectations suggest a slight uptick to 0.6% quarter-on-quarter, compared to the previous period's 0.5%.
The Chinese and Iranian foreign ministers recently engaged in a phone conversation, during which the Iranian foreign minister conveyed Iran's willingness to exercise restraint and expressed no desire to escalate the current situation further, as per Chinese state media. Additionally, China vehemently condemns and firmly opposes the recent attack on the Iranian embassy in Syria, deeming it a serious breach of international law and categorizing it as 'unacceptable'.
The New Zealand Dollar (NZD) fails to take any response from the mixed Chinese data, considering the two nations are close trading partners. China’s Gross Domestic Product (GDP) rose by 1.6% QoQ in the first quarter of 2024, against the previous quarter’s increase of 1.0%. GDP year-over-year rose by 5.3%, exceeding the expected 5.0% and 5.2% prior. Meanwhile, China’s Industrial Production (YoY) increased by 4.5% in March, against the market expectations of 5.4% and 7.0% prior
On the other side, the US Dollar (USD) gained strength as Retail Sales surpassed expectations, denting hopes for potential monetary policy easing by the Federal Reserve (Fed). March's Retail Sales (MoM) surged by 0.7%, outpacing forecasts of 0.3%. February's figure was also revised upward from 0.6% to 0.9%. The Retail Sales Control Group climbed by 1.1%, marking a substantial increase from the previous 0.3%. Investors are now eyeing upcoming US housing data due on Tuesday, as well as Fed Chair Jerome Powell's speech at the Washington Forum.
- GBP/USD drops to a fresh YTD low and is pressured by a combination of factors.
- Bets for more aggressive policy easing by the BoE continue to weigh on the GBP.
- Reduced Fed rate cut bets underpin the USD and also contribute to the downfall.
The GBP/USD pair drifts lower for the third straight day on Tuesday – also marking the fourth day of a negative move in the previous five – and drops to its lowest level since November 17 during the Asian session. Spot prices currently trade around the 1.2420 region as traders now look to the UK monthly employment details for a fresh impetus.
According to the consensus estimates, the number of people claiming unemployment-related benefits are expected to rise to 17.2K from 16.8K previous and the jobless rate is seen edging higher from 3.9% to 4% during the three months to March. This could offer more evidence that the jobs market is cooling and reinforce bets for at least four rate cuts by the Bank of England (BoE) this year, starting in June, which should weigh on the British Pound (GBP) and drag the GBP/USD pair lower.
Meanwhile, the immediate market reaction to a surprisingly stronger report is more likely to be limited in the wake of a strong bullish sentiment surrounding the US Dollar (USD), bolstered by hawkish Federal Reserve (Fed) expectations. Investors pushed back their expectations for the first interest rate cut by the Fed to September from June following the release of hotter-than-expected US consumer inflation figures. This keeps the US Treasury bond yields elevated and underpins the buck.
Apart from this, persistent geopolitical tensions stemming from the ongoing conflicts in the Middle East turn out to be another factor that benefits the Greenback's relative safe-haven status. This, in turn, suggests that the path of least resistance for the GBP/USD pair is to the downside and any attempted recovery might now be seen as a selling opportunity. Traders on Tuesday will further take cues from the US macro data and speeches by FOMC members, including Fed Chair Jerome Powell.
- The Japanese Yen remains depressed near a multi-decade low amid the BoJ’s dovish outlook.
- Reduced Fed rate cut bets lift the USD to a fresh YTD top and further lend support to USD/JPY.
- Intervention fears and a softer risk tone could help limit deeper losses for the safe-haven JPY.
The Japanese Yen (JPY) struggles to gain any meaningful traction during the Asian session on Tuesday and languishes near the 34-year low touched against its American counterpart the previous day. A report on Monday suggested that the Bank of Japan (BoJ) will place less emphasis on inflation and shift to a more discretionary approach in setting monetary policy. Meanwhile, BoJ Governor Kazuo Ueda said that after ending negative rates in March, the central bank would revert to a normal monetary policy that lets various data guide the future rate hike path. This adds to the BoJ's uncertain outlook for future rate hikes and continues to undermine the JPY.
In contrast, the markets pushed back expectations for the first interest rate cut by the Federal Reserve (Fed) following the release of the hotter-than-expected US consumer inflation figures for March. This suggests that the large rate differential between the two countries will stay for some time, which, along with a bullish US Dollar (USD), acts as a tailwind for the USD/JPY pair. Meanwhile, the recent jawboning by Japanese authorities and a softer risk tone could help limit losses for the safe-haven JPY. This, in turn, might hold back traders from placing fresh bullish bets around the currency pair amid overbought technical indicators on the daily chart.
Daily Digest Market Movers: Japanese Yen continues losing ground amid divergent BoJ-Fed policy expectations
- The Japanese Yen continues to be weighed down by the Bank of Japan's dovish outlook, indicating that it is in no rush in terms of policy normalization, which, along with a bullish US Dollar, keeps the USD/JPY pair pinned near a 34-year peak.
- The incoming US data pointed to a still-resilient economy and sticky inflation, raising doubts over how aggressively the Federal Reserve will be able to cut interest rates this year and pushing the US Treasury bond yields to a five-month high.
- The US Census Bureau reported on Monday that Retail Sales rose 0.7% in March as compared to market expectations of a 0.3%increase and the previous month's reading was revised higher to show a growth of 0.9% vs. 0.6% reported originally.
- This, to a larger extent, helps offset the disappointing release of the Empire State Manufacturing Index, which improved less than expected to -14.3 in April from -20.9 and indicated continued weakness in the manufacturing business activity.
- The markets are now pricing in less than two interest rate cuts by the end of 2024 as compared to three projected by the Fed, which lifts the US Dollar to its highest level since November and continues to act as a tailwind for the USD/JPY pair.
- Japanese Finance Minister Shunichi Suzuki reiterated on Tuesday that he is closely watching FX moves and will take all possible measures, though refrained from commenting on whether the recent FX moves are too rapid or excessive.
- Japan's Chief Cabinet Secretary Yoshimasa Hayashi said that it is important for currencies to move in a stable manner, reflecting fundamentals and excessive FX volatility is undesirable, though it does little to provide any respite to the JPY bulls.
- Expectations that the Fed will keep rates higher for longer, along with the risk of a further escalation of conflicts in the Middle East, weigh on investors' sentiment and lend support to the safe-haven JPY, capping gains for the USD/JPY pair.
- Traders now look to the US macro data – Building Permits, Housing Starts and Industrial Production figures – and speeches by influential FOMC members, including Fed Chair Jerome Powell, for some meaningful impetus later this Tuesday.
Technical Analysis: USD/JPY bulls not ready to give up yet, overbought RSI on the daily chart warrants some caution
From a technical perspective, the recent breakout through a short-term trading range hurdle near the 152.00 round figure and the subsequent move up was seen as a fresh trigger for bullish traders. That said, the Relative Strength Index (RSI) on the daily chart is flashing overbought conditions, making it prudent to wait for some near-term consolidation or a modest pullback before positioning for any further gains. Meanwhile, any meaningful corrective slide below the 154.00 mark is likely to attract fresh buyers and remain limited near the 153.40-153.35 region.
This is followed by the overnight swing low or levels just below the 153.00 mark. Some follow-through selling could pave the way for deeper losses and drag the USD/JPY pair further toward the 152.60-152.55 zone en route to the 152.00 resistance-turned-support. On the flip side, momentum beyond the mid-154.00s has the potential to lift spot prices further towards the 155.00 psychological mark.
Japanese Yen FAQs
The Japanese Yen (JPY) is one of the world’s most traded currencies. Its value is broadly determined by the performance of the Japanese economy, but more specifically by the Bank of Japan’s policy, the differential between Japanese and US bond yields, or risk sentiment among traders, among other factors.
One of the Bank of Japan’s mandates is currency control, so its moves are key for the Yen. The BoJ has directly intervened in currency markets sometimes, generally to lower the value of the Yen, although it refrains from doing it often due to political concerns of its main trading partners. The current BoJ ultra-loose monetary policy, based on massive stimulus to the economy, has caused the Yen to depreciate against its main currency peers. This process has exacerbated more recently due to an increasing policy divergence between the Bank of Japan and other main central banks, which have opted to increase interest rates sharply to fight decades-high levels of inflation.
The BoJ’s stance of sticking to ultra-loose monetary policy has led to a widening policy divergence with other central banks, particularly with the US Federal Reserve. This supports a widening of the differential between the 10-year US and Japanese bonds, which favors the US Dollar against the Japanese Yen.
The Japanese Yen is often seen as a safe-haven investment. This means that in times of market stress, investors are more likely to put their money in the Japanese currency due to its supposed reliability and stability. Turbulent times are likely to strengthen the Yen’s value against other currencies seen as more risky to invest in.
- Australian Dollar loses ground on risk aversion as traders await Israel’s response to Iran’s attack.
- Australian currency faces challenges due to differing monetary policy outlooks between the RBA and the Fed.
- US Dollar receives support as stronger-than-expected US Retail Sales figures have diminished sentiment regarding the Fed’s rate cuts.
The Australian Dollar (AUD) extends losses for the third consecutive session on Tuesday, possibly due to the risk aversion as investors cautiously await Israel’s response to Iran’s unprecedented air assault on Saturday. However, the AUD/USD pair pares losses after mixed data from China.
The Australian Dollar faces hurdles amid concerns that the Reserve Bank of Australia (RBA) might need to lower interest rates ahead of the United States (US). According to the Financial Review, the ongoing high inflation in the world's largest economy raises uncertainty about whether the Federal Reserve can take any action this year. Traditionally, as the world's most influential central bank due to the scale of the financial markets it oversees, the Fed typically leads global rate-cutting cycles.
The US Dollar Index (DXY) remains on an upward trajectory, likely influenced by the rise in US Treasury yields. The stronger-than-anticipated US Retail Sales data has added to the diminishing sentiment regarding the Federal Reserve's (Fed) potential monetary policy easing, thereby bolstering the US Dollar (USD). Investors are likely to monitor the US housing data slated for release on Tuesday, alongside Fed Chair Jerome Powell's speech at the Washington Forum.
Daily Digest Market Movers: Australian Dollar depreciates on risk aversion
- Australia’s Consumer Inflation Expectations released on Thursday, showed an increase of 4.6% in April against the previous increase of 4.3%.
- Australian labor market data is due on Thursday, including seasonally adjusted Employment Change and Unemployment Rate for March.
- China’s Gross Domestic Product (GDP) rose by 1.6% QoQ in the first quarter of 2024, against the previous quarter’s increase of 1.0%. GDP year-over-year rose by 5.3%, exceeding the expected 5.0% and 5.2% prior.
- China’s Industrial Production (YoY) increased by 4.5% in March, against the market expectations of 5.4% and 7.0% prior
- Chinese Retail Sales increased by 3.1% in March, as compared to February’s rise of 5.5%. The market was expecting a 4.5% increase.
- Federal Reserve (Fed) Bank of San Francisco President Mary Daly has emphasized that although there has been significant progress regarding inflation, there is still more to be done. She stressed the necessity of being assured that inflation is heading towards the target before making any decisions.
- According to the CME FedWatch Tool, the likelihood of interest rates remaining unchanged in the June meeting has been increased to 77.5% from the previous week of 48.5%.
- US Retail Sales (MoM) increased by 0.7% in March, exceeding the market expectations of 0.3%. The previous reading was revised to 0.9% from 0.6% in February.
- US Retail Sales Control Group rose by 1.1% against the previous increase of 0.3%.
- US yields on 2-year and 10-year Treasury bonds stand at 4.92% and 4.61%, respectively, at the time of writing.
Technical Analysis: Australian Dollar could test the psychological support of 0.6400
The Australian Dollar trades around 0.6420 on Tuesday. The 14-day Relative Strength Index (RSI) suggests a bearish sentiment for the AUD/USD pair as it is positioned below the 50 level. Key support appears at the psychological level of 0.6400. A break below this level could exert downward pressure on the AUD/USD pair to approach the major support at 0.6350, followed by November’s low at 0.6318. On the upside, the AUD/USD pair could find the key resistance at the major level of 0.6450, followed by the 23.6% Fibonacci retracement level of 0.6464. A breakthrough above the latter could support the pair to test the nine-day Exponential Moving Average (EMA) at 0.6499, aligned with the psychological level of 0.6500.
AUD/USD: Daily Chart
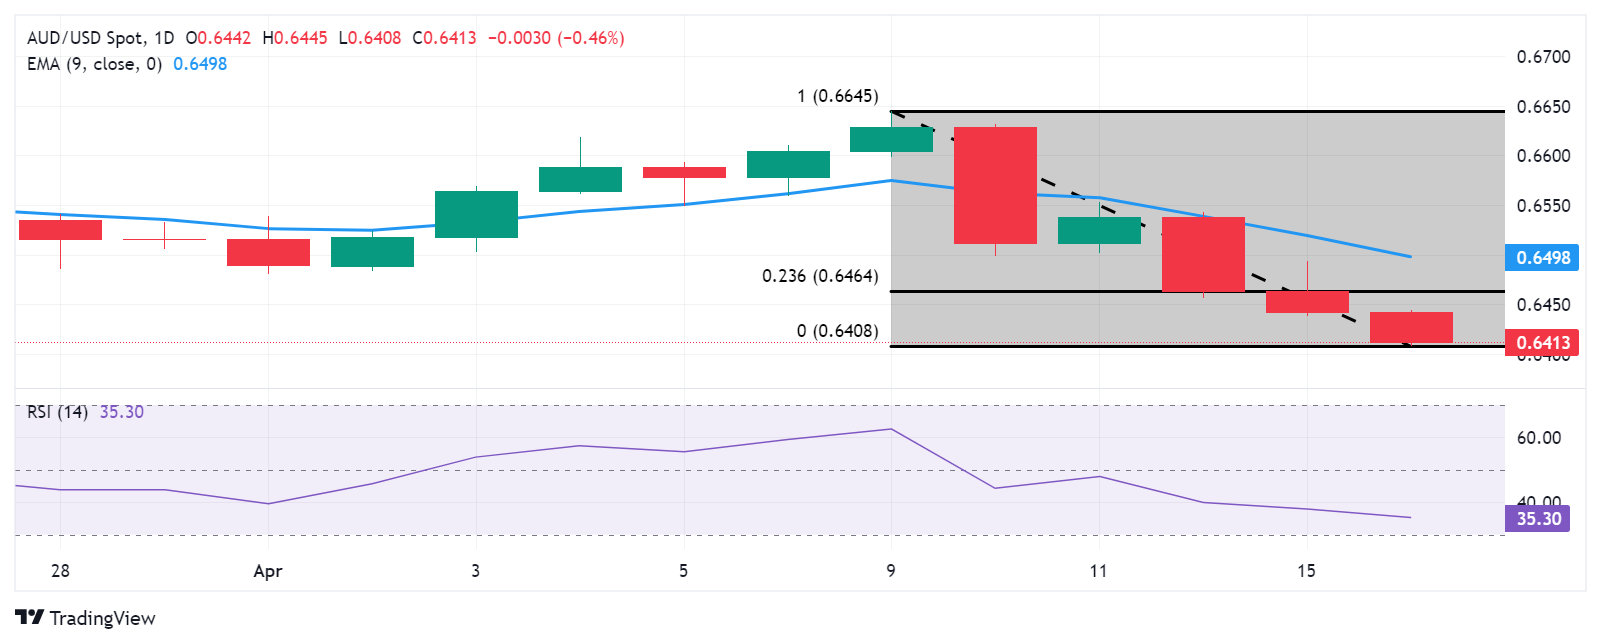
Australian Dollar price today
The table below shows the percentage change of Australian Dollar (AUD) against listed major currencies today. Australian Dollar was the weakest against the US Dollar.
| USD | EUR | GBP | CAD | AUD | JPY | NZD | CHF | |
| USD | 0.16% | 0.19% | 0.18% | 0.47% | 0.10% | 0.43% | 0.19% | |
| EUR | -0.16% | 0.03% | -0.01% | 0.28% | -0.05% | 0.28% | 0.01% | |
| GBP | -0.19% | -0.02% | -0.01% | 0.29% | -0.07% | 0.25% | -0.01% | |
| CAD | -0.17% | 0.00% | 0.03% | 0.29% | -0.07% | 0.26% | 0.01% | |
| AUD | -0.44% | -0.28% | -0.25% | -0.27% | -0.32% | 0.01% | -0.26% | |
| JPY | -0.10% | 0.03% | 0.06% | 0.07% | 0.33% | 0.31% | 0.06% | |
| NZD | -0.44% | -0.28% | -0.26% | -0.28% | -0.01% | -0.34% | -0.27% | |
| CHF | -0.18% | -0.02% | 0.01% | 0.00% | 0.27% | -0.06% | 0.27% |
The heat map shows percentage changes of major currencies against each other. The base currency is picked from the left column, while the quote currency is picked from the top row. For example, if you pick the Euro from the left column and move along the horizontal line to the Japanese Yen, the percentage change displayed in the box will represent EUR (base)/JPY (quote).
Australian Dollar FAQs
One of the most significant factors for the Australian Dollar (AUD) is the level of interest rates set by the Reserve Bank of Australia (RBA). Because Australia is a resource-rich country another key driver is the price of its biggest export, Iron Ore. The health of the Chinese economy, its largest trading partner, is a factor, as well as inflation in Australia, its growth rate, and Trade Balance. Market sentiment – whether investors are taking on more risky assets (risk-on) or seeking safe havens (risk-off) – is also a factor, with risk-on positive for AUD.
The Reserve Bank of Australia (RBA) influences the Australian Dollar (AUD) by setting the level of interest rates that Australian banks can lend to each other. This influences the level of interest rates in the economy as a whole. The main goal of the RBA is to maintain a stable inflation rate of 2-3% by adjusting interest rates up or down. Relatively high interest rates compared to other major central banks support the AUD, and the opposite for relatively low. The RBA can also use quantitative easing and tightening to influence credit conditions, with the former AUD-negative and the latter AUD-positive.
China is Australia’s largest trading partner so the health of the Chinese economy is a major influence on the value of the Australian Dollar (AUD). When the Chinese economy is doing well it purchases more raw materials, goods and services from Australia, lifting demand for the AUD, and pushing up its value. The opposite is the case when the Chinese economy is not growing as fast as expected. Positive or negative surprises in Chinese growth data, therefore, often have a direct impact on the Australian Dollar and its pairs.
Iron Ore is Australia’s largest export, accounting for $118 billion a year according to data from 2021, with China as its primary destination. The price of Iron Ore, therefore, can be a driver of the Australian Dollar. Generally, if the price of Iron Ore rises, AUD also goes up, as aggregate demand for the currency increases. The opposite is the case if the price of Iron Ore falls. Higher Iron Ore prices also tend to result in a greater likelihood of a positive Trade Balance for Australia, which is also positive of the AUD.
The Trade Balance, which is the difference between what a country earns from its exports versus what it pays for its imports, is another factor that can influence the value of the Australian Dollar. If Australia produces highly sought after exports, then its currency will gain in value purely from the surplus demand created from foreign buyers seeking to purchase its exports versus what it spends to purchase imports. Therefore, a positive net Trade Balance strengthens the AUD, with the opposite effect if the Trade Balance is negative.
Following the publication of the high-impact China’s activity data for March, the National Bureau of Statistics (NBS) expressed its outlook on the economy during its press conference on Tuesday.
Key quotes (via Reuters)
China's consumer inflation will recover mildly.
Meanwhile, citing sources, Reuters reports on Tuesday that China's major state banks are seen selling the US Dollars for Yuan in onshore forex market to stabilize the Chinese currency.
developing story ...
| Raw materials | Closed | Change, % |
|---|---|---|
| Silver | 28.847 | 2.5 |
| Gold | 2381.2 | 0.91 |
| Palladium | 1033.72 | -1.89 |
China’s economy expanded 5.3% over the year in the first quarter of 2024, as against a 5.2%% growth in the final quarter of 2023, the official data released by the National Bureau of Statistics (NBS) showed on Tuesday. The market consensus was 5.0% in the reported period.
On a quarterly basis, Chinese Gross Domestic Product (GDP) rate increased by 1.6% in Q1 2024 vs. 1.0% registered in the previous quarter.
China’s March Retail Sales YoY, rose 3.1% vs. 4.5% expected and 5.5% prior while the country’s Industrial Production arrived at 4.5% YoY vs. 5.4% estimates and February’s 7.0%.
Meanwhile, the Fixed Asset Investment increased 4.5% YTD YoY in March vs 4.3% expected and 4.2% last.
AUD/USD reaction to China’s data dump
Stronger-than-expected China’s GDP data briefly lifted the Australian Dollar, although the upside appears limited amid unabated US Dollar demand. At the time of writing, AUD/USD is holding its minor upswing to near 0.6430, still down 0.22% on the day.
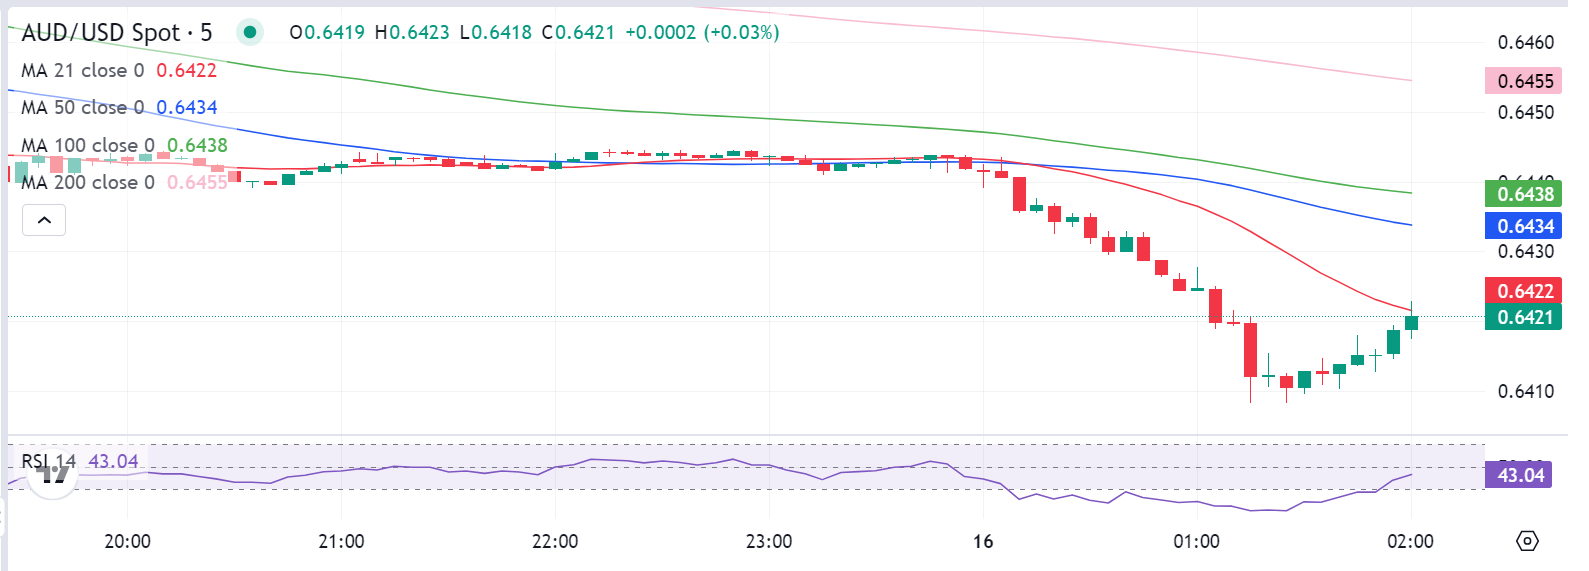
AUD/USD: 5-minutes chart
Australian Dollar FAQs
One of the most significant factors for the Australian Dollar (AUD) is the level of interest rates set by the Reserve Bank of Australia (RBA). Because Australia is a resource-rich country another key driver is the price of its biggest export, Iron Ore. The health of the Chinese economy, its largest trading partner, is a factor, as well as inflation in Australia, its growth rate and Trade Balance. Market sentiment – whether investors are taking on more risky assets (risk-on) or seeking safe-havens (risk-off) – is also a factor, with risk-on positive for AUD.
The Reserve Bank of Australia (RBA) influences the Australian Dollar (AUD) by setting the level of interest rates that Australian banks can lend to each other. This influences the level of interest rates in the economy as a whole. The main goal of the RBA is to maintain a stable inflation rate of 2-3% by adjusting interest rates up or down. Relatively high interest rates compared to other major central banks support the AUD, and the opposite for relatively low. The RBA can also use quantitative easing and tightening to influence credit conditions, with the former AUD-negative and the latter AUD-positive.
China is Australia’s largest trading partner so the health of the Chinese economy is a major influence on the value of the Australian Dollar (AUD). When the Chinese economy is doing well it purchases more raw materials, goods and services from Australia, lifting demand for the AUD, and pushing up its value. The opposite is the case when the Chinese economy is not growing as fast as expected. Positive or negative surprises in Chinese growth data, therefore, often have a direct impact on the Australian Dollar and its pairs.
Iron Ore is Australia’s largest export, accounting for $118 billion a year according to data from 2021, with China as its primary destination. The price of Iron Ore, therefore, can be a driver of the Australian Dollar. Generally, if the price of Iron Ore rises, AUD also goes up, as aggregate demand for the currency increases. The opposite is the case if the price of Iron Ore falls. Higher Iron Ore prices also tend to result in a greater likelihood of a positive Trade Balance for Australia, which is also positive of the AUD.
The Trade Balance, which is the difference between what a country earns from its exports versus what it pays for its imports, is another factor that can influence the value of the Australian Dollar. If Australia produces highly sought after exports, then its currency will gain in value purely from the surplus demand created from foreign buyers seeking to purchase its exports versus what it spends to purchase imports. Therefore, a positive net Trade Balance strengthens the AUD, with the opposite effect if the Trade Balance is negative.
Following his meeting with the Chinese counterpart, Iranian Foreign Minister Hossein Amir-Abdollahian said that “Iran is willing to exercise restraint and has no intention of further escalating the situation.”
In a phone call with Iran’s Foreign Minister, China's Foreign Minister noted that 'It is believed that Iran will be able to grasp the situation well and avoid further instability while safeguarding Iran's sovereignty and dignity.”
Market reaction
Despite a thaw in the Israel-Iran conflict, the safe-haven US Dollar continues to find demand against its major counterparts, with the US Dollar Index trading 0.13% higher on the day at 106.35, as of writing.
Risk sentiment FAQs
In the world of financial jargon the two widely used terms “risk-on” and “risk off'' refer to the level of risk that investors are willing to stomach during the period referenced. In a “risk-on” market, investors are optimistic about the future and more willing to buy risky assets. In a “risk-off” market investors start to ‘play it safe’ because they are worried about the future, and therefore buy less risky assets that are more certain of bringing a return, even if it is relatively modest.
Typically, during periods of “risk-on”, stock markets will rise, most commodities – except Gold – will also gain in value, since they benefit from a positive growth outlook. The currencies of nations that are heavy commodity exporters strengthen because of increased demand, and Cryptocurrencies rise. In a “risk-off” market, Bonds go up – especially major government Bonds – Gold shines, and safe-haven currencies such as the Japanese Yen, Swiss Franc and US Dollar all benefit.
The Australian Dollar (AUD), the Canadian Dollar (CAD), the New Zealand Dollar (NZD) and minor FX like the Ruble (RUB) and the South African Rand (ZAR), all tend to rise in markets that are “risk-on”. This is because the economies of these currencies are heavily reliant on commodity exports for growth, and commodities tend to rise in price during risk-on periods. This is because investors foresee greater demand for raw materials in the future due to heightened economic activity.
The major currencies that tend to rise during periods of “risk-off” are the US Dollar (USD), the Japanese Yen (JPY) and the Swiss Franc (CHF). The US Dollar, because it is the world’s reserve currency, and because in times of crisis investors buy US government debt, which is seen as safe because the largest economy in the world is unlikely to default. The Yen, from increased demand for Japanese government bonds, because a high proportion are held by domestic investors who are unlikely to dump them – even in a crisis. The Swiss Franc, because strict Swiss banking laws offer investors enhanced capital protection.
- EUR/USD extends its losing streak as the Fed is expected to maintain higher interest rates for an extended period.
- US Retail Sales (MoM) experienced a 0.7% increase in March, against the expected 0.3% and 0.9% prior.
- The dovish remarks from the ECB’s officials contribute to downward pressure on the Euro.
EUR/USD continues to lose ground for the sixth successive session, trading near 1.0610 during the Asian hours on Tuesday. The elevated US Dollar (USD) is exerting pressure on the EUR/USD pair, potentially influenced by the higher US Treasury yields. Furthermore, better-than-expected Retail Sales figures from the United States (US) have amplified expectations that the Federal Reserve (Fed) may maintain higher interest rates for an extended period.
US Dollar Index (DXY) extends its gains to near 106.20, with 2-year and 10-year yields on US Treasury bonds standing at 4.92% and 4.60%, respectively, at the time of writing. Escalating geopolitical tensions in the Middle East are prompting investors to flock towards the safe-haven US Dollar (USD) as a refuge.
US Retail Sales (MoM) increased by 0.7% in March, exceeding the market expectations of 0.3%. The previous reading was revised to 0.9% from 0.6% in February. Retail Sales Control Group rose by 1.1% against the previous increase of 0.3%.
Federal Reserve (Fed) Bank of San Francisco President Mary Daly recently stated that while there has been notable progress on inflation, there is still further ground to cover. She emphasized the importance of being confident that inflation is on a path toward the target before taking action. Daly also highlighted that the economy is experiencing solid growth, the labor market remains robust, and inflation is currently above the target level.
The Euro depreciates following dovish remarks from European Central Bank (ECB) officials on Monday. Gediminas Šimkus, a member of the ECB Governing Council, stated that there is a greater than 50% likelihood of witnessing more than three rate cuts this year, according to Reuters.
Additionally, ECB Chief Economist Philip Lane highlighted that there has been notably less progress concerning domestic inflation compared to broader inflation measures. Despite potential near-term fluctuations in the inflation outlook, the projected convergence of inflation to the target by 2025 remains supported.
The People’s Bank of China (PBoC) set the USD/CNY central rate for the trading session ahead on Tuesday at 7.1028 as compared to the previous day's of 7.0979 and 7.2475 Reuters estimates.
Japan's Chief Cabinet Secretary Yoshimasa Hayashi is out with comments on Tuesday, saying that is important for currencies to move in a stable manner reflecting fundamentals.
Additional Quotes:
Won't comment on forex levels, currency intervention
Excessive FX volatility is undesirable.
Closely watching FX moves.
Prepared to take all measures on FX.
Market Reaction:
The Japanese Yen (JPY) is seen consolidating its recent slump to a 34-year low against its American counterpart, with the USD/JPY pair holding steady above the 154.00 mark during the Asian session on Tuesday.
Japanese Finance Minister Shunichi Suzuki reiterated on Tuesday that he is closely watching FX moves and will take all possible measures. Suzuki added that he is aware that FX is not set as an agenda item at the G20 meeting, but it may be brought up in conversation at the meeting and it is not appropriate to comment on whether FX moves too rapid or excessive.
Market Reaction:
The comments do little to provide any respite to the Japanese Yen (JPY), which remains depressed in the wake of divergent Bank of Japan (BoJ)-Federal Reserve (Fed) policy expectations. Meanwhile, the USD/JPY pair languishes near a 34-year low and holds steady above the 154.00 mark during the Asian session on Tuesday.
Federal Reserve (Fed) Bank of San Francisco President Mary Daly crossed the wires in the last hour, saying that the progress on inflation has been significant, but we are still not there yet.
Key Quotes:
Recent inflation data was not surprising.
Inflation bumps along the way aren't particularly surprising.
Don't want to end up with a too-strong, or too-weak policy response.
Need to be confident that inflation is on the way to target before acting.
Can't just look at published information, that's backwards-looking.
The economy growing at a solid rate, the labor market is still strong, and inflation is above target.
The worst thing to do is act urgently when urgency isn't necessary.
Market Reaction:
The hawkish-sounding remarks reinforce market expectations that the Fed will delay cutting interest rates, which has been a key factor behind the recent US Dollar (USD) rally to its highest level since early November.
| Index | Change, points | Closed | Change, % |
|---|---|---|---|
| NIKKEI 225 | -290.75 | 39232.8 | -0.74 |
| Hang Seng | -121.23 | 16600.46 | -0.72 |
| KOSPI | -11.39 | 2670.43 | -0.42 |
| ASX 200 | -35.6 | 7752.5 | -0.46 |
| DAX | 96.26 | 18026.58 | 0.54 |
| CAC 40 | 34.28 | 8045.11 | 0.43 |
| Dow Jones | -248.13 | 37735.11 | -0.65 |
| S&P 500 | -61.59 | 5061.82 | -1.2 |
| NASDAQ Composite | -290.07 | 15885.02 | -1.79 |
| Pare | Closed | Change, % |
|---|---|---|
| AUDUSD | 0.64412 | -0.38 |
| EURJPY | 163.863 | 0.58 |
| EURUSD | 1.06244 | -0.15 |
| GBPJPY | 191.901 | 0.62 |
| GBPUSD | 1.24427 | -0.1 |
| NZDUSD | 0.59025 | -0.59 |
| USDCAD | 1.37865 | 0.08 |
| USDCHF | 0.91165 | -0.15 |
| USDJPY | 154.225 | 0.71 |


© 2000-2026. All rights reserved.
This site is managed by Teletrade D.J. LLC 2351 LLC 2022 (Euro House, Richmond Hill Road, Kingstown, VC0100, St. Vincent and the Grenadines).
The information on this website is for informational purposes only and does not constitute any investment advice.
The company does not serve or provide services to customers who are residents of the US, Canada, Iran, The Democratic People's Republic of Korea, Yemen and FATF blacklisted countries.
Making transactions on financial markets with marginal financial instruments opens up wide possibilities and allows investors who are willing to take risks to earn high profits, carrying a potentially high risk of losses at the same time. Therefore you should responsibly approach the issue of choosing the appropriate investment strategy, taking the available resources into account, before starting trading.
Use of the information: full or partial use of materials from this website must always be referenced to TeleTrade as the source of information. Use of the materials on the Internet must be accompanied by a hyperlink to teletrade.org. Automatic import of materials and information from this website is prohibited.
Please contact our PR department if you have any questions or need assistance at pr@teletrade.global.
transfers