- Analytics
- News and Tools
- Market News
CFD Markets News and Forecasts — 13-01-2022
Federal Reserve's Christopher Waller said three hikes in 2022 are still a good baseline but he said if inflation stays high there could be four or even five hikes.
Key notes
Could also allow the balance sheet to run off earlier.
Doesn't favour 50bps Fed hike in March.
Could start shrinking Fed balance sheet by summer.
Can shrink balance sheet by allowing organic runoff.
Expect inflation around 2.5% by end of 2022.
Once inflation down to 2.5% rapid rate hikes no longer needed.
Fed can take action on balance sheet to prevent yield curve flattening if needed.
Inflation has stayed higher for longer than any of us thought it would.
Fed has to be ready to make quick changes in direction, speed, depending on data.
If inflation stays above 3%, clearly we would need to do more, and potentially rethink framework.
High inflation caught us off guard in what it implies for framework.
Market implications
After Fed's Williams on Friday, Fed speakers will then enter blackout on communications this weekend and the markets are already expecting a rate increase as soon as the end of this quarter. The Fed has guided that rates can start to go up as soon as March.
However, the balance sheet runoff has been rethought by my markets this week, with some members suggesting it will not happen until late in the year or next year. This has stripped US yields and the US dollar lower. Waller is on the more hawkish side, however,
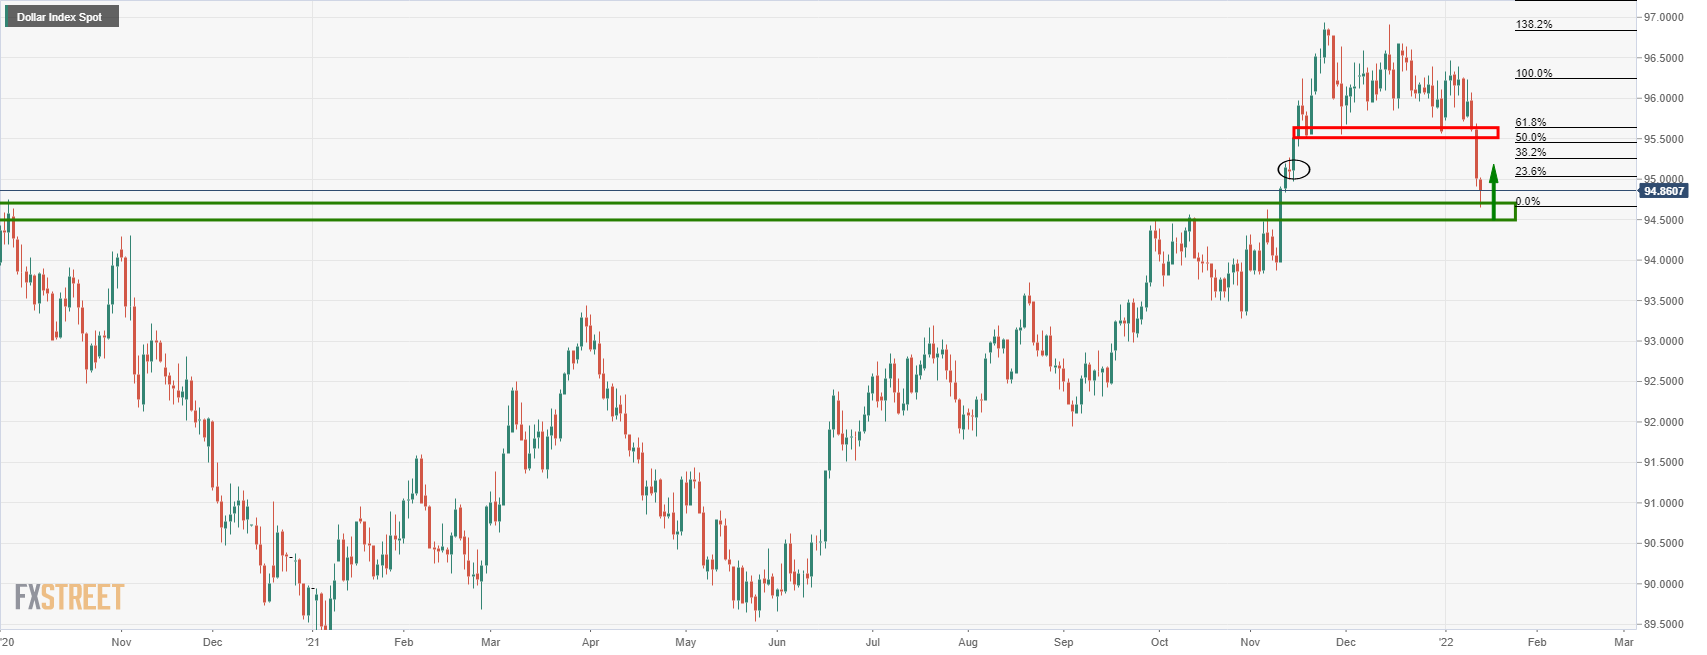
Meanwhile, the US dollar, as measured by the DXY index, has moved in on a critical level of daily support and would now be expected to correct higher as follows:
- The New Zealand dollar extends its rally to four days as the Asian session begins.
- A risk-off market mood did not stop the NZD rise towards a fresh YTD high.
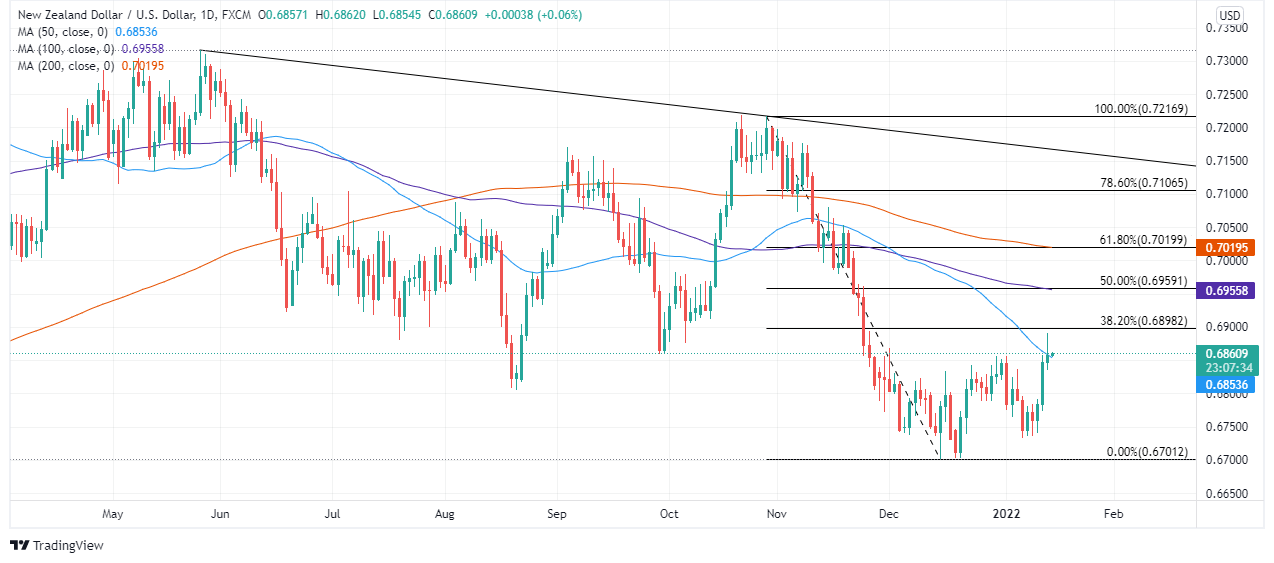
- NZD/USD Technical Outlook: It has a neutral bias though if NZD bulls reclaim 0.6960, an attack towards the 200-DMA is on the cards.
The New Zealand dollar slightly advances for the fourth day in a row, extending its weekly rally. On the day, the NZD/USD pair surges some 0.01%, exchanges hands at 0.6859 at the time of writing. The leading cause of the rally is broad US dollar weakness, according to Joel Frank, an analyst at FX Street, spurred “by a long-squeeze/bout of profit-taking, goes against recent fundamental developments that many would normally see as USD bullish.”
NZD/USD Price Forecast: Technical outlook
On Thursday, during the overnight session for North American traders, the NZD/USD was subdued around the 0.6840-60 region until mixed US macroeconomic data triggered another leg-up, reaching a daily high at 0.6890. The rally stalled at the 0.6900 figure, which confluences with a 38.2% Fibonacci retracement, drawn from November – December 2021 cycle high/lows, retreating above the 50-day moving average (DMA).
The NZD/USD first ceiling level is the 38.2% Fibonacci retracement. A breach of the latter will expose the 50% Fibonacci level at 0.6960, followed by the 61.8% Fibonacci retracement at 0.7019.
Conversely, NZD bull’s first line of defense would be the 0.6800 figure. A clear break of it will send the pair tumbling to the January 6 daily low at 0.6733, followed by 2021 yearly low at 0.6702.
- The AUD/JPY snap a two-day gain, down some 0.01% amid a risk-off market mood.
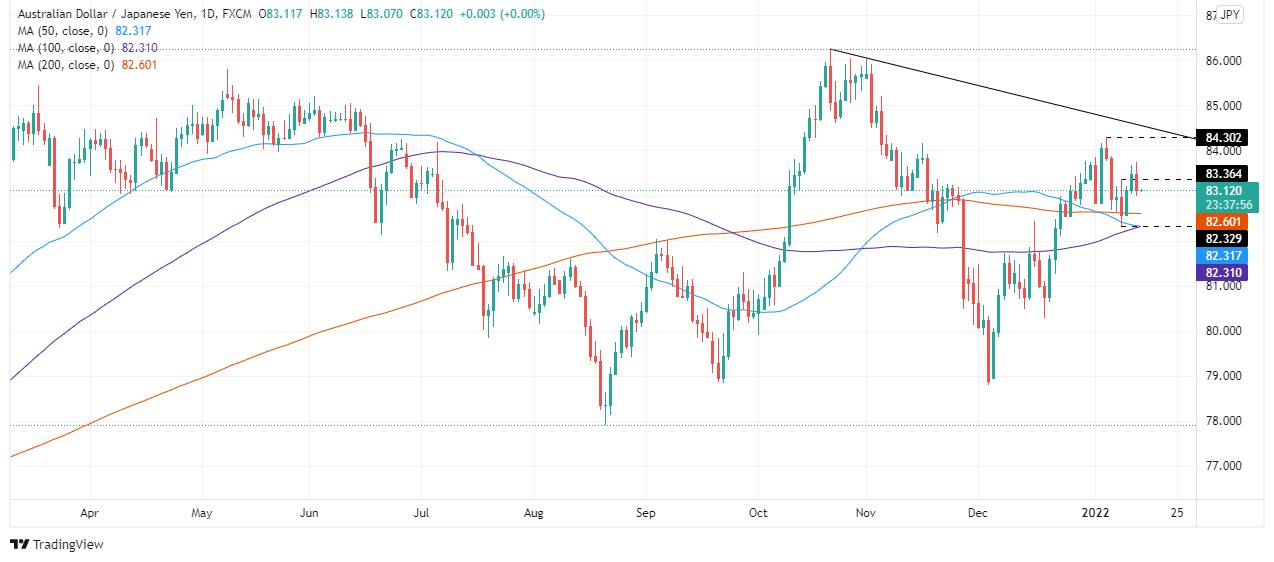
- AUD/JPY Technical Outlook: Bullish biased, though downside risks remain.
As the North American session finishes, the Australian dollar grinds lower for the second time of the week, attributed to dented market mood, as investors assess US central bank rate hikes. At press time, the AUD/JPY is trading at 83.10.
In the meantime, Wall Street stock indices finished the session with losses, between 0.49% and 2.57%, weighing on risk-sensitive currencies like the Australian dollar. Safe-haven peers led by the Japanese yen in the FX complex advanced.
AUD/JPY Price Forecast: Technical outlook
On Thursday, the AUD/JPY pair seesawed between 83.30-50s area, followed by a climb towards the daily high around 83.77, collapsing afterward, near the 83.00 figure. Despite the abovementioned, the pair is neutral-bullish, as the daily moving averages (DMAs) reside below the spot price.
That said, the AUD/JPY first demand zone is the 83.00 figure. A breach of the latter would expose the 200-DMAT at 82.65, followed by the confluence of the 50 and the 100-DMA at 82.35, and then the 82.00 figure.
To the upside, the AUD/JPY first resistance would be the January 10 daily high at 83.36. A clear break above it would expose a four-month-old downslope trendline drawn, from October 2021 highs, near the psychological 84.00 area.
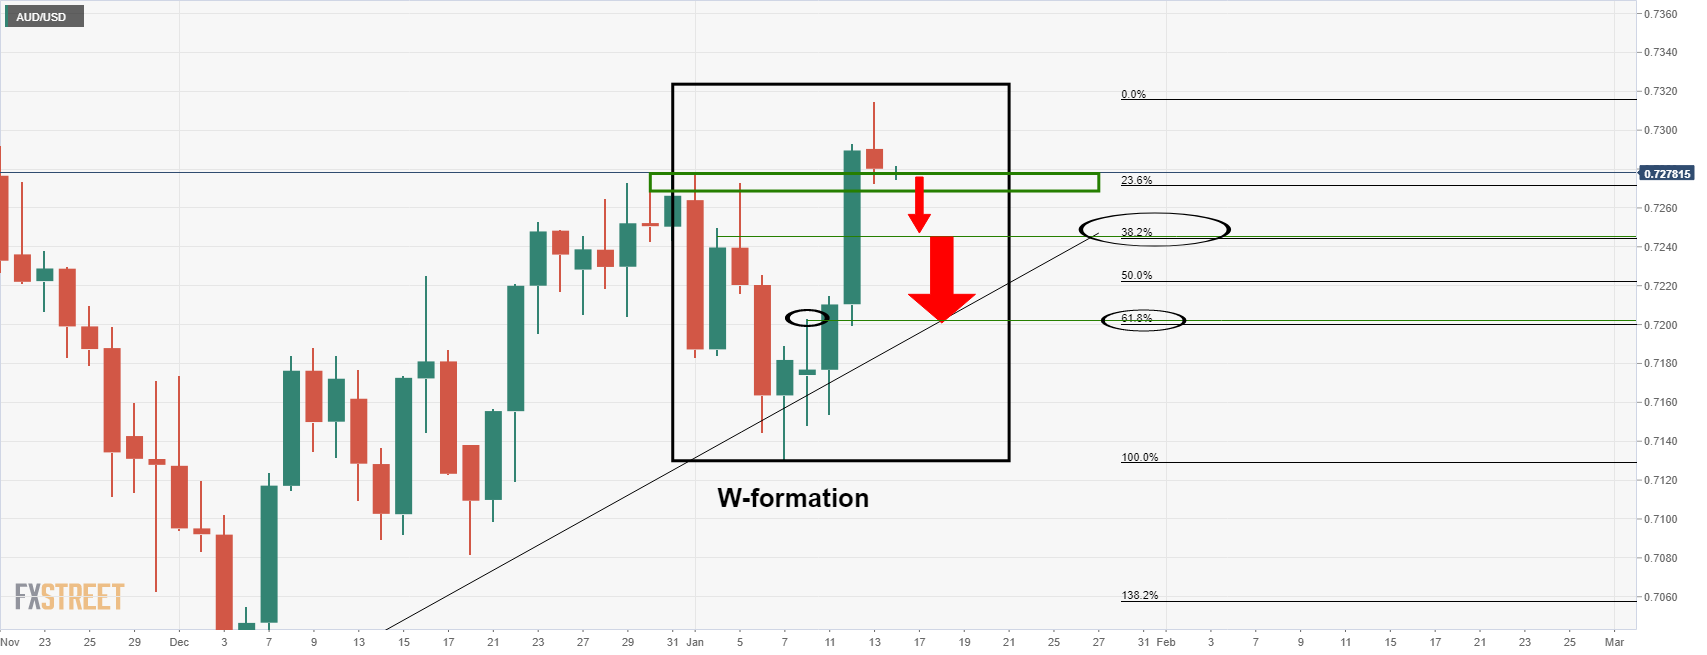
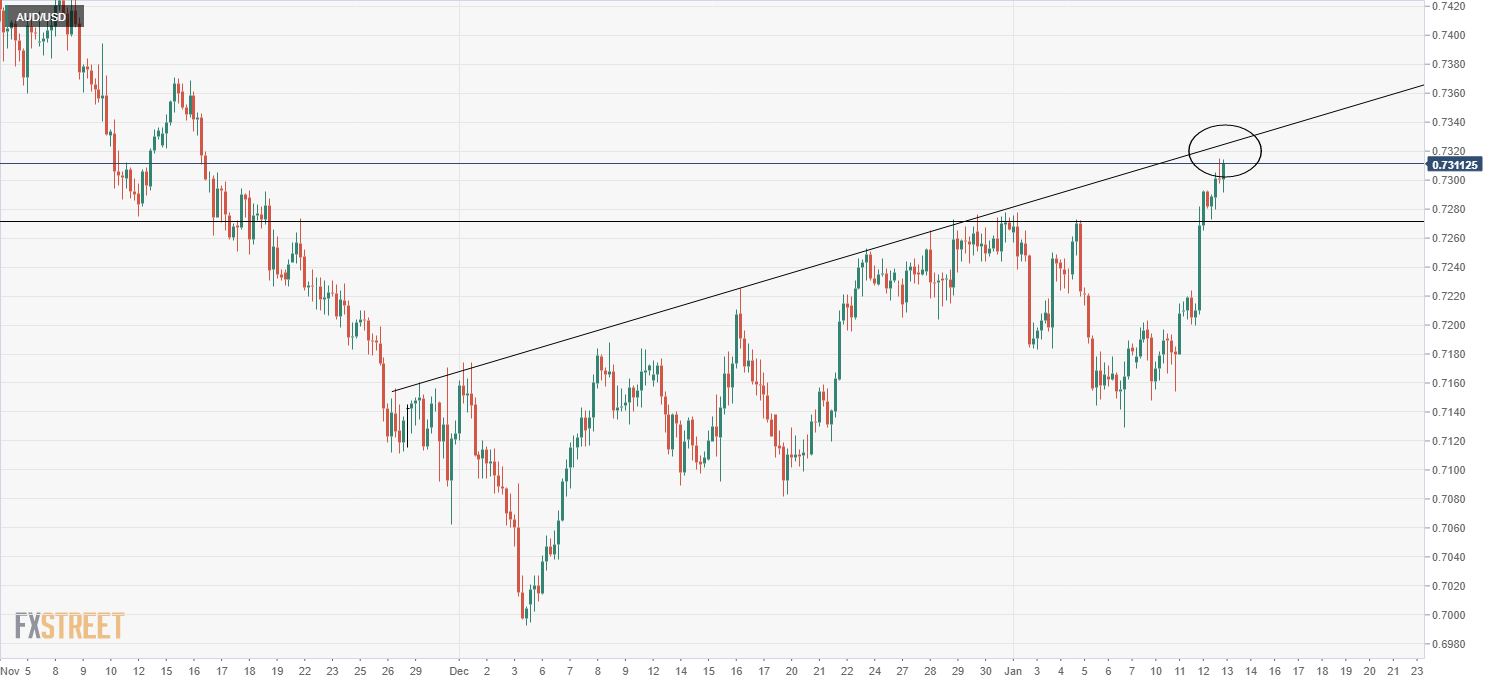
- AUD/USD on the way to the 0.72 figure according to the daily chart analysis.
- Bears will note the confluence of the 38.2% and 61.8% Fibonacci levels.
As per the prior day's analysis, AUD/USD Price Analysis: Bears eye the daily chart's W-formation near 0.7235, the price is under pressure and the bears are on the verge of a break of key support.

The price action since the prior analysis has moved in on the old resistance and a break there opens risk to the 38.2% Fibonacci and the neckline of the W-formation near 0.7250:
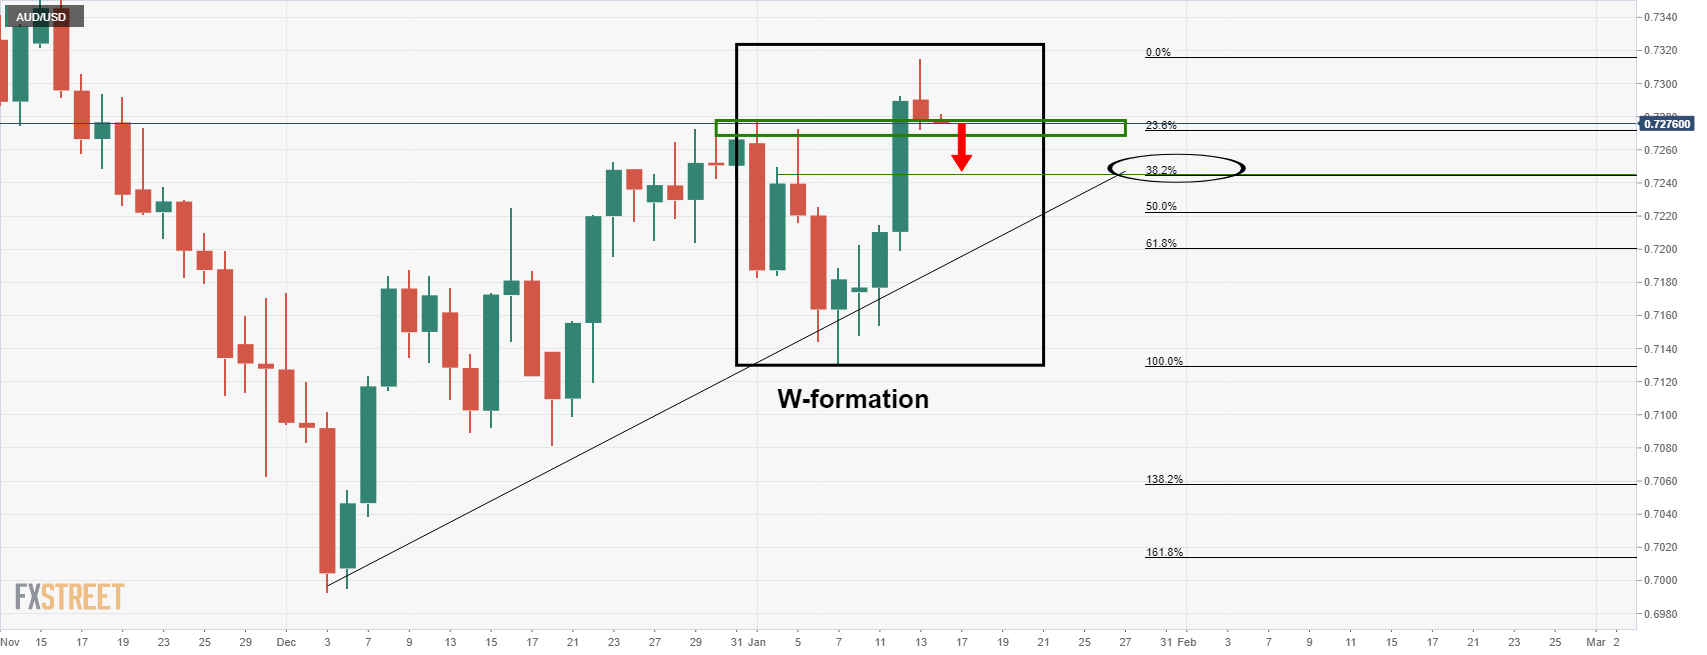
Below there, it can be argued that there is another W-formation, depending on the broker and close of the candle. However, it is a compelling level nonetheless as it meets the 0.72 figure and a confluence of the 61.8% Fibonacci level as follows:
Of course, this all depends on the direction of the greenback. Currently, it is on the back foot, but there are prospects of a correction and that could be enough to set off the Aussie bears:
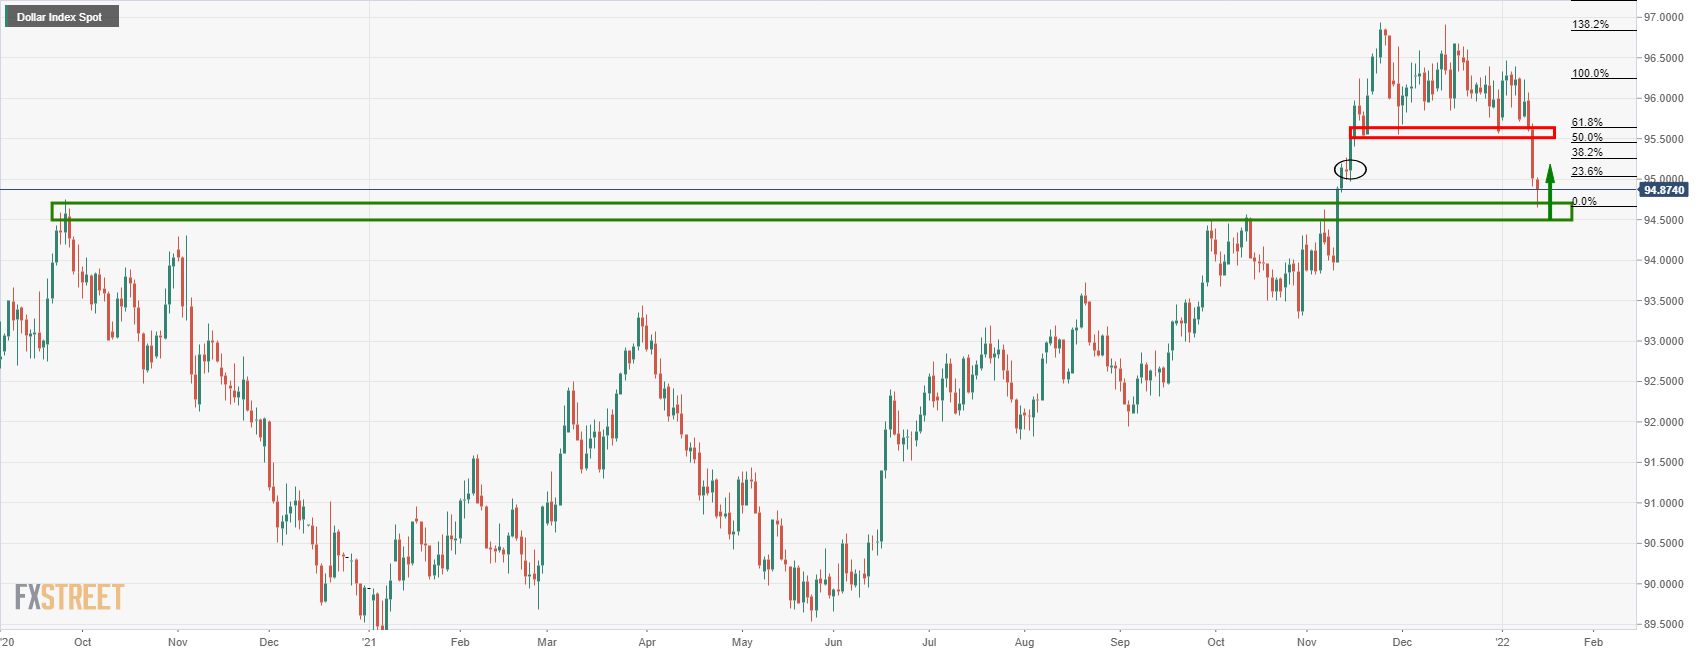
The DXY index, that measures the US dollar vs the basket of major currencies, including the Aussie, could be on the verge of a run to the 38.2% Fibonacci retracement. This could trigger a significant correction in AUD/USD.
- GBP/USD bears move in to take on critical daily support.
- Bears eye a break of 1.3700 for a way to 1.3640s.
GBP/USD is on the verge of a break of critical support according to the following top-down analysis that illustrates the market structure across the daily, 4-hour and 1-hour charts.
GBP/USD daily chart
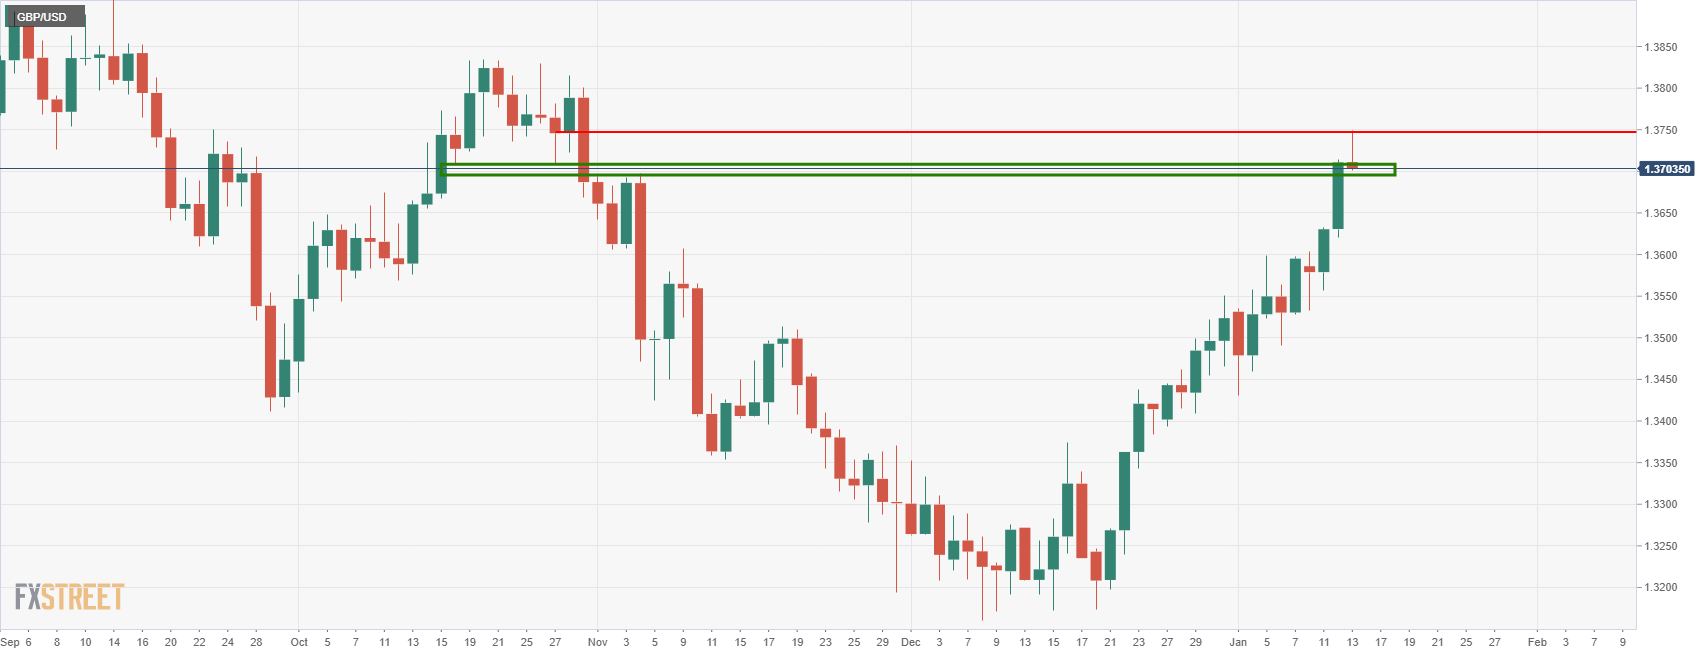
The daily chart shows that the price has run-up to a critical area and level of resistance between 1.3700 and 1.3750. A downside correction could be on the cards on a break below 1.37 as follows:
GBP/USD H4 chart
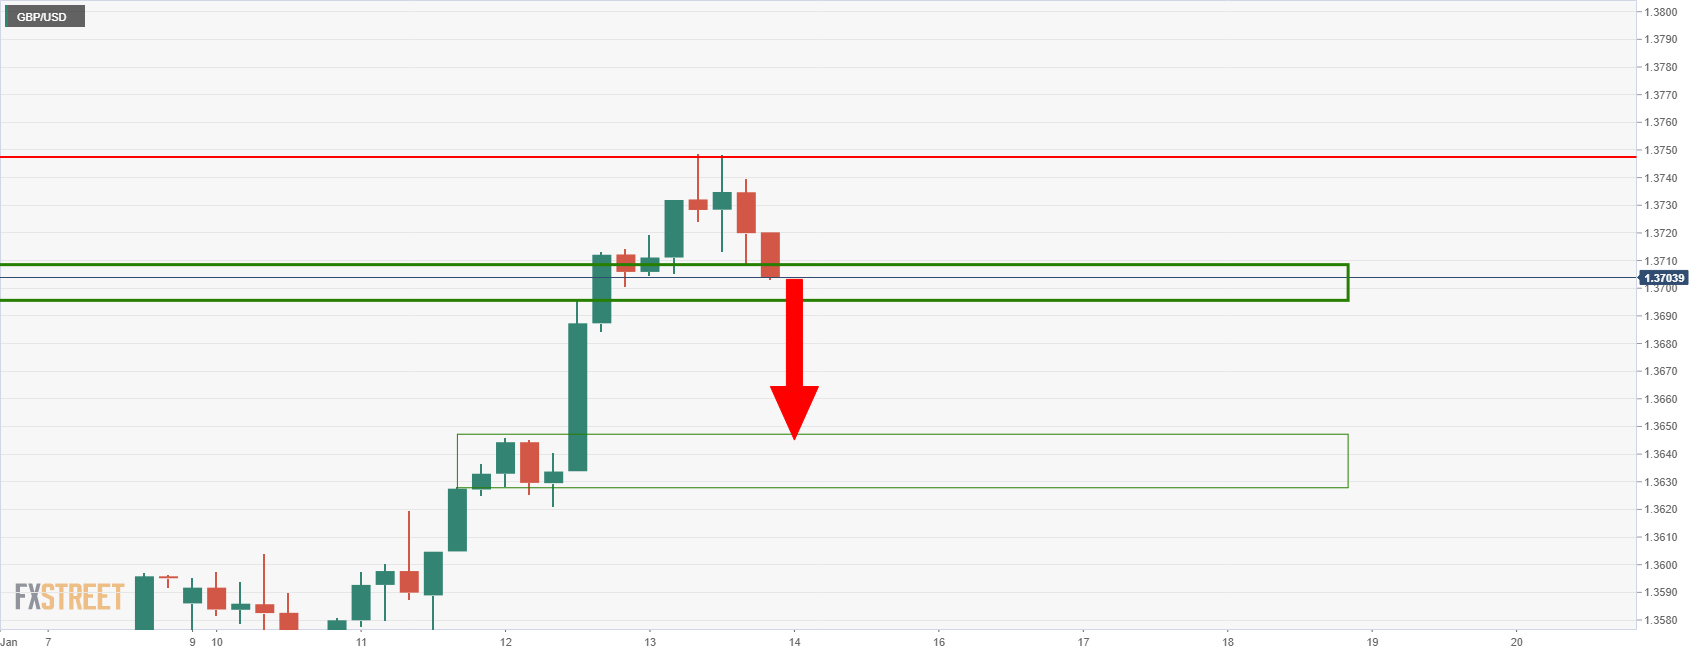
The 4-hour chart is on showing that the price is on the verge of a break of this current support and in doing so, there is room to the 1.3640s.
GBP/USD H1 chart
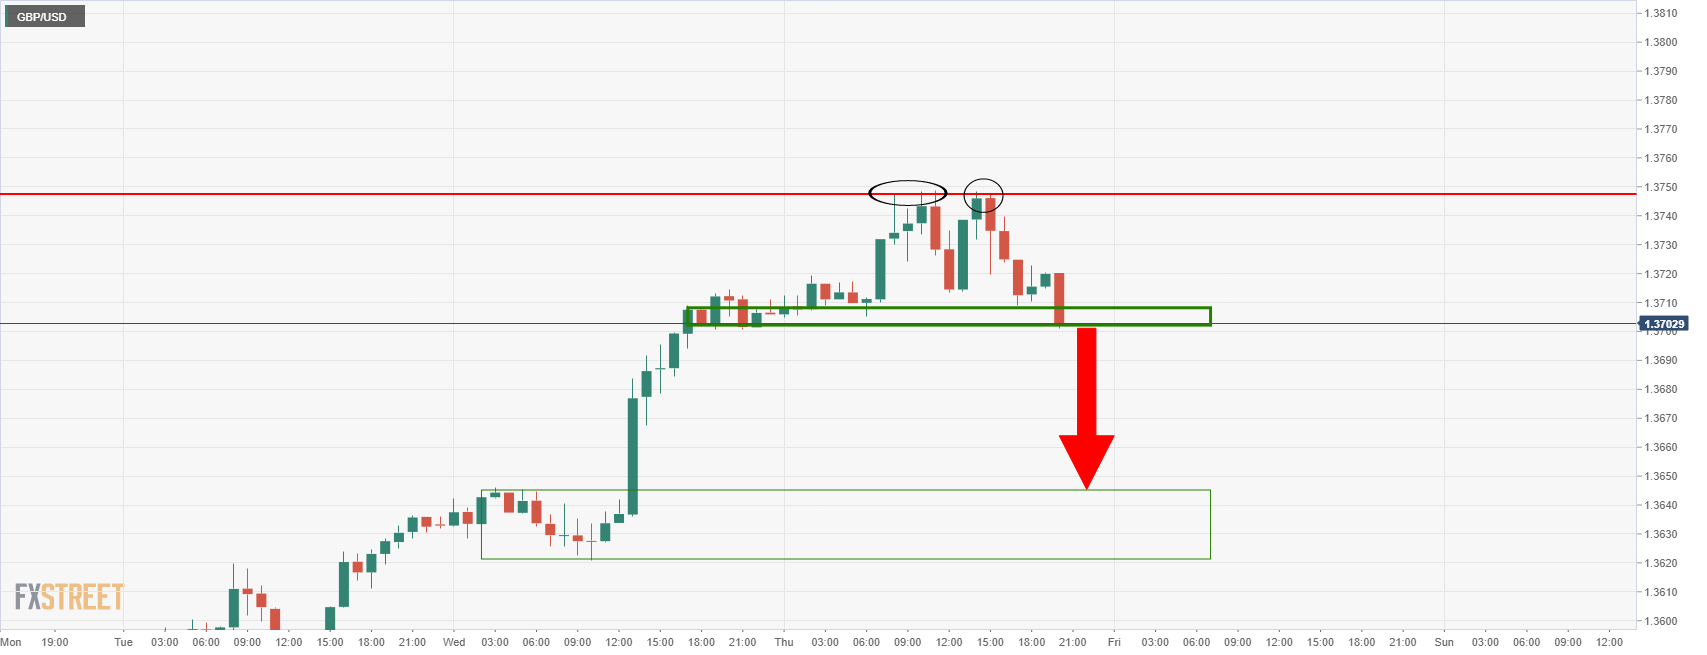
The hourly chart offers a double top confirmation as well.
- EUR/USD buying hit overdrive on Wednesday, but the pace of gains has been more measured on Thursday.
- The pair is now consolidating in the 1.1450 area as traders assess whether the recent dollar long-squeeze is over.
After EUR/USD buying hit overdrive on Wednesday as the pair shot back above the 1.1400 level, the pace of gains has been more measured on Thursday. While the pair continues to trade with modest gains of about 0.1% on the day just above 1.1450, it has backed off from earlier highs in the 1.1480 area. But EUR/USD is still up about 0.8% on the week, with the euro benefitting in tandem with the rest of its G10 peers, on a recent surge in US dollar weakness.
Dollar weakness this week has come despite Fed Chair Jerome Powell on Tuesday (and other Fed members this week) endorsing the outlook for multiple rate hikes and likely quantitative tightening in 2022. It has come despite Consumer Price Inflation data on Wednesday showing price pressures at a fresh multi-decade high at 7.0% YoY and Producer Price Inflation data on Thursday hitting a new series high at 9.7% YoY. The non-intuitive move lower in the buck that has so benefitted EUR/USD this week appears to have been a function of profit-taking/a long squeeze, as well as technical factors.
Note that, according to the US CFTC, International Monetary Market speculators finished 2021 with a net long position in the US dollar that was near the largest is had been in two years. Crowded long-positioning seems to have taken a battering this week, thanks in part to technical buying in EUR/USD after it broke above the key 1.1380 resistance area (the late November/December highs) on Wednesday. Note that during the month of December, EUR/USD had formed an ascending triangle, which often portends a bullish breakout.
The technical play from here would often be to wait for a retracement back to the original level of resistance (at 1.1380) and rebuild longs in the hope the level will now provide solid support. But with the case strengthening for a stronger dollar this year as the Fed becomes more hawkish and inflationary conditions remain hot, the fundamentals may be pointing towards a drop back towards November/December lows in the 1.1200 area over the course of Q1.
Outgoing Fed Vice Chair Richard Clarida, who will resign from his position on Friday, two weeks before the end of his term, said on Thursday that commencing policy normalisation in 2022 would be entirely consistent with the Fed's new flexible average inflation targeting framework. The economy is well above what Clarida would consider to be a moderate overshoot of the Fed's 2.0% longer-run goal, he added, saying that the unwelcome surge in inflation in 2021 will, in the end, prove to be largely transitory under the appropriate monetary policy.
Once these relative price adjustments are complete and bottlenecks have unclogged, inflation will prove to be transitory. The underlying rate of inflation in the US economy is hovering close to the Fed's 2.0% longer-run objective, he concluded.
- USD/CAD bulls are stepping in at a demand area on the daily chart.
- The lower time frames offer structural targets at 1.2550 and 1.2580.
USD/CAD, following a break of the head and shoulders neckline as per prior analysis, USD/CAD Price Analysis: Bears to target 1.2480 on a breakout below daily H&S neckline, has started to stall in the decline.
While there is still every possibility that it can continue lower, a deeper correction could be on the cards as follows:
USD/CAD daily chart
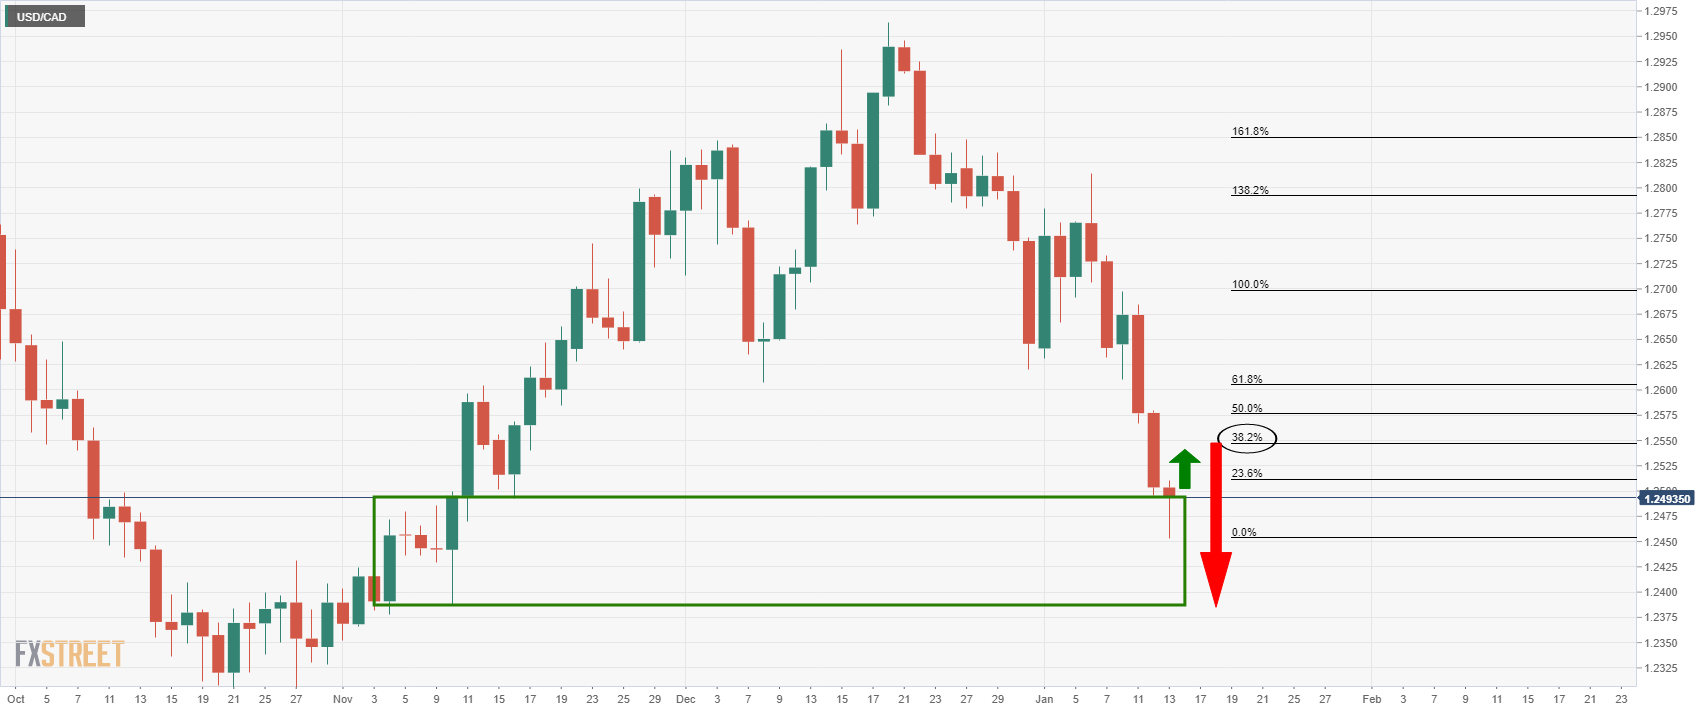
The daily chart shows that the price has run into an area of demand and has stalled. This exposes the 38.2% Fibonacci retracement level near 1.2550 for the forthcoming sessions.
USD/CAD H4 chart
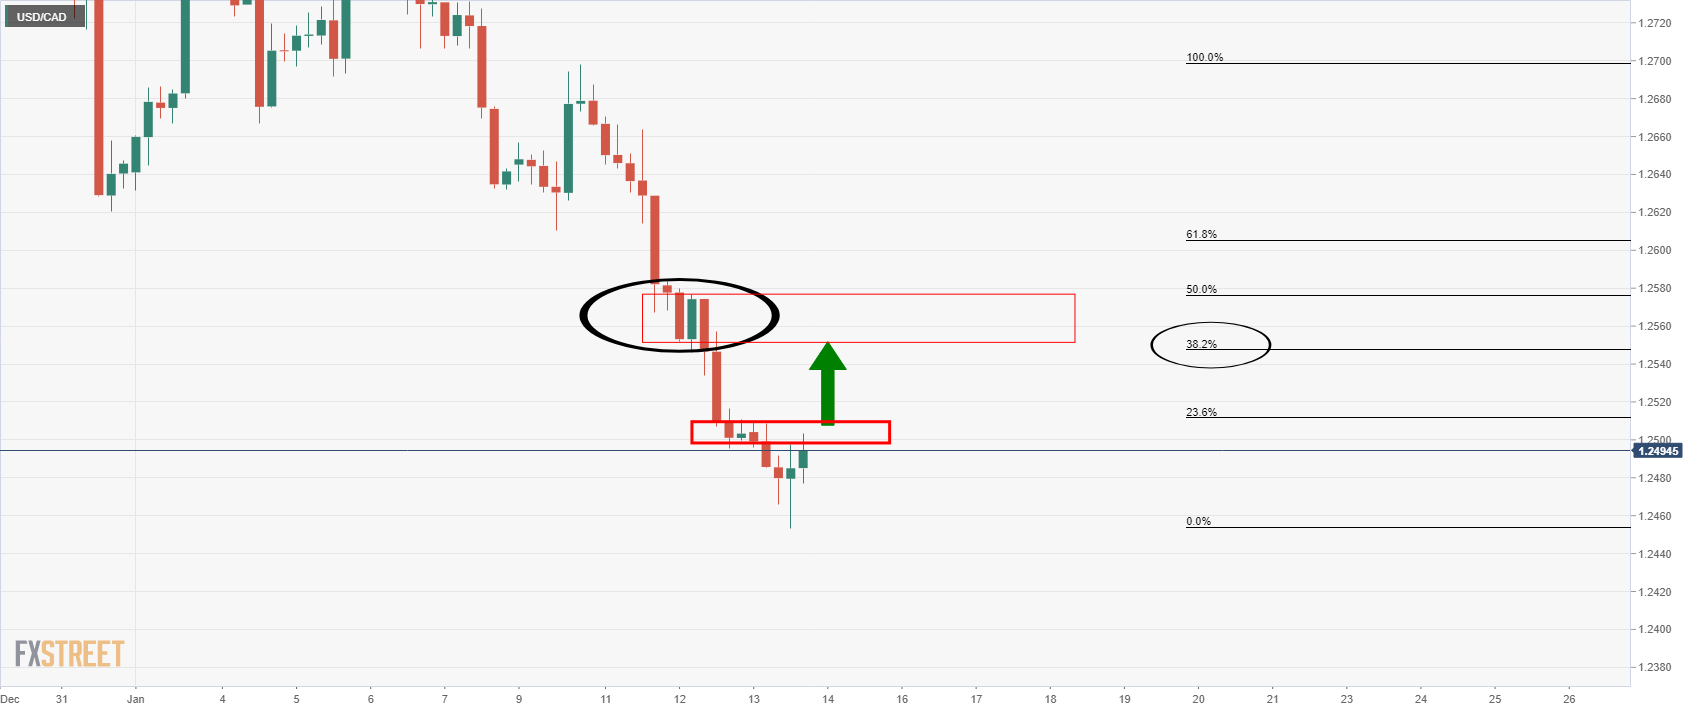
When moving down to the 4-hour time frame, we see that there was some demand in this area during the bearish run. In turn, we can expect the price to be drawn to this liquidity pool should the bulls manage to break the first layer of resistance around 1.25 the figure.
USD/CAD H1 chart
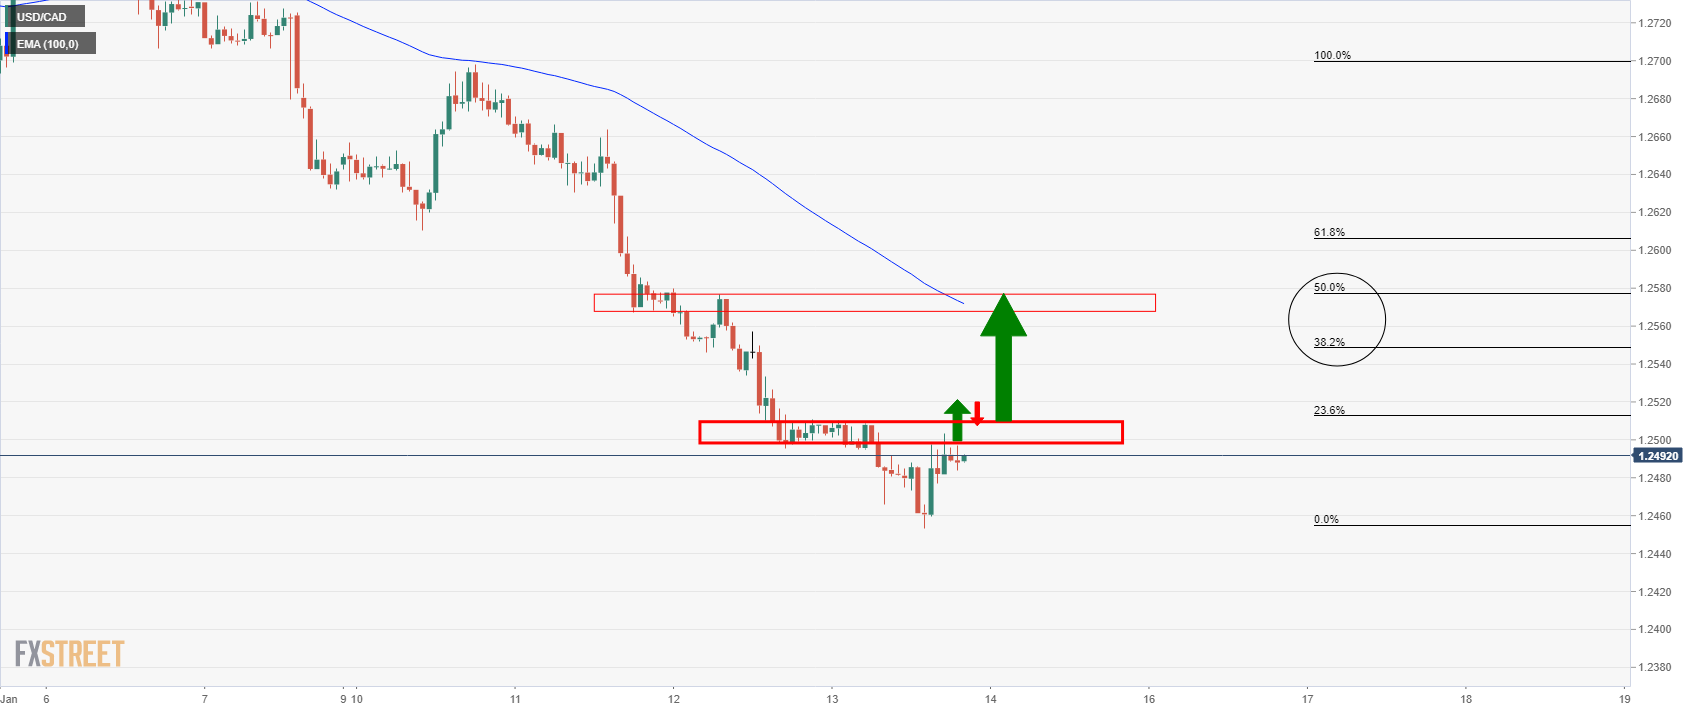
On the hourly time frame, the daily 50% mean reversion level comes in near hourly structure higher up around 1.2580 that currently has a confluence of the 100-hour EMA. If the bulls manage to clear 1.2550 and stay in control, this could be the next level of interest.
Chicago Federal Reserve President Charles Evans said on Thursday that three rate hikes in 2022 would be a good "opening bid", though it could be four if inflation doesn't improve fast enough. Evans added that he is reluctant to declare that the US has reached full employment, but that inflation is "much too high" and controlling price pressures is now the best way of assuring the economic recovery.
Evans went on to remark that the Fed's balance sheet is "very large" and the bank will likely start shrinking it "sooner than later" following rate increases. Evans said that he sees inflation dropping back under 2.5% by the end of 2022, with most of that adjustment a result of real not monetary factors. Officials should think seriously about raising interest rates at the Fed's March meeting, he added, adding that the Fed is still grappling with how fast policy should reach the neutral rate of interest.
What you need to know on Friday, January 14:
The market stabilized, with the greenback consolidating losses on Thursday. Risk appetite receded, preventing the dollar from falling further. Intraday gains of the American currency helped correct oversold conditions reached after Wednesday's sell-off.
The Federal Reserve's hawkishness was pretty much priced in ahead of the release of US inflation figures, with three rate hikes anticipated for this year and chances of a balance sheet runoff before the year-end, resulting in the report triggering the opposite-than-usual reaction to skyrocketing prices pressure.
The GBP/USD pair extended gains to 1.3748, a fresh two month high, to finish the day with modest gains around 13715. The pound ignores headlines showing that UK's Boris Johnson's premiership is at risk amid breaking lockdown rules last year. Also, Brexit keeps making it to the front line, with UK Trade Minister Truss stating that the UK hopes to have an agreement with the trans-pacific partnership Trade Bloc in the next few years.
The EUR/USD pair hit 1.1481, ending the day at around 1.1460. European Central Bank Vice President Luis de Guindos said the European economy is getting used to the coronavirus, adding that "perhaps inflation won't be as transitory as forecast only some months ago," although he expects it to stay below the ECB's target in 2023 and 2024.
Commodity-linked currencies finished the day little changed. AUD/USD trades around 0.7290, while USDCAD stands at 1.2490.
The USD/JPY pair extended its slide and currently flirts with the 114.00 level.
Spot gold retreated modestly, currently trading at around $1,820 a troy ounce, while crude oil prices were weighed by the soft tone of equities. WTI settled at $81.70 a barrel.
US government bond yields ticked higher but were unable to retain gains, ending the day barely up. Wall Street, on the other hand, was incapable of extending its gains, with most indexes posting modest intraday losses.
Friday will be quite a busy day, as the UK will publish its November Gross Domestic Product and Manufacturing Production for the same month, while the US will offer December Retail Sales and the preliminary estimate of the January Michigan Consumer Sentiment Index.
Ethereum must close the week above $3,300, or ETH will resume selling
Like this article? Help us with some feedback by answering this survey:
- The Australian dollar advances for the fourth straight day.
- A risk-off market mood could not stop the rally of the AUD, courtesy of broad US dollar weakness.
- Market participants mainly ignored mixed US macroeconomic data.
The Australian dollar advances as the New York session ends approaches up some 0.08%, courtesy of the continuing US dollar sell-off spurred by hot US consumer inflation. At the time of writing, the AUD/USD exchanges hands at 0.7290. The market sentiment is downbeat, as portrayed by global equities falling. In the FX market, risk-sensitive currencies. Retreats some, but broad US dollar weakness capped the AUD fall.
US Jobless Claims increased though the PPI slowed a tick
Latest developments in the US keep AUD/USD traders leaning on the dynamics of its economy. The US macroeconomic docket showed that Initial Jobless Claims for the week ending on January 7 rose 230K, higher than the 200K estimated by analysts, while prices paid for producers in December, also called PPI, decelerated, came at 9.7%, a tenth lower of the 9.8% foreseen.
Fed and RBA divergence
Fundamentally speaking, nothing has changed. The Federal Reserve would raise rates at least three times, presumably beginning in March. Fed speakers through the week, led by Chief Powell, and Vice-Chair nominee Lael Brainard, said that a rate hike is possible in March and would like to reduce the balance sheet the sooner, the better. The Fed speakers who expressed those views were: Regional Fed’s Presidents Bostic, Daly, Mester, and Barkin.
Putting the Fed aside, the Reserve Bank of Australia (RBA) keeps its dovish stance in place. Additionally, as noted in the RBA’s last monetary policy minutes, the Australian central bank said it would maintain highly supportive monetary policy conditions, and the board would be patient. The RBA noted that inflation increased but remained low, compared with other economies, like the US and the UK.
Therefore, the central bank divergence favors the US Dollar. However, extreme USD longs positioning could have been caught off guard, spurring the unwind of some of those greenback longs, weakening the USD.
- NZD/USD is consolidating in the 0.6875 area on Thursday, having cleared key resistance over the past two sessions.
- Dollar weakness since Wednesday has sent NZD/USD surging from below 0.6800 and opened the door to a longer-term run higher.
NZD/USD’s impressive rally since the start of the week continued on Thursday, though has in recent hours petered out in the 0.6875 area, with the bulls unable to force a test of the 0.6900 level. On the day, the pair trades about 0.4% higher, taking its on the week gains to about 1.5%, the best week for the pair since early October. Broad dollar weakness that on Thursday saw the dollar index drop to fresh two-month lows underneath the 95.00 level has been the principal driver of NZD/USD’s recent turnaround higher. Dollar weakness, which traders have said is being driven by a long-squeeze/bout of profit-taking, goes against recent fundamental developments that many would normally see as USD bullish.
Since last week’s hawkish Fed minutes release, which showed FOMC members were broadly on board with the idea of significant removal of monetary accommodation in 2022, the December unemployment rate was shown to have dropped under 4.0% and December inflation increased. Wednesday saw the release of the December Consumer Price Index which rose at a pace of 7.0% YoY, the highest since 1982, whilst the Producer Price Inflation report on Thursday showed factory-gate price growth reaching 9.7% YoY. The recent run of US data strongly supports the Fed’s new hawkish position that interest rates should be lifted this year and (perhaps) quantitative tightening kicked off.
Various Fed members have spoken public so far this week and all are on board with the notion that accommodation should be quite swiftly removed this year, with most also open to the idea of lift-off in March. Some have said they could support four rate hikes this year if warranted and this seems to now be the base case expectation of most major US banks and analysts. All of the above (hawkish Fed, strong jobs data, hot inflation) might typically be expected to boost the buck, but the opposite has occurred. Some FX strategists have argued the dollar weakness will be short-lived, while others have said it reflects concerns that the Fed might make a policy mistake by tightening too quickly and then having to postpone hike (meaning a lower terminal rate) at a later date.
If the latter camp is correct, NZD/USD recent rally to the upper 0.6800s may prove short-lived. But from a technical perspective, it is impressive how the pair has managed in the last two sessions to break above key levels of resistance. After breaking out of a short-term bearish trend channel on Wednesday that was holding it under 0.6800, NZD/USD has since rallied to multi-week highs above a key level of long-term support turned resistance in the 0.6860 area, as well as clearing the 50-day moving average at 0.6861. The recent bullish run suggests a medium-term change in trajectory for NZD/USD, with the door now open to a move into the 0.6900s and perhaps even a test of the big 0.7000 level.
- The Fed could be priced too hawkish according to the recent moves in US yields and the greenback.
- Gold drops despite softness in the greenback in a technical test of key support.
- Gold is trying to stabilise and is headed for a test of 4-hour resistance towards $1,830.
Gold, (XAU/USD), has been under pressure on Thursday and despite the sell-off in the US dollar which has marked a fresh low to 94.660 as per DXY. At the time of writing, gold is trading at $1,820,33 and is down some 0.32% after sliding from a high of $1,828.18 to a low of $1,812.42.
The price of the US dollar has been undermined by some less hawkish comments of late, including both the Federal Reserve chair, Jerome Powell, and Philly Fed President Patrick Harker.
On Thursday, Harker said he sees the Fed starting to shrink its balance sheet “in late 2022 or early 2023” after the central bank has raised its target rate sufficiently, to around 1 per cent from near zero. The comments echoed that of Powell who said the Fed could start to shrink its balance sheet later this year.
''We're going to end our asset purchases in March, meaning we'll be raising rates over the course of the year," Powell said on Tuesday at his confirmation hearing before the Senate Banking Committee.
"At some point, perhaps later this year, we will start to allow the balance sheet to run off, and that's just the road to normalising policy," he said, adding the US economy "no longer needs or wants" the Fed's very highly accommodative policies.
These comments come in contrast to that of other more hawkish officials, such as the Atlanta Fed President Raphael Bostic. "There is a risk inflation is likely to be elevated for an extended period of time and we need to respond directly, clearly and aggressively," Bostic told Reuters in an interview on Monday.
Bostic explained that the central bank should be aggressive with regards to the balance sheet as well, allowing its holdings to decline by at least $100 billion a month, and with plans to quickly pull at least $1.5 trillion out of financial markets that he considers pure "excess liquidity."
Gold has otherwise been on the backfoot due to such a hawkish outlook at the Fed. However. The varied responses in the markets to the Fed could play into the hands of the gold bugs in time to come.
Initially, the US dollar was on the front foot along with US yields. The 10-year yield rallied to 1.8080% but it has since fallen to 1.7110%. Today, the yield is steeply lower again but above yesterday's aforementioned low.
Despite this, gold has fallen on the day but this could be more of a technical shakeout than anything else. Rates markets have already pencilled in 89bps of rate hikes, with 90% odds of lift-off in March, analysts at TD Securities explained.
''The rates shock appears to be baked into the cake in gold particularly with quantitative tightening still months away,'' the analysts added.
''In this context, gold prices could remain supported in coming trading sessions but are unlikely to follow through to significantly higher prices as markets will ultimately remain intensely focused on the Fed's exit.''
Gold technical analysis
As mentioned, despite the softness in the US dollar, gold is down, but this could be more of a technical move on the day than anything other.
This was forecasted in the following analysis from the prior session as follows:
Gold Price Forecast: XAU/USD bears move in, $1,810 eyed before $1,850
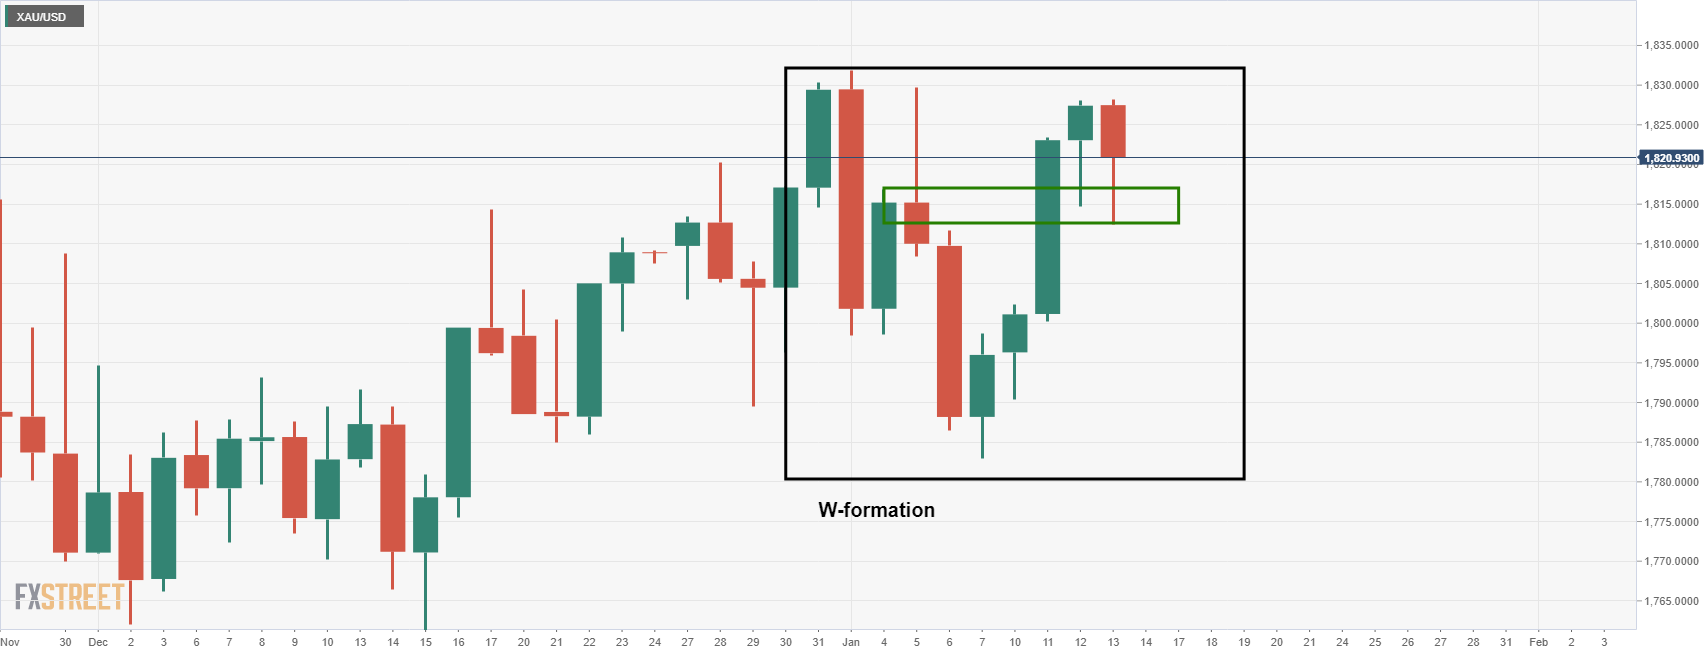
As illustrated, the price has moved lower in a W-formation, as forecasted, and is now making tracks back to the upside on the 4-hour time frame:
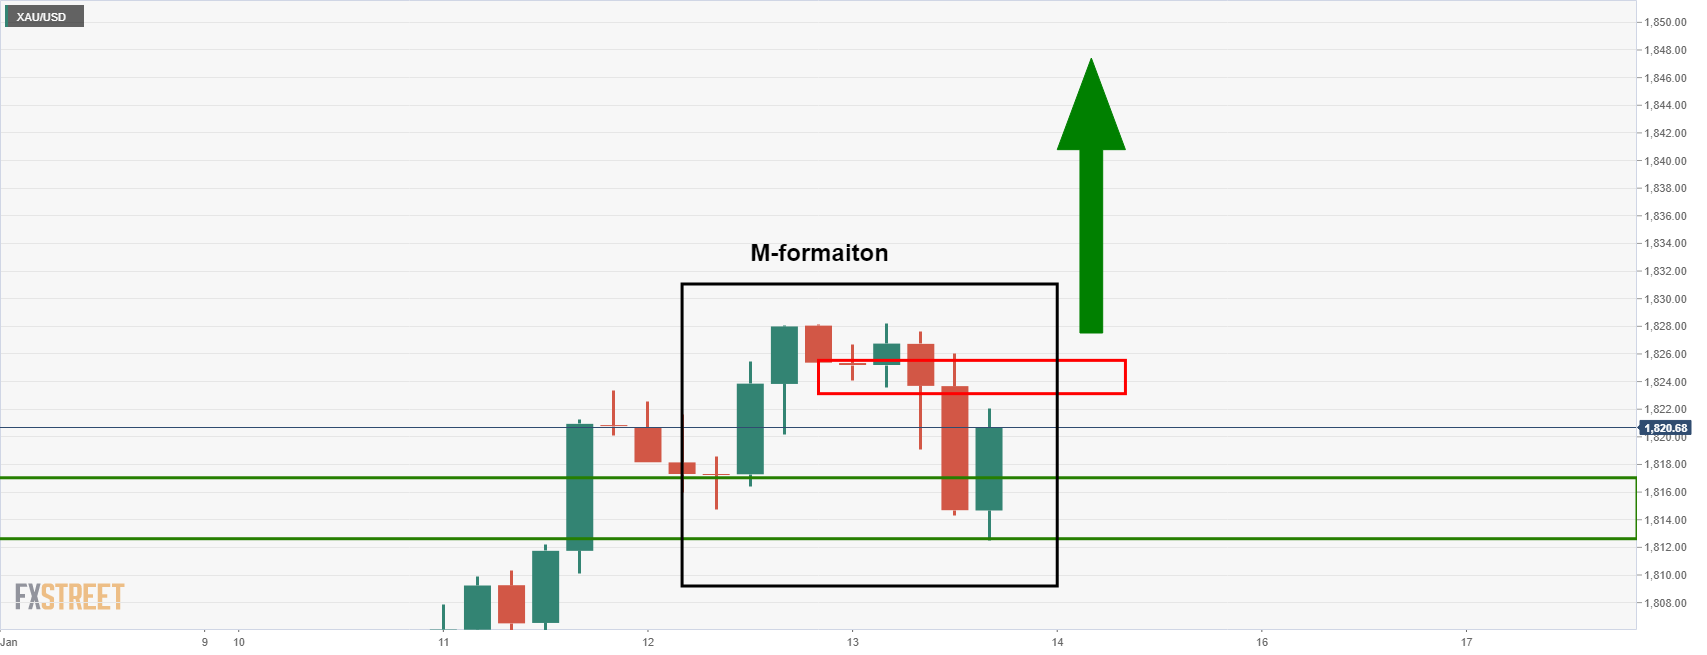
A move higher opens the risk of a break of the M-formation's neckline that could be one of the last major defences for a run towards the $1,850 target.
Federal Reserve Bank of Chicago President Charles Evans said on Thursday that inflation is too high and that monetary policy is not well-positioned for this. As a result, the Fed will be adjusting monetary policy to something closer to neutral and that the Fed strongly expects between two and four rate hikes in 2022.
Additional Remarks:
"Demand for goods has exploded, but for services is woefully below where it was."
"We've seen wage pressures, price pressures."
"Prices of goods in really high demand, short supply have skyrocketed."
"After we end bond purchases we'll start thinking about how to bring the balance sheet down."
"Don't believe inflation will stay this high."
"Inflation will come down because supply chains will improve, demand will fall a little as we raise interest rates."
"Labor force challenges will persist for quite some time."
"Stance of monetary policy is 'wrongfooted' given high inflation."
"We need to get inflation back down to the 2% ballpark."
"Inflation likely to be 2.5% at end of this year."
"Inflation will be adjusting for 'real reasons' like supply chain, business conditions."
"My forecast in December was aligned with 3 rate hikes in 2022."
"Expect the economy will continue to 'power through' the pandemic."
"I think current unacceptably high inflation rates will come down."
"We need to preserve price stability."
"Because inflation has stayed high longer we have to take action quicker than I thought."
"We still need patience along the path of removing accommodation."
"Expect unemployment to be around 3.5% by end of year."
"I expect the tide of inflation will have turned by the end of the year."
"I think it will take a couple years to get rates to neutral, but that could be accelerated."
- The British pound retreats from weekly highs, 120-pips on risk-off market mood.
- GBP/JPY Technical Outlook: Remains upward biased, but GBP bulls need to reclaim above the 50-hour SMA.
On Thursday, the GBP/JPY falls for the second consecutive day, retreating from weekly highs around 157.70s, down close to 100-pips in the day. At the time of writing, the GBP/JPY exchanges hand at 156.53, losing 0.28%. The market mood is downbeat as portrayed by US equities falling between 0.55% and 1.36%. In the FX market complex, the safe-haven peers like the JPY and the CHF advance, while the US dollar continues to be hit by substantial sell-off across the board.
GBP/JPY Price Forecast: Technical outlook
In the overnight session for North American traders, the cross-currency pair was subdued around the 157.00-40 range. But, as the market mood deteriorated, appetite for safe-haven increased, thus sending the GBP/JPY tumbling towards the daily low at 156.31, near 10-pips short of the S2 daily pivot.
A previous GBP/JPY analysis noted that “the GBP/JPY is upward biased,” but also emphasized that “the high reached on January 5 at 157.76, short of October 20, 2021, at 158.22, exposed the GBP/JPY to downward pressure.”
That said, the GBP/JPY retreated 120-pips from the weekly high at 157.72, attributed to risk-aversion meandering in the market.
On the downside, the GBP/JPY next demand area would be the psychological 156.00 figure. A break under that level would expose the January 4 daily low at 155.34. and then the January 3 daily low at 154.90.
To the upside, the first resistance level would be the 200-hour simple moving average (SMA) at 156.81. A decisive break above that level would expose the 100-hour SMA at 157.00, followed by the 50-hour SMA at 157.14.
- USD/JPY has traded at 113.99 on Thursday as the US dollar bleeds out.
- US yields are on the back foot again as markets rethink balance sheet runoff.
USD/JPY is on the verge of breaking below 114 the figure at the time of writing after falling from a high of 114.70 today. The US dollar is being kicked down along with US yields as markets think twice about a faster pace of tapering by the Federal Reserve and wonder if they have priced the Fed too hawkishly.
Both the Federal Reserve chair, Jerome Powell, and Philly Fed President Patrick Harker, while alarmed by inflation and suggesting that rates could be lifted as soon as March have both said the Fed can be patient with regards to the balance sheet run-off. In other words, they have been less hawkish than some other officials and what the market is pricing for.
Harker said he sees the Fed starting to shrink its balance sheet “in late 2022 or early 2023” after the central bank has raised its target rate sufficiently, to around 1 per cent from near zero. Meanwhile, Powell has said that the central bank could start to shrink its balance sheet later this year.
''We're going to end our asset purchases in March, meaning we'll be raising rates over the course of the year," Powell said on Tuesday at his confirmation hearing before the Senate Banking Committee.
"At some point, perhaps later this year, we will start to allow the balance sheet to run off, and that's just the road to normalising policy," he said, adding the US economy "no longer needs or wants" the Fed's very highly accommodative policies.
The rhetoric is less hawkish than, say the likes of Atlanta Fed President Raphael Bostic. "There is a risk inflation is likely to be elevated for an extended period of time and we need to respond directly, clearly and aggressively," Bostic told Reuters in an interview on Monday.
Bostic said the central bank should be aggressive with regards to the balance sheet as well, allowing its holdings to decline by at lease $100 billion a month, and with plans to quickly pull at least $1.5 trillion out of financial markets that he considers pure "excess liquidity."
The mixed messages from the Fed is making for a varied response in the markets at the start of this year. Initially, the US dollar was on the front foot along with US yields. The 10-year yield rallied to 1.8080% but it has since fallen to 1.7110%. Today, the yield is steeply lower again but above yesterday's aforementioned low.
All eyes on US data ahead of Fed decision
Nevertheless, USD/JPY is on the backfoot and will likely remain so until yields begin to stabilise again. At midnight tomorrow, after Fed's Williams speech, the media blackout goes into effect and we will get no more Fed speakers until Chair Powell’s post-decision press conference on January 26. Therefore, the data will be the driving force.
Today, the Producer Price Index confirmed that the pipeline price pressures remain high. ''With firm pricing power strong, this will likely lead to pass-through to consumer and should keep the Fed concerned about further CPI acceleration,'' analysts at Brown Brothers Harriman explained.
Tomorrow, Retail Sales will be important. However, ''Retail Sales probably fell in December, even with higher prices boosting nominal values,'' analysts at TD Securities argued. ''Spending was likely held down by the fading of fiscal stimulus, payback for earlier-than-usual holiday shopping, and Omicron. Real as well as nominal spending was likely still up strongly on a QoQ and a YoY basis.''
- Silver is the only one gaining, up 0.08% in the precious metal segment.
- Mixed US macroeconomic data ignored by US dollar buyers, the DXY edges down 0.20%.
- XAG/USD Technical Outlook: Neutral bearish, per DMAs located above the spot price.
Silver (XAG/USD) advances for the third consecutive day, up some 0.08%, trading at $23.14 at the time of writing. The white metal is the only precious metal that advances in the session, as Gold drops some 0.34%, while Platinum and Cooper fall 0.39% and 0.60%, respectively.
In the meantime, the US Dollar Index (DXY), a gauge of the greenback’s value against a basket of other peers, slides 0.20%, sits at 94.722, even though US T-bond yields are flat at 1.727%.
US macroeconomic data came mixed
Before Wall Street opened, the US economic docket featured Initial Jobless Claims for the week ending January 7. The reading came at 230K, higher than the 200K foreseen, whereas the Producer Price Index (PPI) for December, which measures the prices paid for producers, advanced by 9.7%, though barely lower than the 9.6% estimated on an annual basis, a reading that contradicts the US Consumer Price Index (CPI) revealed on Wednesday, which showed that the US consumer inflation rose by 7.0%, the highest level since 1982.
Fed speakers continue to cross newswires
On Thursday, the Fed speaking parade continued. Philadelphia’s Fed President Patrick Harker coincided with fellow policymakers, who have penciled three-rate hikes in 2022, though Harker noted that he is open to a fourth one. He said the Fed needs to act faster than in the previous Quantitative Tightening concerning the balance sheet reduction.
In the same tone, the Fed’s Vice-Chairwoman nominee Lael Brainard said that the US central bank could hike as soon as March to ensure that the Fed would tame inflation towards the Fed’s target level. She said, “The committee has projected several hikes over the course of the year.”
Meanwhile, Richmond Fed President Thomas Barkin said that the labor shortage “might be a long-lasting phenomenon.” Barkin noted that as the US central bank adjusts the balance sheet down to normal levels, it will impact reserves.
XAG/USD Price Forecast: Technical outlook
XAG/USD is neutral-bearish from a technical analysis perspective. The reason is that the spot price remains below the daily moving averages (DMAs), which are bearish-aligned with the shorter time-frame ones beneath the longer time ones.
That said, at press time, the non-yielding metal faces strong resistance at the confluence of the 100 and the 50-DMA, which lie at $23.29 and $23.30, respectively.
On the downside, the first support level would be the psychological $23.00. A breach of the latter would expose December 29, 2021, swing low at $22.59, followed by $22.00.
- The S&P 500 is slightly more than 0.5% lower and testing the 4700 area amid losses in tech.
- As a result, the Nasdaq 100 is down over 1.5%, while the Dow is holding up better and is flat.
US equities mostly fell on Thursday, with losses in large-cap tech stocks leading the fall. The S&P 500 was last down about 0.5% and testing the 4700 level, while the Nasdaq 100 index was last down 1.4% and back nuder 15,700. Apple was down nearly 1.0%, Meta (Facebook) was down just over 1.0%, Amazon was down closer to 1.5%, Microsoft was down over 2.5% and Tesla was last down over 4.0%. Downside in these large-cap stocks was indicative of generalised underperformance in the S&P 500 information technology (-1.6%) and communications services (-0.6%) sectors.
The Dow held up better and was last trading barely in the red in the 36,250 area amid better performance in the industrials (+0.4%) and financials (+0.1%) sectors, which have a higher weighting in the index. Traders attributed the comparatively better performance in so-called “cyclical” (economically sensitive) stocks to hopes that producer price inflation may have reached its peak in December. MoM, headline producer prices rose 0.2%, a sharp deceleration from November’s 0.8% MoM rate of price growth, aided by signs of easing supply chain disruptions.
Other notable fundamental developments on Thursday included a mixed weekly jobless claims report, which showed initial claims tick up to 230K from previously closer to 200K, which some took as a sign of the short-term Omicron hit to the labour market. Moreover, Fed Vice Chair nominee Lael Brainard is currently testifying at a Senate hearing, but has so far stuck to the script and not said anything new or surprising regarding the outlook for policy in 2022 and beyond.
Amid the tech-led downside in equities on Thursday, the CBOE S&P 500 volatility index (or VIX) has been moving higher and is currently up about 1.2 points on the day to just under 19.0, leaving it still comfortably below last week’s highs above 23.0. US equity market focus now turns to the unofficial start of the Q4 earnings season this Friday, with big US banks including Morgan Stanley, JP Morgan and Citigroup all reporting results.
Traders were passing around Vanda Research’s weekly report on retail flows which showed that, ahead of the upcoming earnings season, retail investors increased their exposure to bank stocks. The report said that financials were one of the most bought equity sectors when compared to historical norms, as smaller investors picked up $289M in equities over the course of the last week vs the $190M average over the last two years.
Federal Reserve Bank of Philadelphia President Patrick Harker said on Thursday that the closer inflation comes back to target levels, the easier it will be for the Fed to normalise rates at a more measures pace. Barkin continued that the timing and pace of any rate moves will depend on inflation and if inflation were to remain more elevated and broad-based, normalisation would need to take place at a more aggressive pace.
The Philadelphia Fed President said that he expects goods inflation to ease as supply chains pressures wane and remarked that, for the most part, we are not seeing price levels impacting demand. However, elevated inflation has clearly lasted longer than most of us expected and labour supply will likely remain short in 2022 amid slowed immigration, an aging workforce and care responsibilities.
Market Reaction
There has not been any reaction to Barkin's comments.
Fed Vice Chair nominee Lael Brainard, speaking at a hearing before the Senate Banking Committee on Thursday, said that the Fed would be in a position to start lifting interest rates as soon as its bond purchase programme had ended (in March). As we go forward to end bond purchases, raise interest rates and shrink the balance sheet, she added, we will do so in a transparent way.
On the economy, Brainard said there is a lot of underlying momentum and that she believes we will see inflation coming back to 2.0% while the employment picture clears. I am very concerned about inflation, she added, emphasising the Fed's commitment to the 2.0% target, saying that inflation would likely remain elevated for the first two quarters. We should all take projections with a fair amount of caution, however, she added.
Market Reaction
There has not been any notable market reaction to her remarks which, on policy, have thus far been broadly as expected.
- Oil has ebbed back from earlier session highs near-$83.00 to the mid-$82.00s.
- There haven't been many fresh catalysts for oil markets, which remain supported by the week dollar.
Oil has been slowly coming off the boil over the course of Thursday’s session, with front-month WTI futures having ebbed back to test the $82.00 area in recent trade after failing to test Wednesday’s highs at $83.00 in earlier trade. At current levels, WTI is trading lower by slightly more than 25 cents on the day, but continues to trade higher by more than $3.0 (over 4.0%) on the week and is only about $3.0 below the 2021 highs in just above $85.00. WTI has come a long way in a very short time (+$7.0 already in 2022) and some bulls may be growing worried that it might be overdue some profit-taking. WTI’s 14-day Relative Strength Index (RSI) is yet to reach overbought territory, though is very close. That suggests that the rally may have the legs to test 2021 highs but, by that point, things would be becoming overbought and a correction may be in order.
There hasn’t been much by way of fundamental catalysts to drive the price action thus far this Thursday, with analysts citing generally positive sentiment amid receding concerns about Omicron as keeping prices close to recent highs. Some suggested recent cold weather in North America, which supported a bullish breakout in US gas prices on Wednesday (much of which has been given back on Thursday) as supporting crude oil markets. PVM analysts state that “it will be interesting to see if the optimism is maintained when temperatures start rising come spring.”
Geopolitics is worth monitoring, as NATO/Russia rhetoric heats up amid failure to reach an agreement over the Ukraine crisis, just in case it starts leading to some risk-premia being priced into oil (supportive if anything). Otherwise, crude oil will likely trade as a function of its correlations to other asset classes. The dollar remains weak, which should help keep oil close to recent highs for the time being (as a weaker dollar makes US oil more affordable for international investors). Meanwhile, US equities are mixed (Nasdaq 100 down half a percent versus Dow up half a percent and S&P 500 flat), so likely not having much impact on oil either way at this point.
- EUR/USD drops to 1.1445, only to rebound back to 1.1470.
- US dollar remains under pressure amid risk appetite.
The EUR/USD dropped from two-month lows at 1.1481 to 1.1445, during the American session. The recovery of the dollar was short-live and the pair is back above 1.1465, looking at recent tops.
The greenback remains under pressure across the board, amid optimism across financial markets. In Wall Street, the Dow Jones gains 0.45% although the Nasdaq drops 0.65%. US yields are modestly lower on Thursday also affecting the dollar.
Yields and the dollar did not benefit from new inflation data released on Thursday that showed Producer Prices rising at the fastest pace in years. A different report showed initial jobless claims rose last week to the highest level in eight weeks. On Friday, economic data due includes the retail sales report.
Short-term outlook
After the breakout of 1.1370 and the confirmation above 1.1400, the outlook still looks bright for the euro. The current risk comes from the overbought readings on technical indicators. The immediate support is the 1.1445 area and below the correction could extend to 1.1410 without putting at risk the bullish bias.
A decline under 1.1350 should weaken the euro significantly, opening the doors to more losses. On the upside, above 1.1485, resistance is seen at 1.1500 and then a more solid barrier at 1.1520.
Technical levels
- The USD weakens against G8 currencies, as shown by the DXY falling 0.21%.
- USD/CHF Technical Outlook: Neutral-bearish biased if it remains below the 200-DMA.
The USD/CHF slumps for the third consecutive day breaks below the 0.9100 thresholds and exchanges hands at 0.9105 at the time of writing. The slide is courtesy of broad US dollar weakness across the FX board, as the greenback is getting hit by all G8 currencies.
The US Dollar Index, a gauge of the greenback’s value against a basket of other currencies, slides some 0.21%, sitting at 94.714, a headwind for the USD/CHF pair.
USD/CHF Price Forecast: Technical outlook
The USD/CHF continued its free fall in the overnight session, dropping from 0.9154, below the S1 daily pivot, reaching a new daily low at 0.9290, but have faced demand around December 31 of 2021, daily low at 0.9102.
On the downside, USD/CHF’s first support would be the 0.9100 figure. A breach of the latter would expose November 2, 2021, a daily low at 0.9085, followed by August 4, 2021, a daily low at 0.9018.
To the upside, the USD/CHF’s first resistance would be the confluence of an upslope trendline broken on January 12 and the 200-DMA around 0.9160-70. A decisive break of that area would expose 0.9200, followed by December 15, 2021, pivot high at 0.9294.
Analysts at Credit Suisse continue to have a bearish view of the Turkish lira. They anticipate that the exchange rate will remain volatile with the government experimenting with unconventional policies.
Key Quotes:
“The lira looks set to remain volatile as the government experiments with unconventional policies (e.g. FX-linked TRY deposits) while real rates have fallen far into negative territory.”
“Another phase of abnormal volatility, similar to the one in mid-December, cannot be ruled out.”
“Meanwhile, the risk of an early elections announcement in Q1 2022 seems low. But if it materialises anyway, it will probably pave the way for some respite for the lira.”
“The vulnerability of the lira is likely to lead markets to build up further risk-premium in front-end rates. We see scope for 1-year OIS rates to rise above their November high of 27.30% and possibly reach 30.00% later in Q1.”
Fed Vice Chair nominee Lael Brainard, speaking at a hearing before the Senate Banking Committee on Thursday, said that the Fed's actions will bring inflation down whilst also allowing the US labour market to make a full recovery. So far in the hearing, Brainard has not been questioned extensively on policy.
Market Reaction
The Dollar Index has in recent trade been picking up from earlier session lows and is now in the 94.80 area, having been as low as 94.70 earlier in the day.
Analysts at Wells Fargo maintain their view for a broadly stronger US dollar over the course of 2022 and into 2023. They consider a more hawkish Federal Reserve should result in capital flows toward the greenback, pushing it to the upside against most G10 and emerging market currencies.
Key Quotes:
“We expect the greenback to strengthen against most G10 and emerging market currencies in the foreseeable future. The Fed has already sped up the tapering of its bond purchases, and with interest rate hikes now seemingly imminent, the Fed has shifted to a more hawkish stance on monetary policy. As the Fed continues to tighten monetary policy at a quicker pace than markets previously expected, we expect capital flows toward the U.S. dollar to materialize over the course of this year.”
“Over the first few weeks of 2022, foreign currencies have outperformed; however, as U.S. Treasury yields rise and the Fed maintains its hawkish approach, we expect the current weaker U.S. dollar trend to reverse course.”
- The US Dollar sell-off extends despite US inflation rising above 7%.
- Market participants expect the Fed’s first interest rate increase by March 2022.
- USD/CAD Technical Outlook: Bearish biased but a daily close below the 200-DMA might keep CAD bulls in charge.
During the North American session, the US dollar sell-off continued after US consumer inflation data released on Wednesday showed that CPI rose by 7.0%. Traders would expect that the US dollar may get stronger on it, as it further cements down the Fed’s first rate hike by March 2022, but per the market reaction, it appears it is already priced in. At the time of writing, the USD/CAD slides to fresh YTD lows, trading at 1.2461, a level last seen in November of the last year.
In the meantime, Light Crude oil Futures, advance 0.07%, sit at $82.70 per barrel, a tailwind for the oil-linked-currency Canadian dollar.
US Initial Jobless Claims climb, PPI edges lower than estimates
in the meantime, the US Department of Labour reported that Initial Jobless Claims for the week ending on January 7 increased by 230K, more than the 200K. At the same time, prices paid by producers, better known as the Producer Price Index for December on an annual basis, rose by 9.7%, a tenth lower than expected, showing that price pressures might get under control.
Earlier, the Philadelphia Fed President Patrick Harker said that he expected three rate hikes, followed by a reduction of its $8,7 Trillion balance sheet, coinciding with Fed’s Bostic, Mester, Daily, and other policymakers have said in the week.
Later in the day, Fed Vice-Chairwoman nominee Lael Brainard would hit the wires. The prepared remarks for her appearance at the US Senate are here.
USD/CAD Price Forecast: Technical outlook
The loonie strengthened against the greenback in the overnight session, extending the USD/CAD slump below the 200-day moving average (DMA), which lies at 1.2500. Hence, the USD/CAD is downward biased, per technical analysis. However, a daily close under the 200-DMA would add downward pressure on the pair.
The USD/CAD first support would be 1.2400. A breach of the latter would keep CAD buyers hopeful of extending towards October 21 of the last year, daily low at 1.2288, but first will need to break below November 10 cycle low at 1.2386, followed by the 1.2300 figure.
Contrarily, the pair’s first resistance would be the 200-DMA at 1.2500. A break above it would expose the January 12 daily high at 1.2580, followed by 1.2600 and then the 100-DMA at 1.2623.
- Mexican peso remains in range, holding onto recent gains versus the US dollar.
- USD/MXN keeps testing the 20.30/35 support area.
- Resistance emerges at 20.55, horizontal level and the 20 and 100-SMA.
The USD/MXN continues to be unable to move away from the 20.35 area. Like what happened every day of the week, the pair rose above 20.40 only to slide later.
The Mexican peso remains strong and continues to pressure the 20.30/35 support. A break lower would clear the way to more losses, targeting initially 20.15 and then the 20.00 zone.
In the area, horizontal levels and the 20 and 100-day simple moving average are located. On the upside, immediate strong resistance emerges at 20.55 and 20.60. A daily close above would expose the next resistance at 20.85.
Technical indicators are flat, affected by the consolidation. The USD/MXN hit a monthly intraday low on Wednesday but it failed to make a run under 20.30. The 200-SMA awaits flat at 20.28.
USD/MXN daily chart
-637776826841370133.png)
- USD/TRY reverses part of the recent pullback to 13.1000.
- Turkey’s Industrial Production expanded 11.4% YoY in November.
- Retail Sales in Turkish gained 1.35 MoM also in November.
After strengthening to the vicinity of the 13.00 mark vs. the US dollar, the Turkish lira now gives away part of those gains and pushes USD/TRY back to the 13.60/70 band on Thursday.
USD/TRY: Upside remains capped by 14.00
USD/TRY appears to have entered into a consolidative phase against the backdrop of increasing cautiousness ahead of the Turkish central bank (CBRT) monetary policy meeting due next week.
In addition, investors remain sceptical about the progress of the protected lira-deposit scheme announced recently. On the latter, the government reported an increase in this kind of deposits in past days.
In the Turkish calendar, Industrial Production expanded at a healthy 11.4% YoY in November and Retail Sales rose 1.3% inter-month and 16.3% over the last twelve months during the same period.
What to look for around TRY
The pair moves within a 13.00-14.00 range so far this year. The higher-than-expected inflation figures released at the beginning of the year put the lira under extra pressure in combination with some cracks in the confidence among Turks regarding the government’s recently announced plan to promote the de-dollarization of the economy. In the meantime, the reluctance of the CBRT to change the (collision?) course and the omnipresent political pressure to favour lower interest rates in the current context of rampant inflation and (very) negative real interest rates are forecast to keep the domestic currency under intense pressure for the time being.
Key events in Turkey this week: Current Account (Tuesday) - Industrial Production (Thursday).
Eminent issues on the back boiler: Progress (or lack of it) of the government’s new scheme oriented to support the lira. Constant government pressure on the CBRT vs. bank’s credibility/independence. Bouts of geopolitical concerns. Much-needed structural reforms. Growth outlook vs. progress of the coronavirus pandemic. Potential assistance from the IMF in case another currency crisis re-emerges. Earlier Presidential/Parliamentary elections?
USD/TRY key levels
So far, the pair is gaining 1.89% at 13.5114 and a drop below 12.7523 (2022 low Jan.3) would pave the way for a test of 12.2628 (55-day SMA) and finally 10.2027 (monthly low Dec.23). On the other hand, the next up barrier lines up at 13.9319 (2022 high Jan.10) followed by 18.2582 (all-time high Dec.20) and then 19.0000 (round level).
- AUD/USD has topped 0.7300 in recent trade and is now looking to test uptrend resistance going back to November.
- The pair has been a beneficiary of recent USD weakness and may struggle to gain further should the dollar stabilise.
AUD/USD has in recent hours moved back to the north of the significant 0.7300 level and looks to be on course to mount a retest of an uptrend that has been capping the price action going all the way back to the end of November in the 0.7320s area. For now, at current levels in the 0.7310s, the pair is trading with gains of about 0.4% on the session, as dollar weakness provides ongoing tailwinds. The US dollar’s recent decline seems out-of-sync with recent fundamental developments, which most would normally interpret as USD bullish. These include the recent hawkish shift in Fed rhetoric towards accelerated tightening in 2022, last Friday’s tight labour market figures and Wednesday’s hot Consumer Price Inflation data.
On which note, the US inflation and employment stories received further input on Thursday in the form of Producer Price Inflation, which showed Core prices growth at a fresh record high (the data series started in 2011) above 8.0% YoY. The latest weekly jobless claims report, meanwhile, was mixed with a much larger than anticipated drop in continued claims and a fall in the insured unemployment rate from 1.3% to 1.1%, but a slightly larger than expected 230K initial claims on the week. The latter is perhaps indicative of the Omicron variant slowing the labour market, though is still in healthy pre-pandemic ranges (typically 200K – 250K).
Back to the dollar; recent downside thus appears to have its roots in position-adjustment (profit-taking on overcrowded long positioning), or a long-squeeze, rather than reflecting broader economic/central bank themes. That suggests that the dollar may soon bottom out. Gauging when exactly that will happen maybe a challenge, though technicians are suggesting the Dollar Index should find support in the mid-94.00s (it is currently around 94.70). That suggests further upside for G10/USD majors may be limited from here on out, suggesting AUD/USD may have a difficult time breaking above uptrend resistance and towards 0.7350.
Ahead, the main focus for FX markets on Thursday will be on Fed Vice Chair nominee Lael Brainard’s Senate hearing from 1500GMT and on any other Fedspeak. Fed members have recently been throwing support behind the notion of multiple rate hikes in 2022 and a potential beginning to quantitative tightening, as Fed’s Patrick Harker did earlier in the session.
Federal Reserve Governor Lael Brainard will testify before the US Senate Committee on Banking, Housing, and Urban Affairs for her Vice-Chair nomination hearing on Thursday, January 13, at 1500 GMT.
Ahead of this event, the dollar is having a difficult time finding demand with the US Dollar Index trading at its lowest level since November 10 below 94.70.
Related articles
Fed’s Brainard: Inflation control is Fed's most important task.
Fed View: Rate hike in March; balance sheet runoff soon after – ABN AMRO.
Powell’s Confirmation Hearing: Inflation was on top of agenda – Rabobank.
Economists at ING offered a brief preview of next week important macro releases, including the Chinese GDP report and Australian labour market report.
Key Quotes:
“When China releases its activity and GDP data on Monday, we expect to see a slight uptrend in retail sales and fixed asset investments, as the job market has started to stabilise and the government has encouraged the start of infrastructure investments managed by local governments. GDP growth in the fourth quarter of 2021 will be down compared to the previous quarter, due to defaults in real estate companies and some base effect.”
“Australia’s December labour report follows on from the strong gains on reopening seen in November. Most of the jobs lost during the last lockdown look to have been restored, though there may be some shift from part-time to full-time workers, and a rising participation rate may result in a modestly higher unemployment rate before it begins to decline again over 2022. Until wages and inflation data are released, this should not have too much impact on expectations for the Reserve Bank of Australia's policy this year.”
- USD/JPY witnessed heavy selling for the second straight day amid a broad-based USD weakness.
- Rebounding US bond yields did little to impress the USD bulls or lend any support to the major.
- A positive risk tone might undermine the safe-haven JPY and help limit any further downfall.
The USD/JPY pair continued losing ground through the early North American session and dropped to a fresh three-week low, around the 114.20 region in the last hour.
The latest US CPI report released on Wednesday was not deemed worrying enough to change the Fed's already hawkish outlook and forced investors to unwind their US dollar bullish positions. The USD selling bias remained unabated on Thursday, which, in turn, was seen as a key factor that dragged the USD/JPY pair lower for the second successive day. This also marked the sixth day of a negative move for the USD/JPY pair in the previous seven sessions, summing up to a fall of over 200 pips from a five-year high touched on January 4.
The USD remained depressed and failed to gain any respite from the US macro releases. In fact, the Weekly Initial Jobless Claims unexpectedly rose from 207K previous to 230K during the week ended January 7. Separately, the US Producer Price Index (PPI) came in at a 9.7% YoY rate for December, up from 9.6% in the previous month. This, however, fell short of market expectations pointing to a reading of 9.8% and hence, did little to impress the USD bulls or stall the USD/JPY pair's decline to the lowest level since December 23.
Meanwhile, a generally positive tone around the equity markets could undermine the safe-haven Japanese yen and help limit further losses for the USD/JPY pair, at least for now. Even from a technical perspective, bearish traders might now wait for a sustained break below an upward sloping trend-line, extending from November swing low, before placing fresh bets. That said, any meaningful recovery attempt is more likely to attract fresh selling at higher levels and runs the risk of fizzling out rather quickly ahead of the 115.00 psychological mark.
Technical levels to watch
- Spot gold is subdued in the mid-$1820s, having struggled to benefit from recent USD weakness.
- US real and nominal yields remain resilient close to recent highs, capping gold’s appeal for now.
Spot gold (XAU/USD) prices have pared back from Asia Pacific/early European session highs at the $1828 mark in more recent trade though have for the most part remained support above $1820. Some traders have been disappointed at gold’s struggles to benefit from this week’s run of US dollar weakness. Yes, the precious metal is higher by about 1.50% on the week, having recovered back to current levels in the $1820s from previously underneath $1800. But the rally has run out of steam ahead of this year’s $1830 highs. That compares to the Dollar Index, a trade-weighted basket of major dollar pairs, which has slumped to fresh two-month lows on Thursday underneath the 95.00 level. Typically, a weaker dollar benefits USD-denominated precious metals such as spot gold as it makes it cheaper for international buyers.
Gold’s reluctance to break out to fresh multi-month highs in tandem with the dollar’s recent slide has its roots in a few factors. Firstly, the dollar move does not reflect a USD bearish fundamental developments, rather it seems to be driven by positioning adjustment as market participants book profit on crowded long-positioning. Indeed, recent USD fundamental developments, such as indications from the Fed it wishes to implement as many as four hikes in 2022 and start quantitative tightening, headline inflation hitting fresh near-four-decade highs at 7.0% and the jobless rate dropping under 4.0% are all arguably USD positive. These dollar positives are at the very least keeping US bond yields support close to recent highs; 10-year yields are trading in the mid-1.70%, just below recent multi-year highs at 1.80% and 10-year TIPS (real) yields are back in the -0.75% area, just below multi-month highs at -0.70%.
Indeed, the resilience of bond yields to hold close to recent highs despite the pullback in the US dollar is the second major reason for XAU/USD’s reluctance to move above $1830. The latest mixed jobless claims, US Producer Price Inflation data and comments from Fed member Patrick Harker, who supports three hikes and could be persuaded on four in 2022, did not shift XAU/USD sentiment. Traders will nonetheless be keeping an eye on upcoming Fed speak on Thursday in the form of Fed Vice Chair nominee Lael Brainard’s Senate hearing from 1500GMT, as well as remarks from other speakers.
Federal Reserve Bank of Philadelphia Patrick Harker on Thursday said that he has penciled in three rate hikes in 2022, but could be persuaded on a fourth. Harker continued that the Fed needs to finish its QE taper, then raise interest rates, then start to reduce the size of its balance sheet, which could begin in late 2022 or early 2023. Harker said he sees the interest rates as the Fed's primary monetary tool and added that the composition of the balance sheet is an active debate, with him preferring one that is slightly shorter in duration when it comes to treasuries, though he is open minded.
Market Reaction
The DXY did not see any notable reaction to the latest comments.
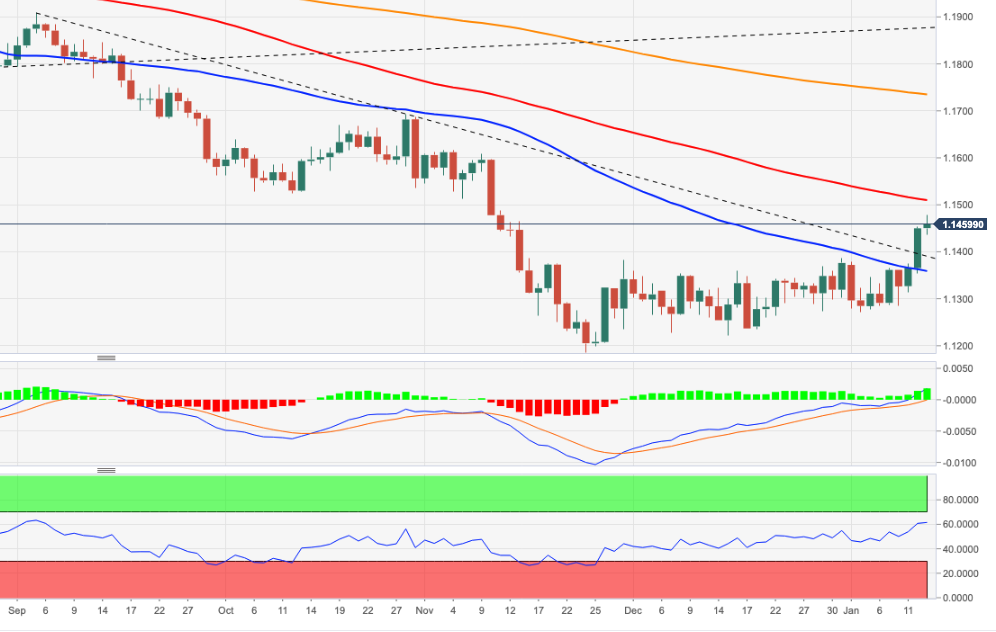
- EUR/USD advances to new highs in the 1.1475/80 band.
- Bulls now face the 100-day SMA near 1.1510.
EUR/USD gains further ground and briefly visited the 1.1480 region on Thursday, up for the third session in a row and recording new 2-month highs.
Further upside now looks likely considering the recent price action, with the next target at the 100-day SMA at 1.1508 ahead of the more relevant hurdle at the 200-week SMA at 1.1516. If the buying interest picks up extra impulse from here, then a move to October’s high at 1.1692 should start shaping up sooner rather than later.
The longer term negative outlook for EUR/USD is seen unchanged while below the key 200-day SMA at 1.1733.
EUR/USD daily chart
- Headline PPI rose at a pace of 9.7% in December, slightly below expected.
- Core PPI was up 8.3% YoY, more than expected.
The headline US Producer Price Index (PPI) rose at an annual pace of 9.7% in December, according to the latest report from the US Bureau of Labor Statistics on Thursday. That marked a new series record high (PPI was first reported back in 2011) but was slightly below the median economist forecast for 9.8% and a slight acceleration versus November's 9.6% reading. MoM, PPI came in at 0.2% in December, below expectations for a 0.4% MoM gain.
Contrary to the headline reading, Core PPI came in at 8.3% YoY which was above expectations for an 8.0% reading and marked a larger than expected acceleration from November's 7.7% YoY pace of price growth. MoM, Core PPI was up 0.5%, in line with expectations, marking a deceleration in the pace of MoM price growth from November 0.9% reading, which had been revised up from 0.7%.
Market Reaction
The DXY did not see any notable reaction to the latest data.
- Initial claims rose to 230K in the week ending on January 8, above the 200K expected.
- The insured unemployment rate fell to 1.1%.
There were 230,000 initial claims for unemployment benefits in the US during the week ending January 8, data published by the US Department of Labor (DoL) revealed on Thursday. This reading followed last week's print of 207,000 and came in above consensus market expectations for 200,000.
Continued jobless claims fell to 1.559M in the week ending January 1, the data showed, below expectations for a decline to 1.733M from 1.753M the week prior (which was revised lower from 1.754M). The insured unemployment rate fell to 1.1% versus 1.3% last week.
Market Reaction
The DXY did not see any notable reaction to the latest data.
- NZD/USD gained traction for the third straight day and shot to the highest level since late November.
- The USD extended the post-US CPI downfall and was seen as a key factor that provided a goodish lift.
- A positive risk tone further undermined the safe-haven USD and benefitted the perceived riskier kiwi.
The NZD/USD pair maintained its bid tone through the early North American session and was last seen trading near the 0.6870-75 region, or the highest level since November 25.
The pair added to this week's strong move up and gained strong follow-through traction for the third successive day on Thursday amid sustained selling bias surrounding the US dollar. The momentum took along some short-term trading stops placed near the 0.6850-55 region, which prompted some technical buying and provided an additional boost to the NZD/USD pair.
Data released on Wednesday showed that the headline US CPI surged to the highest level since June 1982 and core CPI registered the biggest advance since 1991. The stronger prints reinforced the need for quicker interest rate hikes, though were not deemed worrying enough to change the Fed's already hawkish outlook and continued weighing on the greenback.
Apart from this, a generally positive tone around the equity markets was seen as another factor that undermined the greenback's relative safe-haven status and benefitted the perceived riskier kiwi. With the latest leg up, the NZD/USD pair now seems to have confirmed a bullish breakout and seems poised to build on its recovery from 2021 low, around the 0.6700 mark.
Market participants now look forward to the US economic docket, featuring the release of the Producer Price Index and Weekly Initial Jobless Claims. This, along with Fed Governor Lael Brainard's testimony on her nomination as Vice Chair and the broader market risk sentiment, will influence the USD and provide a fresh impetus to the NZD/USD pair.
Technical levels to watch
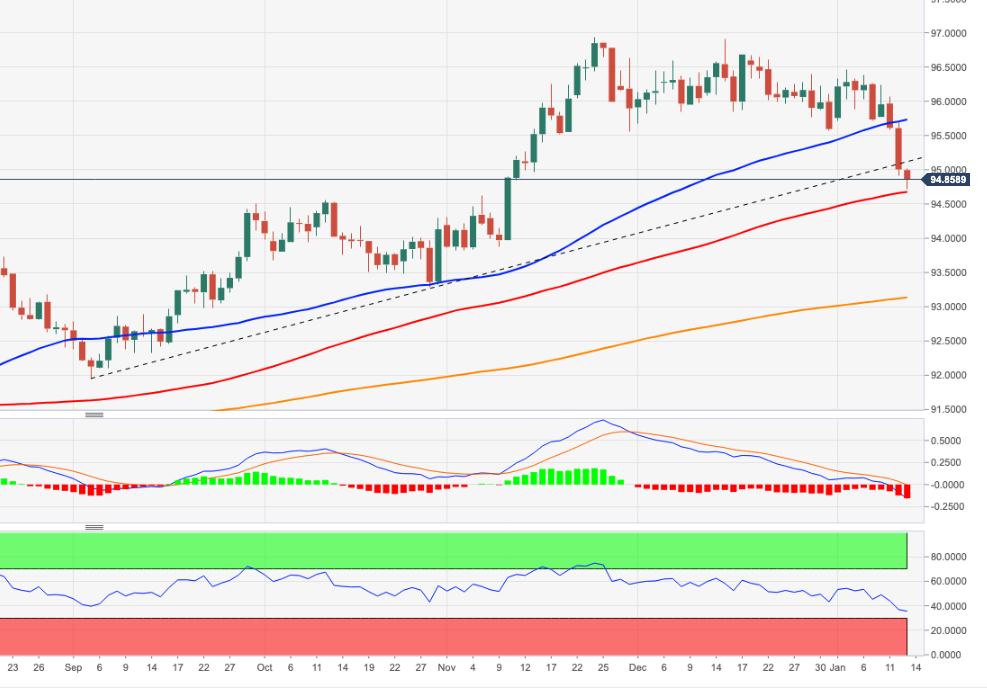
- DXY breaks below the 95.00 support with conviction.
- Immediately to the downside comes the 100-day SMA at 94.64.
DXY extends the downside further and opens the door to a deeper retracement in the very near term.
Indeed, the index broke below the 4m support line near 95.10 and the 200-week SMA at 95.07 and in doing so the upside pressure now looks mitigated, allowing for extra losses to, initially, the 100-day SMA at 94.64. If this level is breached, then there are no relevant support levels until October’s low at 93.27 (October 28 2021).
Looking at the broader picture, the longer-term positive stance remains unchanged above the 200-day SMA at 93.11.
DXY daily chart
- GBP/USD has backed off of earlier highs having failed to break above 1.3750 or its 200DMA just below.
- Cable remains well support on the day however amid continued buck weakness and is now 1.0% up on the week.
GBP/USD’s bullish momentum has cooled off slightly in recent trade, with the pair unable to break above 1.3750 or hold to the north of its 200-day moving average at 1.3736. GBP/USD is now consolidating in the 1.3730s. Nonetheless, cable’s 0.2% rally from around the 1.3700 level on Thursday has taken its weekly gains to more than 1.0% and seen the pair reach its highest levels since late-October. The move higher reflects a continuation of the recent broad weakening of the dollar against its G10 peers that has seen the Dollar Index (DXY) drop more than 1.2% over the course of the last three sessions and to its lowest levels in more than two months underneath 95.00.
Traders and analysts have put the recent weakness down to a squeeze on the market’s (up until very recently) very crowded long-dollar positioning. Notably, recent weakness has seemingly gone against the fundamentals. Recent rhetoric from Fed members and last week’s minutes have markets betting on as many as four rate hikes from the bank this year, with recent inflation and employment data supporting the outlook for tightening. As a result, once the “weak hands” are flushed out and positioning has reverted somewhat back to normality, some are calling for the DXY to find support in the mid-94.00s and then rebound later in the year to reflect the hawkish Fed/strong US economy combination.
That suggests any further GBP/USD rally may struggle to extend beyond 1.3800. Technical indicators are also blinking that GBP/USD may be “overbought”, with the 14-day Relative Strength Index recently surpassing the 70.00 seen as indicating conditions have become overbought. But if the dollar does regain its pose in the coming weeks/months, sterling might well be one of the G10 currencies able to hold its ground given expectations for the BoE to continue hiking interest rates and to start reducing the size of its balance sheet this year, keeping it one step ahead of the Fed when it comes to policy normalisation. For now, analysts think GBP will remain immune to calls for the UK PM’s resignation over his attendance to a work party during lockdowns. “With the UK ahead of other major developed economies in regard to the Omicron wave and the roll-out of booster jabs, GBP will likely see limited impact from the uncertainty over PM Johnson’s future”, wrote analysts at MUFG.
In the short-term, GBP/USD traders will be focused on Fed Vice Chair nominee Lael Brainard’s remarks in a Senate Hearing from 1500GMT as well as on other Fed speakers to guage the levels of support for multiple rate hikes and quantitative tightening in 2022. US weekly jobless claims figures will also be released at 1330GMT ahead of Friday’s US December Retail Sales report at the same time. UK November monthly GDP figures will also be released on Friday prior to the European open at 0700GMT.
- GBP/JPY struggled to preserve its modest intraday gains to the 157.45 area on Thursday.
- The UK political drama acted as a headwind for the British pound and capped the upside.
- The post-US CPI USD selling bias benefitted the JPY and also contributed to the pullback.
The GBP/JPY cross surrendered a major part of its modest intraday gains and was last seen hovering near the lower end of the daily trading range, around the 157.00 mark.
The cross gained some positive traction during the early part of the trading on Thursday, though struggled to capitalize on the move and met with a fresh supply near the 157.45 region. The latest political development in the United Kingdom acted as a headwind for the British pound and capped the upside for the GBP/JPY cross.
In fact, the chances of UK Prime Minister Boris Johnson resigning are rising amid calls from within the Conservative party after an admission that he attended a lockdown-breaching party in May 2020. That said, most Tory MPs still appear determined to wait for the results of a formal investigation before taking any action.
On the other hand, the post-US CPI US dollar sell-off provided a goodish lift to the Japanese yen. This, in turn, was seen as another factor that prompted traders to unwind some of their bullish bets around the sterling and kept a lid on any meaningful upside for the GBP/JPY cross ahead of the Brexit talks on Thursday.
That said, a generally positive tone around the equity markets undermined the JPY's relative safe-haven status and helped limit deeper losses for the pair. This, in turn, warrants some caution before confirming that the GBP/JPY cross has topped out in the near term and positioning for any meaningful corrective pullback.
Technical levels to watch
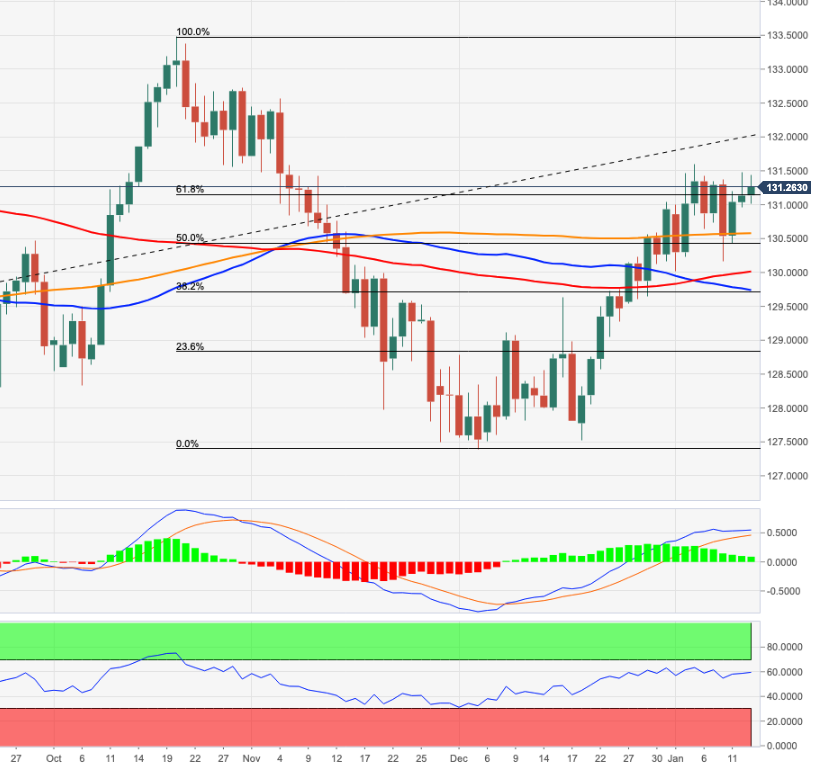
- EUR/JPY extends the upside for the third session in a row.
- The surpass of YTD high should allow for further upside.
EUR/JPY’s upside momentum seems to have faltered just ahead of the 131.50 level on Thursday.
The persistent buying pressure could encourage the cross to attempt an assault to the 2022 high at 131.60 (January 5), just ahead of the Fibo level (of the October-December drop) at 132.17 and November’s peak at 132.53 (November 4).
While above the 200-day SMA, today at 130.54, the outlook for EUR/JPY should remain constructive.
EUR/JPY daily chart
Norges Bank will announce its rate decision on Thursday, 20 January at 10.00 CET. Analysts at Nordea Markets offered a brief preview of the event and expect that the key rate will be on hold at 0.5 per cent.
Key Quotes:
“The interim meetings at Norges Bank are usually dull events, and this time will be no different. In the press release, the central bank will only describe the main developments since the previous meeting vis-a-vis their expectations from December, without concluding on the effects on the rate path.”
“The developments since December have so far been better than expected by the central bank, while the NOK is in line. Although Norges Bank will not conclude on the effects on the rate path, our own assessment is that the sum of news warrants a higher rate path vis-a-vis the rate path from December (supporting our long-held view for four rate hikes this year).”
“Overall, we expect that the Committee will reiterate their message from December: “Based on the Committee’s current assessment of the outlook and balance of risks, the policy rate will most likely be raised further in March”. Market forward rates are currently priced broadly in line with the rate path from Norges Bank so market reactions should thus be muted.”
According to analysts at ING bank, the dollar might have a more balanced positioning now after a large long-squeeze, which could help keep EUR/USD below 1.1500.
Key Quotes:
“A well-telegraphed jump in US inflation to 7% was taken as a “sell the fact” opportunity for FX investors, with a substantial unwinding of dollar longs triggering widespread dollar weakness. The technical break higher in EUR/USD likely put some extra pressure on the dollar in other crosses: whether the 1.1500 resistance holds is key for dollar bulls at the moment.”
“We still think the dollar counter trend does not have long legs, and we see scope for a recovery by the end of this week, as imminent Fed tightening and room to cement views around a fourth Fed hike in 2022 (the Fed’s Bullard sees this as the base case scenario) still offer the greenback – which should now have a less skewed net-long positioning - some appeal on dips.”
Economist at UOB Group Lee Sue Ann suggests the Bank of Korea (BoK) could likely leave the policy rate unchanged at 1.00% at its meeting on Friday.
Key Takeaways
“The BoK said the benchmark rate is still below the neural level. Barring a sharp downturn in its economy, we continue to project the next 25 bps rate hike in 1Q22, likely in February.”
“If inflation becomes more broad-based, the BoK may have to raise interest rate by another 25-50 bps between late-2022 to 2023.”
European Central Bank (ECB) Vice President Luis de Guindos said on Thursday that the European economy is getting used to the coronavirus, as reported by Reuters.
"Perhaps inflation won't be as transitory as forecast only some months ago," de Guindos noted but also added that he expects inflation to stay below the ECB's target in 2023 and 2024.
Market reaction
These comments don't seem to be having a noticeable impact on the shared currency's performance against its major rivals. As of writing, the EUR/USD pair was up 0.17% on the day at 1.1460.
- USD/CHF remained under some selling pressure for the third successive day on Thursday.
- The post-US CPI USD selling, along with the cautious market mood exerted some pressure.
- Bears now await a sustained break below the monthly swing low before placing fresh bets.
The USD/CHF pair maintained its offered tone through the first half of the European session and was last seen trading near the 0.9125-20 region, or a two-week low.
The pair extended this week's sharp retracement slide from the 0.9275-80 region, or a multi-week high and witnessed some follow-through selling for the third successive day on Thursday. The US dollar extended its post-US CPI downfall and was seen as a key factor dragging the USD/CHF pair lower.
Against the backdrop of Fed Chair Jerome Powell's less hawkish comments, the USD witnessed a typical “sell the fact” kind of trade despite strong US consumer inflation figures. Even rebounding US Treasury bond yields did little to impress the USD bulls or lend any support to the USD/CHF pair.
Apart from this, the cautious mood around the equity markets benefitted the Swiss franc's relative safe-haven status and exerted additional downward pressure on the USD/CHF pair. The downfall could further be attributed to some technical selling below the 200-DMA support, around the 0.9165-60 area.
With the latest leg down, the USD/CHF pair has lost around 150 pips from the weekly swing high and might now aim to challenge the 0.9100 mark, or monthly low. A convincing break below the mentioned handle will be seen as a fresh trigger for bearish trades and pave the way for further losses.
Market participants now look forward to the US macro data – the Producer Price Index (PPI) and the usual Weekly Initial Jobless Claims. This, along with the broader market risk sentiment, will be looked upon for some short-term trading opportunities later during the early North American session.
Technical levels to watch
- USD/TRY breaks to the downside but finds support at 21-DMA.
- The US dollar slump helped yield a range breakout in the pair.
- The upside potential remains intact amid bullish RSI.
USD/TRY is staging a solid comeback so far this Thursday, recovering from the lowest level in six days at 13.16.
The pair got sold-off into a broad-based US dollar slump, triggered by in-line with estimates US inflation data for December, which confirmed a March Fed rate hike.
The sell-off in the greenback was also driven by technical selling, as the US dollar index broke the horizontal channel on the daily chart to the downside.
The downside breakout in the spot offered a renewed buying opportunity in the lira. However, the beleaguered currency failed to hold onto the gains and slipped 3% in Thursday’s trading in the running, courtesy of the persistent concerns over soaring inflation in Turkey and unorthodox monetary policy.
USD/TRY: Technical outlook
Looking at USD/TRY’s technical chart, the pair broke the four-day prison range to the downside, having failed several attempts to recapture the 14.00 level.
Bulls found fresh bids at the 21-Daily Moving Average (DMA) at 13.21, which has restricted the downside for now.
A sustained move below the latter will threaten the 13.00 level, below which the upward-sloping 50-DMA at 12.58 will lend support to USD/TRY.
The 14-day Relative Strength Index (RSI) is pointing north above the midline, suggesting that there is more room for recovery.
Buyers need to find a strong foothold above the 14.00 threshold, above which the December 21 high of 14.14 will be put to test.
USD/TRY: Daily chart
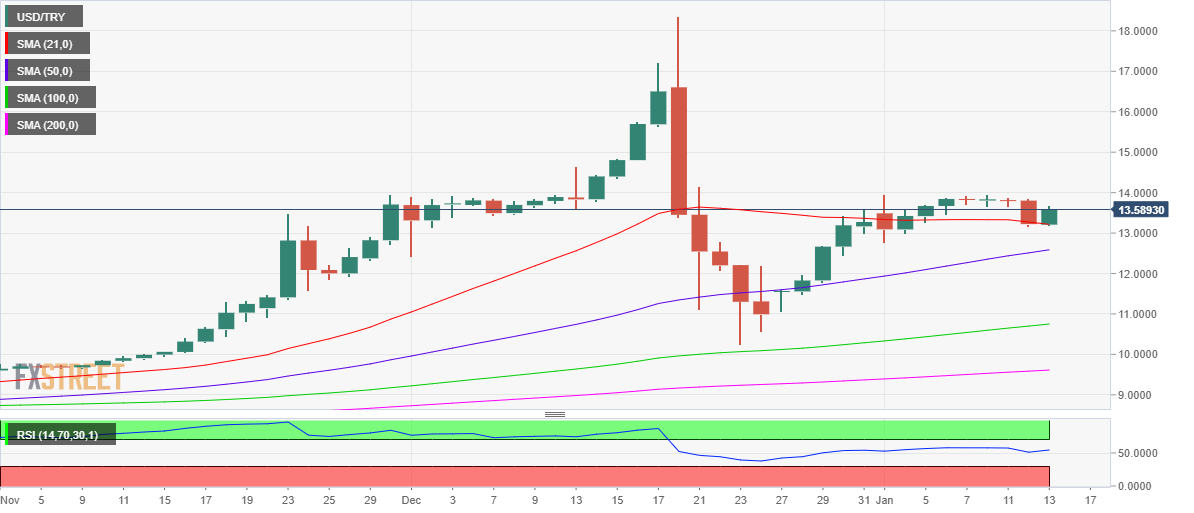
- USD/CAD continued losing ground for the third successive day and dropped to over a two-month low.
- The post-US CPI selling bias remained unabated and was seen as a key factor exerting some pressure.
- Retreating oil prices undermined the loonie and helped limit deeper losses amid the cautious mood.
The USD/CAD pair dropped to over a two-month low during the early European session, albeit quickly recovered few pips thereafter and was last seen trading with only modest losses, below the 1.2500 mark.
The pair witnessed some follow-through selling for the third successive day on Thursday and added to its weekly losses amid an extension of the post-US CPI US dollar downfall. Given that a March Fed rate hike was fully priced in, the USD witnessed aggressive long-unwinding in a typical “sell the fact” kind of trade following the release of US consumer inflation figures.
The selling bias remained unabated through the early part of trading on Thursday, though rebounding US Treasury bond yields and a softer risk tone extended some support to the safe-haven greenback. Apart from this, retreating crude oil prices undermined the commodity-linked loonie and helped limit any further losses for the USD/CAD pair, at least for the time being.
That said, the technical set-up still seems tilted in favour of bearish traders and supports prospects for a further near-term depreciating move. The negative outlook is reinforced by the fact that spot prices broke through the 100-day SMA support earlier this week. A subsequent slide and acceptance below the 1.2500 psychological mark also validated the bearish bias.
Hence, any attempted recovery move is more likely to attract fresh selling at higher levels and remain limited. Market participants now look forward to the US economic docket, featuring the Producer Price Index (PPI) and the usual Weekly Initial Jobless Claims. This, along with oil price dynamics, might produce some short-term trading opportunities around the USD/CAD pair.
Technical levels to watch
FX option expiries for January 13 NY cut at 10:00 Eastern Time, via DTCC, can be found below.
- USD/JPY: USD amounts
- 115.00 652m
- 115.50 1.3b
- 116.00 960m
- USD/CAD: USD amounts
- 1.2650 731m
In its latest economic bulletin published on Thursday, the European Central Bank (ECB) said that the exact impact of the Omicron covid variant on the economy is highly uncertain.
Additional takeaways
Omicron variant likely to induce higher volatility in global growth.
Supply bottlenecks, rising commodity prices, omicron spread continue to weigh on near-term global growth prospects.
Euro area growth is moderating but expected to pick up again strongly in the course of this year.
Risks to economic outlook are broadly balanced.
Market reaction
EUR/USD is maintaining its pullback from two-month highs of 1.1479 on these ECB headlines, currently trading at 1.1465. The spot is higher by 0.21% so far.
Economist at UOB Group Ho Woei Chen, CFA, assesses the latest inflation figures in the Chinese economy.
Key Takeaways
“China’s CPI and PPI cooled off at a faster than expected pace in Dec. Notably, CPI and PPI both fell on a month-on-month basis.”
“We expect headline CPI inflation to remain stable under 2% in the next few months before heading higher in 2H22 for full-year 2022 average of around 2.2%. Meanwhile, the higher comparison base should set PPI into a slower growth pace ahead. After averaging 8.1% in 2021 (2020: -1.8%), we expect PPI to moderate towards 4-6% in 2022.”
“As CPI inflation returns below 2% and PPI continues to moderate, this will provide a more conducive backdrop for the People’s Bank of China’s (PBOC) to ease its monetary policy in 1H22. We expect the 1Y medium-term lending facility (MLF) rate to be cut this month following the 5 bps reduction in the benchmark 1Y Loan Prime Rate (LPR) in Dec 2021.”
UK Foreign Minister Liz Truss tweeted out this Thursday, “I look forward to welcoming @MarosSefcovic to Chevening this morning for constructive talks “
“My priority is protecting peace in Northern Ireland and the Belfast (Good Friday) Agreement,” she added.
Truss’ comments come ahead of Thursday’s meeting, where she is hosting the European Union (EU) commissioner Maros Sefcovic at her official country house.
The talks are scheduled to inject momentum with Brussels to resolve post-Brexit disputes over trading rules.
Market reaction
GBP/USD was last seen trading at 1.3735, adding 0.24% on the day. The pair hit fresh three-month highs of 1.3747 in the last hours.
- EUR/USD gains extra pace and approaches the 1.1500 mark.
- The dollar loses further ground and drops to multi-week lows.
- ECB-speak, US labour market results next on the calendar.
The upbeat note in the risk complex now pushes EUR/USD to fresh 2-month highs in the 1.1480 region on Thursday.
EUR/USD up on dollar’s selloff
EUR/USD advances for the third session in a row on Thursday and extends the recent breakout of the multi-week consolidative phase that has been prevailing since the beginning of December 2021.
The strong leg higher in the pair comes on the back of the renewed and noticeable selloff in the greenback, which has been particularly exacerbated after US inflation figures showed the raise in the annual CPI matched previous estimates in December (+7.0%).
The daily retracement in the buck comes amidst a mild correction in US yields and the German 10y Bund, although they manage to still keep business near recent tops.
In the domestic calendar, ECB’s Vice-President De Guindos and Board member Hakkarainen will speak during the European morning amidst the absence of noteworthy releases in the region.
Across the pond, Producer Prices and Initial Claims will take centre stage followed by speeches by FOMC’s Harker and Evans and the testimony by FOMC’s L.Brainard.
What to look for around EUR
EUR/USD pops higher and already flirts with the key 1.1500 neighbourhood, or 2-month tops. The acute pullback in the US dollar follows the somewhat “disappointing” US inflation figures during December, although they did not change the view that the Federal Reserve could likely start its tightening cycle as soon as at the March meeting, exacerbating the policy divergence between the ECB vs. the Fed. On another front, the unabated advance of the coronavirus pandemic remains as the exclusive factor to look at when it comes to economic growth prospects and investors’ morale.
Key events in the euro area this week: Germany Full Year GDP Growth 2021, ECB C.Lagarde (Friday).
Eminent issues on the back boiler: Asymmetric economic recovery post-pandemic in the euro area. ECB stance/potential reaction to the persistent elevated inflation in the region. ECB tapering speculation/rate path. Italy elects President of the Republic in late January. Presidential elections in France in April.
EUR/USD levels to watch
So far, spot is gaining 0.24% at 1.1468 and faces the next up barrier at 1.1508 (100-day SMA) followed by 1.1516 (200-week SMA) and finally 1.1692 (monthly high Oct.18 2021). On the other hand, a break below 1.1357 (55-day SMA) would target 1.1272 (2022 low Jan.4) en route to 1.1221 (monthly low Dec.15 2021).
- AUD/USD scaled higher for the third straight day and shot to a near two-month high on Thursday.
- The post-US CPI USD selling remained unabated and was seen as a key factor fueling the momentum.
- Technical buying above 100-DMA and a sustained strength beyond the 0.7300 mark favour bulls.
The USD witnessed some selling during the early European session and pushed the AUD/USD pair to a near two-month high, further beyond the 0.7300 mark in the last hour.
The pair gained some follow-through traction for the third successive day on Thursday and built on the previous day's breakout momentum through the 0.7270-75 horizontal resistance. This also marked the fourth day of a positive move in the previous five and was sponsored by the post-US CPI broad-based US dollar selling.
Data released on Wednesday showed that the headline US CPI surged to the highest level since June 1982 and core CPI registered the biggest advance since 1991. The stronger readings reinforced the need for quicker interest rate hikes, though was not deemed worrying enough to change the Fed's already hawkish outlook.
Moreover, the markets had fully priced in an eventual Fed lift-off in March. This, in turn, prompted aggressive USD long-unwinding trade, which extended through the first half of the trading on Thursday. Even rebounding US Treasury bond yields and a softer risk tone did little to lend any support to the safe-haven USD.
Meanwhile, the latest leg up could further be attributed to some technical buying above the 100-day SMA. A subsequent strength beyond the 0.7300 mark might have already set the stage for additional gains. That said, the cautious mood could act as a headwind for the perceived riskier aussie and cap gains for the AUD/USD pair.
Market participants now look forward to the US economic docket, featuring the Producer Price Index and Weekly Initial Jobless Claims. This, along with Fed Governor Lael Brainard's testimony on her nomination as Vice Chair and the broader market risk sentiment, will influence the USD and provide a fresh impetus to the AUD/USD pair.
Technical level to watch
Speaking at an online press conference on Thursday, Gao Feng, China’s Commerce Ministry spokesman reiterated that both teams are maintaining normal communication on US-China Phase One trade deal.
Late December, Gao said that Beijing “hopes that the US can create good conditions for both sides to expand trade cooperation” when asked about the latest in the implementation of the Phase One trade deal.
Market reaction
AUD/USD is trading at 0.7305, up 0.30% on the day, sitting at the highest level in two months.
USD/CNH looks poised to extend the downside to the 6.3500 level in the next weeks, noted FX Strategists at UOB Group.
Key Quotes
24-hour view: “Yesterday, we expected USD to ‘edge lower’ and we were of the view that ‘any weakness is expected to encounter strong support at 6.3680’. We did not anticipate the sharp sell-off that sent USD plummeting to 6.3605. The swift and sharp drop appears to be running ahead of itself but there is room for USD to dip to 6.3560. For today, the major support 6.3500 is likely out of reach. Resistance is at 6.3680 followed by 6.3730.”
Next 1-3 weeks: “We noted yesterday (12 Jan, spot at 6.3760) that the recent build-up in upward momentum has fizzled out and we expected USD to trade between 6.3600 and 6.3900. We did not anticipate the rapid manner by which USD approaches the bottom of the expected range as USD dropped to 6.3605. Downward momentum is beginning to build and USD is expected to trade with a downward bias towards 6.3500. A breach of 6.3780 (‘strong resistance’ level) would indicate that our view is wrong.”
- GBP/USD gained strong follow-through traction on Thursday and shot to a fresh multi-month high.
- The post-US CPI USD selling remained unabated and was seen as a key factor fueling the momentum.
- The UK political drama might cap gains amid slightly overbought conditions and ahead of Brexit talks.
The GBP/USD pair caught fresh bids during the early European session and shot to the highest level since October 29, around the 1.3745 region in the last hour.
Following a brief consolidation earlier this Thursday, the GBP/USD pair regained positive traction and scaled higher for the third successive day. The momentum was sponsored by the post-US CPI selling pressure surrounding the US dollar, which remained unabated through the first half of the trading.
Given that the markets have fully priced in a March Fed rate hike, a surge in the US CPI was taken as a “sell the fact” opportunity and prompted aggressive USD long-unwinding on Wednesday. Even rebounding US Treasury bond yields and a softer risk tone did little to lend any support to the safe-haven USD.
Apart from this, the ongoing positive move could further be attributed to technical buying following the previous day's sustained breakthrough a descending trend-line resistance extending from July. Bulls seemed unaffected and shrugged off the latest political development in the United Kingdom.
The chances of UK Prime Minister Boris Johnson resigning are rising amid calls from within the Conservative party after an admission that he attended a party when gatherings were not allowed in England. This could act as a headwind for the British pound ahead of key Brexit talks on Thursday.
Even from a technical perspective, the RSI (14) on the daily chart has started flashing near-term overbought conditions. This further warrants some caution for aggressive bullish traders and before positioning for an extension of the recent appreciating move witnessed since December 20.
In the absence of any major market-moving economic releases from the UK, traders might take cues from the US economic docket – featuring the Producer Price Index and Weekly Jobless Claims. This, along with Fed Governor Lael Brainard's testimony on her nomination as Vice-Chair, will influence the USD.
Traders will further take cues from any Brexit-related headlines, which might further contribute to producing some meaningful trading opportunities around the GBP/USD pair.
Technical levels to watch
- DXY appears under pressure in the area of recent lows sub-95.00.
- The dollar stays offered in the wake of US inflation figures.
- Weekly Claims, Producer Prices, Fedspeak next in the docket.
The US Dollar Index (DXY), which measures the greenback vs. a bundle of its main rival currencies, remains well on the defensive and drops further south of the 95.00 support.
US Dollar Index weaker post-CPI, looks to upcoming data, Fedspeak
The index loses ground for the third consecutive session on Thursday and accelerates losses below the 95.00 mark, always on the back of the improved sentiment in the risk-linked galaxy and the corrective downside in US yields.
Indeed, the dollar’s selloff gathered steam after US headline inflation rose 7% in the year to December, level last seen back in 1982. Despite the high reading, the results fell in line with market expectations and underpinned the view that the Fed could initiate its normalization as soon as in March.
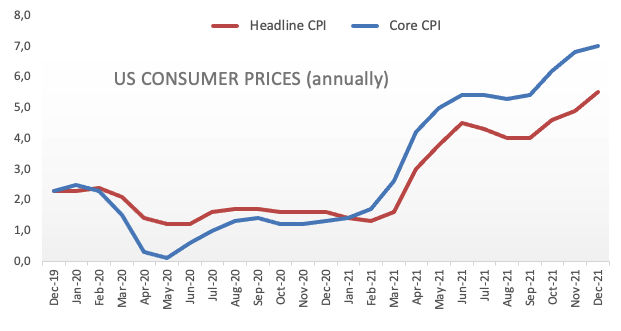
US yields, in the meantime, give away some gains so far on Thursday, although they remain largely near recent highs.
In the US calendar, the usual Initial Claims are due seconded by December Producer Prices. In addition, FOMC’s L.Brainard will testify before the Senate Banking Committee and Chicago Fed C.Evans (2023 voter, centrist) is due to speak.
What to look for around USD
The index lost the grip and dropped to new lows in the sub-95.00 area as market participants keep digesting the recent inflation figures amidst higher US yields and prospects of Fed’s tightening in March. On the supportive side for the greenback, Fed-speakers still point to a sooner-than-anticipated lift-off, the persistent elevated inflation, higher yields and the solid performance of the US economy.
Key events in the US this week: Initial Claims, FOMC L.Brainard Testimony, Producer Prices (Thursday) - Retail Sales, Industrial Production, Flash Consumer Sentiment, Business Inventories (Friday).
Eminent issues on the back boiler: Start of the Fed’s tightening cycle. US-China trade conflict under the Biden’s administration. Debt ceiling issue. Potential geopolitical effervescence vs. Russia and China.
US Dollar Index relevant levels
Now, the index is losing 0.25% at 94.74 and a break above 96.46 (weekly top Jan.4) would open the door to 96.90 (weekly high Dec.15) and finally 96.93 (2021 high Nov.24). On the flip side, the next down barrier emerges at 94.64 (100-day SMA) seconded by 93.27 (monthly low Oct.28 2021) and then 93.11 (200-day SMA).
- Rebounding US bond yields underpinned the USD and capped the upside for gold on Thursday.
- The metal might continue to benefit from its status as a hedge against surging consumer prices.
- Any meaningful corrective slide could still be seen as a buying opportunity and remain limited.
Gold now seems to have entered a bullish consolidation phase and was seen oscillating in a narrow trading band, just below a one-week high through the early European session. As investors digest a surge in the US consumer prices, a goodish rebound in the US Treasury bond yields helped ease the bearish pressure surrounding the US dollar. This, in turn, was seen as a key factor that acted as a headwind for the dollar-denominated commodity.
Apart from this, the prospects for an eventual Fed lift-off in March 2022 held back bulls from placing fresh bets around the non-yielding data. Data released on Wednesday showed that the headline US CPI surged to the highest level since June 1982 and core CPI registered the biggest advance since 1991. The report reinforced the need for quicker interest rate hikes, though was not deemed worrying enough to change the Fed's already hawkish outlook.
Moreover, gold, which is considered a hedge against rising prices, could further benefit from stubbornly high inflation. This, along with the cautious market mood, should help limit the downside for the safe-haven gold. Hence, any meaningful pullback could still be seen as a buying opportunity and remain limited, at least for now. Nevertheless, the XAU/USD, for now, seems to have snapped four successive days of the winning streak.
Market participants now look forward to the US economic docket, featuring the release of the Producer Price Index (PPI) and the usual Weekly Initial Jobless Claims. This, along with Fed Governor Lael Brainard's testimony on her nomination as Vice-Chair, will influence the USD later during the early North American session. Traders will also take cues from the broader market risk sentiment for some short-term opportunities around gold prices.
Technical outlook
From a technical perspective, the recent move up witnessed over the past one week or so stalled just ahead of the $1,830-32 supply zone. The mentioned barrier should now act as a pivotal point for short-term traders, which if cleared decisively will set the stage for additional gains. Gold could then accelerate the momentum to the next relevant hurdle near the $1,848-50 region. The upward trajectory could further get extended towards the $1,869-70 area en-route the $1,877 zone, or a multi-month high touched in mid-November.
On the flip side, immediate support is pegged around the $1,815-12 horizontal zone. Any further decline is likely to get bought into and remain limited near the $1,800 round-figure mark. Some follow-through selling could drag gold towards support marked by an upward sloping trend-line extending from August 2021 swing low, currently around the $1,785 region. A convincing break below will be seen as a fresh trigger for bearish traders and pave the way for deeper losses, possibly towards December swing low, around the $1,753 region.
Gold daily chart
-637776559351758222.png)
Levels to watch
Here is what you need to know on Thursday, January 13:
The dollar faced heavy selling pressure in the second half of the day on Wednesday after the data published by the US Bureau of Labor Statistics showed that the annual Consumer Price Index (CPI) rose to 7% as expected. After losing more than 0.6%, the US Dollar Index is having a tough time staging a recovery and continues to edge lower below 95.00. Investors await December Producer Price Index (PPI) and the weekly Initial Jobless Claims data from the US. Additionally, the European Central Bank will release its Economic Bulletin in the European session.
US Inflation Quick Analysis: Strong figures on all fronts cement Fed action, dollar set to bounce.
Although the CPI inflation in the US reached its strongest level in nearly four decades, the greenback suffered losses against its rivals. Following FOMC Chairman Jerome Powell's cautious tone with regards to balance sheet runoff, the fact that inflation remained within expectations seems to have hurt the dollar. Meanwhile, the CME Group's FedWatch Tool shows that markets are pricing a 21.2% chance of the Fed leaving its policy rate unchanged in March, compared to 17.9% on Wednesday.
US Consumer Inflation Soars: Federal Reserve March rate hike looms.
EUR/USD rose sharply on Wednesday and broke above 1.1400. The pair was last seen trading at its highest level since mid-November at 1.1450.
GBP/USD closed the previous two trading days in the positive territory and gained more than 100 pips in that period. The pair continues to push higher in the early European session and holds comfortably above 1.3700.
USD/JPY dropped to 114.50 area but the benchmark 10-year US Treasury bond yield is posting modest daily gains around 1.75% on Thursday, limiting the pair's losses for the time being.
After breaking above $1,800 earlier in the week, gold registered impressive gains on Tuesday and continues to edge higher on Wednesday. Early Thursday, XAU/USD is moving sideways above $1,820.
Bitcoin gained more than 2% for the second straight day on Wednesday but seems to have lost its bullish momentum near $44,000. Ethereum extended its rebound on Wednesday and rose 4% before turning quiet around $3,330.
According to FX Strategists at UOB Group, USD/JPY faces extra losses on a close below 114.30.
Key Quotes
24-hour view: “We highlighted yesterday that ‘the underlying tone still appears to be on the soft side and we continue to see chance for USD to dip below 115.00’. Instead of dipping below 115.00, USD plunged to a low of 114.36 before settling on a soft note at 114.63 (-0.56%). The rapid decline appears to be overdone but there is room for USD to test 114.30. The next support at 114.00 is not expected to come into the picture. On the upside, a breach of 115.10 (minor resistance is at 114.85) would indicate that the current weakness has stabilized.”
Next 1-3 weeks: “Two days ago (11 Jan, spot at 115.20), we held the view that the recent USD strength has come to an end and we expected USD to trade between 114.55 and 115.90. Yesterday (12 Jan), USD dropped below 114.55 (low of 114.36). Downward momentum is beginning to improve but USD has to close below 114.30 before a sustained decline can be expected. The prospect for USD to close below 114.30 would remain intact as long as USD does not move above 115.35 (‘strong resistance’ level) within these couple of days. Looking ahead, the next support below 114.30 is at 114.00.”
CME Group’s advanced prints for natural gas futures markets noted open interest rose for the fourth session in a row on Wednesday, now by around 35.6K contracts, the largest single-day build so far this year. Volume, in the same direction, increased sharply by around 282.6K contracts, reversing the previous day’s drop.
Natural gas now looks to $5.00
Prices of natural gas rose nearly 15% on Wednesday to the vicinity of the $5.00 mark per MMBtu, levels last seen in late November. The sharp move was accompanied by higher open interest and volume, which is supportive of extra gains in the very near term. That said, the key $5.00 mark remains the next magnet for bulls in the very near term at least.
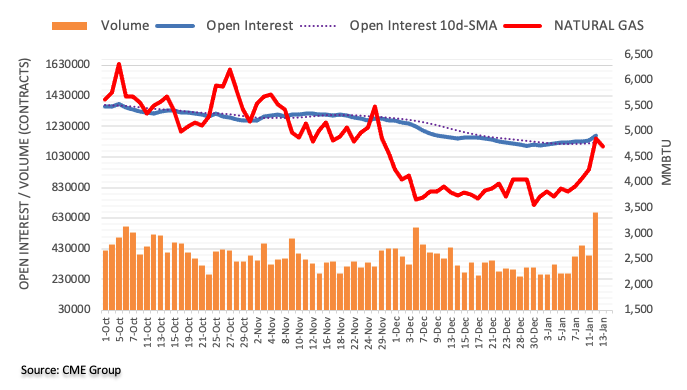
The options market turns retains bullish bias on the NZD/USD for the third consecutive day heading into Thursday’s European session, per the latest weekly data from Reuters.
That said, one-month risk reversal (RR) of NZD/USD, a gauge of calls to puts, prints +0.013 levels at the latest, per data source Reuters.
It’s worth noting that the NZD/USD prices do track the bullish signals flashed by options markets but struggle for fresh clues after the previous day’s heavy run-up, like all other G10 currency pairs. Hence, today’s Fedspeak and US PPI will be important for the pair traders amid a lack of major data/events.
The Kiwi pair seesaws around 0.6855 after refreshing the highest levels last seen on December 24.
Read: NZD/USD hits wall of resistance near 0.6860 on sluggish yields, Fedspeak eyed
- USD/JPY was seen consolidating the overnight post-US CPI slide to a near three-week low.
- Rebounding US bond yields helped ease the USD bearish pressure and extended support.
- The cautious mood underpinned the safe-haven JPY and capped any meaningful recovery.
The USD/JPY pair oscillated in a narrow range above mid-114.00s heading into the European session and consolidated the overnight slide to a near three-week low.
Following an early uptick to the 115.45 area, the USD/JPY pair witnessed aggressive selling on Wednesday amid the post-US CPI broad-based US dollar sell-off. The data reaffirmed expectations that the Fed will begin raising interest rates in March, though was not deemed worrying enough to change an already hawkish outlook and weighed heavily on the buck.
As investors digest a surge in the US consumer prices, the greenback found some support amid a goodish rebound in the US Treasury bond yields. This, in turn, was seen as a key factor that extended some support to the USD/JPY pair. That said, the cautious market mood benefitted the safe-haven Japanese yen and kept a lid on any meaningful recovery, at least for now.
Meanwhile, the USD/JPY pair's inability to gain any meaningful traction suggests that the near-term bearish trend might still be far from being over. A subsequent slide below the overnight swing low, around the 114.40-35 area, will reaffirm the negative outlook and pave the way for an extension of the recent pullback from a five-year high touched on January 4.
Traders now look forward to the US economic docket, featuring the Producer Price Index (PPI) and the usual Weekly Initial Jobless Claims later. This, along with Fed Governor Lael Brainard's testimony on her nomination as Vice Chair and the US bond yields, will influence the USD. Apart from this, the broader market risk sentiment might provide some impetus to the USD/JPY pair.
Technical levels to watch
- USD/CAD seesaws around multi-day low, pauses two-day downtrend.
- Bearish MACD signals, 100-DMA break favor sellers to aim for ascending support line from June.
- 38.2% Fibonacci retracement level guards immediate upside, monthly peak acts as additional resistance.
USD/CAD dribbles around 1.2500 ahead of Thursday’s European session, following a two-day south-run to poke the lowest levels since mid-November. In doing so, the Loonie pair clings to the 200-DMA by the press time
It’s worth noting that a clear downside break of the 100-DMA and bearish MACD joins downbeat RSI, not oversold, to keep USD/CAD sellers hopeful of extending the latest weakness.
As a result, the 50% Fibonacci retracement level of June-December 2021 upside, around 1.2485 and a 7.5-month-old support line near 1.2450 are nearby targets for the pair sellers.
However, the pair’s sustained weakness past 1.2450 will aim for the 61.8% Fibo. level and October’s low, respectively around 1.2375 and 1.2290.
On the flip side, the 38.2% Fibonacci retracement level of 1.2600 restricts the short-term rebound of the USD/CAD prices ahead of highlighting the 100-DMA, surrounding 1.2625 at the latest.
Furthermore, the quote’s rise past 1.2625 enables the bulls to aim for the monthly top close to 1.2815.
Overall, USD/CAD has further downside scope but the RSI line approaches the oversold territory and may restrict the quote’s declines around the key support line.
USD/CAD: Daily chart
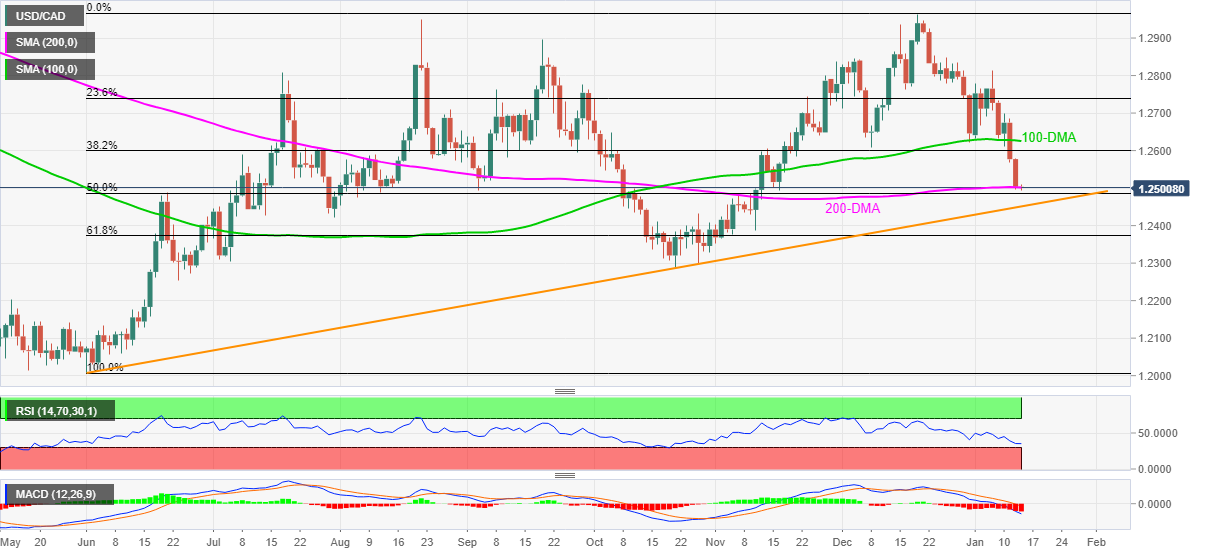
Trend: Further weakness expected
The upside momentum in NZD/USD could now push the cross to, initially, the 0.6885 level ahead of 0.6905, noted FX Strategists at UOB Group.
Key Quotes
24-hour view: “We highlighted yesterday that ‘upward momentum has not improved by much’ and we were of the view that ‘the bias is for NZD to head higher to 0.6805’. We did not anticipate the surge in momentum as NZD blew past 0.6805 and soared to 0.6859. Further NZD strength is not ruled but overbought conditions suggest that 0.6900 is likely out of reach for today (there is another resistance at 0.6885). Support is at 0.6830 followed by 0.6805.”
Next 1-3 weeks: “While we noted yesterday (12 Jan, spot at 0.6785) that downward momentum has fizzled out, we expected NZD to trade within a range of 0.6735/0.6835. However, NZD surged above 0.6835 during NY hours (high of 0.6859). The rapid improvement in momentum indicates that NZD could advance further. Resistance is at 0.6885 followed by 0.6905. A breach of 0.6785 (‘strong support’ level) would invalidate our view.”
Open interest in crude oil futures markets extended the uptrend in place since the beginning of the new year on Wednesday, this time by around 22.6K contracts as per flash data from CME Group. Volume followed suit and increased by around 46.7K contracts, reaching the second straight daily build.
WTI flirts with overbought levels
Prices of the barrel of the WTI rose further on Wednesday and consolidated the breakout of the key $80.00 mark. The daily uptick was amidst increasing open interest and volume, opening the door to the continuation of the leg higher although not without some caution, as the commodity gradually approaches the overbought territory, as per the daily RSI neat the 70.0 yardstick.
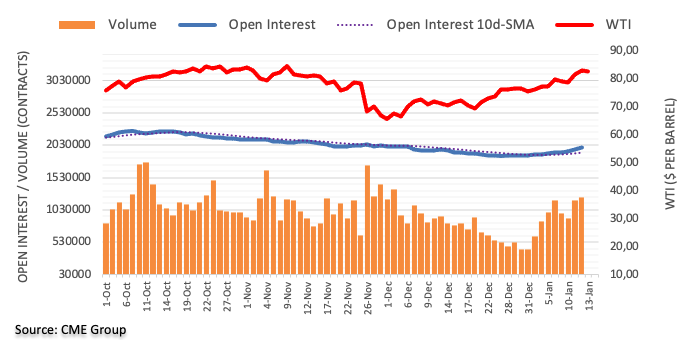
- Asian equities grind lower as market fears Fed action following 40-year high US inflation.
- Australia, Britain report all-time high daily infections, Tokyo pushes up virus-led alert level.
- US proposes more UN Security Council sanctions on North Korea for missile tests.
Asia-Pacific markets fail to track Wall Street gains as investors fear stiff monetary policies ahead. Also challenging the sentiment are issues concerning the coronavirus and geopolitics that together drowns risk appetite during early Thursday. However, a lack of major data and sluggish yields limit losses heading into the European session.
A 40-year high US inflation figure propels the US Treasury yields, after an initially negative reaction. In addition to the 7.0% YoY figures of the US Consumer Price Index (CPI) for December, hawkish Fedspeak also inflates odds of a rate hike in March.
Elsewhere, Australia and the UK print all-time high daily covid infections while Japan’s COVID-19 cases rose to a four-month high, which in turn pushed Tokyo towards the second highest virus alert level.
It’s worth noting that the US proposal of levying extra sanctions on North Korea, for a slew of missile tests in recent days, also contributes to the risk-off mood.
Amid these plays, MSCI’s index of Asia-Pacific shares outside Japan drops 0.20% whereas Japan’s Nikkei 225 declines 1.0% by the press time.
Further, Australia’s ASX 200 rises 0.50% as PM Morrison sounds hopeful of overcoming the virus conditions and announced an easing of activity restrictions for close contacts to tackle supply crunch. India’s BSE Sensex is also on the same line as the economy battles a jump in the virus cases ahead of the national budget announcement, up for publishing on February 01.
Additionally, stocks in China drown Hong Kong, Indonesia and South Korean markets while S&P 500 Futures also print mild losses by the press time. That said, the US Treasury yields snap the recent downtrend as traders await more clues to confirm hawkish expectations from the Fed.
Looking forward, the Fed policymakers’ speeches will be crucial for near-term market direction as they approach the blackout period before the monetary policy meeting, during January 25-26. Also important will be the US Producer Price Index (PPI) for December and weekly jobless claims.
Read: US Treasury yields lick post US inflation wounds amid hawkish Fedspeak
In opinion of FX Strategists at UOB Group, GBP/USD remains poised to visit the 1.3740 region ahead of 1.3800 in the short-term horizon.
Key Quotes
24-hour view: “We highlighted yesterday that ‘solid upward momentum suggests GBP could continue to rise towards 1.3660’. We added, ‘the next resistance at 1.3700 is likely out of reach for today’. The subsequent GBP strength exceeded our expectations as it surged to a high of 1.3715 during NY session. While GBP could strengthen further today, overbought conditions suggest a slower pace of advance and a sustained rise above 1.3740 appears unlikely (next resistance is at 1.3800 is not expected to come into the picture for today). On the downside, a breach of 1.3650 (minor support is at 1.3670) would indicate that the current GBP strength is ready to take a break.”
Next 1-3 weeks: “We have expected a stronger GBP since late last week. In our latest narrative from yesterday (12 Jan, spot at 1.3635), we highlighted that ‘further GBP strength is likely’ and ‘the next resistance is at 1.3660 followed by 1.3700’. Our view was correct even though we did not quite expect the rapid manner by which GBP rush above 1.3700 (high of 1.3715). While the rapid rise is overbought, further GBP strength would not be surprising. That said, overbought conditions suggest a slower pace of advance. The next resistance is at 1.3740 followed by 1.3800. Overall, the current GBP is intact as long as it does not move below 1.3620 (‘strong support’ level was at 1.3560 yesterday).”
According to preliminary readings from CME Group for crude oil futures markets, traders added nearly 4K contracts to their open interest positions on Wednesday, extended the uptrend for the third session in a row. In the same line, volume went up for the second straight day, this time by around 11.8K contracts.
Gold still targets the $1,830 region
Prices of the gold extended the uptrend for yet another session on Wednesday. The recent surpass of the key $1,800 mark looks convincing and Wednesday’s uptick was in tandem with rising open interest and volume. Against this, further gains seem favoured in the very near term with the immediate target at the key resistance area around $1,830 per ounce troy.
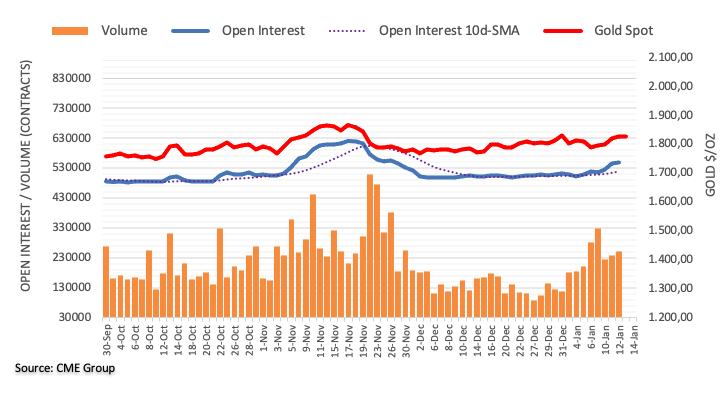
FX Strategists at UOB Group now see EUR/USD testing the 1.1470 level in the next weeks.
Key Quotes
24-hour view: “While we expected EUR to ‘move above 1.1395’ yesterday, we highlighted that ‘it is left to be seen if it can maintain a foothold above this major resistance level’. However, EUR blew past 1.1395 before closing on a strong note at 1.1442 (+0.69%). Solid upward momentum suggests that EUR could strengthen further to 1.1470. The next resistance at 1.1515 is however, likely out of reach. Support is at 1.1420 followed by 1.1395.”
Next 1-3 weeks: “Yesterday (12 Jan, spot at 1.1370), we highlighted that EUR ‘appears poised to move above 1.1395’. We added, ‘a clear break of this level could lead to an advance towards 1.1440’. While our view for a break of 1.1395 was correct, we did not quite expect the rapid manner by which EUR soared above 1.1440 (high of 1.1452). The solid build-up in momentum coupled with the break of the strong resistance at 1.1395 indicates that EUR is likely to continue to march higher. The next resistance is at 1.1470 followed by 1.1515. The current EUR strength is intact as long as it does not move below the ‘strong support’ level at 1.1370 (level was at 1.1315 yesterday).”
Analysts at Australia and New Zealand Banking Group (ANZ) came out with a preview of India’s FY 2022-23 annual budget, to be announced on February 01, 2022.
The investment expects, “The central government to clock a fiscal deficit of 6.6% of GDP in FY22, lower than the budgeted 6.8%.”
Key highlights
FY22 has been fortuitous for India’s fiscal health as the rebound in nominal GDP beat expectations, and also fed into high tax buoyancy that will help cover additional spending and a shortfall in disinvestment receipts.
However, the tide could turn in FY23 as both GDP growth and tax buoyancy are expected to normalize, while the economy will still need fiscal handholding amid private sector weakness.
A fine balancing act between fiscal retreat and economic recovery is thus needed. An elevated borrowings program alongside a challenging economic and financial market backdrop could pressure yields higher, although this will likely be within the RBI’s tolerance threshold.
Also read: USD/INR Price News: Doji around 78.6% Fibo. underpins Indian rupee pullback towards 74.00
“I'd be open to more than three rate hikes this year if that's required,” Patrick Timothy Harker, President of the Federal Reserve Bank of Philadelphia said on Thursday.
Additional comments
“7% inflation is very high, very bad.”
“We can do something. by hiking rates.”
“Would support fewer rate hikes if inflation does in fact start to come down.”
“Currently have three rate hikes in for this year, open to starting in March.”
Market reaction
The US dollar index is keeping its recovery mode intact just below 95.00, unable to gain traction despite the risk-off mood.
- Silver grinds higher around weekly high after positing the biggest daily gains in a month.
- 100-DMA, descending trend line from November 26 restricts immediate upside.
- Bullish MACD signals, clear break of two-month-old resistance keep buyers hopeful.
Silver (XAG/USD) traders jostle around the multi-day top while defending $23.00 heading into Thursday’s European session. The bright metal picks up bids to $23.20 by the press time.
That said, silver prices jumped the most since mid-December the previous day after crossing a downward sloping trend line from November 16.
Although bullish MACD signals join the previous resistance break to favor buyers, a convergence of the 100-DMA and a seven-week-old descending trend line challenges the XAG/USD bulls around $23.30.
It’s worth noting that the last monthly peak near $23.45 acts as an extra hurdle to the north before directing the buyers towards the $23.00 threshold.
Meanwhile, pullback moves may aim for the resistance-turned-support line near $22.95.
However, any further weakness will recall the silver sellers targeting the early December peaks near $22.60 and the monthly low near $21.95.
To sum up, silver prices are likely to stay firmer but need validation from $23.30.
Silver: Daily chart
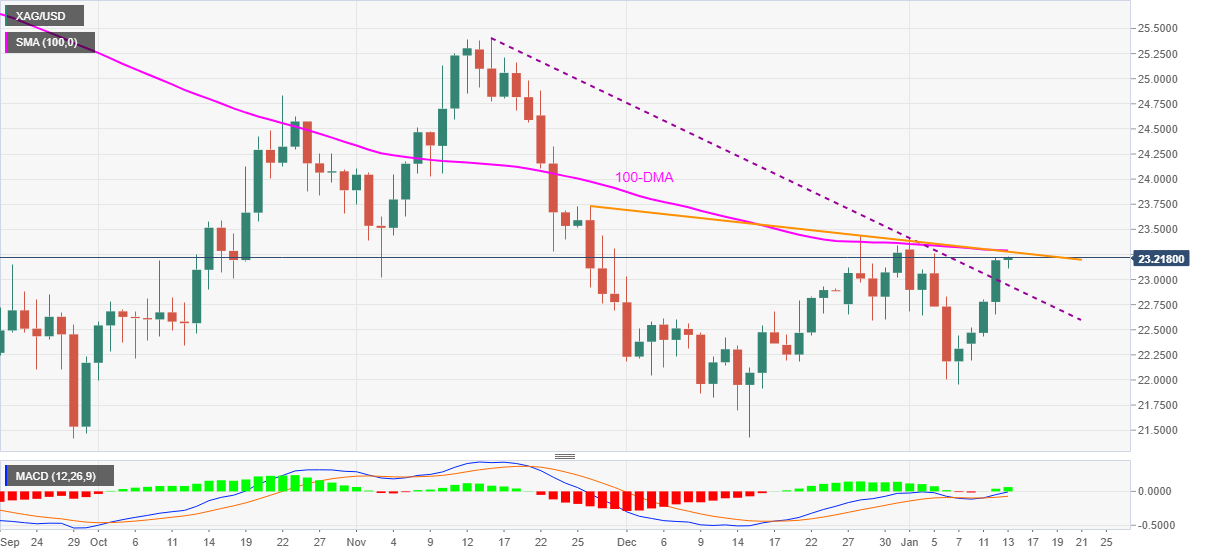
Trend: Further upside expected
- AUD/USD ticks up to refresh multi-day high during thee-day uptrend.
- Aussie PM Morrison said preventing everyone from getting the virus is not the objective, slams covid parties.
- Market sentiment dwindles post US inflation, ignores hawkish Fed comments.
- Fedspeak, US PPI eyed for fresh impulse, virus updates are the key too.
AUD/USD recently marked an uptick to print the fresh high since mid-November, around 0.7295, heading into Thursday’s European session.
The pair’s latest strength took clues from Australia Prime Minister Scott Morrison’s speech after the national cabinet meeting. The national leader crossed wires, via ABC News, after Australia refreshed record top infections and the supply chain constraints, as well as issues linked to virus testing kits, unearthed.
While conveying the cabinet decision to give concessional access for RAT kits, Aussie PM Morrison said, “Preventing everyone from getting the virus is not the objective,” while adding, “What we’re trying to achieve is to ensure that we can keep hospitals under the least pressure they can possibly be put on them.” The Australian leader also criticized covid parties while announcing the easing of restrictions for close contacts.
Elsewhere, recently hawkish comments from the Fed policymakers fail to lift the US dollar as markets remain divided over the US central bank’s next move considering the latest inflation data. US CPI jumped to the highest levels since 1982 while matching 7.0% YoY forecasts, up from 6.8% previous readouts. The monthly figures rose to 0.5% versus 0.4% expected but softened below 0.8% prior.
It should be noted, however, that virus woes and geopolitical tensions, especially concerning Iran, North Korea and China, challenge the AUD/USD prices of late.
That said, AUD/USD traders will pay attention to Fed policymakers’ speeches as they approach the blackout period before the monetary policy meeting, during January 25-26. Also important will be the US Producer Price Index (PPI) for December and weekly jobless claims.
Technical analysis
A clear upside break of the 100-DMA level surrounding 0.7290 becomes necessary for the AUD/USD bulls to aim for 61.8% Fibonacci retracement (Fibo.) of October-December downside near 0.7340. Otherwise, a convergence of the 50-DMA and 38.2% Fibo. will lure the sellers to recall 0.7210 on the chart.
- USD/CHF consolidates the biggest daily losses in seven weeks.
- Steady RSI, sustained break of the key support line, 61.8% Fibonacci retracement favor sellers.
- Bears eye five-month-old horizontal support line, buyers have a long and bumpy road ahead.
USD/CHF pares the heaviest daily losses since late November around 0.9145 heading into Thursday’s European session.
The Swiss currency (CHF) pair remains near the lowest levels in over a week while keeping the previous day’s downside break of monthly support line, now resistance near 0.9230, as well as 61.8% Fibonacci retracement (Fibo.) of August-November upside, at 0.9155.
Given the steady RSI and a lack of decisive momentum signals from MACD, the USD/CHF prices are likely to remain pressured until crossing the 0.9155 immediate hurdle.
Even if the quote rise past 0.9155, 50% Fibo. level near the 0.9200 threshold, will challenge the pair buyers before directing them to the support-turned-resistance line surrounding 0.9230.
During the USD/CHF run-up beyond 0.9230, the monthly high of 0.9278 will be in focus.
Alternatively, a horizontal line since August 17, around 0.9100, stays on the USD/CHF bear’s radar.
Following that, August month’s low near 0.9020 and the 0.9000 psychological magnet will gain the seller’s attention.
USD/CHF: Daily chart
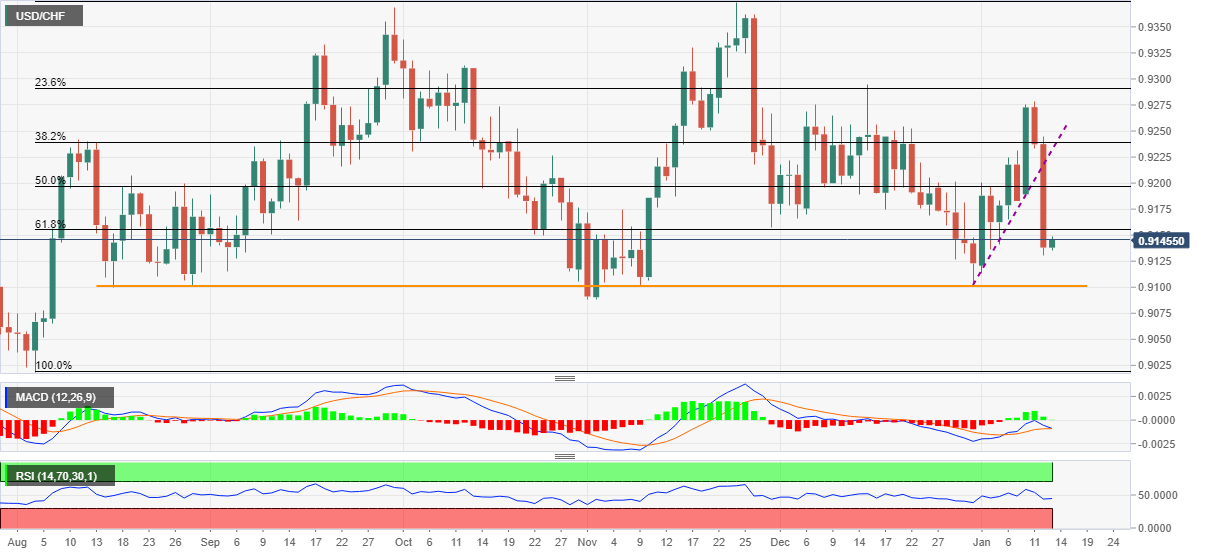
Trend: Further weakness expected
- EUR/USD seesaws around two-month high, pares heaviest daily jump since early December.
- US inflation matched forecasts in December, favoring chatters of less fuel for Fed hawks.
- ECB policymakers stay hopeful despite virus woes, citing mixed concerns over inflation.
- A slew of ECB, Fed members up for speaking today, US PPI, Jobless Claims are important too.
EUR/USD hangs in balance around the highest levels since mid-November during the early Thursday morning in Europe.
The major currency pair jumped the most in five weeks the previous day as the US dollar slumped to a multi-day low as the inflation data matched forecasts, triggering market challenges that the Fed hawks will have less ammunition when they meet on January 25-26.
That said, the US Consumer Price Index (CPI) jumped to the highest levels since 1982 while matching 7.0% YoY forecasts, up from 6.8% previous readouts. The monthly figures rose to 0.5% versus 0.4% expected but softened below 0.8% prior.
However, the Fed policymakers reiterated their bullish bias following the inflation data release, which in turn has been challenging EUR/USD bulls of late. Federal Reserve Bank of St. Louis President James Bullard was the first among them who said, per Wall Street Journal (WSJ), “Four rate hikes in 2022 now appear to be on the table and, in the face of high inflation, a rate hike in March seems likely.”
Following that, a member of the Fed Board of Governors and incoming Vice Chairman of the FOMC Lael Brainard also mentioned, “Inflation control is Fed's most important task,” whereas President and CEO of the Federal Reserve Bank of San Francisco Mary Daly signaled a rate hike as early as March.
On the other hand, European Central Bank (ECB) policymaker Francois Villeroy de Galhau said, “We are very near to the peak in inflation.” It’s worth noting that the Eurozone Industrial Production jumped 2.3% MoM in November versus 0.5% forecasts and -1.3% revised prior.
Given the recently escalating pressure on the Fed policymakers, the bond yields are consolidating the previous losses, which in turn challenge the equity futures and riskier assets. However, a slew of policymakers from the European Central Bank (ECB) and the Fed are up for speaking on Thursday, which in turn will offer an active day for the EUR/USD traders. In addition to the monetary policy signals, the US Producer Price Index (PPI) for December and weekly jobless claims, as well as European Economic Bulletin, will also direct short-term pair moves.
To sum up, the recent inflation data solidifies the ECB v/s Fed drama even as the Fed has an upper hand over the bloc’s central bank. As a result, the EUR/USD prices may witness a pullback should the balance tilt in favor of the Fed hawks.
Technical analysis
A clear upside break of a descending trend line from May, around 1.1410 by the press time, joins bullish MACD signals to direct buyers towards the 100-DMA level of 1.1510.
- Gold bulls take a breather before resuming the post-US inflation uptrend.
- US inflation confirms a March Fed rate hike, DXY traders ‘sell the fact’.
- Gold 2022 Outlook: Correlation with US T-bond yields to drive yellow metal.
Gold price is consolidating near weekly highs, as the US dollar attempts a bounce in tandem with the Treasury yields this Thursday. The greenback got smashed on ‘sell the fact’ trading after the 7% rise in the US annualized inflation in December cemented a March Fed rate hike, which was almost priced in by the market. Despite the pullback in gold price, the upside bias remains intact, courtesy of a bullish technical setup on the daily chart.
Read: US Consumer Inflation Soars: Federal Reserve March rate hike looms
Gold Price: Key levels to watch
The Technical Confluences Detector shows that the gold price needs to crack strong resistance at $1,826, the Fibonacci 23.6% one-day.
The next critical upside hurdle is pegged at the previous month high of $1,831, above which bulls will aim for the pivot point one-day R2 at $1,837.
A firm break above the latter will open gates for a rally towards the pivot point one-day R3 at $1,845.
On the flip side, the Fibonacci 38.2% one-day at $1,821 is seen capping immediate pullbacks.
The confluence of the SMA10 four-hour, pivot point one-day S1 and Fibonacci 61.8% one-day at $1,819 will be on the sellers’ minds.
Further down, the previous day’s low of $1,815 could be retested, opening floors for a test of $1,812, where the Fibonacci 23.6% one-month and Fibonacci 61.8% one-week coincide.
Here is how it looks on the tool
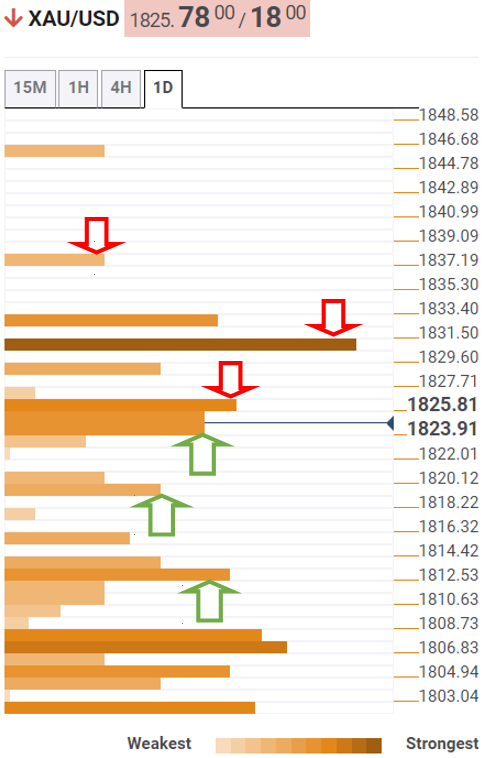
About Technical Confluences Detector
The TCD (Technical Confluences Detector) is a tool to locate and point out those price levels where there is a congestion of indicators, moving averages, Fibonacci levels, Pivot Points, etc. If you are a short-term trader, you will find entry points for counter-trend strategies and hunt a few points at a time. If you are a medium-to-long-term trader, this tool will allow you to know in advance the price levels where a medium-to-long-term trend may stop and rest, where to unwind positions, or where to increase your position size.
- GBP/USD seesaws around 11-week high, pauses two-day uptrend.
- UK’s Truss meets EU’s Sefcovic, Trade Secretary Trevelyan to push for post-Brexit free-trade deal with India.
- Britain prints record infections, UK PM Johnson rejects resignation demands.
- US inflation couldn’t propel greenback but today’s Fedspeak may do.
Having jumped the most in three weeks, GBP/USD steadies around 1.3710 during early Thursday.
The cable pair cheered broad US dollar weakness post-inflation release to print the notable run-up. However, cautious sentiment ahead of the key Brexit talks and recently hawkish Fedspeak challenge the bulls of late.
US CPI jumped to the highest levels since 1982 while matching 7.0% YoY forecasts, up from 6.8% previous readouts. The monthly figures rose to 0.5% versus 0.4% expected but softened below 0.8% prior.
Following that US inflation data, Federal Reserve Bank of St. Louis President James Bullard said, per Wall Street Journal (WSJ), “Four rate hikes in 2022 now appear to be on the table and, in the face of high inflation, a rate hike in March seems likely.”
On the same line were comments from the member of the Fed Board of Governors and incoming Vice Chairman of the FOMC Lael Brainard who said, “Inflation control is Fed's most important task. Additionally, President and CEO of the Federal Reserve Bank of San Francisco Mary Daly signaled a rate hike as early as March.
It is worth noting that the worsening virus conditions also challenge GBP/USD bulls. “Covid-19 infections in the UK climbed to a new record high in the first week of the year, though levels dropped slightly in London, new figures show,” per The Independent. The news also mentioned, “An estimated 4.3 million people in private households across the UK had Covid-19 in the seven days to January 6, up from 3.7 million in the previous week.”
Elsewhere, politics also plays its role to challenge GBP/USD buyers as UK PM Boris Johnson accepts mistakes of holding a booze party during the early pandemic days. However, the Tory leader refrains to step aside even as some of the key politicians demand.
Against this backdrop, US 10-year Treasury yields add 2.5 basis points (bps) to regain 1.755 level whereas the 2-year counterpart rises 1.6 bps to 0.923% by the press time. Further, S&P 500 Futures drop 0.20% intraday after the Wall Street benchmarks closed with mild gains.
Looking forward, UK’s Brexit Minister Liz truss will host European Commission Vice President Maros Sefcovic at the foreign secretary’s country residence, Chevening House, on Thursday, per Bloomberg. “UK Foreign Secretary Liz Truss enters the latest round of post-Brexit negotiations over Northern Ireland, facing a choice between picking a fight with the European Union that would curry favor with her Conservative Party faithful or cutting a deal to avert a trade war,” adds the news.
Bloomberg also quotes the British Trade Secretary Anne-Marie Trevelyan’s India visit for talks on an agreement that Britain hopes will help double its trade with India by 2030.
While UK-India news may have little impact on the GBP/USD prices, fears of a negative start to Truss’ Brexit career can drag the quote downwards.
Other than the Brexit talks, the US Producer Price Index (PPI) for December and weekly jobless claims, as well as Fedspeak, will be important to track as well.
Technical analysis
Sustained run-up beyond the previous resistance lines from July and June, respectively around 1.3680 and 1.3600, keeps GBP/USD buyers hopeful. However, overbought RSI conditions may test the immediate run-up until crossing the October tops near 1.3835.
- WTI steps back from multi-day high, pressured around intraday low.
- Overbought RSI triggers pullback but three-week-old support line, 23.6% Fibonacci retracement limits immediate downside.
- Multiple levels since late October restricts immediate upside.
WTI crude oil buyers take a breather after a two-day uptrend near the highest level since early November. That said, the US oil benchmark drops 0.25% intraday while taking rounds to $81.90 of late.
Overbought RSI conditions triggered the WTI pullback from a multi-day high. However, the commodity’s further weakness remains doubtful until its stays beyond the $79.50 support confluence, comprising ascending trend line from December 21 and 23.6% Fibonacci retracement of August-October 2021 upside.
In a case where WTI drops below $79.50, January 10 swing low near $78.00 should return to the chart. Though, a convergence of the previous resistance line from October, a six-week-old upward sloping trend line and 38.2% Fibo level, near $76.15, becomes a tough nut to crack for the bears.
Meanwhile, the quote’s further upside will wait for the fresh multi-day high, currently around $82.50, before challenging a three-month-long horizontal area near $83.50-84.00.
Should oil prices rally past $84.00, the latest high surrounding $85.00 and the $90.00 psychological magnet will be on the trader’s radar.
To sum up, oil prices retreat but the bulls are not out of the woods yet.
WTI: Daily chart
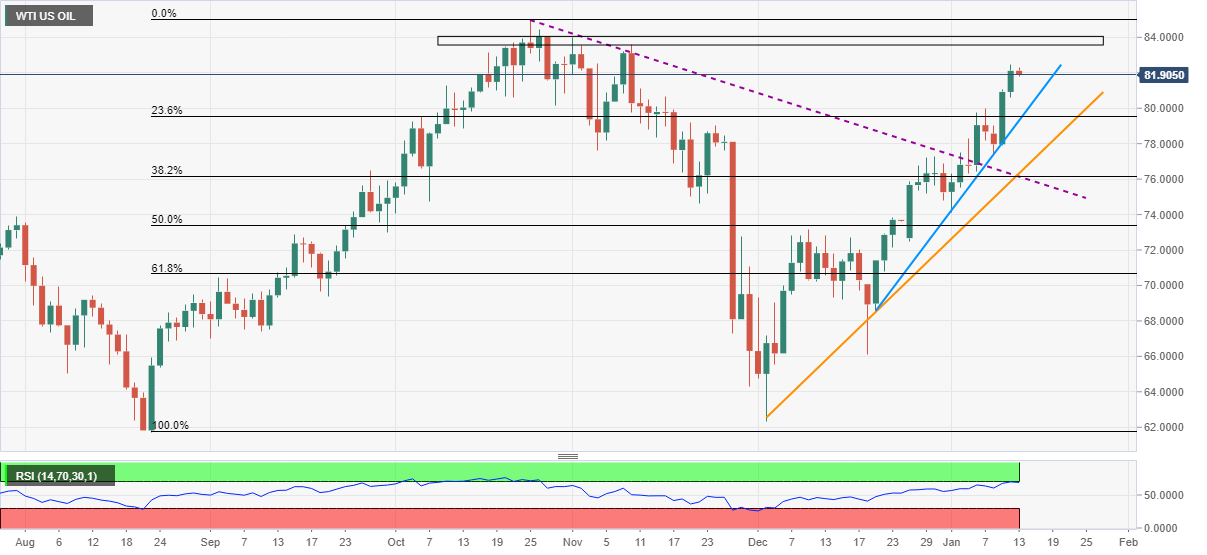
Trend: Pullback expected
Economists at ABN AMRO bank have brought forward their expectations for the start of interest rate hikes by the Fed from June to March while predicting balance-sheet run-off to kick in soon after.
Key quotes
“Following further unexpectedly strong labor market data last Friday, and a number of Fed speakers (Barkin and Bostic) since showing openness to a March interest rate rise, we have brought forward our expectation for the start of rate hikes from June previously.“
“Following a 25bp hike in March, we continue to expect the Fed to hike at a quarterly pace until it reaches the pre-pandemic target range of 1.50-1.75%, but this is now expected to be reached one quarter sooner – in Q2 2023. As such, we now expect four hikes in 2022, up from three previously, while we continue to expect three hikes in 2023.”
“With the December FOMC minutes last week providing confirmation that the Fed is likely to take a more aggressive approach to winding down its balance sheet, we now expect this to begin soon after the March lift-off, perhaps as soon as May.”
“Initially, we expect this new round of QT to start at a slow pace of $15bn per month, with the pace doubling each month until it reaches a $60bn per month pace (this amount includes both Treasuries and MBS; the Treasury portion being c.$40bn).”
Analysts at Societe Generale offer a sneak peek at what they expect from Bank Indonesia, on the policy front, for 2022.
Key quotes
“Indonesia's December headline inflation touched an 18-month high of 1.9% and we expect it to inch up from here and move toward its median target of 3.0% in 2022.”
“BI's monetary policy action is majorly influenced by the triumvirate of dollar exchange rate, bond yield and foreign ownership - not surprising for a country used to a high foreign ownership of government bonds to finance the deficit.”
“However, since the pandemic and amid a substantial drop in foreign ownership of bonds (outflows of $10.6bn since early 2020), BI embarked on a debt monetisation scheme as public expenditure soared. From BI's perspective, while the currency's stability may be comforting, this is mainly the result of high commodity prices and weak economic activity. “
“We expect BI to keep the policy rate unchanged at 3.5% in January.”
“However, we believe that the central bank would need to follow the Fed to maintain the attractiveness of real yields as support from foreign bond holders is likely to become crucial once BI starts normalizing its balance sheet.”
“We bring forward our rate hike expectation from 3Q22 to 2Q22 and now expect two rate hikes of 25bp each in 2022 rather than one.”
- GBP/JPY is looking to extend the bullish momentum towards 158.00.
- UK PM Johnson is bearing brunt of violating his government's covid rules.
- Bull flag confirmation on the 1D chart will open doors towards 165.00.
GBP/JPY is advancing towards 158.00, trading close to three-month highs amid a broad meltdown in the US dollar, which overshadowed the brewing UK political turmoil.
At the momentum, the greenback is licking its wound after being smashed on ‘sell the fact’ flows on in-line with expectations US inflation data. The US CPI arrived at 7.0% YoY in December, matching the market consensus.
Mounting political pressures surrounding the 40-year high inflation in America could also be attributed to the dollar’s downfall. This has fuelled the correction in USD/JPY, as it now trades close to 114.50 vs. 115.50 levels seen a day before.
On the GBP-side of the story, the cable is so far resilient to the brewing political turmoil in the UK, especially in light of PM Boris Johnson flouting his government's covid rules, in a garden party during the country’s first lockdown in 2022.
Looking forward, markets will await fresh covid updates from the UK, political developments on both sides of the Atlantic and the US PPI release for fresh trading impetus.
From a short-term technical perspective, GBP/JPY is on the verge of confirming a bull flag breakout on the daily sticks, should the price close the day above the falling trendline resistance of 157.11.
The next upside target is seen at the three-month highs, above which 158.00 will be put to test, opening doors for a rally towards the pattern target measured near 165.00.
The 14-day Relative Strength Index (RSI) is sitting beneath the overbought region, allowing room for more upside.
developing story ...
GBP/JPY daily chart
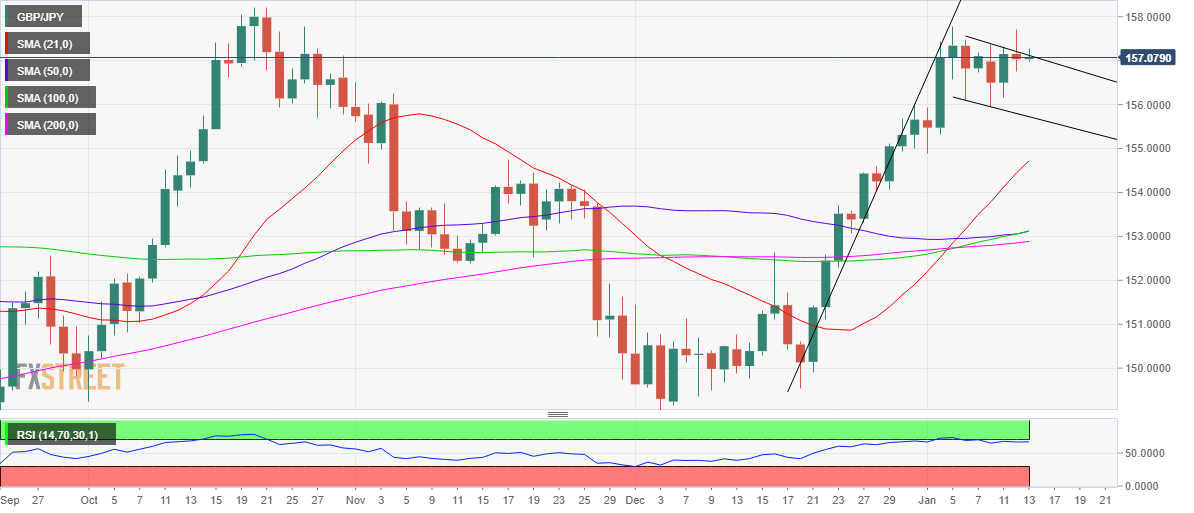
On the flip side, immediate support awaits at Wednesday’s low of 156.76, below which the 156.50 psychological level will be on the sellers’ radars.
The additional downside will expose the falling trendline support at 155.72. That level is the last line of defense for optimists.
GBP/JPY additional levels to watch
| Raw materials | Closed | Change, % |
|---|---|---|
| Brent | 84.75 | 1.05 |
| Silver | 23.143 | 1.66 |
| Gold | 1826.062 | 0.3 |
| Palladium | 1909.42 | -0.33 |
- US Treasury yields pause recent declines, S&P 500 Futures print mild losses.
- US inflation matched hawkish forecasts but market players sold the facts.
- Latest Fedspeak bolsters rate hike concerns ahead of blackout period, virus, geopolitics also test sentiment.
- US PPI, comments from Fed policymakers and second-tier job numbers eyed for fresh impulse.
After portraying a surprise positive reaction to the 40-year high US inflation data, risk appetite wanes during early Thursday. While tracking the catalysts, the recently hawkish comments from the Fed policymakers and geopolitical headlines, coupled with the virus updates, could be found guilty.
US CPI jumped to the highest levels since 1982 while matching 7.0% YoY forecasts, up from 6.8% previous readouts. The monthly figures rose to 0.5% versus 0.4% expected but softened below 0.8% prior.
Following that US inflation data, Federal Reserve Bank of St. Louis President James Bullard said, per Wall Street Journal (WSJ), “Four rate hikes in 2022 now appear to be on the table and, in the face of high inflation, a rate hike in March seems likely.” On the same line were comments from the member of the Fed Board of Governors and incoming Vice Chairman of the FOMC Lael Brainard who said, “Inflation control is Fed's most important task. Additionally, President and CEO of the Federal Reserve Bank of San Francisco Mary Daly signaled a rate hike as early as March.
Elsewhere, “Deputy US Trade Representative (USTR) Jayme White expressed Washington’s ongoing concern about Canada’s proposed digital services tax in talks on Wednesday with Canada’s deputy trade minister, David Morrison,” USTR said in a statement per Reuters.
Furthermore, US Ambassador to the United Nations (UN) Linda Thomas-Greenfield tweeted the proposal to levy extra sanctions on North Korea for the latest slew of missile tests.
Amid these plays, US 10-year Treasury yields add 2.5 basis points (bps) to regain 1.755 level whereas the 2-year counterpart rises 1.6 bps to 0.923% by the press time. Further, S&P 500 Futures drop 0.20% intraday after the Wall Street benchmarks closed with mild gains.
Moving on, the Fed policymakers’ speeches will be crucial for near-term market direction as they approach the blackout period before the monetary policy meeting, during January 25-26. Also important will be the US Producer Price Index (PPI) for December and weekly jobless claims. Should the incoming catalysts keep flashing challenges to market sentiment and support Fed’s faster rate hikes starting from March 2022, US Treasury yields may extend the latest rebound, underpinning the USD recovery and challenging the commodities as well as Antipodeans.
Read: Jerome Powell falters US inflation disaster
While reacting to the six consecutive missile tests by North Korea, US Ambassador Linda Thomas-Greenfield tweeted the US proposal to levy further sanctions on the hermit kingdom to the United Nations (UN) early Thursday.
“On top of today's designations by the US State Department and the US Treasury, the US is proposing United Nations sanctions following North Korea's six ballistic missile launches since September 2021, each of which were in violation of UN Security Council resolution,” tweeted US Ambassador.
The diplomat also mentioned, “Today’s designations by the US State Department and the US Treasury convey our serious concern about North Korea’s continued ballistic missile launches and proliferation activities. We urge all UN Member States to fully implement their obligations under UNSC resolutions.”
FX implications
The news weighs on the market sentiment and triggers a pullback in the commodities, as well as Antipodeans, at the latest.
- USD/INR rebounds from 15-week low, following the previous day’s candlestick formation.
- MACD conditions keep sellers hopeful till the quote stays below 74.75.
- 200-DMA, 61.8% Fibonacci retracement challenges short-term recovery.
USD/INR justifies the Doji candlestick formation at a multi-day low to pick up bids to 73.84, up 0.10% intraday during early Thursday.
The trend reversal suggesting candlestick gains additional attention due to the nearness to the 78.6% Fibonacci retracement (Fibo.) level of September-December 2021 upside, near 73.67.
Even so, bearish MACD signals and sustained trading below a four-month-old support line, now resistance around 74.75, keep USD/INR sellers hopeful.
That said, the latest rebound may aim for the confluence of 200-DMA and 61.8% Fibo. level around 74.30. Also acting as the immediate resistance is the 74.00 threshold.
Meanwhile, a downside break of the 78.6% Fibonacci retracement level near 73.67 will aim for the mid-September lows near 73.35 before directing the quote to the bottoms marked in September and May, respectively around 72.90 and 72.35.
To sum up, USD/INR prices are likely to rebound but the bulls have a long way before retaking the controls.
USD/INR: Daily chart
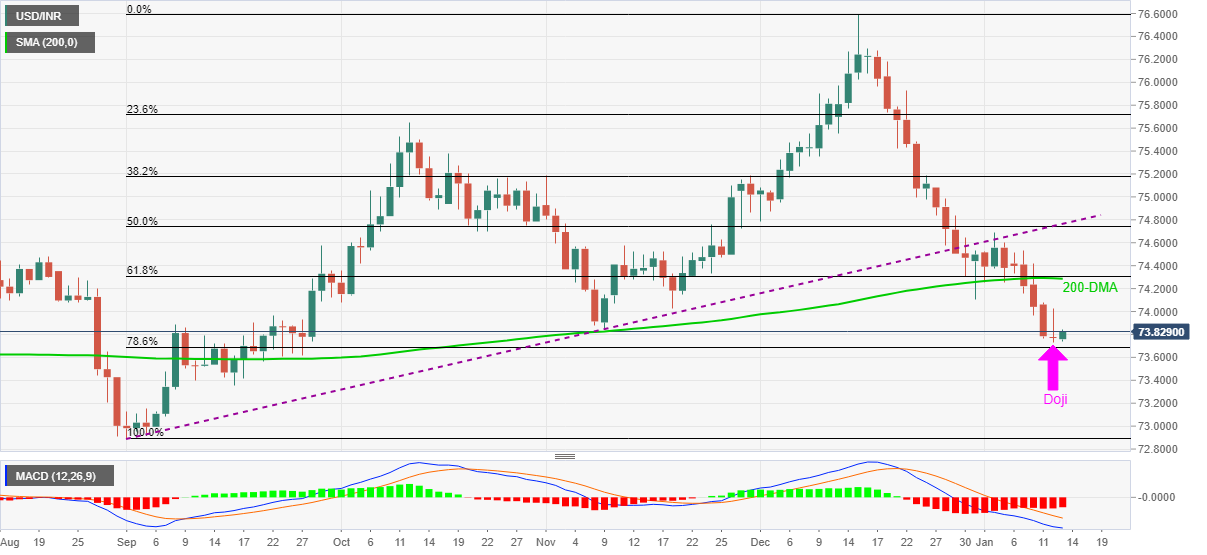
Trend: Short-term recovery expected
- AUD/USD bulls are throwing in the towel as per the hourly chart.
- The bears can target the daily W-formation's neckline.
AUD/USD has risen sharply as the US dollar plummets below critical daily support. However, the W-formation is compelling, especially with the DXY now stabilising at deeper support as follows:
DXY daily chart
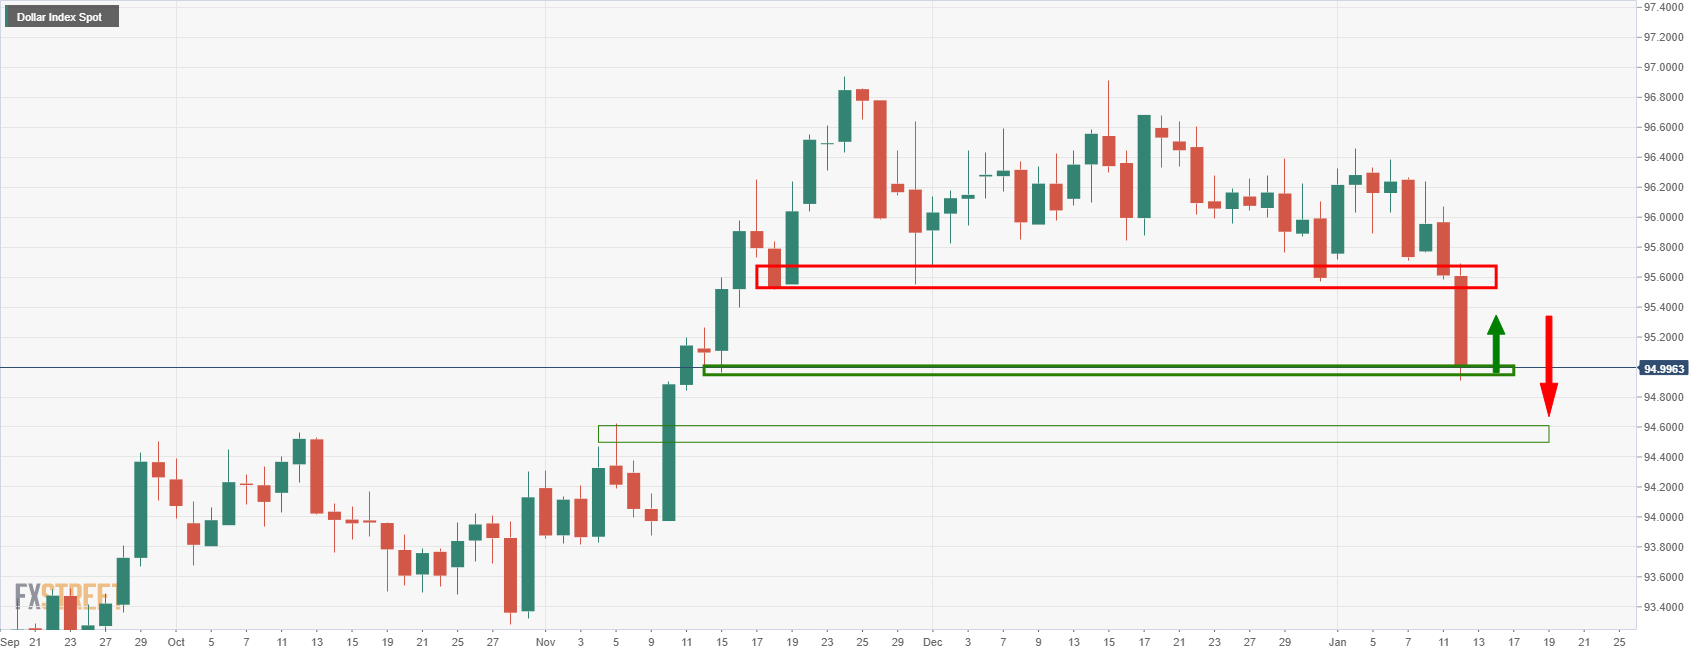
There are prospects f a bullish correction in the US dollar for the sessions ahead.
AUD/USD daily chart
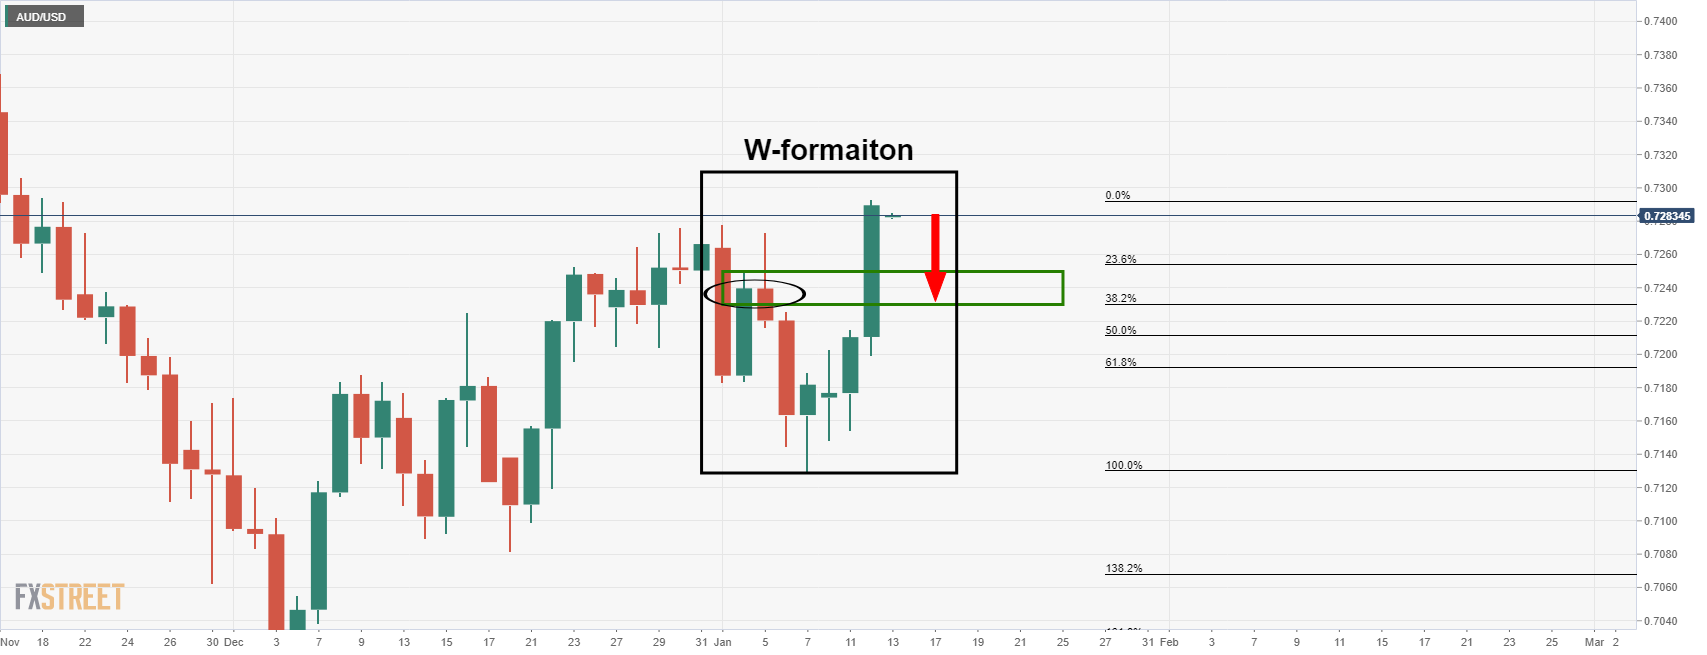
This rhymes with a downside correction in the Aussie as illustrated above. The W-formation is a reversion pattern and there is a high probability that the neckline will be retested as support in due course. This comes in near 0.7235.
AUD/USD H1 chart
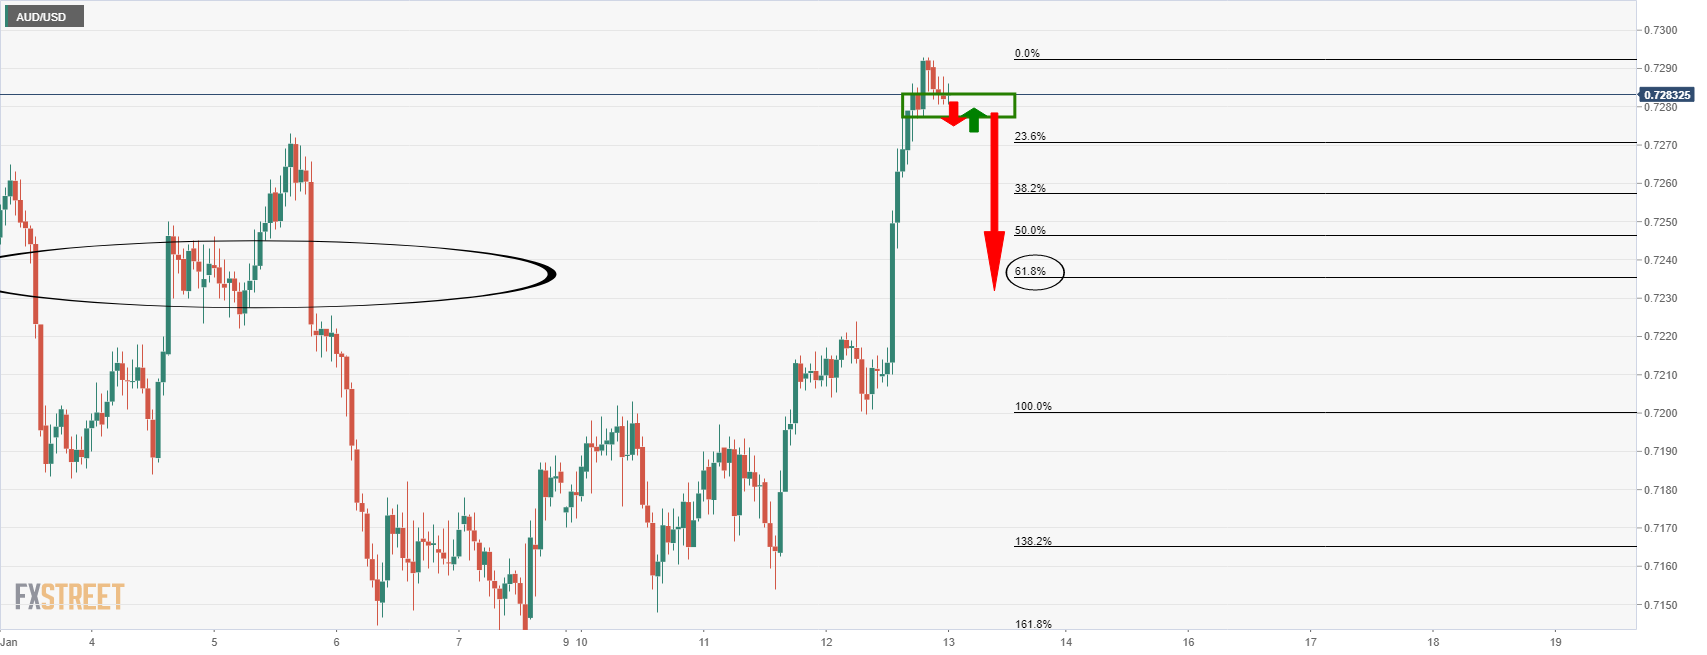
From an hourly perspective if the price breaks support, then the 61.8% Fibonacci retracement that aligns with prior structure and the W-formation's neckline will be eyed.
- USD/TRY remains depressed around weekly low after dropping the most since December 23.
- Turkey’s Erdogan hopes to see benefits of the latest policy measures in summer.
- US dollar slumped as CPI matched forecasts, hawkish Fedspeak restricts immediate downside.
- Turkish Industrial Production, US PPI and Fed policymakers’ speeches will be crucial for intraday direction.
USD/TRY remains on the back foot around $13.20, fails to keep early Asian bounce off weekly low during Thursday’s Asian session.
The Turkish lira (TRY) pair dropped the most since late December the previous day after the US dollar slumped despite 40-year high inflation figures, as well as hawkish Fedspeak.
The reason could be linked to the actual figures matching the forecasts, at 7.0% in December.
Following the US inflation data, Federal Reserve Bank of St. Louis President James Bullard said, per Wall Street Journal (WSJ), “Four rate hikes in 2022 now appear to be on the table and, in the face of high inflation, a rate hike in March seems likely.” On the same line were comments from the member of the Fed Board of Governors and incoming Vice Chairman of the FOMC Lael Brainard who said, “Inflation control is Fed's most important task. Additionally, President and CEO of the Federal Reserve Bank of San Francisco Mary Daly signaled a rate hike as early as March.
At home, Turkish President Recep Tayyip Erdogan promised on Wednesday to tame Turkey's surging inflation, per Reuters. The news also mentioned Erdogan saying, "The swelling inflation is not in line with the realities of our country," while also adding that the government's measures would soon soften the burden of "unjust" price hikes. Additional comments from Erdogan were like routine statements as, “Turkey will bring prices down as soon as possible,” as well as “Hopes to see benefits of economic policy in summer months.”
Against this backdrop, the US Treasury yields improve following the hawkish Fedspeak and the S&P 500 Futures also fail to extend the previous day’s gains amid mixed sentiment.
Looking forward, Turkey’s Industrial Production for November, prior 8.5% YoY, will act as an immediate catalyst for USD/TRY prices whereas US Producer Price Index (PPI) for December and weekly jobless claims will join the Fedspeak will entertain pair traders afterward.
Technical analysis
21-DMA around $13.20 tests the USD/TRY bears cheering a clear downside break of the 10-DMA, near $13.52 at the latest. Also acting as the nearby support is a 50-DMA level of $12.58. It’s worth noting that the quote’s rally past $13.52 isn’t a sure call for the buyers as the $14.00 threshold has been restricting the pair’s upside of late.
| Time | Country | Event | Period | Previous value | Forecast |
|---|---|---|---|---|---|
| 06:00 (GMT) | Japan | Prelim Machine Tool Orders, y/y | December | 64.0% | |
| 13:00 (GMT) | U.S. | FOMC Member Harker Speaks | |||
| 13:30 (GMT) | U.S. | Continuing Jobless Claims | January | 1754 | 1733 |
| 13:30 (GMT) | U.S. | PPI excluding food and energy, m/m | December | 0.7% | 0.5% |
| 13:30 (GMT) | U.S. | PPI excluding food and energy, Y/Y | December | 7.7% | 8% |
| 13:30 (GMT) | U.S. | PPI, y/y | December | 9.6% | 9.8% |
| 13:30 (GMT) | U.S. | PPI, m/m | December | 0.8% | 0.4% |
| 13:30 (GMT) | U.S. | Initial Jobless Claims | January | 207 | 200 |
| 15:00 (GMT) | U.S. | FOMC Member Brainard Speaks | |||
| 18:00 (GMT) | U.S. | FOMC Member Charles Evans Speaks |
In recent trade today, the People’s Bank of China (PBOC) set the yuan (CNY) at 6.3542 vs the previous fix of 6.3658 and prior close of 6.3588.
About the fix
China maintains strict control of the yuan’s rate on the mainland.
The onshore yuan (CNY) differs from the offshore one (CNH) in trading restrictions, this last one is not as tightly controlled.
Each morning, the People’s Bank of China (PBOC) sets a so-called daily midpoint fix, based on the yuan’s previous day closing level and quotations taken from the inter-bank dealer.
- DXY remains sidelined around nine-week low, pauses two-day downtrend.
- Sustained break of previously key supports join bearish MACD signals, downbeat RSI to favor sellers.
- 100-DMA lures short-term bears, tops marked since late September offer strong support.
US Dollar Index (DXY) bears take a breather around multi-day low, making rounds to the 95.00 threshold during Thursday’s Asian session.
The greenback gauge dropped to the lowest levels since November 11 the previous day after breaking two-month-old horizontal support and an ascending trend line from May 25.
The downside break of the key supports join bearish MACD signals and an absence of oversold RSI conditions to favor DXY sellers.
That said, the 100-DMA level near 94.67 can act as immediate support for the US Dollar Index. Though, a horizontal area comprising September’s top near 94.50 becomes a tough nut to crack for the DXY bears.
In a case where the quote drops below 94.50, August month’s high of 93.72 will be in focus.
Meanwhile, the support-turned-resistance line from May, around 95.10, restricts the DXY’s corrective pullback.
Following that, the aforementioned horizontal support, now resistance around 95.55, will precede the 50-DMA level of 95.90 to limit the US Dollar Index advances.
To sum up, DXY is ready for further downside but the key support around 94.50 will be a test for bears.
DXY: Daily chart
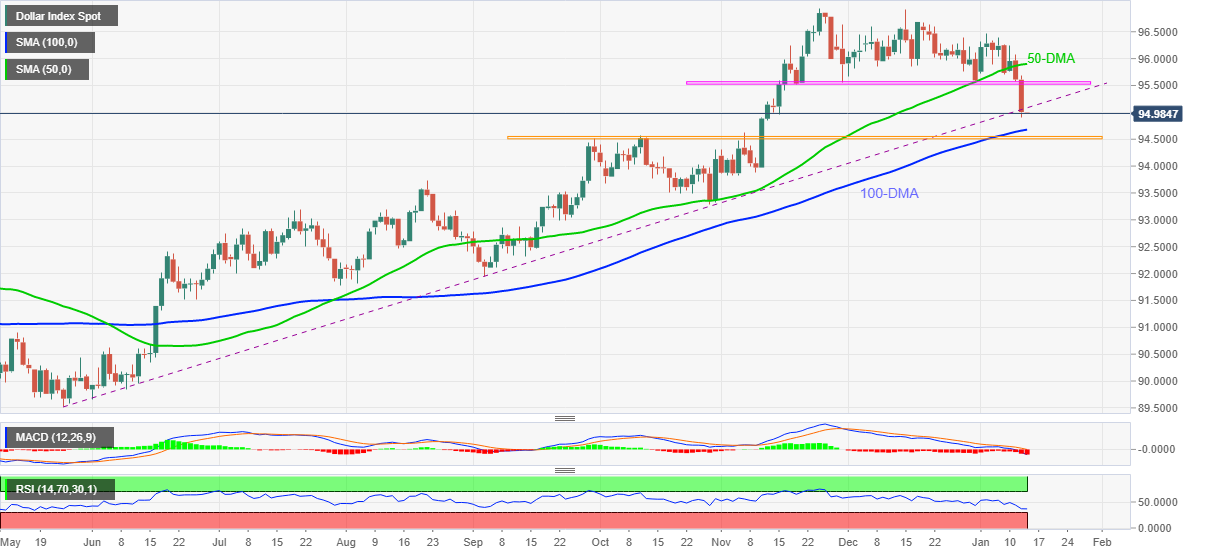
Trend: Further weakness expected
- USD/CAD pauses two-day downtrend near the lowest levels since mid-November.
- Fed policymakers convey inflation fears to reiterate rate hike concerns after US CPI jumped to 40-year high.
- US Trade Official raises concerns over Canadian proposal of Digital Services Tax.
- US PPI, Fedspeak will be important to watch for fresh impulse.
USD/CAD stays defensive around 1.2500, the lowest level in two months, during Thursday’s Asian session.
In doing so, the Loonie pair pauses the two-day downtrend amid recently hawkish Fedspeak and sidelined prices of Canada’s main export item, namely WTI crude oil. It’s worth noting that the Loonie pair’s drop on Wednesday could be linked to the US inflation figure’s matching of market forecasts, despite the refreshing 40-year high.
That said, US CPI jumped to the highest levels since 1982 while matching 7.0% YoY forecasts, up from 6.8% previous readouts. The monthly figures rose to 0.5% versus 0.4% expected but softened below 0.8% prior.
Following that US inflation data, Federal Reserve Bank of St. Louis President James Bullard said, per Wall Street Journal (WSJ), “Four rate hikes in 2022 now appear to be on the table and, in the face of high inflation, a rate hike in March seems likely.” On the same line were comments from the member of the Fed Board of Governors and incoming Vice Chairman of the FOMC Lael Brainard who said, “Inflation control is Fed's most important task. Additionally, President and CEO of the Federal Reserve Bank of San Francisco Mary Daly signaled a rate hike as early as March.
Elsewhere, “Deputy US Trade Representative (USTR) Jayme White expressed Washington’s ongoing concern about Canada’s proposed digital services tax in talks on Wednesday with Canada’s deputy trade minister, David Morrison,” USTR said in a statement per Reuters.
It’s worth observing that the US Treasury yields improve following the hawkish Fedspeak and the S&P 500 Futures also fail to extend the previous day’s gains amid mixed sentiment, which in turn stop the US dollar’s downside and probe oil buyers around a nine-week high past $82.00.
Looking forward, US Producer Price Index (PPI) for December and weekly jobless claims will join the Fedspeak to entertain USD/CAD traders.
Overall, USD/CAD bears are likely to keep the reins but corrective pullback can’t be ruled out amid the recent US-Canada political jitters as well as the broad covid fears.
Technical analysis
Although 200-DMA around 1.2500 challenges the USD/CAD bears targeting an ascending support line from May, near 1.2450, buyers remain away until the quote stays below the 100-DMA level of 1.2625.
- USD/JPY bulls are stepping in to correct the price drop from overnight.
- The 115 area is in focus for the sessions ahead.
USD/JPY is trying to correct the strong bearish drop that occurred overnight and the following illustrate the market structure in a top-down analysis and the potential price flow.
USD/JPY daily charts
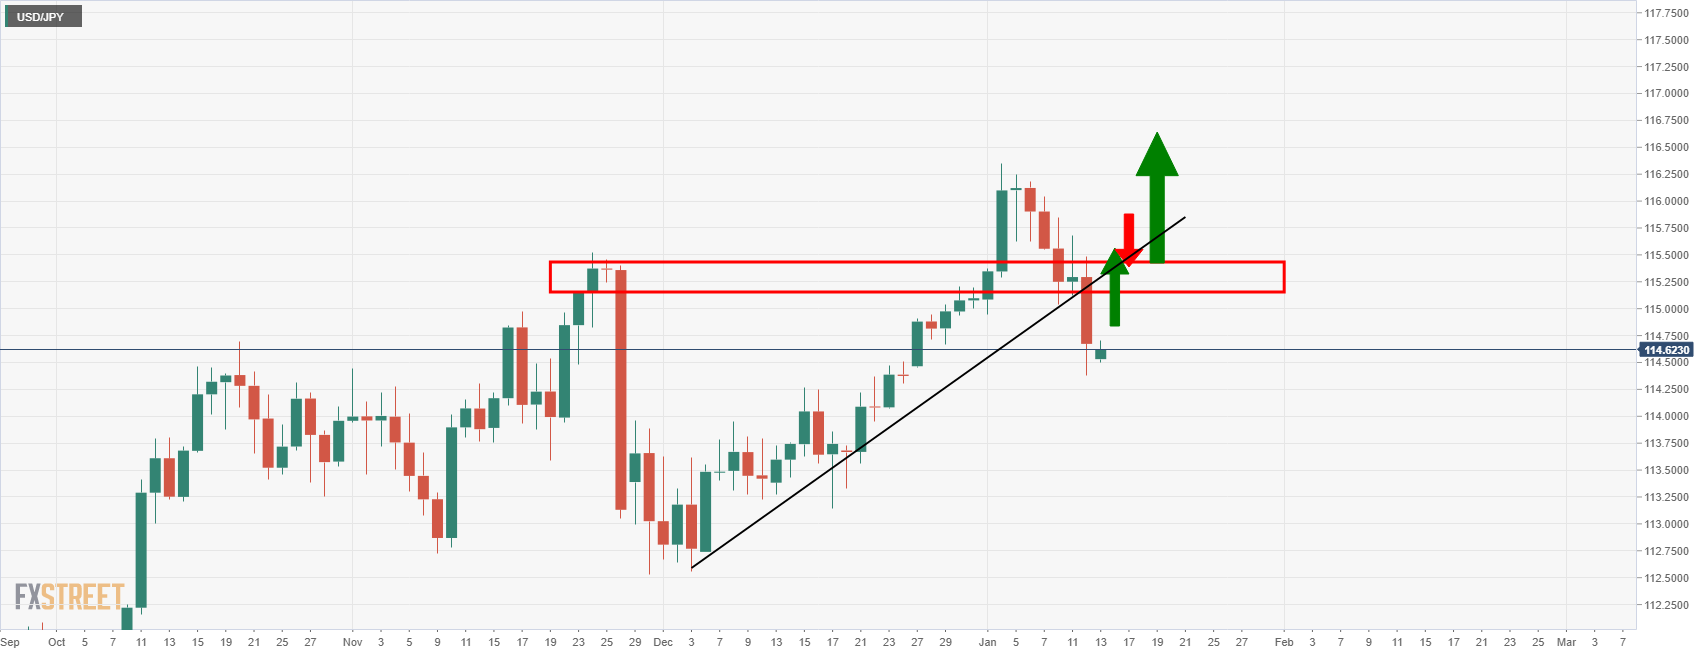
For the bulls, there is little prospect of an upside opportunity until the daily structure is broken once again. This falls in at around 115.40.
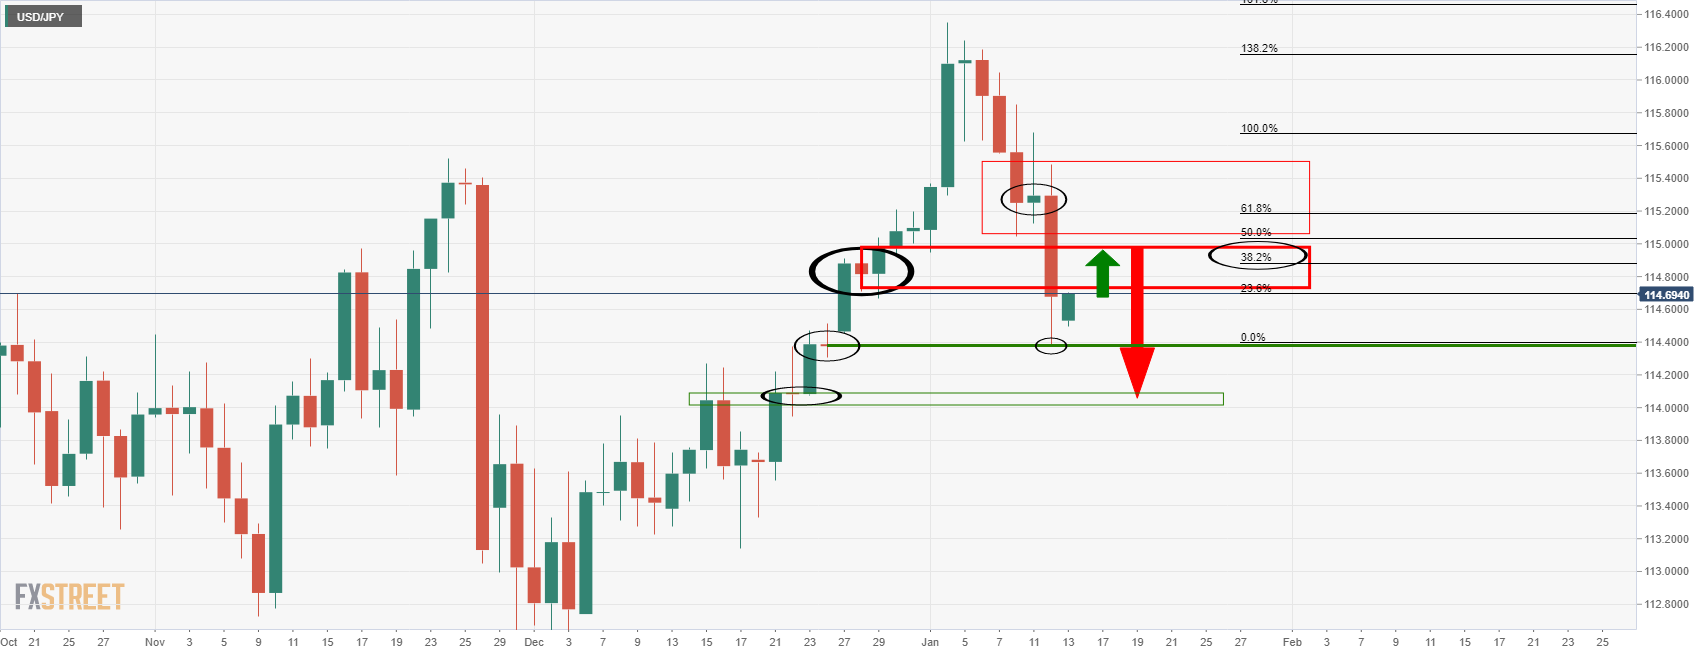
For the bears, a move towards 114.80/115.00 could be on the cards where a confluence of the 38.2% Fibonacci retracement and a 50% mean reversion come into line. This area might be expected to act as resistance on initial tests and potentially lead to a downside continuation.
USD/JPY H4 chart
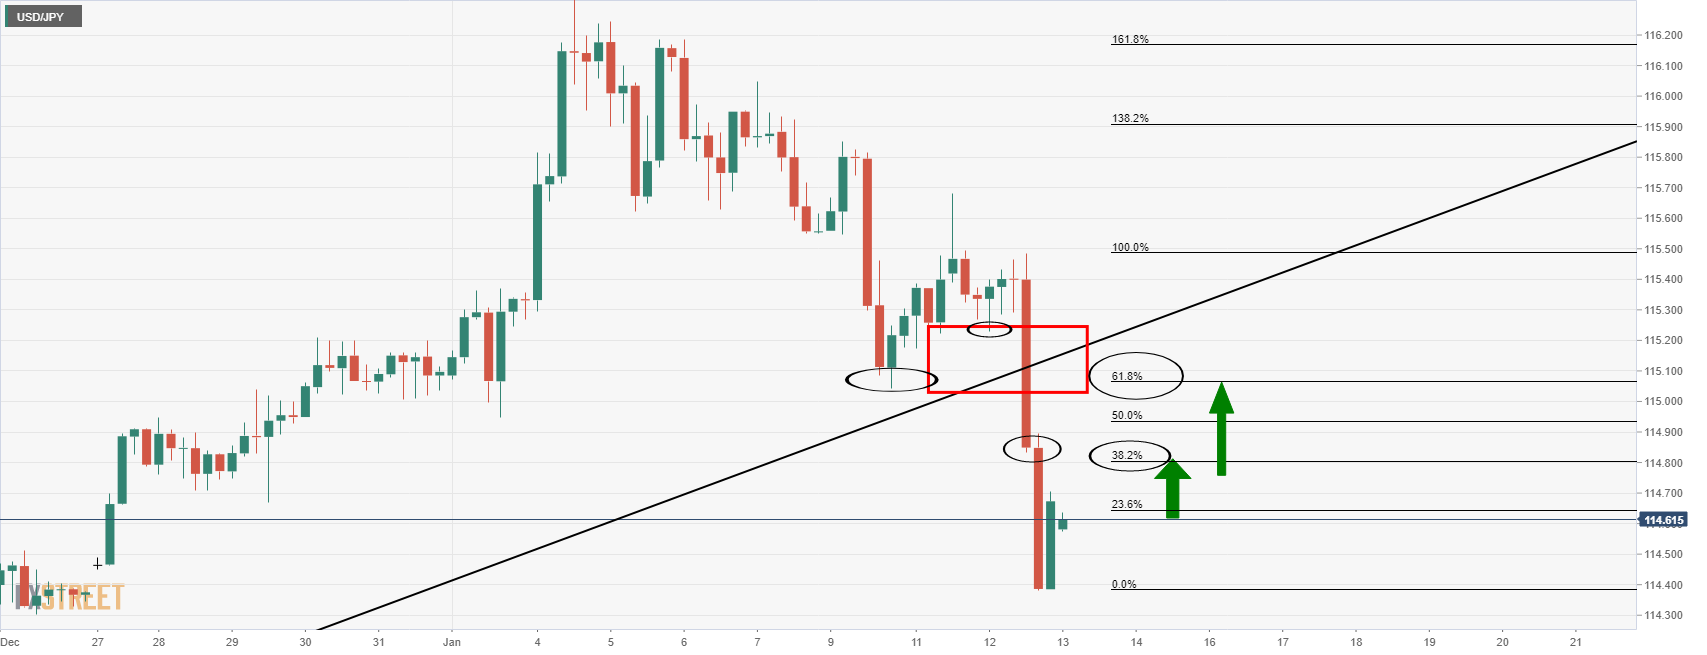
On the 4-hour chart, the price path could resemble something as illustrated above where the various structural levels of interest are eclipsed.
USD/JPY H1 chart
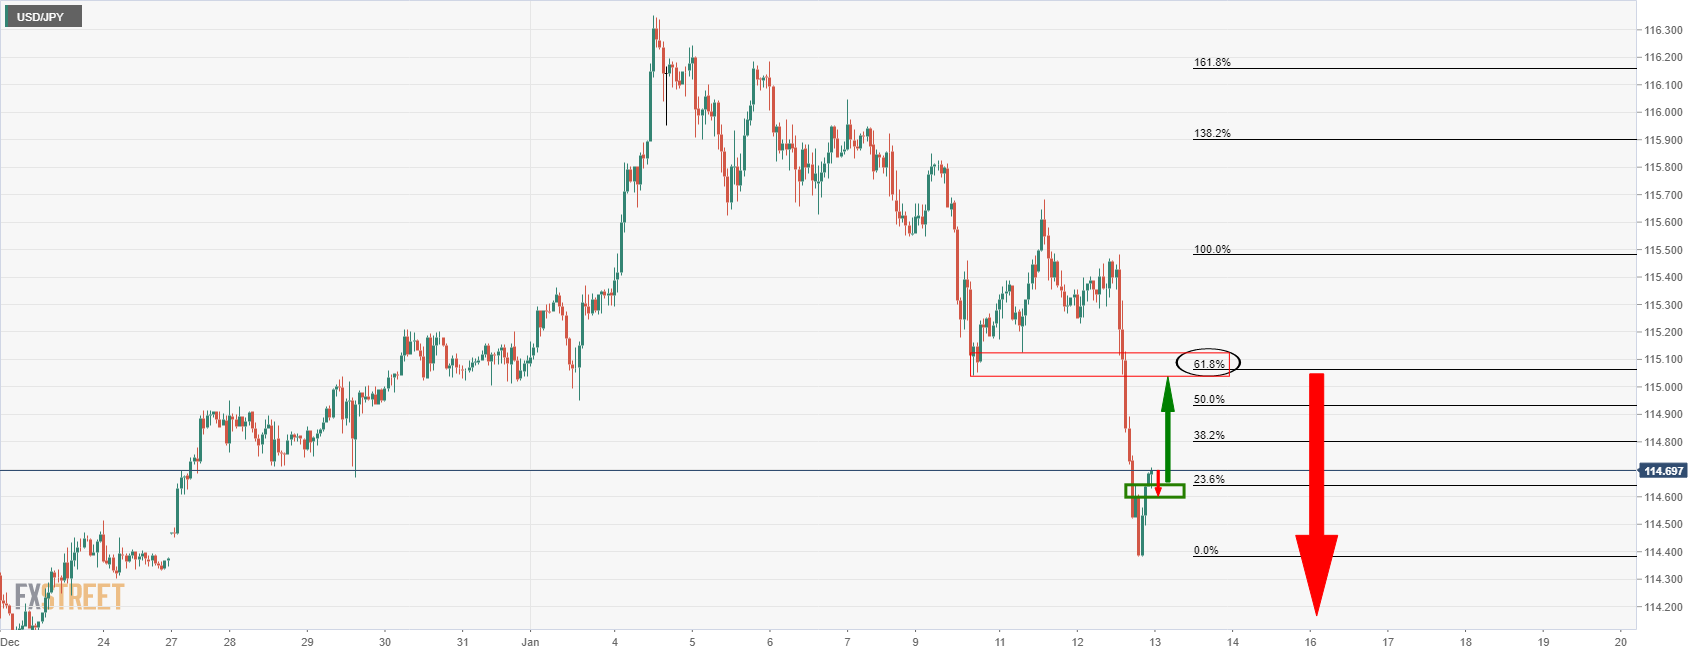
At this juncture, the price is above the hourly structure which could act as support on a retest and lead to a meanwhile bullish correction, again, towards the 115 figure. The 61.8% Fibo is located there also.
USD/JPY M15 chart
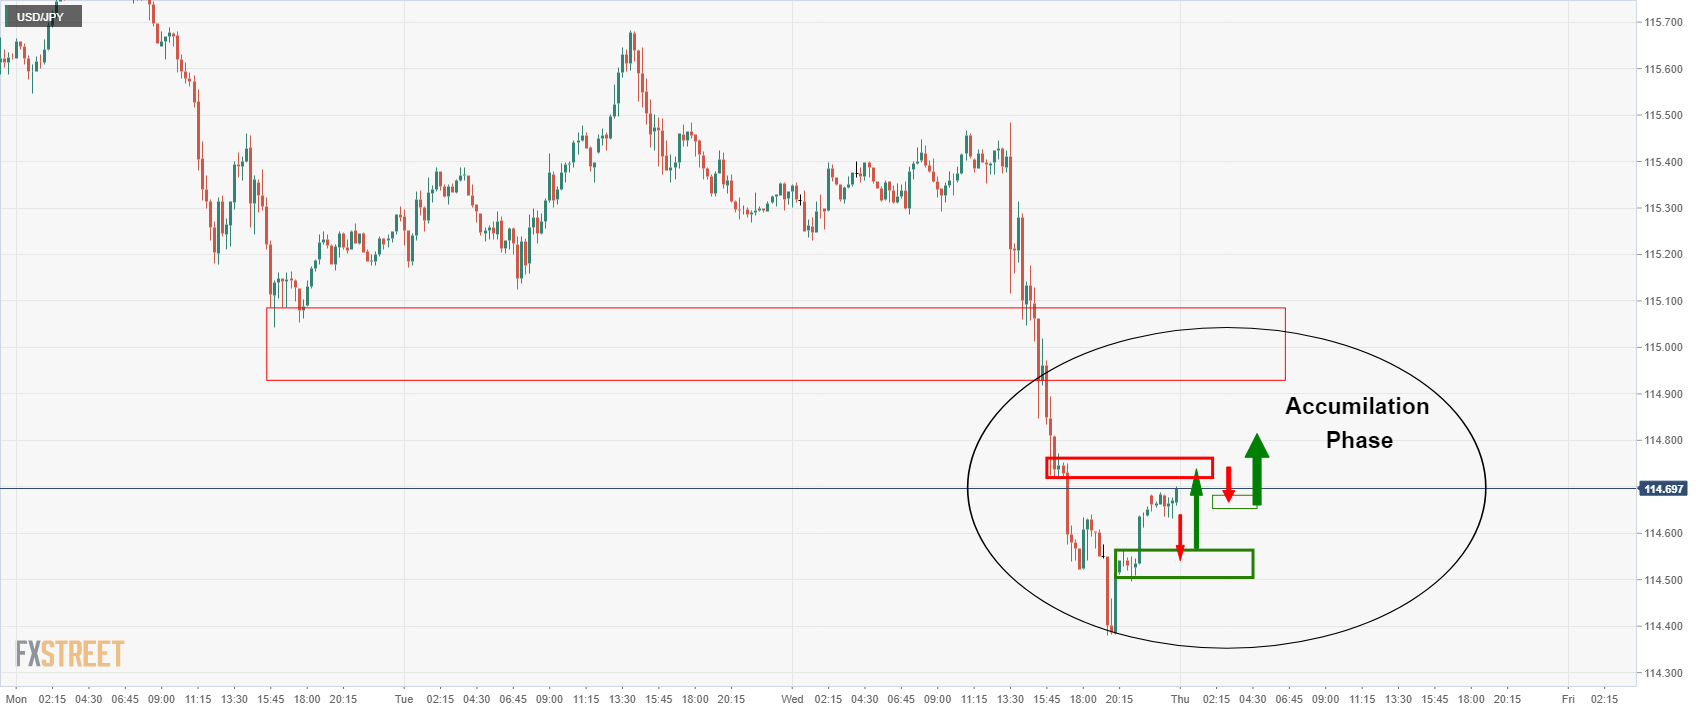
From a 15-min perspective, the price action could evolve in a phase of accumulation, similar to the above schematic.
- EUR/USD consolidates the biggest daily gains in five weeks around one-month high.
- Clear break of descending trend line from May, bullish MACD signals favor buyers.
- 100-DMA lures bulls ahead of the three-month-old horizontal hurdle.
- 21-DMA, ascending trend line from late November add to the downside filters.
EUR/USD remains lackluster around monthly high, recently easing to 1.1440 amid Thursday’s Asian session.
The major currency pair jumped the most since early December the previous day on breaking a descending trend line from May. The resistance breakout also gained support from the bullish MACD signals to refresh monthly high.
That said, the 23.6% Fibonacci retracement (Fibo.) of the pair’s May-November declines seem to restrict the quote’s immediate moves around 1.1450.
However, the sellers are less likely to retake entries until the pair remains above the previous resistance line, around 1.1410.
Even so, 21-DMA and a seven-week-old ascending support line, respectively around 1.1330 and 1.1290, will challenge the EUR/USD bears.
On the contrary, the 100-DMA level of 1.1510 stays on the bull’s radar ahead of targeting the 1.1530 horizontal line established in October.
Should the EUR/USD buyers cross the 1.1530 hurdle, further upside towards August month’s low near 1.1665 can’t be ruled out.
EUR/USD: Daily chart
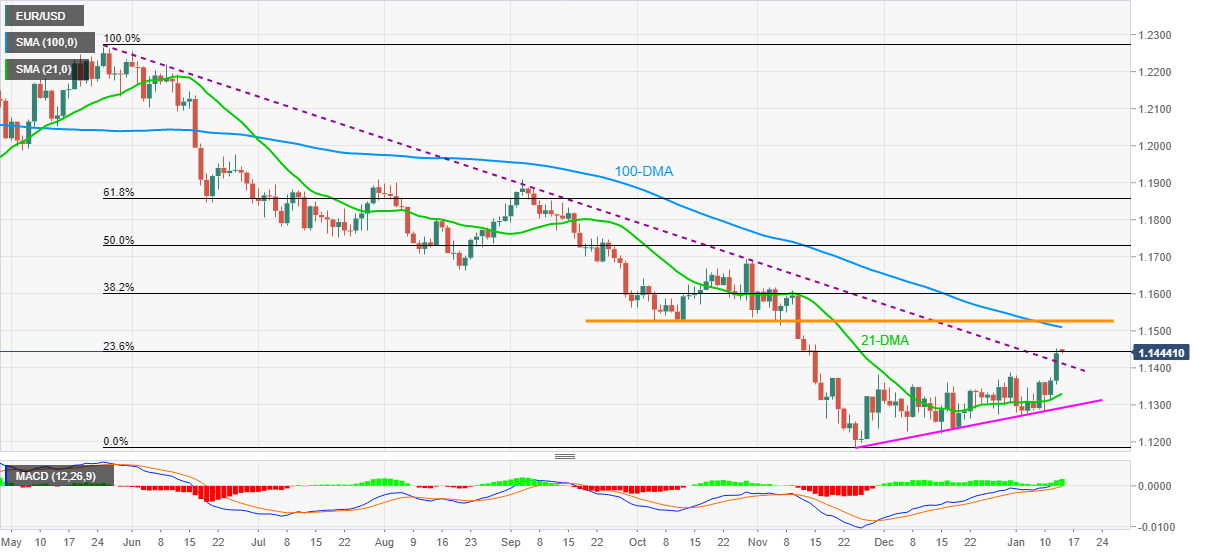
Trend: Further upside expected
| Pare | Closed | Change, % |
|---|---|---|
| AUDUSD | 0.72843 | 1.04 |
| EURJPY | 131.153 | 0.07 |
| EURUSD | 1.14401 | 0.66 |
| GBPJPY | 157.091 | -0.05 |
| GBPUSD | 1.37034 | 0.52 |
| NZDUSD | 0.68466 | 0.93 |
| USDCAD | 1.2504 | -0.54 |
| USDCHF | 0.91423 | -0.99 |
| USDJPY | 114.637 | -0.57 |


© 2000-2026. All rights reserved.
This site is managed by Teletrade D.J. LLC 2351 LLC 2022 (Euro House, Richmond Hill Road, Kingstown, VC0100, St. Vincent and the Grenadines).
The information on this website is for informational purposes only and does not constitute any investment advice.
The company does not serve or provide services to customers who are residents of the US, Canada, Iran, The Democratic People's Republic of Korea, Yemen and FATF blacklisted countries.
Making transactions on financial markets with marginal financial instruments opens up wide possibilities and allows investors who are willing to take risks to earn high profits, carrying a potentially high risk of losses at the same time. Therefore you should responsibly approach the issue of choosing the appropriate investment strategy, taking the available resources into account, before starting trading.
Use of the information: full or partial use of materials from this website must always be referenced to TeleTrade as the source of information. Use of the materials on the Internet must be accompanied by a hyperlink to teletrade.org. Automatic import of materials and information from this website is prohibited.
Please contact our PR department if you have any questions or need assistance at pr@teletrade.global.
transfers