- Analytics
- News and Tools
- Market News
CFD Markets News and Forecasts — 18-08-2021
| Time | Country | Event | Period | Previous value | Forecast |
|---|---|---|---|---|---|
| 01:30 (GMT) | Australia | Unemployment rate | July | 4.9% | 5% |
| 01:30 (GMT) | Australia | Changing the number of employed | July | 29.1 | -46.2 |
| 06:00 (GMT) | Switzerland | Trade Balance | July | 4.3 | |
| 06:30 (GMT) | Switzerland | Industrial Production (YoY) | Quarter II | 4.8% | |
| 08:00 (GMT) | Eurozone | Current account, unadjusted, bln | June | 4.3 | |
| 12:30 (GMT) | U.S. | Continuing Jobless Claims | August | 2866 | 2800 |
| 12:30 (GMT) | U.S. | Philadelphia Fed Manufacturing Survey | August | 21.9 | 23 |
| 12:30 (GMT) | U.S. | Initial Jobless Claims | August | 375 | 363 |
| 14:00 (GMT) | U.S. | Leading Indicators | July | 0.7% | 0.8% |
| 23:01 (GMT) | United Kingdom | Gfk Consumer Confidence | August | -7 | -7 |
| 23:05 (GMT) | Australia | RBA Assist Gov Kent Speaks | |||
| 23:30 (GMT) | Japan | National CPI Ex-Fresh Food, y/y | July | 0.2% | -0.4% |
| 23:30 (GMT) | Japan | National Consumer Price Index, y/y | July | 0.2% |
ActionForex offers views of the TD Bank Financial Group's analysts on the latest U.S. housing data.
"Housing starts fell 7% (or 116k) to 1.53 million units (annualized) in July. The headline number came in below expectations, which called for a more moderate pullback to 1.61 million. Upward revisions to the prior two months added 55k to the overall tally."
"Starts in the single-family segment fell 4.5% (or 52k) to 1.11 million, while starts in the multifamily segment fell 13.1% (or 64k) to 423k."
"Permitting activity recorded its first gain in three months, rising 2.6% to 1.64 million. The multifamily segment, where permits rose 11.2% to 587k was entirely responsible for the increase. Single-family permits, meanwhile, fell 1.7% to 1.05 million, retreating for the fourth consecutive month."
"A pullback in housing starts in July was widely expected given that permitting activity (a leading indicator for starts) had fallen in each of the three months prior. Despite this, the overall pace of new homebuilding remains relatively healthy, with the six-month moving average still above the pre-pandemic trend at close to 1.59 million."
"The smaller multifamily market has contributed to the healthy pace of homebuilding, with starts in the segment generally trending higher over the last several months thanks to improving public health conditions and better prospects for dense urban living. The recent surge in multifamily permits suggests that the pullback in starts experienced in July may be short-lived. But, the latest Delta-driven COVID-19 wave could still pose a near-term hurdle for the segment."
"Rising material costs and a shortage of qualified labor, coupled with buyers’ affordability challenges add to concerns for builders. Builder sentiment in the larger single-family market has eased gradually in recent months. Nonetheless, the fundamentals for homebuilding remain solid, thanks to an improving labor market backdrop and still exceptionally low inventory levels."
The
U.S. Energy Information Administration (EIA) reported on Wednesday that crude
inventories decreased by 3.234 million barrels in the week ended August 13,
following a drop of 0.447 million barrels in the previous week. Economists had
forecast a draw of 1.055 million barrels.
At the same time, gasoline stocks rose by 0.696 million barrels, while analysts had expected a fall of 1.671 million barrels. Distillate stocks declined by 2.697 million barrels, while analysts had forecast a gain of 0.276 million barrels.
Meanwhile,
oil production in the U.S. increased by 100,000 barrels a day to 11,400 million
barrels a day.
U.S.
crude oil imports averaged 6.4 million barrels per day last week, down by
46,000 barrels per day from the previous week.
ActionForex reports that analysts at TD Bank Financial Group discuss Canada's inflation data for July.
"Canadian inflation rose to the highest rate in almost a decade, with the consumer price index rising 3.7% year-on-year in July, up from 3.1% in June and above the median analyst estimate of 3.4%."
"The acceleration in price growth was widespread with six of eight major categories seeing faster year-on-year growth. Shelter prices (+4.8%) contributed the most to the increase. Only clothing & footwear and alcohol, tobacco & cannabis saw price growth slow relative to a year ago."
"Two of three of the Bank of Canada’s core inflation metrics moved higher in the month. The CPI-trim rose to 3.1% (from 2.7%) and CPI-Median to 2.6% (from 2.4%). The CPI-common measure was unchanged 1.7%. Taken together, the three measures averaged 2.5%, the highest level since February 2009."
"Price growth continues to surprise on the upside in Canada. At the same time, it is becoming more widespread across categories. The pandemic’s effect on price growth is not only on the supply side, where production disruptions are adding to the cost of manufactured goods such as autos, but also on demand, where policy supports have driven robust spending on housing and durable goods items. We are also now starting to see the impact of faster price growth in re-opening services sectors such as restaurants."
"The staying power of inflation will ultimately depend on expectations and the response of monetary policy. The Bank of Canada may be willing to tolerate higher inflation while the economy is still re-opening and recovering from the health shock, but it will respond to more lasting price pressures by reducing monetary accommodation."
FXStreet reports that Karen Jones, Team Head FICC Technical Analysis Research at Commerzbank, believes that gold’s rally higher will shortly encounter tougher resistance at $1806/12, where the yellow metal is likely to struggle.
“Gold has seen a strong bounce off the March lows at $1679/$1677, which is approaching tougher resistance offered by the 55, 100 and 200-day ma at $1806/12 and the resistance line at $1813. We suspect that this will repel the advance at least on the initial test and provoke some further consolidation.”
“Key resistance is the mid-July high at $1834, a move above here is needed to retest the $1856/57 4th June low and the $1878 2020-2021 downtrend.”
“Support at “1679/$1677 is reinforced by the $1670 June 2020 low."
FXStreet notes that the softening in the pound vs. the euro on the announcement of the UK CPI data this morning was short-lived. In the opinion of economists at Rabobank, this may suggest that the market sees little in this data to shift the debate about the UK inflation outlook.
“There are many reasons for the BoE to remain cautious about the withdrawal of policy stimulus... That said, it remains very likely that the BoE will remain mindful of what it has called ‘two-sided risks around the central path for inflation in the medium-term’.”
“The BoE’s asset purchase programme will be complete at the end of this year. While we are not expecting a rate rise until 2023, a debate has opened in the market as to whether a move in 2022 is possible.”
“Since the Bank of England is on a slightly more hawkish path than the European Central Bank, we remain of the view that EUR/GBP can edge lower by year-end towards 0.84.”
U.S. stock-index futures dropped slightly on Wednesday, as investors remained cautious ahead of the release of the minutes from the July Federal Reserve meeting later today (18:00 GMT), which could provide clues on the U.S. central bank's plans for its stimulus.
Global Stocks:
Index/commodity | Last | Today's Change, points | Today's Change, % |
Nikkei | 27,585.91 | +161.44 | +0.59% |
Hang Seng | 25,867.01 | +121.14 | +0.47% |
Shanghai | 3,485.29 | +38.31 | +1.11% |
S&P/ASX | 7,502.10 | -8.90 | -0.12% |
FTSE | 7,152.86 | -28.25 | -0.39% |
CAC | 6,781.67 | -38.17 | -0.56% |
DAX | 15,922.81 | +0.86 | +0.01% |
Crude oil | $67.10 | +0..77% | |
Gold | $1,789.80 | +0.11% |
(company / ticker / price / change ($/%) / volume)
3M Co | MMM | 199.36 | -0.19(-0.10%) | 723 |
ALCOA INC. | AA | 41.23 | -0.38(-0.91%) | 28081 |
ALTRIA GROUP INC. | MO | 48.51 | -0.05(-0.10%) | 5426 |
Amazon.com Inc., NASDAQ | AMZN | 3,241.31 | -0.65(-0.02%) | 15710 |
AMERICAN INTERNATIONAL GROUP | AIG | 53.98 | -0.03(-0.06%) | 209 |
Apple Inc. | AAPL | 149.98 | -0.21(-0.14%) | 491231 |
AT&T Inc | T | 28.11 | -0.08(-0.28%) | 14943 |
Boeing Co | BA | 221.7 | -0.52(-0.23%) | 65205 |
Caterpillar Inc | CAT | 212.38 | -1.06(-0.50%) | 2329 |
Chevron Corp | CVX | 99.72 | 0.33(0.33%) | 40220 |
Cisco Systems Inc | CSCO | 55.86 | -0.15(-0.27%) | 14756 |
Citigroup Inc., NYSE | C | 71.44 | -0.18(-0.25%) | 13616 |
Exxon Mobil Corp | XOM | 55.66 | 0.10(0.18%) | 27164 |
Facebook, Inc. | FB | 358.5 | 0.05(0.01%) | 47520 |
Ford Motor Co. | F | 12.98 | -0.01(-0.08%) | 375550 |
Freeport-McMoRan Copper & Gold Inc., NYSE | FCX | 34.25 | -0.46(-1.33%) | 64398 |
General Electric Co | GE | 101.44 | -0.18(-0.18%) | 15699 |
General Motors Company, NYSE | GM | 50.52 | 0.05(0.10%) | 98757 |
Goldman Sachs | GS | 403 | -1.97(-0.49%) | 4176 |
Google Inc. | GOOG | 2,741.21 | -4.80(-0.17%) | 2244 |
Hewlett-Packard Co. | HPQ | 28.5 | -0.18(-0.63%) | 10339 |
Intel Corp | INTC | 52.55 | -0.14(-0.27%) | 36498 |
International Business Machines Co... | IBM | 142.2 | -0.22(-0.15%) | 1941 |
Johnson & Johnson | JNJ | 179 | -0.47(-0.26%) | 1663 |
JPMorgan Chase and Co | JPM | 156.69 | -0.32(-0.20%) | 6109 |
McDonald's Corp | MCD | 240.2 | -0.08(-0.03%) | 1750 |
Merck & Co Inc | MRK | 78.82 | -0.01(-0.01%) | 13673 |
Microsoft Corp | MSFT | 292.1 | -0.42(-0.14%) | 87765 |
Nike | NKE | 170.1 | -0.56(-0.33%) | 3209 |
Pfizer Inc | PFE | 50.34 | -0.08(-0.16%) | 324052 |
Procter & Gamble Co | PG | 145.15 | 0.27(0.19%) | 3966 |
Starbucks Corporation, NASDAQ | SBUX | 116.62 | 0.05(0.04%) | 3861 |
Tesla Motors, Inc., NASDAQ | TSLA | 669.73 | 4.02(0.60%) | 342766 |
The Coca-Cola Co | KO | 57.23 | -0.05(-0.09%) | 12219 |
Twitter, Inc., NYSE | TWTR | 62.75 | -0.13(-0.21%) | 14751 |
Verizon Communications Inc | VZ | 56.1 | -0.08(-0.14%) | 4988 |
Visa | V | 234.8 | 0.27(0.12%) | 2354 |
Wal-Mart Stores Inc | WMT | 150.8 | 0.10(0.07%) | 37177 |
Walt Disney Co | DIS | 175.15 | -0.68(-0.39%) | 26824 |
Yandex N.V., NASDAQ | YNDX | 69.33 | 0.26(0.38%) | 750 |
The
Commerce Department reported on Wednesday the housing starts plunged by 7.0
percent m-o-m in July to a seasonally adjusted annual pace of 1.534 million
(the lowest level since April), while building permits rose by 2.6 percent
m-o-m to a seasonally adjusted annual rate of 1.635.
Economists
had forecast housing starts decreasing to a pace of 1.600 million units last
month and building permits growing to a pace of 1.610 million units.
Data
for June was revised to show homebuilding increasing to a pace of 1.650 million
units, instead of increasing at a rate of 1.643 million units as previously
reported.
According
to the report, permits for single-family homes, the largest segment of the
market, fell 1.7 percent m-o-m in July, while approvals for the multi-family
homes segment surged 11.2 percent m-o-m.
In
the meantime, groundbreaking on single-family homes declined 4.5 percent m-o-m
in July, while housing starts for the multi-family tumbled 13.6 percent m-o-m.
Statistics Canada reported on Wednesday the country’s consumer price index (CPI) rose 0.6 percent m-o-m in July, following a 0.3 percent m-o-m gain in the previous month. This was the fastest pace since January.
On
the y-o-y basis, Canada’s inflation rate increased 3.7 percent last month, accelerating
from 3.1 percent in June. This was the highest rate since May 2011.
Economists
had predicted inflation would increase 0.3 percent m-o-m and 3.4 percent y-o-y
in July.
According
to the report, prices rose at a faster pace in six of the eight major
components on a y-o-y basis in July, with shelter prices (+4.8 percent y-o-y) contributing
the most to the all-items advance.
Meanwhile, the closely watched the Bank of
Canada's core index surged 3.3 percent y-o-y in July, following a 2.7 percent
y-o-y jump in June.
FXStreet reports that Lee Sue Ann, an economist at UOB Group, suggests that the PBoC will refrain from acting on rates, when it meets on Friday.
“With another CNY3.75 trillion of MLF maturing the rest of the year, the PBoC may need to cut the RRR further to pump more liquidity back into the system.”
“However, we maintain our expectation for the PBoC to keep its benchmark 1Y LPR and the 5Y & above LPR unchanged at 3.85% and 4.65%, respectively, for the rest of the year.”
FXStreet notes that AUD/USD has finally confirmed its bearish “wedge” continuation pattern below the 0.7288 recent low to reinforce its existing large top to result in an aggressive sell-off. Economists at Credit Suisse maintain a bearish outlook for 0.7085/43 – the “measured top objective” and 38.2% retracement of the entire 2020/2021 bull trend.
“We see support next at 0.7221/09 – the 78.6% retracement of the rally from last November. Whilst this should be allowed to hold at first, below in due course should see support next at 0.7159/45 and eventually our core objective at 0.7085/43 – the ‘measured top objective’ and 38.2% retracement of the entire 2020/2021 bull trend. With key price support from the late 2020 low not far below at 0.6991 we continue to look for a floor here.”
“Resistance moves to 0.7278/88 initially, with 0.7315/19 now ideally capping to keep the immediate risk lower.”
| Time | Country | Event | Period | Previous value | Forecast | Actual |
|---|---|---|---|---|---|---|
| 06:00 | United Kingdom | Retail Price Index, m/m | July | 0.7% | 0.3% | 0.5% |
| 06:00 | United Kingdom | Producer Price Index - Output (YoY) | July | 4.5% | 4.4% | 4.9% |
| 06:00 | United Kingdom | Producer Price Index - Input (MoM) | July | 0.5% | 0.5% | 0.8% |
| 06:00 | United Kingdom | Producer Price Index - Input (YoY) | July | 9.7% | 9.1% | 9.9% |
| 06:00 | United Kingdom | Producer Price Index - Output (MoM) | July | 0.6% | 0.4% | 0.6% |
| 06:00 | United Kingdom | Retail prices, Y/Y | July | 3.9% | 3.6% | 3.8% |
| 06:00 | United Kingdom | HICP ex EFAT, Y/Y | July | 2.3% | 1.8% | |
| 06:00 | United Kingdom | HICP, m/m | July | 0.5% | 0.3% | 0.0% |
| 06:00 | United Kingdom | HICP, Y/Y | July | 2.5% | 2.3% | 2% |
| 09:00 | Eurozone | Construction Output, y/y | June | 12.2% | 2.8% | |
| 09:00 | Eurozone | Harmonized CPI ex EFAT, Y/Y | July | 0.9% | 0.7% | 0.7% |
| 09:00 | Eurozone | Harmonized CPI | July | 0.3% | -0.1% | -0.1% |
| 09:00 | Eurozone | Harmonized CPI, Y/Y | July | 1.9% | 2.2% | 2.2% |
USD traded mixed and little changed against most of its major rivals in the European session on Wednesday, as investors were cautious ahead of the release of the minutes from the July Federal Reserve meeting, which is due at 18:00 GMT, hoping to get clues on the U.S. central bank's plans for its $120 billion a month of bond purchases.
The U.S. Dollar Index (DXY), measuring the U.S. currency's value relative to a basket of foreign currencies, edged up 0.01% to 93.14.
On Tuesday, the Fed's Chairman Jerome Powell said the COVID-19 pandemic was “still casting a shadow on economic activity” but noted that it wasn't yet clear whether the delta-variant would have a significant impact on the U.S. economy. He refrained from commenting on the Fed's future policy path.
Earlier this month, however, several Fed’s policymakers have expressed views that the U.S. central bank should begin tapering stimulus in the fourth quarter, but some others have stressed that more evidence of a recovery is needed, particularly in the labour market, before such action is taken.
The Mortgage Bankers Association (MBA) reported on Wednesday the mortgage application volume in the U.S. fell 3.9 percent in the week ended August 13, following a 2.8 percent gain in the previous week. This marked the biggest decline in the last four weeks.
According
to the report, refinance applications plunged 5.3 percent, while applications
to purchase a home increased 0.8 percent.
Meanwhile,
the average fixed 30-year mortgage rate rose from 2.99 percent to 3.06 percent,
the highest level in a month.
“Mortgage
rates followed an overall increase in Treasury yields last week, which started
higher from the strong July jobs report before slowing because of weaker
consumer sentiment and concerns about rising COVID-19 cases,” noted Joel Kan,
MBA Associate Vice President of Economic and Industry Forecasting. “The
increase in mortgage rates caused a 5 percent decrease in refinancing, driven
by a 7 percent drop in conventional refinance applications. Even though rates
are 7 basis points lower than the same week a year ago, the refinance index is
around 8 percent lower. The eligible pool of homeowners who stand to benefit
from a refinance is smaller now.”
FXStreet notes that the Reserve Bank of New Zealand (RBNZ) surprised markets by leaving its interest rates unchanged at 0.25%. Still, economists at ING expect two rate hikes by the end of the year. In turn, NZD should benefit from an attractive carry once sentiment improves.
“The RBNZ held rates unchanged at 0.25% today, but the policy statement and the projections included in the Monetary Policy Statement fell on the hawkish side of the spectrum.”
“Considering the RBNZ's hawkish tone, we have not changed our view that the RBNZ will raise rates by a total of 50bp by the year-end: we expect back-to-back hikes at the 6 October and 24 November meetings. We expect to see three more hikes in 2022.”
“Today’s hold from the RBNZ has left the NZD quite vulnerable in the short-run to external headwinds, but in the longer-term we expect the RBNZ tightening cycle to fuel a sustained rebound in the currency.”
“Our current 0.74 year-end estimate for NZD/USD looks less realistic after the recent deterioration in market sentiment, but a move to the 0.72 region in 4Q21 may still be on the cards.”
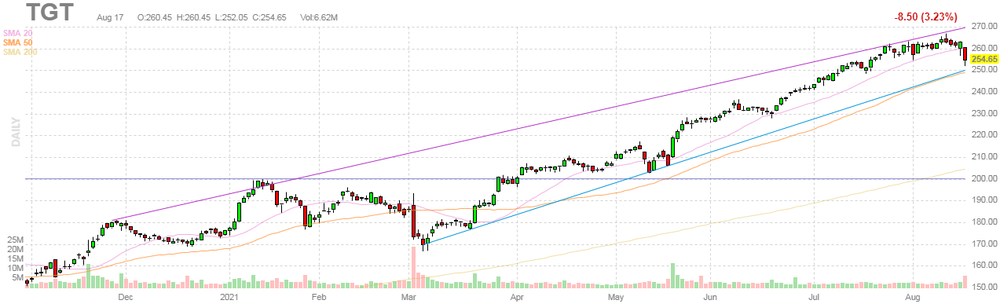
Target (TGT) reported Q2 FY 2021 earnings of $3.64 per share (versus $3.35 per share in Q2 FY 2020), beating analysts’ consensus estimate of $3.53 per share.
The company’s quarterly revenues amounted to $24.826 bln (+8.1% y/y), roughly in line with analysts’ consensus estimate of $25.032 bln.
TGT fell to $245.00 (-3.79%) in pre-market trading.
UOB Group’s FX Strategists note that USD/CNH keeps the positive view and is expected to surpass the 6.5000 level in the short-term horizon.
24-hour view: “Despite the relatively strong advance, upward momentum has not improved by as much and USD is unlikely to strengthen much further. For today, USD is more likely to consolidate and trade between 6.4780 and 6.4980.”
Next 1-3 weeks: “We have held the same since last Tuesday (10 Aug, spot at 6.4830) where USD ‘has to close above the major resistance at 6.5000 before a sustained advance can be expected’. USD rose to 6.4967 yesterday (17 Aug) before easing off. Upward momentum has improved slightly and the chance for USD to close above 6.5000 has increased. The next resistance above 6.5000 is at 6.5180 followed by 6.5300. On the downside, a break of 6.4650 (no change in ‘strong support’ level) would indicate that USD is not ready to head higher just yet.”
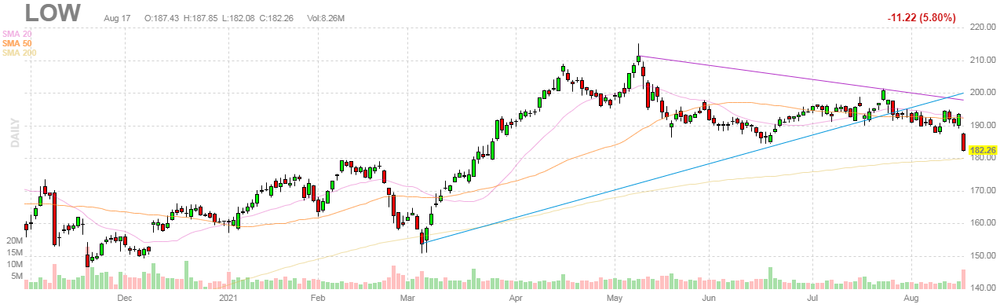
Lowe's (LOW) reported Q2 FY 2022 earnings of $4.25 per share (versus $3.75 per share in Q2 FY 2021), beating analysts’ consensus estimate of $4.01 per share.
The company’s quarterly revenues amounted to $27.570 bln (+1.0% y/y), beating analysts’ consensus estimate of $26.759 bln.
LOW rose to $143.00 (+0.81%) in pre-market trading.
FXStreet reports that Brent crude oil is threatening a top and strategists at Credit Suisse suggest that the top will be confirmed on a break below the $67.44 July low.
“Brent Crude Oil remains under pressure with weekly RSI momentum holding a clear top and bearish divergence to warn of a potential price top also.”
“Below the $67.44 July low would warn of a more serious break lower, for a move to $64.57 next, with scope for the 200-day average at $63.18.”
“Above $72.70 is needed to ease the pressure off the $67.44 July low for a recovery back to the top of the range at $75.78/77.84.”
FXStreet reports that economists at MUFG are maintaining a bearish bias for EUR/USD in the month ahead.
“The US economy is continuing to recover strongly with employment growth picking up in recent months. It leaves the Fed on course to make a QE taper announcement before the end of this year.”
“Long-term US yields have put in place a near-term bottom which is helping to encourage a stronger USD as well. The euro is not benefitting from the improving growth outlook as the ECB has strengthened their commitment to maintain loose monetary policy. The widening policy divergence between the ECB and Fed will encourage a weaker euro.”
“The German election is scheduled on the 26th September with polls pointing to a closer race. It should garner more market attention early in September and the uncertainty could weigh modestly on the euro, although we view any euro weakness on the back of the German election as likely to prove temporary.”
Reuters reports that the Office for National Statistics said that UK house prices rose in June at the fastest annual rate since 2004 as the market surged ahead of a phasing out of a tax break on property purchases.
House prices were 13.2% higher than in June 2020, following a 9.8% annual increase in May.
Finance minister Rishi Sunak cut stamp duty, a tax on house purchases, in July 2020. But from last month it started to return to its pre-pandemic level.
The tax cut aimed to reverse a slump in property sales at the start of the pandemic, and helped fuel a surge in property prices and some new construction. Many households were already seeking more spacious housing suited to working from home.
At the top end of the scale, house prices in the north west of England rose in June by 18.6% in annual terms, the ONS said. London stood at the bottom end but house prices there were still up 6.3%.
According to the report from Eurostat, the euro area annual inflation rate was 2.2% in July 2021, up from 1.9% in June. A year earlier, the rate was 0.4%. The core figures rose by 0.7%, beating the 0.7% consensus forecasts. European Union annual inflation was 2.5% in July 2021, up from 2.2% in June. A year earlier, the rate was 0.9%.
The lowest annual rates were registered in Malta (0.3%), Greece (0.7%) and Italy (1.0%). The highest annual rates were recorded in Estonia (4.9%), Poland and Hungary (both 4.7%). Compared with June, annual inflation fell in nine Member States, remained stable in two and rose in sixteen.
In July, the highest contribution to the annual euro area inflation rate came from energy (+1.34 percentage points, pp), followed by food, alcohol & tobacco (+0.35 pp), services (+0.31 pp) and non-energy industrial goods (+0.17 pp).
FXStreet reports that strategists at Credit Suisse expect the yellow metal to stall its recovery at the $1808/1834 resistance zone.
“Strength now faces a test of a cluster of resistances including its 55 and 200-day averages and July and August highs at $1808/1834 and we expect this to cap the rebound and for the risk to lower again in the broader range. Only below $1671 though would mark a major top to mark an important change of trend lower. We would then see support at $1620/15 initially, then $1565/60.”
CNBC reports that Chinese President Xi Jinping emphasized at a finance and economic meeting the need to support moderate wealth for all — or the idea of “common prosperity,” which analysts have said is behind the latest regulatory crackdown on tech companies.
The meeting called for the “reasonable adjustment of excessive incomes and encouraging high income groups and businesses to return more to society,” state media said.
Leaders also specified common prosperity does not mean prosperity for just a few and is not a form of equal distribution, state media said. Rather, progress toward the goal would occur in stages, the report said.
Delivering “common prosperity” has emerged in recent months as an underlying theme of Chinese political discussion. The term is generally understood as moderate wealth for all, rather than just a few. But it remains a vague, frequently used slogan.
FXStreet reports that economists at Credit Suisse discuss NZD/USD prospects.
“NZD/USD strength has been capped at its 55 and 200-day averages and recent high at 0.7106 and the subsequent aggressive sell-off leaves a large top threatening.”
“Beneath the 0.6880 July low should see a top confirmed to turn the core trend lower with support then seen initially at 0.6799 ahead of the 38.2% retracement of the 2020/2021 bull trend at 0.6703, which we would look to hold at first. Big picture though, we would see the broader risk lower for an eventual break, with support seen next at 0.6511/0.6467.”
Reuters reports that Minneapolis Federal Reserve President Neel Kashkari said that it could be “reasonable” to start reducing the Fed’s bond-buying program later this year, though it would depend on making further progress in the labor market.
“It is a question of when, not a question of if” the Fed will slow its bond-buying, Kashkari said. - There’s a lot of public discussion about, will it be at the end of this year, will it be the beginning of next year: Those seem like reasonable ranges of deliberation, but ultimately it will be driven by the data.”
Raising interest rates, however, is likely still a “few years” in the future, Kashkari said, because the Fed has pledged not to do so until the economy reaches full employment and inflation, now temporarily high, climbs “over time” to the Fed’s goal of 2% on average.
| Time | Country | Event | Period | Previous value | Forecast | Actual |
|---|---|---|---|---|---|---|
| 01:00 | Australia | Leading Index | July | -0.06% | -0.12% | |
| 01:30 | Australia | Wage Price Index, y/y | Quarter II | 1.5% | 1.9% | 1.7% |
| 01:30 | Australia | Wage Price Index, q/q | Quarter II | 0.6% | 0.6% | 0.4% |
| 02:00 | New Zealand | RBNZ Interest Rate Decision | 0.25% | 0.5% | 0.25% | |
| 03:00 | New Zealand | RBNZ Press Conference | ||||
| 06:00 | United Kingdom | Retail Price Index, m/m | July | 0.7% | 0.3% | 0.5% |
| 06:00 | United Kingdom | Producer Price Index - Output (YoY) | July | 4.5% | 4.4% | 4.9% |
| 06:00 | United Kingdom | Producer Price Index - Input (MoM) | July | 0.5% | 0.5% | 0.8% |
| 06:00 | United Kingdom | Producer Price Index - Input (YoY) | July | 9.7% | 9.1% | 9.9% |
| 06:00 | United Kingdom | Producer Price Index - Output (MoM) | July | 0.6% | 0.4% | 0.6% |
| 06:00 | United Kingdom | Retail prices, Y/Y | July | 3.9% | 3.6% | 3.8% |
| 06:00 | United Kingdom | HICP ex EFAT, Y/Y | July | 2.3% | 1.8% | |
| 06:00 | United Kingdom | HICP, m/m | July | 0.5% | 0.3% | 0.0% |
| 06:00 | United Kingdom | HICP, Y/Y | July | 2.5% | 2.3% | 2% |
During today's Asian trading, the US dollar recorded a weak decline against the euro and a basket of major world currencies.
Investors ' attention is focused on the minutes of the July meeting of the US Federal Reserve System, which will be published later on Wednesday. The document may give hints about the future plans of the Fed regarding the timing and pace of curtailing the asset purchase program.
The euro rose slightly against the US dollar after earlier during the Asian session it reached the lowest level since November 2020.
The New Zealand dollar consolidated against the US dollar, despite the results of the RBNZ meeting. The Reserve Bank of New Zealand (RBNZ) delayed raising rates as policymakers quickly shifted gears after the country was put into a snap COVID-19 lockdown over a handful of new cases, but the bank still expects a hike before year-end.
The RBNZ held the official cash rate at a record low of 0.25% despite the economy running red-hot and a majority of analysts expecting a hike. Some had said Governor Adrian Orr may even deliver a 50 basis point rate hike.
The ICE index, which tracks the dynamics of the dollar against six currencies (euro, swiss franc, yen, canadian dollar, pound sterling and swedish krona), fell by 0.10%.
FXStreet reports that in the opinion of FX Strategists at UOB Group, AUD/USD remains poised to drop further.
Next 1-3 weeks: “We have expected AUD to trade within a 0.7310/0.7420 range since last Thursday. On Monday, we indicated that ‘looking ahead, the current consolidation is likely to be resolved by an attempt to move lower but AUD has to close below July’s low of 0.7290 before a sustained decline can be expected’. That said, we did not expect the outsized drop of -1.10% (0.7256) yesterday. While the sharp drop appears to be running ahead of itself, strong downward momentum suggests that AUD could weaken further to 0.7200. The next support is at 0.7150. Overall, AUD is expected to stay weak unless it can move above the ‘strong resistance’ level (currently at 0.7330).”
EUR/USD
Resistance levels (open interest**, contracts)
$1.1824 (1470)
$1.1790 (725)
$1.1764 (177)
Price at time of writing this review: $1.1719
Support levels (open interest**, contracts):
$1.1676 (2957)
$1.1652 (5109)
$1.1621 (1734)
Comments:
- Overall open interest on the CALL options and PUT options with the expiration date September, 3 is 87416 contracts (according to data from August, 17) with the maximum number of contracts with strike price $1,2000 (8353);
GBP/USD
$1.4006 (949)
$1.3918 (786)
$1.3846 (222)
Price at time of writing this review: $1.3744
Support levels (open interest**, contracts):
$1.3691 (1118)
$1.3642 (942)
$1.3610 (994)
Comments:
- Overall open interest on the CALL options with the expiration date September, 3 is 16243 contracts, with the maximum number of contracts with strike price $1,4300 (2170);
- Overall open interest on the PUT options with the expiration date September, 3 is 13737 contracts, with the maximum number of contracts with strike price $1,3800 (1118);
- The ratio of PUT/CALL was 0.85 versus 0.85 from the previous trading day according to data from August, 17
* - The Chicago Mercantile Exchange bulletin (CME) is used for the calculation.
** - Open interest takes into account the total number of option contracts that are open at the moment.
Reuters reports that the Reserve Bank of New Zealand (RBNZ) delayed raising rates as policymakers quickly shifted gears after the country was put into a snap COVID-19 lockdown over a handful of new cases, but the bank still expects a hike before year-end.
The RBNZ held the official cash rate at a record low of 0.25% despite the economy running red-hot and a majority of analysts expecting a hike. Some had said Governor Adrian Orr may even deliver a 50 basis point rate hike.
However, New Zealand's first local COVID-19 infection in six months, and a snap lockdown ordered for the entire nation on Tuesday hosed down those expectations and forced policymakers to confront the risk of a potentially premature move now.
A hike would have made New Zealand the first both in the Asia-Pacific and the G10 currency block to raise rates in the pandemic era.
RBNZ projections showed policymakers still expect to raise rates over coming months, with the cash rate seen at 0.50% by the end of the year, 1.5% by mid next year and over 2% by end of 2023. Markets are now pricing a 60% chance of a hike in October
Governor Orr told reporters at a press conference that the bank's clear direction is to be reducing monetary stimulus and lifting the cash rate.
According to the report from Office for National Statistics, the Consumer Prices Index (CPI) rose by 2.0% in the 12 months to July 2021, down from 2.5% to June. Economists had expected a 2.3% increase. On a monthly basis, CPI was unchanged in July 2021, compared with a rise of 0.4% in July 2020.
The Consumer Prices Index including owner occupiers’ housing costs (CPIH) rose by 2.1% in the 12 months to July 2021, down from 2.4% in the 12 months to June.
The largest upward contribution to the CPIH 12-month inflation rate came from transport (0.85 percentage points).
CPIH was unchanged on the month in July 2021, compared with a rise of 0.4% in July 2020.
Clothing and footwear, and a variety of recreational goods and services made the largest downward contributions to the change in the CPIH 12-month inflation rate between June and July 2021.
Price rises for second-hand cars, compared with falls a year ago, resulted in the largest, partially offsetting, upward contribution to change.
Around 0.2 percentage points of the easing in the CPIH rate between June and July 2021 came from base effects, specifically from items that became available again in July 2020 at the end of the first coronavirus (COVID-19) lockdown.
| Raw materials | Closed | Change, % |
|---|---|---|
| Brent | 68.94 | -1.12 |
| Silver | 23.635 | -0.81 |
| Gold | 1785.628 | -0.08 |
| Palladium | 2483.1 | -4.63 |
| Time | Country | Event | Period | Previous value | Forecast |
|---|---|---|---|---|---|
| 01:00 (GMT) | Australia | Leading Index | July | -0.07% | |
| 01:30 (GMT) | Australia | Wage Price Index, y/y | Quarter II | 0.6% | 1.9% |
| 01:30 (GMT) | Australia | Wage Price Index, q/q | Quarter II | 1.5% | 0.6% |
| 02:00 (GMT) | New Zealand | RBNZ Interest Rate Decision | 0.25% | 0.5% | |
| 03:00 (GMT) | New Zealand | RBNZ Press Conference | |||
| 06:00 (GMT) | United Kingdom | Retail Price Index, m/m | July | 0.7% | 0.3% |
| 06:00 (GMT) | United Kingdom | Producer Price Index - Output (YoY) | July | 4.3% | 4.4% |
| 06:00 (GMT) | United Kingdom | Producer Price Index - Input (MoM) | July | -0.1% | 0.5% |
| 06:00 (GMT) | United Kingdom | Producer Price Index - Input (YoY) | July | 9.1% | 9.1% |
| 06:00 (GMT) | United Kingdom | Producer Price Index - Output (MoM) | July | 0.4% | 0.4% |
| 06:00 (GMT) | United Kingdom | Retail prices, Y/Y | July | 3.9% | 3.6% |
| 06:00 (GMT) | United Kingdom | HICP ex EFAT, Y/Y | July | 2.3% | |
| 06:00 (GMT) | United Kingdom | HICP, m/m | July | 0.5% | 0.3% |
| 06:00 (GMT) | United Kingdom | HICP, Y/Y | July | 2.5% | 2.3% |
| 09:00 (GMT) | Eurozone | Construction Output, y/y | June | 13.6% | |
| 09:00 (GMT) | Eurozone | Harmonized CPI ex EFAT, Y/Y | July | 0.9% | 0.7% |
| 09:00 (GMT) | Eurozone | Harmonized CPI | July | 0.3% | -0.1% |
| 09:00 (GMT) | Eurozone | Harmonized CPI, Y/Y | July | 1.9% | 2.2% |
| 12:30 (GMT) | U.S. | Building Permits | July | 1.594 | 1.61 |
| 12:30 (GMT) | U.S. | Housing Starts | July | 1.643 | 1.602 |
| 12:30 (GMT) | Canada | Bank of Canada Consumer Price Index Core, y/y | July | 2.7% | |
| 12:30 (GMT) | Canada | Consumer Price Index m / m | July | 0.3% | 0.3% |
| 12:30 (GMT) | Canada | Consumer price index, y/y | July | 3.1% | 3.4% |
| 14:30 (GMT) | U.S. | Crude Oil Inventories | August | -0.447 | -1.259 |
| 18:00 (GMT) | U.S. | FOMC meeting minutes |
| Pare | Closed | Change, % |
|---|---|---|
| AUDUSD | 0.72532 | -1.12 |
| EURJPY | 128.295 | -0.26 |
| EURUSD | 1.17088 | -0.56 |
| GBPJPY | 150.462 | -0.49 |
| GBPUSD | 1.37293 | -0.8 |
| NZDUSD | 0.69146 | -1.46 |
| USDCAD | 1.26196 | 0.39 |
| USDCHF | 0.91378 | 0.2 |
| USDJPY | 109.555 | 0.29 |


© 2000-2026. All rights reserved.
This site is managed by Teletrade D.J. LLC 2351 LLC 2022 (Euro House, Richmond Hill Road, Kingstown, VC0100, St. Vincent and the Grenadines).
The information on this website is for informational purposes only and does not constitute any investment advice.
The company does not serve or provide services to customers who are residents of the US, Canada, Iran, The Democratic People's Republic of Korea, Yemen and FATF blacklisted countries.
Making transactions on financial markets with marginal financial instruments opens up wide possibilities and allows investors who are willing to take risks to earn high profits, carrying a potentially high risk of losses at the same time. Therefore you should responsibly approach the issue of choosing the appropriate investment strategy, taking the available resources into account, before starting trading.
Use of the information: full or partial use of materials from this website must always be referenced to TeleTrade as the source of information. Use of the materials on the Internet must be accompanied by a hyperlink to teletrade.org. Automatic import of materials and information from this website is prohibited.
Please contact our PR department if you have any questions or need assistance at pr@teletrade.global.
transfers