- Analytics
- News and Tools
- Market News
CFD Markets News and Forecasts — 20-10-2020
| Time | Country | Event | Period | Previous value | Forecast |
|---|---|---|---|---|---|
| 06:00 (GMT) | United Kingdom | Producer Price Index - Output (MoM) | September | 0.0% | 0.1% |
| 06:00 (GMT) | United Kingdom | Producer Price Index - Input (MoM) | September | -0.4% | -0.4% |
| 06:00 (GMT) | United Kingdom | Producer Price Index - Input (YoY) | September | -5.8% | -5.5% |
| 06:00 (GMT) | United Kingdom | Producer Price Index - Output (YoY) | September | -0.9% | -0.9% |
| 06:00 (GMT) | United Kingdom | Retail Price Index, m/m | September | -0.3% | 0.4% |
| 06:00 (GMT) | United Kingdom | PSNB, bln | September | -35.9 | -34 |
| 06:00 (GMT) | United Kingdom | HICP ex EFAT, Y/Y | September | 0.9% | |
| 06:00 (GMT) | United Kingdom | Retail prices, Y/Y | September | 0.5% | 1.2% |
| 06:00 (GMT) | United Kingdom | HICP, m/m | September | -0.4% | 0.5% |
| 06:00 (GMT) | United Kingdom | HICP, Y/Y | September | 0.2% | 0.5% |
| 07:30 (GMT) | Eurozone | ECB President Lagarde Speaks | |||
| 10:00 (GMT) | United Kingdom | CBI industrial order books balance | October | -48 | |
| 12:10 (GMT) | United Kingdom | MPC Member Ramsden Speaks | |||
| 12:30 (GMT) | Canada | Retail Sales YoY | August | 2.7% | |
| 12:30 (GMT) | Canada | Retail Sales, m/m | August | 0.6% | 1.1% |
| 12:30 (GMT) | Canada | New Housing Price Index, MoM | September | 0.5% | 0.5% |
| 12:30 (GMT) | Canada | New Housing Price Index, YoY | September | 2.1% | |
| 12:30 (GMT) | Canada | Retail Sales ex Autos, m/m | August | -0.4% | 0.9% |
| 12:30 (GMT) | Canada | Bank of Canada Consumer Price Index Core, y/y | September | 0.8% | |
| 12:30 (GMT) | Canada | Consumer Price Index m / m | September | -0.1% | -0.1% |
| 12:30 (GMT) | Canada | Consumer price index, y/y | September | 0.1% | 0.4% |
| 12:50 (GMT) | U.S. | FOMC Member Brainard Speaks | |||
| 14:00 (GMT) | U.S. | FOMC Member Mester Speaks | |||
| 14:30 (GMT) | U.S. | Crude Oil Inventories | October | -3.818 | -0.24 |
| 18:00 (GMT) | U.S. | Fed's Beige Book | |||
| 21:45 (GMT) | New Zealand | Trade Balance, mln | September | -353 | |
| 22:30 (GMT) | Australia | RBA Assist Gov Debelle Speaks |
According to ActionForex, analysts at TD Bank Financial Group note that U.S. housing starts increased by 1.9% month-on-month to 1.42 million units (annualized) in September.
"The headline print came slightly below market expectations, which called for a more optimistic 2.5% jump to 1.45 million units. Today’s report also came with revisions to the August and July readings (-33k on net)."
"The improvement was concentrated in single-family starts, which advanced by 8.5% to 1.11 million units following a 2.9% increase in the month prior. By contrast, the recent softness in multi-family construction extended to September as starts in this segment fell by 16.3% to 307k units."
"Building permits advanced by 5.2% in September to 1.55 million after a 0.5% decline in August (previously reported as -0.9%). Single-family permits were up 7.8%, while multi-family permits declined by 0.9%."
"Supported by low mortgage rates, the growth in housing demand has been particularly impressive over the last few months. In fact, sales of new single-family homes are outpacing single-family starts by a historical margin according to a recent National Association of Home Builders (NAHB) study. This suggests that there is room for additional homebuilding growth in the coming months. What is more, elevated traffic numbers have pushed builder confidence to consecutive all-time highs in September and October."
"On the other side of the ledger, binding constraints on the supply front are a thorn in the otherwise positive outlook. Notably, skyrocketing softwood lumber prices, which have surged by a record 29% month-on-month in September, are effectively adding thousands of dollars to construction costs. A fall resurgence in new COVID-19 cases as well as a labor market recovery that is losing steam are other factors that could weigh on housing demand as we near the end of the year and enter 2021."
FXStreet reports that since returning in mid-August to highs last seen before the pandemic, the S&P 500 benchmark index of the broader US market has bounced between 3100 and a high of 3588 set on September 2. According to Lisa Shalett from Morgan Stanley, there are three key concerns that may keep stocks trading in a range for a while yet, giving investors time to reposition for the next phase.
“The timing and size of CARES 2.0 fiscal stimulus is a major source of uncertainty, as the Senate focuses instead on a Supreme Court nomination.”
"The outcome of key Senate races could determine the size of the next stimulus bill if control of the chamber switches parties. Many Senate races remain close. Even if Democrats manage to gain the majority in the Senate, their margin will likely be slim. However, a ‘blue wave’ result – where the Democratic Party gains control of the White House and both chambers of Congress – could lead to an economic relief package approaching $3 trillion come next year.”
“Signs of another cresting wave of COVID-19 infections could also exacerbate worries. On October 15, US daily positive cases numbered more than 62,000, the worst report since July. In Europe, new cases have surged to twice their peak in April. We continue to believe that better treatment regimes, lower mortality rates and more clarity on when vaccines will become widely available will help to limit the economic impact.”
FXStreet reports that Lee Sue Ann, Economist at UOB Group, assesses the recent win of PM Jacinda Ardern at the October 17 national elections.
“New Zealand’s governing Labour Party, led by incumbent Prime Minister (PM) Jacinda Ardern won the country’s general election on Saturday (17 October), in an unprecedented landside over the opposition National Party, led by Judith Collins. It was the first time a New Zealand political party has secured a majority government under the mixed-member proportional representation (MMP) voting system introduced since 1996.”
“But with 100% of ballots counted for the preliminary results, the Labour Party has achieved the highest percentage of the popular vote (49.1%) for any political party since the National Party won 54.0% in 1951. This election was the worst defeat for the National Party, which won nearly 27% of the vote, down on last election’s 44% and the party worst defeat since 2002.”
“Ardern's re-election was buoyed by her "go hard and go early" approach to handling the COVID-19 pandemic, which has helped the country avoid the devastating outbreaks seen elsewhere.”
“Still, Ardern looks set to face another tough term ahead, as she attempts to address issues such as inequality, child poverty, climate change and the housing market; whilst steering the economy from the COVID-19 fallout. Regardless of the election result, the New Zealand economic outlook remains bleak."
“Uncertainties surrounding border closures look set to keep business investment and household spending subdued. Whilst a substantial fiscal response has been in place, the weakening global economic outlook is likely to weigh on goods exports, and unemployment is expected to rise following the expiry of wage subsidies paid by the government. The bill for government measures has already resulted in government debt rising from below 20% of GDP earlier in the year to 27.6% in June, and it is projected to rise to 53.6% over the coming four years.”
FXStreet notes that aluminium (LME) has reached the 55-month moving average at 1864.33 as well as the July 2019 high at 1866.00 and made its current October high at 1872.50. The metal still has the 200-week moving average at 1904.66 in its sights, Karen Jones, Team Head FICC Technical Analysis Research at Commerzbank, briefs.
“Once exceeded, the 200-week moving average at 1904.66 would be next in line (please the weekly chart on the following page). Still further up the February and March 2019 highs can be spotted at 1936.00/1951.00.”
“Minor support can be found between the early August and early September highs at 1824.00/1792.00 and also between the 55-day moving average and late September high at 1788.44/1785.50. More significant support sits between the September and current October lows at 1726.00/1725.00.”
U.S. stock-index futures rose on Tuesday, following Monday's market decline, supported by reports that House Speaker Pelosi and Treasury Secretary Mnuchin had narrowed some of their differences on a new stimulus package.
Global Stocks:
Index/commodity | Last | Today's Change, points | Today's Change, % |
Nikkei | 23,567.04 | -104.09 | -0.44% |
Hang Seng | 24,569.54 | +27.28 | +0.11% |
Shanghai | 3,328.10 | +15.44 | +0.47% |
S&P/ASX | 6,184.60 | -44.80 | -0.72% |
FTSE | 5,892.51 | +7.86 | +0.13% |
CAC | 4,937.98 | -4.64 | -0.09% |
DAX | 12,746.71 | -107.95 | -0.84% |
Crude oil | $40.85 | -0.51% | |
Gold | $1,908.90 | -0.15% |
(company / ticker / price / change ($/%) / volume)
ALCOA INC. | AA | 12.74 | 0.11(0.87%) | 7761 |
ALTRIA GROUP INC. | MO | 39.4 | 0.22(0.56%) | 4904 |
Amazon.com Inc., NASDAQ | AMZN | 3,217.50 | 10.29(0.32%) | 48148 |
AMERICAN INTERNATIONAL GROUP | AIG | 30.3 | 0.21(0.70%) | 7124 |
Apple Inc. | AAPL | 116.75 | 0.77(0.66%) | 1373261 |
AT&T Inc | T | 26.96 | 0.08(0.30%) | 104290 |
Boeing Co | BA | 168.4 | 1.29(0.77%) | 74970 |
Caterpillar Inc | CAT | 168.13 | 0.60(0.36%) | 1455 |
Chevron Corp | CVX | 71.71 | 0.43(0.60%) | 12502 |
Cisco Systems Inc | CSCO | 39.43 | 0.13(0.33%) | 26711 |
Citigroup Inc., NYSE | C | 43.15 | 0.25(0.58%) | 28706 |
E. I. du Pont de Nemours and Co | DD | 58.66 | 0.22(0.38%) | 236 |
Exxon Mobil Corp | XOM | 33.6 | 0.18(0.54%) | 45782 |
Facebook, Inc. | FB | 262.68 | 1.28(0.49%) | 101391 |
FedEx Corporation, NYSE | FDX | 284.4 | 2.43(0.86%) | 15608 |
Ford Motor Co. | F | 7.62 | 0.03(0.40%) | 214279 |
Freeport-McMoRan Copper & Gold Inc., NYSE | FCX | 17.39 | 0.25(1.46%) | 150139 |
General Electric Co | GE | 7.32 | 0.03(0.41%) | 272440 |
General Motors Company, NYSE | GM | 33.87 | 0.52(1.56%) | 82104 |
Goldman Sachs | GS | 206.5 | 0.81(0.39%) | 10598 |
Google Inc. | GOOG | 1,529.01 | -5.60(-0.36%) | 19301 |
Home Depot Inc | HD | 285 | 1.27(0.45%) | 2692 |
HONEYWELL INTERNATIONAL INC. | HON | 172.45 | 0.86(0.50%) | 969 |
Intel Corp | INTC | 54.7 | 0.12(0.22%) | 91547 |
International Business Machines Co... | IBM | 120.8 | -4.72(-3.76%) | 147360 |
International Paper Company | IP | 46.76 | 0.07(0.15%) | 1571 |
Johnson & Johnson | JNJ | 145.01 | 0.69(0.48%) | 16990 |
JPMorgan Chase and Co | JPM | 100.4 | 0.60(0.60%) | 19680 |
McDonald's Corp | MCD | 227.2 | 1.20(0.53%) | 1236 |
Merck & Co Inc | MRK | 79 | 0.33(0.42%) | 6129 |
Microsoft Corp | MSFT | 215.7 | 1.48(0.69%) | 137725 |
Nike | NKE | 127.81 | 0.38(0.30%) | 3057 |
Pfizer Inc | PFE | 37.94 | 0.14(0.38%) | 43992 |
Procter & Gamble Co | PG | 144.05 | 2.14(1.51%) | 139211 |
Starbucks Corporation, NASDAQ | SBUX | 88.14 | 0.54(0.62%) | 1888 |
Tesla Motors, Inc., NASDAQ | TSLA | 432.39 | 1.56(0.36%) | 477811 |
The Coca-Cola Co | KO | 49.85 | 0.23(0.46%) | 3928 |
Travelers Companies Inc | TRV | 113.75 | 1.91(1.71%) | 3284 |
Twitter, Inc., NYSE | TWTR | 46 | 0.18(0.39%) | 24273 |
UnitedHealth Group Inc | UNH | 325.28 | 1.06(0.33%) | 643 |
Verizon Communications Inc | VZ | 57.4 | 0.10(0.17%) | 11602 |
Visa | V | 197.96 | 0.99(0.50%) | 414858 |
Wal-Mart Stores Inc | WMT | 143.47 | 0.52(0.36%) | 9223 |
Walt Disney Co | DIS | 124.64 | 0.41(0.33%) | 7772 |
Yandex N.V., NASDAQ | YNDX | 57.34 | 0.39(0.68%) | 7640 |
- Say he is willing to go more than $2.2 trillion in total stimulus
The Commerce
Department reported on Tuesday the housing starts rose by 1.9 percent m-o-m in September
to a seasonally adjusted annual pace of 1.415 million, while building permits surged
by 5.2 percent m-o-m to an annual rate of 1.553 million.
Economists had
forecast housing starts increasing to a pace of 1.457 million units last month
and building permits rising to a pace of 1.520 million units.
Data for August
was revised to show homebuilding dropping to a pace of 1.388 million units,
instead of decreasing at a rate of 1.416 million units as previously reported, and
permits declining to a pace of 1.476 million units, instead of falling at a
rate of 1.470 million units as previously reported.
According to
the report, permits for single-family homes, the largest segment of the market,
jumped 7.8 percent m-o-m in September, while approvals for the multi-family homes segment declined
0.9 percent m-o-m.
In the
meantime, groundbreaking on single-family homes climbed 8.5 percent m-o-m in September, while housing
starts for the multi-family plunged 14.7 percent m-o-m.
FXStreet notes that EUR/CHF maintains a large top and economists at Credit Suisse expect further weakness to unfold in due course, with pivotal support seen next at the 200-day average at 1.0678.
“EUR/CHF fell on Monday and backed away from the ‘neckline’ to the large topping structure, which reinforces our downside bias. With daily MACD momentum also still clearly pointing lower, we see support initially at 1.0702/00, then 1.0689/88, ahead of the 200-day average at 1.0678. Whilst we would expect this to hold at first, below can see support next at 1.0650, ahead of the low of July and psychological inflection point at 1.0607/00. Beyond here would see support next at the 78.6% retracement of the May/June surge at 1.0593, ahead of the “measured top objective” seen at 1.0580.”
“Resistance is seen initially at 1.0730/36, which we ideally look for to hold to maintain the top."
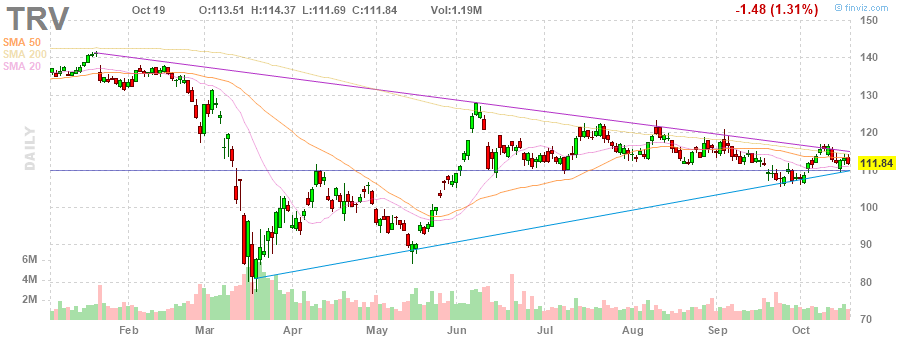
Travelers (TRV) reported Q3 FY 2020 earnings of $3.12 per share (versus $1.43 per share in Q3 FY 2019), beating analysts’ consensus estimate of $3.07 per share.
The company’s quarterly revenues amounted to $7.771 bln (+2.7% y/y), beating analysts’ consensus estimate of $7.317 bln.
TRV rose to $115.50 (+3.27%) in pre-market trading.
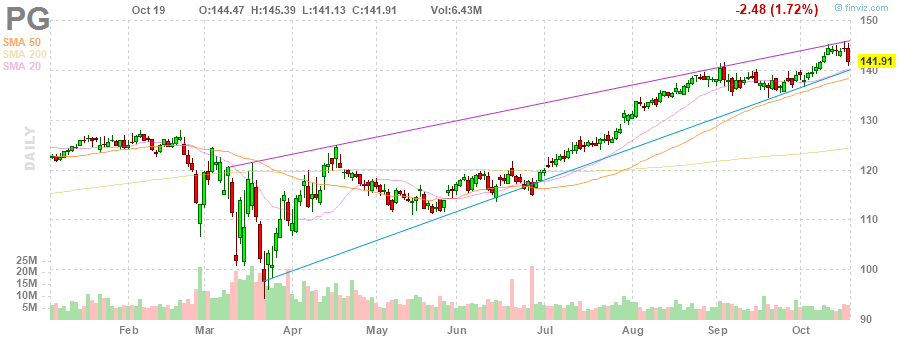
Procter & Gamble (PG) reported Q1 FY 2021 earnings of $1.63 per share (versus $1.37 per share in Q1 FY 2020), beating analysts’ consensus estimate of $1.42 per share.
The company’s quarterly revenues amounted to $19.318 bln (+8.5% y/y), beating analysts’ consensus estimate of $18.379 bln.
The company also issued in-line guidance for FY 2021, raising core EPS growth from 3-7% y/y to 5-8% y/y, which translates to $5.38-5.53, versus analysts’ consensus estimate of $5.39.
PG rose to $144.25 (+1.65%) in pre-market trading.
FXStreet notes that financial markets have been trading in a wide range since August. For example, US equity markets have not been able to make new highs in six weeks, the longest period since this new bull market began in March. Uncertainty about fiscal stimulus, the US election and the pandemic could mean the correction isn’t over, according to Mike Wilson, Chief Investment Officer and Chief US Equity Strategist at Morgan Stanley.
“From a technical perspective, I've been closely watching a key resistance area for the S&P 500 since early September. And that comes in around 3550. Last week, the index failed to break through that level for the second time in two months. This technical failure is not the end of the bull market, but it does suggest to me that the correction that began in September probably is incomplete. In short, that means equity markets could experience another 10% correction back toward more formidable support levels. More specifically, the 200-day moving average, which comes in around 3125.”
“At today's prices, the S&P 500 is trading at an equity risk premium of 380 basis points... However, with so much uncertainty surrounding the US elections, Brexit and the arriving second wave of COVID-19, we think the equity risk premium should be about 10% higher. In short, we like our 3100-3550 range on the S&P 500 as a good guide for risk taking, both from a technical and valuation perspective.”
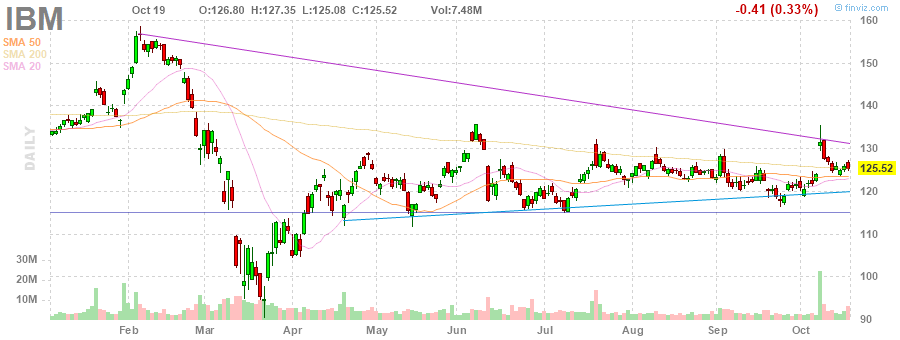
IBM (IBM) reported Q3 FY 2020 earnings of $2.58 per share (versus $2.68 per share in Q3 FY 2019), in line with analysts’ consensus estimate of $2.58 per share.
The company’s quarterly revenues amounted to $17.560 bln (-2.6% y/y), roughly in line with analysts’ consensus estimate of $17.557 bln.
IBM fell to $121.94 (-2.85%) in pre-market trading.
- Says in order for a deal to happen, both sides need to meet
- Confirms that EU's chief Brexit negotiator Barnier will speak with UK's chief Brexit negotiator Frost later today
| Time | Country | Event | Period | Previous value | Forecast | Actual |
|---|---|---|---|---|---|---|
| 08:00 | Eurozone | Current account, unadjusted, bln | August | 25.5 | 21.8 | |
| 09:30 | United Kingdom | MPC Member Vlieghe Speaks |
GBP traded mixed against its major rivals in the European session on Tuesday as investors continued to track developments in trade talks between the EU and the UK. The pound rose against JPY, AUD and NZD, fell against EUR, CHF and CAD, and changed little against USD.
On Monday, the UK's Cabinet Minister Michael Gove reiterated that the EU must change its approach on post-Brexit trade talks if it wants to restart negotiations. The trade talks were halted last week after the British Prime Minister (PM) Boris Johnson concluded that there was no point in continuing them and the UK should get ready for an Australia-style no-deal break with the EU. However, he added that Britain would listen if there was "a fundamental change of approach" from Brussels.
Bloomberg reported earlier today, citing an EU source, that the EU and the UK chief negotiators, Michel Barnier and David Frost, will discuss next steps in negotiations later today, after having agreed to "intensify" them at Monday's meeting.
Despite an impasse in the EU-UK talks, investors still hope that the sides eventually will agree on some sort of an agreement.
FXStreet reports that economist Lee Sue Ann and Senior FX Strategist Peter Chia at UOB Group reviewed the current developments around Brexit and the prospects around the British pound.
“UK PM Boris Johnson has claimed there will be no more trade and security talks with the European Union (EU). “Unless there’s a fundamental change of approach, we’re going to go to the Australia solution, and we should do it with great confidence,” he reportedly said. The “Australia solution” refers to trading on World Trade Organization (WTO) terms — in other words, without a formal trade deal.”
“Whilst the chances of a “no-deal” happening have increased, a “no-deal” scenario is not yet certain, as talks will continue. EU’s chief negotiator Michel Barnier and UK’s chief negotiator David Frost will, however, resume technical talks on Monday.”
“Boris Johnson’s posturing towards a “no-deal” is a clear negative on the GBP. Sentiment on the currency is already dented by a new wave of coronavirus infections across the UK. So, until an eleventh-hour deal, the risk is still to the downside of GBP/USD. There is also scope for further shorts in the GBP/USD as net speculative short-positioning is only one-tenth (US$792m now vs US$7.8b in Aug 2019) of what is reached last summer when pricing for a “no-deal” Brexit was the most intense. So, we reiterate our defensive view on GBP/USD in the immediate quarter and expect the currency pair at 1.25 at end-4Q20.”
FXStreet notes that the US dollar has lost some ground at the start of this week which has helped to lift EUR/USD back towards the 1.1800-level and cable briefly back above 1.3000 on Monday as it is still holding out hope for pre-election fiscal stimulus. However, economists at MUFG Bank do not expect the bill to be passed before the US elections on November 3 and see the USD supported until then.
“The partial reversal of last week’s US dollar gains has been driven in part by renewed optimism over the prospect of US fiscal stimulus. According to reports, House speaker Nancy Pelosi and Treasury Secretary Seven Mnuchin have ‘continued to narrow their differences’ on a pre-election COVID-19 relief package. President Trump has reportedly stated as well that he is ready to match the $2.2 trillion spending level demanded by Democrats. Nancy Pelosi has emphasized though that time is running out to reach a deal, and hopes to have clarity on whether they will be able to pass a stimulus bill before the election by the end of today.”
“There have been few signs yet that the Senate Republicans will be willing to back a larger stimulus bill. In these circumstances, we remain sceptical that a fiscal stimulus bill will be passed before the election. But remain more hopeful that a significant fiscal stimulus bill will be passed after the election especially if there is Blue Wave. It could provide the next bullish catalyst for risk assets and high beta currencies. Until then market participants are likely to remain more cautious ahead of the election supporting the US dollar.”
FXStreet notes that USD/CHF sellers attack 0.9100 round-figures on Tuesday as the previous breached uptrend now offers resistance at 0.9184. Karen Jones, Team Head FICC Technical Analysis Research at Commerzbank, is closely watching the 0.9048 mid-September low as a break below here would open the path for further losses.
“USD/CHF yesterday failed at the breached two-month uptrend line which now acts as resistance 0.9184.”
“Intraday Elliott wave counts remain negative and for now we will maintain a negative bias below 0.9190.”
“Attention on the 0.9048 mid-September low. Only a slide below 0.9048 will target the 0.8998 recent low. The recent low at 0.8998 guards 0.8943 (TD support). Failure at 0.8943 is needed to introduce scope to the 0.8703/0.8698 2014 lows.”
FXStreet reports that economists at UBS expect markets to remain more volatile than normal, notably into the US election.
“Whatever the outcome of the US election, we think new stimulus will be rolled out after the vote and lift economic growth. The second most likely outcome is the status quo in our view. This scenario presents the risk of fiscal policy gridlock, which would further contribute to volatility. But even in this scenario, we would expect some stimulus measures to pass.”
“Successful vaccine trials will increase certainty about the economic outlook. Critical Phase 3 efficacy data for the most advanced vaccines in development is likely this month or next..”
“Central bank policy is making the long-term case for equities over cash even clearer. The Fed projects that rates will remain on hold until at least the end of 2023. At the same time, the shift to average inflation targeting suggests policymakers may be willing to accept a period of moderately higher inflation. Real returns on cash are likely to remain negative, and cash lump sums can deplete quickly when we consider the possibility that personal spending may rise more rapidly than interest rates. For investors looking to draw on their savings to fund their spending, this combination of factors makes it more important to be invested in growth assets.”
Not yet at a point where we can reach a conclusion on negative rates
There is a risk that negative rates end up being counterproductive
Outlook for monetary policy is skewed towards adding further stimulus
QE is probably less potent now than in March
Risks are skewed towards even larger job losses
Difficult to see a scenario where all furlough workers are reintegrated seamlessly
The speed of the recovery is likely to be slower while the virus remains a concern
FXStreet reports that Karen Jones, Team Head FICC Technical Analysis Research at Commerzbank, maintains a bearish bias on the aussie.
“AUD/USD continues to weigh on the downside – a negative bias remains entrenched below the short-term downtrend at 0.7198 which continues to cap.”
“The downtrend maintains a negative bias and the near-term risk remains for a slide to 0.7006, the September low and 0.6964, the 23.6% Fibonacci retracement. There is scope for this to extend towards the 200-day ma, the February high and mid-June low at 0.6791/74, which is expected to hold the downside.”
Bloomberg reports that according to people familiar with the matter the Bank of Japan is likely to consider changing its inflation forecasts to reflect the short-term impact on prices of a government travel campaign at a policy meeting next week, .
The central bank will probably discuss cutting its price projection for this fiscal year ending in March to account for the downward pressure on prices of Prime Minister Yoshihide Suga’s Go To Travel campaign, the people said. The campaign offers subsidized domestic travel. A downgrade of the projection wouldn’t trigger any additional action by the BOJ, the people added.
FXStreet reports that economists at HSBC think the Chinese yuan can still outperform many other currencies in its basket, supported by bond inflows.
“Markets may be starting to have concerns about a slowdown in China’s recovery from here. That said, we believe the People’s Bank of China (PBoC) will keep the overall monetary policy stance accommodative.”
“For the CNY, the current situation looks quite similar to 4Q17. In September 2017, as the China Foreign Exchange Trade System (CFETS) RMB Index rose to around 95 and China’s growth data showed signs of peaking momentum, the PBoC lowered the foreign exchange (forex) risk reserve ratio for forward forex trading from 20% to 0%. The first removal of the forex reserve requirement in September 2017 did not lead to a complete reversal for the downward trend in USD/CNY, but there was a pause in 4Q17 before the CNY resumed appreciating in 1Q18. Similarly, this time around, we think there could also be a pause in the CNY’s appreciation for similar reasons, as well as due to potential uncertainty around the US elections.”
According to the report from ECB, the current account of the euro area recorded a surplus of €20 billion in August 2020, increasing by €3 billion from the previous month. Surpluses were recorded for goods (€32 billion) and services (€2 billion). Deficits were recorded for secondary income (€11 billion) and primary income (€4 billion).
In the 12 months to August 2020, the current account recorded a surplus of €224 billion (1.9% of euro area GDP), compared with a surplus of €265 billion (2.2% of euro area GDP) in the 12 months to August 2019. This decline was driven by reductions in the surpluses for services (down from €68 billion to €25 billion) and for primary income (down from €67 billion to €24 billion). These developments were partly offset by a larger surplus for goods (up from €294 billion to €323 billion) and a smaller deficit for secondary income (down from €164 billion to €148 billion).
In financial account, euro area residents’ net acquisitions of foreign portfolio investment securities totalled €549 billion and non-residents’ net acquisitions of euro area portfolio investment securities totalled €446 billion in 12 months to August 2020
RTTNews reports that S&P Global Ratings retained the sovereign ratings of Australia at 'AAA' with a negative outlook.
The agency said the Covid-19 pandemic dealt Australia a severe economic and fiscal shock, which has substantially deteriorated the government's fiscal headroom at the 'AAA' rating level.
The general government deficit is forecast to peak at 14 percent of GDP in fiscal 2021 before narrowing, and net general government debt to reach more than 40 percent of GDP by fiscal 2023.
However, with strong institutions, a credible monetary policy, and floating exchange-rate regime, Australia's typically strong fiscal performance remains credit strength for the rating, the agency said.
| Time | Country | Event | Period | Previous value | Forecast | Actual |
|---|---|---|---|---|---|---|
| 00:30 | Australia | RBA Meeting's Minutes | ||||
| 06:00 | Germany | Producer Price Index (YoY) | September | -1.2% | -1.4% | -1% |
| 06:00 | Germany | Producer Price Index (MoM) | September | 0% | -0.1% | 0.4% |
In today's Asian trading, the US dollar traded without significant fluctuations against the euro and the Japanese yen. Investors continue to follow the news regarding the approval of new economic incentives in the United States.
House speaker Nancy Pelosi on Saturday night called on the White house to reach an agreement on the remaining outstanding issues within 48 hours. Pelosi and US Treasury Secretary Steven Mnuchin were scheduled to hold regular discussions on Monday.
Meanwhile, The Washington Post reported, citing sources, that a deal between Pelosi and the administration of US President Donald Trump does not "sound like an imminent one."
The People's Bank of China (PBOC) has kept its benchmark loan interest rate (LPR) unchanged for the sixth consecutive month as the economy continues to recover from the crisis caused by the coronavirus pandemic. The annual LPR is left at 3.85% per annum. The last time this rate was lowered in April this year.
The Australian dollar is declining. The Reserve Bank of Australia discussed the possibility of additional monetary easing to support the labor market and the economy as a whole, according to the minutes of the October meeting of the RBA.
The ICE index, which tracks the dynamics of the US dollar against six currencies (euro, swiss franc, yen, canadian dollar, pound sterling and swedish krona), rose 0.03%.
FXStreet reports that in opinion of FX Strategists at UOB Group, USD/CNH could grind lower and tests the 6.6450 level in the next weeks.
“While we expected USD to weaken yesterday, we held the view that ‘any weakness is likely limited to a test of the month-to-date low of 6.6788’. The subsequent weakness exceeded our expectation as USD plummeted to a low of 6.6700. The rapid decline is oversold, but we see room for another down-leg towards 6.6580 before the current weakness should stabilize. Resistance is at 6.6850 followed by 6.6930.”
FXStreet reports that economists at Westpac expect the US Dollar Index to trade at the upper boundary of the 93.50-95 range in the short-term.
“DXY should continue to trade on the higher side of recent ranges while new COVID-19 cases in Europe surge, activity restrictions tighten, and Brexit and US fiscal stimulus prospects remain uncertain.
“Blue wave election expectations and associated hopes for a larger US fiscal deal early 2021 likely prove more decisive for the USD multi-week, sustaining the medium-term bear trend.”
eFXdata reports that NAB Research discusses USD/JPY outlook.
"Japans’ economic recovery remains stuck in the slow lane. Deflationary pressures add to our expectations for a lower USD/JPY. A post mortem on the Q3 Tankan survey has left us comfortable with our expectations of a slow economic recovery in Japan and lower USD/JPY over the coming year,"
"USD/JPY now trades around the ¥105 mark suggesting exporter profits look set to remain under pressure. On its own, the collapse in profits doesn't bode well for USD/JPY. Our medium-term view on USD/JPY sees the pair slowly but surely heading towards a lower trading range of ¥100 to ¥105 in 2021,"NAB adds.
According to the report from the Federal Statistical Office (Destatis), in September 2020, the index of producer prices for industrial products decreased by 1.0% compared with the corresponding month of the preceding year. Economists had expected a 1.4% decrease. In August the annual rate of change all over had been –1.2%/ Compared with the preceding month August the overall index increased by 0.4% in September 2020 (unchanged in August). Economists had expected a 0.1% decrease.
Energy prices as a whole decreased by 3.3%. On an annual basis, prices of petroleum products were down 17.9%, prices of natural gas (distribution) decreased by 8.2%.
The overall index disregarding energy was 0.2% down in September 2019.
Prices of intermediate goods decreased by 1.3% compared to September 2019. Prices of non-durable consumer goods decreased by 0.1% compared to September 2019. Prices of capital goods increased by 0.9% compared to September 2019, durable consumer goods by 1.4%.
RTTNews reports that China's central bank left its benchmark lending rates unchanged for the sixth consecutive month.
The one-year loan prime rate was retained at 3.85 percent and the five-year loan prime rate was maintained at 4.65 percent.
The one-year and five-year loan prime rates were last reduced in April. The one-year loan prime rate was lowered by 20 basis points and five-year rate by 10 basis points in April.
The interest rates were expected to be retained today as the rate on its medium-term lending facility or MLF, which serves as a guide for the LPR, was maintained this month.
With the PBoC appearing reluctant to keep monetary policy loose for longer than needed amid a broadening economic recovery, we think the next move in the LPR will be an increase early next year, economists at Capital Economics said.
EUR/USD
Resistance levels (open interest**, contracts)
$1.1873 (4048)
$1.1848 (484)
$1.1828 (505)
Price at time of writing this review: $1.1775
Support levels (open interest**, contracts):
$1.1709 (977)
$1.1684 (1546)
$1.1654 (2049)
Comments:
- Overall open interest on the CALL options and PUT options with the expiration date November, 6 is 53727 contracts (according to data from October, 19) with the maximum number of contracts with strike price $1,1800 (4048);
GBP/USD
Resistance levels (open interest**, contracts)
$1.3060 (265)
$1.3024 (1681)
$1.2999 (213)
Price at time of writing this review: $1.2946
Support levels (open interest**, contracts):
$1.2862 (244)
$1.2816 (567)
$1.2788 (771)
Comments:
- Overall open interest on the CALL options with the expiration date November, 6 is 32336 contracts, with the maximum number of contracts with strike price $1,3950 (3694);
- Overall open interest on the PUT options with the expiration date November, 6 is 24101 contracts, with the maximum number of contracts with strike price $1,2050 (2391);
- The ratio of PUT/CALL was 0.75 versus 0.74 from the previous trading day according to data from October, 19
* - The Chicago Mercantile Exchange bulletin (CME) is used for the calculation.
** - Open interest takes into account the total number of option contracts that are open at the moment.
| Raw materials | Closed | Change, % |
|---|---|---|
| Brent | 42.32 | -0.87 |
| Silver | 24.34 | 1 |
| Gold | 1903.302 | 0.24 |
| Palladium | 2340.36 | 0.66 |
| Index | Change, points | Closed | Change, % |
|---|---|---|---|
| NIKKEI 225 | 260.5 | 23671.13 | 1.11 |
| Hang Seng | 155.47 | 24542.26 | 0.64 |
| KOSPI | 5.21 | 2346.74 | 0.22 |
| ASX 200 | 52.6 | 6229.4 | 0.85 |
| FTSE 100 | -34.93 | 5884.65 | -0.59 |
| DAX | -54.33 | 12854.66 | -0.42 |
| CAC 40 | -6.59 | 4929.27 | -0.13 |
| Dow Jones | -410.89 | 28195.42 | -1.44 |
| S&P 500 | -56.89 | 3426.92 | -1.63 |
| NASDAQ Composite | -192.68 | 11478.88 | -1.65 |
| Time | Country | Event | Period | Previous value | Forecast |
|---|---|---|---|---|---|
| 00:30 (GMT) | Australia | RBA Meeting's Minutes | |||
| 06:00 (GMT) | Switzerland | Trade Balance | September | 3.4 | |
| 06:00 (GMT) | Germany | Producer Price Index (YoY) | September | -1.2% | -1.4% |
| 06:00 (GMT) | Germany | Producer Price Index (MoM) | September | 0% | -0.1% |
| 08:00 (GMT) | Eurozone | Current account, unadjusted, bln | August | 25.5 | |
| 09:30 (GMT) | United Kingdom | MPC Member Vlieghe Speaks | |||
| 12:30 (GMT) | U.S. | Housing Starts | September | 1.416 | 1.45 |
| 12:30 (GMT) | U.S. | Building Permits | September | 1.47 | 1.505 |
| 17:00 (GMT) | U.S. | FOMC Member Charles Evans Speaks |
| Pare | Closed | Change, % |
|---|---|---|
| AUDUSD | 0.70627 | -0.18 |
| EURJPY | 124.045 | 0.47 |
| EURUSD | 1.17665 | 0.43 |
| GBPJPY | 136.412 | 0.29 |
| GBPUSD | 1.29394 | 0.26 |
| NZDUSD | 0.66021 | -0.01 |
| USDCAD | 1.31863 | -0.04 |
| USDCHF | 0.90992 | -0.53 |
| USDJPY | 105.422 | 0.03 |


© 2000-2026. All rights reserved.
This site is managed by Teletrade D.J. LLC 2351 LLC 2022 (Euro House, Richmond Hill Road, Kingstown, VC0100, St. Vincent and the Grenadines).
The information on this website is for informational purposes only and does not constitute any investment advice.
The company does not serve or provide services to customers who are residents of the US, Canada, Iran, The Democratic People's Republic of Korea, Yemen and FATF blacklisted countries.
Making transactions on financial markets with marginal financial instruments opens up wide possibilities and allows investors who are willing to take risks to earn high profits, carrying a potentially high risk of losses at the same time. Therefore you should responsibly approach the issue of choosing the appropriate investment strategy, taking the available resources into account, before starting trading.
Use of the information: full or partial use of materials from this website must always be referenced to TeleTrade as the source of information. Use of the materials on the Internet must be accompanied by a hyperlink to teletrade.org. Automatic import of materials and information from this website is prohibited.
Please contact our PR department if you have any questions or need assistance at pr@teletrade.global.
transfers