- Analytics
- News and Tools
- Market News
CFD Markets News and Forecasts — 21-10-2020
| Time | Country | Event | Period | Previous value | Forecast |
|---|---|---|---|---|---|
| 06:00 (GMT) | Germany | Gfk Consumer Confidence Survey | November | -1.6 | -2.8 |
| 08:30 (GMT) | United Kingdom | MPC Member Andy Haldane Speaks | |||
| 09:25 (GMT) | United Kingdom | BOE Gov Bailey Speaks | |||
| 10:00 (GMT) | United Kingdom | CBI industrial order books balance | October | -48 | -45 |
| 12:30 (GMT) | U.S. | Continuing Jobless Claims | October | 10018 | 9500 |
| 12:30 (GMT) | U.S. | Initial Jobless Claims | October | 898 | 860 |
| 14:00 (GMT) | Eurozone | Consumer Confidence | October | -13.9 | -15 |
| 14:00 (GMT) | U.S. | Leading Indicators | September | 1.2% | 0.7% |
| 14:00 (GMT) | U.S. | Existing Home Sales | September | 6 | 6.3 |
| 17:10 (GMT) | U.S. | Fed Barkin Speech | |||
| 21:45 (GMT) | New Zealand | CPI, y/y | Quarter III | 1.5% | 1.7% |
| 21:45 (GMT) | New Zealand | CPI, q/q | Quarter III | -0.5% | 0.9% |
| 22:00 (GMT) | U.S. | FOMC Member Kaplan Speak | |||
| 23:01 (GMT) | United Kingdom | Gfk Consumer Confidence | October | -25 | -28 |
| 23:30 (GMT) | Japan | National CPI Ex-Fresh Food, y/y | September | -0.4% | -0.4% |
| 23:30 (GMT) | Japan | National Consumer Price Index, y/y | September | 0.2% |
FXStreet notes that current trends in the base metals markets are complex and rely more on macro-economic developments rather than fundamental drivers. The economic recovery expected in the coming months is set to support a strengthening of the sector in 2021, according to strategists at ABN Amro.
“Recent positive macro-economic trends in China and its massive infrastructure stimulus package underpins market sentiment. Chinese imports of metals has remained relatively strong, implying a high need for raw materials for its manufacturing sector.”
“The uncertainty over the ultimate economic impact of the second wave of coronavirus remains high. Next to that, there are no deficits in base metals markets anymore and inventories are relatively high. This also overhangs the base metals complex and increases price volatility.”
“A further increase in this Chinese demand and solid macro-economic data going forward is likely to keep a floor under most base metals markets.”
“For 2021, global economic growth will show a recovery from current lows and base metals prices will strengthen further on this. Prices will also find support the trend in the dollar. A weaker dollar during 2021 makes metals cheaper for non-dollar holders and supports prices.”
The U.S. Energy
Information Administration (EIA) revealed on Wednesday that crude inventories
fell by 1.001 million barrels in the week ended October 16. Economists had
forecast a drop of 1.021 million barrels.
At the same
time, gasoline stocks rose by 1.895 million barrels, while analysts had
expected a decline of 1.829 million barrels. Distillate stocks tumbled by 3.832
million barrels, while analysts had forecast a decrease of 1.743 million
barrels.
Meanwhile, oil
production in the U.S. plunged by 600,000 barrels a day to 9.900 million
barrels a day.
U.S. crude oil
imports averaged 5.1 million barrels per day last week, down by 167,000 barrels
per day from the previous week.
- Says "optimistic morning" at White House on stimulus talks
- Things are moving in "favourable direction"
Statistics
Canada reported on Wednesday the New Housing Price Index (NHPI) surged 1.2
percent m-o-m in September, following a 0.5 percent m-o-m advance in the
previous month. This was the largest monthly jump in home prices in 14 years.
Economists had
forecast the NHPI to increase 0.5 percent m-o-m in September.
According to
the report, new home prices rose in 24 out of the 27 census metropolitan areas
(CMAs) surveyed in September, with Victoria (+2.5 percent m-o-m) and Hamilton
(+2.3 percent m-o-m) recording the largest monthly gains, as both CMAs offer affordable
and large properties relative to larger city centers and are becoming more attractive
choices for potential homebuyers who are able to work from home.
On the
contrary, Regina (-0.3 percent m-o-m) and Saskatoon (-0.2 percent m-o-m) were
the only two CMAs with decreased new home prices in September.
In y-o-y terms,
NHPI climbed 3.2 percent in September, following a 2.1 percent gain in the
previous month. This was the largest y-o-y advance since January 2018.
Statistics
Canada announced on Wednesday that the Canadian retail sales rose 0.4 percent
m-o-m to CAD53.19 billion in August, following an unrevised 0.6 percent m-o-m increase
in July.
Economists had forecast a 1.1 percent m-o-m advance for August.
According to the report, sales at gasoline stations (+1.2 percent m-o-m) rose for the fourth straight month in August, while sales at motor vehicle and parts dealers edged down (-0.1 percent m-o-m) following three consecutive monthly increases.
Excluding motor
vehicle and parts dealers, retail sales grew 0.5 percent m-o-m in August compared
to an unrevised 0.4 percent m-o-m drop in July and economists’ forecast for a
0.9 percent m-o-m gain. Excluding motor vehicle and parts dealers and gasoline
stations, retail sales went up 0.4 percent m-o-m in August after decreasing 0.8
percent m-o-m in July, bolstered by higher sales at building material and
garden equipment and supplies dealers (+4.5 percent m-o-m) and food and
beverage stores (+0.8 percent m-o-m).
In y-o-y terms,
Canadian retail sales climbed 3.5 percent in August, following a revised 2.9
percent increase in July (originally a 2.7 percent rise).
- Aside from virus, biggest downside risk is no fiscal support
- U.S. recovery highly uneven and highly uncertain
- Q3 GDP has likely recovered more than half of its H1 decline
- Financing conditions favorable for large businesses, tight for small businesses
- Labor market improvement rapid but uneven, easiest gains behind us
- U.S. rates likely to stay below neutral for a period after liftoff
- In the months ahead Fed to clarify how asset purchases to best work with forward guidance
- Premature withdrawal of fiscal support would risk allowing recessionary dynamics to become entrenched, holding back employment and spending, increasing scarring from extended unemployment spells, leading more businesses to shutter, and ultimately harming productive capacity
U.S. stock-index futures traded flat on Wednesday, as investors continued to monitor talks on a new stimulus package in Washington.
Global Stocks:
Index/commodity | Last | Today's Change, points | Today's Change, % |
Nikkei | 23,639.46 | +72.42 | +0.31% |
Hang Seng | 24,754.42 | +184.88 | +0.75% |
Shanghai | 3,325.02 | -3.08 | -0.09% |
S&P/ASX | 6,191.80 | +7.20 | +0.12% |
FTSE | 5,809.40 | -79.82 | -1.36% |
CAC | 4,882.83 | -46.45 | -0.94% |
DAX | 12,639.91 | -97.04 | -0.76% |
Crude oil | $40.97 | -1.75% | |
Gold | $1,928.00 | 0.66% |
- BoE committed not to tighten policy until we are confident that it is appropriate to do so
- QE is BoE's marginal policy tool
- BoE could push UK yields lower
- While there might be appropriate time to use negative rates, that time is not right now
- MPC's earlier statement that negative rates at this time could be less effective still applies
- Burden of proof for any future tightening is high
- Negative rates certainly in toolbox for potential use in future as assessment of effectiveness changes
- Lower bound is likely to be different across different countries
- In some countries lower bound could be positive
(company / ticker / price / change ($/%) / volume)
ALCOA INC. | AA | 12.89 | 0.09(0.70%) | 3722 |
Amazon.com Inc., NASDAQ | AMZN | 3,219.00 | 1.99(0.06%) | 28084 |
American Express Co | AXP | 102.78 | -0.36(-0.35%) | 3011 |
Apple Inc. | AAPL | 117.19 | -0.32(-0.27%) | 875784 |
AT&T Inc | T | 26.84 | 0.08(0.30%) | 149618 |
Boeing Co | BA | 167 | -0.24(-0.14%) | 45769 |
Caterpillar Inc | CAT | 169.1 | 0.11(0.07%) | 1108 |
Cisco Systems Inc | CSCO | 39.03 | -0.17(-0.43%) | 54798 |
Citigroup Inc., NYSE | C | 43.62 | 0.10(0.23%) | 56994 |
Exxon Mobil Corp | XOM | 33.59 | -0.11(-0.33%) | 22286 |
Facebook, Inc. | FB | 279.76 | 12.20(4.56%) | 637728 |
FedEx Corporation, NYSE | FDX | 287.99 | 0.59(0.20%) | 4395 |
Ford Motor Co. | F | 7.78 | 0.04(0.52%) | 252488 |
Freeport-McMoRan Copper & Gold Inc., NYSE | FCX | 17.84 | 0.23(1.31%) | 43966 |
General Electric Co | GE | 7.29 | -0.05(-0.68%) | 2002530 |
General Motors Company, NYSE | GM | 36.48 | 0.88(2.47%) | 437786 |
Goldman Sachs | GS | 208 | -0.03(-0.01%) | 8263 |
Google Inc. | GOOG | 1,566.00 | 10.07(0.65%) | 10816 |
Home Depot Inc | HD | 286.25 | 0.21(0.07%) | 465 |
HONEYWELL INTERNATIONAL INC. | HON | 172.61 | -0.65(-0.38%) | 381 |
Intel Corp | INTC | 53.27 | -0.16(-0.30%) | 87092 |
International Business Machines Co... | IBM | 117.41 | 0.04(0.03%) | 33940 |
International Paper Company | IP | 46.42 | 0.02(0.04%) | 521 |
Johnson & Johnson | JNJ | 144.9 | 0.35(0.24%) | 5255 |
JPMorgan Chase and Co | JPM | 100.53 | 0.16(0.16%) | 51174 |
McDonald's Corp | MCD | 226.99 | -0.46(-0.20%) | 33871 |
Merck & Co Inc | MRK | 78.55 | 0.28(0.36%) | 89728 |
Microsoft Corp | MSFT | 214 | -0.65(-0.30%) | 163847 |
Nike | NKE | 128.59 | 0.10(0.08%) | 2683 |
Pfizer Inc | PFE | 37.58 | 0.09(0.24%) | 30300 |
Procter & Gamble Co | PG | 142.5 | 0.02(0.01%) | 3921 |
Starbucks Corporation, NASDAQ | SBUX | 88.56 | 0.05(0.06%) | 4415 |
Tesla Motors, Inc., NASDAQ | TSLA | 421.22 | -0.72(-0.17%) | 305177 |
The Coca-Cola Co | KO | 50.19 | -0.06(-0.12%) | 17698 |
Twitter, Inc., NYSE | TWTR | 48.93 | 2.58(5.57%) | 302975 |
UnitedHealth Group Inc | UNH | 324.5 | 1.09(0.34%) | 3662 |
Verizon Communications Inc | VZ | 57.75 | 0.50(0.87%) | 173924 |
Visa | V | 198.15 | 0.45(0.23%) | 7318 |
Walt Disney Co | DIS | 124.6 | -0.35(-0.28%) | 6212 |
Yandex N.V., NASDAQ | YNDX | 55.56 | -0.57(-1.02%) | 27405 |
FXStreet notes that S&P 500 posted a relatively neutral session on Tuesday, completing an “inverted hammer” candlestick reversal, which reinforces the conviction that the “neckline” to its “head & shoulders” base and the 38.2% retracement of the recent recovery at 3428/18 will hold for a turn back higher, as per Credit Suisse.
“The S&P 500 posted a relatively neutral session on Tuesday, completing a potentially bullish ‘inverted hammer’ candlestick reversal above the “neckline” to its recently completed base at 3428/27 and the 38.2% retracement of the recent recovery at 3420/18. This reversal pattern reinforces our view that 3428/18 will provide a solid floor for the uptrend to resume.”
“Resistance moves to 3477, above which would bullishly confirm yesterday’s session for strength back to 3516/18, then 3550, above which would trigger a move back to the 3588/94 high, which is also the upper end of its ‘typical’ extreme (15% above the 200-day average). Whilst this should clearly be respected, we look for a break in due course, with our ‘measured base objective’ at 3653.”
Statistics
Canada announced on Wednesday the country’s consumer price index (CPI) fell 0.1
percent m-o-m in September, the same pace as in the previous two months.
On the y-o-y basis,
Canada’s inflation rate increased 0.5 percent last month, following a 0.1
percent advance in August.
Economists had
predicted inflation would decrease 0.1 percent m-o-m but gain 0.4 percent y-o-y
in September.
According to
the report, price changes in transportation (+0.1 percent y-o-y compared to -1.3
percent y-o-y in August), recreation, education and reading (-1.2 percent y-o-y
compared to -3.1 percent y-o-y), and shelter (+1.7 percent y-o-y compared to
+1.5 percent y-o-y) components contributed the most to the September acceleration
in the CPI. Meanwhile, the drop in gasoline prices (-10.7 percent y-o-y) in
September was comparable to the August decrease (-11.1 percent y-o-y), while
food price growth (+1.6 percent y-o-y) slowed slightly compared with last month
(+1.8 percent y-o-y).
Overall, prices
rose in six of the eight major components on a year-over-year basis in
September.
The closely watched the Bank of Canada's core index
rose 1.0 percent y-o-y in September after a 0.8 percent gain in August.
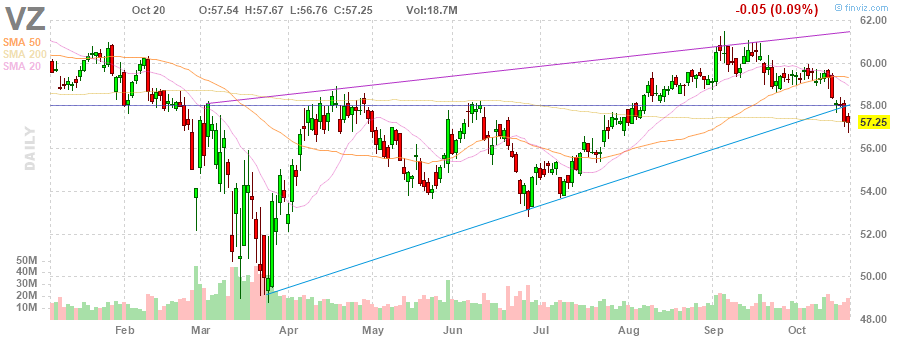
Verizon (VZ) reported Q3 FY 2020 earnings of $1.25 per share (versus $1.25 per share in Q3 FY 2019), beating analysts’ consensus estimate of $1.22 per share.
The company’s quarterly revenues amounted to $31.500 bln (-4.2% y/y), generally in line with analysts’ consensus estimate of $31.603 bln.
The company also issued raised guidance for FY 2020, projecting EPS of +0-2%, up from -2% to +2%, to $4.81-4.90 versus analysts’ consensus estimate of $4.77.
VZ rose to $57.93 (+1.19%) in pre-market trading.
| Time | Country | Event | Period | Previous value | Forecast | Actual |
|---|---|---|---|---|---|---|
| 06:00 | United Kingdom | Producer Price Index - Output (MoM) | September | 0.1% | 0.1% | -0.1% |
| 06:00 | United Kingdom | Producer Price Index - Input (MoM) | September | -0.2% | -0.4% | 1.1% |
| 06:00 | United Kingdom | Producer Price Index - Input (YoY) | September | -5.6% | -5.5% | -3.7% |
| 06:00 | United Kingdom | Producer Price Index - Output (YoY) | September | -0.9% | -0.9% | -0.9% |
| 06:00 | United Kingdom | Retail Price Index, m/m | September | -0.3% | 0.4% | 0.3% |
| 06:00 | United Kingdom | HICP ex EFAT, Y/Y | September | 0.9% | 1.3% | |
| 06:00 | United Kingdom | Retail prices, Y/Y | September | 0.5% | 1.2% | 1.1% |
| 06:00 | United Kingdom | PSNB, bln | September | -30.1 | -33.6 | -36.1 |
| 06:00 | United Kingdom | HICP, m/m | September | -0.4% | 0.5% | 0.4% |
| 06:00 | United Kingdom | HICP, Y/Y | September | 0.2% | 0.5% | 0.5% |
| 07:30 | Eurozone | ECB President Lagarde Speaks |
GBP strengthened against its major rivals in the European session on Wednesday, supported by upbeat comments on the UK-EU trade deal by the block’s chief Brexit negotiator Michel Barnier.
While speaking to the European Parliament this morning, Barnier said that a trade deal with the UK “is within reach if both sides are willing to work constructively, if both sides are willing to compromise, and if we’re able to make progress in the next few days, on the basis of legal texts, and if we’re ready in the next few days to resolve the sticking points, the trickiest subjects” He also pointed out that over the past few weeks progress had been made with on law enforcement cooperation, including protecting human rights, Europol, Eurojust, data protection and other areas and that “an outline is emerging for this deal on these points.”
“Our door remains open - it will remain open right up until the last day where we can work together. We’re willing to do intense work, to intensify talks day and night if that’s what needed to reach a draft agreement that will leave enough time for democracy”, he concluded.
In response to Barnier’s speech, the UK’s government said that they noted “with interest” his significant comments on the issues behind the current difficulties in talks and they are studying carefully what was said. They also promised that the UK’s chief negotiator David Frost will discuss the situation when he speaks to Michel Barnier later today.
Apart from Brexit-related headlines, investors also continued monitoring the coronavirus-related news as the UK is struggling to fight Covid-19 resurgence. UK prime minister Boris Johnson stated today that the government is pursuing a local and regional approach to restrictions, adding that he does think that national lockdown is not the right policy.
Market participants also received the UK’s inflation data for September. The Office for National Statistics (ONS) reported the UK’s consumer price inflation accelerated to 0.5 percent y-o-y last month from a near five-year low of 0.2 percent y-o-y in August. That was in line with economists’ forecast. Nonetheless, inflation remained well below the BoE's 2-percent target.
- National lockdown is not the right policy
- Areas with Tier 3 restrictions are already making progress
- Tier 3 restrictions will be lifted if R rate falls below 1; but other factors are also taken into account, like hospital admissions
- Tier 3 decisions will be reviewed every 28 days
The Mortgage
Bankers Association (MBA) reported on Wednesday the mortgage application volume
in the U.S. fell 0.6 percent in the week ended October 16, following a 0.7
percent decline in the previous week.
According to
the report, refinance applications increased 0.2 percent, while applications to
purchase a home declined 2.1 percent.
Meanwhile, the
average fixed 30-year mortgage rate edged up to 3.02 percent from record-low 3.00
percent.
“Despite the
uptick in rates, refinance activity held steady, with FHA refinance
applications posting a 17.6% increase, helping to offset declines in the other
loan types,” noted Joel Kan, MBA’s associate vice president of economic and
industry forecasting.
FXStreet notes that gold prices have struggled lately. A weaker dollar has supported the yellow metal somewhat but more investors have taken profit recently. Investors are now less convinced of another rise above $2,000 per ounce and are set to continue taking profits. However, economists at ABN Amro expect XAU/USD to race higher towards $2,100 in 2021.
“The US elections are approaching and we think that it is likely that more investors will take profit in gold for two reasons: First, more uncertainty could result in a more risk-off behaviour and thus liquidating long gold positions. Second, expectations of higher economic growth if Biden wins could temporarily support the dollar. As a result, gold prices will probably decline.”
“As the Fed will keep rates low for the coming years, US real yields will continue to be negative. This will support gold prices again in 2021.”
“Next year, we expect gold prices to move towards $2,000 per ounce again.”
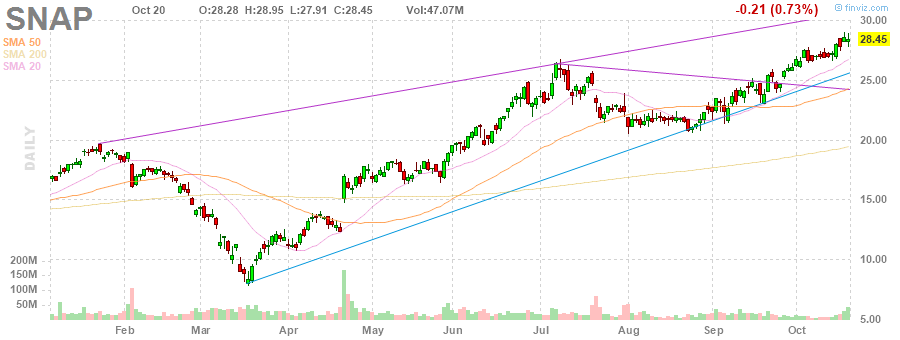
Snap (SNAP) reported Q3 FY 2020 earnings of $0.01 per share (versus -$0.04 per share in Q3 FY 2019), beating analysts’ consensus estimate of -$0.05 per share.
The company’s quarterly revenues amounted to $0.679 bln (+52.1% y/y), solidly beating analysts’ consensus estimate of $0.551 bln.
SNAP rose to $35.32 (+24.15%) in pre-market trading.
FXStreet notes that EUR/JPY moved sharply higher again on Tuesday, however, only a break above 125.11 would end the corrective risks for the core bull uptrend to resume, in the opinion of the Credit Suisse analyst team. Support stays at 123.03/01, then 122.38/23.
“EUR/JPY rebounded further on Tuesday after essentially holding above the potential uptrend from May earlier in the week. We stay biased towards further ranging here with a mild downside bias whilst below 125.11.”
“An eventual break below the October low at 123.03/01 would reassert the correction and warn of a retest of the 122.38 late September low, then more likely we think key retracement supports seen at 122.27/23 – including the 38.2% retracement of the entire rally from the May low – which we continue to look to remain a stronger floor. A break though would instead raise the prospect of a deeper setback to the ‘neckline’ to the June/July base at 121.35, with scope for the 200-day average at 121.10.”
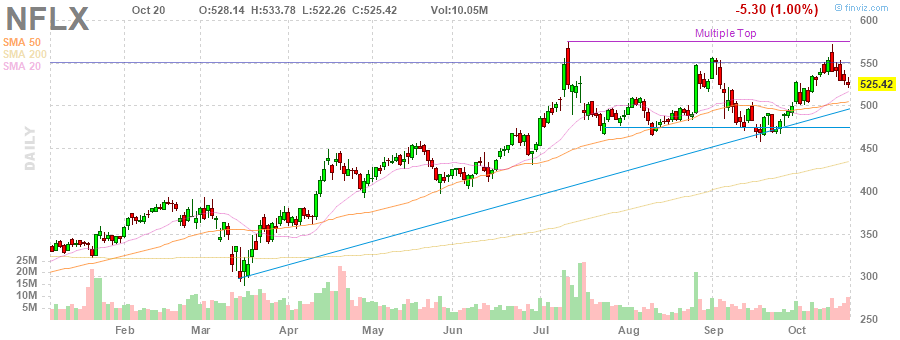
Netflix (NFLX) reported Q3 FY 2020 earnings of $1.74 per share (versus $1.09 per share in Q3 FY 2019), missing analysts’ consensus estimate of $2.14 per share.
The company’s quarterly revenues amounted to $6.436 bln (+22.7% y/y), generally in line with analysts’ consensus estimate of $6.381 bln.
It also reported global streaming paid net adds of 2.20 mln versus its prior guidance of 2.50 mln and 10.09 mln in Q2 FY 2020.
The company issued mixed guidance for Q4 FY 2020, projecting EPS of $1.35 versus analysts’ consensus estimate of $0.94 and revenues of $6.572 bln versus analysts’ consensus estimate of $6.59 bln. It also guided Q4 FY 2020 global streaming net adds of 6.00 mln.
NFLX fell to $497.99 (-5.22%) in pre-market trading.
- Warns that debt build up a financial stability risk
- We note with interest that EU's negotiator Barnier, speaking to EP this morning, has commented in significant way on issues behind the current difficulties in our talks
- We are studying carefully what was said
- New agreement is not possible unless the last one is properly respected
- Now is the time for responsibility
CNBC reports that according to Morgan Stanley portfolio manager a Democratic sweep in the coming U.S. elections will likely unleash more fiscal stimulus, but it could also cause the Federal Reserve to hike interest rates earlier than expected.
The first rate hike by the Fed could be brought forward from around 2024-2025 to 2023-2024 — depending on how other policies, such as taxation, turn out in the event of a “blue wave,” said Jim Caron, a senior member of Morgan Stanley Investment Management’s global fixed income team.
Caron said that the U.S. economy, under pressure from the coronavirus pandemic this year, was already expected to rebound in 2021. Additional stimulus that’s likely to come with a “blue wave” would boost that growth potential further, he added.
FXStreet reports that according to the strategists at ABN Amro, the most likely outcome is that Biden wins the presidency and this result is set to benefit the commodity market.
“We expect that Democratic policies would probably result in a considerably stronger US economy in the coming years. This is positive for commodities in general overall, especially if Chinese growth is resilient.”
“We also expect US real rates to remain negative or to decline further in 2021. This supports commodity prices due to the historical negative relationship between the two.”
Reuters reports that central bank governor Yi Gang said China will strike a balance between stabilising economic growth and preventing risks, even as debt was allowed to temporarily rise this year to support the coronavirus-hit economy.
Yi told that he expected China's macro leverage ratio to stabilise next year as the economy expands, after the debt gauge rose in 2020.
"Monetary policy needs to guard the 'gates' of money supply, and properly smooth out fluctuations in the macro leverage ratio, and keep it on a reasonable track in the long run," Yi said.
The Institute for International Finance (IIF) said in July that China's debt-to-GDP ratio was on track to hit 335%, from nearly 318% in the first quarter.
FXStreet reports that gold consolidation extends, but with new highs eventually expected as the yellow metal holds the $1837 support, strategists at Credit Suisse apprise.
“Gold extends its consolidation/correction following the move to our base case objective of $2075/80 in August, but is still holding flagged support at $1837, the 38.2% retracement of the rally from March.”
“We look for the $1837 support to continue to hold to maintain the sideways range ahead of a break above $1993 for a fresh look at $2075. An eventual move above here stays looked for a resumption of the core bull trend with resistance seen next at $2175, then $2300, although we continue to believe this will not be seen until next year.”
According to the report from the UK Government, UK house prices increased by 2.5% in the year to August 2020, up from 2.1% in July 2020. Economists had expected a 2.4% increase. On a non-seasonally adjusted basis, average house prices in the UK increased by 0.7% between July 2020 and August 2020, compared with a rise of 0.3% during the same period a year earlier (July 2019 and August 2019).
House price growth was strongest in England where prices increased by 2.8% in the year to August 2020. The highest annual growth within the English regions was in the East Midlands where average house prices grew by 3.6%. The lowest annual growth was in the North East, where prices increased by 0.2% in the year to August 2020.
The Royal Institution of Chartered Surveyors’ (RICS) August 2020 UK Residential Market Survey results reveal that the sales market continues to show strong momentum, even if the longer term view remains cautious. National house price growth indicator hits a four-year high and most respondents foresee demand increasing for homes with gardens over the next two years.
Reuters reports that the European Union's Brexit negotiator said that a new trade deal with Britain was "within reach" if both sides work hard to overcome the sticking points in the coming days.
"An agreement is within reach if both sides are willing to work constructively, compromise and working to make progress on the basis of legal texts and if we are able in the coming days to resolve the sticking points," Michel Barnier said.
FXStreet reports that FX Strategists at UOB Group remain bearish on USD/CNH but a drop to 6.6030 looks unlikely in the short-term.
Next 1-3 weeks: “We highlighted yesterday that ‘downward momentum in USD has improved further; next level to focus on is at 6.6450’. USD dropped to a low of 6.6563 during NY hours and closed on a soft note at 6.6647 (-0.21%). While we continue to expect further USD weakness, oversold shorter-term conditions suggest a slower pace of decline. A break of 6.6450 would not be surprising but the next major support at 6.6030 may not come into the picture so soon. Overall, USD is expected to stay under pressure unless it can move above 6.6980 (‘strong resistance’ level was at 6.7050 yesterday).”
Reuters reports that after statistics showed state borrowing had soared while tax receipts had fallen, British finance minister Rishi Sunak said that things could have been far worse.
“Whilst it’s clear that the coronavirus pandemic has had a significant impact on our public finances, things would have been far worse had we not acted in the way we did to protect millions of livelihoods,” Sunak said.
“Over time and as the economy recovers, the government will take the necessary steps to ensure the long-term health of the public finances,” he said.
| Time | Country | Event | Period | Previous value | Forecast | Actual |
|---|---|---|---|---|---|---|
| 06:00 | United Kingdom | Producer Price Index - Output (MoM) | September | 0.1% | 0.1% | -0.1% |
| 06:00 | United Kingdom | Producer Price Index - Input (MoM) | September | -0.2% | -0.4% | 1.1% |
| 06:00 | United Kingdom | Producer Price Index - Input (YoY) | September | -5.6% | -5.5% | -3.7% |
| 06:00 | United Kingdom | Producer Price Index - Output (YoY) | September | -0.9% | -0.9% | -0.9% |
| 06:00 | United Kingdom | Retail Price Index, m/m | September | -0.3% | 0.4% | 0.3% |
| 06:00 | United Kingdom | HICP ex EFAT, Y/Y | September | 0.9% | 0.6% | |
| 06:00 | United Kingdom | Retail prices, Y/Y | September | 0.5% | 1.2% | 1.1% |
| 06:00 | United Kingdom | PSNB, bln | September | -30.1 | -33.6 | -36.1 |
| 06:00 | United Kingdom | HICP, m/m | September | -0.4% | 0.5% | 0.4% |
| 06:00 | United Kingdom | HICP, Y/Y | September | 0.2% | 0.5% | 0.5% |
During today's Asian trading, the US dollar declined against the euro and the yen, while the yuan rose against the dollar to the highest in more than 2 years.
The ICE index, which tracks the dynamics of the US dollar against six currencies (Euro, Swiss franc, yen, canadian dollar, pound sterling and Swedish Krona), fell by 0.28%.
Investors continue to follow the news about the package of new economic incentives in the United States. Speaker of The House of representatives Nancy Pelosi on Tuesday announced progress in negotiations with the White house.
The focus was also on UK data. Consumer prices in the UK in September 2020 increased by 0.5% compared to the same month last year, the Office for National Statistics reported. Thus, inflation accelerated compared to August's 0.2%. Analysts on average also expected prices to rise by 0.5% year-on-year.
FXStreet reports that analysts at Natixis seek to determine whether the USD still plays this safe-haven currency role when risk aversion is high nowadays, and what factors could have changed this role.
“When risk aversion has become high, the dollar has traditionally played a safe-haven currency role, appreciating against the euro. A rise in risk aversion (1998, 2000-2001, 2008-2009, 2012, 2014, 2018-19) has led to an appreciation of the dollar against the euro. The dollar’s safe-haven role stems from the fact that when risk aversion is high (2008, 2012, 2014, 2018-19): Capital flows to the US from OECD countries, particularly from the Eurozone; but capital also flows to the US (the dollar) from emerging countries due to capital outflows.”
“The COVID-19 crisis has not given rise to a lasting appreciation of the dollar against the euro. This can be explained by: An economic reason, concern about the rising US external debt; a political reason, the end of dollar purchases by many countries (China, Russia, OPEC).”
Reuters reports that European Commission Vice-President Valdis Dombrovskis said that the European Union will be ready to approve new measures to support its member states should the economies suffer further after a new surge in COVID-19 cases.
"We will certainly keep monitoring the situation closely and we are ready to react with new proposals, if necessary," Dombrovskis told when asked whether there would be a new Recovery Fund.
Dombrovskis added that a new wave of coronavirus infections would "certainly have an effect" on the Commission's upcoming autumn economic forecasts.
eFXdata reports that TD Research discusses GBP outlook.
"For now, we think that 1.2860/65 should provide solid support in cable. The next major reassessment point to the upside does not come in until last week’s high at 1.3083, suggesting we have plenty of room to extend higher — as long as sentiment remains firm."
"We note, however, that with the final days running down to a whole host of top-tier risk events and still a lot at stake, we are in a particularly mercurial and capricious time right now. This suggests the potential for sharp reversals and abrupt swings in the market’s mood are higher than usual," TD adds.
According to the report from Office for National Statistics, the Consumer Prices Index (CPI) 12-month rate was 0.5% in September 2020, up from 0.2% in August.
The Consumer Prices Index including owner occupiers’ housing costs (CPIH) 12-month inflation rate was 0.7% in September 2020, up from 0.5% in August 2020.
The largest contribution to the CPIH 12-month inflation rate in September 2020 came from recreation and culture (0.31 percentage points).
Transport costs, and restaurant and café prices, following the end of the Eat Out to Help Out scheme, made the largest upward contributions (of 0.23 and 0.21 percentage points, respectively) to the change in the CPIH 12-month inflation rate between August and September 2020.
This was partially offset by smaller downward contributions from furniture, household equipment and maintenance; games, toys and hobbies; and food and non-alcoholic beverages.
EUR/USD
Resistance levels (open interest**, contracts)
$1.1928 (3359)
$1.1904 (4047)
$1.1885 (484)
Price at time of writing this review: $1.1845
Support levels (open interest**, contracts):
$1.1762 (1050)
$1.1736 (975)
$1.1705 (1545)
Comments:
- Overall open interest on the CALL options and PUT options with the expiration date November, 6 is 54721 contracts (according to data from October, 20) with the maximum number of contracts with strike price $1,1800 (4047);
GBP/USD
Resistance levels (open interest**, contracts)
$1.3107 (2632)
$1.3058 (266)
$1.3022 (1681)
Price at time of writing this review: $1.2983
Support levels (open interest**, contracts):
$1.2923 (460)
$1.2905 (826)
$1.2878 (325)
Comments:
- Overall open interest on the CALL options with the expiration date November, 6 is 32360 contracts, with the maximum number of contracts with strike price $1,3950 (3784);
- Overall open interest on the PUT options with the expiration date November, 6 is 25436 contracts, with the maximum number of contracts with strike price $1,2050 (2391);
- The ratio of PUT/CALL was 0.79 versus 0.75 from the previous trading day according to data from October, 20
* - The Chicago Mercantile Exchange bulletin (CME) is used for the calculation.
** - Open interest takes into account the total number of option contracts that are open at the moment.
| Raw materials | Closed | Change, % |
|---|---|---|
| Brent | 42.58 | 0.59 |
| Silver | 24.63 | 1.23 |
| Gold | 1907.354 | 0.21 |
| Palladium | 2399.67 | 2.54 |
| Index | Change, points | Closed | Change, % |
|---|---|---|---|
| NIKKEI 225 | -104.09 | 23567.04 | -0.44 |
| Hang Seng | 27.28 | 24569.54 | 0.11 |
| KOSPI | 11.67 | 2358.41 | 0.5 |
| ASX 200 | -44.8 | 6184.6 | -0.72 |
| FTSE 100 | 4.57 | 5889.22 | 0.08 |
| DAX | -117.71 | 12736.95 | -0.92 |
| CAC 40 | 0.01 | 4929.28 | 0 |
| Dow Jones | 113.37 | 28308.79 | 0.4 |
| S&P 500 | 16.2 | 3443.12 | 0.47 |
| NASDAQ Composite | 37.61 | 11516.49 | 0.33 |
| Time | Country | Event | Period | Previous value | Forecast |
|---|---|---|---|---|---|
| 06:00 (GMT) | United Kingdom | Producer Price Index - Output (MoM) | September | 0.0% | 0.1% |
| 06:00 (GMT) | United Kingdom | Producer Price Index - Input (MoM) | September | -0.4% | -0.4% |
| 06:00 (GMT) | United Kingdom | Producer Price Index - Input (YoY) | September | -5.8% | -5.5% |
| 06:00 (GMT) | United Kingdom | Producer Price Index - Output (YoY) | September | -0.9% | -0.9% |
| 06:00 (GMT) | United Kingdom | Retail Price Index, m/m | September | -0.3% | 0.4% |
| 06:00 (GMT) | United Kingdom | PSNB, bln | September | -35.9 | -34 |
| 06:00 (GMT) | United Kingdom | HICP ex EFAT, Y/Y | September | 0.9% | |
| 06:00 (GMT) | United Kingdom | Retail prices, Y/Y | September | 0.5% | 1.2% |
| 06:00 (GMT) | United Kingdom | HICP, m/m | September | -0.4% | 0.5% |
| 06:00 (GMT) | United Kingdom | HICP, Y/Y | September | 0.2% | 0.5% |
| 07:30 (GMT) | Eurozone | ECB President Lagarde Speaks | |||
| 10:00 (GMT) | United Kingdom | CBI industrial order books balance | October | -48 | |
| 12:10 (GMT) | United Kingdom | MPC Member Ramsden Speaks | |||
| 12:30 (GMT) | Canada | Retail Sales YoY | August | 2.7% | |
| 12:30 (GMT) | Canada | Retail Sales, m/m | August | 0.6% | 1.1% |
| 12:30 (GMT) | Canada | New Housing Price Index, MoM | September | 0.5% | 0.5% |
| 12:30 (GMT) | Canada | New Housing Price Index, YoY | September | 2.1% | |
| 12:30 (GMT) | Canada | Retail Sales ex Autos, m/m | August | -0.4% | 0.9% |
| 12:30 (GMT) | Canada | Bank of Canada Consumer Price Index Core, y/y | September | 0.8% | |
| 12:30 (GMT) | Canada | Consumer Price Index m / m | September | -0.1% | -0.1% |
| 12:30 (GMT) | Canada | Consumer price index, y/y | September | 0.1% | 0.4% |
| 12:50 (GMT) | U.S. | FOMC Member Brainard Speaks | |||
| 14:00 (GMT) | U.S. | FOMC Member Mester Speaks | |||
| 14:30 (GMT) | U.S. | Crude Oil Inventories | October | -3.818 | -0.24 |
| 18:00 (GMT) | U.S. | Fed's Beige Book | |||
| 21:45 (GMT) | New Zealand | Trade Balance, mln | September | -353 | |
| 22:30 (GMT) | Australia | RBA Assist Gov Debelle Speaks |
| Pare | Closed | Change, % |
|---|---|---|
| AUDUSD | 0.7046 | -0.24 |
| EURJPY | 124.67 | 0.5 |
| EURUSD | 1.18219 | 0.47 |
| GBPJPY | 136.442 | 0.02 |
| GBPUSD | 1.29401 | 0.01 |
| NZDUSD | 0.65759 | -0.4 |
| USDCAD | 1.31262 | -0.46 |
| USDCHF | 0.90638 | -0.39 |
| USDJPY | 105.452 | 0.03 |


© 2000-2026. All rights reserved.
This site is managed by Teletrade D.J. LLC 2351 LLC 2022 (Euro House, Richmond Hill Road, Kingstown, VC0100, St. Vincent and the Grenadines).
The information on this website is for informational purposes only and does not constitute any investment advice.
The company does not serve or provide services to customers who are residents of the US, Canada, Iran, The Democratic People's Republic of Korea, Yemen and FATF blacklisted countries.
Making transactions on financial markets with marginal financial instruments opens up wide possibilities and allows investors who are willing to take risks to earn high profits, carrying a potentially high risk of losses at the same time. Therefore you should responsibly approach the issue of choosing the appropriate investment strategy, taking the available resources into account, before starting trading.
Use of the information: full or partial use of materials from this website must always be referenced to TeleTrade as the source of information. Use of the materials on the Internet must be accompanied by a hyperlink to teletrade.org. Automatic import of materials and information from this website is prohibited.
Please contact our PR department if you have any questions or need assistance at pr@teletrade.global.
transfers