- Analytics
- News and Tools
- Market News
CFD Markets News and Forecasts — 23-10-2020
On Monday, at 05:00 GMT, Japan will release an index of leading economic indicators for August. At 07:00 GMT, Britain will publish the Nationwide house price index for October. At 09:00 GMT, Germany will present the IFO business environment indicator, the IFO current situation assessment indicator, and the IFO economic expectations indicator for October. At 11: 00 GMT in Germany, the Bundesbank's monthly report will be released. At 14:00 GMT, the US will announce changes in new home sales for September. At 15:30 GMT, the head of the SNB Jordan will make a speech. At 21:45 GMT, New Zealand will report a change in the foreign trade balance for September.
On Tuesday, at 09:00 GMT, the Euro zone will announce changes in the aggregate M3 of money supply and private sector lending for September. At 11:00 GMT, Britain will release the retail sales index according to the Confederation of British Industrialists for October. At 12:30 GMT, the US will announce changes in orders for durable goods for September. At 13:00 GMT, the US will publish the S&P/Case-Shiller home price index for August, at 14:00 GMT - the consumer confidence indicator for October and Fed-Richmond manufacturing index for October.
On Wednesday, at 00:30 GMT, Australia will release the consumer price index for the 3rd quarter. At 09:00 GMT, Switzerland will present an index of Swiss investor expectations, according to ZEW and Credit Suisse data for October. At 14:00 GMT in Canada, the Bank of Canada's interest rate decision will be announced. At 14:30 GMT, the US will announce changes in oil reserves according to the Ministry of energy. At 23:50 GMT, Japan will report changes in retail sales for September.
On Thursday, at 00:00 GMT, New Zealand will release ANZ's business confidence indicator for October. At 00:30 GMT, Australia will present the import price index for the 3rd quarter. At 03:00 GMT in Japan, the Bank of Japan's interest rate decision will be announced. At 05:00 GMT, Japan will publish a consumer confidence indicator for October. At 06:30 GMT in Japan, a Bank of Japan press conference will be held. At 08:55 GMT, Germany will announce changes in the unemployment rate and the number of unemployed for October. At 09:30 GMT, Britain will report changes in the volume of the M4 money supply aggregate, the number of approved mortgage applications and the volume of net loans to individuals for September. At 10:00 GMT, the Euro zone will present the consumer confidence index, the economic sentiment index, the industrial business optimism index and the business sentiment index for October. At 12:30 GMT, the US will announce changes in GDP and present the price index of GDP for the 3rd quarter. Also at 12:30 GMT, the US will report a change in the number of initial applications for unemployment benefits. At 12:45 GMT the ECB's interest rate decision will be announced. At 13:00 GMT, Germany will release the consumer price index for October. At 13: 30 GMT the ECB will hold a press conference. At 14:00 GMT, the US will announce a change in pending home sales for September. At 23:30 GMT, Japan will present the Tokyo consumer price index for October and report changes in the unemployment rate for September.
On Friday, at 00:30 GMT, Australia will publish the producer price index for the 3rd quarter and report changes in private sector lending for September. At 05:00 GMT, Japan will announce changes in construction orders for September. At 06:30 GMT, France will report changes in GDP for the 3rd quarter. At 07:00 GMT, Germany will release the import price index for September and announce changes in retail trade for September. At 07:45 GMT France will report on the change in the volume of consumer spending for September. At 08:00 GMT, Switzerland will present the KOF index of leading economic indicators for October. At 10:00 GMT, the Euro zone will announce changes in the volume of GDP for the 3rd quarter and the unemployment rate for September. At 12:30 GMT, Canada will report changes in GDP for August and release the producer price index for September. Also at 12: 30 GMT, the US will present the main index of personal consumption expenditures for September and announce changes in household income/expenses for September. At 13:45 GMT, the US will publish the Chicago purchasing managers ' index for October, and at 14:00 GMT, the Reuters/Michigan consumer sentiment index for October. At 17:00 GMT, in the US, the Baker Hughes report on the number of active oil drilling rigs will be released.
On Saturday, at 01:00 GMT, China will publish the PMI for the manufacturing sector and the index of activity in the non-manufacturing sector for October.
- The "ball is not moving much" right now
- There are still policy issues that divide the two teams
- It would be very difficult, even if you had deal in the next few days; you’ve got to go through committee print, and then you’ve got to have votes in House and Senate, so it’s not going to be easy
FXStreet reports that EUR/USD is higher on Friday after the region's set of flash preliminary Manufacturing Purchasing Managers' Index (PMI) readings helped the pair reject a concerted break below 1.18 overnight. Economists at TD Securities expect the EUR/USD pair to remain generally rangebound for now.
“The October readings held their ground in firm expansion mode across the euro area. That said, the service sector slowed further into contraction territory overall. The big surprise was German manufacturing. This jumped sharply to 58.0 in October, providing some relief after August's manufacturing data showed the first decline since the spring. Today's releases show continued declines in employment, but at a decelerating rate.”
“Overall, as countries continue to restrict activity due to rising COVID-19 cases, the global goods sector continues its rebound (perhaps at a somewhat slower rate), while the services sector slides further into contraction territory as people spend less time outside of their homes.”
“It is hard for us to get too excited for a meaningful break higher in EUR/USD near-term. Next week's ECB meeting and the US vote soon after leave us expecting the pair to remain generally rangebound for now.”
Preliminary
data released by IHS Markit on Friday pointed to further solid growth in
business activity during October, at the fastest pace for 20 months.
According to
the report, the Markit flash manufacturing purchasing manager's index (PMI)
came in at 53.3 in October, up marginally from 53.2 in September. That was the
highest reading since January 2019. Economists had expected the reading to edge
up to 53.4. A reading above 50 signals an expansion in activity, while a
reading below this level signals a contraction. The upturn was underpinned by accelerated
expansion in new orders, which was the sharpest since January 2019, while,
production growth slowed.
Meanwhile, the
Markit flash services purchasing manager's index (PMI) rose to 56.0 in October from
54.6 in the previous month. The latest reading indicated the sharpest expansion
in business activity since February 2019. Economists had expected the reading
to remain at 54.6. Output increased, while business growth softened amid
ongoing COVID-19 restrictions and a slower expansion of new export business,
and employment growth dipped to a three-month low.
Overall, IHS
Markit Flash U.S. Composite PMI Output Index came in at 55.5 in October, up
from 54.3 in September, signaling the fastest increase in the private sector
business activity since February 2019.
“The US economy
looks to have started the fourth quarter on a strong footing, with business
activity growing at a rate not seen since early 2019,” Chris Williamson, Chief
Business Economist at HIS Markit noted. “The service sector led the expansion
as increasing numbers of companies adapted to life with COVID19, while
manufacturing continued to report solid growth amid rising demand from
households and businesses.”
FXStreet notes that while both President Trump and challenger Biden want to boost economic growth and reduce unemployment, their approaches are radically different. Economists at Rabobank try to assess the impact of their policy plans on a range of macroeconomic variables, such as GDP, real income, public debt and trade.
“The upward effect on GDP growth from additional Trump tax cuts would be offset by the cuts in government spending aimed at stabilizing the public debt to GDP ratio. The Biden plan would boost GDP growth, but also the trajectory of public debt to GDP. In the long run, we expect the US economy to be larger by 3.8% to 4.6% due to the Biden plan tapping into the endogenous growth potential of the economy. However, we expect public debt to arrive at somewhere between 164% and 170% of GDP, which is much higher than the 147% in our baseline scenario.”
“The tax relief in the Trump administration’s plans results in a rapid pickup of real personal disposable income in the aftermath of the corona crisis from $43,350 per capita by the end of this year to roughly $47,000 in 2025, which is $1,000 more than in our baseline.”
“As Biden imposes higher taxes, by 2025 we project real disposable personal income to barely touch $46,000 per capita, which is even slightly below our baseline. However, as the impact of tax policies starts to peter out, we expect a rapid pickup in income after 2025, which is directly related to productivity-enhancing policies which prop up economic growth. Ultimately, we expect real income to be 2.2% to 3.3% higher.”
“Unemployment and trade under Trump would roughly follow the same trajectory as in our baseline. US trade is expected to rise significantly under Biden.”
“In the short-term, Biden’s policy packages push unemployment below levels in our baseline, as positive employment effects of additional government spending outweighs the negative impact of a higher minimum wage. However, mid-decade unemployment is expected to rise above the baseline, partly related to higher corporate taxes and a pickup in labor-saving technological change.”
U.S. stock-index futures rose on Friday, as investors weighed the potential for a new coronavirus relief package in the U.S., as well as a mixed set of earnings reports and favorable news from the COVID-19 treatment front.
Global Stocks:
Index/commodity | Last | Today's Change, points | Today's Change, % |
Nikkei | 23,516.59 | +42.32 | +0.18% |
Hang Seng | 24,918.78 | +132.65 | +0.54% |
Shanghai | 3,278.00 | -34.50 | -1.04% |
S&P/ASX | 6,167.00 | -6.80 | -0.11% |
FTSE | 5,878.00 | +92.35 | +1.60% |
CAC | 4,931.19 | +79.81 | +1.65% |
DAX | 12,705.39 | +162.33 | +1.29% |
Crude oil | $40.74 | +0.25% | |
Gold | $1,914.10 | +0.50% |
FXStreet reports that S&P 500 reversed higher on Thursday and the Credit Suisse analyst team maintains the view that the “neckline” to its “head & shoulders” base and the 38.2% retracement at 3428/18 will hold for a turn back higher.
“The S&P 500 reversed slightly higher on Thursday after yet again holding above the ‘neckline’ to its recently completed base at 3429/27 and the 38.2% retracement of the recent recovery at 3418/15. We therefore maintain our view that 3429/15 will provide a solid floor for the uptrend to resume.”
“Resistance stays at 3477, above which would bullishly confirm yesterday’s session for strength back to 3516/18, then 3550, above which would trigger a move back to the 3588/97 high, which is also the upper end of its ‘typical’ extreme (15% above the 200-day average). Whilst this should clearly be respected, we look for a break in due course, with our “measured base objective” at 3653.”
(company / ticker / price / change ($/%) / volume)
ALCOA INC. | AA | 13.76 | 0.10(0.73%) | 10892 |
ALTRIA GROUP INC. | MO | 39.1 | 0.11(0.28%) | 6545 |
Amazon.com Inc., NASDAQ | AMZN | 3,192.50 | 16.10(0.51%) | 24540 |
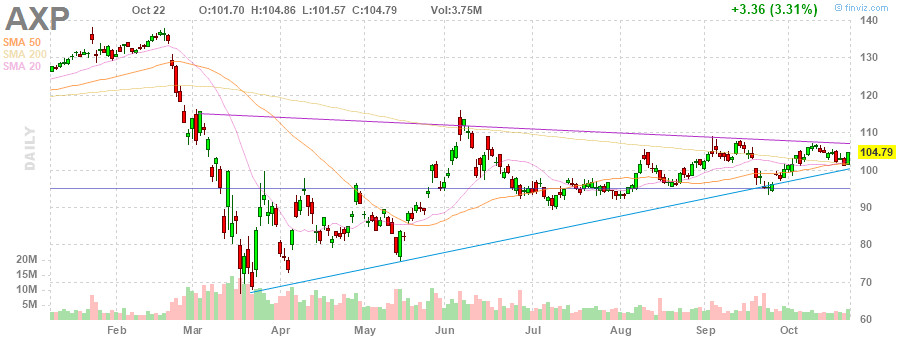
American Express Co | AXP | 100.85 | -3.94(-3.76%) | 199772 |
AMERICAN INTERNATIONAL GROUP | AIG | 32.13 | 0.12(0.37%) | 211 |
Apple Inc. | AAPL | 116.23 | 0.48(0.41%) | 650714 |
AT&T Inc | T | 28.24 | -0.04(-0.14%) | 125560 |
Boeing Co | BA | 169.8 | 0.73(0.43%) | 172657 |
Caterpillar Inc | CAT | 169.45 | 0.82(0.49%) | 4060 |
Chevron Corp | CVX | 73.65 | 0.25(0.34%) | 18285 |
Cisco Systems Inc | CSCO | 38.9 | 0.08(0.21%) | 10988 |
Citigroup Inc., NYSE | C | 44.13 | 0.18(0.41%) | 70781 |
E. I. du Pont de Nemours and Co | DD | 59.69 | 0.21(0.35%) | 606 |
Exxon Mobil Corp | XOM | 35.02 | 0.16(0.46%) | 81664 |
Facebook, Inc. | FB | 279.1 | 0.98(0.35%) | 76279 |
FedEx Corporation, NYSE | FDX | 278 | 2.05(0.74%) | 45690 |
Ford Motor Co. | F | 8.36 | 0.15(1.83%) | 1045284 |
Freeport-McMoRan Copper & Gold Inc., NYSE | FCX | 18.5 | 0.15(0.82%) | 44433 |
General Electric Co | GE | 7.91 | 0.19(2.46%) | 893946 |
General Motors Company, NYSE | GM | 37.65 | 0.24(0.64%) | 44866 |
Goldman Sachs | GS | 206.45 | 1.05(0.51%) | 15897 |
Google Inc. | GOOG | 1,626.45 | 11.12(0.69%) | 5936 |
Home Depot Inc | HD | 283 | 1.84(0.65%) | 2816 |
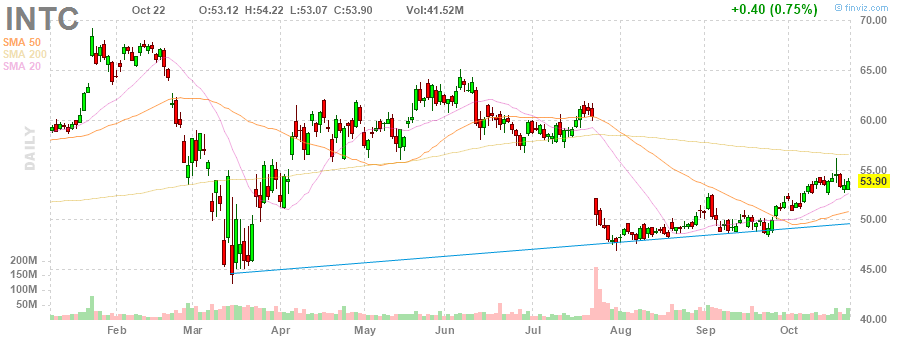
Intel Corp | INTC | 48.42 | -5.48(-10.17%) | 1986351 |
International Business Machines Co... | IBM | 116.39 | 0.63(0.54%) | 10792 |
Johnson & Johnson | JNJ | 145.93 | 0.85(0.59%) | 12211 |
JPMorgan Chase and Co | JPM | 103.19 | 0.31(0.30%) | 104290 |
McDonald's Corp | MCD | 229.49 | 0.34(0.15%) | 1299 |
Merck & Co Inc | MRK | 79.57 | 0.36(0.45%) | 1667 |
Microsoft Corp | MSFT | 215.5 | 0.61(0.28%) | 58817 |
Nike | NKE | 130.42 | 0.40(0.31%) | 38492 |
Pfizer Inc | PFE | 37.61 | 0.18(0.48%) | 121915 |
Procter & Gamble Co | PG | 141.5 | 0.05(0.04%) | 1183 |
Starbucks Corporation, NASDAQ | SBUX | 89.7 | 0.34(0.38%) | 148858 |
Tesla Motors, Inc., NASDAQ | TSLA | 423.51 | -2.28(-0.54%) | 416323 |
The Coca-Cola Co | KO | 50.8 | 0.12(0.24%) | 8159 |
Travelers Companies Inc | TRV | 126.65 | 0.51(0.40%) | 841 |
Twitter, Inc., NYSE | TWTR | 50.1 | -0.18(-0.36%) | 30070 |
UnitedHealth Group Inc | UNH | 328.06 | 2.33(0.72%) | 777 |
Verizon Communications Inc | VZ | 57.57 | 0.24(0.42%) | 12111 |
Visa | V | 198.89 | 0.90(0.45%) | 5269 |
Wal-Mart Stores Inc | WMT | 143.85 | 0.30(0.21%) | 12979 |
Walt Disney Co | DIS | 128.4 | 0.84(0.66%) | 8174 |
Yandex N.V., NASDAQ | YNDX | 58.46 | 0.46(0.79%) | 8546 |
Intel (INTC) target lowered to $50 from $55 at Cowen
Intel (INTC) downgraded to Underperform from Neutral at BofA Securities; target lowered to $45
| Time | Country | Event | Period | Previous value | Forecast | Actual |
|---|---|---|---|---|---|---|
| 07:15 | France | Services PMI | October | 47.5 | 46.8 | 46.5 |
| 07:15 | France | Manufacturing PMI | October | 51.2 | 51 | 51.0 |
| 07:30 | Germany | Services PMI | October | 50.6 | 49.2 | 48.9 |
| 07:30 | Germany | Manufacturing PMI | October | 56.4 | 55.1 | 58.0 |
| 08:00 | Eurozone | Services PMI | October | 48 | 47 | 46.2 |
| 08:00 | Eurozone | Manufacturing PMI | October | 53.7 | 53.1 | 54.4 |
| 08:30 | United Kingdom | Purchasing Manager Index Manufacturing | October | 54.1 | 53.1 | 53.3 |
| 08:30 | United Kingdom | Purchasing Manager Index Services | October | 56.1 | 54 | 52.3 |
EUR traded mixed against other major currencies in the European session on Friday as investors weighed mixed PMI data out of the euro area and growing coronavirus cases in the region.
IHS Markit reported its flash Eurozone Manufacturing PMI came in at 54.4 in early October, up from 53.7 in September, pointing to the biggest advance in the region's factory activity since August 2018. A reading below 50 represents a contraction in the activity. Economists had expected the indicator to drop to 53.1 in October. At the same time, the flash Eurozone Services PMI fell to 46.2 from 48.0 in September. That was the lowest reading since May and below economists' forecast of 47. As a result, the flash IHS Markit Eurozone Composite PMI, which looks at activity in both manufacturing and services sectors, fell to 49.4 this month from to 50.4 in September, recording the first contraction of business activity since June. The report also revealed divergent trends across the region: Germany continued to report steady growth Germany's October flash composite index edged down from 54.7 to
54.5), while France recorded deterioration in its business activity for the second straight month (France's October flash composite flash PMI fell from 48.5 to 47.3).
Eurozone's economic activity contracted this month as a wave of coronavirus infections triggered lockdowns and curfews in some of the largest member states.
Coronavirus cases continue to surge in Europe, making the region the epicenter of the pandemic once again after successfully slowing the outbreak early this. To combat the spread of the virus, the EU governments are forced to reimpose the restrictions.
FXStreet reports that USD/CAD has retraced around 70% of the September rally with USD under pressure across the board in October. The loonie is firmly at the mercy of the USD leg which in turn is trading off the back of risk sentiment. There is little reason to expect that dynamic to change heading into the election and for that reason, economists at Rabobank expect USD to retrace some of its recent losses as volatility rises heading into November 3.
“Our bias remains for a USD bid in Q4 that should see the greenback recoup some of its recent losses. This, driven by a rise in risk aversion around the election, the potential for a second wave to spook US markets and the likely downturn in activity we expect to see in Q4.”
“Although we would not claim to know which way the election will go, we are of the view that polls are likely overstating Biden’s lead and the election could well prove much closer than many anticipate which is likely to add to the vol picture in early November and see USD/CAD retest the 1.33 level.”
American Express (AXP) reported Q3 FY 2020 earnings of $1.30 per share (versus $2.08 per share in Q3 FY 2019), missing analysts’ consensus estimate of $1.35 per share.
The company’s quarterly revenues amounted to $8.751 bln (-20.4% y/y), roughly in line with analysts’ consensus estimate of $8.711 bln.
AXP fell to $101.77 (-2.88%) in pre-market trading.
FXStreet notes that AUD/USD witnessed some selling after rising to fresh one-week tops, around the 0.7135-40 region. The prospect of a huge Reserve Bank of Australia (RBA) policy move coming just hours before polls close in the US on November 3 adds to the risks that this “double-header” event may yet push the aussie below 0.70, at least in the short-term, per Westpac.
“The RBA looks set to announce sweeping changes including a cut in the cash rate, the 3yr target bond rate and the rate on the term funding facility. The RBA will cut the rate on exchange settlement accounts where banks can deposit cash at the RBA which could see markets begin to intermittently trade negative interest rates here in Australia and will announce a significant move in its bond purchase program to one of purchasing Australian government bonds and semi government bonds, across the curve, including maturities in the 5 – 10-year range. Such a move would bring the RBA more into line with other Central Banks like the Fed, Bank of Japan, ECB etc and that was one factor that drove the Australian dollar down to a four-week low on Tuesday at 0.7021.”
“So the prospect of a huge RBA policy move coming just hours before polls close in the US on November 3 adds to the risks that this ‘Double Header’ event may yet push the AUD/USD pair below 0.70, at least in the short term though record Chinese steel production driving very strong iron ore prices and a rising RMB may limit any dips.”
FXStreet notes that the pound has corrected lower after the sharp gain recorded on Wednesday and this makes a lot of sense to economists at MUFG Bank as the outlook remains gruesome for the sterling. GBP failed to respond to more fiscal action as British Finance Minister Rishi Sunak came to the rescue again with a new Job Support Scheme.
“The new Job Support Scheme due to commence on November 1 will now look more like the expensive Job Retention Scheme. Workers can qualify if working just 20% of usual hours rather than the planned third and crucially, companies will now only have to fork out 5% of employees’ wages instead of the planned 33%.”
“Taking OBR estimates and the verbal estimates from the government on the cost of the new scheme, the UK budget deficit is heading for over 20% of GDP. Last week, the IMF released budget deficit estimates which had an estimate for the UK at -16.5% with only the US (-18.7%) and Canada (-19.9%) expected to run larger deficits. Of course other countries are going to have to increase government spending again due to the second wave of COVID-19 but the UK is heading for being the worst or very close to the worst advanced country. FX is all about the relative, and on that basis, running close to the largest budget deficit while recording the largest economic contraction due to COVID-19 and with trade frictions set for the new year, the outlook for GBP remains grim.”
- We want a Canada-style deal and think it is reasonable
- If EU won't do a Brexit deal, we will go to Australia terms
- We've made some real progress with EU
Intel (INTC) reported Q3 FY 2020 earnings of $1.11 per share (versus $1.42 per share in Q3 FY 2019), in line with analysts’ consensus estimate of $1.11 per share.
The company’s quarterly revenues amounted to $18.333 bln (-4.5% y/y), roughly in line with analysts’ consensus estimate of $18.258 bln.
The company issued in-line guidance for Q4 FY 2020, projecting EPS of approx. $1.10 versus analysts’ consensus estimate of $1.08 and revenues of approx. $17.40 bln versus analysts’ consensus estimate of $17.39 bln.
INTC fell to $48.79 (-9.48%) in pre-market trading.
FXStreet notes that USD/JPY maintains a short-term top and analysts at Credit Suisse look for a break of the potential uptrend support at 104.48/34 next. The pair flirts with session lows, around 104.65 region, as of writing.
“USD/JPY maintains a short-term top after breaking below support at the key October lows at 104.93/83 earlier in the week, which turned the short-term risks lower again.”
“The market is stalling above potential trend support from March, today at 104.48/34, however, the ‘measured objective’ to the newly completed top suggests we could easily see a move to the 104.00 low of September, with a potential trend support just below at 103.87.”
- Outlook for a Brexit deal is "a little brighter"
- Says Brexit talks process is now "back on track"
- Trust with UK has improved in recent days
- The issues preventing a deal being finalized are very much still there
- Two sides still are "miles apart" on fisheries
FXStreet reports that USD/CNH’s outlook remains negative but a move to 6.6030 stays out of favour for the time being, suggested FX Strategists at UOB Group.
Next 1-3 weeks: “We have held a negative view in USD since last Friday, 16 Oct). In our latest narrative from Wednesday (21 Oct, spot at 6.6590), we indicated that USD ‘is still weak but the next major support at 6.6030 may not come into the picture so soon’. USD subsequently dropped to a low of 6.6275 before rebounding. Downward momentum is beginning to slow and this coupled with rather oversold conditions suggests 6.6030 could be out of reach this time round. That said, only a break of 6.6980 (no change in ‘strong resistance’ level) would indicate the risk for further USD weakness has eased.”
CNBC reports that China’s foreign exchange regulator told businesses Friday to prepare for more volatility in the yuan.
The Chinese currency strengthened roughly 1% this week against the U.S. dollar to levels not seen since July 2018. Less than five months ago, the yuan was at its weakest against the greenback since early 2008.
One-year implied volatility of the yuan has climbed to 5%, versus less than 2% for previous years, indicating a basis of “increased flexibility” in the exchange rate, State Administration of Foreign Exchange spokeswoman Wang Chunying told reporters on Friday.
“In face of exchange rate fluctuations, businesses should strengthen their risk prevention awareness,” Wang said. She said that rather than expect one-way strengthening or weakening of the yuan, businesses should prepare for two-way moves in the exchange rate, and hedge appropriately without speculating.
Reuters reports that a COVID-19 vaccine could be available for the German population early next year, Health Minister Jens Spahn said, adding that Germany would be prepared to pass on surplus amounts of the shot to other countries.
Spahn told Der Spiegel that as soon as enough vaccine was available it would be possible to vaccinate a large proportion of the population that wanted the shot in six to seven months.
FXStreet reports that progress in EU/UK trade talks could now flip GBP/USD range to 1.32-1.37, economists at Westpac apprise.
“Data over the next week is dominated by surveys (notably PMI and CBI surveys). Confidence is a key component and will be critically related to both the containment of COVID-19 cases and the risk of failure in EU/UK trade talks.”
“EU/UK post-Brexit talks appeared to be close to being abandoned at the end of last week. However, potential easing of contentious parts of UK’s Internal Market Bill and possible solutions for EU fishing rights in UK waters could allow intense legal discussions as early as next week. It that transpires, GBP/USD could flip its recent range through 1.3200 (for a 1.32-1.37 range), despite the current rise in COVID-19.”
According to the report from IHS Markit/CIPS, UK private sector companies indicated another overall increase in business activity during October, but the rate of expansion slowed considerably since the previous month. This reflected a much weaker contribution from the service economy, with survey respondents often commenting on tighter restrictions across the hospitality sector and the impact of local lockdowns on general consumer spending. As a result, service providers reported a decline in new business for the first time since June, which contrasted with another solid expansion in new orders received by manufacturing companies in October.
The headline seasonally adjusted UK Composite Output Index – which is based on approximately 85% of usual monthly replies - registered 52.9 in October, down from 56.5 in September and further below August's recent peak of 59.1. Although still above the 50.0 no change value, the latest reading pointed to the weakest rise in UK private sector output since a return to growth was first signalled in July.
Manufacturing production (index at 56.4) increased at a much faster pace than service sector activity (index at 52.3). In both sectors, the speed of recovery was the slowest for four months during October.
According to the report from IHS Markit, business activity fell back into decline across the eurozone in October as accelerating growth of manufacturing output was overwhelmed by a steepening deterioration in the service sector amid rising COVID-19 worries.
The rate of job losses eased, but forward -looking indicators deteriorated: inflows of new business showed a renewed decline and business optimism for the year ahead slipped to the lowest since May. Deflationary pressures meanwhile eased as business costs rose at a faster rate.
The flash Eurozone Composite PMI fell for a third consecutive month in October, dropping from to 50.4 in September to 49.4 to register the first contraction of business activity since June. Although the index remains well above the all-time lows seen during the height of the pandemic in the second quarter, the renewed decline raises the possibility that the region could see the economy contract again in the fourth quarter.
The survey also revealed increasingly divergent trends by sector. Manufacturing output growth accelerated to the fastest since February 2018, supported by inflows of new orders surging at the quickest rate since January 2018. Conversely, service sector output fell for a second successive month, deteriorating at the sharpest rate since May.
According to the report from IHS Markit, a further rise in manufacturing output helped to support growth across the German private sector in October. However, in a sign of a two-speed economy emerging, service providers recorded a modest decline in activity amid new restrictions and heightened uncertainty due to a second wave of coronavirus cases.
The headline Flash Germany Composite Output Index registered 54.5 in October. Though down slightly from September’s 54.7, the latest reading was still comfortably above the 50.0 no-change mark that separates growth from contraction.
Trends at the sector level continued to diverge in October, with the manufacturing output index pointing to the strongest pace of expansion since February 2011, while the equivalent measure of services business activity fell below the neutral 50.0 threshold for the first time since June. Service providers reported an impact on demand from new restrictions and increased uncertainty associated with a rise in the number of coronavirus disease 2019 (COVID-19) cases. New business fell across the sector for the first time in four months, led by a sharp and accelerated fall in foreign demand.
This contrasted with the situation in the manufacturing sector, where latest data showed a record increase in order book volumes, supported by a resurgence in export business.
| Time | Country | Event | Period | Previous value | Forecast | Actual |
|---|---|---|---|---|---|---|
| 00:30 | Japan | Nikkei Services PMI | October | 46.9 | 46.6 | |
| 00:30 | Japan | Manufacturing PMI | October | 47.7 | 48 | |
| 06:00 | United Kingdom | Retail Sales (YoY) | September | 2.7% | 3.7% | 4.7% |
| 06:00 | United Kingdom | Retail Sales (MoM) | September | 0.9% | 0.4% | 1.5% |
During today's Asian trading, the US dollar rose against the euro and declined against the Japanese yen.
The ICE index, which tracks the dynamics of the US dollar against six currencies (Euro, Swiss franc, yen, canadian dollar, pound sterling and Swedish Krona), rose by 0.12%.
The continued uncertainty surrounding negotiations on a new stimulus package in the United States is contributing to the growth of demand for the dollar as a safe currency.
The pound declined against the US dollar, despite positive UK data. The volume of retail sales in the UK in September increased by 1.5% compared to the previous month, according to data from the Office for National Statistics. In annual terms, sales increased by 4.7%. Analysts on average predicted an increase in the first indicator by 0.4%, the second - by 3.7%.
Reuters reports that China’s top leaders will chart the country’s economic course for 2021-2025 at a key meeting starting on Monday, seeking to balance growth and reforms to avoid stagnation amid an uncertain global outlook and deepening tensions with the United States.
The plan and its execution will be crucial for China to avoid the so-called “middle income” trap, policy insiders say, referring to the struggle of many economies to boost productivity and shift towards higher value-added industries.
“Although the Chinese government has been calling for a transition in the development model for a number of years, we think the next five years will be particularly important, both politically and economically,” Goldman Sachs economists wrote in a note ahead of the plenum, the fifth meeting of the Central Committee since the 2017 party congress.
Sustaining steady growth will be the priority, even as expectations grow that top leaders could announce fresh reforms to spur domestic demand, innovation and self-reliance under Xi’s new “dual circulation” strategy, policy insiders said.
EUR/USD
Resistance levels (open interest**, contracts)
$1.1897 (4037)
$1.1877 (496)
$1.1862 (505)
Price at time of writing this review: $1.1793
Support levels (open interest**, contracts):
$1.1734 (1024)
$1.1704 (1545)
$1.1669 (2078)
Comments:
- Overall open interest on the CALL options and PUT options with the expiration date November, 6 is 55658 contracts (according to data from October, 22) with the maximum number of contracts with strike price $1,1800 (4037);
GBP/USD
Resistance levels (open interest**, contracts)
$1.3153 (1007)
$1.3117 (1681)
$1.3091 (107)
Price at time of writing this review: $1.3052
Support levels (open interest**, contracts):
$1.3009 (826)
$1.2967 (286)
$1.2911 (259)
Comments:
- Overall open interest on the CALL options with the expiration date November, 6 is 33522 contracts, with the maximum number of contracts with strike price $1,3950 (3784);
- Overall open interest on the PUT options with the expiration date November, 6 is 25694 contracts, with the maximum number of contracts with strike price $1,2050 (2391);
- The ratio of PUT/CALL was 0.77 versus 0.80 from the previous trading day according to data from October, 22
* - The Chicago Mercantile Exchange bulletin (CME) is used for the calculation.
** - Open interest takes into account the total number of option contracts that are open at the moment.
FXStreet reports that AUD/USD is now expected to navigate between 0.7030 and 0.7185 in the next weeks, suggested FX Strategists at UOB Group.
Next 1-3 weeks: “We noted yesterday that ‘downward momentum has improved, albeit not by much’ and added, we ‘continue to see 0.7005 as a solid support’. That said, we did not rule out a break of 0.7005 ‘as long as the ‘strong resistance’ at 0.7130 is intact’. AUD subsequently surged to a high of 0.7137 during NY hours. The break of 0.7130 indicates that the recent downward pressure has dissipated. The current movement is viewed as the early stages of a consolidation phase and AUD could trade between 0.7030 and 0.7185 for now.”
According to the report from Office for National Statistics, in September 2020 retail sales volumes increased by 1.5% when compared with August; this is the fifth consecutive month of growth, resulting in an increase of 5.5% when compared with February's pre-pandemic level. Economists had expected a 0.4% increase.
While food sales have done well in recent months as people have eaten out less, non-food store sales have now made a recovery at 1.7% above their February levels.
In the three months to September, retail sales volumes increased by 17.4% when compared with the previous three months; this is the biggest quarterly increase on record as sales picked up from record-low levels experienced earlier in the year.
In September, fuel sales volumes were still 8.6% below February with reduced travel as many continued to work from home, and clothing sales volumes were still 12.7% below February.
Home improvement sales continued to do well in September with increased sales in household goods and garden items within "other" non-food stores.
The proportion of online sales was at 27.5%, compared with 20.1% reported in February, despite small monthly declines across most of the retail sector.
| Raw materials | Closed | Change, % |
|---|---|---|
| Brent | 42.34 | 1.85 |
| Silver | 24.68 | -1.28 |
| Gold | 1903.516 | -1.09 |
| Palladium | 2383.93 | -0.74 |
| Index | Change, points | Closed | Change, % |
|---|---|---|---|
| NIKKEI 225 | -165.19 | 23474.27 | -0.7 |
| Hang Seng | 31.71 | 24786.13 | 0.13 |
| KOSPI | -15.81 | 2355.05 | -0.67 |
| ASX 200 | -18 | 6173.8 | -0.29 |
| FTSE 100 | 9.15 | 5785.65 | 0.16 |
| DAX | -14.58 | 12543.06 | -0.12 |
| CAC 40 | -2.57 | 4851.38 | -0.05 |
| Dow Jones | 152.84 | 28363.66 | 0.54 |
| S&P 500 | 17.93 | 3453.49 | 0.52 |
| NASDAQ Composite | 21.31 | 11506.01 | 0.19 |
| Time | Country | Event | Period | Previous value | Forecast |
|---|---|---|---|---|---|
| 00:30 (GMT) | Japan | Nikkei Services PMI | October | 46.9 | |
| 00:30 (GMT) | Japan | Manufacturing PMI | October | 47.7 | |
| 06:00 (GMT) | United Kingdom | Retail Sales (YoY) | September | 2.8% | 3.7% |
| 06:00 (GMT) | United Kingdom | Retail Sales (MoM) | September | 0.8% | 0.4% |
| 07:15 (GMT) | France | Services PMI | October | 47.5 | 46.8 |
| 07:15 (GMT) | France | Manufacturing PMI | October | 51.2 | 51 |
| 07:30 (GMT) | Germany | Services PMI | October | 50.6 | 49.2 |
| 07:30 (GMT) | Germany | Manufacturing PMI | October | 56.4 | 55.1 |
| 08:00 (GMT) | Eurozone | Services PMI | October | 48 | 47 |
| 08:00 (GMT) | Eurozone | Manufacturing PMI | October | 53.7 | 53.1 |
| 08:30 (GMT) | United Kingdom | Purchasing Manager Index Manufacturing | October | 54.1 | 53.1 |
| 08:30 (GMT) | United Kingdom | Purchasing Manager Index Services | October | 56.1 | 54 |
| 13:00 (GMT) | Belgium | Business Climate | October | -10.8 | -11.5 |
| 13:45 (GMT) | U.S. | Services PMI | October | 54.6 | 54.6 |
| 13:45 (GMT) | U.S. | Manufacturing PMI | October | 53.2 | 53.4 |
| 17:00 (GMT) | U.S. | Baker Hughes Oil Rig Count | October | 205 |
| Pare | Closed | Change, % |
|---|---|---|
| AUDUSD | 0.71123 | 0.01 |
| EURJPY | 123.922 | -0.04 |
| EURUSD | 1.18184 | -0.34 |
| GBPJPY | 137.107 | -0.19 |
| GBPUSD | 1.30785 | -0.46 |
| NZDUSD | 0.66657 | 0.23 |
| USDCAD | 1.31322 | -0.03 |
| USDCHF | 0.90703 | 0.32 |
| USDJPY | 104.842 | 0.29 |


© 2000-2026. All rights reserved.
This site is managed by Teletrade D.J. LLC 2351 LLC 2022 (Euro House, Richmond Hill Road, Kingstown, VC0100, St. Vincent and the Grenadines).
The information on this website is for informational purposes only and does not constitute any investment advice.
The company does not serve or provide services to customers who are residents of the US, Canada, Iran, The Democratic People's Republic of Korea, Yemen and FATF blacklisted countries.
Making transactions on financial markets with marginal financial instruments opens up wide possibilities and allows investors who are willing to take risks to earn high profits, carrying a potentially high risk of losses at the same time. Therefore you should responsibly approach the issue of choosing the appropriate investment strategy, taking the available resources into account, before starting trading.
Use of the information: full or partial use of materials from this website must always be referenced to TeleTrade as the source of information. Use of the materials on the Internet must be accompanied by a hyperlink to teletrade.org. Automatic import of materials and information from this website is prohibited.
Please contact our PR department if you have any questions or need assistance at pr@teletrade.global.
transfers