- Analytics
- News and Tools
- Market News
CFD Markets News and Forecasts — 25-08-2020
| Time | Country | Event | Period | Previous value | Forecast |
|---|---|---|---|---|---|
| 01:30 | Australia | Construction Work Done | Quarter II | -1% | -5.8% |
| 05:00 | Japan | Leading Economic Index | June | 78.4 | 85.0 |
| 05:00 | Japan | Coincident Index | June | 73.4 | 76.4 |
| 06:45 | France | Consumer confidence | August | 94 | 94 |
| 08:00 | Switzerland | Credit Suisse ZEW Survey (Expectations) | August | 42.4 | |
| 12:30 | U.S. | Durable goods orders ex defense | July | 9.2% | |
| 12:30 | U.S. | Durable Goods Orders ex Transportation | July | 3.3% | 2% |
| 12:30 | U.S. | Durable Goods Orders | July | 7.3% | 4.3% |
| 14:00 | Canada | Gov Council Member Wilkins Speaks | |||
| 14:30 | U.S. | Crude Oil Inventories | August | -1.632 | |
| 16:00 | United Kingdom | MPC Member Andy Haldane Speaks |
FXStreet notes that after hitting a record high of 3380 on 19 February, then plunging 34% to a pandemic-induced low of 2237 on Mar 23, the S&P 500 index took just five months to make a round trip and set a new record. Nevertheless, the recovery stage of this new business cycle has not transitioned to an expansion phase for three reasons explained by Lisa Shalett from Morgan Stanley.
“S&P 500 gains are concentrated in a handful of stocks. The five largest names, mostly tech and social media companies, now comprise a historic 25% of the index. That group is up 30% year to date, but the median stock is down 7%. The result is an index that is not only expensive – the forward price-earnings (P/E) ratio is 23, near the extremes of the 1999 tech bubble – but also very top-heavy. Lower interest rates may seem to justify high valuations, but if inflation picks up as the recovery progresses, those rates will likely rise and create market headwinds.”
“The market seems disconnected from the economy. While markets tend to anticipate the future, expectations may be getting unrealistic. We see lots of data supporting a V-shaped recovery but the recession isn’t over. Unemployment remains over 10%; even a 20% jump in GDP growth in the third quarter would return the economy to a level still 9% below where it stood in January. We don’t expect GDP to fully recover until the second quarter of next year and doubt that corporate profits will significantly outpace that rate.”
“Investors seem overly complacent about potential risks. Individual investors seem somewhat subdued, but institutional investors have moved to max-bullish sentiment, with put/call ratios at seven-year lows (a low number indicates investors expect stocks to rise). Such complacency seems odd, given high uncertainty about the next phase of fiscal stimulus. Although the outlook may have improved on COVID-19 infection rates and a vaccine, the pandemic’s trajectory remains in doubt. The US presidential election, where possible outcomes are very much in flux, represents another major unknown for markets.”
“We expect markets to be mostly range-bound over the next three months of uncertainty and think small caps, value-style and cyclical stocks will return to favor. Meantime, watch market breadth, valuations and economic fundamentals for signs that the market is reaching new extremes.”
The U.S.
Commerce Department announced on Tuesday that the sales of new single-family
homes surged 13.9 percent m-o-m to a seasonally adjusted annual rate of 901,
000 units in July. This was the highest level since December 2006.
Economists had
forecast the sales pace of 785,000 last month.
June’s sales
pace was revised up to 791,000 units from the originally reported 776,000
units.
According to
the report, new home sales in the South, the largest area, increased 13.0
percent m-o-m in July. At the same time, sales in the Midwest climbed 58.8 percent
m-o-m and sales in the West went up 7.8 percent m-o-m, while sales in the
Northeast plunged 23.1 percent m-o-m.
The Conference
Board announced on Tuesday its U.S. consumer confidence fell 6.9 points to 84.8
in August from 91.7 in July.
Economists had
expected consumer confidence to come in at 93.0.
July’s consumer
confidence reading was revised up from originally estimated 92.6.
The survey
showed that the expectations index dropped from 88.9 last month to 85.2 this
month. Meanwhile, the present situation index plunged from 95.9 in July to 84.2.
“Consumer Confidence declined in August for the second consecutive month,” noted Lynn Franco, Senior Director of Economic Indicators at The Conference Board. “The Present Situation Index decreased sharply, with consumers stating that both business and employment conditions had deteriorated over the past month. Consumers’ optimism about the short-term outlook, and their financial prospects, also declined and continues on a downward path. Consumer spending has rebounded in recent months but increasing concerns amongst consumers about the economic outlook and their financial well-being will likely cause spending to cool in the months ahead.”
The Nonmanufacturing
Business Outlook Survey, released by the Federal Reserve Bank of Philadelphia
on Tuesday, revealed the region's business activity in the nonmanufacturing sector
continued to improve in August, albeit at a slower pace than in the previous
month.
According to
the survey, the diffusion index for current general activity fell from 23.7 in
July to 17.9 this month, remaining positive for the third consecutive month.
A reading above
0 signals expansion, while a reading below 0 indicates contraction.
According to
the report, the new orders index edged down 2 points to 11.6 in August,
recording positive reading for the second straight month. Meanwhile, the
survey’s indexes for full-time and part-time employment remained negative, coming
in at -3 and -5.9 respectively. However, both future activity indexes - the
diffusion index for future activity at the firm level (35) and the future
regional activity index (19.7) - suggest that the respondents expect overall
improvement in nonmanufacturing activity over the next six months. On the price
front, the prices paid
index was essentially unchanged at 10.1, while the prices received index
increased nearly 8 points but remained in negative territory for the fifth
consecutive month, at -6.3 in August.
U.S. stock-index futures traded mixed on Tuesday, with Nasdaq futures being flat and S&P 500 futures surging, as upbeat comments by the senior Chinese and U.S. trade officials on their latest trade talks solidified positive sentiment, which was boosted on Monday by hopes for a near-term coronavirus vaccine breakthrough.
Global Stocks:
Index/commodity | Last | Today's Change, points | Today's Change, % |
Nikkei | 23,296.77 | +311.26 | +1.35% |
Hang Seng | 25,486.22 | -65.36 | -0.26% |
Shanghai | 3,373.58 | -12.06 | -0.36% |
S&P/ASX | 6,161.40 | +31.80 | +0.52% |
FTSE | 6,109.56 | +4.83 | +0.08% |
CAC | 5,064.66 | +56.77 | +1.13% |
DAX | 13,166.29 | +99.75 | +0.76% |
Crude oil | $43.27 | +1.53% | |
Gold | $1,936.90 | -0.12% |
S&P
reported on Tuesday its Case-Shiller Home Price Index, which tracks home prices
in 20 U.S. metropolitan areas, rose 3.5 percent y-o-y in June, following a revised
3.6 percent y-o-y increase in May (originally a 3.7 percent y-o-y gain).
Economists had
expected an advance of 3.8 percent y-o-y.
Phoenix (+9.0
percent y-o-y), Seattle (+6.5 percent y-o-y) and Tampa (+5.9 percent y-o-y)
recorded the highest y-o-y advances in June. Five of the 19 cities reported
greater price gains in the year ending June versus the year ending May.
Meanwhile, the
S&P/Case-Shiller U.S. National Home Price Index, which measures all nine
U.S. census divisions, rose 4.3 percent y-o-y in June, no change from the
previous month.
“Housing prices
were stable in June,” noted Craig J. Lazzara, Managing Director and Global Head
of Index Investment Strategy at S&P Dow Jones Indices. “More data will be
required to understand whether the market resumes its previous path of
accelerating prices, continues to decelerate, or remains stable. That said,
it’s important to bear in mind that deceleration is quite different from an environment
in which prices actually fall.”
(company / ticker / price / change ($/%) / volume)
3M Co | MMM | 164.7 | 1.17(0.72%) | 7915 |
ALCOA INC. | AA | 15.24 | 0.12(0.79%) | 5997 |
ALTRIA GROUP INC. | MO | 44.2 | 0.16(0.36%) | 9821 |
Amazon.com Inc., NASDAQ | AMZN | 3,296.98 | -10.48(-0.32%) | 35489 |
American Express Co | AXP | 100.7 | 1.37(1.38%) | 12263 |
AMERICAN INTERNATIONAL GROUP | AIG | 29.93 | 0.38(1.29%) | 3133 |
Apple Inc. | AAPL | 500.2 | -3.23(-0.64%) | 646757 |
Boeing Co | BA | 180.77 | 2.50(1.40%) | 333424 |
Caterpillar Inc | CAT | 142.56 | 0.88(0.62%) | 7746 |
Chevron Corp | CVX | 87.85 | 0.65(0.75%) | 14833 |
Cisco Systems Inc | CSCO | 42.25 | 0.07(0.17%) | 24686 |
Citigroup Inc., NYSE | C | 51.8 | 0.74(1.45%) | 90853 |
Deere & Company, NYSE | DE | 206 | 0.60(0.29%) | 1811 |
Exxon Mobil Corp | XOM | 41.35 | -0.87(-2.06%) | 269119 |
Facebook, Inc. | FB | 272.39 | 1.00(0.37%) | 87440 |
FedEx Corporation, NYSE | FDX | 218.43 | 1.03(0.47%) | 3657 |
Ford Motor Co. | F | 7.04 | 0.06(0.86%) | 286717 |
Freeport-McMoRan Copper & Gold Inc., NYSE | FCX | 14.6 | 0.04(0.27%) | 41422 |
General Electric Co | GE | 6.65 | 0.02(0.30%) | 411134 |
General Motors Company, NYSE | GM | 30.63 | 0.32(1.06%) | 59804 |
Goldman Sachs | GS | 209.41 | 2.07(1.00%) | 20133 |
Google Inc. | GOOG | 1,591.23 | 3.03(0.19%) | 3249 |
Hewlett-Packard Co. | HPQ | 18.88 | 0.23(1.23%) | 3581 |
Home Depot Inc | HD | 288.36 | 1.61(0.56%) | 14616 |
HONEYWELL INTERNATIONAL INC. | HON | 165.15 | 5.78(3.63%) | 53903 |
Intel Corp | INTC | 49.15 | 0.01(0.02%) | 78472 |
International Business Machines Co... | IBM | 126.39 | 0.71(0.56%) | 13059 |
International Paper Company | IP | 37.5 | 0.23(0.62%) | 2619 |
Johnson & Johnson | JNJ | 152.4 | 0.25(0.16%) | 10180 |
JPMorgan Chase and Co | JPM | 101.3 | 1.24(1.24%) | 90405 |
McDonald's Corp | MCD | 213.75 | 1.13(0.53%) | 8000 |
Merck & Co Inc | MRK | 85.32 | -0.10(-0.11%) | 6899 |
Microsoft Corp | MSFT | 213.15 | -0.54(-0.25%) | 88276 |
Nike | NKE | 112.15 | 0.32(0.29%) | 57260 |
Pfizer Inc | PFE | 38.31 | -0.53(-1.36%) | 246144 |
Procter & Gamble Co | PG | 139.15 | 0.64(0.46%) | 6294 |
Starbucks Corporation, NASDAQ | SBUX | 79.97 | 1.29(1.64%) | 21854 |
Tesla Motors, Inc., NASDAQ | TSLA | 1,980.00 | -34.20(-1.70%) | 321227 |
The Coca-Cola Co | KO | 48.32 | 0.35(0.73%) | 32748 |
Twitter, Inc., NYSE | TWTR | 40.31 | -0.18(-0.44%) | 48373 |
UnitedHealth Group Inc | UNH | 310.85 | 2.01(0.65%) | 8379 |
Verizon Communications Inc | VZ | 59.65 | 0.08(0.13%) | 10859 |
Visa | V | 207.2 | 0.79(0.38%) | 19426 |
Wal-Mart Stores Inc | WMT | 131.23 | -0.10(-0.08%) | 26814 |
Walt Disney Co | DIS | 131.16 | 0.47(0.36%) | 26523 |
Yandex N.V., NASDAQ | YNDX | 66.39 | 1.13(1.73%) | 276997 |
Apple (AAPL) target raised to $530 from $470 at Cowen
Facebook (FB) target raised to $330 from $242 at UBS
Starbucks (SBUX) upgraded to Buy from Hold at Stifel; target $90
FXStreet notes that S&P 500 has reached all-time high cementing that a new bull market has been underway since the March low. This was the fifth time in history that the market hit an all-time high while the economy was still in a recession. Market breadth has been underwhelming while the concentration of the largest five stocks remains a risk, Lizz Ann Sonders from Charles Schwab reports.
“The stock market rally off the March 23 low is now ‘officially’ a new bull market, courtesy of the S&P 500 having hit a new all-time high. It was the fastest recovery in history to a new high following a decline of at least 30% historically (the S&P was down 34% from February 19 to March 23; also the fastest move in history from an all-time high to bear market territory).”
“The dominance of the five largest stocks in the S&P 500 have received much investor attention (and buying pressure). In equal-weighted terms, they represent 1% of the S&P 500; but in cap-weighted terms, they now represent nearly their own quartile. This cycle’s dominance by the top five stocks is outsized relative to past cycles. Following the past three major bear market lows, the five largest stocks did not perform as well as they have today.”
“Concentration has its risks; particularly with regard to the relatively weak breadth statistics accompanying the March new all-time highs. The percentage of S&P 500 stocks above their 50-day and 200-day moving averages have rolled over in conjunction with the overall index hitting a new high. In addition, less than 10% of the S&P 500’s members are trading at a new 52-week high.”
“The recent all-time high marked the fifth time in history when the S&P 500 hit an all-time high while the economy was still officially in a NBER-defined recession. The prior four times were in January 1961, July 1980, November 1982 and February 1991. In all four cases, the NBER declared the recession as having concluded within the subsequent month.”
“I worry about the signs of froth in the market and among some behavioral measures of investor sentiment; not to mention traditional valuation metrics that are historically-stretched. This is not an environment in which greed should dominate investment decisions; but instead one for discipline around diversification and periodic rebalancing. Momentum can power the stock market beyond fundamental supports.”
Best Buy (BBY) reported Q2 FY 2020 earnings of $1.71 per share (versus $1.08 per share in Q2 FY 2019), beating analysts’ consensus estimate of $1.09 per share.
The company’s quarterly revenues amounted to $9.910 bln (+3.9% y/y), beating analysts’ consensus estimate of $9.794 bln.
BBY fell to $113.05 (-3.68%) in pre-market trading.

| Time | Country | Event | Period | Previous value | Forecast | Actual |
|---|---|---|---|---|---|---|
| 06:00 | Germany | GDP (YoY) | Quarter II | -2.2% | -11.7% | -11.3% |
| 06:00 | Germany | GDP (QoQ) | Quarter II | -2.0% | -10.1% | -9.7% |
| 08:00 | Germany | IFO - Current Assessment | August | 84.5 | 87.9 | |
| 08:00 | Germany | IFO - Expectations | August | 97 | 97.5 | |
| 08:00 | Germany | IFO - Business Climate | August | 90.5 | 92.6 | |
| 10:00 | United Kingdom | CBI retail sales volume balance | August | 4 | 8 | -6 |
Safe-haven USD and JPY fell against their major rivals in the European session on Tuesday as upbeat comments by the senior Chinese and U.S. trade officials on trade talks solidified positive sentiment, which was boosted on Monday by hopes for a near-term coronavirus vaccine breakthrough. JPY traded lower against USD.
The U.S. Treasury Secretary Steve Mnuchin and the U.S. Trade Representative (USTR) Robert Lighthizer held a phone call with China's Vice Premier, Liu He, late Monday to discuss implementation of the Phase One trade agreement signed by the world’s largest two economies earlier this year. After the call, the USTR’s office stated that “both sides see progress and are committed to taking the steps necessary to ensure the success of the agreement”. Meanwhile, China's Commerce Ministry described the conversation as "constructive" and confirmed that "the sides agreed to create the conditions and atmosphere for further facilitating the implementation of the Phase One trade deal."
Sentiment was initially boosted by news that the U.S. Food and Drug Administration (FDA) approved emergency use authorization for convalescent plasma in hospitalized COVID-19 patients. In addition, the UK’s drugmaker AstraZeneca announced that it had begun testing an antibody-based cocktail for the prevention and treatment of COVID-19. The announcement came following the Financial Times’ report that the Trump administration is considering "fast-tracking" the Covid-19 vaccine candidate being developed by AstraZeneca and Oxford University. These announcements raised hopes for a potential COVID-19 treatment breakthrough.
Carsten Brzeski, Chief Economist, Eurozone and Global Head of Macro for ING Research, notes that the latest Ifo reading suggests that German businesses believe the rebound is strengthening.
"From rearview mirror to GPS. After this morning’s GDP data for the second quarter gave a final glance at the depth of the crisis in the second quarter, the just-released Ifo index gives some guidance on the short-term outlook for the economy. Germany’s most prominent leading indicator increased for the fifth consecutive months to 92.6 in August, from 90.4 in July. German businesses have started to believe in the rebound as both the expectations and current assessment component increased. While the current assessment component is still clearly below its pre-crisis level, the expectations component stands at its highest level since November 2018."
"An interesting aspect of this crisis is the productivity boost for more real-time and experimental data. Many of these are leading the traditional leading indicators and were relatively reliable in predicting the extent of the slump and now the upswing. Whether they also provide reliable information for nowcasting when the main focus returns to decimal places remains to be seen. If they do, market participants will pay much less attention to the traditional indicators."
"The German economy has managed the first stages of the crisis relatively well. The lockdown was eventually milder than in many other countries. Lockdown measures were lifted earlier than in most countries and consequently the rebound could be stronger than in most other countries. However, it remains important to make a strong distinction between rebound and recovery. While the rebound looks strong, as illustrated by the latest update of the Bundesbank’s activity tracker, the shape of the recovery is much more uncertain, particularly to the extent that the amount of permanent damage is still hard to gauge."
"For now, today’s Ifo index keeps the hopes for a V-shaped rebound alive. However, the fact that a rebound is not necessarily the same as a recovery will be the main theme of the coming months."
FXStreet notes that the S&P 500 has moved to a decisive new record high above 3394 for a move to the 3432/36 resistance. Despite the improvement in momentum, analysts at Credit Suisse continue to look for this to try and cap for a corrective phase.
“S&P 500 has gapped higher to a conclusive new record high and a move to our ‘ideal’ objective of Fibonacci projection at 3432/36. With potential trend channel resistance just above at 3443 it is from here we continue to look for a correction lower to finally emerge.”
“Support moves to 3414/13 initially, with a break below 3400/3397 needed to ease the immediate upside bias, with support then seen at the uptrend from late June at 3382 today, with the 13-day exponential average at 3370. Only below the 3355/54 recent low though would see a (small) price top established to confirm a more important near-term peak, with support then seen next at 3326.”
“Should strength directly extend and a close above 3443 be posted this would suggest the trend has entered a more accelerated phase with resistance seen next at 3450/52, then 3466.”
FXStreet notes that central banks in OECD countries are explicitly (the case in Japan, probably soon in the US) or de facto (in the Eurozone) switching to a policy of controlling long-term interest rates, otherwise known as “yield curve control”. A clear consequence of this choice of yield curve control is financial instability: asset price bubbles, rising debt and high variability in asset prices, according to economists at Natixis.
“The slope of the yield curve no longer responds to its usual determinants. As long-term interest rates are controlled, they no longer react to changes in public debt or expected inflation.”
“The central bank’s money supply can no longer be controlled; it becomes endogenous. This is because central banks have to supply the quantity of money that is necessary, by buying bonds, to lower the long-term interest rate to the desired level.”
“Once inflation normalises after the COVID crisis as the economy gets going again, stocks are reduced and commodity prices rise, real long-term interest rates will be persistently negative, as nominal long-term interest rates will remain low.”
“Negative real long-term interest rates will lead to strong rises in equity valuation and real estate prices; there will also be a strong incentive to borrow.”
“In the event of a demand shock (positive or negative), it will no longer be corrected by a change in long-term interest rates, leading to high variability in asset prices and in GDP growth.”
The
Confederation of British Industry (CBI) reported on Tuesday its latest survey
of retailers showed retail sales volume balance stood at -6 in the year to August,
down from +4 in July, which pointed to a slight fall in retail sales after
broadly flat sales in the previous month. The decline
was broad-based across sectors.
Economist had
forecast the reading to increase to +8.
Moreover, retail
sales volumes are expected to fall at a faster rate in the year to September (-17).
The report also
revealed that orders placed on suppliers fell for the sixteenth consecutive
month (-27 in August, down from -14 in July) and are expected to drop at a
similar pace next month (-26). Meanwhile, stock levels in relation to expected
sales eased to their lowest level since March (+19 in August, down from +29 in
July).
In other survey's results, employment in the retail sector dropped at the sharpest pace since
February 2009 in the year to August (-45, down from -20 in May) and an even
faster decline is anticipated in the quarter ahead (-52). Investment intentions
for the year ahead remained negative, but to a lesser extent than in May (-32,
down from -55).
“Indeed, the
latest survey shows that trading conditions for the retail sector remain tough,
even against the backdrop of business slowly returning. Firms will be wary of
deteriorating household incomes and the risk of further local lockdowns
potentially hitting them in the pocket for a second time,” noted Alpesh Paleja,
CBI Lead Economist. “As a result, further support may well be needed for the
retail sector if demand continues to disappoint. Extending business rates
relief will go a long way towards alleviating pressure on retailers’ cash flow.”
FXStreet reports that USD/CAD, which up until recently remained in a clear downtrend, has now seen a bullish MACD cross and small bullish ‘outside day’ to increase the risk of a corrective rise, with a move above 1.3243/45 confirming a leg higer to 1.3356/61, analysts at Credit Suisse report.
“USD/CAD continues to stall around the 200-week average at 1.3170 and has posted a bullish ‘outside day’ rejection from the recent low at 1.3135/33. Furthermore, MACD has now bullishly crossed higher to bring it into line with the majority of other USD pairs which also show a tiring momentum picture. All in all then, the risk of a deeper corrective move back higher seems to have grown, although only a move above resistance at 1.3243/45 would this, which includes the 13 -day exponential average, which has been a good barometer over the past month.”
“Next resistance above 1.3243/45 is then seen at 1.3272, before 1.3356/61.”
“A break below 1.3135/33 would suggest the downtrend is resuming for a move back to 1.3105, with scope for the 61.8% retracement of the entire 2017/2020 upmove at 1.3057. We expect to see a lengthier pause here, particularly with another key support just below at the 1.2952 price low.”
Bloomberg reports that a U.S. Democratic victory at the ballot box come November could help Asia’s stock markets, according to UBS Global Wealth Management.
A Democratic administration with an emphasis on infrastructure and a less combative trade posture would be positive for Asia’s information technology companies, 5G-related firms and electric vehicle tech supply chains, strategists led by Mark Haefele wrote in a note. Japanese automakers could also benefit in the long term, as they have a head-start in environmental-related fields, an area that would gain from Democratic presidential candidate Joe Biden’s “green” agenda, they said.
“We think a Democratic sweep would prove to be an advantageous outcome for Asia’s equity markets,” the strategists said. “It could lead to higher U.S. corporate income taxes and more regulatory oversight, but we think greater government spending would be supportive of the region’s export-oriented economies.”
In contrast, a second term for President Donald Trump may result in a harsher U.S. stance against China, stalling progress in trade negotiations and jeopardizing the Phase One agreement, the strategists wrote. The U.S. may also delist more Chinese shares, boosting Hong Kong’s status as a financial center.
UBS Global Wealth pointed out that equity volatility tends to rise going into U.S. elections before the certainty of the result pushes shares higher. However, volatility could climb after election day if the contest is challenged, it said.
FXStreet reports that Citigroup Inc.’s Chief US Equity Strategist, Tobias Levkovich, bumped up the 2020 forecast for S&P 500 index from 2,900 to 3,300, per Bloomberg.
“The pushback to our upward adjustments will involve claims of capitulation and a lack of fortitude/consistency.”
“However, we appear to be in one of those periods where technicals seem to overwhelm fundamentals and standing in the way of that might only indicate our intransigence.”
“We still think the market may be ahead of itself but the Fed will do ‘whatever it takes’ to prevent US stocks declining by teen-like percentages.”
“Is the S&P 500 ready to drop 500 points? No.”
CNBC reports that the worst of the hit from the coronavirus pandemic appears to be over and markets could see a rebound in revenues from here, market veteran Ed Yardeni told.
“We do have weekly indicators that are pointing in the direction of a rebound in revenues,” he told CNBC’s “Street Signs Asia.” “We think that the second quarter was the bottom for both revenue and earnings.”
The president of Yardeni Research pointed to indicators like retail sales as well as new and existing home sales which have been “very strong.”
Last week, retail giants Walmart, Target, Lowe’s and Home Depot reported tremendous sales gains, blowing away Wall Street estimates.
Yardeni said: “All in all, we’re still seeing that economies are recovering pretty well from what was basically a lockdown recession.”
In a note early this week, Citi Private Bank pointed to the effectiveness of government stimulus in “countering the deepest impacts of the COVID recession.”
“The generally good health of the world economy pre-COVID and rapid fiscal action by governments fueled a rebound in global activity that has been extremely sharp, V-shaped in fact,” strategists wrote.
They added that it seemed to be “business as usual” when it comes to spending, for large segments of the population, attributing the spending boom to what they called “substitution effects.” For instance, people spend on improving their homes instead of saving, or online shopping instead of in-store retail.
These “substitution effects” have been so “robust,” they said, that they have caused supply chain disruptions and inventory depletions.
“At current production rates, retail inventories will continue dropping through the third quarter. We believe this will restrain US GDP through year-end, but it will be a driver of a future recovery in industrial activity and trade,” Citi Private Bank wrote. “We have pent-up demand during a pandemic.”
Reuters reports that German business morale improved more than expected in August, a survey showed on Tuesday, boosting hopes that companies in Europe's largest economy are recovering from the coronavirus shock.
The Ifo institute said its business climate index rose to 92.6 from a downwardly revised 90.4 in July. This was the fourth monthly increase in a row and came in better than economists' expectations for 92.2.
"The German economy is on the road to recovery," Ifo President Clemens Fuest said in a statement, adding that firms assessed their current business situation much more optimistically than in the previous month.
FXStreet reports that AUD/USD is likely to be in a period of consolidation over the near-term, with technical support at 0.70. Localised COVID-19 outbreaks have little bearing on the aussie as fiscal flexibility and the green light from the central bank for the pair rally support the AUD, according to economists at HSBC.
“The AUD is likely to be in a period of consolidation; prior resistance around 0.70 should turn into a key support level for AUD/USD.”
“The path of COVID-19 continues to have little bearing on the AUD. One key factor is the significant fiscal firepower at the government’s disposal to mitigate the economic impacts. In fact, the Australian government announced an extension of its wage subsidy programmes on 7 August.”
“The Reserve Bank of Australia (RBA) has given the green light to the rally in the AUD. From August’s minutes, the RBA noted that the AUD strength is broadly in line with its fundamentals, such as commodity prices and interest rate differentials. At the parliamentary testimony on 14 August, RBA Governor Lowe reiterated that negative rates in Australia were ‘extraordinarily unlikely’. He also, once again, ruled out direct monetisation of government debt and FX intervention. Our economists see the RBA being on hold over the coming quarters, with the next monetary policy meeting due on 1 September.”
“We believe the ability to flex fiscal firepower and the green light from the central bank for the aussie rally are AUD bullish. We still see the AUD holding on to recent gains and possibly strengthening further next year, even if the currency remains sensitive to RORO over the near-term.”
| Time | Country | Event | Period | Previous value | Forecast | Actual |
|---|---|---|---|---|---|---|
| 06:00 | Germany | GDP (YoY) | Quarter II | -2.2% | -11.7% | -11.3% |
| 06:00 | Germany | GDP (QoQ) | Quarter II | -2.0% | -10.1% | -9.7% |
During today's Asian trading, the dollar index continued to decline, as optimism related to the possibility of early approval of a coronavirus vaccine in the US weakens the attractiveness of the US currency as a "safe haven"asset. The ICE index, which tracks the dynamics of the US dollar against six currencies (euro, swiss franc, yen, canadian dollar, pound and swedish krona), fell 0.1%.
Yesterday, the Financial Times newspaper wrote that US President Donald Trump intends to circumvent the usual regulatory standards in order to force approval in the country of an experimental vaccine developed by AstraZeneca Plc and the University of Oxford, before the November presidential election.
Previously, the Food and drug administration (FDA) officially authorized the use of plasma taken from people who have had coronavirus to treat infected patients.
Traders' attention this week is focused on the speech of Federal reserve Chairman Jerome Powell at the Federal reserve Bank event in Kansas city. The Symposium, organized by the Kansas city Fed, annually gathers the heads of world Central banks, finance ministers, academics and financial market participants in Jackson hole. This year's event will be held online on August 27-28. Its theme is "Moving into the next decade: consequences of monetary policy". Powell is expected to talk in his speech about a long-running review of the Fed's strategy.
The yuan rose in value on information about a telephone conversation between representatives of the US administration and Vice Premier of the state Council of China Liu He. A report published on the website of the US trade mission notes that US trade representative Robert Lighthizer and Treasury Secretary Steven Mnuchin noted progress in implementing the first phase of the trade agreement between the US and China, following a telephone conversation with Liu He.
Reuters reports that China will maintain a "normal" monetary policy, a senior central bank official said on Tuesday, as Beijing holds off on more easing as its post-COVID economic recovery gathered pace.
Sun Guofeng, head of the monetary policy department at the People's Bank of China, told a press conference the central bank would not change its monetary policy direction or its flexible approach to policy.
Liquidity would also stay reasonably ample, which would allow China's economy to return to its potential growth, he said.
"To cope with all sorts of uncertainties, the monetary policy requires greater certainty," said Sun, adding that China has not adopted zero or negative interest rates and other non-traditional policies such as quantitative easing. That means the PBOC does not need to deal with the complications associated with exiting such measures.
Chinese authorities have urged banks to offer cheaper loans and cut fees to help struggling businesses hit by the COVID-19 pandemic. Lenders have also grappled with a surge in non-performing loans and difficulties to replenish their capital as profits fell.
Despite the pressures on the banking sector, there is no need for China to lower regulatory requirement on banks' capital adequacy ratio, Liu Guoqiang, vice governor at PBOC, told the same briefing.
Capital adequacy ratio of the banking sector fell to 14.21% by end-June, but still remained above the regulatory standards of 10.5%, according to Liu.
"Even as capital adequacy ratio drops further in the future, we cannot lower regulatory requirements. Doing so would be fooling ourselves," said Liu, adding that banks should rather replenish their capital via tools such as perpetual bonds and second-tier capital.
Mid-sized and small banks can use proceeds from local government special bonds to boost their capital, Liu said.
On China's official digital currency, Sun from PBOC said internal tests are being conducted in Shenzhen, Suzhou, Xiongan and Chengdu, with plans for use at the 2022 Winter Olympic Games in Beijing although there was no timetable for the rollout.
eFXdata reports that Nordea Research flags a scope for ECB rhetorical intervention if EUR/USD continues to rise above 1.20 over the coming weeks.
"The ECB is by the way probably not ready to accept >1.20 levels without a battle either. They managed to temporarily temper the EUR/USD momentum in August and September 2017 when sources kept leaking stories to Reuters and Bloomberg every time 1.20 was breached.
"We are on alert of a similar rhetorical intervention from Frankfurt should the EUR/USD gain too fast again this autumn," Nordea notes.
According to the report from Federal Statistical Office (Destatis), the gross domestic product (GDP) fell sharply by 9.7% in the 2nd quarter of 2020 on the 1st quarter of 2020 after adjustment for price, seasonal and calendar variations. Economists had expected a 10.1% decrease. The GDP drop in the 2nd quarter of 2020 was not quite as steep as reported in the first release of 30 July 2020 (-10.1%). The slump in the German economy was thus much larger than during the financial and economic crisis of 2008/2009 (-4.7% in the 1st quarter of 2009) and the sharpest decline since quarterly GDP calculations for Germany started in 1970.
As a consequence of the ongoing corona pandemic and the restrictions related with it, household final consumption expenditure fell sharply by 10.9% in the 2nd quarter of 2020 compared with the 1st quarter after price, seasonal and calendar adjustment. Gross fixed capital formation in machinery and equipment even dropped by as much as 19.6%. Gross fixed capital formation in construction also declined markedly (-4.2%) in the 2nd quarter, which was due in particular to the exceptionally strong 1st quarter (+5.1%). Only final consumption expenditure of general government had a stabilising effect; it was 1.5% higher than in the previous quarter and prevented an even larger GDP decrease.
The trade with foreign countries also slumped. In the 2nd quarter of 2020, exports of goods and services dropped by 20.3% on the 1st quarter 2020 after price, seasonal and calendar adjustment. Imports also recorded a double-digit decline of 16.0%. This means that the decreases were even markedly larger than during the financial and economic crisis in the 1st quarter 2009 (exports: -11.0%; imports: -5.9%). In the 1st quarter of 2020, at the beginning of the coronavirus crisis, exports had already dropped by 3.3% and imports by 1.9%.
The German economy shrank also in a year-on-year comparison. GDP was down a price-adjusted 11.3% in the 2nd quarter of 2020 (also calendar-adjusted) on a year earlier. Again, such large decreases had not been observed even during the financial and economic crisis of 2008/2009. The largest decrease on the same quarter of the preceding year had been recorded in the 2nd quarter of 2009 (-7.9%).
EUR/USD
Resistance levels (open interest**, contracts)
$1.1896 (2312)
$1.1867 (2300)
$1.1845 (1199)
Price at time of writing this review: $1.1808
Support levels (open interest**, contracts):
$1.1752 (1262)
$1.1730 (794)
$1.1703 (942)
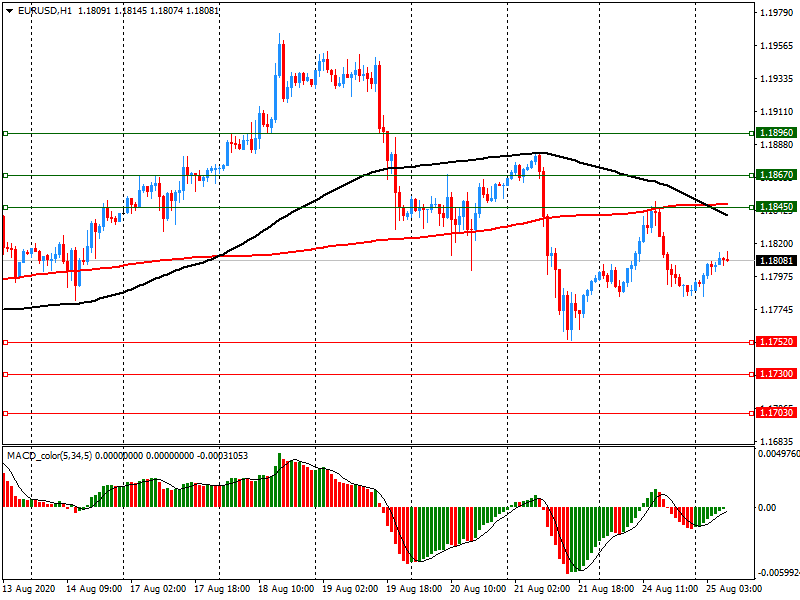
Comments:
- Overall open interest on the CALL options and PUT options with the expiration date September, 4 is 91725 contracts (according to data from August, 24) with the maximum number of contracts with strike price $1,0500 (5007);
GBP/USD
Resistance levels (open interest**, contracts)
$1.3193 (979)
$1.3161 (820)
$1.3134 (833)
Price at time of writing this review: $1.3099
Support levels (open interest**, contracts):
$1.2999 (546)
$1.2976 (512)
$1.2947 (1574)
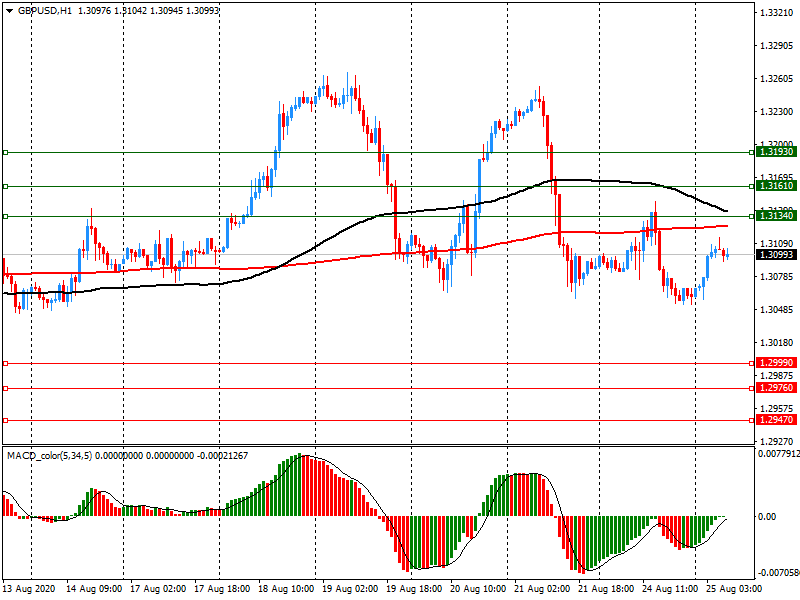
Comments:
- Overall open interest on the CALL options with the expiration date September, 4 is 23133 contracts, with the maximum number of contracts with strike price $1,3800 (3394);
- Overall open interest on the PUT options with the expiration date September, 4 is 18794 contracts, with the maximum number of contracts with strike price $1,3000 (1574);
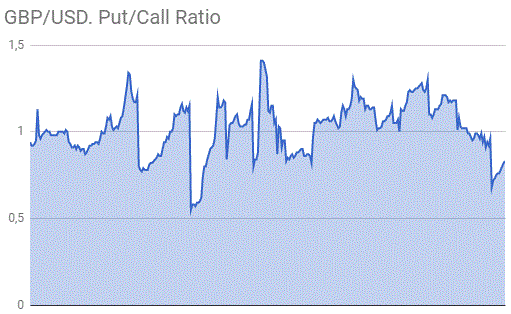
- The ratio of PUT/CALL was 0.81 versus 0.83 from the previous trading day according to data from August, 24
* - The Chicago Mercantile Exchange bulletin (CME) is used for the calculation.
** - Open interest takes into account the total number of option contracts that are open at the moment.
| Raw materials | Closed | Change, % |
|---|---|---|
| Brent | 44.91 | 1.42 |
| Silver | 26.57 | -0.34 |
| Gold | 1928.205 | -0.5 |
| Palladium | 2163.53 | -0.25 |
| Index | Change, points | Closed | Change, % |
|---|---|---|---|
| NIKKEI 225 | 65.21 | 22985.51 | 0.28 |
| Hang Seng | 437.74 | 25551.58 | 1.74 |
| KOSPI | 25.24 | 2329.83 | 1.1 |
| ASX 200 | 18.4 | 6129.6 | 0.3 |
| FTSE 100 | 102.84 | 6104.73 | 1.71 |
| DAX | 301.74 | 13066.54 | 2.36 |
| CAC 40 | 111.56 | 5007.89 | 2.28 |
| Dow Jones | 378.13 | 28308.46 | 1.35 |
| S&P 500 | 34.12 | 3431.28 | 1 |
| NASDAQ Composite | 67.92 | 11379.72 | 0.6 |
| Time | Country | Event | Period | Previous value | Forecast |
|---|---|---|---|---|---|
| 06:00 | Germany | GDP (YoY) | Quarter II | -2.3% | -11.7% |
| 06:00 | Germany | GDP (QoQ) | Quarter II | -2.0% | -10.1% |
| 08:00 | Germany | IFO - Current Assessment | August | 84.5 | |
| 08:00 | Germany | IFO - Expectations | August | 97 | |
| 08:00 | Germany | IFO - Business Climate | August | 90.5 | |
| 10:00 | United Kingdom | CBI retail sales volume balance | August | 4 | 8 |
| 13:00 | Belgium | Business Climate | August | -13.9 | |
| 13:00 | U.S. | Housing Price Index, m/m | June | -0.3% | |
| 13:00 | U.S. | S&P/Case-Shiller Home Price Indices, y/y | June | 3.7% | 3.6% |
| 14:00 | U.S. | Richmond Fed Manufacturing Index | August | 10 | |
| 14:00 | U.S. | New Home Sales | July | 0.776 | 0.786 |
| 14:00 | U.S. | Consumer confidence | August | 92.6 | 93 |
| 17:30 | Canada | BOC Deputy Governor Lawrence Schembri Speaks | |||
| 19:25 | U.S. | FOMC Member Daly Speaks | |||
| 22:45 | New Zealand | Trade Balance, mln | July | 426 |
| Pare | Closed | Change, % |
|---|---|---|
| AUDUSD | 0.7162 | 0.04 |
| EURJPY | 124.926 | 0.11 |
| EURUSD | 1.1788 | -0.06 |
| GBPJPY | 138.406 | -0.04 |
| GBPUSD | 1.30605 | -0.21 |
| NZDUSD | 0.65297 | -0.17 |
| USDCAD | 1.32159 | 0.22 |
| USDCHF | 0.91115 | -0.04 |
| USDJPY | 105.963 | 0.16 |


© 2000-2026. All rights reserved.
This site is managed by Teletrade D.J. LLC 2351 LLC 2022 (Euro House, Richmond Hill Road, Kingstown, VC0100, St. Vincent and the Grenadines).
The information on this website is for informational purposes only and does not constitute any investment advice.
The company does not serve or provide services to customers who are residents of the US, Canada, Iran, The Democratic People's Republic of Korea, Yemen and FATF blacklisted countries.
Making transactions on financial markets with marginal financial instruments opens up wide possibilities and allows investors who are willing to take risks to earn high profits, carrying a potentially high risk of losses at the same time. Therefore you should responsibly approach the issue of choosing the appropriate investment strategy, taking the available resources into account, before starting trading.
Use of the information: full or partial use of materials from this website must always be referenced to TeleTrade as the source of information. Use of the materials on the Internet must be accompanied by a hyperlink to teletrade.org. Automatic import of materials and information from this website is prohibited.
Please contact our PR department if you have any questions or need assistance at pr@teletrade.global.
transfers