- Analytics
- News and Tools
- Market News
CFD Markets News and Forecasts — 28-09-2018
Most of the September gain was among households with incomes in the bottom third, whose index value of 96.3 was the highest since November 2000. In contrast, the Sentiment Index among households with incomes in the top third lost a total of 8.1% during the past seven months since reaching its cyclical peak of 111.9 in February 2018. This divergence across income subgroups has been observed in past economic cycles and indicates that the expansion has now benefitted nearly all population subgroups.
The MNI Chicago Business Barometer slipped to a three-month low of 63.6 in August, down 1.9 points from July's 65.5. Firms' operations continued to grow at a healthy pace in August, despite decelerating for the first time in five months. A softening in Supplier Deliveries, Order Backlogs and Employment offset gains in Production and New Orders, driving the decline in the Barometer. However, it still sits 6.9% higher on the year and continues to signal robust business conditions. August saw both demand and output inch higher, though broadly unchanged from their already-elevated July levels. Despite registering only minor changes on the month, the New Orders indicator is up 6.4% on the year while the Production indicator posted a 9.1% y/y rise
U.S. stock-index futures fell on Friday on the back of lingering trade tensions and declines in European equity markets amid worries about Italy's budget.
Global Stocks:
| Index/commodity | Last | Today's Change, points | Today's Change, % |
| Nikkei | 24,120.04 | +323.30 | +1.36% |
| Hang Seng | 27,788.52 | +72.85 | +0.26% |
| Shanghai | 2,821.35 | +29.58 | +1.06% |
| S&P/ASX | 6,207.60 | +26.40 | +0.43% |
| FTSE | 7,504.16 | -41.28 | -0.55% |
| CAC | 5,475.17 | -65.24 | -1.18% |
| DAX | 12,216.58 | -219.01 | -1.76% |
| Crude | $72.23 | | +0.15% |
| Gold | $1,188.40 | | +0.08% |
(company / ticker / price / change ($/%) / volume)
| Amazon.com Inc., NASDAQ | AMZN | 2,004.00 | -8.98(-0.45%) | 47027 |
| American Express Co | AXP | 107.86 | 0.01(0.01%) | 204 |
| AMERICAN INTERNATIONAL GROUP | AIG | 53.15 | -0.24(-0.45%) | 490 |
| Apple Inc. | AAPL | 224.55 | -0.40(-0.18%) | 200927 |
| AT&T Inc | T | 33.36 | -0.06(-0.18%) | 10189 |
| Barrick Gold Corporation, NYSE | ABX | 11.15 | 0.02(0.18%) | 33589 |
| Boeing Co | BA | 368.5 | 1.11(0.30%) | 8231 |
| Caterpillar Inc | CAT | 151.55 | -0.92(-0.60%) | 3226 |
| Chevron Corp | CVX | 122.25 | -0.22(-0.18%) | 1695 |
| Cisco Systems Inc | CSCO | 48.18 | -0.15(-0.31%) | 11768 |
| Citigroup Inc., NYSE | C | 72.22 | -0.73(-1.00%) | 40767 |
| Deere & Company, NYSE | DE | 150.46 | -0.76(-0.50%) | 7298 |
| Exxon Mobil Corp | XOM | 85.3 | -0.47(-0.55%) | 43642 |
| Facebook, Inc. | FB | 167.8 | -1.04(-0.62%) | 99541 |
| Freeport-McMoRan Copper & Gold Inc., NYSE | FCX | 13.85 | -0.02(-0.14%) | 13475 |
| General Electric Co | GE | 11.44 | -0.09(-0.78%) | 242642 |
| General Motors Company, NYSE | GM | 33.61 | -0.06(-0.18%) | 1179 |
| Goldman Sachs | GS | 226 | -1.74(-0.76%) | 12051 |
| Google Inc. | GOOG | 1,189.00 | -5.64(-0.47%) | 2011 |
| Hewlett-Packard Co. | HPQ | 25.5 | -0.13(-0.51%) | 1851 |
| Home Depot Inc | HD | 206.3 | -0.54(-0.26%) | 836 |
| Intel Corp | INTC | 45.7 | -0.18(-0.39%) | 49512 |
| International Business Machines Co... | IBM | 150.93 | -0.57(-0.38%) | 3775 |
| International Paper Company | IP | 51.31 | 1.08(2.15%) | 135 |
| Johnson & Johnson | JNJ | 138.1 | -0.12(-0.09%) | 780 |
| JPMorgan Chase and Co | JPM | 113.87 | -0.65(-0.57%) | 26430 |
| McDonald's Corp | MCD | 165.8 | -0.73(-0.44%) | 739 |
| Merck & Co Inc | MRK | 70.45 | -0.27(-0.38%) | 200 |
| Microsoft Corp | MSFT | 114.07 | -0.34(-0.30%) | 56374 |
| Nike | NKE | 84.12 | -0.42(-0.50%) | 3626 |
| Starbucks Corporation, NASDAQ | SBUX | 57.2 | -0.14(-0.24%) | 901 |
| Tesla Motors, Inc., NASDAQ | TSLA | 268.94 | -38.58(-12.55%) | 1284454 |
| The Coca-Cola Co | KO | 45.93 | -0.08(-0.17%) | 141 |
| Twitter, Inc., NYSE | TWTR | 29.15 | -0.27(-0.92%) | 55032 |
| Visa | V | 149.58 | -0.44(-0.29%) | 1691 |
| Wal-Mart Stores Inc | WMT | 93.99 | -0.14(-0.15%) | 5989 |
| Walt Disney Co | DIS | 115.36 | -0.68(-0.59%) | 957 |
| Yandex N.V., NASDAQ | YNDX | 33 | -0.28(-0.84%) | 3020 |
3M (MMM) target raised to $220 from $210 at Deutsche Bank
Apple (AAPL) target raised to $215 from $210 at Nomura; Neutral rated
Tesla (TSLA) was downgraded to Sell from Neutral at Citigroup
Prices for products sold by Canadian manufacturers, as measured by the Industrial Product Price Index (IPPI), decreased 0.5% in August, mainly due to lower prices for primary non-ferrous metal products. Prices for raw materials purchased by Canadian manufacturers, as measured by the Raw Materials Price Index (RMPI), fell 4.6%, largely reflecting lower prices for crude energy products.
The IPPI fell 0.5% in August, following a 0.2% decrease in July. Of the 21 major commodity groups, 12 were down, 7 were up and 2 were unchanged.
The decrease in the IPPI was mainly due to lower prices for primary non-ferrous metal products (-3.4%), which posted their largest decline since July 2017. Lower prices for unwrought precious metals and precious metal alloys (-3.9%), unwrought aluminum and aluminum alloys (-5.8%) and unwrought copper and copper alloys (-4.0%) were mostly responsible for the decline in this commodity group.
Personal income increased $60.3 billion (0.3 percent) in August according to estimates released today by the Bureau of Economic Analysis. Disposable personal income (DPI) increased $51.4 billion (0.3 percent) and personal consumption expenditures (PCE) increased $46.4 billion (0.3 percent).
Real DPI increased 0.2 percent in August and Real PCE increased 0.2 percent. The PCE price index increased 0.1 percent. Excluding food and energy, the PCE price index increased less than 0.1 percent.
The increase in personal income in August primarily reflected increases in wages and salaries, government social benefits to persons, and nonfarm proprietors' income.
The $28.7 billion increase in real PCE in August reflected an increase of $15.3 billion in spending for goods and a $14.3 billion increase in spending for services. Within goods, other nondurable goods was the leading contributor to the increase. Within services, the largest contributor to the increase was spending for health care
Real gross domestic product (GDP) grew 0.2% in July after essentially no change in June. This increase was concentrated as 12 of 20 sectors were up, led by growth in manufacturing, wholesale trade, utilities and transportation and warehousing.
The output of goods-producing industries expanded 0.3% after edging down in June, while services-producing industries were up 0.2%.
The manufacturing sector was up 1.2% in July, its strongest growth since November 2017, as output of both non-durable and durable manufacturing rose.
Non-durable manufacturing expanded 2.4% in July, the highest monthly growth in four years, as six of nine subsectors increased. Increases in chemical (+5.5%) and petroleum and coal products (+7.6%) manufacturing were driven by a ramp-up in production following shutdowns for maintenance and retooling at some facilities earlier in 2018.
Durable manufacturing rose 0.3% as 7 of 10 subsectors grew. Wood products (+2.1%), fabricated metal products (+1.1%) and machinery manufacturing (+0.8%) led the increase, while declines in furniture and related products (-5.2%) and miscellaneous manufacturing (-4.7%) offset some of the growth.
In September 2018, according to preliminary estimates, the Italian consumer price index for the whole nation (NIC) decreased by 0.4% on monthly basis and increased by 1.5% compared with September 2017 (+1.6% in August 2018).
The slight slowdown of the growth on annual basis of All items index was mainly due to prices of Unprocessed food (from +3.1% of the previous month to +2.4%) of Services related to transport (from +2.8% to +2.5%) and to prices of Non-regulated energy products (from +9.5% to +9.3%) whose growth was still wide.
Inflation excluding energy and unprocessed food (core inflation) was +0.8% (the same annual rate of change observed in August) and inflation excluding energy was +1.0% (down +1.1% of August).
Gross fixed capital formation (GFCF), in volume terms, was estimated to have fallen by 0.5% to £85.2 billion in Quarter 2 (Apr to June) 2018 from £85.6 billion in Quarter 1 (Jan to Mar) 2018.
Business investment was estimated to have fallen by 0.7% to £47.5 billion between Quarter 1 2018 and Quarter 2 2018.
Between Quarter 2 2017 and Quarter 2 2018, GFCF was estimated to have fallen by 0.6% from £85.8 billion; business investment was estimated to have fallen by 0.2% from £47.6 billion.
The sectors that contributed to the 0.5% GFCF fall between Quarter 1 2018 and Quarter 2 2018 were public corporations' dwellings, business investment and private sector transfer costs.
The asset that contributed most to the decrease in GFCF over the same period was transport equipment.
Euro area annual inflation is expected to be 2.1% in September 2018, up from 2.0% in August 2018, according to a flash estimate from Eurostat, the statistical office of the European Union. Looking at the main components of euro area inflation, energy is expected to have the highest annual rate in September (9.5%, compared with 9.2% in August), followed by food, alcohol & tobacco (2.7%, compared with 2.4% in August), services (1.3%, stable compared with August) and non-energy industrial goods (0.4%, stable compared with August).
The UK's current account deficit was £20.3 billion (3.9% of gross domestic product (GDP)) in Quarter 2 (Apr to June) 2018, a widening of £4.6 billion from a revised deficit of £15.7 billion (3.0% of GDP) in Quarter 1 (Jan to Mar) 2018 and the widest deficit since Quarter 2 2017.
The UK's current account deficit widened in Quarter 2 2018, due mainly to a widening of the trade in goods and primary income deficits.
The total trade in goods deficit widened by £2.7 billion to £34.7 billion in Quarter 2 2018, from £32.0 billion in Quarter 1 2018, the largest increase to the deficit since Quarter 3 (July to Sept) 2016 (£8.0 billion); this can be partly attributed to movements in erratics, which include aircraft and non-monetary gold, and an increase in the price of oil.
The primary income deficit widened by £2.1 billion in Quarter 2 2018 to £8.8 billion from a revised deficit of £6.7 billion in Quarter 1 2018; this was due to payments on investment income rising more than receipts.
UK gross domestic product (GDP) in volume terms was estimated to have increased by 0.4% between Quarter 1 (Jan to Mar) 2018 and Quarter 2 (Apr to June) 2018, unrevised from the first quarterly estimate of GDP.
Growth in the latest quarter was driven by the services sector, which increased by 0.6%, due partly to an increase in retail sales.
Household spending grew by 0.4%, while business investment decreased by 0.7% between Quarter 1 2018 and Quarter 2 2018.
Nominal GDP grew by 0.8% in Quarter 2 2018, with compensation of employees growing by 0.7%.
GDP was estimated to have increased by 1.7% between 2016 and 2017, unrevised from the previous estimate.
In September 2018, the KOF Economic Barometer rose from 98.9 in the previous month (revised down from 100.3) by 3.3 points to a level of 102.2. This may imply that the downward trend, which has been visible since the beginning of 2018, might have come to a halt.
The strongest positive contributions to this result come from manufacturing, followed by the indicators from the exporting sector and finally from the financial sector. The signals from the remaining sectors are slightly positive or neutral.
In August 2018, household expenditure on goods increased by 0.8% in volume, after a stability (+0.0%) in July. This growth was driven by the jump of manufactured good consumption (+2.5% after +0.0%), in spite of the decline in food consumption (-0.6%) and energy spending (-0.5%).
Consumption of durables increased strongly in August (+4.1%), in particular in transport equipment (+6.9%). Indeed, new car sales reached an exceptionnally high level, in anticipation of the tightening of the new car approval tests in Europe on September 1st. Household durables spending rebounded (+0.4% after -0.7%), driven by furniture purchases, and despite the return to normal of television set purchases.
Consumer prices in the Tokyo region were up 1.3 percent on year in September, says rttnews.
That exceeded expectations for 1.1 percent and was up from 1.2 percent in August.
Core CPI, which excludes the costs of fresh food, advanced an annual 1.0 percent - also above expectations for 0.9 percent, which would have been unchanged.
On a monthly basis, overall Tokyo inflation was up 0.1 percent and core CPI was flat.
In August 2018, the seasonally adjusted number of new dwellings consented rose 7.8 percent compared with July 2018, following an 11 percent fall in July, and an 8.1 percent fall in June.
In the year ended August 2018, the actual number of new dwellings consented was 32,759, up 6.6 percent from the August 2017 year.
The annual value of non-residential building work consented was $6.7 billion, up 5.4 percent from the August 2017 year.
Japan's housing starts increased for the first time in three months in August, according to rttnews.
Housing starts advanced 1.6 percent in August from last year, reversing a 0.7 percent drop in July. Orders were forecast to climb 0.4 percent.
Annualized housing starts decreased to 957,000 from 958,000 in July. The expected level was 947,000.
Data also showed that construction orders received by big 50 contractors rose 0.5 percent year-on-year in August in contrast to a 9.3 percent fall in July. Orders increased for the first time in four months.
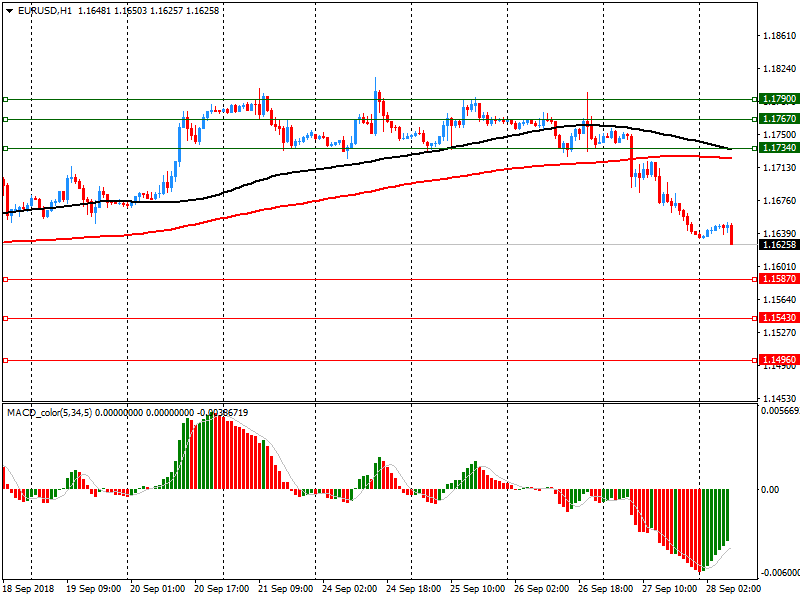
EUR/USD
Resistance levels (open interest**, contracts)
$1.1790 (3070)
$1.1767 (2930)
$1.1734 (604)
Price at time of writing this review: $1.1626
Support levels (open interest**, contracts):
$1.1587 (4924)
$1.1543 (3297)
$1.1496 (3274)
Comments:
- Overall open interest on the CALL options and PUT options with the expiration date October, 15 is 88659 contracts (according to data from September, 27) with the maximum number of contracts with strike price $1,1900 (5054);
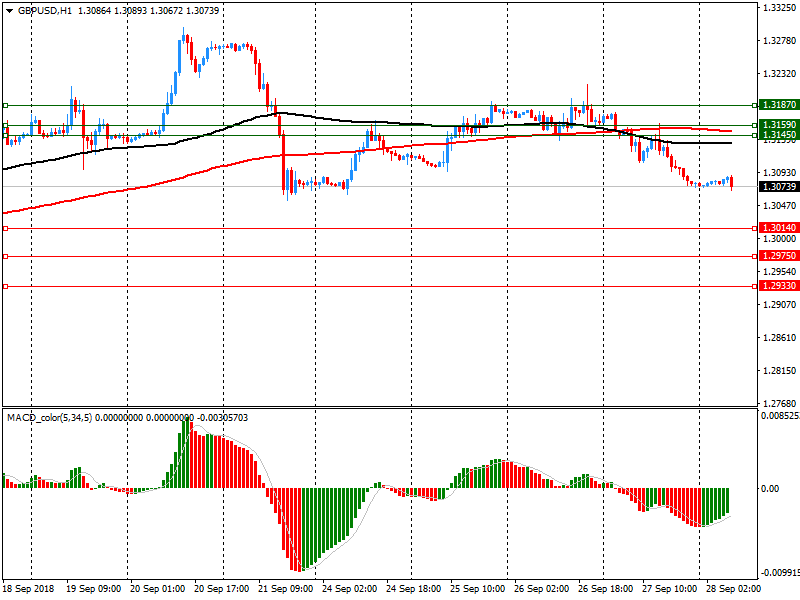
GBP/USD
Resistance levels (open interest**, contracts)
$1.3187 (2563)
$1.3159 (2213)
$1.3145 (722)
Price at time of writing this review: $1.3074
Support levels (open interest**, contracts):
$1.3014 (1550)
$1.2975 (1729)
$1.2933 (2143)
Comments:
- Overall open interest on the CALL options with the expiration date October, 15 is 29345 contracts, with the maximum number of contracts with strike price $1,3200 (2972);
- Overall open interest on the PUT options with the expiration date October, 15 is 37734 contracts, with the maximum number of contracts with strike price $1,2800 (2338);
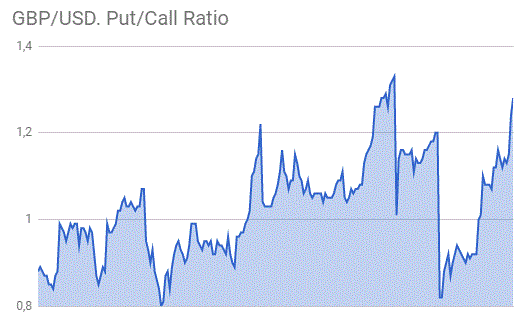
- The ratio of PUT/CALL was 1.28 versus 1.24 from the previous trading day according to data from September, 27.
* - The Chicago Mercantile Exchange bulletin (CME) is used for the calculation.
** - Open interest takes into account the total number of option contracts that are open at the moment.
Over a year, the Consumer Price Index (CPI) should barely slow down in September 2018: +2.2% after +2.3% in August, according to the provisional estimate made at the end of the month. The slight decrease in inflation should come, on the one hand, from a slowdown in services and energy prices and, on the another hand, from a slightly larger drop in those of manufactured products. Contrariwise, lesser inflation should be mitigated by a marked acceleration in food prices, due to these in fresh food prices.
Over one month, consumer prices should edge down: −0.2% after +0.5% in August. This downturn should be due to these, seasonal, in the prices of some tourism-related services. Contrariwise, energy prices should rise over one month after a stability in August. Those of manufactured products should accelerate after the end, in August, of the summer sales in the metropolitan area. Lastly, food prices should be more dynamic than in the previous month.
© 2000-2026. All rights reserved.
This site is managed by Teletrade D.J. LLC 2351 LLC 2022 (Euro House, Richmond Hill Road, Kingstown, VC0100, St. Vincent and the Grenadines).
The information on this website is for informational purposes only and does not constitute any investment advice.
The company does not serve or provide services to customers who are residents of the US, Canada, Iran, The Democratic People's Republic of Korea, Yemen and FATF blacklisted countries.
Making transactions on financial markets with marginal financial instruments opens up wide possibilities and allows investors who are willing to take risks to earn high profits, carrying a potentially high risk of losses at the same time. Therefore you should responsibly approach the issue of choosing the appropriate investment strategy, taking the available resources into account, before starting trading.
Use of the information: full or partial use of materials from this website must always be referenced to TeleTrade as the source of information. Use of the materials on the Internet must be accompanied by a hyperlink to teletrade.org. Automatic import of materials and information from this website is prohibited.
Please contact our PR department if you have any questions or need assistance at pr@teletrade.global.


