- Analytics
- News and Tools
- Market News
CFD Markets News and Forecasts — 29-05-2023
- AUD/NZD has started balancing above 1.0800 as investors are awaiting the RBA Lowe’s speech for further cues.
- The street is anticipating a neutral RBA interest rate policy stance for June after a surprise 25 bps rate hike in May.
- RBNZ Silk warned that the central bank must be watchful of over-tightening policy.
The AUD/NZD pair has shifted its auction comfortably above the round-level resistance of 1.0800 in the early Tokyo session. The asset has picked strength ahead of the speech from Reserve Bank of Australia (RBA) Governor Philip Lowe.
RBA Governor Philip Lowe is expected to deliver guidance about the likely monetary policy action next week. The street is anticipating a neutral interest rate policy stance for June after a surprise 25 basis points (bps) rate hike announcement in May.
Australia’s inflation is consistently decelerating for the past three months due to higher interest rates from the RBA. The monthly Consumer Price Index (CPI) has already decelerated to 6.3% in March from a whopping 8.4% figure being recorded in December. Meanwhile, Australia’s retail demand remained stagnant in March as higher cost of living and bulky interest rates have squeezed deep pockets of households. A sheer decline in households’ spending is expected to weigh heavily on inflationary pressures further.
On Wednesday, Australia’s monthly CPI (April) will be keenly watched. The economic data is expected to accelerate marginally to 6.4% vs. the prior release of 6.3%. Sticky inflation figures could force the RBA to go hawkish ahead.
Meanwhile, the New Zealand Dollar has failed to maintain its strength despite a significant increase in interest rates by the Reserve Bank of New Zealand (RBNZ). The RBNZ has hiked its Official Cash Rate (OCR) to 5.5% as inflationary pressures seem reluctant in releasing heat. Last week, RBNZ Assistant Governor Karen Silk warned that the central bank must be watchful of over-tightening policy and that it can hold now and sees what develops.
- US Dollar Index regains upside momentum after downbeat start of the week.
- Uncertainty about US debt ceiling deal’s passage through Congress, anxiety ahead of the key data underpins greenback’s haven demand.
- Republicans criticize agreement to avoid US default, political turmoil in Eurozone also favor DXY long.
- Risk catalysts, US CB Consumer Confidence eyed for fresh impulse.
US Dollar Index (DXY) bulls attack the key upside hurdle surrounding 104.30 as it benefits from the return of full markets amid early Tuesday in Asia.
In doing so, the greenback’s gauge versus six major currencies picks up bids as traders rush to risk safety amid uncertainty surrounding the US debt ceiling deal’s passage, as well as due to the cautious mood ahead of the key US data. Apart from that, the risk-negative headlines from the European and Chinese political frontiers also allow the DXY to grind higher as it approaches the highest levels since November 2022, marked in the last week.
On Monday, the DXY began the week on a softer footing in reaction to US President Joe Biden and House Speaker Kevin McCarthy’s weekend announcement of an agreement to avoid the debt-ceiling expiration. However, some of the policymakers, mostly Republicans, are against the comprises made to reach the deal and stay ready to challenge the move in the House, as well as in the Senate, which in turn raises market fears as the US approaches the June 5 deadline for default.
“A handful of hard-right Republican lawmakers said on Monday they would oppose a deal to raise the United States' $31.4 trillion debt ceiling, in a sign that the bipartisan agreement could face a rocky path through Congress before the U.S. runs out of money next week,” said Reuters.
Additionally favoring the US Dollar Index bulls are the hawkish Fed bets amid upbeat prints of the US PMIs, Durable Goods Orders and Q1 GDP and inflation signals. It should be noted that the political fears in Eurozone and the US-China tension, as well as recession woes in the bloc, also underpin the US Dollar’s haven demand. That said, Spanish Prime Minister (PM) Pedro Sanchez announced snap elections in July while Greek President is up for appointing a caretaker PM ahead of a repeat election on June 25. Additionally, the last week’s downward revision to Germany’s first quarter (Q1) Gross Domestic Product (GDP) figures renewed recession fears in the bloc and also favor the DXY bulls.
Amid these plays, the European yields edged lower on Monday while the equities futures grind higher.
Looking ahead, developments about the US debt ceiling agreement and the US CB Consumer Confidence for May will be crucial for the US Dollar Index traders to watch for intraday directions.
Also read: US Consumer Confidence Preview: Confidence remains down, but DXY aims up
Technical analysis
A clear upside break of a six-month-old falling resistance line, around 104.30 by the press time, becomes necessary for the US Dollar Index (DXY) bulls to keep the reins.
- AUD/JPY kicks off the week just under the 92.00 mark, leveraging positive market sentiment that favors riskier assets over safe havens like the Japanese Yen.
- The AUD/JPY technical outlook remains bullish, with indicators like the RSI and the 3-day RoC hinting at gathering momentum among buyers.
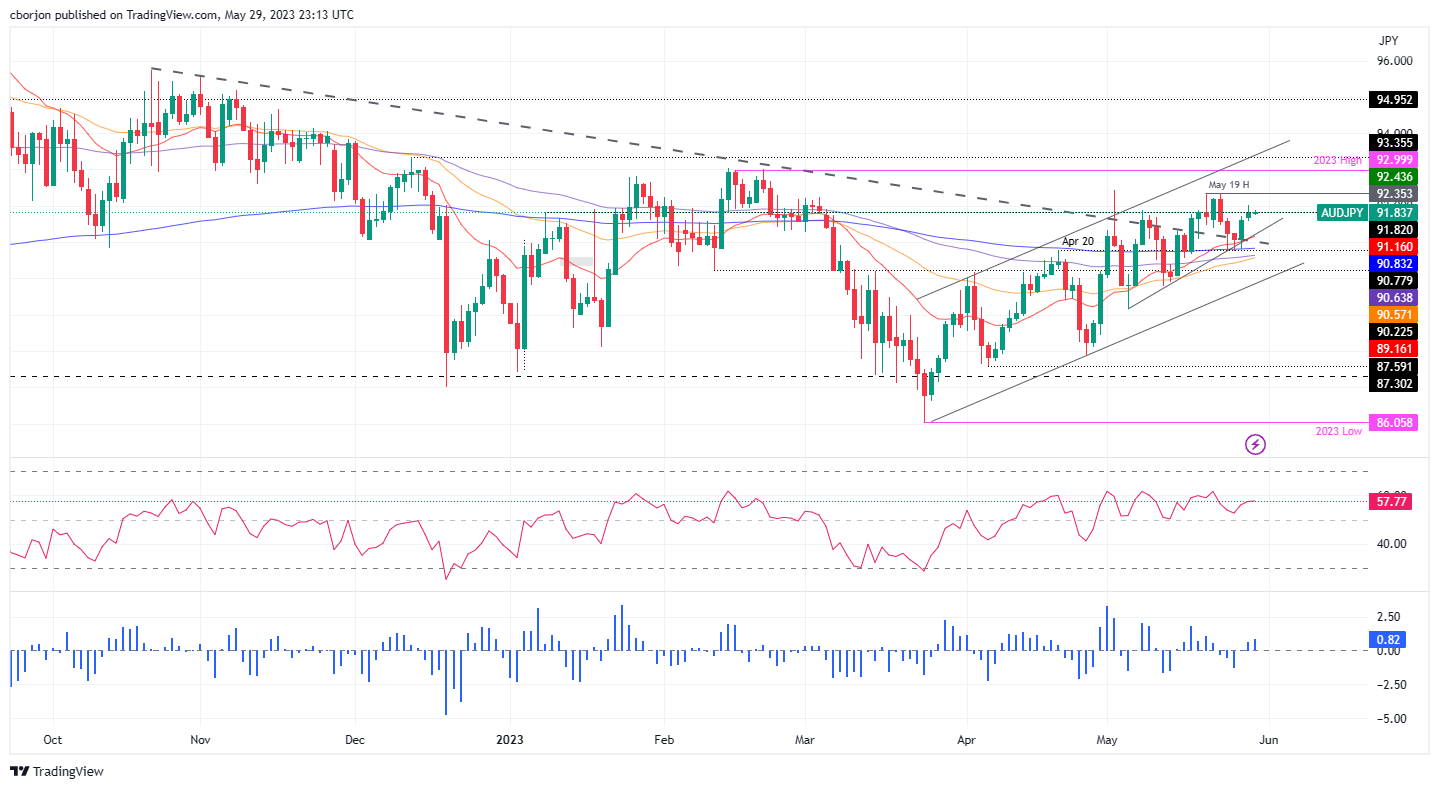
- AUD/JPY faces immediate resistance at 92.00, with the potential to challenge the YTD high of 92.99; downside support stands at the May 29 low of 91.59, with further falls potentially targeting 91.00.
AUD/JPY begins the week on the right foot, though almost unchanged as Tuesday’s Asian session begins, registering minuscule gains of 0.05%, below the 92.00 figure. An upbeat market sentiment could bolster appetite for riskier assets, leaving safe-haven assets or peers like the Japanese Yen (JPY) vulnerable to further losses.
AUD/JPY Price Analysis: Technical outlook
From a technical perspective, the AUD/JPY is upward biased. Given the fundamental backdrop with an improvement in risk appetite, further upside is expected. But on its way north, the AUD/JPY must hurdle some crucial resistance levels. Additionally, the Relative Strength Index (RSI) indicator is in bullish territory, while the 3-day Rate of Change (RoC) jumped above its prior day peak, suggesting that buyers are gathering momentum.
The AUD/JPY first resistance would be the 92.00 mark. Break above will expose the last week’s high of 92.35, followed by the 92.50 mid-point before challenging the year-to-date (YTD) high of 92.99. On the other hand, the AUD/JPY first support would be the 91.59 May 29 low. Once cleared, the AUD/JPy could dive toward one-month-old upslope support at around 91.30/91.20 before dropping toward 91.00.
AUD/JPY Price Action – Daily chart
- NZD/USD is consolidating above 0.6050 as the market mood is quiet amid an extended weekend in the US economy.
- The US debt-ceiling raise will save the economy from reporting a default but will attract downgrade ratings from credit agencies.
- A power-pack action is anticipated from the USD Index, this week, amid the release of the Employment data.
The NZD/USD pair is demonstrating a sideways performance above the immediate support of 0.6060 in the early Asian session. The Kiwi asset is expected to come out of the woods and display a sheer volatile action as United States markets will open today after an extended weekend.
S&P500 futures are holding decent gains as investors are optimistic that the US debt-ceiling issue will get passage in Congress before June 05. There is no denying the fact that the approval for the US debt-ceiling raise will save the economy from reporting a default but will attract downgrade ratings from credit agencies.
The US Dollar Index (DXY) is consistently facing barricades around 104.30. The upside in the USD index is capped due to approval for an increase in the US borrowing limit while the downside is being supported by expectations that the Federal Reserve (Fed) will hike interest rates further.
This week, the US Employment gamut will remain in the spotlight. On Wednesday, US JOLTS Job Openings data will be released. The economic data is seen falling to 9.35M vs. the prior release of 9.59M. This indicates that firms have slowed down their hiring process due to a bleak economic outlook. Later on, US Automatic Data Processing (ADP) Employment Change (May) will be in focus. As per the consensus, the US economy added fresh 170K jobs in May, lower than the prior addition of 269K.
On the New Zealand Dollar front, Caixin Manufacturing PMI (May) data will remain in the spotlight. The economic data is seen steady at 49.5. Factory activity in China seems failing to show a confident recovery despite the reopening of the economy after a strict lockdown period. A figure of 50.0 is considered a contraction in economic activities.
It is worth noting that New Zealand is one of the leading trading partners of China and a steady factory activity would weigh on the New Zealand Dollar.
- EUR/USD stays pressured at the lowest levels in 10 weeks.
- Political turmoil in Spain, unimpressive ECB talks and fears of German recession weigh on Euro.
- Risks surrounding US debt-ceiling agreement’s passage through Congress, hawkish Fed bets also favor bears.
- Mid-tier EU/US data, developments about efforts to avoid US default will be eyed for intraday directions.
EUR/USD bears flirt with the 1.0700 threshold as full markets return on Tuesday, after Monday’s holiday in multiple bourses. The Euro pair’s latest weakness could be linked to the fresh challenges to sentiment, as well as comparatively less hawkish bets on the European Central Bank (ECB) than the Federal Reserve (Fed).
Despite the sluggish start of the week, due to holidays in major markets, the political turmoil in Spain joined doubts about the ECB’s capacity to extend its hawkish run to weigh n the EUR/USD price.
On Monday, Spanish Prime Minister (PM) Pedro Sanchez announced snap elections in July while Greek President is up for appointing a caretaker PM ahead of a repeat election on June 25. Additionally, the last week’s downward revision to Germany’s first quarter (Q1) Gross Domestic Product (GDP) figures renewed recession fears in the bloc and weigh on the EUR/USD prices.
Even so, ECB Policymaker Pierre Wunsch said on Saturday, “We hiked 400bp and we might have to do more.”
On the other hand, market sentiment improved after the US policymakers sealed the deal to avoid the US default. However, the agreement’s passage through Congress is a concern amid dissatisfaction with the compromises cited to reach the deal.
Elsewhere, upbeat prints of the US PMIs, Durable Goods Orders and Q1 GDP and inflation signals underpin hawkish bias about the Fed despite expectations that the debt ceiling deal pushes the government for mode bond issuance and exhaust liquidity from the markets.
With this, the European yields edge lower while the equities grind higher and the US Dollar takes a breather around a multi-day high.
Moving on, Eurozone Consumer Confidence and second-tier housing data from the US will join the US CB Consumer Confidence to entertain the EUR/USD traders. Though, developments about the US debt ceiling agreement and clues for the Eurozone inflation will be the key to watching for a clear guide.
Also read: US Consumer Confidence Preview: Confidence remains down, but DXY aims up
Technical analysis
EUR/USD struggles between a one-month-old descending resistance line and an upward-sloping support line from late November 2022, respectively near 1.0725 and 1.0700, amid sluggish markets. However, the nearly oversold RSI (14) signals the recovery of the Euro pair.
Even if the quote breaks the 1.0700 immediate support, the 200-day Exponential Moving Average (EMA) of around 1.0685 can act as an additional downside filter to challenge the bears before giving them control.
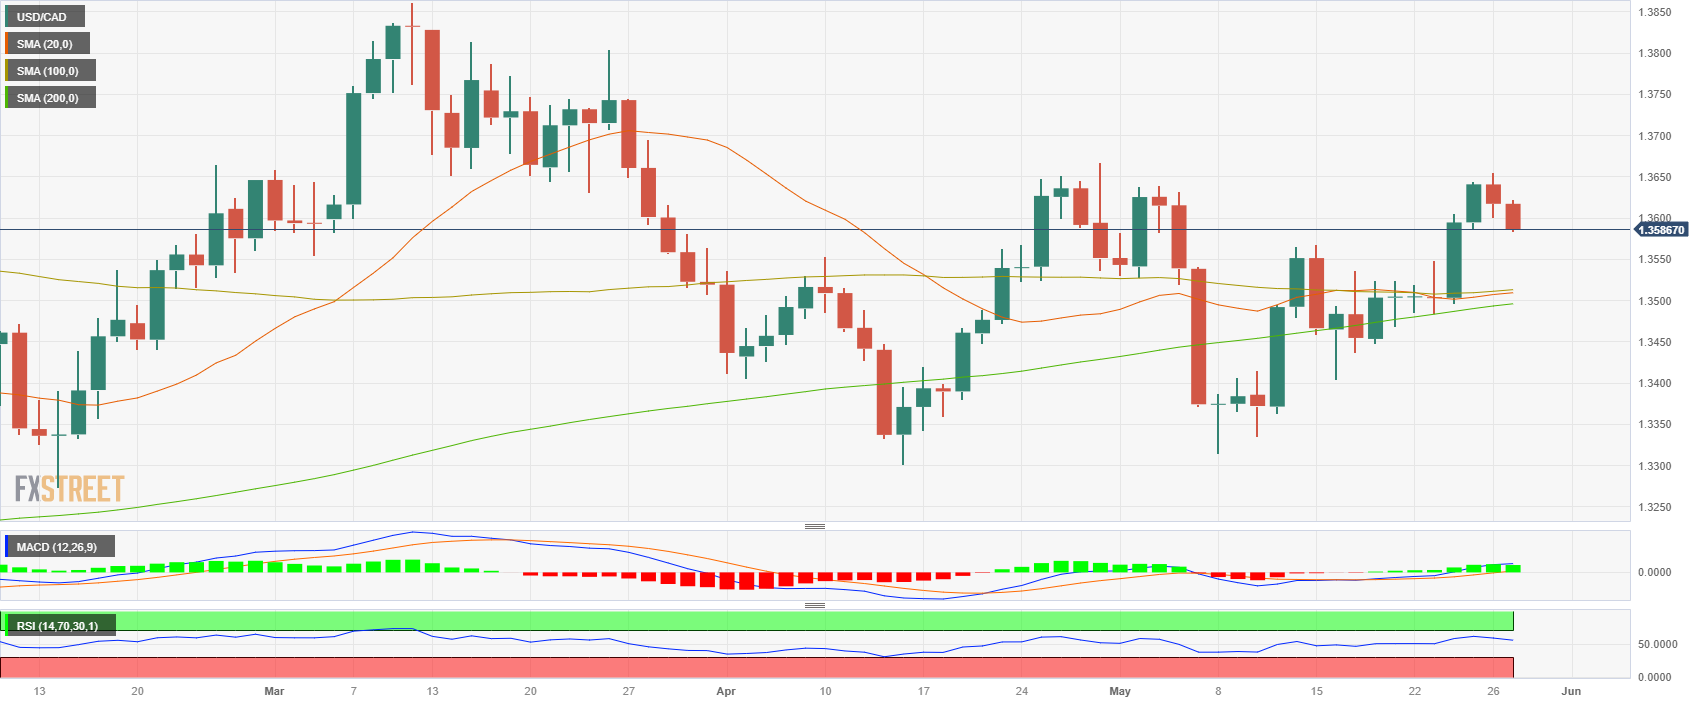
- USD/CAD is oscillating in a narrow range below 1.3600 amid a quiet market mood.
- This week, US Employment-linked economic indicators will keep investors busy.
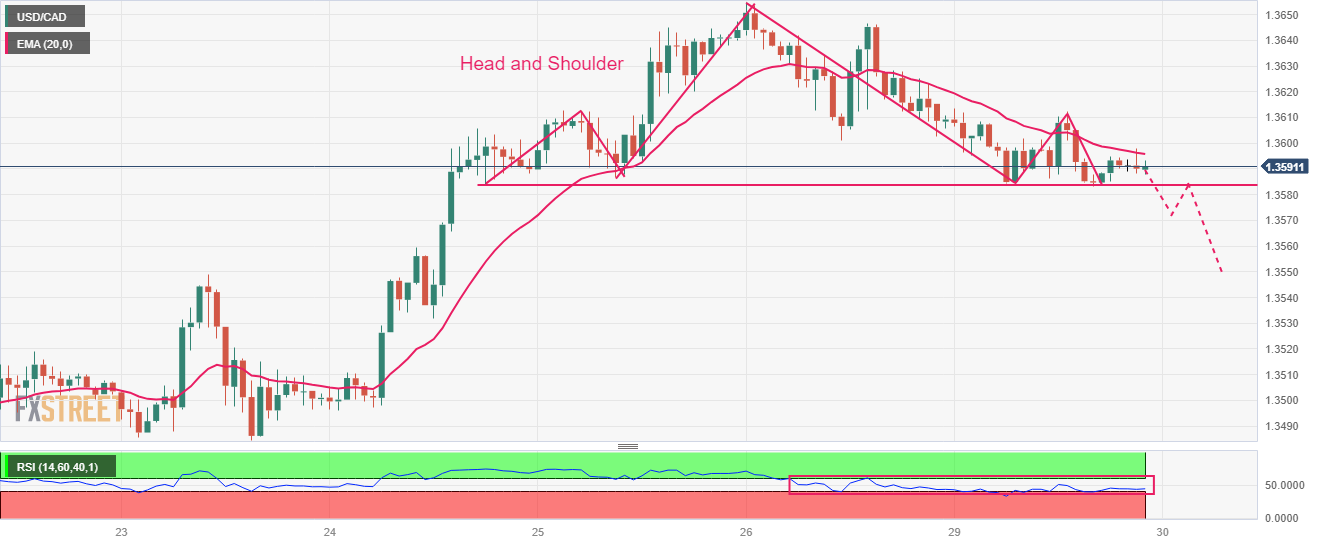
- USD/CAD is hovering near the neckline of the Head and Shoulder chart pattern around 1.3584.
The USD/CAD pair is juggling in a narrow range below the round-level resistance of 1.3600 in the early Tokyo session. The Loonie asset is expected to display a power-pack action as investors would remain highly active after an extended weekend.
As US debt-ceiling raise proposal is finally going to Congress for approval before June 05, investors would shift their focus towards United States Employment-linked economic indicators. After Wednesday’s JOLTS Job Openings data, investors will focus on Thursday’s Automatic Data Processing (ADP) Employment Change and finally on Friday’s Nonfarm Payrolls (NFP) data.
The Canadian Dollar is expected to remain on the tenterhooks amid the release of the Q1 Gross Domestic Product (GDP) data, which will release on Wednesday.
Meanwhile, the US Dollar Index (DXY) has dropped after facing stiff barricades around 104.30.
USD/CAD is hovering near the neckline of the Head and Shoulder chart pattern formed on an hourly scale, which is plotted around 1.3584. A slippage below the neckline support would result in a sheer breakdown. The 20-period Exponential Moving Average (EMA) at 1.3596 is acting as a barricade for the US Dollar bulls.
Meanwhile, the Relative Strength Index (RSI) (14) is oscillating in the 40.00-60.00 range. A downside momentum will get triggered after a breakdown below 40.00.
Going forward, a break below May 29 low at 1.3584 will drag the asset toward May 23 high at 1.3550. A breakdown below the latter will expose the Loonie asset to psychological support at 1.3500.
On the contrary, a fresh buy would come above May 26 high at 1.3655, which would drive the asset toward the round-level resistance at 1.3700 followed by March 27 high at 1.3745.
USD/CAD hourly chart
- GBP/USD defends recovery from two-month low as Sterling Pound buyers attack 1.2360 resistance confluence.
- 100-HMA, three-week-old descending trend line restricts immediate upside ahead of 200-HMA.
- Cable sellers need validation from three-day-long rising support line.
- Steady RSI, mildly firmer MACD signals underpin bullish bias.
GBP/USD grinds higher past 1.2350, making rounds to 1.2360 amid early Tuesday in Asia, as it struggles to extend the previous two-day rebound from the lowest levels since April.
In doing so, the Cable pair pokes a convergence of the 100-Hour Moving Average (HMA) and a falling trend line from May 10.
Given the pair’s sustained observance of the three-day-old rising trend line and above 50 RSI (14) line, not overbought, not to forget slightly bullish MACD signals, the Pound Sterling buyers are likely to keep the reins.
Hence, the quote is expected to cross the immediate upside hurdle of 1.2360, which in turn will allow the GBP/USD buyers to aim for the 200-HMA level surrounding the 1.2400 round figure.
However, tops marked during May 24 and 16, close to 1.2470 and 1.2550 in that order, can challenge the pair’s further upside.
On the contrary, the aforementioned support line from the last Thursday, near 1.2340 by the press time, restricts the immediate downside of the GBP/USD pair.
Following that, the monthly low surrounding the 1.2300 round figure could return to the chart.
It’s worth noting that the GBP/USD pair’s downside past 1.2300 will need validation from February’s high surrounding 1.2270 to welcome the bears.
GBP/USD: Hourly chart
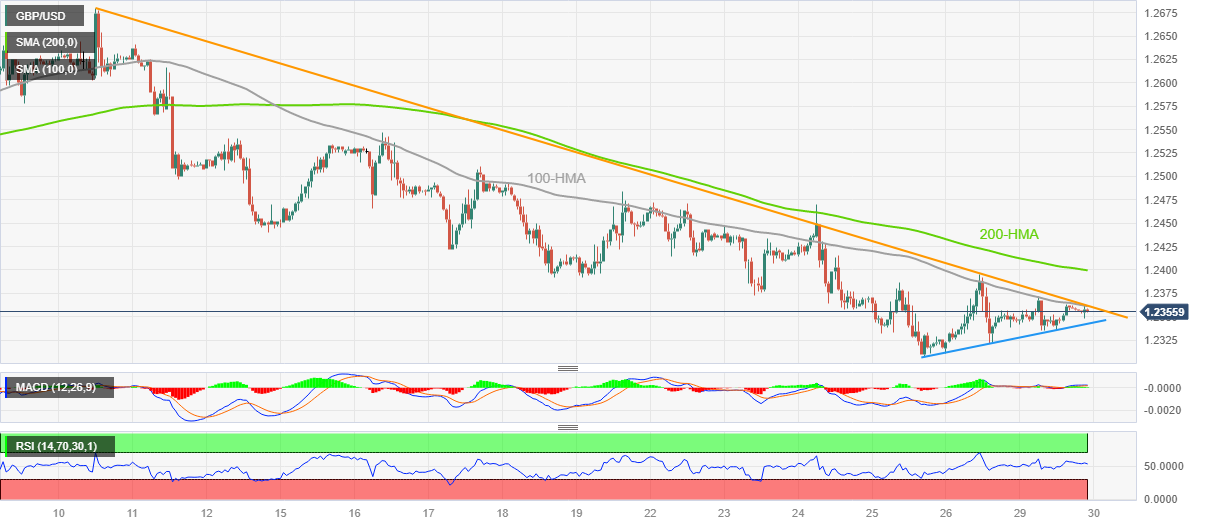
Trend: Further upside expected
- US crude oil benchmark WTI retreats from a daily high of $73.51, faltering under the $73.00 mark, impacted by looming Fed interest rate hikes threatening economic growth.
- A surge in expectations for a hawkish Fed following upbeat US economic data, coupled with diminished recession likelihood, sees a 50% chance of a 25 bps rate hike, a significant increase from last month’s 8.3% odds.
- WTI’s dip eased by OPEC+ output cut hints, Saudi short-seller warnings, and Russia’s production stance; focus shifts to June 4 OPEC+ meeting.
Western Texas Intermediate (WTI), the US crude oil benchmark, retreats after hitting a daily high of $73.51, tumbles below the $73.00 figure late in the New York session. At the time of writing, WTI is trading at $72.99, weighed by further interest rate hikes of the Federal Reserve, which could dent the prospects for economic growth.
Oil prices are weighed by the potential impact of further Fed tightening, despite OPEC+ output cut signals
After a solid tranche of US economic data from mid-May, investors began to price in a more hawkish Fed than initially expected. Upbeat Retail Sales, Industrial Production, GDP figures, and employment data eased the likelihood of a recession in the US. That’s reflected in the CME Fedwatch Tools, with a 50% chance of the Fed lifting rates 25 bps, up from 8.3% odds one month ago.
In the meantime, a risk-on impulse failed to underpin the WTI price, as news that the White House (WH) and the US Congress erupted that the US President Joe Biden and House Speaker Kevin McCarthy struck an agreement to raise the debt-ceiling so the country could fulfill its debt payments.
WTI’s fall was capped by last week’s comments from the Saudi Energy Minister Abdulaziz bin Salman warning short-sellers that betting on falling oil prices to “watch out,” in a possible signal that OPEC+ may further cut output. Furthermore, comments from Russian oil officials, including Deputy Prime Minister Alexander Novak, suggested that Russia is inclined to keep its current production without making changes.
The Organization of the Petroleum Exporting Countries (OPEC) and its allies, including Russia, known as OPEC+, will meet on June 4.
WTI Technical Levels
- Gold price has shown topsy-turvy moves above $1,943.00 amid a less volatile action due to the long weekend.
- Fresh incoming data from US economic indicators are hinting at a sharp rise in demand-pull inflation.
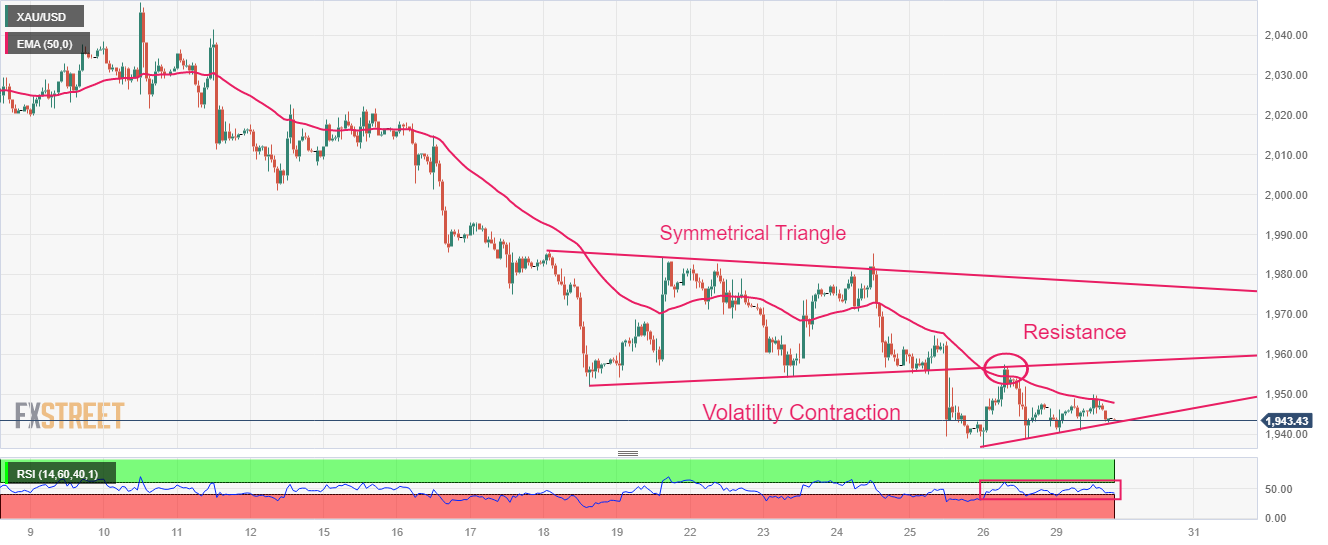
- Gold price has again shifted into a volatility contraction and is expected to deliver more downside ahead.
Gold price (XAU/USD) is displaying topsy-turvy moves above $1,943.00 in the early Asian session. The precious metal is expected to extend its downside journey after an intermediate inventory adjustment phase as the Federal Reserve (Fed) is expected to make more interest rate hikes in June meeting certain amid resilient households' spending in the United States.
Earlier, Fed chair Jerome Powell cited that more rate hikes seem less certain as tight credit conditions by US regional banks are effectively restricting inflation. However, fresh incoming data from economic indicators is hinting at a sharp rise in demand-pull inflation.
S&P500 futures are showing gains in early Asia, portraying a risk appetite theme as fears of a default by the US economy have receded. US President Joe Biden made clear on Monday that the agreed proposal between the White House and Republicans is going to Congress for voting before the deadline of June 05.
The US Dollar Index (DXY) is facing barricades in extending its recovery above 104.30. Investors should brace for a volatile action ahead as US markets will open after a long weekend, therefore, investors would first wrap up their positions. Apart from that, investors would shift their focus towards JOLTS Jobs Openings data, which will release on Wednesday along with Fed’s Beige Book. As per the consensus, job openings are expected to fall to 9.35M vs. the prior release of 9.59M.
Gold technical analysis
Gold price displayed a downside move after a breakdown of the Symmetrical Triangle chart pattern on an hourly scale. The precious metal has sensed immense selling pressure after a pullback move to near $1,957.82. The yellow metal has again shifted into a volatility contraction and is expected to deliver more downside ahead.
The 50-period Exponential Moving Average (EMA) at $1,948.00 is barricading the upside of the Gold price.
Meanwhile, the Relative Strength Index (RSI) (14) is oscillating in the 40.00-60.00 range. A breakdown below 40.00 will trigger the downside momentum.
Gold hourly chart
- AUD/USD edges higher after bouncing off the lowest levels in six months the previous day.
- Market sentiment improves on US debt limit extension agreement, denting US Dollar.
- Concerns about the passage of deal through Congress prod Aussie buyers.
- Off in multiple markets offered a rocky start to the key week, risk catalysts, second-tier data eyed for clear directions.
AUD/USD dribbles around 0.6550 as it struggles to defend the last two-day rebound from a multi-week low amid early Tuesday. In doing so, the Aussie pair justifies its risk barometer status amid fresh challenges to the sentiment emanating from the US and China, as well as due to the return of the full markets.
Monday’s off in multiple markets restricted the reaction to the much-awaited US agreement on the debt ceiling extension. Even so, the US Dollar extends Friday’s downbeat performance amid firmer sentiment. However, some of the policymakers on both sides are against the compromises cited to reach the deal and hence raise doubts about its passage through the House and Senate during its voting on Wednesday and before June 05 deadline.
“A handful of hard-right Republican lawmakers said on Monday they would oppose a deal to raise the United States' $31.4 trillion debt ceiling, in a sign that the bipartisan agreement could face a rocky path through Congress before the U.S. runs out of money next week,” said Reuters.
Apart from the US debt ceiling deal, the recent tension between Washington and Beijing also seems to prod the AUD/USD bulls. Recently, China turned down the US request for a meeting of the Defense Chiefs in Singapore, per the Wall Street Journal (WSJ).
Additionally, the recently hawkish Fed bias, backed by the US data, also prods the Aussie pair buyers even as the Reserve Bank of Australia (RBA) is also likely to trace the Reserve Bank of New Zealand’s (RBNZ) footsteps in announcing the rate hikes.
Amid these plays, markets were pretty quiet amid a lack of major data/events and the close of trading in multiple markets.
Looking forward, Aussie Building Permits for April and the US housing and mid-tier sentiment figures may entertain the AUD/USD traders. However, major attention will be given to the headlines suggesting the US debt ceiling deal’s passage through Congress before June 05.
Technical analysis
A convergence of a three-week-old descending trend line and a previous support line from March 10, around 0.6575-80, appears a short-term key upside hurdle for the AUD/USD bulls to cross during further recovery.
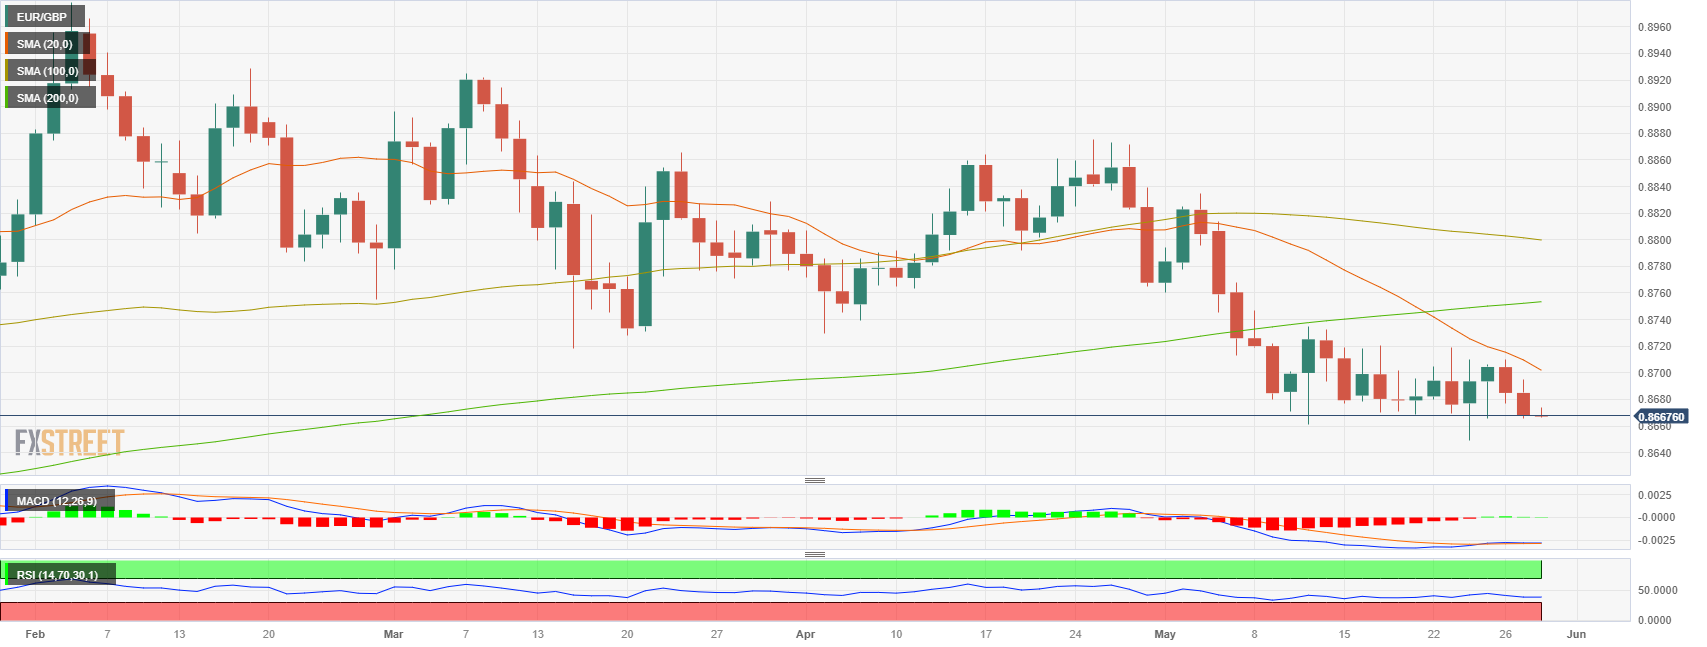
- EUR/GBP is resuming its downward trend, edging closer to its yearly low, signaling potential bearish momentum in the pair.
- The current trend remains undecided below the 0.8700 resistance, awaiting a clear direction pressured down by failing German Yields.
- Market awaits ECB President Lagarde's speech and German inflation data on Wednesday for potential developments.
The Euro is currently experiencing widespread losses and depreciation, which is having an impact on its pairs against the US Dollar, Japanese Yen and the Swiss Franc.
The EUR/GBP pair is showing a resumption of its downward trend, getting closer to its yearly low and indicating a potential bearish momentum. With the pair's trend remaining uncertain below the 0.8670 zone, market participants are awaiting ECB President Lagarde's upcoming speech and German inflation data on Wednesday for possible developments that could provide clarity and influence the market's direction.On Tuesday, Spanish inflation data, released by the National Statistics Institute may also have an impact on the Euro price dynamics.
EUR/GBP faced losses as yields diverge between Germany and UK
German yields decreased on Monday. The 10-year bond yield stands at 2.43%, showing a minor decline of 0.08%. The 2-year yield is at 2.90% with losses of 0.5%, while the 5-year yield is at 2.46% with limited losses of 0.08%. Conversely, British yields rose. The 10-year bond yield reached 4.37% with gains of 0.87%, the 2-year yield stands at 4.55% with gains of 1.35%, and the 5-year yield is at 4.34% with gains of 1.51%.
On Wednesday, Destatis will release inflation figures from Germany which are expected to have further decelerated in May. In that sense, the inflationary figures for the biggest economic block from the Eurozone may have an impact on the Euro against major currency counterparts.
Levels to watch
According to the daily chart, the EUR/GBP pair maintains a neutral-to-bearish outlook in the short term, as the bears have seemingly retreated while the market enters a phase of consolidation. However, technical indicators continue to show negativity, suggesting the potential for further downward movement.
In the event of a decline in the EUR/GBP exchange rate, immediate support levels are observed at the 0.8660 zone, followed by the yearly low at 0.8645 and 0.8600 level. On the other hand, upcoming resistance levels for EUR/GBP are anticipated at the 0.8700 level, followed by the zone at 0.8725 and the 100-day Simple Moving Average (SMA) at 0.8750.
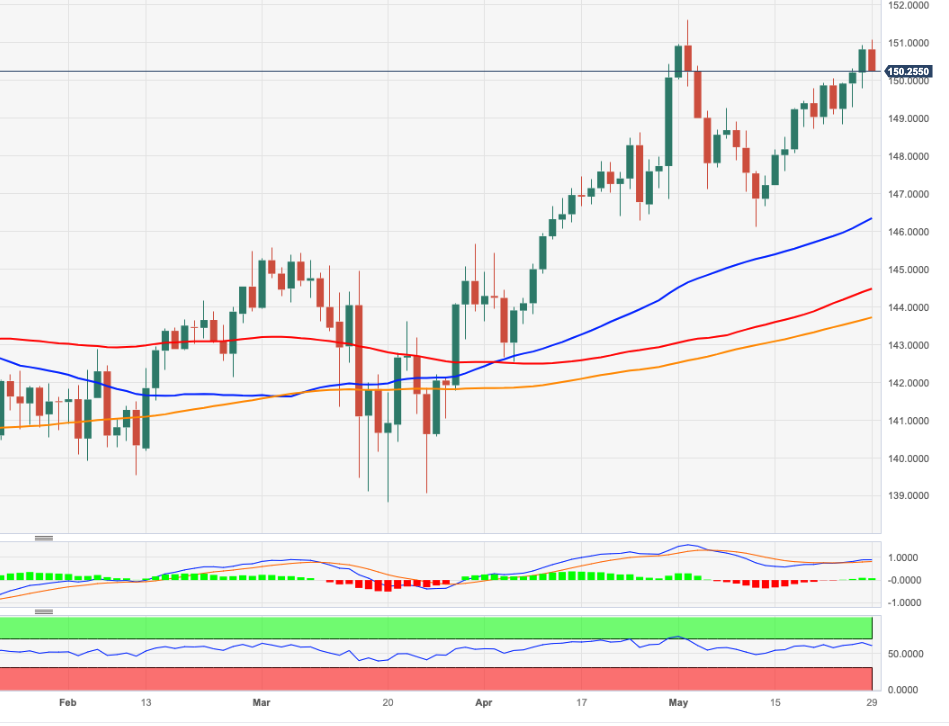
- USD/JPY 140.16 and 139.50 are vulnerable on the downside.
- Bulls eye a break of 140.91 in the coming sessions.
Having briefly touched a six-month high of 140.91, USD/JPY, the US Dollar drifted lower and USD/JPY reached 140.40 the low. The following illustrates a bullish bias on the charts.
USD/JPY H4 charts
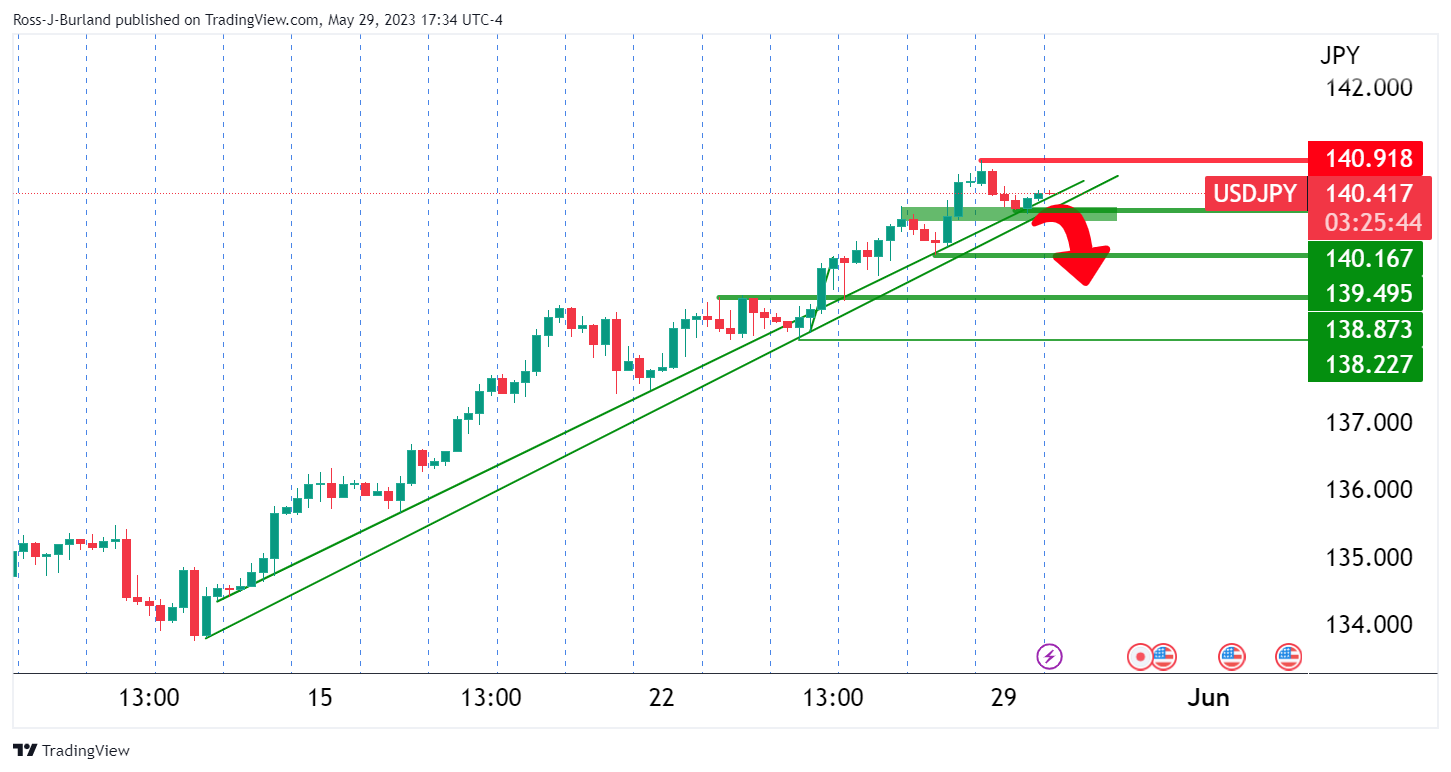
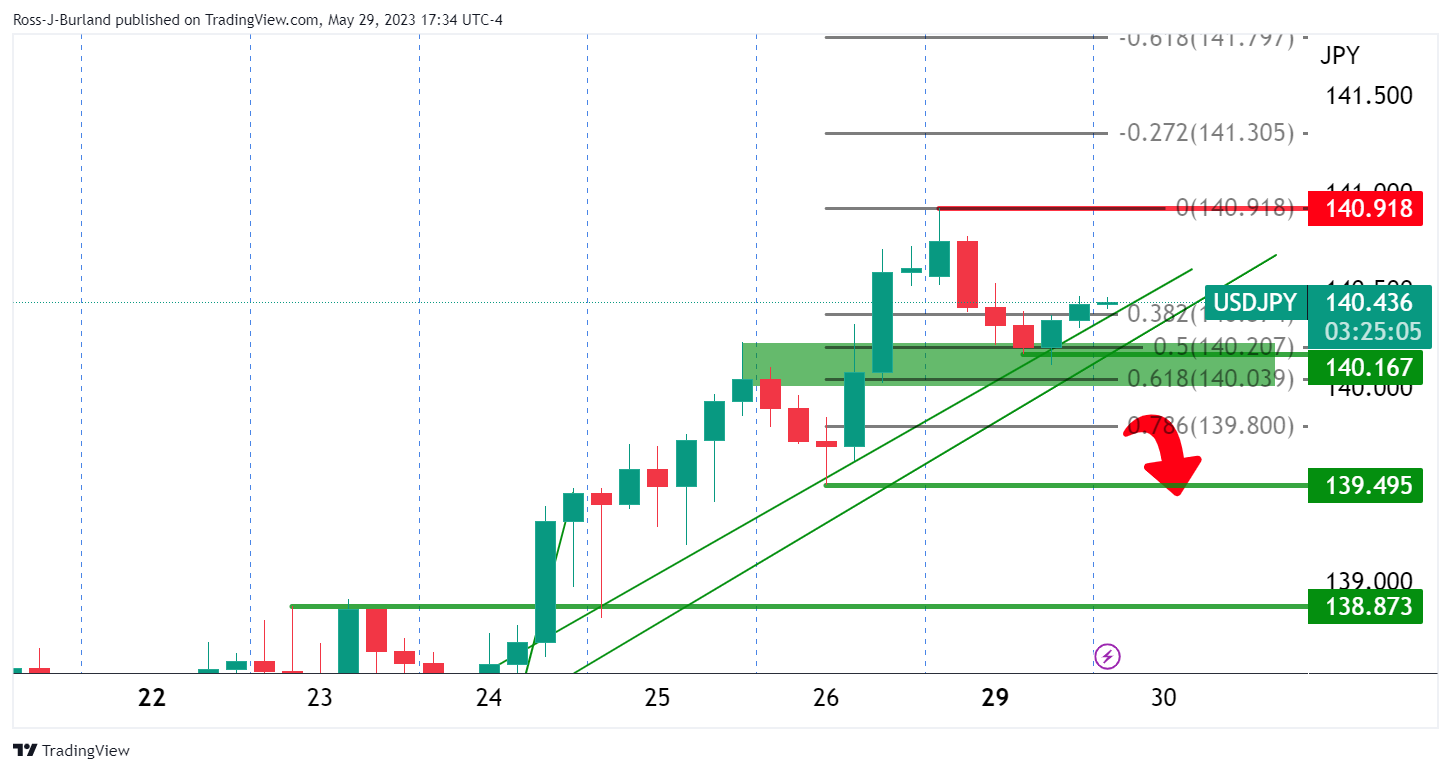
The price has been hugging a trendline support area and there is little sign that the bullish trend will not continue while above 140.00. We have seen a pullback into prior resistance and this leaves the prospects of a continuation for the days ahead. 140.90 is the level to break on the upside while 140.16 and 139.50 are vulnerable on the downside.
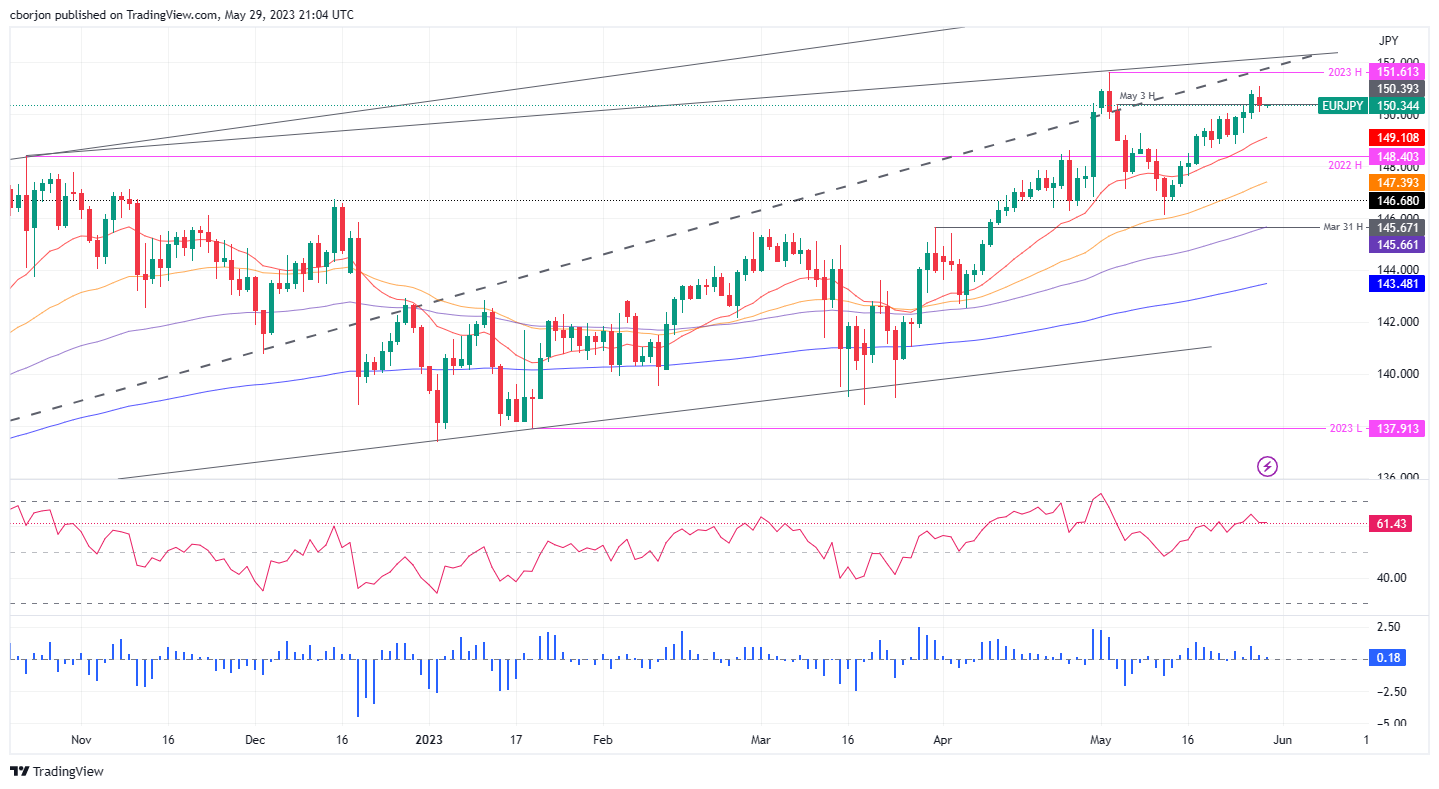
- EUR/JPY slips from a four-week high of 151.07, with US debt ceiling developments cushioning the fall amidst Japanese Yen strength.
- Bullish technical indicators hint at a potential upward trajectory for EUR/JPY, placing the YTD high of 151.61 within reach despite the current dip.
- Surpassing the weekly high of 151.07 could challenge the YTD high, with upside potential at 152.00; initial support rests at 150.00.
EUR/JPY retreats after hitting a new four-week high of 151.07, down 0.26% during the day amidst thin liquidity conditions, sponsored by holidays in Europe and the United States (US). Positive news about the US debt ceiling improved appetite, capping the EUR/JPY’s fall amidst the Japanese Yen (JPY) strength during the day. At the time of writing, the EUR/JPY is trading at 150.34.
EUR/JPY Price Analysis: Technical outlook
The daily chart shows that the EUR/JPY is upward biased, though, in Monday’s session, the cross-currency pair dipped below the May 3 high-turned-support at 150.39 and later reclaimed the latter. Although aiming downward, the Relative Strength Index (RSI) stays in the bullish territory, while the 3-day Rate of Change (RoC) persists above the neutral line. That said, the EUR/JPY in the near-term warrants further upside, which could put the year-to-date (YTD) high of 151.61 in danger.
If EUR/JPY buyers reclaim the weekly high of 151.07, a test of the YTD high of 151.61 is on the cards. The upside risks lie at 152.00. Conversely, the EUR/JPY first support would be 150.00, but further losses are expected on a drop below the latter at around the 20-day Exponential Moving Average (EMA) at 149.09.
EUR/JPY Price Action – Daily chart
After a quiet Monday, Tuesday will likely bring greater market movements. During the Asian session, Japan will report April's unemployment rate, while New Zealand and Australia will release April's building permits data. In Europe, Spain will release preliminary inflation figures. In the US, attention turns to Congress after the debt-limit deal. On Tuesday, US data will include consumer confidence and housing numbers. Friday will see the release of the NFP report.
Here is what you need to know on Tuesday, May 30:
There was more action over the weekend than on Monday following an agreement in principle between US President Biden and Speaker Kevin McCarthy to lift the debt limit for two years. Now, the House and the Senate must pass the deal, with the June 5 deadline looming. That day, according to Treasury Secretary Janet Yellen, the US could run out of cash. The vote in Congress is expected to be on Wednesday.
The agreement in the US helped market sentiment on Monday, although price action was subdued with many European markets and Wall Street closed. The US dollar weakened modestly, and the DXY managed to close with modest gains, favored by the decline in EUR/USD.
The euro lagged on Monday, with EUR/USD retracing from 1.0740 toward 1.0700 while EUR/GBP posted the lowest daily close since November below 0.8670. GBP/USD ended flat, hovering around 1.2350. On Tuesday, Spain will release the preliminary reading of April's Consumer Price Index (CPI).
USD/CHF dropped to the 0.9030 area and then bounced back toward 0.9050. EUR/CHF closed at 0.9685, the weakest since October 2022. Switzerland will release Q1 GDP data on Tuesday.
USD/JPY hit fresh monthly highs at 140.90 and lost momentum, approaching 140.00. The April Unemployment Rate is due in Japan on Tuesday.
AUD/USD rose for the second day in a row, favored by the improvement in market sentiment. The recovery found resistance at 0.6550. April Building Permits will be released on Tuesday.
NZD/USD remained under pressure, and was seen hovering around 0.6050. The pair is consolidating recent losses and is trading 225 pips below the level it had a week ago. Building permits data is also due in New Zealand.
USD/CAD dropped below 1.3600, with the Loonie favored by the better mood across the markets and also by stronger crude oil prices.
Gold moved sideways around $1,940, while Silver gave up a small fraction of Friday's gains, falling to $23.15. Cryptocurrencies rose, with BTC/USD advancing to $27,650 and Ethereum climbing 2.10% to $1,893.
The Turkish lira posted a record low close. USD/TRY rose above 20.00 for the first time, following Recep Tayyip Erdogan's victory in Sunday's presidential runoff in Turkey.
Like this article? Help us with some feedback by answering this survey:
EUR/USD bulls need to get on the back side of the trendline resistance with risk to 1.0850.
Bears eye a break of recent lows for downside execution.
EUR/USD was pressured on Memorial Day, with the price falling from 1.0743 to a low of 1.0705 as the US Dollar’s 4-day winning streak lives on that is now up some 3% vs. the Euro. The following analysis shows the price sliding out of the bullish rally toward prior support.
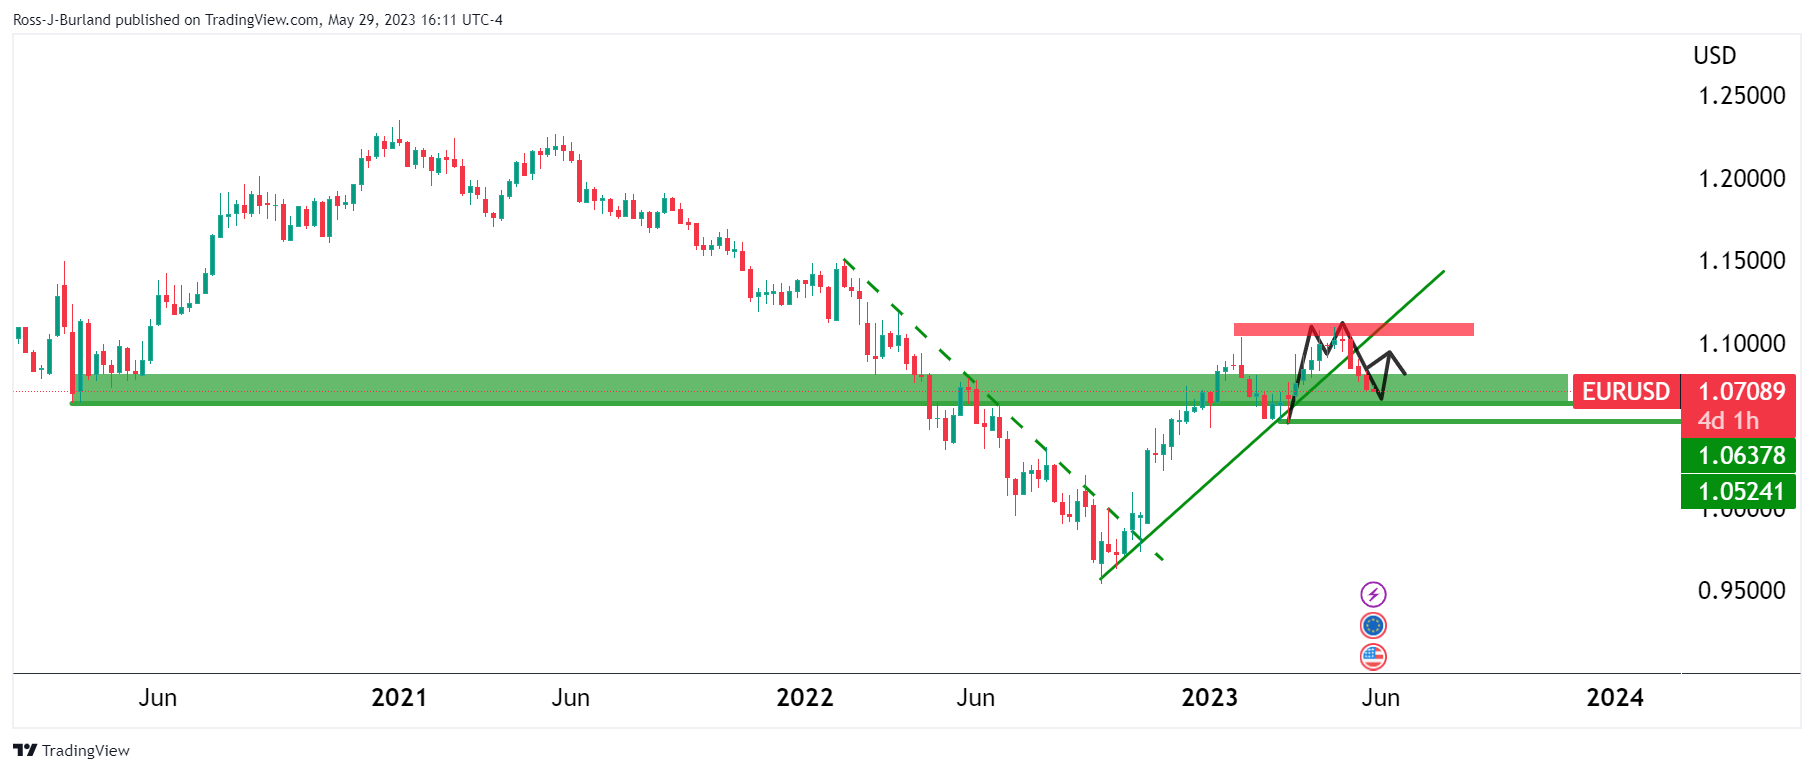
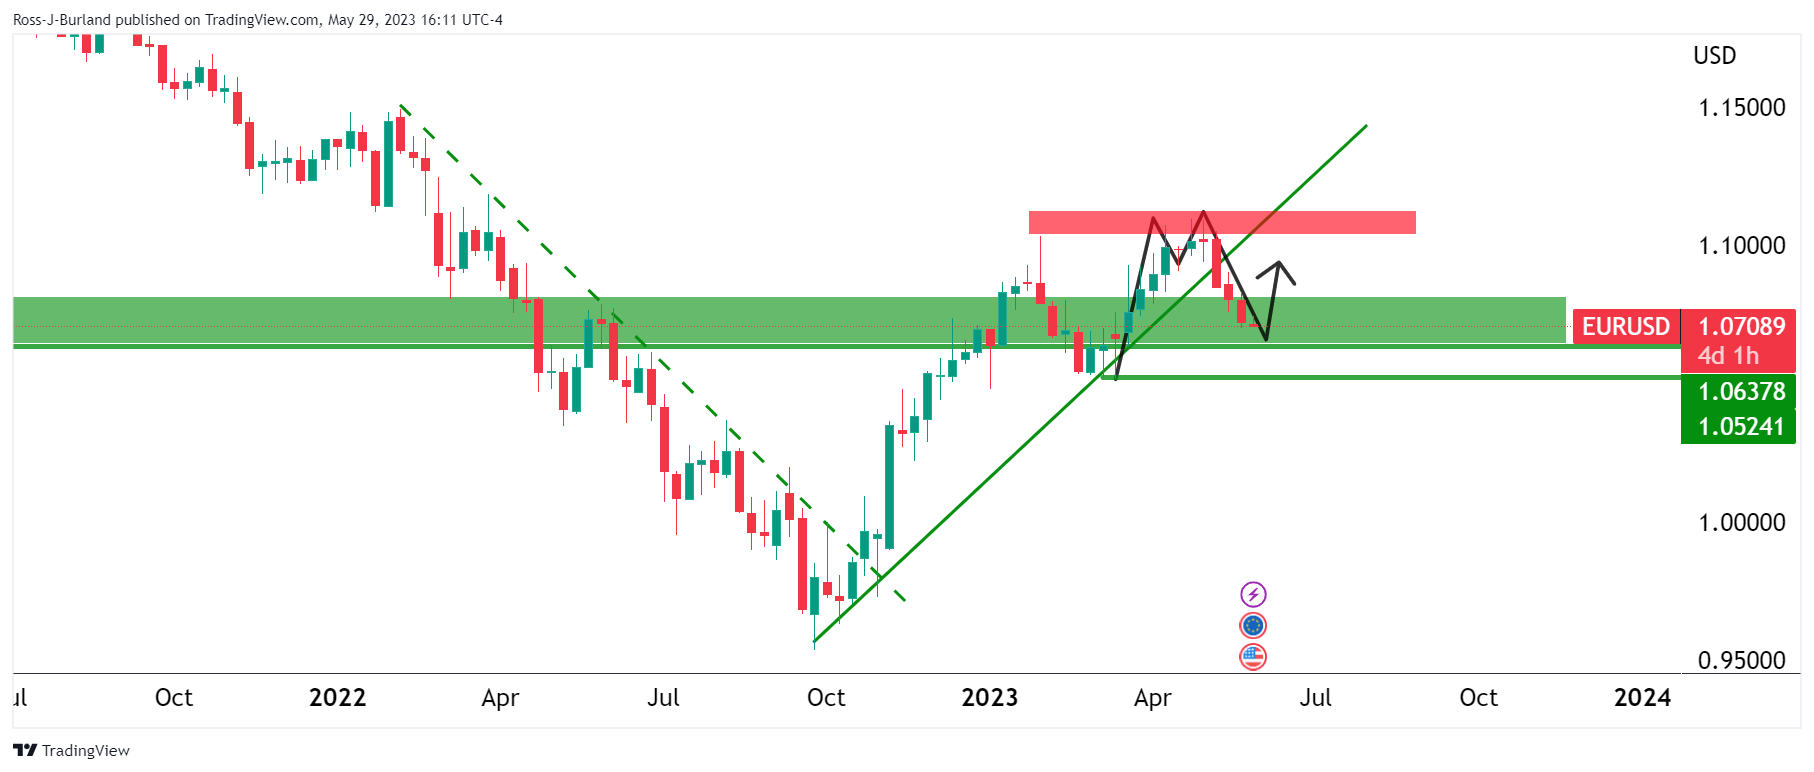
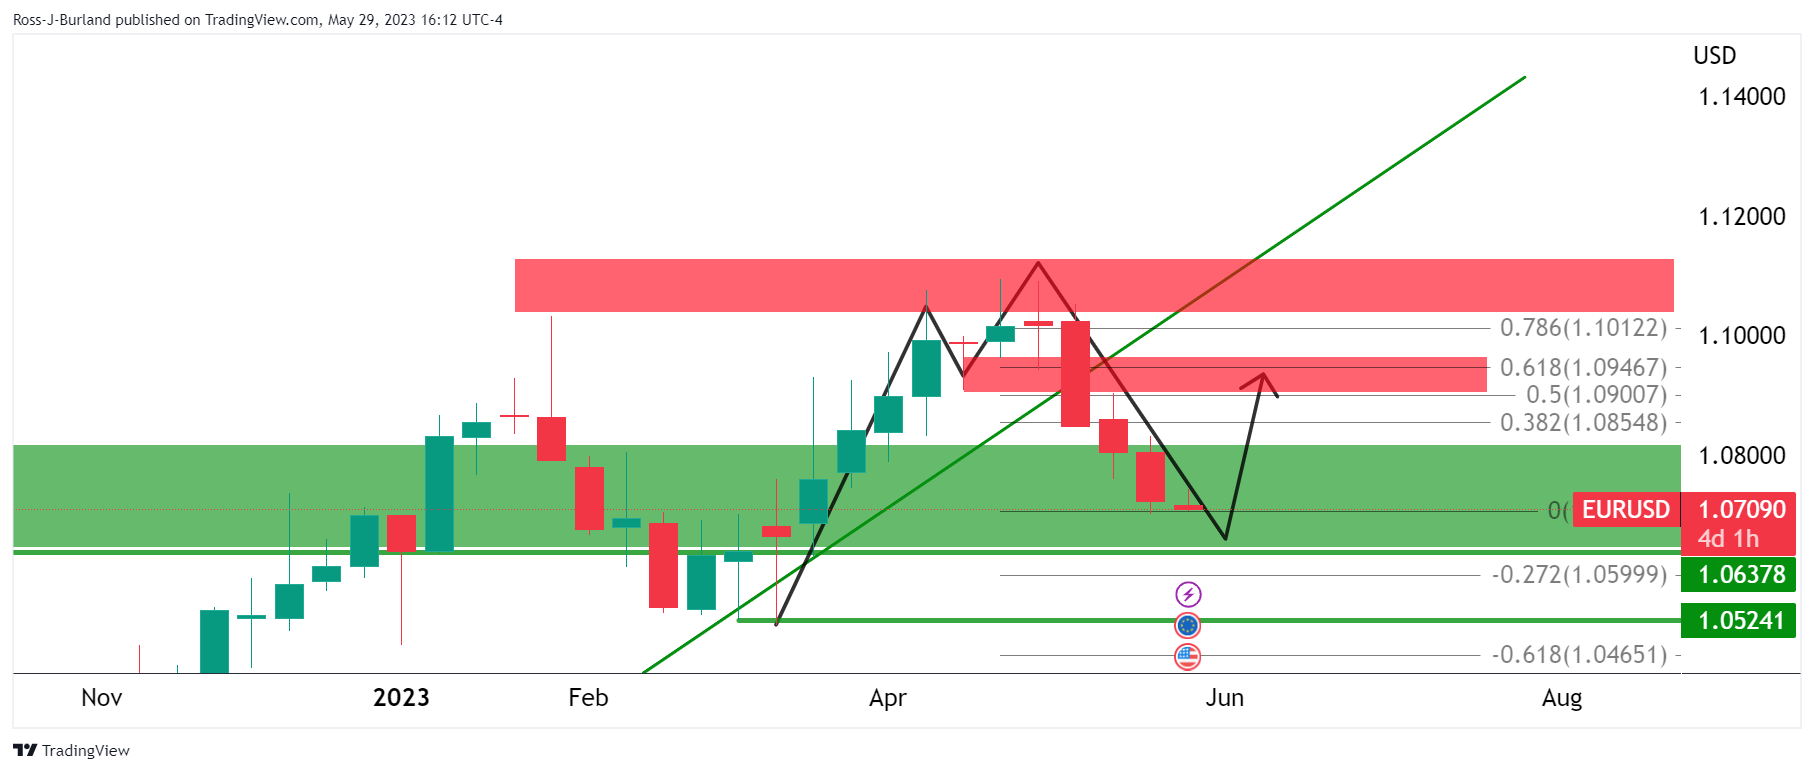
The M-formation is a reversion pattern and it would be expected to draw the price towards the neckline.
EUR/USD H4 chart
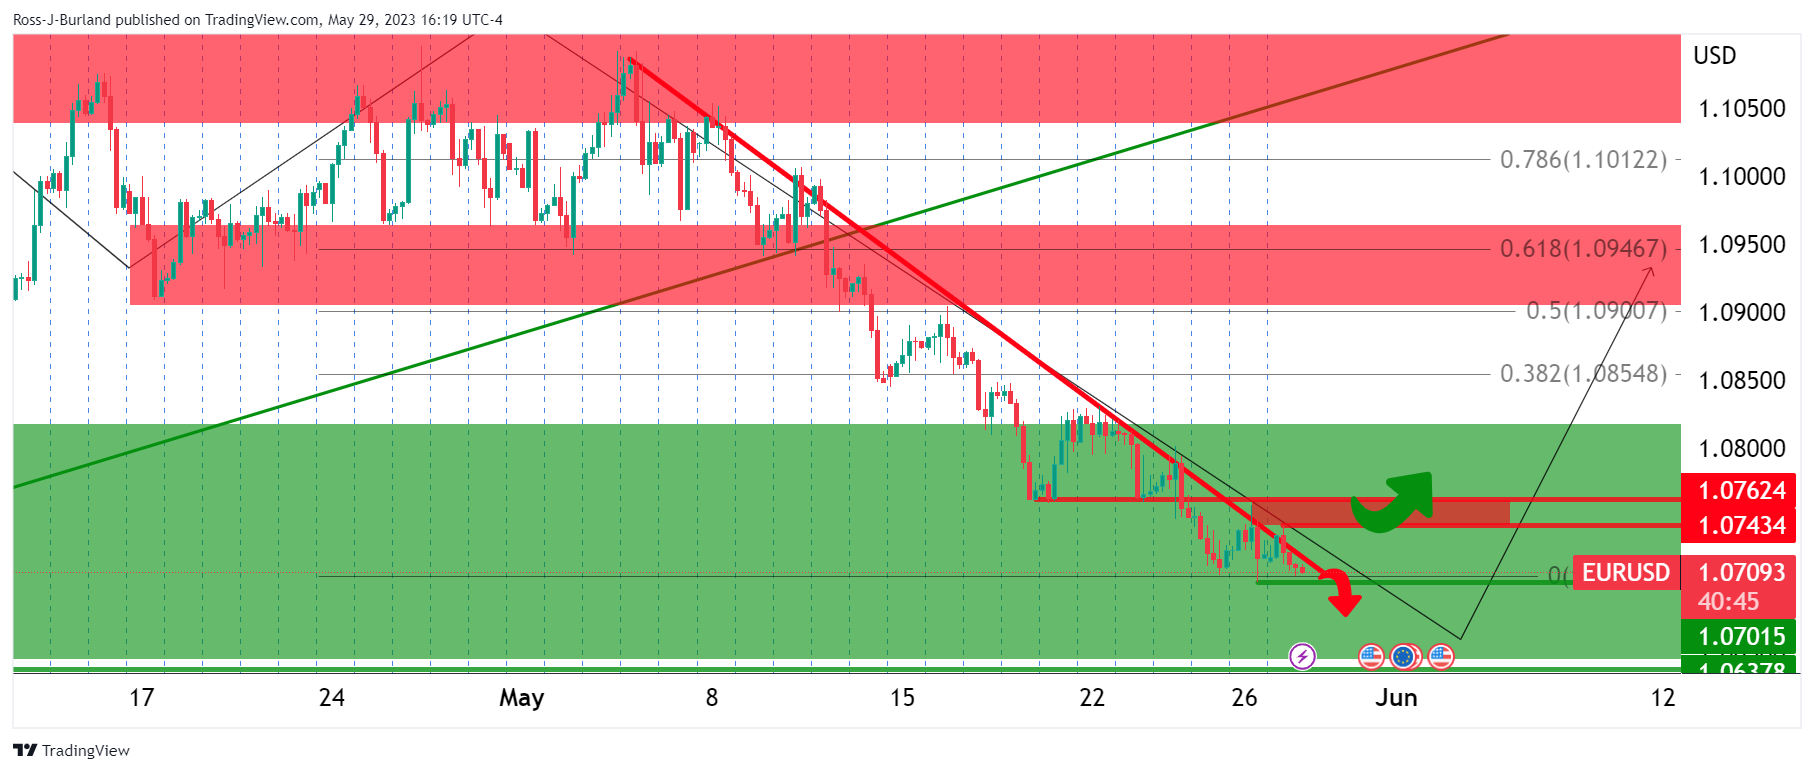
The Euro remains on the front side of the trend and until it breaks out, there is a focus on lower lows. A break above, however, opens risk to 1.0850.
- NZD/USD bulls coming into the market.
- Bearish impulse could be on the verge of a significant correction.
NZD/USD bears are lurking in a shallow correction of the daily bearish impulse as the following will illustrate in a top-down analysis starting on the daily chart.
NZD/USD daily chart
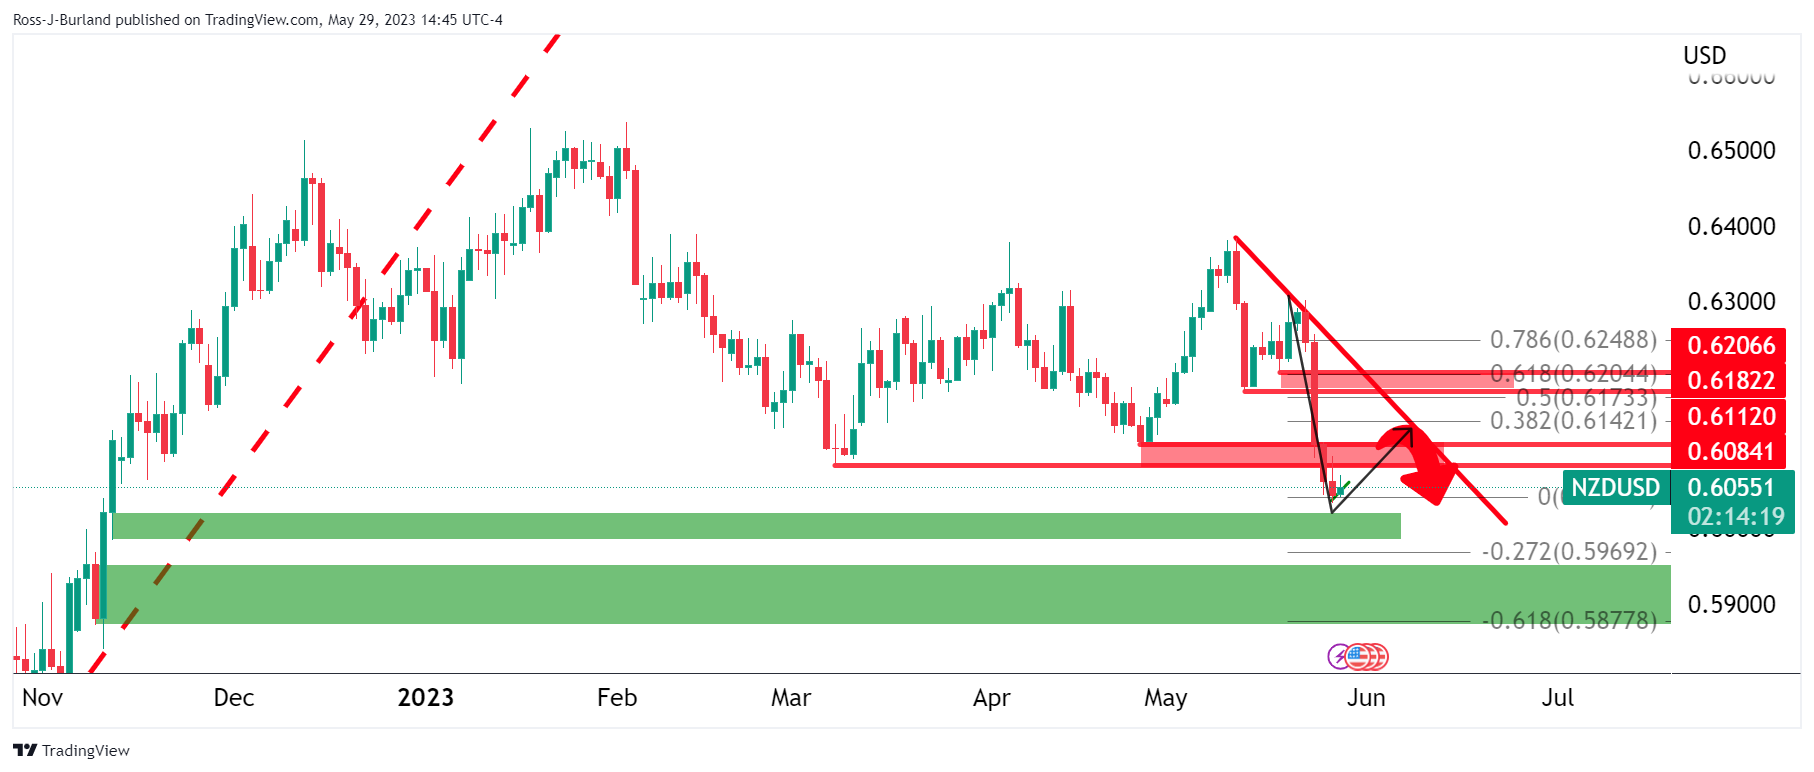
The price is embedded below prior support structure that could now be expected to act as resistance on the correction.
However, if bears fail to fend off the bulls, the Fibonacci scale will then come into focus near 0.6150 which guards a move to test the trendline resistance.
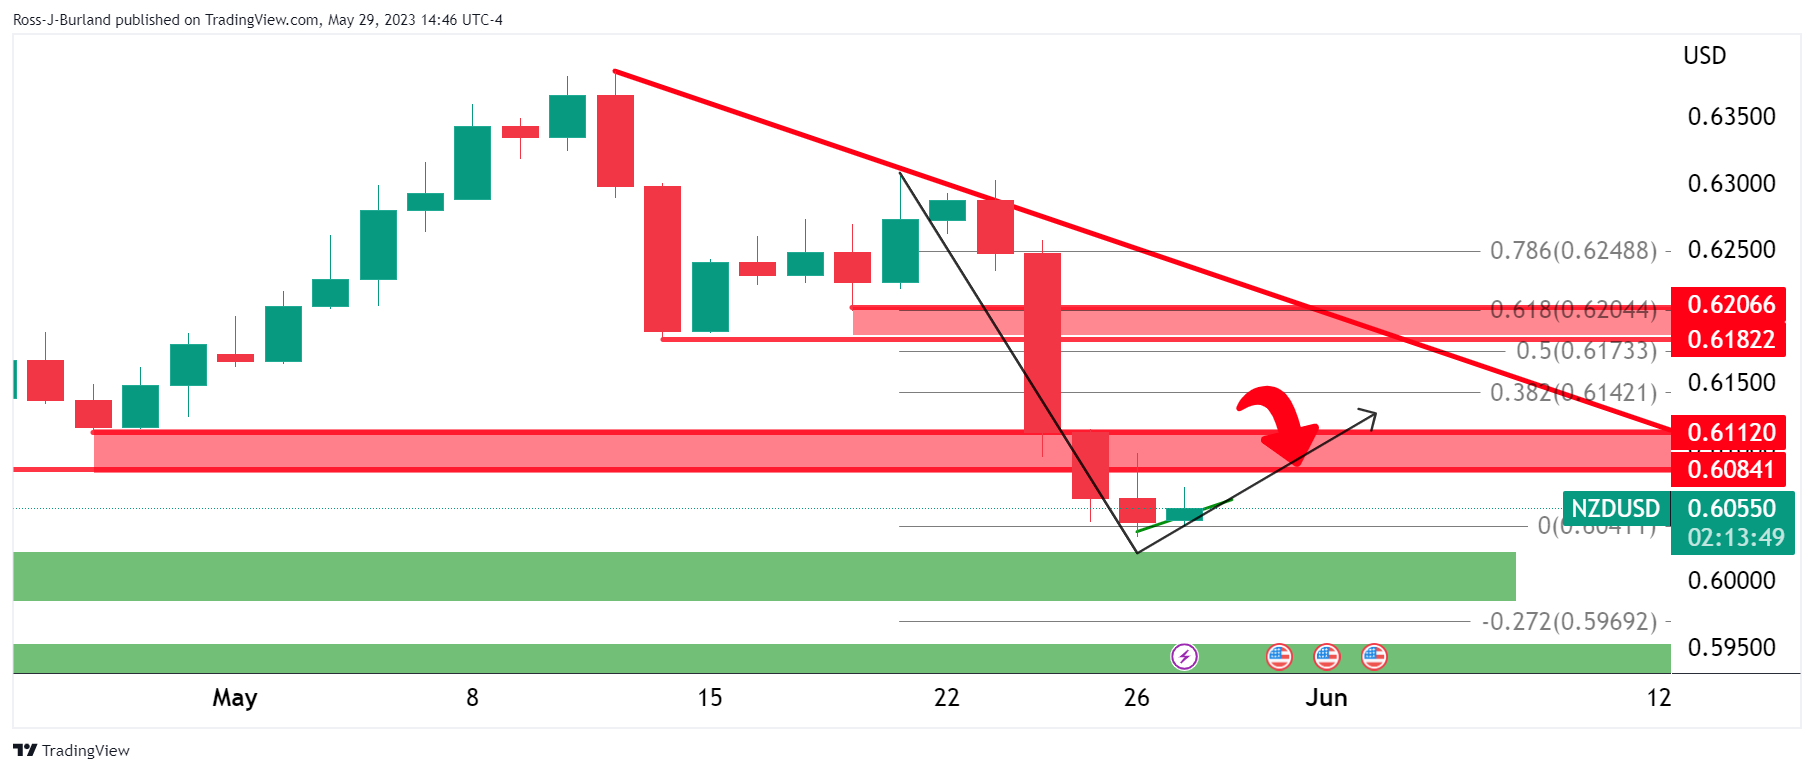
NZD/SD H4 chart
The price may already be on the verge of extending lower on a break of support.
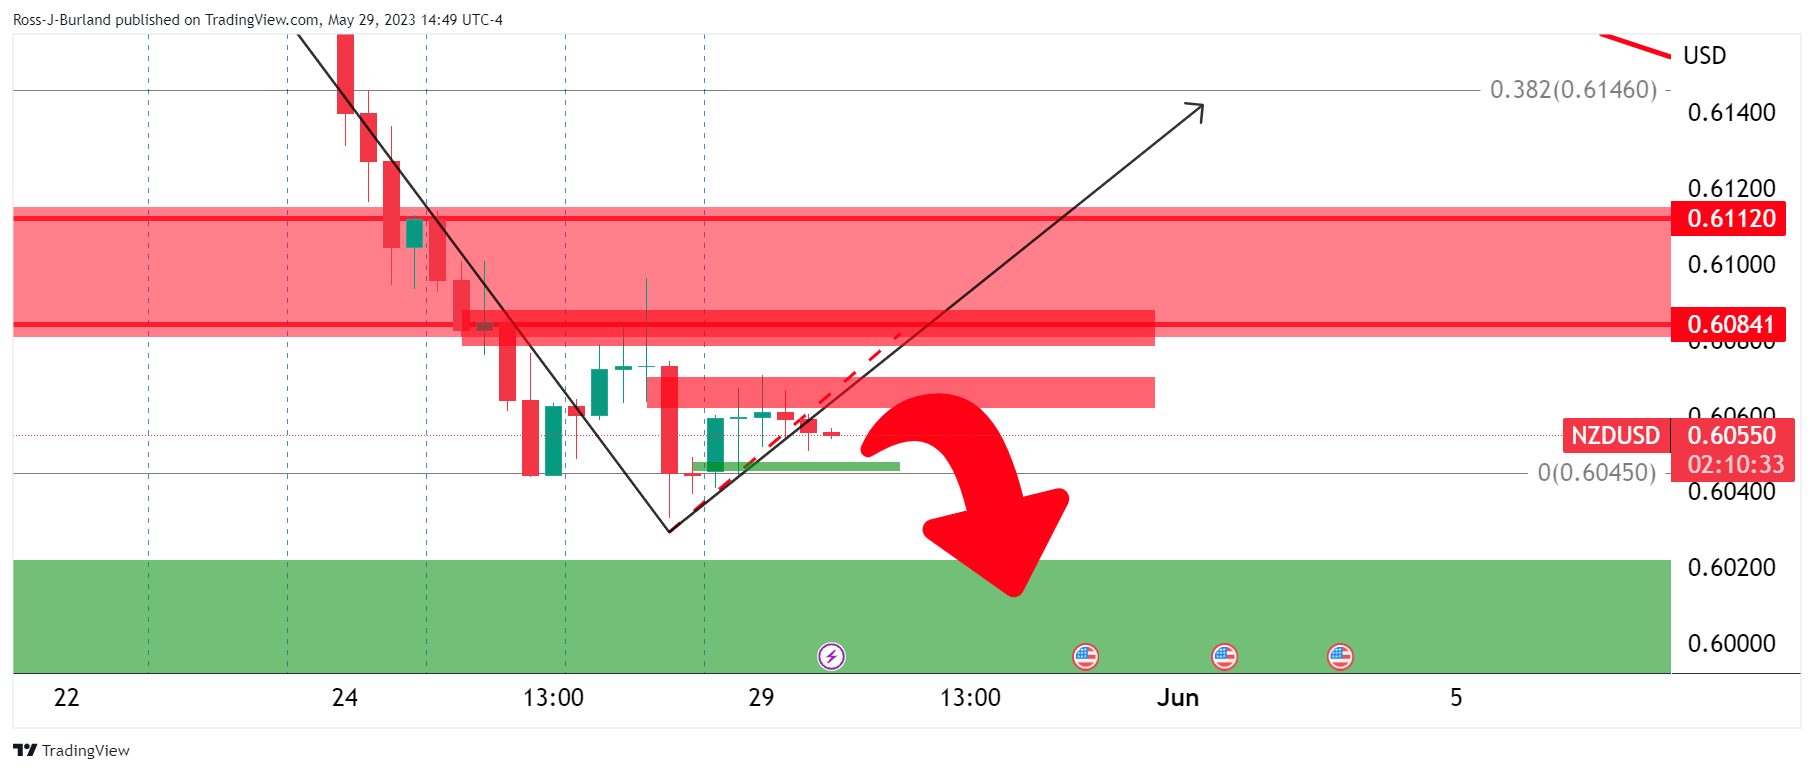
NZD/USD H1 chart
On the hourly chart, 0.6050 is an important support level that guards risk to restest the lows.
- Bulls take a breather on quiet Monday and the USD/CHF retreats to the 0.9030 zone.
- Positive market mood amid debt-ceiling agreement weights on the US Dollar.
- US NFP and Switzerland GDP data eyed.
The USD/CHF trades for a second consecutive day with losses as interest in the US Dollar wanes due to the US debt-ceiling agreement announced on Sunday. This has fueled a positive market mood which is anathema to the safe-haven Greenback. In addition, as the US celebrates Memorial Day, the low volume in the markets seems to be weighing on the pair . On Tuesday, investors will eye Swiss Q1 GDP data.
Traders eye US NFP and Swiss Q1 GDP data
On Sunday, an announcement was made by US President Joe Biden and Republican House Speaker Kevin McCarthy stating that they have come to an agreement on extending the debt ceiling. The proposal suggests allowing the government to borrow money without increasing the limit, temporarily suspending it until 2025. However, the deal still needs approval from Congress, although officials are optimistic about its passage.
This news had a positive impact on Wall Street futures, and put downward pressure on the US Dollar.
On Tuesday, Swiss Statistics will release Gross Domestic Product (GDP) data from Q1. This is expected to have expanded at a weak annualized rate of 0.6% from its previous 0.8%.
Nonfarm Payrolls (NFP) data from the US from May is expected to hint at more pain in the American labor market whose outlook is heavily considered by the Federal Reserve for its monetary policy decisions. In that sense, labor market figures may have an impact on the expectations for the next meeting on June 14 and hence in the US Dollar price dynamics. Other relevant data that will be published this week includes the ISM services index and the ADP employment change data.
Levels to watch
Technically speaking and as per the daily chart, the USD/CHF holds a neutral-to-positive outlook for the short term, as the indicators still remain in positive territory despite losing momentum.
To gain momentum the bulls must retake the 0.9060 area which could potentially pave the way towards the 0.9075 area and then to the 100-day Simple Moving Average (SMA) at 0.9133.
On the downside, support levels are seen at the 0.9020 level followed by the psychological mark at 0.9000 and at the 20-day Simple Moving Average (SMA) currently at the 0.8960 zone.
-638209838360369970.png)
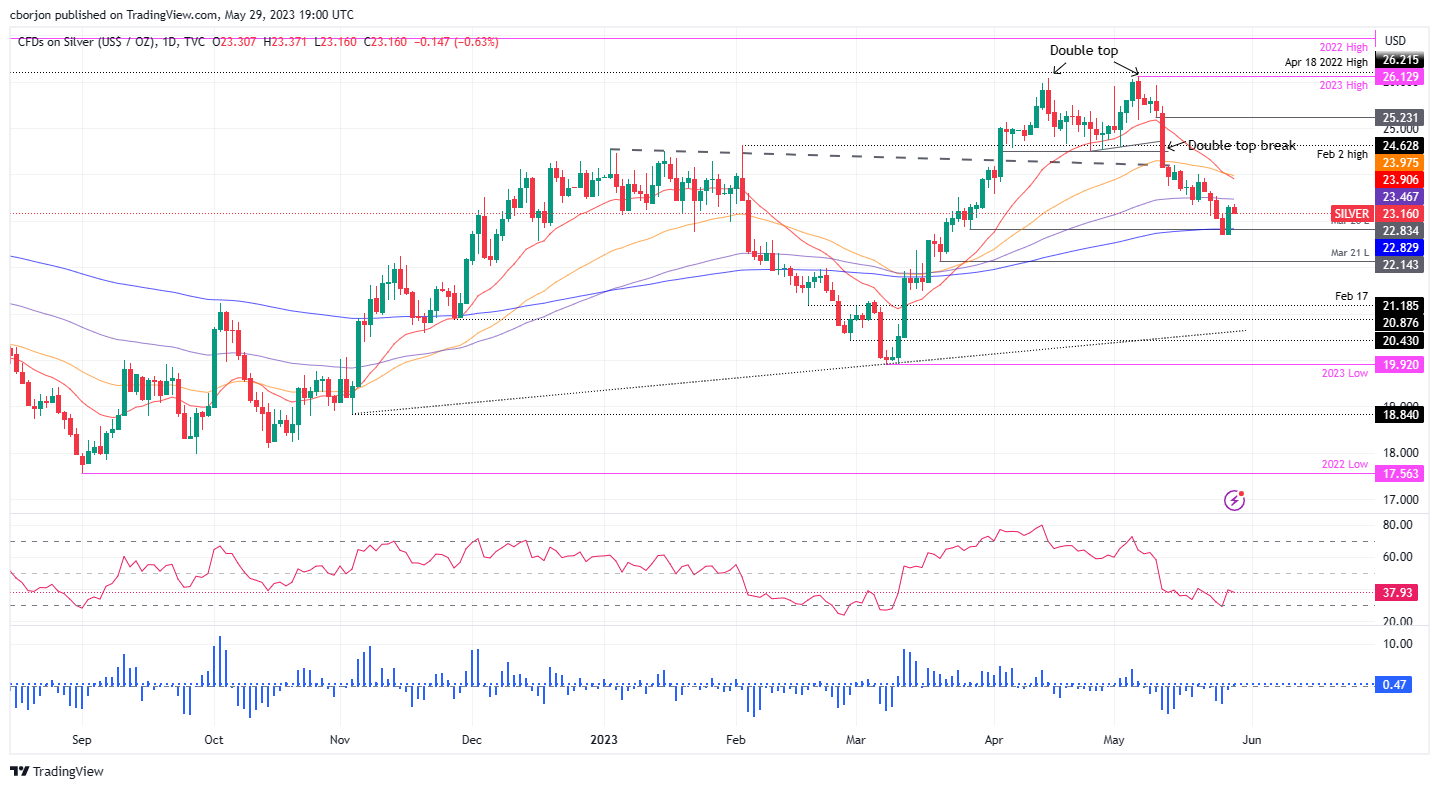
- Silver prices wrestle with a $23.37 resistance, nudging the XAG/USD towards daily lows as sellers eye lower targets amidst bearish indicators.
- Despite achieving a double-top objective, XAG/USD continues to face downward pressure; a fall below $23.00 could spur further losses.
- Overcoming the 100-day EMA at $23.46 could set the XAG/USD against resistances at $23.50 and the $23.90/$23.97 EMA intersection, eventually aiming for $24.00.
Silver price faces solid resistance around the $23.37 area as the 100-day Exponential Moving Average (EMA) sits around $23.46, pushing the XAG/USD spot price toward its daily lows of $23.15, with sellers eyeing lower prices. In addition, technical indicators turned bearish, with further downward action expected. At the time of writing, the XAG/USD is trading at $23.16.
XAG/USD Price Analysis: Technical outlook
From a technical point of view, XAG/USD is neutral to downward biased, capped on the upside by strong resistance levels. Even though the double-top measured objective was achieved on May 25, piercing below the $23.00 figure, downward pressure continues to mount on the white metal. Nevertheless, last Friday, profit-taking by sellers lifted the XAG/USD above $23.00.
The XAG/USD must drop below the $23.00 mark for a bearish continuation. A breach of the latter will expose the last week's low of $22.68, followed by the March 21 low of $22.14. that could exacerbate further losses toward the $22.00 figure.
In contrast, if XAG/USD pierces the 100-day EMA at $23.46, the next line resistance would be $23.50, followed by the intersection of the 20 and 50-day EMAs at $23.90/$23.97, immediately followed by $24.00.
XAG/USD Price Action – Daily chart
- GBP/JPY bulls eye the 175.00 level.
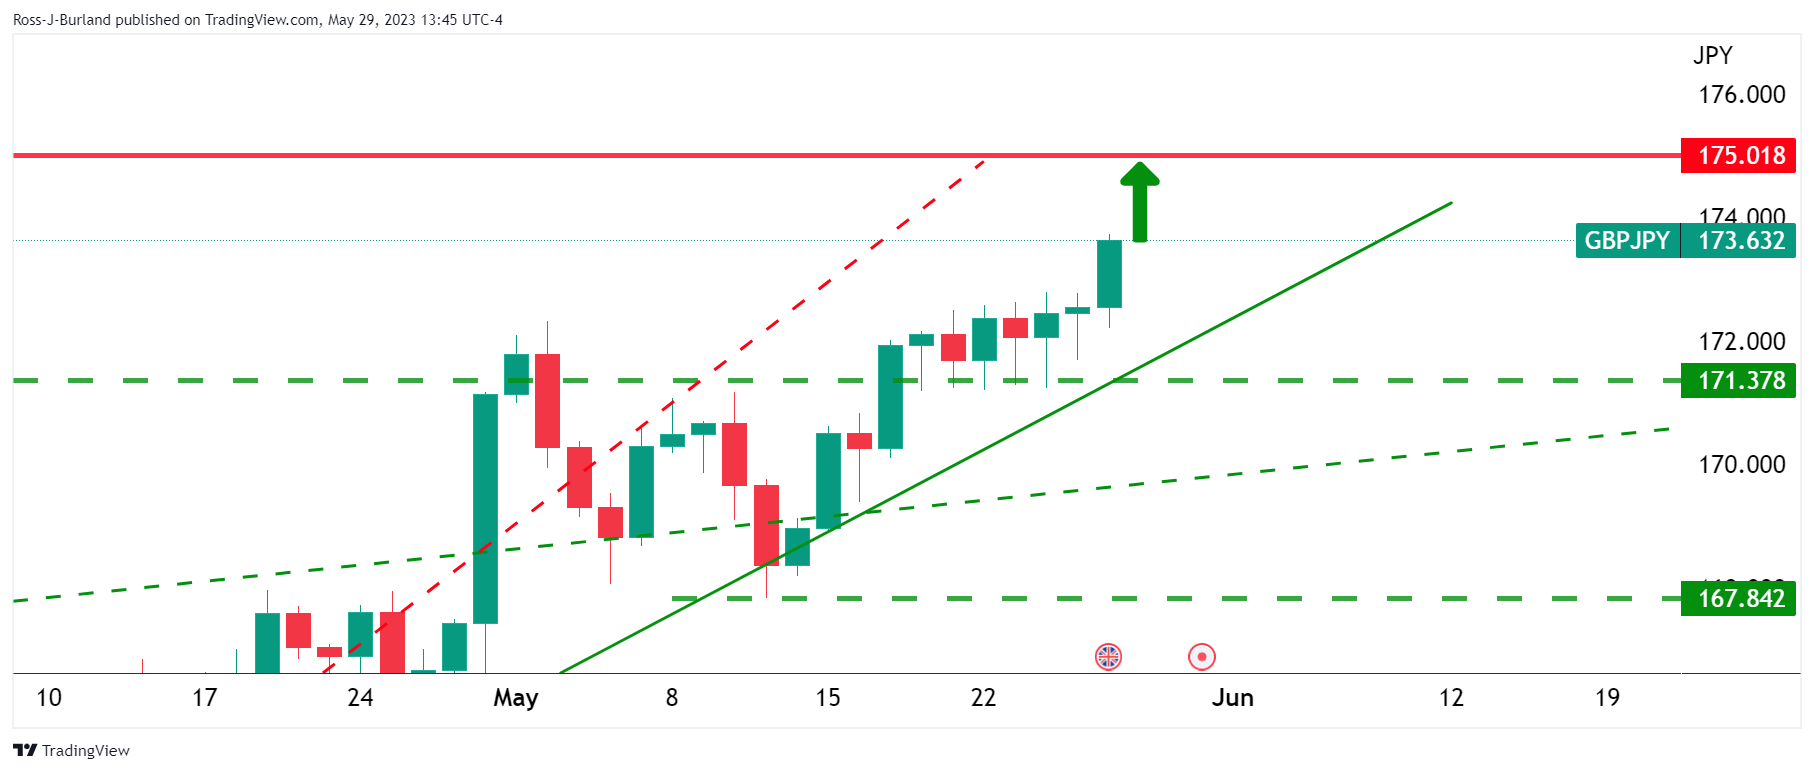
- 173.00 is key support and eyed on the hourly correction.
GBP/JPY is well on its way towards the 175 area having climbed sharply in a continuation of the 2023 bullish trend. The following will illustrate prospects for the price meeting 175.00 in due course.
GBPJPY weekly charts
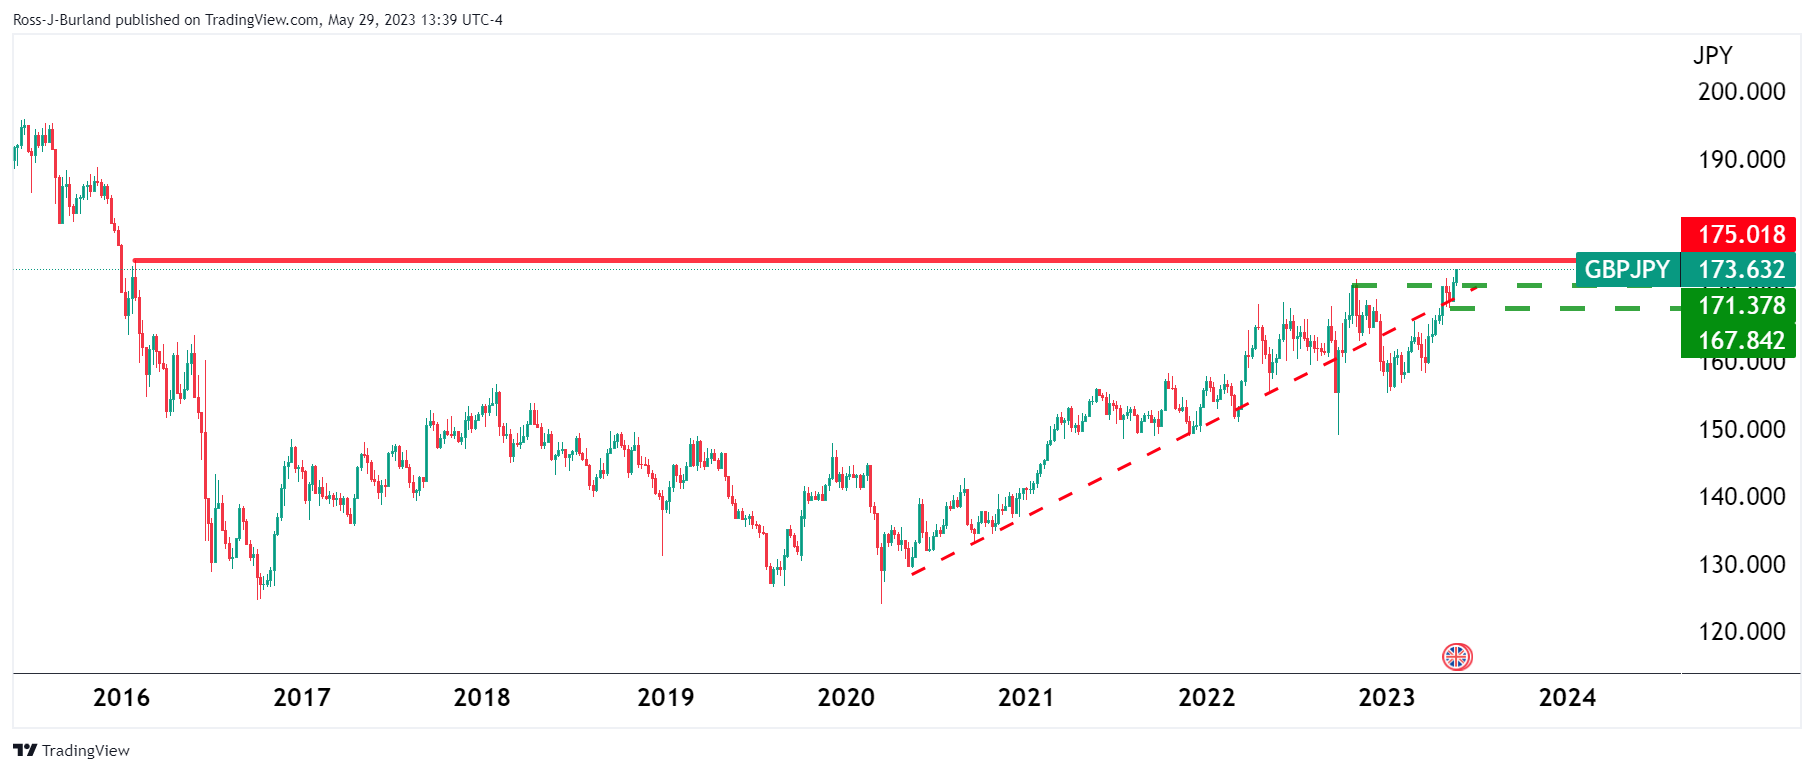
175.00 was a key resistance in 2016.
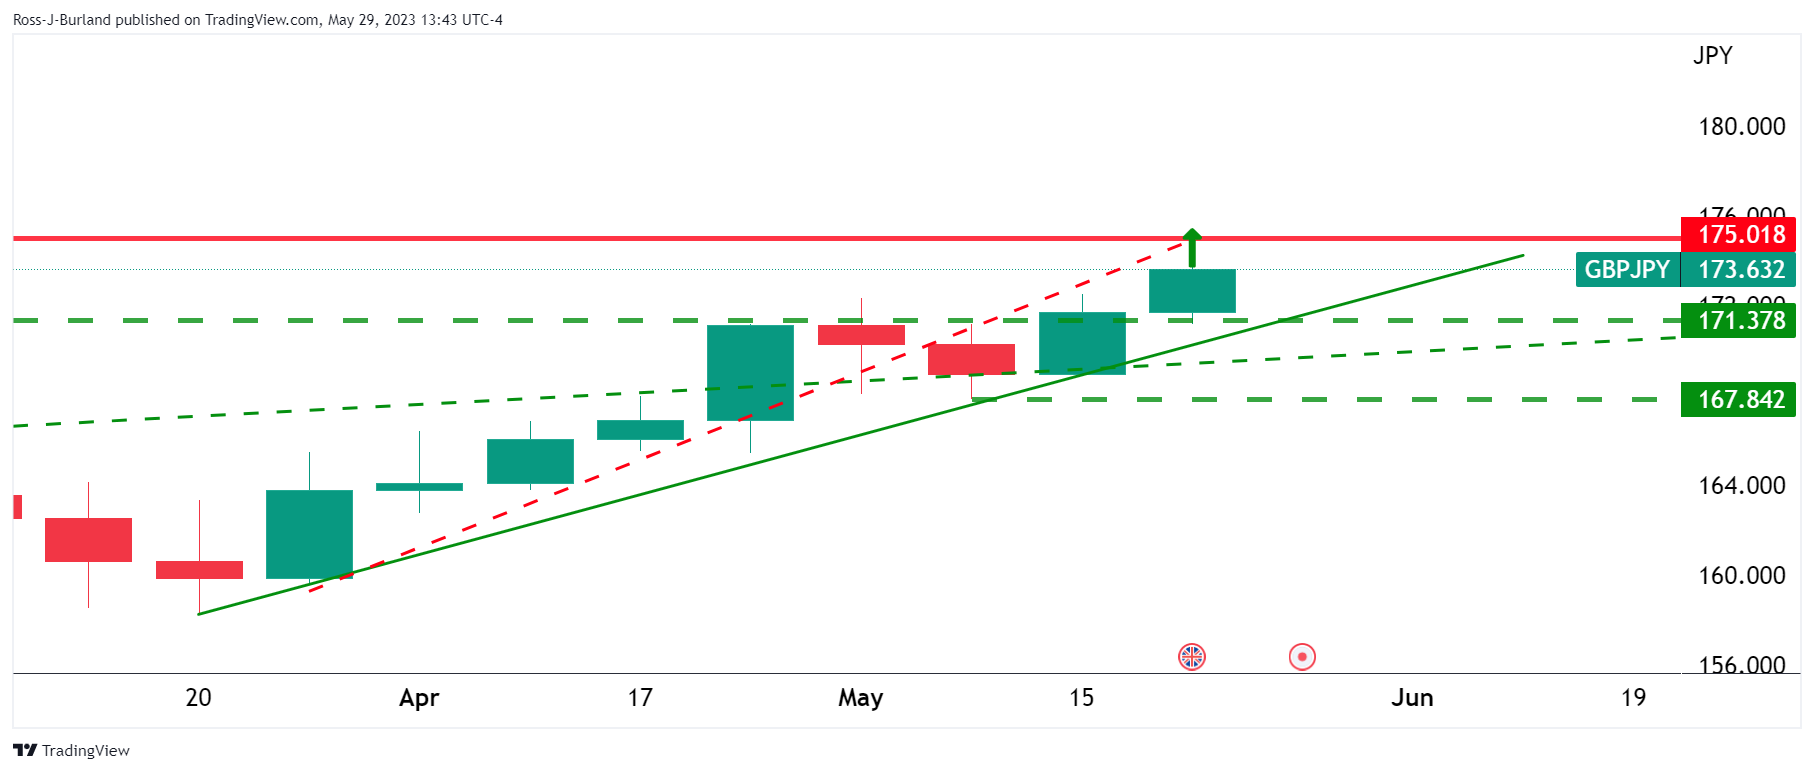
GBP/JPY daily chart
The start of the week has seen the bulls in control with little signs of a deceleration so far.
GBP/JPY H4 chart
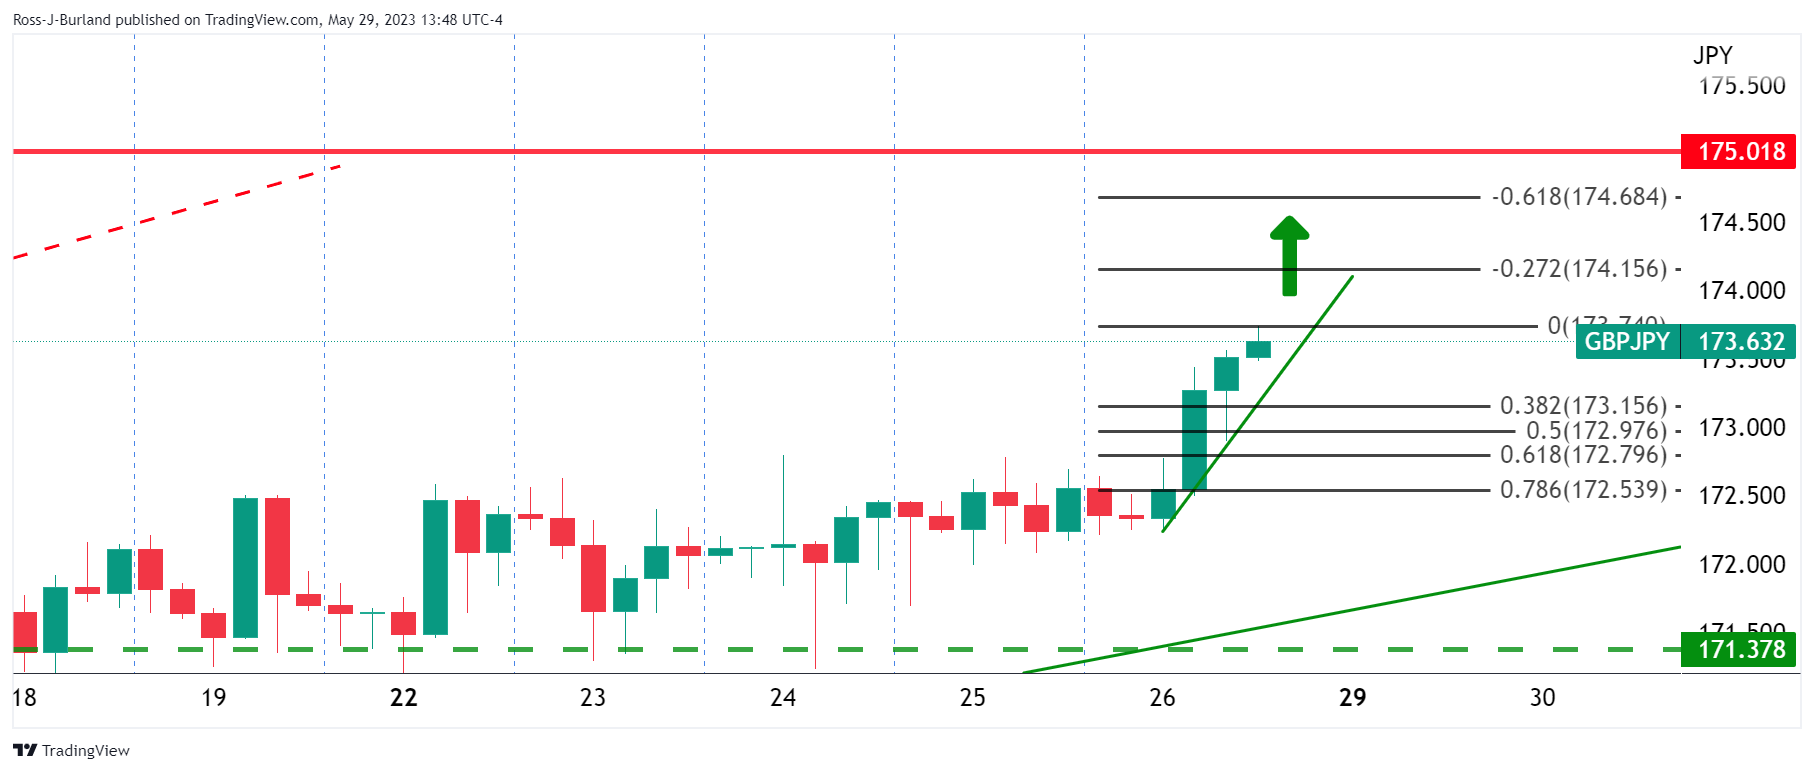
The trendline support remains intact, so far.
GBP/JPY H1 chart
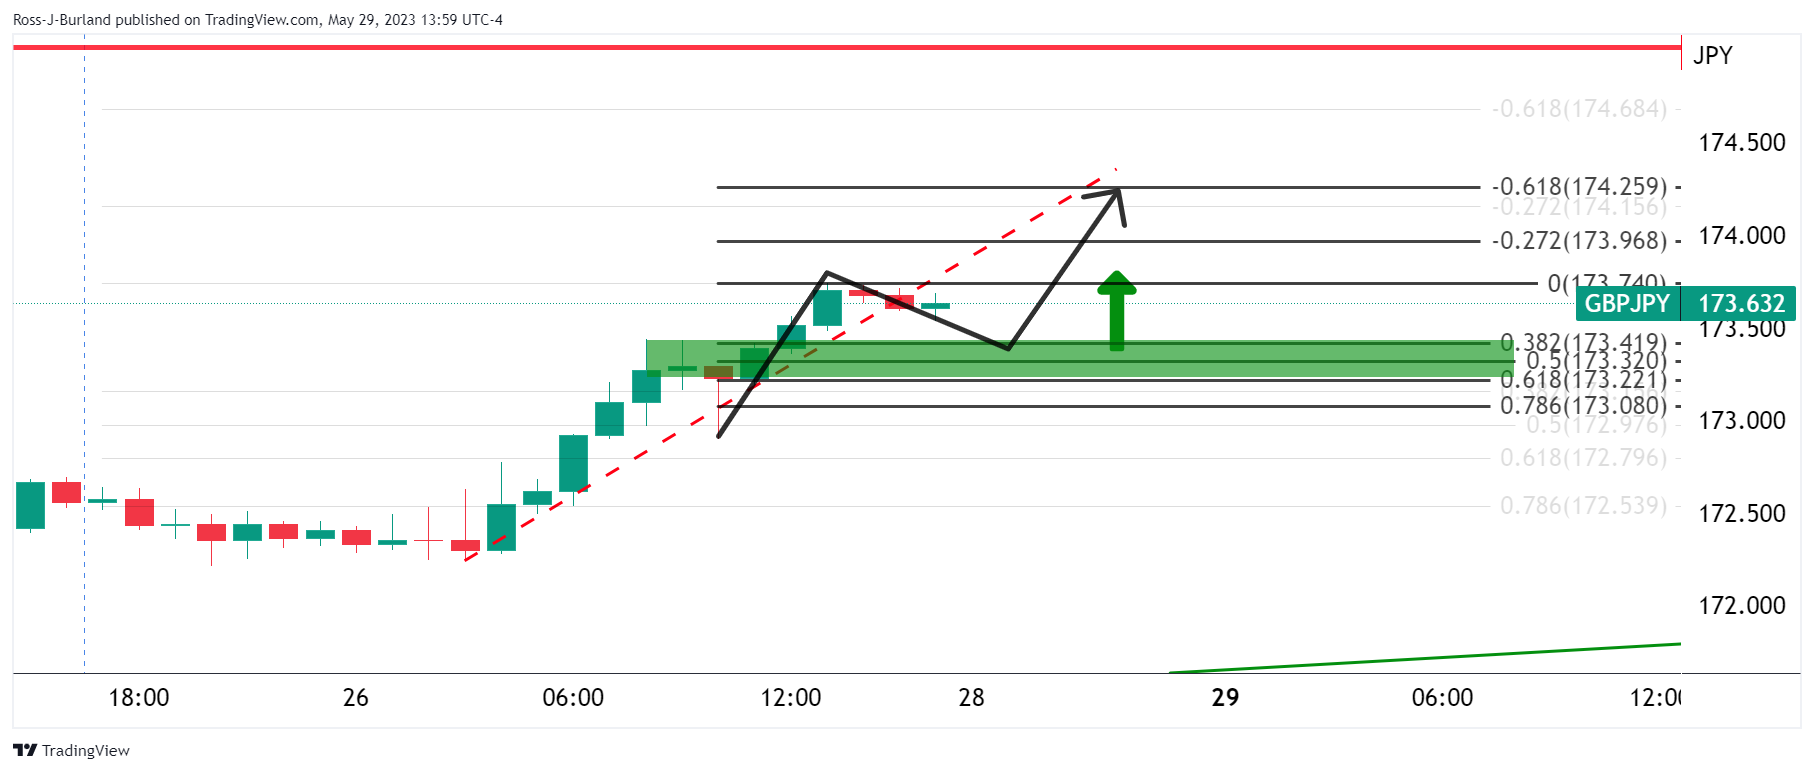
The hourly chart shows that the price is moving to the backside of the trend but should the bulls commit to above 173.00, there will be prospects of a continuation of the bullish trend.
- The Mexican Peso rallied for the second straight trading session on the back of increased risk appetite amongst investors.
- The agreement reached over the weekend to raise the US debt ceiling stokes investor optimism, as reflected in rising equity futures.
- The US Dollar Index (DXY) remains static amidst rising US bond yields due to strong US data and a hawkish Fed, unable to prevent USD/MXN’s decline as Mexico’s ongoing GDP growth uplifts the Peso.
- ING analysts indicate that the Peso’s trajectory hinges on the Fed’s response to a possible recession, significantly if the US economy slows down amidst inflation worries.
USD/MXN dropped sharply as investors’ optimism spurred an appetite for riskier assets, meaning emerging market currencies appreciated against the US Dollar (USD). The Mexican Peso (MXN) rallied for the second straight trading session, with the USD/MXN down 0.36%. At the time of writing, the USD/MXN exchanges hands at 17.5550 after hitting a daily high of 17.6236.
White House-Congress debt ceiling agreement, strong US data underpin Peso’s rally against the US Dollar
During the weekend, talks between Republicans and Democrats delivered an agreement to raise the US debt ceiling, cheered by investors, as shown by equity futures rising. US President Joe Biden and House Speaker Kevin McCarthy remain confident that their agreement will pass Congress. Meanwhile, the latest tranche of economic data from the United States (US), puts the US Federal Reserve (Fed) on center stage, with odds for a 25 bps hike in June increasing from 25.7% to 58.4% on Monday.
US data improved, as shown by Retail Sales, Industrial Production, GDP, and Consumer Spending. In addition, the Fed’s preferred gauge for inflation, the Core PCE, stood at around the high of 4%. Consequently, the aggressive repricing on a hawkish Fed was witnessed by US bond yields, climbing sharply and underpinning the US Dollar.
The US Dollar Index (DXY) is almost unchanged at 104.240, though it failed to cap the USD/MXN fall. The Mexican Peso strengthened since last Friday as data from Mexico showed the country grew for the sixth consecutive quarter, with the Gross Domestic Product (GDP) increasing by 1% in the period.
“It all depends on whether inflation allows the Fed to respond to a recession. If the US does slow down quite aggressively and the Fed still has a problem with inflation and dollar rates stay high, then probably the Peso could start to suffer,” wrote analysts of ING.
During the weekend, the Chicago Fed President Austan Goolsbee said the Fed is improving on its inflation goal but has not succeeded, adding that interest rate increases take months or years to be felt by the economy. He said that the Fed can get inflation down without a recession.
USD/MXN Price Analysis: Technical outlook
USD/MXN remains downward biased after sliding below the 20-day Exponential Moving Average (EMA) at 17.7662, exacerbating a fall toward the psychological 17.5000 barrier. Drop below the latter could put the year-to-date (YTD) low of 17.4238 in play before testing 17.0000. Conversely, USD/MXN buyers must reclaim the 20-day EMA, so they can threaten to lift the pair toward the 50-day EMA at 17.9706.
- The Cable trades with gains for a second consecutive day.
- The US debt-ceiling agreement favored a positive market environment
- Focus shifts to NFP data from May from the US.
Cable trades with gains near the 1.2350 area and benefits from the positive market mood fueled by the announcement on Sunday regarding an agreement on the debt ceiling between US President Joe Biden and Republican House Speaker Kevin McCarthy. While neither country will release relevant economic reports the pace of the session will be dictated by the market assessment of the mentioned agreement.
US stock futures rise signaling a positive market mood
On Sunday, Joe Biden and Kevin McCarthy made a joint announcement, stating that they have reached an agreement regarding the extension of the debt ceiling. According to the proposed deal, the government would be allowed to borrow money without increasing the limit, which would be temporarily suspended until 2025. However, the proposal still requires approval from Congress, although US officials are hopeful that it will be passed.
The news of the agreement was well-received by Wall Street futures, leading to a rise in their value and exerting downward pressure on the US Dollar.
For the rest of the week, the focus will shift to Nonfarm Payrolls (NFP) data from the US from May which is expected to hint at more pain in the American labor market. In that sense the outlook may have an impact on expectations from the next Federal Reserve (Fed) meeting in June and hence on the US Dollar price dynamics.
Levels to watch
Technically speaking, the GBP/USD holds a neutral to bearish outlook for the short term. The bears are struggling to maintain their dominance, but technical indicators are still unfavorable, suggesting that the market may still have some downside potential.
The psychological mark at 1.2320 is the immediate support level for GBP/USD. A break below this level could pave the way towards the 100-day Simple Moving Average (SMA) at 1.2290 area and then to the 1.2250 zone. Furthermore, a move above the 1.2390 level would favor the bull’s momentum with next resistances at the 1.2450 zone and 20-day SMA at 1.2480.
- The Loonie sets a second consecutive day of losses.
- The US Dollar lost appeal after the debt-ceiling agreement on Sunday.
The USD/CAD, at the time of writing, is trading at 1.3590, below its opening price by 0.15 % during the American session. Following the debt ceiling agreement announcement on Sunday, market’s sentiment turned positive and weakened the US Dollar while American traders enjoyed a long weekend on Memorial Day. On the other hand Canada's economic calendar has nothing relevant to offer and the Canadian Dollar benefits from the positive market environment.
Wall Street future’s rise amid US debt-ceiling agreement
US President Joe Biden and Republican House Speaker Kevin McCarthy jointly declared that they have come to a consensus on extending the debt ceiling, on Sunday. Under the proposed deal, the government would be permitted to borrow funds without raising the limit; instead, the limit would be temporarily suspended until 2025. However, the proposal still needs to be approved by Congress, but U.S. officials are optimistic about its passage. As a reaction, Wall Street futures cheered on the announcement and edged higher, applying pressure on the US Dollar.
Levels to watch
According to the daily charts, the USD/CAD holds a neutral to bearish outlook for the short term. However, indicators remain in positive territory and the convergence of the 20 and 100-day Simple Moving Averages (SMA) at the 135.00 area suggests that more upside may be in store for the pair.
The 1.3580 zone is the immediate support level for the USD/CAD. A break below this level could pave the way towards the mentioned convergence at the 1.3500 level. Furthermore, the 1.3620 zone is key for USD/CAD to gain further traction. If cleared, we could see a more pronounced move towards the monthly high at 1.3650 and the psychological mark at 1.3700.
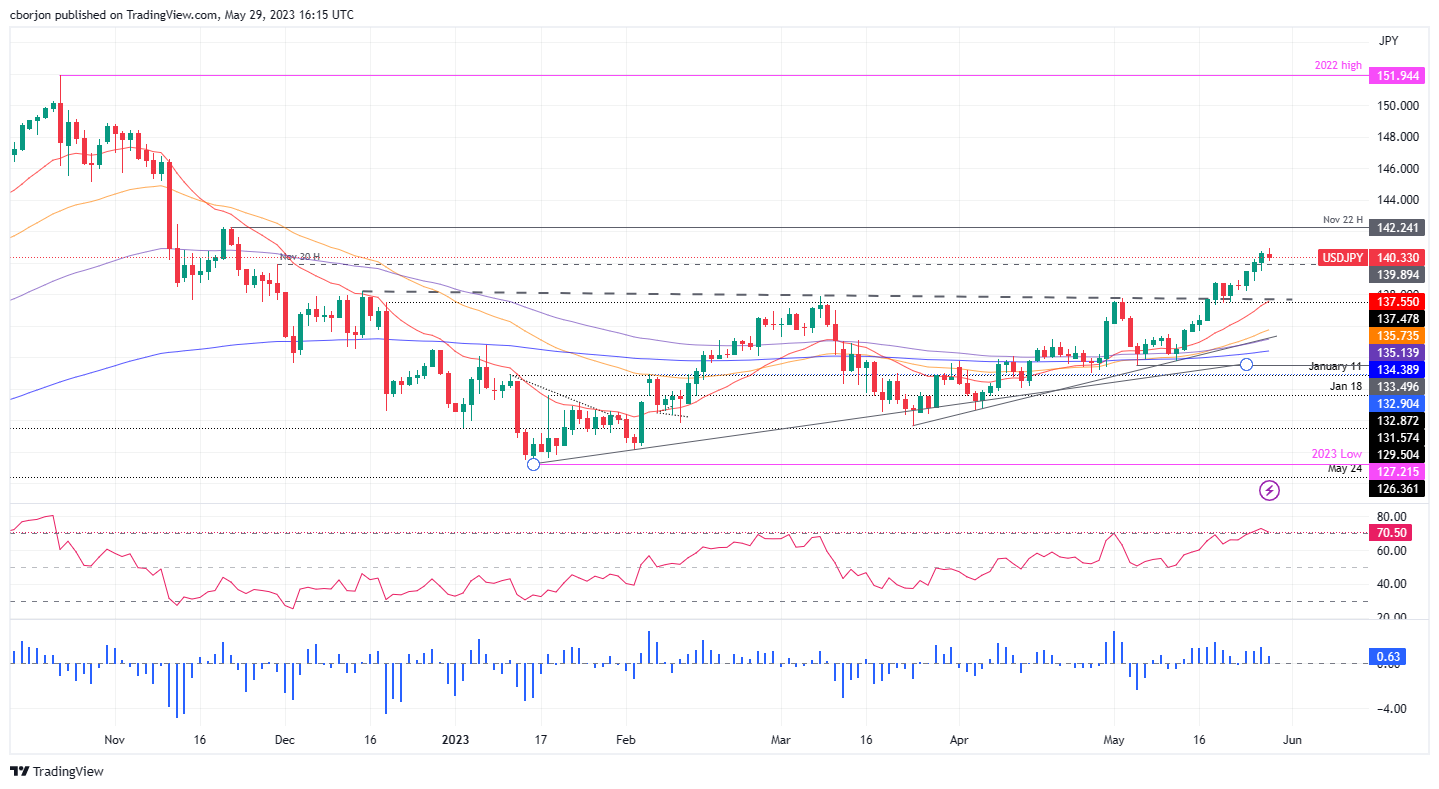
- Technical indicators suggest potential exhaustion in the pair's rally, as the failure to cross the 141.00 mark triggers a downward correction toward 140.00, hinting at an ongoing correction.
- Despite the short-term pullback, market bulls remain prepared for a potential rally, setting sights on the November 22 daily high of 142.24 and further up at the 143.00 mark.
USD/JPY retraces after hitting a new year-to-date (YTD) high of 140.92, trades below its opening price by 0.19% amidst thin volume during the North American session. Memorial Day in the United States (US), and holidays across Europe, keep the Forex markets depressed. At the time of writing, the USD/JPY is trading at 140.34.
USD/JPY Price Analysis: Technical outlook
The USD/JPY is still upward biased, but the rally is fading as the pair shows signs of exhaustion. Failure to decisively crack the 141.00 figure exacerbated a downward correction toward the 140.00 figure, ahead of reaching for May 26 daily low of 139.50. It should be said the Relative Strength Index (RSI) indicator, at 70, begins to aim downwards, while the 3-day Rate of Change (RoC) points toward the neutral area, suggesting an ongoing correction.
That could trigger a short-term correction before USD/JPY bulls jump into action and lift the exchange rates past the 141.00 mark, on its way toward the November 22 daily high f 142.24, before reaching 143.00.
USD/JPY Price Action – Daily chart
- Gold bounces and shows signs of resilience despite a strong US dollar, as lower US Treasury bond yields lend some support amidst the backdrop of US Memorial Day and European holidays.
- Optimism soars amongst investors following a provisional deal between the White House and US Congress to raise the US debt ceiling.
- Positive US economic data spurred a hawkish repricing of the US Federal Reserve.
Gold price pares some of its fall of almost 2% last week, bouncing off from the $1940 area amidst thin liquidity conditions due to US Memorial Day and holidays across Europe. Lower US Treasury bond yields underpin XAU/USD, though a solid US Dollar (USD) caps its rally. The XAU/USD is trading at $1947, above its opening price by 0.08%.
Investors turn optimistic after a US debt-ceiling agreement; US Fed’s hawkish repricing influences markets
Sentiment amongst investors turned positive after a deal was reached between the White House (WH) and the US Congress. However, it remains subject to a vote as soon as possible, which would raise the US debt ceiling by two years until January 1, 2025. That keeps US equity futures positive, though the greenback is also up, as bets that the US Federal Reserve (Fed) will lift rates in June rose from 25.7% a week ago to 58.4% Today.
The reasons behind a “hawkish” repricing of the US Federal Reserve (Fed), come after solid Retail Sales, Industrial Production, and upward revision of the Gross Domestic Product (GDP) flashed signs of resiliency in the economy of the United States (US). That alongside the last week’s review of the Fed’s preferred gauge for inflation, the Core PCE stood at around the high 4%.
Therefore, US Treasury bond yields, particularly the 10-year benchmark note rate, edged toward 3.859% before reversing its course, down to 3.796%, a tailwind for Gold prices.
During the weekend, the Chicago Fed President Austan Goolsbee said the Fed is improving on its inflation goal but has not succeeded, adding that interest rate increases take months or years to be felt by the economy. He added that the Fed can get inflation down without a recession.
XAU/USD Price Analysis: Technical outlook
XAU/USD’s daily chart portrays the yellow metal as neutral biased, trapped within the boundaries of the 100-day Exponential Moving Average (EMA) at $1934.21 and the 50-day EMA at $1972.45. In addition, the $1950 psychological price level was used as solid support that capped Gold’s fall until May 24, when it gave way to lower prices. That said, the bulls must reclaim the latter for a bullish continuation. On the downside, if XAU/USD cracks $1940, it could dive and test the 100-day EMA; before aiming toward the 200-day EMA at $1883.95.
- Australian Dollar rises modestly against the US dollar on a quiet Monday.
- Although AUD/USD maintains a negative tone, it gained some support in the short term.
On Monday, the AUD/USD made a modest gain, moving away from the six-month low it reached last Friday below 0.6500. In a quiet session, with American markets closed, the pair peaked at 0.6553, the highest level since Wednesday, before pulling back to 0.6530.
The US Dollar is posting mixed results across the board, amid low trading volume. Market participants continue to digest last week's US consumer inflation data and closely follow developments around the debt ceiling drama.
On Tuesday, Australia is expected to report a 2% increase in Building Permits for April. Next week, the Reserve Bank of Australia will hold its monetary policy meeting.
AUD/USD outlook
The pair's trend continues to be to the downside, but in the short-term, the rebound pushed the price above the 20-period Simple Moving Average (SMA) in the 4-hour charts, currently at 0.6525. While above this level, the Australian Dollar could continue to consolidate, while a slide below, would expose 0.6500 and the recent lows.
If the AUD/USD manages to consolidate above 0.6555, it could strengthen for an extension of the recovery. The next resistance stands at 0.6580, followed by 0.6600.
Technical levels
Price pressures seem to be very sticky and the economy is showing little weakness. Therefore, Gold could remain under downside pressure, economists at TD Securities report.
Fed could hike more than the market has priced
“The concern that prices will not drop as fast as the US central bank desires have prompted a sharp correction in recent days, with the risk that Gold may drop to support near low $1,900s, should the 100-DMA support be breached.”
“Notwithstanding our longer term positive Gold view, the short run represents downside risk, if the economy stays firm.”
“Inflation is not moving down slower, it rose. This may well prompt the Fed to hike more than the market has priced and may be bad news for longs and Gold prices”.
Economists at Danske Bank discuss Lira's outlook after the Turkish presidential election.
Time to fasten seatbelts as Erdogan secures another term
“Recep Tayyip Erdoğan, has sealed his iron grip on Turkey. In the absence of a u-turn in his economic policies, the risk of an acute currency crisis looms.”
“In a scenario where Turkey ran out of foreign currency, Lira’s value would likely collapse, inflation would explode and goods shortages could occur. Turkish corporates with large foreign liabilities would face rising rollover risk.”
- Oil price finds a floor after Republicans and Democrats agree a deal to extend the US government debt ceiling on Sunday.
- The deal means a default is unlikely and boosts demand prospects in the US.
- US interest rates are expected to rise further after debt deal and strong US macro data.
- Higher interest rates, however, will strengthen the US Dollar but weigh on Oil.
Oil price remains in a familiar range within the $72s on Monday, as traders in both the US and UK take a break to enjoy the bank-holiday weekend. WTI Oil is finding support from the news US lawmakers have agreed to extend the US debt ceiling, subject to a vote in Congress. Yet this has also had the effect of raising interest rate expectations – a factor weighing on Oil price. Higher interest rates will lead to a stronger US Dollar, putting pressure on Oil price, which is priced in Dollars.
At the time of writing, WTI Oil is trading in the mid $72s and Brent Crude Oil in the mid $76s.
Oil news and market movers
- Oil settles in a familiar range as traders in the US and UK take time off for a long bank-holiday weekend.
- Crude is supported by the news that a deal has been struck to extend the debt-ceiling deal on Sunday, between House Republicans and Democrats.
- More upside is expected on Tuesday, when market participants return to their desks, and once the debt deal has been voted through Congress, the final step to making it law.
- The extension of the debt ceiling as well as robust US macroeconomic data has increased market expectations that the Federal Reserve (Fed) will have to raise interest rates at their next meeting to combat rising inflation expectations – bullish for the US Dollar; bearish for Oil.
- The CME FedWatch tool shows a 60.7% chance of the Fed raising interest rates by 0.25% at their meeting on June 14.
- Traders further await the outcome of the next meeting of OPEC+ on June 4, when the possibility of production cuts has been raised.
- Saudi Oil Minister Prince Abdulaziz bin Salman seemed to imply OPEC+ might cut production quotas when he warned speculators (interpreted as short-sellers) should “watch out” at a press conference last week.
- Russia’s Energy Minister Alexander Novak, however, later played down the idea of production cuts. “I don't think that there will be any new steps, because just a month ago certain decisions were made regarding the voluntary reduction of oil production by some countries," he said.
Crude Oil Technical Analysis: Triangle formation hinting end of downtrend?
WTI Oil is in a long-term downtrend from a technical perspective, making successive lower lows. Given the old adage that the trend is your friend, this favors short positions over long positions. WTI Oil is trading below all the major daily Simple Moving Averages (SMA) and all the weekly SMAs except the 200-week, which is at $66.90.
-638209665687200271.png)
WTI US Oil: Daily Chart
A right-angled triangle has probably finished forming as shown by the dotted lines on the chart above.
The triangle initially broke out to the upside, with price breaking above the upper border of the triangle on May 24 but then failed to follow-through higher and reversed. It is currently trading just below the lower border.
A breakout higher is still possible. The three green up bars in a row that occurred prior to the bullish breakout on May 24 are a bullish sign in themselves. It suggests there is still a chance price could recover after the May 25 sell-off and eventually continue breaking out higher.
Such a bullish breakout could see Oil price rise in a volatile rally to a potential target in the $79.70s, calculated by using the usual technical method, which is to take 61.8% of the height of the triangle and extrapolate it from the breakout point higher. Oil price could even go as far as a 100% extrapolation, however, the 61.8% level roughly coincides with the 200-day SMA and the main trendline for the bear market, heightening its importance as a key resistance level.
Assuming Oil price reaches its target, a bullish break would also signify that price had surpassed the key $76.85 lower high of April 28, thereby, bringing the dominant bear trend into doubt.
The long hammer Japanese candlestick pattern that formed at the May 4 (and year-to-date) lows is a further sign that Oil price may have formed a strategic bottom.
Further, the mild bullish convergence between price and the Relative Strength Index (RSI) at the March and May 2023 lows – with price making a lower low in May that is not matched by a lower low in RSI – is a sign that bearish pressure is easing.
That said, until Oil price actually climbs back above the $74.70 May 24 highs there is still a possibility WTI Oil price could break out lower. A break below the May 22 lows of $70.65, or better still the $69.40 May 15 lows, would provide confirmation.
-638209666502542318.png)
WTI US Oil: Weekly Chart
A break below the year-to-date (YTD) lows of $64.31 would imply a new lower low was forming, reigniting the downtrend. The next target from there would be at around $62.00, where trough lows from 2021 will come into play, followed by support at $57.50.
WTI Oil FAQs
What is WTI Oil?
WTI Oil is a type of Crude Oil sold on international markets. The WTI stands for West Texas Intermediate, one of three major types including Brent and Dubai Crude. WTI is also referred to as “light” and “sweet” because of its relatively low gravity and sulfur content respectively. It is considered a high quality Oil that is easily refined. It is sourced in the United States and distributed via the Cushing hub, which is considered “The Pipeline Crossroads of the World”. It is a benchmark for the Oil market and WTI price is frequently quoted in the media.
What factors drive the price of WTI Oil?
Like all assets, supply and demand are the key drivers of WTI Oil price. As such, global growth can be a driver of increased demand and vice versa for weak global growth. Political instability, wars, and sanctions can disrupt supply and impact prices. The decisions of OPEC, a group of major Oil-producing countries, is another key driver of price. The value of the US Dollar influences the price of WTI Crude Oil, since Oil is predominantly traded in US Dollars, thus a weaker US Dollar can make Oil more affordable and vice versa.
How does inventory data impact the price of WTI Oil
The weekly Oil inventory reports published by the American Petroleum Institute (API) and the Energy Information Agency (EIA) impact the price of WTI Oil. Changes in inventories reflect fluctuating supply and demand. If the data shows a drop in inventories it can indicate increased demand, pushing up Oil price. Higher inventories can reflect increased supply, pushing down prices. API’s report is published every Tuesday and EIA’s the day after. Their results are usually similar, falling within 1% of each other 75% of the time. The EIA data is considered more reliable, since it is a government agency.
How does OPEC influence the price of WTI Oil?
OPEC (Organization of the Petroleum Exporting Countries) is a group of 13 Oil-producing nations who collectively decide production quotas for member countries at twice-yearly meetings. Their decisions often impact WTI Oil prices. When OPEC decides to lower quotas, it can tighten supply, pushing up Oil prices. When OPEC increases production, it has the opposite effect. OPEC+ refers to an expanded group that includes ten extra non-OPEC members, the most notable of which is Russia.
Economists at Wells Fargo discuss the Argentine Peso outlook.
Argentine Peso will be the worst performing emerging market currency in 2023
“Despite sharp interest rate hikes, we believe the Argentine Peso is on track for devaluation as FX reserves remain depleted and the IMF program could be at risk.”
“In our view, a managed depreciation is likely up until the election; however, once presidential elections end in October, we believe an outsized and intentional Peso devaluation will materialize and the Argentine Peso will be the worst performing emerging market currency in 2023.”
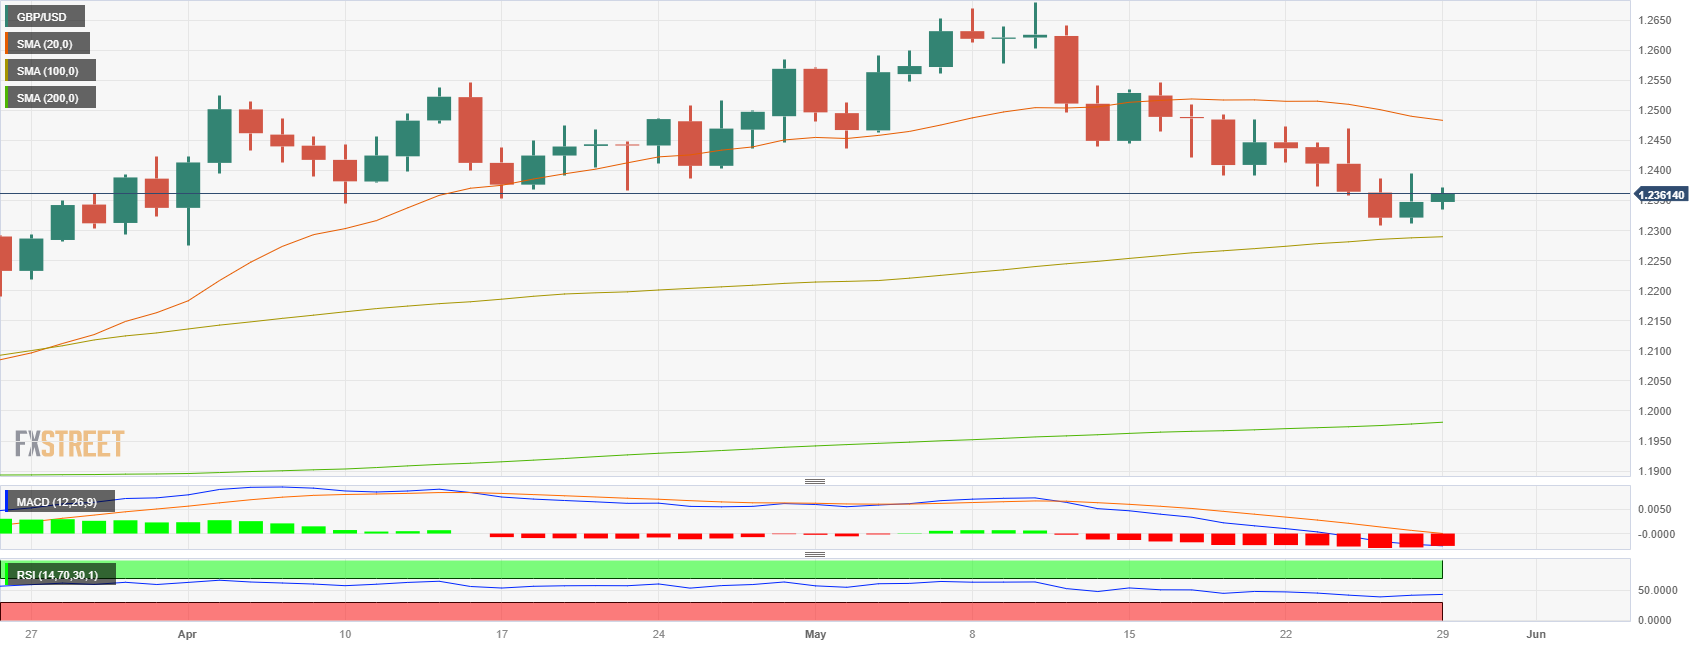
- GBP/USD adds to Friday’s gains and retests the 1.2370/75 band.
- The greenback trades without direction near 104.20/30.
- Markets’ attention is expected to be on Friday’s US Payrolls.
Despite the broad-based range bound theme in the global markets, GBP/USD manages to gather further upside impulse and revisit the 1.2370 region on Monday.
GBP/USD looks at USD, risk trends
GBP/USD trades with gains for the second session in a row amidst the dollar’s vacillating price action and the generalized flattish mood in the global markets due to the US Memorial Day holiday and the UK’s Spring Bank Holiday.
Moving forward, investors’ attention should refocus on the release of US Nonfarm Payrolls for the month of May (June 2), which might have direct implication in the Fed’s interest rate decision on June 14, while further tightening is expected from the BoE also in June, particularly following sticky inflation figures during last month.
There were no data releases/events in the UK docket on Monday.
GBP/USD levels to consider
As of writing, the pair is gaining 0.01% at 1.2344 and the surpass of 1.2409 (55-day SMA) would open the door to 1.2668 (2023 high May 8) and then 1.2864 (200-week SMA). On the downside, the next support emerges at 1.2308 (monthly low May 25) seconded by 1.2274 (monthly low April 3) and finally 1.2010 (weekly low March 15).
The 10-year EU-US spread has narrowed. This should support the EUR/USD pair, in the view of economists at MUFG Bank.
Spread / FX link tends to correct following shocks
“The very sharp narrowing of the 10-year EZ-US spread will have an influence on FX – all else equal. Like long-term valuation – we should depend on this analysis for short-term direction, but over time if this 10-year spread narrowing is sustained, it will be a supportive factor for EUR/USD.”
“The largest divergence in 10yr spread / FX direction came following the launch of the Euro in 1999 which coincided with remarkably strong fundamentals for the US with record FDI inflows to the US fuelled by the tech/productivity boom. Outside of that example, EUR/USD tends to mean revert based on data back to mid-1980’s.”
In the opinion of Markets Strategist Quek Ser Leang at UOB Group, USD/IDR could extend the advance past the 15,000 mark in the short-term horizon.
Key Quotes
“Last Monday (22 May, spot at 14,890), we indicated that ‘as long as USD/IDR stays above 14,750, there is a chance for USD/IDR to rise further even though it might not be able to break clearly above the resistance at 14,980’. In line with our expectations, USD/IDR rose but did not break 14,980 (high has been 14,969).”
“Upward momentum has improved, and this week, USD/IDR is not only likely to break above 14,980, but also 15,000. However, the next resistance at 15,060 could be just out of reach. Support is at 14,920, followed by 14,880.”
Economists at Wells Fargo expect US Dollar depreciation to be modest during Q4-2023, but pick up pace over the course of next year.
Greenback could be relatively stable in the near term
“The greenback could be relatively stable in the near term, as some additional Fed tightening combined with the potential for mildly unsettled markets could provide temporary support for the greenback.
However, we expect the US currency to eventually come under pressure as aggressive Fed easing starts from early 2024.”
“We forecast the trade-weighted Dollar to soften 1.5% over the balance of 2023, and by a further 5% in 2024.”
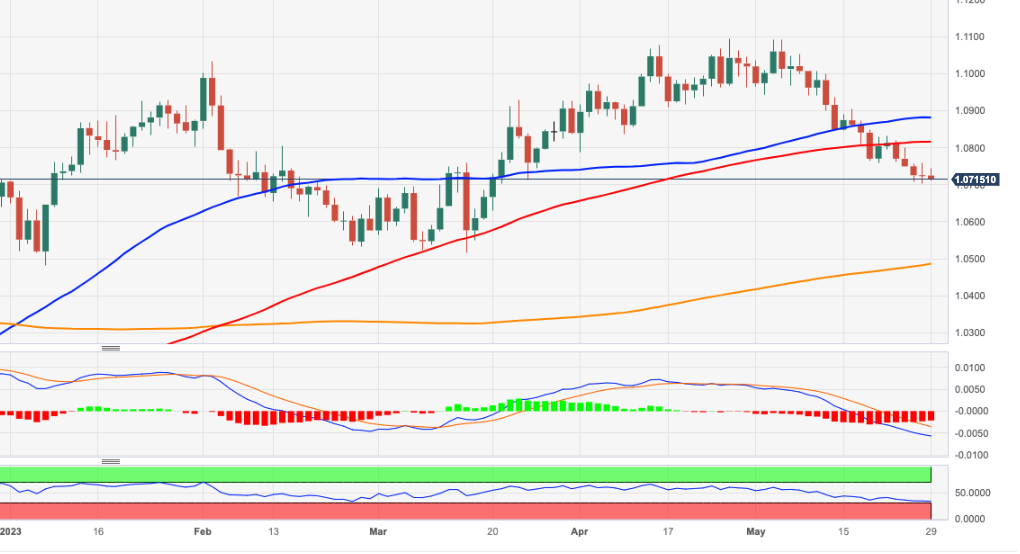
- EUR/USD remains under pressure and close to 1.0700.
- The breach of 1.0700 could pave the way for a sustained drop.
EUR/USD keeps the bearish note well in place and keeps the trade near the key 1.0700 zone on Monday.
The ongoing bearish development could force the pair to break below the 1.0700 region and thus expose a deeper pullback to, initially, the March low of 1.0516 (March 15) in the near term.
Looking at the longer run, the constructive view remains unchanged while above the 200-day SMA, today at 1.0485.
EUR/USD daily chart
Extra gains in USD/MYR should meet a tough barrier at 4.6570 in the near term, suggests Markets Strategist Quek Ser Leang at UOB Group.
Key Quotes
“Last Monday (22 May, spot at 4.5330), we highlighted that ‘the sharp and swift rise in USD/MYR appears to be overdone but it could test 4.5600 first before the risk of a reversal increases’. We did not anticipate USD/MYR to lift-off and rocket to a high of 4.6360 on Friday. USD/MYR subsequently pulled back from the high and closed at 4.5970 (+1.34% for the week).”
“The steep and swift rally appears to be overextended but with no sign of easing just yet, USD/MYR could rise further even though the chance of it breaking above 4.6570 this week is not high. On the downside, a breach of 4.5550 (minor support at 5.5720) indicates the current strong rally is ready to take a breather.”
The Canadian Dollar is heading into the end of the month little changed against a generally stronger USD. Economists at Scotiabank project a potential range of 1.3450/1.3735 for the coming week.
USD is likely to remain firm in the short run
“The US Dollar is likely to remain firm in the short run but may struggle to improve significantly versus the CAD over the next week or so.”
“Our modeling projects a potential range of 1.3450/1.3735 for the USD/CAD pair for the coming week.”
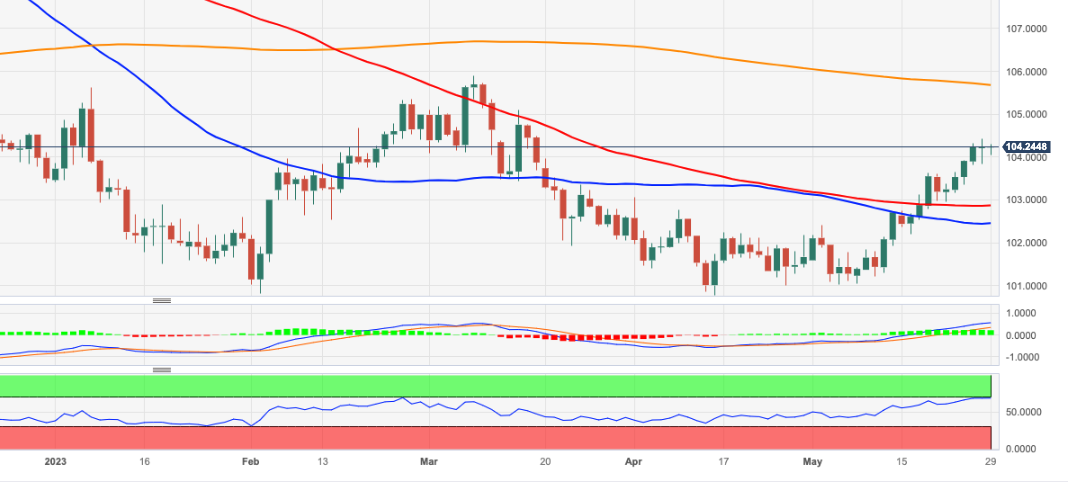
- DXY treads water around 104.20/30 at the beginning of the week.
- Further upside needs to clear the May top at 104.41.
DXY struggles to extend further the May rally on Monday.
Further upside appears on the cards in the near term. That said, the surpass of the May high at 104.41 (May 26) should put a potential visit to the key 200-day SMA, today at 105.67, back on the radar ahead of the 2023 peak of 105.88 (March 8).
Looking at the broader picture, while below the 200-day SMA the outlook for the index is expected to remain negative.
DXY daily chart
Markets Strategist Quek Ser Leang at UOB Group notes that further upside lies ahead for USD/THB.
Key Quotes
“Last Monday (22 May, spot at 34.40), we held the view that USD/THB ‘has room to test 34.55 before the risk of a more sustained pullback increases’. We added, ‘the next resistance at 34.75 is unlikely to come into view’. The anticipated USD/THB strength exceeded our expectations as USD/THB soared to a high of 34.80 before ending the week on a strong note at 34.78 (+1.15%).”
“Upward momentum remains strong and while further USD/THB strength this week will not be surprising, severely overbought conditions suggest a sustained break above 35.05 is unlikely. The next major resistance at 35.30 is unlikely to come under threat. Support is at 34.60; a breach of 34.40 would indicate USD/THB is not advancing further.”
- EUR/JPY briefly tests the area beyond the 151.00 yardstick.
- The continuation of the uptrend targets the 2023 peak near 151.60.
EUR/JPY reverses three consecutive sessions with gains and slip back to the boundaries of the 150.00 zone at the beginning of the week.
Further upside appears a plausible near-term scenario, and convincing breakout of the key round level at 150.00 could encourage the cross to dispute the 2023 top at 151.61 (May 2) in the not-so-distant future.
So far, further upside looks favoured while the cross trades above the 200-day SMA, today at 143.69.
EUR/JPY daily chart
USD peak in place? The longest and second-largest US Dollar bull run may be ending, according to analysts at MUFG Bank.
USD strength became more extreme last year
“USD strength became more extreme last year. The USD reached its highest level against our equally-weighted basket of other G10 currencies since the early 2000’s. At the peak in October, the USD was over 2 standard deviations stronger than the average over the last 40 years.”
“Similar extreme levels of USD overvaluation were last recorded in the early 2000’s and mid-1980’s and subsequently proved to be long-term bearish turning points for the USD. On both occasions, the USD then fell by around 40%. In comparison, the USD has declined so far by around 8% since the peak in October thereby leaving room for the adjustment lower to extend further in the coming years.”
FX diversification into Gold has continued after sanctions on Russia, economists at MUFG Bank report.
Gold is popularly viewed as an inflation hedge
“Gold is seen as a safe and desirable reserve asset in periods of high economic, financial and geopolitical uncertainty, and when returns on reserve assets are low. As has been the case in recent years. It is also popularly viewed as an inflation hedge.”
“Gold is perceived as a safe and desirable reserve asset when countries are subject to financial sanctions and when financial investments are potentially subject to asset freezes and seizure. The sanctions imposed on Russia have boosted the appeal of Gold in recent years.”
- US Dollar stays resilient against its rivals at the beginning of the week.
- US Dollar Index trades at multi-week highs following last week's rally.
- Hawkish Fed bets continue to provide a boost to US Dollar.
The US Dollar (USD) preserves its strength to start the new week despite subdued trading action amid the Memorial Day holiday in the United States (US). The US Dollar Index (DXY), which tracks the USD's performance against a basket of six major currencies, holds steady above 104.00 after having gained 1% last week.
Following the latest upbeat macroeconomic data releases from the US, investors reassess the Fed's policy outlook and now see a stronger chance of the US central bank raising the key interest rate one more time in June. In turn, the USD continues to find demand on the back of rising US Treasury bond yields.
In the second half of the week, the ISM Manufacturing PMI, ADP Employment Change and the US Bureau of Labor Statistics' May jobs report will be watched closely by market participants.
Daily digest market movers: US Dollar benefits from hawkish Fed bets
- The US Bureau of Economic Analysis (BEA) reported on Friday that inflation in the US, as measured by the change in Personal Consumption Expenditures (PCE) Price Index, rose to 4.4% on a yearly basis in April from 4.2% in March.
- The annual Core PCE Price Index, the Fed's preferred gauge of inflation, edged higher to 4.6%, compared to the market expectation of 4.6%.
- Further details of the BEA's publication showed that Personal Income increased 0.4% on a monthly basis while Personal Spending rose 0.8%.
- Cleveland Fed President Loretta Mester told CNBC on Friday that PCE Price Index data underscore the slow progress on inflation. "It's important for the Fed not to under tighten the monetary policy," Mester added.
- According to the CME Group FedWatch Tool, markets are currently pricing in a less than 40% probability of the Fed leaving its policy rate unchanged at the upcoming meeting.
- On Sunday, US President Joe Biden and Republican House Speaker Kevin McCarthy reached an agreement to temporarily suspend the debt-limit to avoid a US debt default. The House of Representatives and Senate still need to approve the deal, which will suspend the $31.4 trillion debt-ceiling until January 1, 2025, in coming days.
- Bond and stock markets in the US will remain closed on Monday.
- On Tuesday, the Conference Board will release the Consumer Confidence Index data for May.
US Dollar Index technical analysis: Buyers look to retain control
The Relative Strength Index (RSI) indicator on the daily chart stays near 70, suggesting that the US Dollar Index (DXY) could turn technically overbought in the near term. In case DXY stages a technical correction, 104.00 (Fibonacci 23.6% retracement of the November-February downtrend) aligns as key support. A daily close below that level could attract USD sellers and open the door for an extended slide toward 103.00, where the 100-day Simple Moving Average (SMA) is located.
If DXY continues to use 104.00 as support, buyers are likely to remain interested. Additionally, the bullish cross seen in the 20-day and the 50-day SMAs points to a build-up of momentum. On the upside, 105.00 (psychological level, static level) aligns as next resistance before 105.60 (200-day SMA, Fibonacci 38.2% retracement).
How does Fed’s policy impact US Dollar?
The US Federal Reserve (Fed) has two mandates: maximum employment and price stability. The Fed uses interest rates as the primary tool to reach its goals but has to find the right balance. If the Fed is concerned about inflation, it tightens its policy by raising the interest rate to increase the cost of borrowing and encourage saving. In that scenario, the US Dollar (USD) is likely to gain value due to decreasing money supply. On the other hand, the Fed could decide to loosen its policy via rate cuts if it’s concerned about a rising unemployment rate due to a slowdown in economic activity. Lower interest rates are likely to lead to a growth in investment and allow companies to hire more people. In that case, the USD is expected to lose value.
The Fed also uses quantitative tightening (QT) or quantitative easing (QE) to adjust the size of its balance sheet and steer the economy in the desired direction. QE refers to the Fed buying assets, such as government bonds, in the open market to spur growth and QT is exactly the opposite. QE is widely seen as a USD-negative central bank policy action and vice versa.
The Japanese Yen has been under pressure in recent days, with USD/JPY breaking a six-month high of 140. But in the view of economists at UBS, Yen weakness should reverse as Dollar strength is unlikely to last.
BoJ looks set to normalize policy with positive economic data
“While we acknowledge the risk of further near-term upside for the Dollar, we believe the recent movement in USD/JPY is set to reverse, and we expect the pair to reach 122 by year-end.”
“The minutes of the Federal Reserve's last policy meeting showed that the need for more rate hikes has become less certain.”
“The Bank of Japan looks set to normalize policy with positive economic data. The strength in the latest set of economic data should keep the Bank of Japan on track to adjust its yield-curve control regime sometime between July and October, in our view. We expect the central bank to raise the 10-year Japan government bond (JGB) yield target from 0.5% currently to at least 0.75%.”
Economists at MUFG Bank expect the Chinese Yuan to strengthen against the US Dollar.
China’s economy is rebounding after COVID disruption
“After COVID restrictions were released at the end of last year, China’s economy has rebounded at the start of 2023 as pent up demand is realised. It has been mainly driven by consumption and services sector growth while growth in manufacturing output and property investment have disappointed. We expect China’s economy to expand by 5.5% this year.”
“China’s trade surplus with the US has continued to widen hitting a new record as import demand from China has failed to keep up with strengthening export growth. The wider trade surplus should encourage a stronger CNY and weaker USD.”
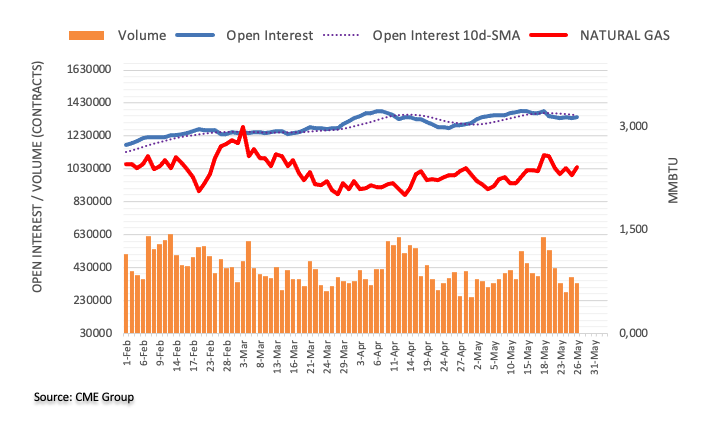
Considering advanced prints from CME Group for natural gas futures markets, open interest remained choppy and increased my almost 7K contracts last Friday. Volume, on the other hand, dropped by nearly 41K contracts, partially reversing the previous daily build.
Natural Gas remains stuck within the multi-week range
Prices of natural gas reversed the previous daily pullback and printed modest gains at the end of last week. The move was on the back of rising open interest and declining volume, which leaves the current side-lined pattern well in place for the time being.
USD/CNH could lose some upside momentum once 7.0500 is cleared, argue UOB Group’s Economist Lee Sue Ann and Markets Strategist Quek Ser Leang.
Key Quotes
24-hour view: “We highlighted last Friday that ‘conditions are deeply overbought and USD is unlikely to advance much further’ and we expected USD to trade in a range between 7.0700 and 7.1000. USD rose close to the top of the expected range (high of 7.0976) and then sold off sharply to a low of 7.0585. Upward pressure has eased and conditions remain overbought. Today, USD is likely to trade sideways in a range of 7.0600/7.0930.”
Next 1-3 weeks: “Last Friday (26 May, spot at 7.0885) we highlighted that while the USD strength that started more than two weeks ago is intact, conditions are deeply overbought and 7.1200 may not come into view so soon. USD rose slightly above a key resistance level of 7.0960 (high of 7.0976) and then pulled back sharply to a low of 7.0585. The price actions resulted in an ‘outside reversal day’. This coupled with overbought conditions suggests the chance for USD to rise to 7.1200 is low. However, only a break of the ‘strong support’ at 7.0500 (no change in level) would indicate the USD is not advancing further.”
Economists at MUFG Bank discuss when the Bank of Japan could remove YCC as a policy tool.
Falling inflation and yields globally will likely offer the BoJ the time to act
“Market expectations on the timing of a YCC change have been pushed back following Governor Ueda’s dovish communications following his first BoJ meeting in April. But we maintain that YCC has passed its sell-by-date and while it remains unclear whether price stability at 2% can be achieved, the BoJ will still move to widen the band or scrap it completely.”
“The BoJ will want to avoid a similar outcome to the RBA and will likely move to abandon YCC at a point when markets are not speculating on a move. That could mean YCC ends as global yields decline later this year as inflation risks recede. In such a scenario, USD/JPY will likely be falling.”
“The BoJ may well decide to scrap YCC when the markets least expect it and speculation is low. So falling inflation and yields globally will likely offer the BoJ the time to act.”
Why will inflation fall so much faster in the United States than in the Eurozone? Analysts at Natixis explain the reasons for this asymmetry between the inflation dynamics in the US and the Eurozone.
Four reasons for the different inflation dynamics in the US and the Eurozone
“We can expect inflation excluding energy and food to fall below 3% in the United States by the end of 2023, while it will probably still be higher than 5% in the Eurozone.”
“We see four reasons to expect inflation excluding energy and food to be significantly higher in the Eurozone than in the United States at the end of 2023. 1. Rising profit margins for Eurozone companies, while they are falling in the US. 2. The slight slowdown in wages in the US, while they are accelerating in the Eurozone. 3. The expected drastic slowdown in US rents, given their correlation with real estate prices, while they are accelerating slightly in the Eurozone. 4. The more restrictive monetary policy in the US than in the Eurozone.”
- EUR/USD treads water around 1.0720 on Monday.
- The greenback looks directionless as well despite debt ceiling deal.
- Trading conditions are expected to remain thin due to US holiday.
A pretty quiet start of the new trading week sees EUR/USD wobbling around the 1.0720/30 region so far.
EUR/USD looks at risk trends, US data
After bottoming out in multi-week lows just pips above the key 1.0700 mark on Friday, EUR/USD manages to regain some composure and navigates the low-1.0700s on Monday on the back of the generalized lack of direction in the global markets.
Indeed, trade conditions and volatility are expected to remain scarce on Monday in response to the inactivity in the US markets due to the Memorial Day holiday.
No major reaction in the FX world following the deal around the USD debt ceiling issue so far, although European stock markets have opened the session in an optimistic fashion.
Furthermore, investors are extensively hopeful that the arrangement to raise the U.S. debt ceiling will pass a separated Congress. This view comes after President Biden and House Speaker McCarthy agreed throughout the end of the week to raise the debt ceiling and stay away from a very first government default.
No data releases are due in the US and the Euroland on Monday.
What to look for around EUR
EUR/USD’s sell-off seems to have met some decent contention around the 1.0700 neighbourhood so far.
In the meantime, the pair’s price action is expected to closely mirror the behaviour of the US Dollar and will likely be impacted by any differences in approach between the Fed and the ECB with regards to their plans for adjusting interest rates.
Moving forward, hawkish ECB-speak continue to favour further rate hikes, although this view appears in contrast to some loss of momentum in economic fundamentals in the region.
Key events in the euro area this week: EMU Final Consumer Confidence, Economic Sentiment, Industrial Sentiment (Tuesday) – Germany Unemployment Change, Unemployment Rate, Flash Inflation Rate, ECB Lagarde (Wednesday) – Germany Retail Sales/Final Manufacturing PMI, EMU Final Manufacturing PMI, Flash Inflation Rate, ECB Lagarde, ECB Accounts (Thursday).
Eminent issues on the back boiler: Continuation of the ECB hiking cycle in June and July (and September?). Impact of the Russia-Ukraine war on the growth prospects and inflation outlook in the region. Risks of inflation becoming entrenched.
EUR/USD levels to watch
So far, the pair is gaining 0.04% at 1.0726 and a break above 1.0814 (100-day SMA) would target 1.0880 (55-day SMA) en route to 1.1000 (round level). On the other hand, immediate contention aligns at 1.0701 (monthly low May 26) seconded by 1.0516 (low March 15) and finally 1.0481 (2023 low January 6).
Economists at MUFG Bank analyze EUR/USD outlook.
ECB caution coupled with falling inflation means higher real yields
“The level of real yields should begin to pick up again in the Eurozone relative to the US. The ECB is likely to vote for rates hikes at the next two meetings even as inflation shows signs of easing which should be EUR supportive.”
“The primary risk to the view comes on the US side and if economic activity shows limited signs of further slowdown, there are risks of further declines in EUR/USD. Also, a worse than expected global backdrop could see manufacturing activity in Germany influence the broader economy more than expected.”
“But we maintain our assumption that growth in Germany and the Eurozone shows some modest rebound which will contrast to the deceleration in US economic activity as we move toward recessionary conditions by year-end.”
The continuation of the upside momentum could push USD/JPY beyond the 141.00 mark in the short-term horizon, according to UOB Group’s Economist Lee Sue Ann and Markets Strategist Quek Ser Leang.
Key Quotes
24-hour view: “Last Friday, we highlighted that USD could rise further to 140.50 before the risk of a pullback increases. We stated, ‘141.00 is highly unlikely to come into view today’. Our view was not wrong as USD rose to a high of 140.72 before closing on a firm note at 140.62 (+0.41%). USD continues to rise in early Asian trade, and while it could break above 141.00, it is unlikely to threaten the next resistance at 141.55. On the downside, a breach of 140.00 (minor support is at 140.35) suggests USD is not rising further.”
Next 1-3 weeks: “In our update from last Friday (26 May, spot at 140.00), we indicated the outlook for USD is still positive even though 141.00 may not come into view so soon. We did not expect USD to rise quickly to 140.72. USD extended its advance in early Asian trade today and the increased momentum indicates that a breach of 141.00 will not be surprising. The next level to focus on is 142.00; this level is a solid long-term resistance level and might not break (there is another minor resistance at 141.55). Overall, only a breach of 139.30 (‘strong support’ level was at 138.55 last Friday) would indicate that the USD strength that started two weeks ago has run its course.”
CME Group’s flash data for crude oil futures markets noted traders scaled back their open interest positions by around 2.6K contracts after four consecutive daily builds on Friday. In the same line, volume reversed three straight daily advances and went down by nearly 450K contracts.
WTI: Further consolidation in store
Friday’s bounce in prices of WTI was amidst shrinking open interest and volume, removing strength from the continuation of the rebound at least in the very near term. That said, the commodity is likely seen maintaining the current consolidation range for the time being. Gains, in the meantime, appear limited above the $74.00 mark per barrel so far.
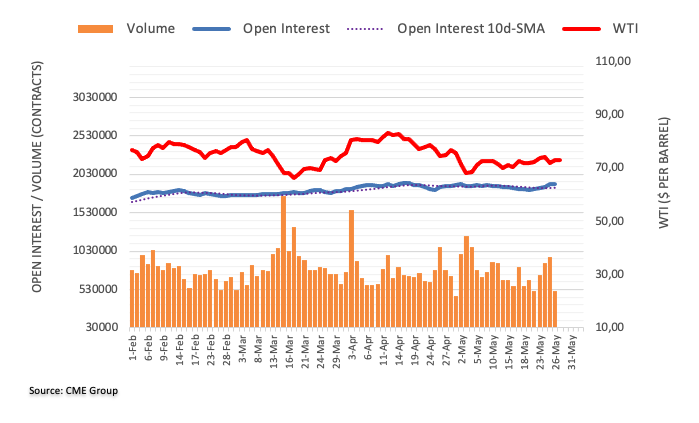
Economists at Credit Suisse have increased their BoE terminal rate forecast to 5% due to the beat in UK inflation.
Mild recession should allow the BoE to pause in August
“We have increased our BoE terminal rate forecast from 4.75% to 5.0%. We now expect two more 25 bps hikes from the BoE (in June and August), compared with one before and no rate cuts in 2023. This is driven by the upside surprise in UK inflation.”
“We have revised up our 2023 inflation forecast from 7.0% to 7.2% and 2024 inflation forecast from 2.2% to 2.3%. We expect core inflation to remain sticky around the 6.5% mark in H1 2023 (compared with 6.2% before) and fall convincingly only in H2 to close to 5% by end-2023 (with headline inflation falling to 4%).”
“But we expect the BoE to hike rates to less than market pricing (which has peak rates at 5.4%). Our expectation is for headline inflation to continue to fall and for some of the strength in core inflation to reverse in the coming prints. We also expect a mild recession that should allow the BoE to pause in August (earlier than market pricing).”
There is still scope for AUD/USD to drop to the mid-0.6400s in the next few weeks, comment UOB Group’s Economist Lee Sue Ann and Markets Strategist Quek Ser Leang.
Key Quotes
24-hour view: “Last Friday, we held the view that AUD ‘could weaken further but severely oversold conditions suggest it is unlikely to threaten 0.6450 today’. We stated, ‘Resistance is at 0.6525, followed by 0.6545’. Our view for GBP to weaken did not quite materialize as it eked out a fresh low of 0.6490 and then rebounded to 0.6544 before closing at 0.6518 (+0.18%). AUD appears to have moved into a consolidation phase and is likely to trade between 0.6500 and 0.6550 today.”
Next 1-3 weeks: “There is not much to add to our update from last Friday (26 May, spot at 0.6505). As highlighted, the weakness in AUD that started two weeks ago has yet to stabilize. In other words, AUD could weaken further to 0.6450. On the upside, a breach of 0.6590 (no change in ‘strong resistance’ level from last Friday) would suggest the weakness in AUD has stabilized.”
Here is what you need to know on Monday, May 29:
Following the choppy action witnessed ahead of the weekend, financial markets stay relatively calm early Monday amid thin trading conditions. UK markets are closed due to the Spring Bank Holiday and American traders will be enjoying a long weekend on Memorial Day. Later in the week, several high-tier data releases, including European inflation figures and the US jobs report, will likely ramp up volatility.
Over the weekend, US President Joe Biden and Republican House Speaker Kevin McCarthy reached an agreement to temporarily suspend the debt-limit to avoid a US debt default. The House of Representatives and Senate still need to approve the deal, which will suspend the $31.4 trillion debt-ceiling until January 1, 2025, in coming days. The market reaction to this development, however, is likely to be observed early Tuesday when US stock index futures and US bond markets return to action.
In the meantime, the US Dollar Index (DXY) rose 1% last week and registered gains for the third straight week. Early Monday, the DXY fluctuates in a tight channel at around 104.00.
EUR/USD managed to shake off the bearish pressure on Friday but still ended up losing more than 100 pips on a weekly basis. The pair edges slightly higher in the European morning and trades below 1.0750.
GBP/USD seems to have gone into a consolidation phase at around 1.2350 at the beginning of the week following last week's slide.
USD/JPY added nearly 300 pips last week and registered its highest weekly close since October above 140.00. The pair moves up and down in a narrow band near 140.50 in the European morning. In the early Asian session on Tuesday, April Unemployment data from Japan will be looked upon for fresh impetus.
Gold price fell sharply last week and touched its weakest level in over two months below $1,940. XAU/USD struggles to gather recovery momentum early Monday and continues to trade below $1,950.
Bitcoin rose nearly 5% on Sunday and broke out of the two-week-old trading channel. BTC/USD, however, lost its traction after meeting resistance at $28,500 early Monday and retreated below $28,000. Following a quiet start to the weekend, Ethereum gathered bullish momentum and advanced to a fresh three-week high above $1,900 on Sunday before staging a technical correction on Monday.
Economists at Crédit Agricole have revised their USD/JPY forecasts higher following Yen’s weakness in the second quarter.
Surprised by the JPY’s weakness during Q2
“The peak in the Fed Funds rate and the potential of the US economy falling into recession may put downward pressure on USD/JPY. High US rates also risk causing further difficulties for US regional banks, which may bring back a safe-haven bid for the JPY.”
“We are surprised by the JPY’s weakness during Q2. As a result, we revise higher our USD/JPY forecasts, adjusting the end-Q2 forecast from 128 to 134, and the end-2023 forecast from 122 to 128.”
Open interest in gold futures markets dropped for yet another session on Friday, this time by around 12.5K contracts according to preliminary readings from CME Group. Volume followed suit and shrank by nearly 73K contracts after three consecutive daily builds.
Gold appears supported near $1930
Gold prices attempted a decent bounce on Friday. The move, however, was on the back of declining open interest and volume and hints at the likelihood that a sustainable rebound is not favoured in the very near term. So far, the yellow metal seems to have met a decent contention around the $1930 per ounce troy.
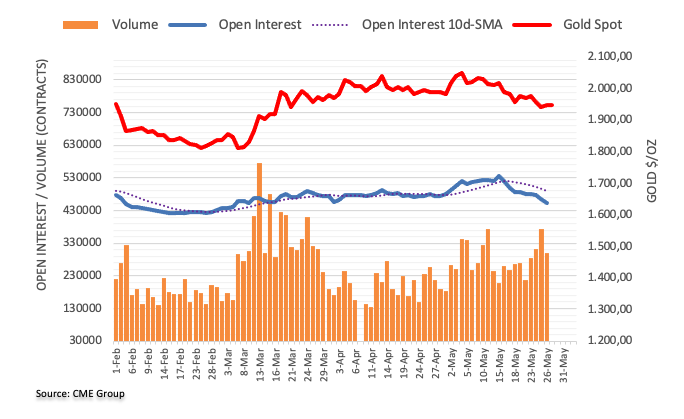
- Gold Price licks its wounds at two-month low amid US Dollar pullback.
- Concerns about US debt ceiling allow XAU/USD to bounce amid holidays in multiple markets.
- Key technical hurdle, fundamental catalysts stand tall to challenge the Gold buyers.
Gold Price (XAU/USD) picks up bids to consolidate the monthly losses, the first in three, amid mixed concerns surrounding the US debt limit extension. Adding strength to the corrective bounce could be the holidays in the major markets including the US, as well as anxiety ahead of this week’s US Nonfarm Payrolls (NFP).
That said, a deal to avoid the US debt payment default lacks unanimous support from some among the Republicans and Democrats, which in turn hints at a political drama over the passage of the key agreement to avoid the looming default on June 05. The same prods the Gold Price buyers.
Apart from that, hawkish hopes from the US Federal Reserve (Fed), backed by upbeat US data and hawkish comments from the Fed policymakers, as well as from Monetary Fund Managing (IMF) Director Kristalina Georgieva, also challenge the Gold price upside.
Hence, XAU/USD traders may witness further consolidation of the latest losses but the bullish trend hinges on the US data, the debt ceiling deal’s passage and the Gold buyer’s ability to conquer the $1,951 resistance.
Also read: Gold Price Forecast: No relief for XAU/USD buyers despite the US debt deal
Gold Price: Key levels to watch
Our Technical Confluence Indicator shows that the Gold price rebound approaches the short-term key upside hurdle surrounding $1,951, comprising Fibonacci 38.2% on one day and the previous monthly low.
In a case where the XAU/USD remains firmer past $1,951, a convergence of the 5-DMA, previous daily low and Pivot Point one-day R1, close to $1,958, can prod the Gold buyers before giving them control.
It should be noted that 200-HMA, Fibonacci 61.8% on one-week and Pivot Point one-day R2 together constitute $1,968 as the last defense of the Gold sellers.
On the flip side, a joint of the Fibonacci 61.8% on one-day and Pivot Point one-month S1 offers short-term key support near $1,945 ahead of highlighting the previous daily low and Pivot Point one-day S1, close to $1,938.
Following that, the Pivot Point one-week S1 may check the Gold sellers around $1,928 ahead of directing them to the $1,900 round figure.
Here is how it looks on the tool
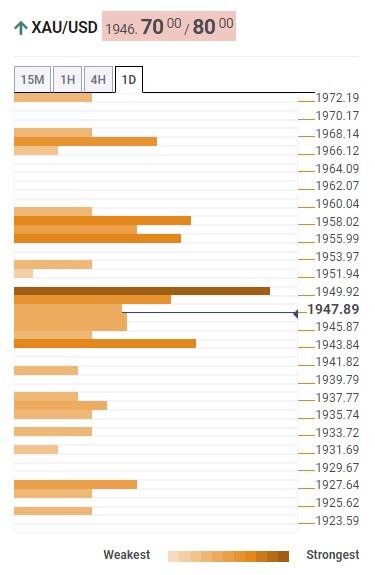
About Technical Confluences Detector
The TCD (Technical Confluences Detector) is a tool to locate and point out those price levels where there is a congestion of indicators, moving averages, Fibonacci levels, Pivot Points, etc. If you are a short-term trader, you will find entry points for counter-trend strategies and hunt a few points at a time. If you are a medium-to-long-term trader, this tool will allow you to know in advance the price levels where a medium-to-long-term trend may stop and rest, where to unwind positions, or where to increase your position size
USD strength has been a headwind for the Kiwi. But economists at ANZ Bank expect the NZD/USD to move back higher if the debt-ceiling issue is resolved.
Carry likely to return to focus if the US debt-ceiling deal gets through Congress
“Our sense is that the consolidation we’re seeing reflects carry, with the NZD the only G10 currency that carries positively against the USD, but as we saw last week, it may be vulnerable to Dollar strength if US bond yields rise a bit more, or if markets continue to fret about getting the debt-ceiling deal through Congress. Assuming the latter is resolved in the nick of time as usual, carry will endure, and that’s one factor behind our expectation of gradual NZD appreciation over 2023.”
“Last week’s MPS was a dovish surprise, but it’s behind us now and markets are looking to the future.”
“Support 0.5750/0.5900/0.6085 Resistance 0.6365/0.6540”
- Natural Gas struggles to defend the first daily gains in three inside bullish chart formation.
- Key SMA, impending bull cross on MACD lure XNG/USD buyers.
- Confirmation of falling wedge becomes necessary to convince Natural Gas bulls.
- Sellers have a bumpy road to travel unless breaking $2.14.
Natural Gas (XNG/USD) Price remains mildly bid around $2.44, recently retreating from the intraday top, during early Monday morning in Europe. In doing so, the XNG/USD struggles to keep the first daily gains in three after snapping the downtrend earlier in the day.
That said, the commodity’s latest weakness could be linked to the inability to keep the bounce off the 200-bar SMA. However, the looming bull cross on the MACD signal and a one-week-old falling wedge bullish chart formation keep the Natural Gas buyers hopeful.
The energy instrument’s latest fall eyes to break the 200-SMA support of $2.41 but the 61.8% Fibonacci retracement level of its early May upside, near $2.39, precedes the stated wedge’s lower line, close to $2.38 at the latest, to restrict short-term downside of the commodity.
Should the XNG/USD defies the bullish chart formation, multiple supports around $2.30-25 and the monthly low of around $2.14 can prod the bears before directing them to the yearly bottom of around $2.11 and then to the $2.00 round figure.
On the flip side, a convergence of the 50% Fibonacci retracement and the wedge’s top line, near $2.48 at the latest, appears the key upside hurdle for the Natural Gas buyers to cross to convince the XNG/USD bulls.
Following that, the previous support line from May 05, close to $2.57 by the press time, could challenge the Natural Gas buyers on their way to the falling wedge confirmation’s theoretical target of around $3.00.
Natural Gas Price: Four-hour chart
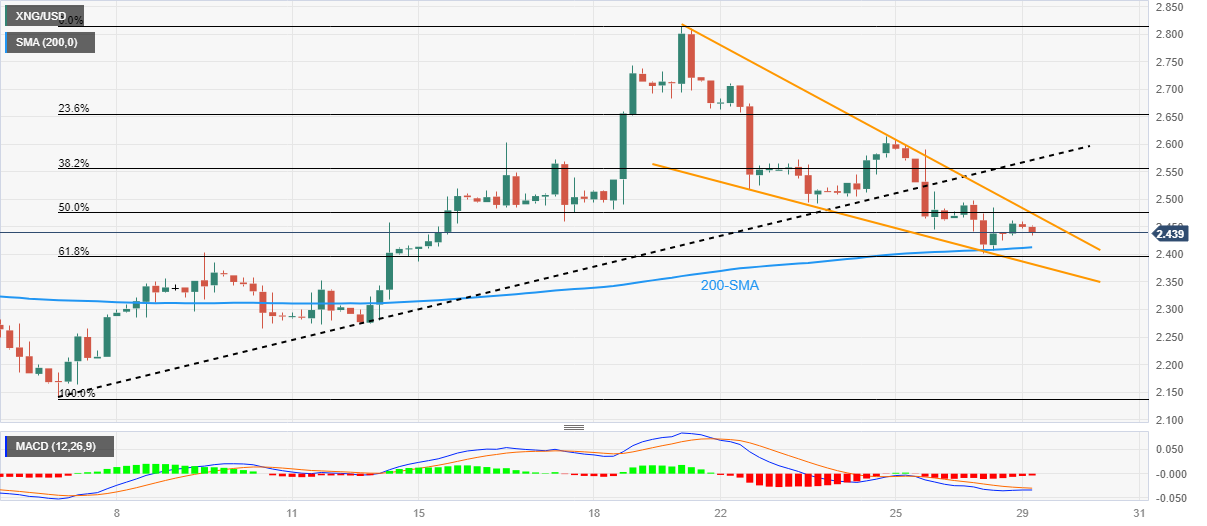
Trend: Recovery expected
The disappearance of productivity gains has led to a stagflationary equilibrium of high inflation and low growth, economists at Natixis report.
Central banks do not know whether focus on fighting inflation or boosting growth
“We believe that the United States and the Eurozone will be characterised by a stagflationary equilibrium due to the lack of productivity gains.”
“The lack of productivity gains generates a sharp rise in unit labour costs, a sharp rise in employment and therefore significant pressure on the labour market, and a slowdown in potential growth. This type of stagflationary equilibrium puts central banks in difficulty, due to the appearance of a conflict between the objective of reducing inflation and the objective of stimulating activity. Both the Fed and the ECB are therefore reluctant to really fight inflation.”
- USD/CAD has shifted its auction below 1.3600 after a modification in the US debt structure.
- Fresh incoming data is advocating for more interest rate hikes by the Federal Reserve.
- Resilience in the Canadian economy could force the Bank of Canada to start hiking interest rates again.
- USD/CAD asset has dropped after facing barricades around the horizontal resistance placed from April 26 high at 1.3651.
USD/CAD has shifted its auction below the round-level support of 1.3600 in the early European session. The Loonie asset has faced intensive selling pressure after a sharp decline in appeal for the US Dollar Index (DXY). The USD Index lost its appeal after US President Joe Biden comprised the scale of spending initiatives proposed for the budget for approving a raise in the United States borrowing cap limit to avoid default. US Treasury Secretary Janet Yellen already warned Congressional leaders that the Federal government could default by June 05 on obligated payments.
S&P500 futures have surrendered at least half of gains generated in early Asia after US President Joe Biden announced that an agreed deal on the US debt-ceiling is going to Congress. Investors have trimmed their positions in US equities as the US markets will remain closed on Monday on account of Memorial Day.
The US Dollar Index (DXY) has refreshed its day’s low at 104.11 after retreating from 104.20. The USD Index is struggling to firm its feet despite chances of further policy-tightening by the Federal Reserve (Fed). The street is anticipating more interest rate hikes from the Federal Reserve after a rebound in consumption expenditure by US households.
Modification in US debt structure trims appeal for USD Index
Vigorous negotiations among White House officials and House of Representatives Kevin McCarthy-led team concluded in early Asia after US President Joe Biden agreed to downsize the scale of spending initiatives proposed for the budget for raising the US debt-ceiling limit. The $31.4 trillion US borrowing limit has received approval for two years and fears of a default situation for the United States economy have faded. The White House agreed to cut spending for the budget but remained stubborn for neither cutting on health coverage nor increasing poverty.
Investors should note that an increase in the US debt-ceiling would attract credit rating agencies, which would downgrade the long-term credibility of the US economy. This may have a significant impact on the US Dollar Index (DXY) and US equities.
Increase in consumer spending to force the Federal Reserve to remain hawkish
The expectations for a pause in the policy-tightening spell by the Federal Reserve (Fed) were extremely solid last week after Federal Reserve chair Jerome Powell announced that more rate hikes are less appropriate as tight credit conditions by US regional banks are weighing significant pressure on inflation.
Firms are struggling to fetch credit for augmenting working capital requirements, which has forced them to rely on less production capacity. However, the recent US Personal Consumption Expenditure (PCE) Price Index (April) showed that households’ spending is resilient despite the higher cost of living. The monthly headline and core PCE Price Index accelerated by 0.4%, higher than anticipated by market participants. Also, US Durable Goods Orders data expanded by 1.1% while the street was anticipating a contraction by 1.0%. Fresh incoming data is advocating for more interest rate hikes by the Federal Reserve.
Canada’s GDP figures in spotlight
A power-pack action is anticipated from the Canadian Dollar, this week, amid the release of the Gross Domestic Product (GDP) data, which will release on Wednesday. As per the preliminary report, monthly GDP (March) is seen contracting by 0.1% vs. an expansion of 0.1% recorded in February. Q1 and annualized GDP are seen significantly expanding by 0.4% and 2.1% respectively vs. a stagnant performance.
Resilience in the Canadian economy could force Bank of Canada (BoC) Governor Tiff Macklem to start hiking interest rates again. Investors should be aware that the Bank of Canada is keeping its interest rates steady from March considering that the current monetary policy is restrictive enough to tame stubborn inflation.
USD/CAD technical outlook
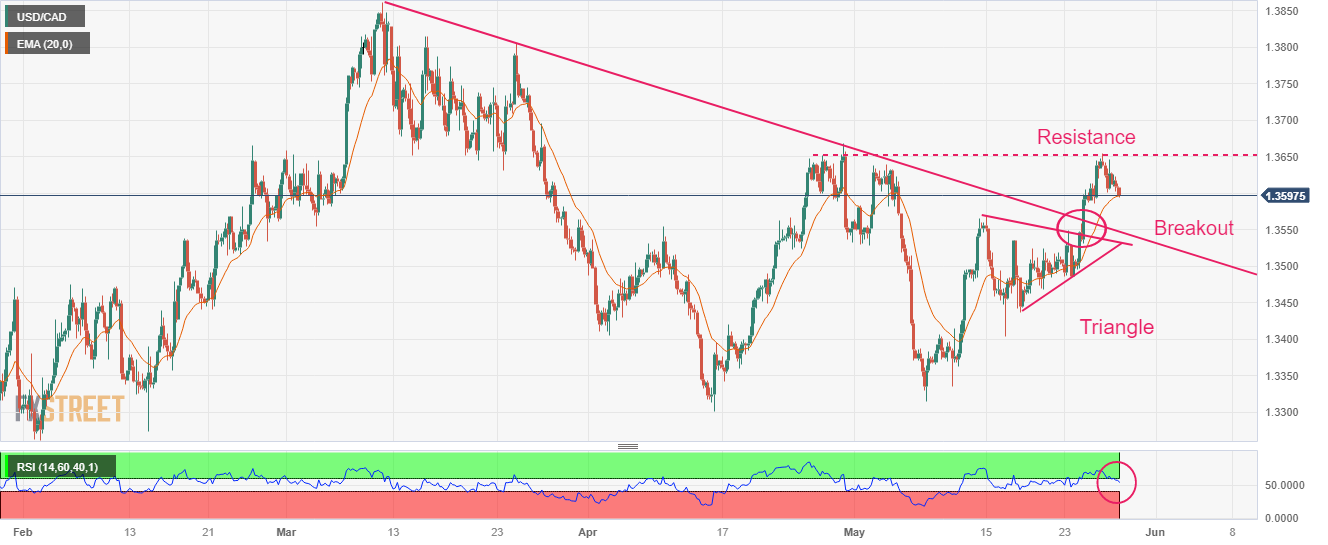
USD/CAD showed a stellar upside action after a breakout of the Symmetrical Triangle formed on a four-hour scale. The US Dollar bulls got strength after climbing above the downward-sloping trendline plotted from March 10 high at 1.3862. After an upside move, the Loonie asset has dropped after facing barricades around the horizontal resistance placed from April 26 high at 1.3651.
The asset has shown a mean-reversion move to near the 20-period Exponential Moving Average (EMA) at 1.3594.
A range shift move by the Relative Strength Index (RSI) (14) into the 40.00-60.00 territory from the bullish zone of 40.00-60.00 indicates a loss in the upside momentum.
In the view of UOB Group’s Economist Lee Sue Ann and Markets Strategist Quek Ser Leang, the negative view around GBP/USD remains intact for the time being.
Key Quotes
24-hour view: “Our view for GBP to break below 1.2300 last Friday was incorrect as it rebounded from 1.2317 to 1.2395 and then dropped back down to close at 1.2351 (+0.24%). The price actions appear to be consolidative and today, we expect GBP to consolidate in a range of 1.2320/1.2390.”
Next 1-3 weeks: “We continue to hold the same view as last Friday (26 May, spot at 1.2320) wherein ‘the 2-week weakness in GBP is intact but it remains to be seen if 1.2175 will come into view this time around’. On a shorter-term note, it is worth noting that both 1.2300 and 1.2250 are strong support levels. On the upside, a breach of 1.2415 (no change in ‘strong resistance’ level) would suggest the GBP weakness has stabilized.”
- USD/CHF remains depressed after reversing from seven-week high.
- US Dollar consolidates monthly gains as US debt ceiling agreement lacks overall acceptance ahead of Congress voting.
- Risk appetite appears slightly positive as off in multiple markets, including Switzerland, limits sentiment.
USD/CHF holds lower ground near the mid-0.9000s amid early Monday morning in Europe. In doing so, the Swiss Franc (CHF) pair struggles to cheer the US Dollar's weakness amid holidays in the US and Switzerland.
That said, the US Dollar Index (DXY) retreats from the highest levels in 10 weeks as the US policymakers unveil initial agreement on the measures to avoid the ‘catastrophic’ default. It’s worth noting, however, that some among the Republicans and Democrats are against the deal and hence signal a bumpy road through Congress even as the June 05 default looms, which in turn puts a floor under the US Dollar and prods the USD/CHF bears.
Not only the mixed concerns on the US debt limited agreement but hawkish concerns about the Federal Reserve’s (Fed) next move, backed by the upbeat US data, also underpin the bullish bias surrounding the Swiss Franc pair.
During the last week, US PMIs, the second estimate of the first quarter (Q1) 2023 Gross Domestic Product (GDP), Durable Goods Orders and the Core Personal Consumption Expenditure (PCE) Price Index for the said month, also known as the Fed’s preferred inflation gauge, marked upbeat details in their latest readings. The same joins US Dollar positive comments from International Monetary Fund Managing (IMF) Director Kristalina Georgieva, as well as some of the Federal Reserve (Fed) officials, to keep the US Dollar bulls hopeful. As a result, the interest rate futures and the CME’s FedWatch Tool show recently increasing support for the Federal Reserve’s (Fed) 25 basis points (bps) rate hike in June.
On a different page, the S&P500 Futures print mild gains and cut the US Dollar’s haven demand while the yields are less active amid off in bond markets in the US.
Looking ahead, risk catalysts may entertain the USD/CHF traders ahead of the Swiss Q1 GDP and the US Nonfarm Payrolls (NFP), scheduled for publishing on Tuesday and Friday. Above all, major attention will be given to the US Congress voting on the debt ceiling deal.
Technical analysis
USD/CHF sellers need validation from a three-week-old ascending support line, close to 0.9030 at the latest.
FX option expiries for May 29 NY cut at 10:00 Eastern Time, via DTCC, can be found below.
- EUR/USD: EUR amounts
- 1.0655 828m
- USD/JPY: USD amounts
- 139.50 409m
- 141.00 406m
- AUD/USD: AUD amounts
- 0.6575 364m
- USD/CAD: USD amounts
- 1.3590 968m
- EUR/GBP: EUR amounts
- 0.8700 779m
- The index appears slightly offered just above 104.00.
- Biden-McCarthy reached a deal to raise the debt limit.
- US markets will be closed on Monday due to Memorial Day holiday.
The greenback gives away part of the recent rally, although it manages well to keep the trade above the 104.00 mark when gauged by the USD Index (DXY) on Monday.
USD Index: Gains capped near 104.40
The index starts the week mildly on the defensive, although still above the 104.00 barrier ahead of the opening bell in Euroland on Monday.
Indeed, the tepid bounce in the risk complex puts the buck under some pressure after market participants continue to digest the recently clinched deal around the US debt ceiling.
On this, and in a significant move forward after months of impasse, House Speaker Kevin McCarthy and President Joe Biden announced on Saturday that they had reached a deal in principle to raise the debt limit days before a possible default. The arrangement would suspend the $31.4 trillion debt limit until January 2025, permitting the public authority to cover its bills. In return, non-defence optional spending would be "roughly flat" at current year levels in 2024, and it would increment by just 1% in 2025.
Once the debt ceiling issue is dealt with, investors are expected to shift their attention to the upcoming FOMC event on June 14, where speculation over another 25 bps rate hike continues to run high.
There will be no data releases across the pond due to the Memorial Day holiday.
What to look for around USD
The index eases some ground after hitting multi-week peaks near 104.40 in the second half of the last week.
In the meantime, rising bets of another 25 bps at the Fed’s next gathering in June appear underpinned by the steady resilience of key US fundamentals (employment and prices mainly) amidst the ongoing rally in US yields and the DXY.
Favouring a pause by the Fed, instead, appears the extra tightening of credit conditions in response to uncertainty surrounding the US banking sector.
Key events in the US this week: FHFA’s House Price Index, CB Consumer Confidence (Tuesday) – MBA Mortgage Applications, Fed’s Beige Book (Wednesday) – ADP Employment Change, Initial Jobless Claims, Final Manufacturing PMI, ISM Manufacturing PMI, Construction Spending (Thursday) – Nonfarm Payrolls, Unemployment Rate (Friday).
Eminent issues on the back boiler: Debt ceiling. Persistent debate over a soft/hard landing of the US economy. Terminal Interest rate near the peak vs. speculation of rate cuts in late 2023/early 2024. Fed’s pivot. Geopolitical effervescence vs. Russia and China. US-China trade conflict.
USD Index relevant levels
Now, the index is down 0.10% at 104.12 and faces the next support at the 100-day SMA at 102.86 seconded by the 55-day SMA at 102.44 and finally 101.01 (weekly low April 26). On the flip side, the surpass of 104.31 (monthly high May 25) seconded by 105.67 (200-day SMA) and then 105.88 (2023 high March 8).
- GBP/USD grinds near intraday high, extends previous day’s rebound from two-month low.
- Convergence of 50-EMA, 13-day-old descending trend line challenges Cable pair buyers.
- Downbeat RSI underpins corrective bounce off 100-EMA, ascending trend line from last November also checks Pound Sterling bears.
GBP/USD pares monthly losses, the first in three, around 1.2360 during early Monday as markets in the UK and the US are off for the Memorial Day holiday. In doing so, the Cable pair extends the previous day’s recovery from the last levels since early April as the US Dollar retreats from a multi-day high despite the Biden-McCarthy deal on debt ceiling extension.
Also read: GBP/USD recovers from 1.2350 as USD Index drops amid US debt-ceiling raise approval
That said, the below 50 levels of the RSI line, placed at 14, joins the 100-Exopnential Moving Average (EMA) to put a floor under the Pound Sterling pair around the 1.2300 round figure.
Even so, the bearish MACD signals and the 1.2400 resistance confluence, including the 50-EMA and a two-week-old descending trend line, restrict immediate upside moves of the GBP/USD pair.
Following that, the tops marked market during late 2022 and in the last month, around 1.2440 and 1.2585 in that order, could act as the final defense of the Cable bears.
On the contrary, a downside break of the 100-EMA level surrounding 1.2300 isn’t an open invitation to the Pound Sterling bears as an upward-sloping support line from November 2022, close to 1.2230 could restrict further downside of the pair.
Though, a clear downside break of the 1.2230 support won’t hesitate to challenge the 1.2000 round figure on its way to meet early 2023 low surrounding 1.1840.
GBP/USD: Daily chart
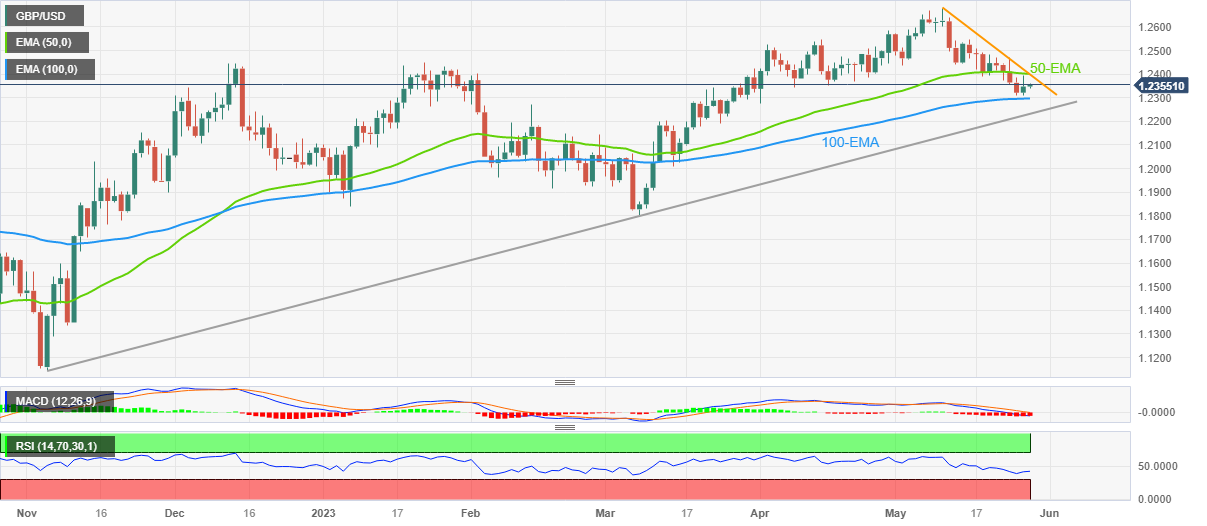
Trend: Limited recovery expected
UOB Group’s Economist Lee Sue Ann and Markets Strategist Quek Ser Leang suggest a drop to 1.0650 and below seems not favoured in EUR/USD for the time being.
Key Quotes
24-hour view: “We highlighted last Friday that EUR ‘could dip below 1.0700 but it is unlikely to threaten the next support at 1.0650’. We added, ‘a breach of 1.0760 would indicate that EUR is not ready to head below 1.0700’. Instead of dipping below 1.0700, EUR rose to 1.0758, dropped to 1.0700, and then rebounded to close little changed at 1.0724 (+0.05%). Downward pressure has eased and EUR is unlikely to weaken much further. Today, we expect EUR to trade sideways, likely between 1.0700 and 1.0750.”
Next 1-3 weeks: “Our update from last Friday (26 May, spot at 1.0725) still stands. As highlighted, the selloff in EUR that started about 2-1/2 weeks ago appears to be overextended, both in terms of time and price. While EUR could still drop below the major support at 1.0700, it remains to be seen if it has enough momentum to break clearly below the next support at 1.0650. All in all, only a breach of 1.0775 (‘strong resistance’ level was at 1.0790 last Friday) would suggest that the weakness in EUR has stabilized.”
- AUD/USD has shown a recovery move from below 0.6530 amid a decline in appeal for the USD Index.
- Speaker McCarthy agreed for raising the US borrowing cap limit as US Biden got ready for compromise spending initiatives for the budget.
- Australian retail demand remained stagnated as higher interest rates and sky-rocketing cost of living have trimmed their pockets.
The AUD/USD pair has shown a solid recovery from below 0.6530 amid a sheer sell-off in the US Dollar Index (DXY). The Aussie asset is aiming to recapture its immediate resistance of 0.6544 as the appeal for risk-perceived currencies has improved dramatically.
S&P500 futures have surrendered significant added posted in early Asia as the demand for US equities has dropped after Republicans agreed on modifying United States debt dynamics to avoid a default situation. House of Representatives Kevin McCarthy agreed for raising the US borrowing cap limit as US President Joe Biden got ready for compromising spending initiatives for the budget. The approval for an increase in the current $31.4 trillion US debt limit has come for two years.
The USD Index has displayed a perpendicular fall after retreating from the crucial resistance of 104.20. More downside for the USD index is anticipated as more liquidity flush into the economy would undermine the appeal of the USD Index.
Meanwhile, investors are not focusing on rising expectations of more interest rate hikes by the Federal Reserve (Fed). Fed chair Jerome Powell is expected to raise rates further despite announcing that tight credit conditions by US regional banks are weighing on inflationary pressures. Households’ spending has increased sharply in April, indicating some persistence in inflation, which could diminish the impact of the interest rates raised yet.
The Australian Dollar is expected to remain on the tenterhooks as the street is mixed over the interest rate decision by the Reserve Bank of Australia (RBA), which is scheduled for next week. Households’ retail demand remained stagnated in April as higher interest rates and sky-rocketing cost of living have trimmed their pockets. Therefore, RBA Governor Philip Lowe could look for keeping interest rates steady.
- GBP/JPY retreats from the highest levels since February 2016 as traders pare recent gains amid UK holiday.
- Off in major bond markets, recently hawkish BoJ concerns versus doubts BoE hawks prod pair buyers.
- Risk catalysts are important for clear directions, US debt limit passage is the key.
GBP/JPY bulls take a breather at seven-year high as the UK markets are off due to Memorial Day on Monday, allowing the cross-currency buyers to pare recent gains around 173.50 amid a sluggish start to the key week.
That said, the quote’s latest pullback from the highest levels since February 2016 takes clues from the market’s mixed sentiment, as well as recent hawkish concerns about the Bank of Japan (BoJ). Also exerting downside pressure on the GBP/JPY is the doubt on the Bank of England’s (BoE) capacity to defend the rate hike bias.
The US policymakers’ initial agreement to avoid the debt payment default allows the markets to remain optimistic, favoring the pair’s upside momentum. However, some of the leftists and rightists are against the compromises involved to reach the much-awaited deal, which in turn prods the positive vibes from the development as the agreement needs to pass through the House on Wednesday and the Senate by June 05 to avoid the looming ‘catastrophic’ default.
Elsewhere, Friday’s mostly upbeat UK Retail Sales figures struggle to back the BoE hawks amid looming economic fears and recent easing in the inflation numbers. Furthermore, expectations of the BoJ’s higher rates in the future also weigh on the GBP/JPY price amid the sluggish session.
On a different page, Friday’s retreat in the US Treasury bond yields from a 10-week high also exerts downside pressure on the GBP/JPY price amid a sluggish session.
Moving on, the GBP/JPY traders should pay attention to the risk catalysts, mainly to the headlines about the US debt ceiling deal passage and the central bank clues.
Technical analysis
Although overbought RSI hints at the further pullback in GBP/JPY price, buyers remain hopeful unless the quote stays beyond a seven-month-old previous resistance line, around 172.50 by the press time.
- Gold price is facing delicate hurdles around $1,945.00 despite the USD Index has retreated from 104.20.
- A downgrade in the US long-term credibility would have a negative impact on the USD Index and US equities.
- Gold price is defending its cushion near horizontal support plotted from $1.937.39.
Gold price (XAU/USD) is facing fragile barricades around $1,945.00 in the Asian session. The precious metal is expected to move higher as the US Dollar Index (DXY) has retreated after a pullback move to near 104.20. The approval of a raise in the US debt-ceiling has pushed the USD index under pressure.
There is no denying the fact that the United States economy will attract a downgrade in its long-term credibility by credit rating agencies as higher debt increases the default chances of a nation. This would have a negative impact on the US Dollar Index and US equities, however, Gold would be considered a safe-haven. Therefore, the upside bias for the Gold price looks extremely solid.
S&P500 futures have surrendered the majority of gains added in early Asia. Investors should note that US markets are closed on Monday on account of Memorial Day, therefore, investors could remain risk-averse ahead.
Meanwhile, fears of more interest rate hikes by the Federal Reserve (Fed) could put some pressure on the Gold price. Rising consumer spending is advocating persistence in the US inflation, which could force the Fed not to halt its policy-tightening spell. This week, the US Employment data will keep investors’ busy as it will provide a base for June’s monetary policy meeting.
Gold technical analysis
Gold price is defending its cushion near horizontal support plotted from March 15 high at $1.937.39 on a four-hour scale. The precious metal is auctioning in a Falling Channel in which each pullback is considered a selling opportunity by market participants.
The 20-period Exponential Moving Average (EMA) at $1,952.38 is consistently barricading the Gold bulls from making any recovery.
Meanwhile, the Relative Strength Index (RSI) (14) is looking to shift its oscillation in the 40.00-60.00 range from the bearish range of 20.00-40.00, which indicates that the downside momentum has faded.
Gold four-hour chart
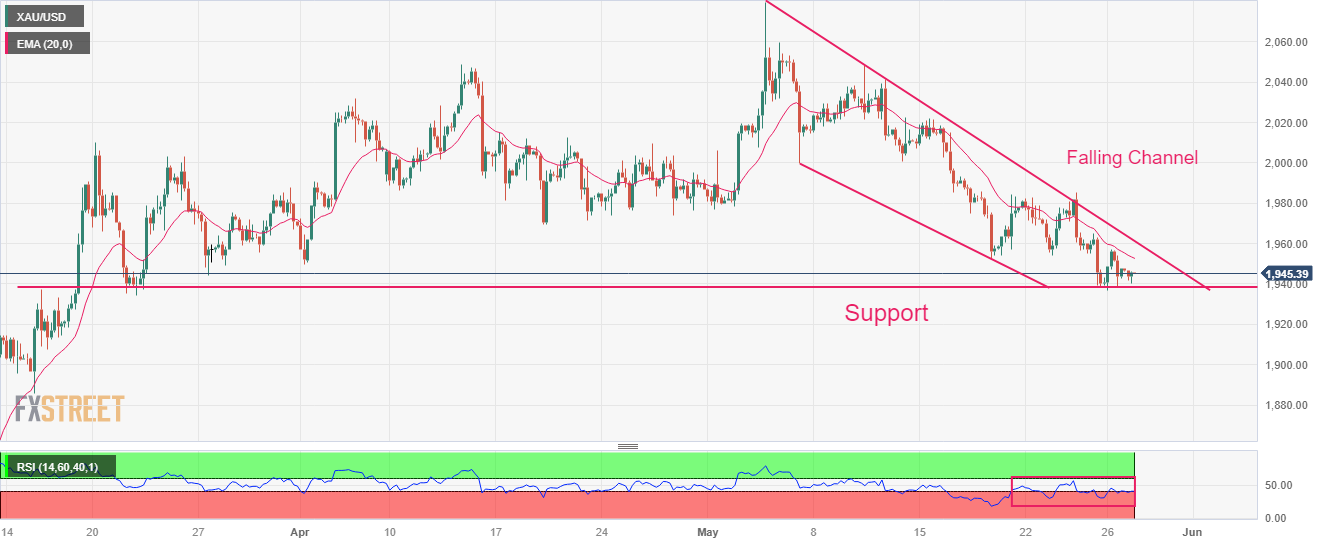
- USD/INR is making efforts in defending its immediate support of 82.50 amid a subdued USD Index.
- The USD Index could get a booster shot as investors are anticipating a continuation of the interest rate hike regime from the Fed.
- USD/INR has delivered a breakdown of the Head and Shoulder chart pattern.
The USD/INR pair is making efforts in defending its immediate support of 82.50 in the Asian session. The asset is expected to remain on the tenterhooks despite the US Dollar Index (DXY) having shown a pullback move to near 104.20. However, the pullback move has come after a sheer sell-off post-approval of a raise in the US debt-ceiling proposal.
Demand for US equities has trimmed after the bipartisan between the White House and Republicans as in the longer term it would impact the credibility of the United States economy due to higher debt on the balance sheet. Meanwhile, the USD Index could get a booster shot as investors are anticipating a continuation of the interest rate hike regime from the Federal Reserve (Fed).
On the Indian Rupee front, investors are shifting their focus towards the interest rate decision by the Reserve Bank of India (RBI), which will be announced next week.
USD/INR has delivered a breakdown of the Head and Shoulder chart pattern on an hourly scale, which indicates a long consolidation in which inventory shifts from institutional investors to retail participants. The 50-period Exponential Moving Average (EMA) at 82.65 is acting as a barricade for the US Dollar bulls.
The Relative Strength Index (RSI) (14) has shifted into the bearish range of 20.00-40.00, showing signs of bearish momentum.
Going forward, a downside move below May 24 low at 82.50 will further drag the asset toward 29 September 2022 high at 82.22. A slippage below the latter will further drag the asst toward the round-level support at 82.00.
In an alternate scenario, a decisive break above May 23 high at 82.97 will drive the asset toward 03 November 2022 high at 83.18 followed by all-time high at 83.42.
USD/INR hourly chart
-638209297379488244.png)
Economists at Goldman Sachs believe that “if the deal passes Congress by June 5, which means the US avoids a default, the reduction in federal spending would trim US GDP by just 0.1% next year.”
On the US Federal Reserve (Fed) interest rates outlook, they noted Friday that “while we continue to expect the Fed to pause deletion in June, this morning’s stronger-than-expected consumer spending and inflation data and the wide range of views by FOMC participants on the appropriate policy path make this a close call.”
- USD/JPY eases from yearly high, snaps three-day uptrend.
- One-week-old resistance line, overbought RSI (14) line challenge Yen pair buyers.
- 12-day-old bullish trend channel, upbeat MACD signals and sustained trading beyond 200-SMA favor buyers.
USD/JPY remains dicey at 140.60 as the Yen pair buyers struggle to extend the previous uptrend heading into Monday’s European session. In doing so, the quote also justifies the overbought RSI (14) line and the quote’s inability to cross a one-week-old ascending resistance line.
Even so, bullish MACD signals and a two-week-old ascending trend channel, as well as the quote’s ability to stay firmer past 200-SMA, keeps the USD/JPY buyers hopeful.
Hence, the quote’s latest pullback remains elusive unless it breaks the 200-SMA support level of 135.75.
Following that, the monthly low o around 133.50 and the 130.00 psychological magnet could act as the last defense of the USD/JPY buyers.
That said, the aforementioned channel’s bottom line and a previous resistance line from May 02, respectively near 139.75 and 139.20, could act as intermediate halts to watch during the Yen pair’s weakness.
Alternatively, an upside break of the weekly resistance line, close to 141.05 at the latest, could propel the USD/JPY towards the aforementioned channel’s peak of near 142.00 However, the six-month high to around 142.25, comprising the late November 2022 peak, can act as the final battle to be won for the Yen pair buyers before retaking the control.
USD/JPY: Four-hour chart
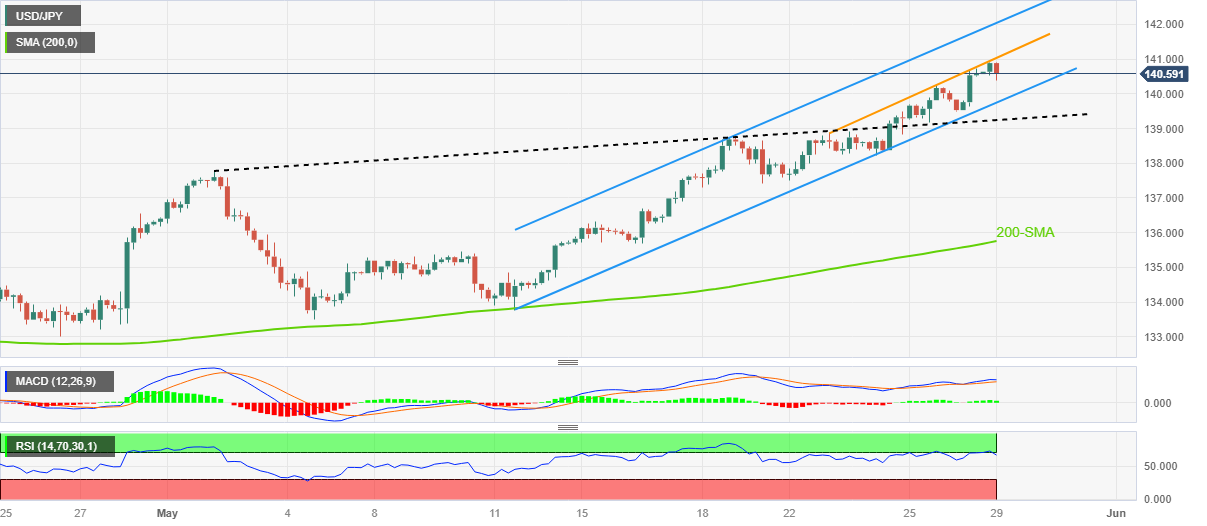
Trend: Bullish
- EUR/USD prints the first daily gain in five around the lowest levels in 10 weeks.
- US Dollar retreats as policymakers deliver debt ceiling agreement, challenges to passage prod the Euro buyers.
- Hawkish Fed bets versus fears of Eurozone recession also exert downside pressure on EUR/USD.
- Holidays in Germany, US to restrict Euro moves ahead of Eurozone inflation, US NFP.
EUR/USD picks up bids to print the first daily gain in five around 1.0730 amid early Monday morning in Europe. In doing so, the Euro pair consolidates the first monthly loss in three amid the market’s cautious optimism about the US policymakers’ ability to avoid the ‘catastrophic’ default. Adding strength to the pair’s positioning could be the month-end resizing amid the holidays in Germany, France, the UK and the US on Monday.
US President Joe Biden and top congressional Republican, as well as the House Speaker, Kevin McCarthy finally agreed over terms to raise the federal government's $31.4 trillion debt ceiling through January 2025 during the weekend.
Following the initial announcements, US President Biden strongly urged both chambers to pass the agreement while McCarthy appears to have no difficulties in getting the deal through the House. However, some of the policymakers have clearly shown their discomfort with the compromises that together tried to avoid the debt payment default, which in turn challenges the market’s positive outlook about the key issue.
Alternatively, the last week’s upbeat prints of the top-tier data including Durable Goods Orders and the Core Personal Consumption Expenditure (PCE) Price Index for the said month, known as the Fed’s preferred inflation gauge, underpin the hawkish Fed bets and weigh on the EUR/USD price. On the same line could be downward revision to the German Q1 2023 growth numbers, which in turn renewed recession fears in the bloc and prod the European Central Bank (ECB) hawks.
Against this backdrop, S&P500 Futures remain mildly bid near the highest levels since August 2022, up 0.30% intraday around 4,225 whereas the bond markets are inactive amid off in multiple key bourses by the press time. With this, the US Dollar Index (DXY) retreats from from a 10-week high and allow the Euro pair sellers to lick their wounds.
Looking ahead, preliminary readings of the German and Eurozone inflation numbers will precede the US jobs report for May, especially the Nonfarm Payrolls (NFP), to direct the short-term EUR/USD moves. However, major attention will be given to the US Congress voting on the debt ceiling deal.
Technical analysis
EUR/USD justifies Friday’s Doji candlestick above the 200-day Exponential Moving Average (EMA), around 1.0685 by the press time. The recovery moves, however, need validation from the 61.8% Fibonacci retracement of its March-April upside, near 1.0740 at the latest.
- USD/CAD holds lower ground during two-day retreat from monthly high.
- Bearish MACD signals add strength to pullback moves targeting previous resistance line.
- Loonie pair’s recovery needs validation from April’s peak.
USD/CAD remains mildly offered near 1.3600 as it defends the previous day’s U-turn from a one-month high during Monday’s sluggish Asian session, especially amid the holidays in the US.
That said, the Loonie pair’s latest weakness justifies its inability to cross a two-month-old descending resistance line, around 1.3650 by the press time. Adding strength to the downside bias are the bearish MACD signals.
With this, the USD/CAD sellers are all set to prod the previous resistance line stretched from early March, close to 1.3550. However, a convergence of the 50-SMA and a three-week-old support line, near 1.3535 at the latest, could challenge the Loonie pair’s further downside.
Even if the quote breaks the 1.3535 support confluence, the 200-SMA level of around 1.3500 can act as the last defense of the USD/CAD buyers before giving control to the Loonie pair bears.
On the contrary, the aforementioned two-month-old resistance line, close to 1.3650, restricts the immediate upside of the pair ahead of the previous monthly high of around 1.3665-70.
Following that, the late March swing high near 1.3700 may act as an additional check for the USD/CAD buyers before targeting the yearly high marked in March around 1.3860.
Overall, USD/CAD is likely to witness further downside but the room towards the south is limited.
USD/CAD: Four-hour chart
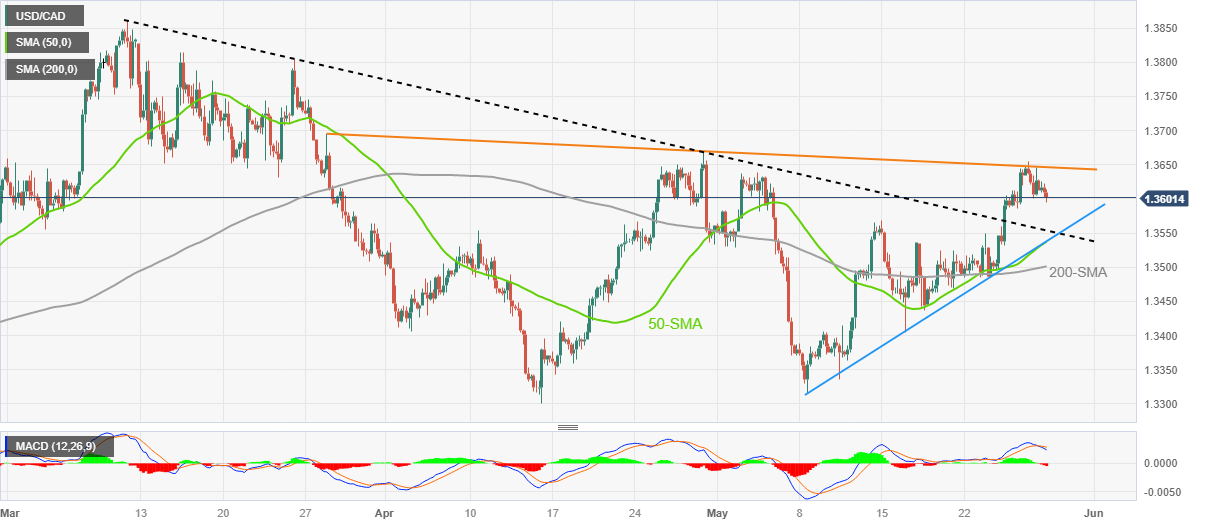
Trend: Limited downside expected
- Market sentiment remains cautiously optimistic even as US President Biden, House Speaker McCarthy unveil debt ceiling extension deal.
- Challenges to deal’s passage from some Democrats and Republicans weigh on risk appetite.
- Pre-NFP anxiety, holidays in major markets also restrict the positive mood.
Risk appetite remains slightly positive on early Monday as market players take a sigh of relief, although for now, amid US policymakers’ announcements of an initial deal to extend the debt ceiling expiration. Even so, concerns that the agreement is yet in the pipeline for being the law and the default looms on June 05 amid dissatisfaction with the deal prod the risk-on mood amid holidays in the US, UK and Germany.
Amid these plays, S&P500 Futures remain mildly bid near the highest levels since August 2022, up 0.30% intraday around 4,225 whereas the bond markets are inactive amid off in multiple key bourses by the press time.
US President Joe Biden and top congressional Republican Kevin McCarthy reached a tentative deal to raise the federal government's $31.4 trillion debt ceiling through January 2025. Following the announcements, US President Biden strongly urged both chambers to pass the agreement while McCarthy appears to have no difficulties in getting the deal through the House. However, some of the policymakers have clearly shown their discomfort with the compromises that together tried to avoid the ‘catastrophic’ default, which in turn challenges the market’s positive outlook about the key issue.
Additionally, upbeat US data and comments from the International Monetary Fund Managing (IMF) Director Kristalina Georgieva, as well as some of the Federal Reserve (Fed) officials, also underpin the hawkish Fed bias and weigh on the sentiment.
That said, US PMIs, the second estimate of the first quarter (Q1) 2023 Gross Domestic Product (GDP), Durable Goods Orders and the Core Personal Consumption Expenditure (PCE) Price Index for the said month, known as the Fed’s preferred inflation gauge, marked upbeat details in their latest readings.
With this, the interest rate futures and the CME’s FedWatch Tool show recently increasing support for the Federal Reserve’s (Fed) 25 basis points (bps) rate hike in June.
Elsewhere, China’s improvement in Industrial Profits and the global central bankers’ optimism, as well as upbeat comments from the IMF, keeps the market players on a dicey floor.
Moving on, the US jobs report for May, especially the Nonfarm Payrolls (NFP) will be the key data to watch for the market players for clear directions. However, major attention will be given to the US Congress voting on the debt ceiling deal.
Als read: Gold Price Forecast: XAU/USD bears approach $1,930 support on US debt ceiling extension, NFP eyed
| Raw materials | Closed | Change, % |
|---|---|---|
| Silver | 23.315 | 2.59 |
| Gold | 1946.67 | 0.28 |
| Palladium | 1418.56 | 0.97 |
- NZD/USD has stretched its recovery above 0.6060 amid a sheer sell-off in the USD Index.
- An increase in $31.4 trillion US borrowing limit is expected to attract downgrades from credit rating firms for US long-term sovereignty.
- NZD/USD has shown a responsive buying move after dropping below 0.6040 but is likely to face stiff barricades around 0.6110.
The NZD/USD pair has extended its recovery above 0.6060 in the Asian session. The Kiwi asset is expected to stretch its rebound move further as the approval for the US debt-ceiling raise has weighed heavily on the US Dollar Index (DXY).
Gains in the S&P500 futures have trimmed sharply after the approval of the raise in the US debt-ceiling. An increase in the $31.4 trillion US borrowing limit is expected to attract downgrades from credit rating firms for US long-term sovereignty. This will weigh heavily on the US Dollar Index and US equities ahead.
On a broader note, the New Zealand Dollar remained under pressure despite the Reserve Bank of New Zealand (RBNZ) hiked interest rates by 25 basis points (bps) last week to 5.50%. RBNZ Assistant Governor Karen Silk warned that the central bank must be watchful of over-tightening policy and that it can hold now and sees what develops.
NZD/USD has shown a responsive buying move after dropping below 0.6040 on a two-hour scale. The recovery move by the Kiwi asset has to pass through plenty of filters to build a bullish impression. The recovery move in the Kiwi asset is expected to face stiff barricades around the horizontal resistance plotted from April 26 low at 0.6110.
The 20-period Exponential Moving Average (EMA) at 0.6067 is still acting as a barricade for the New Zealand Dollar bulls.
Meanwhile, the Relative Strength Index (RSI) (14) has attempted a range shift into the 40.00-60.00 territory from the bearish range of 20.00-40.00, which indicates a loss in the downside momentum.
Further extension in recovery above April 26 low at 0.6110 will push the Kiwi asset toward April 27 high at 0.6162 followed by May 12 low at 0.6182.
On the contrary, a downside move below May 26 low at 0.6032 will expose the asset to a fresh six-month low toward the psychological support of 0.6000. A slippage below the latter will further drag the asset toward 11 November 2022 low at 0.5984.
NZD/USD two-hour chart
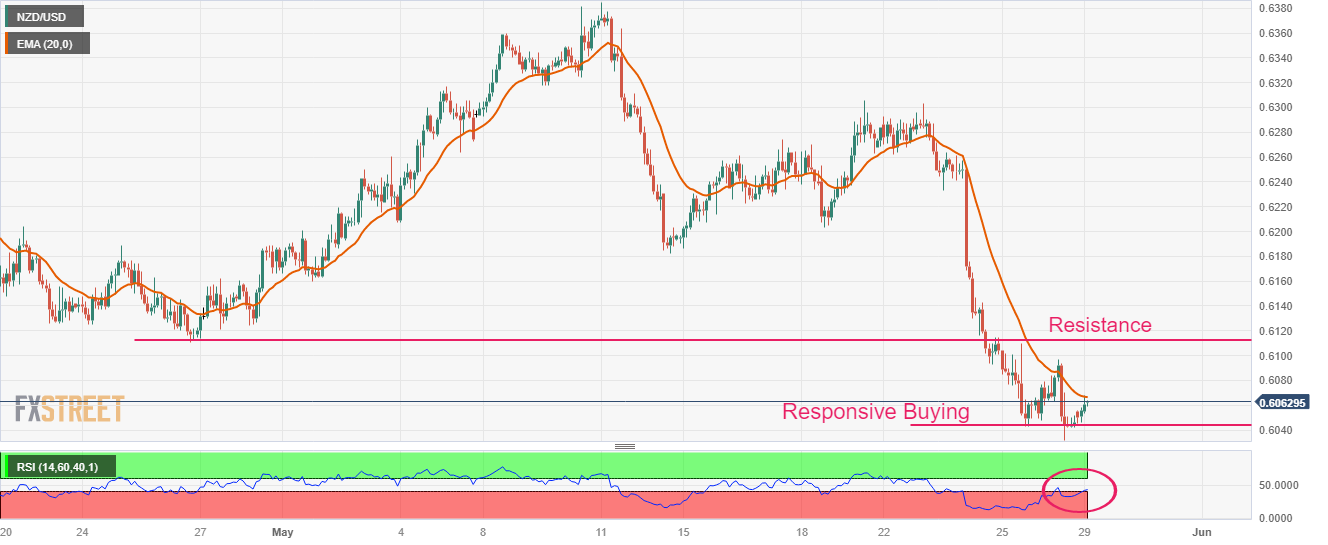
- Silver price fades the previous day’s corrective bounce off two-month low.
- Overbought RSI, looming bear cross on MACD adds strength to bearish bias below 200-HMA.
- Fortnight-old resistance line adds to the upside filters; $23.00 acts as extra support .
Silver price (XAG/USD) remains mildly offered around $23.30 amid early Monday as it consolidates the biggest daily gains in nearly two-month, marked the previous day. In doing so, the bright metal also justifies the market’s rush towards the US Dollar even as the policymakers announced the initial agreement on the US debt ceiling extension.
Also read: US President Biden: This deal is good news for the American people
Also luring the XAG/USD sellers is the RSI (14) line surrounding the overbought territory, as well as the impending bear cross on the MACD indicator.
With this, the Silver Price is all set to test the 100-Hour Moving Average (HMA) support of near $23.20, quickly followed by the $23.00 round figure.
However, the latest swing low of around $22.70, marked the previous day, may challenge the XAG/USD bears afterward.
Meanwhile, the Silver price recovery needs validation from the 200-HMA and a two-week-old descending resistance line, respectively near $23.45 and $23.60.
Even so, the $24.00 threshold and the mid-month swing high of around $24.20 may test the XAG/USD buyers before giving them the control.
Above all, the Silver price remains bearish unless crossing the late April bottom of around $24.50.
To sum up, XAG/USD remains on the bear’s radar even if the commodity sellers lack acceptance of late.
Silver price: Hourly chart
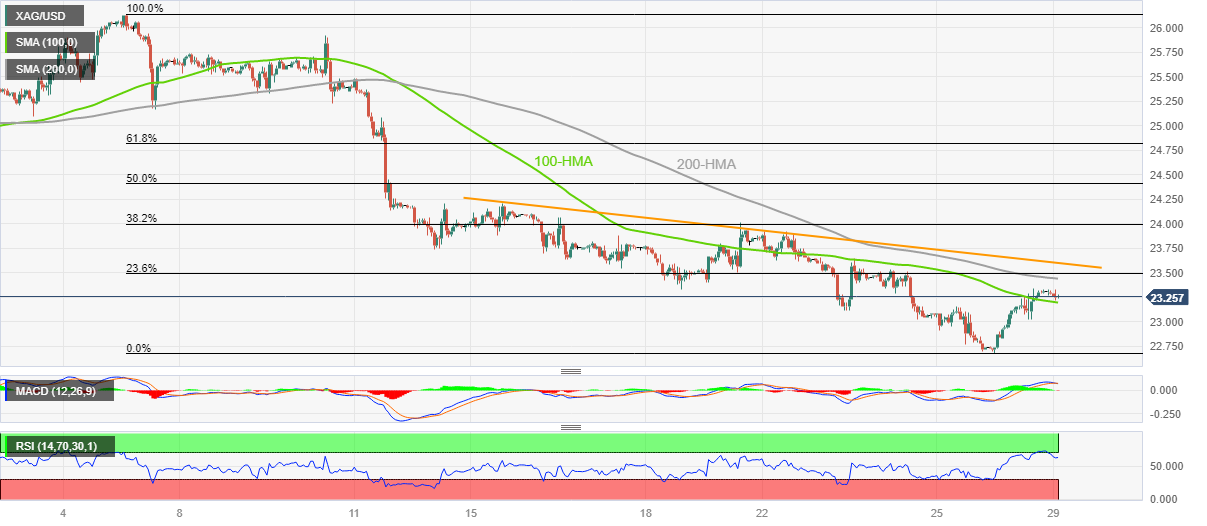
Trend: Further downside expected
- USD/TRY picks up bids to refresh all-time high, reverses Friday’s corrective pullback.
- Erdogan marks more than two decades of leadership with the latest election win.
- Uncertainty about US debt ceiling extension deal also weighs on Turkish Lira.
- Risk catalysts, US NFP eyed for clear directions.
USD/TRY remains mildly bid near the 20.00 psychological magnet on early Monday, adjacent to the all-time high of 20.80 marked the previous day, as the Turkish Lira (TRY) sellers cheer Recep Tayyip Erdogan’s victory in the country's presidential election on Sunday.
As Erdogan advocates for easy rates, his dominance in the nation for more than two decades could allow the TRY bears to keep the reins amid hopes of less-costly funds despite higher inflation.
Official results showed, per Reuters, that Erdogan’s challenger Kemal Kilicdaroglu got 47.9% of the votes while the winner acquires 52.1% of the votes, pointing to a deeply divided nation. In his victory speech, Erdogan acknowledged per Reuters that inflation was the most urgent issue, but said it would also fall, following the central bank's policy rate that was cut to 8.5% from 19% two years ago.
On the other hand, the passage of the US debt ceiling deal to avoid the default prods the US Dollar bulls, as well as the USD/TRY buyers. However, the deal lacks support from some of the extreme leftists and rightists due to the compromise each party had to do to reach the agreement. As a result, the market’s optimism from the deal fades ahead of the key voting on the matter during the week.
Elsewhere, upbeat US data and comments from the International Monetary Fund Managing (IMF) Director Kristalina Georgieva, as well as some of the Federal Reserve (Fed) officials, also favor the USD/TRY bulls.
In the last week, US PMIs, the second estimate of the first quarter (Q1) 2023 Gross Domestic Product (GDP), Durable Goods Orders and the Core Personal Consumption Expenditure (PCE) Price Index for the said month, known as the Fed’s preferred inflation gauge, marked upbeat details in their latest readings.
Against this backdrop, the market sentiment remains mildly positive and helps the AUD/USD to grind higher. With this, Wall Street closed on a positive note while S&P500 Futures print mild gains as it cheers the US debt ceiling deal whereas the holidays in major bourses restrict the bond market moves of late.
Looking ahead, Turkish Quarterly Gross Domestic Product (GDP) and the US jobs report for May will be the key data to watch for the USD/TRY traders. However, major attention will be given to the US Congress voting on the debt ceiling deal.
Technical analysis
Although the overbought RSI conditions challenge the USD/TRY bulls, the pair’s bearish bias remains off the table unless it provides a sustained downside break of the previous resistance line from March, around 19.75 by the press time.
- GBP/USD has recovered amid a sell-off in the USD index after approval of a raise in the US debt-ceiling.
- The US Dollar Index has critically come under pressure as the approval of a higher US debt-ceiling has faded fears of a spike in interest rates.
- BoE Bailey is bound to halve inflation by year-end as promised by UK PM Rishi Sunak.
The GBP/USD pair has attempted a recovery move after trading sideways below 1.2350 in the Asian session. The strength in Cable has come due to a sheer decline in the US Dollar Index (DXY) after the approval of a raise in the US debt-ceiling.
House of Representatives Kevin McCarthy-led Republicans have approved a raise in the $31.4 trillion US borrowing cap for two years as the White House agreed to cut spending for the budget but remained stubborn for neither cutting on health coverage nor increasing poverty.
S&P500 futures have trimmed some gains added in early Asia despite receding fears of a default by the United States Federal on obligated payments.
The US Dollar Index has critically come under pressure as the approval of higher US debt-ceiling has faded fears of a spike in interest rates if the US Treasury had announced a default. Also, an increase in the US debt-ceiling would attract credit rating agencies, which would downgrade the long-term credibility of the US economy. This may have a significant impact on the US Dollar Index (DXY) and US equities.
This week, investors will keep their focus on the United States Automatic Data Processing (ADP) Employment data (May), which will release on Thursday. As per the consensus, the US labor market has witnessed a drop in payroll numbers by 22K vs. the former addition of 296K.
Meanwhile, the Pound Sterling has shown recovery as the Bank of England (BoE) is expected to raise interest rates further knowing the fact that inflationary pressures in the United Kingdom are expected to remain extremely stubborn. BoE Governor Andrew Bailey is bound to halve inflation by year-end as promised by UK PM Rishi Sunak.
Barclays expects the BoE to extend the tightening cycle beyond the June meeting, sees one additional 25bps hike in August - now sees BoE terminal bank rate at 5%.
People’s Bank of China (PBOC) set the USD/CNY central rate at 7.0575 on Monday, versus previous fix of 7.0760 and market expectations of 7.0574. It's worth noting that the USD/CNY closed near 7.0625 the previous day.
"China central bank says to conduct 5 billion yuan 3-month central bank bill swap on May 29," reported Reuters.
"With 2 billion Yuan worth of reverse repos maturing on Monday, China central bank injects 23 billion yuan on a net basis on the day.” said Reuters following the PBOC Fix announcements.
About PBOC fix
China maintains strict control of the yuan’s rate on the mainland.
The onshore yuan (CNY) differs from the offshore one (CNH) in trading restrictions, this last one is not as tightly controlled.
Each morning, the People’s Bank of China (PBOC) sets a so-called daily midpoint fix, based on the yuan’s previous day's closing level and quotations taken from the inter-bank dealer.
- Gold Price fades the previous day’s corrective bounce from nine-week low.
- United States policymakers get a deal to extend debt ceiling but it’s passage through Congress appears challenging.
- Monday’s holiday, light calendar may restrict immediate XAU/USD moves.
- Updates about US House passage of debt ceiling, US Nonfarm Payrolls eyed for clear directions.
Gold Price (XAU/USD) takes offers to refresh intraday low near $1,941 as it fails to cheer the United States policymakers’ initial agreement to avoid the ‘catastrophic’ default on early Monday. In doing so, the XAU/USD takes clues from the uncertainty surrounding the deal’s passage through the US Congress, as well as the hawkish Federal Reserve (Fed) concerns. Additionally, the cautious mood ahead of this week’s US Nonfarm Payrolls (NFP) also favors the Gold sellers.
Gold Price fails to cheer agreement on debt ceiling stretch
Gold price justifies the market’s fears of the United States default, despite the latest agreement on the US debt limited extension. The reason could be linked to some of the policymakers’ support of the deal.
That said, US President Joe Biden and top congressional Republican Kevin McCarthy reached a tentative deal to raise the federal government's $31.4 trillion debt ceiling through January 2025. The deal, however, lacks support from some of the extreme leftists and rightists due to the compromise each party had to do to reach the agreement. It should be noted that the debt ceiling deal needs to pass through the House on Wednesday and the Senate by June 05 to avoid the looming ‘catastrophic’ default. Recently, US President Biden ‘strongly’ urged both chambers to pass the agreement.
Given the optimism surrounding the US debt ceiling deal, coupled with the nearness to short-term key technical support, the Gold sellers should remain cautious ahead of the key United States Nonfarm Payrolls.
United States data, hawkish Federal Reserve bets prod XAU/USD bulls
Apart from the US debt ceiling concerns, upbeat US data and comments from the International Monetary Fund Managing (IMF) Director Kristalina Georgieva also favor the Gold sellers.
In the last week, US PMIs, the second estimate of the first quarter (Q1) 2023 Gross Domestic Product (GDP), Durable Goods Orders and the Core Personal Consumption Expenditure (PCE) Price Index for the said month, known as the Fed’s preferred inflation gauge, marked upbeat details in their latest readings. On Friday, US Durable Goods Orders for April came in better-than-forecast to 1.1% from 3.3% prior, versus -1.0% expected. Further, Nondefense Capital Goods Orders ex Aircraft, also known as the Core Durable Goods Orders, marked upbeat growth of 1.4% compared to -0.2% anticipated and -0.6% previous readings. Additionally, the Core PCE Price Index for the said month rose past market forecasts and previous readings of 0.3% MoM and 4.6% YoY to 0.4% and 4.7% in that order.
The data allowed IMF’s Georgieva to state that the US interest rates will need to be higher for longer. Alternatively, Federal Reserve Bank of Cleveland President Loretta Mester said that the Personal Consumption Expenditures (PCE) Price Index released on Friday underscored the slow progress on inflation. During the weekend, Federal Reserve Bank of Chicago President Austan Goolsbee welcomed the US debt ceiling news while also saying, amid the CBS Show “Face the Nation”, “I try to make it a point not to prejudge and make decisions when you are still weeks out from the meeting."
Given the recently increasing support for the Federal Reserve’s (Fed) 25 basis points (bps) of rate hike in June, the Gold price may witness further downside. However, it all depends upon this week’s key US political drama and the key US NFP.
US Nonfarm Payrolls, House passage of debt limit deal eyed
Looking ahead, Monday’s off in major trading frontiers may allow the Gold Price to consolidate the recent losses but the overall view remains bearish amid the hawkish Fed bets and concerns about the US debt ceiling. Even if the US policymakers avoid the ‘catastrophic’ default, the debt deal will allow the Fed to remain on its preferred plan of “higher for longer rates”, which in turn weighed on the Gold price. That said, this week’s US jobs report for May will also be key to watch on the calendar for clear directions.
Gold price technical analysis
Gold price eases below a three-week-old descending resistance line, around $1,954 by the press time, after falling the last three consecutive weeks.
The XAU/USD retreat ignores the Relative Strength Index (RSI) line’s, placed at 14, downbeat performance in the past few days. However, the bearish signals from the Moving Average Convergence and Divergence (MACD) indicator lure Gold buyers.
Apart from the MACD signals and the immediate resistance line, a convergence of the 21-DMA and 50-DMA, around $1,995 by the press time, quickly followed by the $2,000 round figure, adds to the upside filters for the XAU/USD to cross to convince buyers.
In a case where the Gold price remains firmer past $2,000, the previous monthly high of around $2,050 and the recently flashed record top surrounding $2,080 will be in the spotlight.
On the flip side, a daily closing below the resistance-turned-support line of around $1,954 isn’t an open invitation to the Gold sellers as an upward-sloping trend line from November 2022, close to $1,930, can challenge the bears before giving them control.
To sum up, the Gold Price’s road to bull’s dominance is far from sight.
Gold price: Daily chart
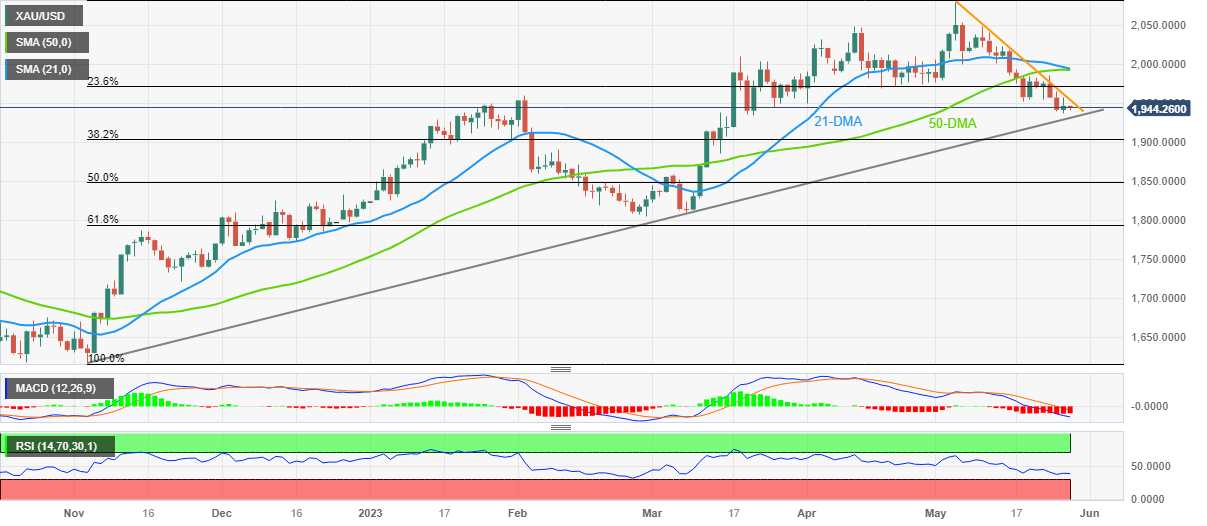
Trend: Limited upside expected
- EUR/USD is trading sideways above 1.0700, and remains lackluster despite approval of the US debt-ceiling raise.
- In spite of the German recession, the ECB is expected to raise interest rates further.
- EUR/USD has slipped below the 61.8% Fibonacci retracement at 1.0738.
The EUR/USD pair is showing a back-and-forth action above the round-level support of 1.0700 in the Asian session. The major currency pair is expected to remain in action as the proposal of raising the $31.4 trillion US borrowing limit has been approved for two years after compromising for the budget’s spending initiatives by Democrats.
The US Dollar Index (DXY) is facing barricades in extending its recovery above 104.30 despite the Federal Reserve (Fed) is expected to continue its policy-tightening regime after observing persistence in US households’ spending.
Despite a record of recession in the German economy after showing contraction in Gross Domestic Product (GDP) numbers consecutively for two quarters, the European Central Bank (ECB) is expected to raise interest rates further to tame stubborn inflation. ECB President Christine Lagarde has already announced that more than one interest rate hike is anticipated to bring down inflation.
EUR/USD has slipped below the 61.8% Fibonacci retracement (plotted from March 15 low at 1.0516 to April 26 high at 1.1095) at 1.0738 on a four-hour scale. The 20-period Exponential Moving Average (EMA) at 1.0740 is acting as a strong barrier for the Euro bulls. The asset is auctioning in a Falling Channel in which each pullback is considered as a selling opportunity by market participants.
The Relative Strength Index (RSI) (14) is oscillating in the bearish range of 20.00-40.00, indicating the continuation of the bearish momentum.
The downside move will resume if the shared currency pair drops below the round-level support of 1.0700. This will drag the asset toward March 13 low at 1.0650 followed by March 03 low at 1.0588.
On the flip side, a recovery move above May 24 high around 1.0800 would push the ball in Euro’s court. A solid recovery above 1.0800 would drive the asset toward May 18 high at 1.0848 and May 16 high at 1.0904.
EUR/USD four-hour chart
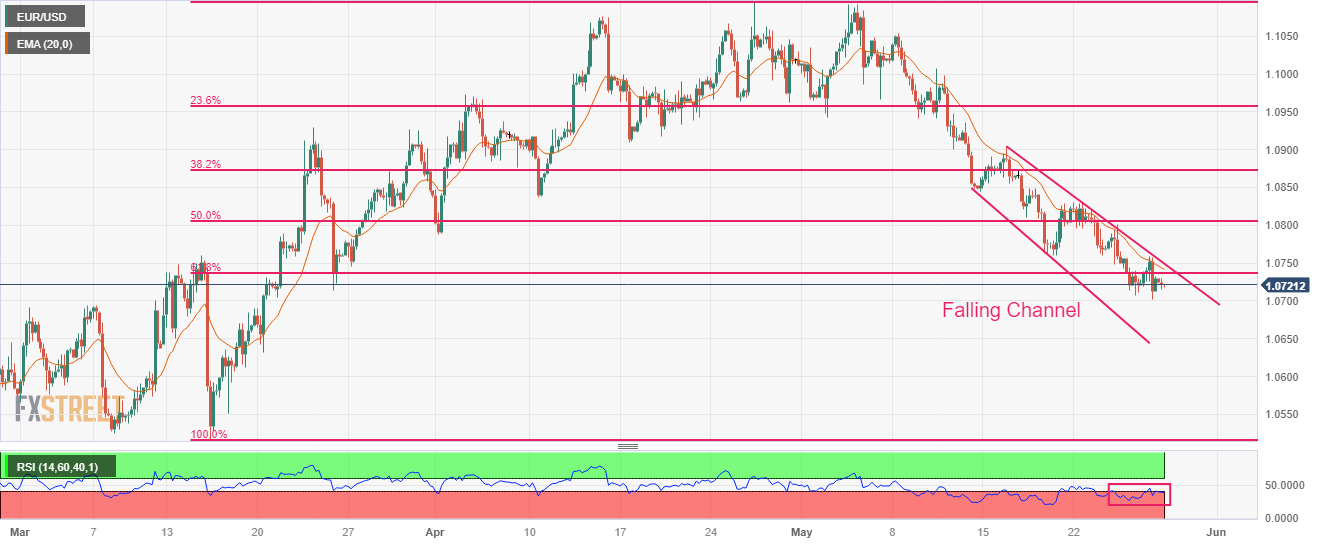
- AUD/USD grinds higher after bouncing off multi-day low the previous day.
- Market sentiment improves as US policymakers reach a deal to avoid default, woes over passage prod optimism.
- US holiday adds strength to the corrective bounce but hawkish Fed bets, upbeat US data keeps Aussie bears hopeful.
AUD/USD picks up bids to extend the previous day’s rebound from the yearly low, mildly bid near 0.6530 by the press time, as it justifies the market’s cautious optimism amid holidays in multiple bourses on Monday.
That said, the hopes of avoiding the catastrophic US default recently put a floor under the risk-barometer AUD/USD pair. Adding strength to the pair’s consolidation of monthly losses are the hopes of witnessing upbeat Aussie inflation data from Australia and optimism about the Reserve Bank of Australia’s (RBA) rate hikes, considering the recently firmer Aussie data and the Reserve Bank of New Zealand’s (RBNZ) rate lift.
On Saturday, US President Joe Biden and House Speaker Kevin McCarthy reached a tentative deal to raise the Federal government's $31.4 trillion debt ceiling through January 2025. However, the agreement lacks support from some of the leftists and rightists due to the compromises involved. That said, the debt ceiling deal needs to pass through the House on Wednesday and the Senate by June 05 to avoid the looming ‘catastrophic’ default.
Also read: US President Biden: This deal is good news for the American people
Apart from the US debt ceiling optimism, improving China Industrial Profits for April also underpin the AUD/USD pair’s rebound due to Canberra’s business ties with Beijing. That said, China's National Bureau of Statistics (NBS) said during the weekend that China’s Industrial Firms Profits improved to -18.2% YoY versus -19.2% prior. It should be noted that the Year-To-Date (YTD) figures suggest -20.6% numbers versus -21.4% previous readings.
Even so, comparatively stronger US data and hawkish Fed bets challenge the Aussie pair buyers ahead of the top-tier US and Australia economics.
On Friday, US Durable Goods Orders for April came in better-than-forecast to 1.1% from 3.3% prior, versus -1.0% expected. Further, Nondefense Capital Goods Orders ex Aircraft, also known as the Core Durable Goods Orders, marked upbeat growth of 1.4% compared to -0.2% anticipated and -0.6% previous readings. Additionally, the Core PCE Price Index for the said month rose past market forecasts and previous readings of 0.3% MoM and 4.6% YoY to 0.4% and 4.7% in that order.
Following the data, International Monetary Fund Managing (IMF) Director Kristalina Georgieva and Federal Reserve Bank of Chicago President Austan Goolsbee appear hawkish for the Fed. Though, Cleveland Fed President Loretta Mester said that the Personal Consumption Expenditures (PCE) Price Index released on Friday underscored the slow progress on inflation.
Amid these plays, the market sentiment remains mildly positive and helps the AUD/USD to grind higher. With this, Wall Street closed on a positive note while S&P500 Futures print mild gains as it cheers the US debt ceiling deal whereas the holidays in major bourses restrict the bond market moves of late.
Looking ahead, Australia’s Monthly Consumer Price Index and the US Nonfarm Payrolls (NFP) may entertain AUD/USD bulls but major attention will be given to the US Congress voting on the debt ceiling deal.
Technical analysis
AUD/USD recovery remains elusive unless crossing the previous support stretched from March, around 0.6580 by the press time.
| Index | Change, points | Closed | Change, % |
|---|---|---|---|
| NIKKEI 225 | 115.18 | 30916.31 | 0.37 |
| KOSPI | 4.12 | 2558.81 | 0.16 |
| ASX 200 | 16.6 | 7154.8 | 0.23 |
| DAX | 190.17 | 15983.97 | 1.2 |
| CAC 40 | 89.91 | 7319.18 | 1.24 |
| Dow Jones | 328.69 | 33093.34 | 1 |
| S&P 500 | 54.17 | 4205.45 | 1.3 |
| NASDAQ Composite | 277.6 | 12975.69 | 2.19 |
- WTI crude oil begins the week with a gap-up, crosses short-term resistance line on market’s mildly positive mood.
- Bullish MACD signals favor energy buyers but RSI conditions suggest limited upside room.
- Sustained trading beyond 200-HMA, immediate support line keeps Oil buyers hopeful.
WTI crude oil picks up bids to defend the week-start gap towards the north of $73.00, up 0.50% near $73.30 by the press time of the mid-Asian session on Monday. In doing so, the black gold surpasses a three-day-old descending resistance line while approaching a horizontal hurdle comprising multiple levels marked since May 19.
It should be noted that the initial agreement on the US debt ceiling extension allows the commodity price to remain firmer despite the challenges the deal has in Congress.
Also read: US President Biden: This deal is good news for the American people
It’s worth noting that the MACD indicator flashes bullish signals and favors the energy buyers but the RSI (14) approaches the overbought region and hence suggests limited upside room for the commodity price.
That said, the WTI bulls may quickly challenge the previous weekly peak of $74.70 on crossing the immediate horizontal hurdle surrounding $73.50-55. However, the monthly high of $76.60 and the late April swing high near $76.85 could check the quote’s further upside.
Alternatively, the resistance-turned-support line stretched from the last Wednesday and the 200-Hour Moving Average (HMA), respectively near $72.85 and $72.40, can challenge the WTI bears.
Also likely to challenge the commodity buyers is an upward-sloping resistance line from May 17, near $71.60.
WTI crude oil: Hourly chart
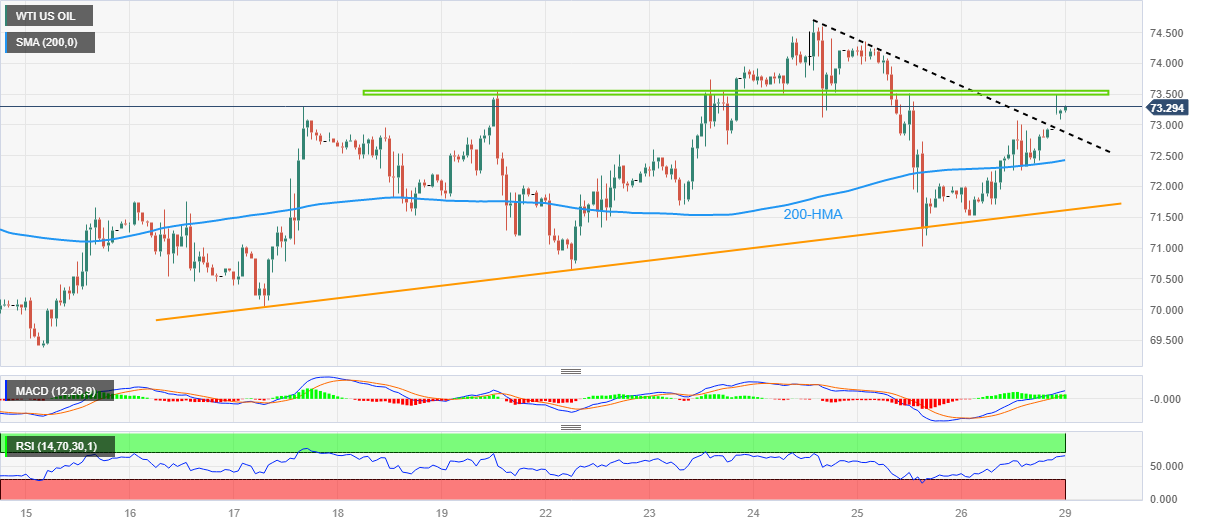
Trend: Limited upside expected
- USD/JPY is looking to capture the critical resistance of 141.00 as the Fed could raise rates ahead.
- Fears of a default by the US economy have started fading as the $31.4 trillion borrowing limit will get raised for two years.
- Investors are keeping the focus on further development about tweaking Yield Curve Control by the BoJ.
The USD/JPY pair is looking to capture the critical resistance of 141.00 in the early Tokyo session. The asset is expected to extend its rally towards 141.00 as the street is anticipating that robust consumption expenditure by United States' households would force the Federal Reserve (Fed) to stick to its policy-tightening spree in order to keep pressure on inflation.
S&P500 futures have posted stellar gains in early Asia as US President Joe Biden is sending the US debt-ceiling raise deal to Congress after getting its agreement from Republicans. Fears of a default by the United States economy have started fading as the $31.4 trillion borrowing limit will get raised for two years. White House announced that the agreement will neither cut health coverage nor increase poverty.
However, fears of more interest rate announcements have soared as the United States economy is showing resilience despite higher pressure on pockets due to higher rates. April’s US core Personal Consumption Expenditure (PCE) expanded by 0.4% vs. an estimate of 0.3%. Higher expenditure by US individuals is expected to fuel inflationary pressures. Apart from them, US Durable Goods Orders expanded by 1.1% while the street was expecting a contraction by 1.0%.
On the Japanese Yen front, Tuesday’s Employment data will be keenly watched. The Unemployment Rate is seen declining to 2.7% from the former release of 2.8%. While the Job/Applicants Ratio is seen steady at 1.32.
Meanwhile, investors are keeping the focus on further development about tweaking Yield Curve Control (YCC) by the Bank of Japan (BoJ). BoJ Governor Kazuo Ueda cited the central bank is considering strategies for tweaking YCC. He further added that shortening the duration of bond yield targets to a 5-year zone from the current 10-year is also a part of YCC.
| Pare | Closed | Change, % |
|---|---|---|
| AUDUSD | 0.6518 | 0.19 |
| EURJPY | 150.777 | 0.34 |
| EURUSD | 1.0725 | -0.02 |
| GBPJPY | 173.602 | 0.59 |
| GBPUSD | 1.23496 | 0.23 |
| NZDUSD | 0.60469 | -0.27 |
| USDCAD | 1.36156 | -0.17 |
| USDCHF | 0.90491 | -0.06 |
| USDJPY | 140.587 | 0.35 |
- US Dollar Index seesaws near the highest levels in 2.5 months, picks up bids of late.
- US President Biden, House Speaker McCarthy’s debt ceiling deal is in woods amid policymakers’ discomfort.
- Holidays in major markets may prod the DXY bulls.
- Hawkish Fed bets highlight US NFP as another key catalyst.
US Dollar Index (DXY) makes rounds to 104.25-30 during early Monday as it struggles to cheer the US debt ceiling agreement amid uncertainty surrounding its passage through Congress. Additionally challenging the DXY buyers could be the holidays in multiple markets and cautious mood ahead of this week’s US jobs report.
Although US President Joe Biden and House Speaker Kevin McCarthy reached a tentative deal to raise the Federal government's $31.4 trillion debt ceiling through January 2025, the agreement lacks support from some of the leftists and rightists due to the compromises involved. That said, the debt ceiling deal needs to pass through the House on Wednesday and the Senate by June 05 to avoid the looming ‘catastrophic’ default. Recently, US President Biden ‘strongly’ urged both chambers to pass the agreement. Even so, the upbeat US data and hawkish Fed bets keep the DXY buyers hopeful.
Market players are getting more optimistic about the Federal Reserve’s (Fed) 0.25% rate hike in June after Friday’s upbeat US data, as well as the welcome growth figures marked earlier in the last week.
US Durable Goods Orders for April came in better-than-forecast to 1.1% from 3.3% prior, versus -1.0% expected. Further, Nondefense Capital Goods Orders ex Aircraft, also known as the Core Durable Goods Orders, marked upbeat growth of 1.4% compared to -0.2% anticipated and -0.6% previous readings. Additionally, the Core PCE Price Index for the said month rose past market forecasts and previous readings of 0.3% MoM and 4.6% YoY to 0.4% and 4.7% in that order.
Not only the data, but comments from influential personalities also underpin the bullish bias about the US Dollar. International Monetary Fund Managing (IMF) Director Kristalina Georgieva stated that the US interest rates will need to be higher for longer. Alternatively, Federal Reserve Bank of Cleveland President Loretta Mester said that the Personal Consumption Expenditures (PCE) Price Index released on Friday underscored the slow progress on inflation. During the weekend, Federal Reserve Bank of Chicago President Austan Goolsbee welcomed the US debt ceiling news while also saying, amid the CBS Show “Face the Nation”, “I try to make it a point not to prejudge and make decisions when you are still weeks out from the meeting."
Against this backdrop, Wall Street closed on a positive note while S&P500 Futures print mild gains as it cheers the US debt ceiling deal whereas the holidays in major bourses restrict the bond market moves of late.
Looking ahead, Monday’s off in major trading frontiers may allow the DXY bull to take a breather. That said, this week’s US jobs report for May and the US Congress voting on the debt ceiling deal will be key to watching for clear directions.
Technical analysis
Friday’s Doji candlestick challenges the US Dollar Index (DXY) bulls unless the quote remains below the latest peak of around 104.45. However, the 200-day Exponential Moving Average (EMA) level surrounding 103.85 puts a floor under the DXY prices.


© 2000-2026. All rights reserved.
This site is managed by Teletrade D.J. LLC 2351 LLC 2022 (Euro House, Richmond Hill Road, Kingstown, VC0100, St. Vincent and the Grenadines).
The information on this website is for informational purposes only and does not constitute any investment advice.
The company does not serve or provide services to customers who are residents of the US, Canada, Iran, The Democratic People's Republic of Korea, Yemen and FATF blacklisted countries.
Making transactions on financial markets with marginal financial instruments opens up wide possibilities and allows investors who are willing to take risks to earn high profits, carrying a potentially high risk of losses at the same time. Therefore you should responsibly approach the issue of choosing the appropriate investment strategy, taking the available resources into account, before starting trading.
Use of the information: full or partial use of materials from this website must always be referenced to TeleTrade as the source of information. Use of the materials on the Internet must be accompanied by a hyperlink to teletrade.org. Automatic import of materials and information from this website is prohibited.
Please contact our PR department if you have any questions or need assistance at pr@teletrade.global.
transfers