- Analytics
- News and Tools
- Market News
CFD Markets News and Forecasts — 30-10-2018
| Time | Country | Event | Period | Previous value | Forecast |
|---|---|---|---|---|---|
| 00:00 | New Zealand | ANZ Business Confidence | October | -38.3 | |
| 00:01 | United Kingdom | Gfk Consumer Confidence | October | -9 | -10 |
| 00:30 | Australia | Private Sector Credit, y/y | September | 4.5% | |
| 00:30 | Australia | Private Sector Credit, m/m | September | 0.5% | 0.4% |
| 00:30 | Australia | Trimmed Mean CPI q/q | Quarter III | 0.5% | 0.4% |
| 00:30 | Australia | CPI, q/q | Quarter III | 0.4% | 0.4% |
| 00:30 | Australia | CPI, y/y | Quarter III | 2.1% | 1.9% |
| 00:30 | Australia | Trimmed Mean CPI y/y | Quarter III | 1.9% | 1.9% |
| 01:00 | China | Non-Manufacturing PMI | October | 54.9 | 54.9 |
| 01:00 | China | Manufacturing PMI | October | 50.8 | 50.6 |
| 03:00 | Japan | BoJ Interest Rate Decision | -0.1% | -0.1% | |
| 05:00 | Japan | Housing Starts, y/y | September | 1.6% | -0.7% |
| 05:00 | Japan | Construction Orders, y/y | September | 0.5% | |
| 05:00 | Japan | Consumer Confidence | October | 43.4 | 43.5 |
| 06:30 | Japan | BOJ Press Conference | |||
| 07:00 | Germany | Retail sales, real unadjusted, y/y | September | 1.6% | 0.9% |
| 07:00 | Germany | Retail sales, real adjusted | September | -0.1% | 0.5% |
| 07:45 | France | CPI, m/m | October | -0.2% | 0.1% |
| 07:45 | France | CPI, y/y | October | 2.2% | |
| 09:00 | Switzerland | Credit Suisse ZEW Survey (Expectations) | October | -30.8 | |
| 10:00 | Eurozone | Harmonized CPI ex EFAT, Y/Y | October | 0.9% | 1% |
| 10:00 | Eurozone | Harmonized CPI, Y/Y | October | 2.1% | 2.2% |
| 10:00 | Eurozone | Unemployment Rate | September | 8.1% | 8.1% |
| 12:15 | U.S. | ADP Employment Report | October | 230 | 189 |
| 12:30 | Canada | Industrial Product Price Index, m/m | September | -0.5% | |
| 12:30 | Canada | Industrial Product Price Index, y/y | September | 5.8% | |
| 12:30 | Canada | GDP (m/m) | August | 0.2% | |
| 13:45 | U.S. | Chicago Purchasing Managers' Index | October | 60.4 | 60.0 |
| 14:30 | U.S. | Crude Oil Inventories | October | 6.346 | 3.667 |
| 17:15 | Switzerland | SNB Chairman Jordan Speaks | |||
| 20:15 | Canada | BOC Gov Stephen Poloz Speaks | |||
| 22:30 | Australia | AIG Manufacturing Index | October | 59 |
Major US stock indices rose significantly, helped by a rebound in the technology sector amid optimism about the US-China trade dispute and some positive corporate earnings reports.
Investors also focused on US data, which indicated that the Conference Board's consumer confidence index rose again in October. The index now stands at 137.9, compared with 135.3 in September (revised from 138.4). The current situation index rose from 169.4 to 172.8, and the expectations index increased from 112.5 to 114.6. "Consumer confidence increased in October, after a slight improvement in September, and remains at a level that was last observed in the fall of 2000. Consumer assessment of current conditions remains quite positive, primarily due to strong employment growth. The expectations index recorded another gain in October, suggesting that consumers do not foresee that the economy will lose momentum in the near future. Rather, they expect high growth rates to continue in early 2019, "said Lynn Franco, director of economic development in the Conference Board
Most of the components of DOW recorded an increase (26 of 30). The growth leader was Intel Corporation (INTC, + 4.87%). Outsiders were the shares of International Business Machines Corporation (IBM, -3.30%).
Almost all sectors of the S & P finished the sale in the black. The base materials increased the most (+ 1.8%). The decline showed only the conglomerates sector (-0.2%).
At the time of closing:
Dow 24,874.95 +432.03 +1.77%
S & P 500 2,682.63 +41.38 +1.57%
Nasdaq 100 7,161.65 +111.36 +1.58%
| Time | Country | Event | Period | Previous value | Forecast |
|---|---|---|---|---|---|
| 00:00 | New Zealand | ANZ Business Confidence | October | -38.3 | |
| 00:01 | United Kingdom | Gfk Consumer Confidence | October | -9 | -10 |
| 00:30 | Australia | Private Sector Credit, y/y | September | 4.5% | |
| 00:30 | Australia | Private Sector Credit, m/m | September | 0.5% | 0.4% |
| 00:30 | Australia | Trimmed Mean CPI q/q | Quarter III | 0.5% | 0.4% |
| 00:30 | Australia | CPI, q/q | Quarter III | 0.4% | 0.4% |
| 00:30 | Australia | CPI, y/y | Quarter III | 2.1% | 1.9% |
| 00:30 | Australia | Trimmed Mean CPI y/y | Quarter III | 1.9% | 1.9% |
| 01:00 | China | Non-Manufacturing PMI | October | 54.9 | 54.9 |
| 01:00 | China | Manufacturing PMI | October | 50.8 | 50.6 |
| 03:00 | Japan | BoJ Interest Rate Decision | -0.1% | -0.1% | |
| 05:00 | Japan | Housing Starts, y/y | September | 1.6% | -0.7% |
| 05:00 | Japan | Construction Orders, y/y | September | 0.5% | |
| 05:00 | Japan | Consumer Confidence | October | 43.4 | 43.5 |
| 06:30 | Japan | BOJ Press Conference | |||
| 07:00 | Germany | Retail sales, real unadjusted, y/y | September | 1.6% | 0.9% |
| 07:00 | Germany | Retail sales, real adjusted | September | -0.1% | 0.5% |
| 07:45 | France | CPI, m/m | October | -0.2% | 0.1% |
| 07:45 | France | CPI, y/y | October | 2.2% | |
| 09:00 | Switzerland | Credit Suisse ZEW Survey (Expectations) | October | -30.8 | |
| 10:00 | Eurozone | Harmonized CPI ex EFAT, Y/Y | October | 0.9% | 1% |
| 10:00 | Eurozone | Harmonized CPI, Y/Y | October | 2.1% | 2.2% |
| 10:00 | Eurozone | Unemployment Rate | September | 8.1% | 8.1% |
| 12:15 | U.S. | ADP Employment Report | October | 230 | 189 |
| 12:30 | Canada | Industrial Product Price Index, m/m | September | -0.5% | |
| 12:30 | Canada | Industrial Product Price Index, y/y | September | 5.8% | |
| 12:30 | Canada | GDP (m/m) | August | 0.2% | |
| 13:45 | U.S. | Chicago Purchasing Managers' Index | October | 60.4 | 60.0 |
| 14:30 | U.S. | Crude Oil Inventories | October | 6.346 | 3.667 |
| 17:15 | Switzerland | SNB Chairman Jordan Speaks | |||
| 20:15 | Canada | BOC Gov Stephen Poloz Speaks | |||
| 22:30 | Australia | AIG Manufacturing Index | October | 59 |
The Conference Board Consumer Confidence Index increased again in October, following a modest improvement in September. The Index now stands at 137.9 (1985=100), up from 135.3 in September. The Present Situation Index -- based on consumers' assessment of current business and labor market conditions -- improved from 169.4 to 172.8. The Expectations Index -- based on consumers' short-term outlook for income, business and labor market conditions -- increased from 112.5 last month to 114.6 this month.
U.S. stock-index futures fell slightly on Tuesday, pointing to a small loss at the open.
Global Stocks:
| Index/commodity | Last | Today's Change, points | Today's Change, % |
| Nikkei | 21,457.29 | +307.49 | +1.45% |
| Hang Seng | 24,585.53 | -226.51 | -0.91% |
| Shanghai | 2,568.05 | +25.94 | +1.02% |
| S&P/ASX | 5,805.10 | +76.90 | +1.34% |
| FTSE | 7,017.90 | -8.42 | -0.12% |
| CAC | 4,966.31 | -23.04 | -0.46% |
| DAX | 11,292.94 | -42.54 | -0.38% |
| Crude | $65.87 | | -1.75% |
| Gold | $1,226.00 | | -0.13% |
The S&P CoreLogic Case-Shiller U.S. National Home Price NSA Index, covering all nine U.S. census divisions, reported a 5.8% annual gain in August, down from 6.0% in the previous month. The 10-City Composite annual increase came in at 5.1%, down from 5.5% in the previous month. The 20-City Composite posted a 5.5% year-over-year gain, down from 5.9% in the previous month. Las Vegas, San Francisco and Seattle reported the highest year-over-year gains among the 20 cities. In August, Las Vegas led the way with a 13.9% year-over-year price increase, followed by San Francisco with a 10.6% increase and Seattle with a 9.6% increase. Four of the 20 cities reported greater price increases in the year ending August 2018 versus the year ending July 2018.
The inflation rate in Germany as measured by the consumer price index is expected to be 2.5% in October 2018.That would be the highest growth rate since September 2008 (+2.8%). Based on the results available so far, the Federal Statistical Office (Destatis) also reports that the consumer prices are expected to increase by 0.2% on September 2018.
In October 2018, the harmonised index of consumer prices for Germany, which is calculated for European purposes, is expected to increase by 2.4% year on year and 0.1% on September 2018.
(company / ticker / price / change ($/%) / volume)
| ALCOA INC. | AA | 34.63 | 0.81(2.40%) | 1030 |
| ALTRIA GROUP INC. | MO | 64.41 | -0.18(-0.28%) | 1219 |
| Amazon.com Inc., NASDAQ | AMZN | 1,519.60 | -19.28(-1.25%) | 90363 |
| Apple Inc. | AAPL | 212.2 | -0.04(-0.02%) | 355260 |
| AT&T Inc | T | 29.74 | 0.10(0.34%) | 55783 |
| Barrick Gold Corporation, NYSE | ABX | 12.6 | -0.08(-0.63%) | 30029 |
| Boeing Co | BA | 336.15 | 0.56(0.17%) | 9477 |
| Caterpillar Inc | CAT | 114.34 | 0.36(0.32%) | 15618 |
| Chevron Corp | CVX | 109.4 | 0.47(0.43%) | 2453 |
| Cisco Systems Inc | CSCO | 43.96 | 0.12(0.27%) | 19218 |
| Citigroup Inc., NYSE | C | 64.79 | 0.44(0.68%) | 14118 |
| Exxon Mobil Corp | XOM | 77.25 | 0.20(0.26%) | 4001 |
| Facebook, Inc. | FB | 142.44 | 0.35(0.25%) | 125713 |
| Ford Motor Co. | F | 9.32 | 0.04(0.43%) | 80338 |
| Freeport-McMoRan Copper & Gold Inc., NYSE | FCX | 11.06 | -0.03(-0.27%) | 11071 |
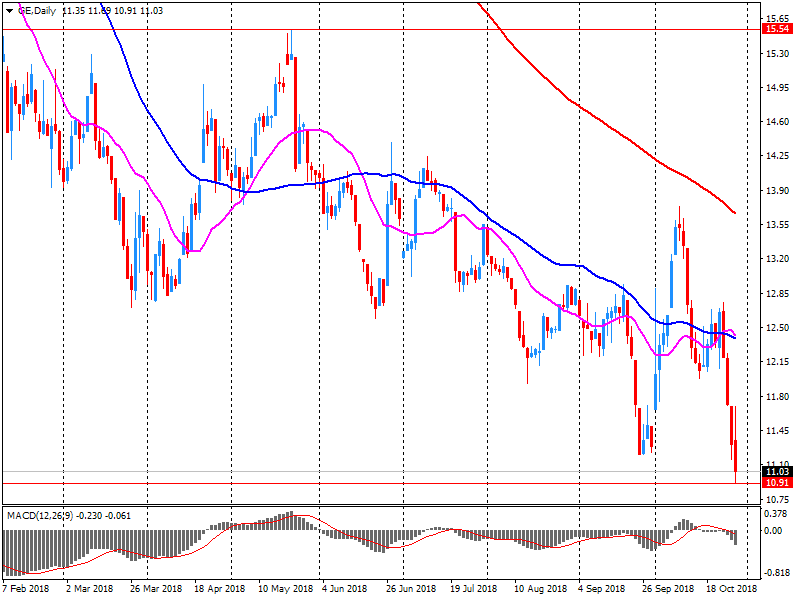
| General Electric Co | GE | 10.77 | -0.39(-3.49%) | 4451352 |
| General Motors Company, NYSE | GM | 33.27 | 0.14(0.42%) | 4689 |
| Goldman Sachs | GS | 215.78 | 1.29(0.60%) | 897 |
| Google Inc. | GOOG | 1,018.38 | -1.70(-0.17%) | 8438 |
| Home Depot Inc | HD | 173.99 | 0.79(0.46%) | 1187 |
| Intel Corp | INTC | 45.78 | 0.38(0.84%) | 90715 |
| International Business Machines Co... | IBM | 119.83 | 0.19(0.16%) | 11134 |
| Johnson & Johnson | JNJ | 137.52 | -0.03(-0.02%) | 989 |
| JPMorgan Chase and Co | JPM | 105.29 | 0.44(0.42%) | 8729 |
| Merck & Co Inc | MRK | 71.47 | 0.02(0.03%) | 1984 |
| Microsoft Corp | MSFT | 104.4 | 0.55(0.53%) | 211986 |
| Nike | NKE | 72.49 | 0.30(0.42%) | 5873 |
| Pfizer Inc | PFE | 41.81 | -1.42(-3.28%) | 90054 |
| Procter & Gamble Co | PG | 88.1 | -0.14(-0.16%) | 607 |
| Starbucks Corporation, NASDAQ | SBUX | 58.43 | 0.06(0.10%) | 3949 |
| Tesla Motors, Inc., NASDAQ | TSLA | 334.23 | -0.62(-0.19%) | 67708 |
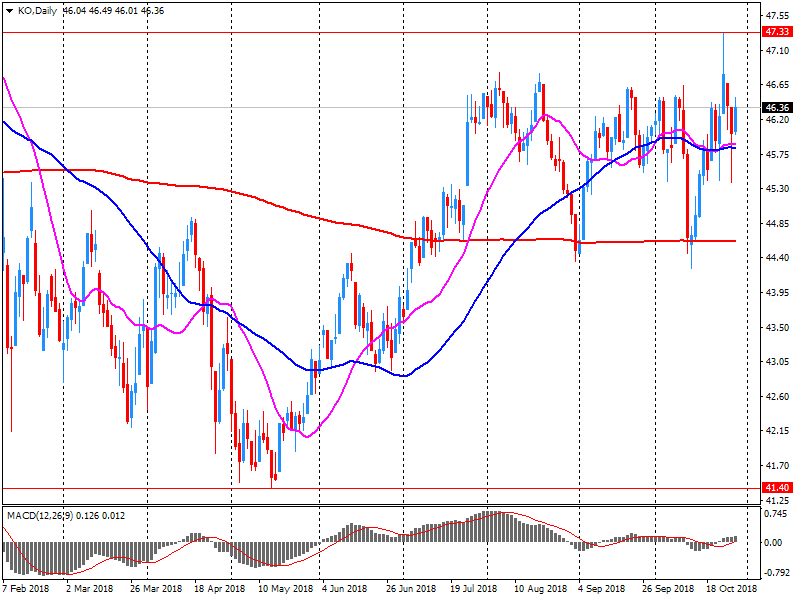
| The Coca-Cola Co | KO | 46.29 | -0.17(-0.37%) | 27612 |
| Twitter, Inc., NYSE | TWTR | 32.42 | 0.03(0.09%) | 68218 |
| United Technologies Corp | UTX | 121.13 | 0.04(0.03%) | 17320 |
| Verizon Communications Inc | VZ | 56.94 | 0.46(0.81%) | 2140 |
| Visa | V | 135.35 | 1.02(0.76%) | 16826 |
| Wal-Mart Stores Inc | WMT | 100.25 | 0.45(0.45%) | 7413 |
| Walt Disney Co | DIS | 113.33 | 0.29(0.26%) | 869 |
| Yandex N.V., NASDAQ | YNDX | 27.94 | 0.72(2.65%) | 33141 |
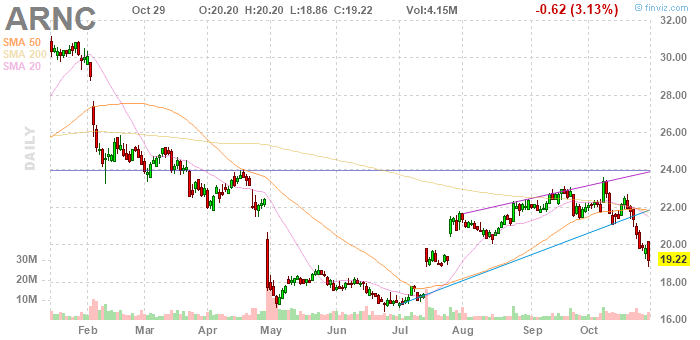
Arconic (ARNC) reported Q3 FY 2018 earnings of $0.32 per share (versus $0.25 in Q3 FY 2017), beating analysts' consensus estimate of $0.30.
The company's quarterly revenues amounted to $3.524 bln (+8.9% y/y), beating analysts' consensus estimate of $3.481 bln.
The company also raised FY 2018 EPS guidance to $1.28-1.34 from $1.17-1.27 (versus analysts' consensus estimate of $1.31) and reaffirmed FY 2018 revenues guidance at $13.70-14.00 bln (versus analysts' consensus estimate of $13.94 bln).
ARNC rose to $19.75 (+2.76%) in pre-market trading.
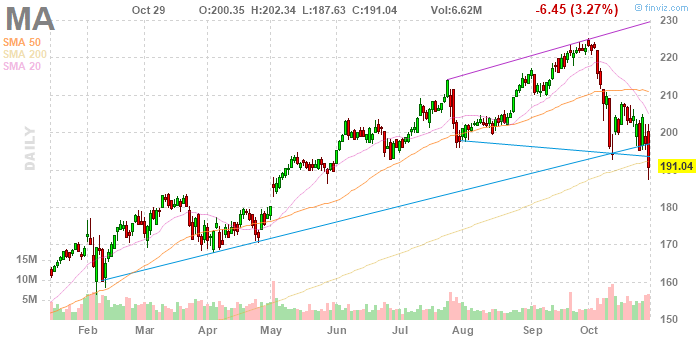
MasterCard (MA) reported Q3 FY 2018 earnings of $1.78 per share (versus $1.34 in Q3 FY 2017), beating analysts' consensus estimate of $1.68.
The company's quarterly revenues amounted to $3.898 bln (+14.7% y/y), beating analysts' consensus estimate of $3.861 bln.
MA rose to $195.50 (+2.33%) in pre-market trading.
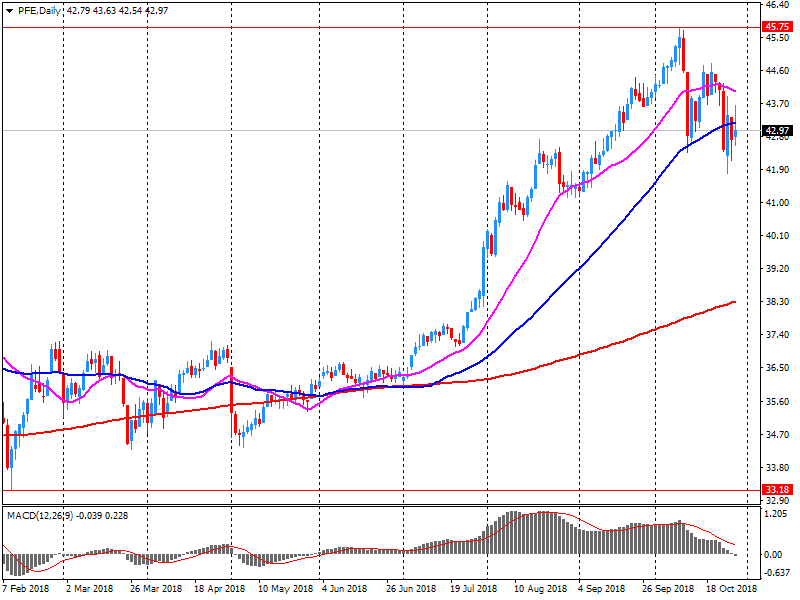
Pfizer (PFE) reported Q3 FY 2018 earnings of $0.78 per share (versus $0.67 in Q3 FY 2017), beating analysts' consensus estimate of $0.75.
The company's quarterly revenues amounted to $13.298 bln (+1.0% y/y), missing analysts' consensus estimate of $13.533 bln.
The company also narrowed FY 2018 EPS guidance to $2.98-3.02 from $2.95-3.05 (versus analysts' consensus estimate of $2.99) and lowered revenues guidance to $53-53.7 bln from $53.5-55.5 bln (versus analysts' consensus estimate of $54.16 bln.
PFE fell to $41.70 (-3.54%) in pre-market trading.
General Electric (GE) reported Q3 FY 2018 earnings of $0.14 per share (versus $0.29 in Q3 FY 2017), missing analysts' consensus estimate of $0.20.
The company's quarterly revenues amounted to $29.573 bln (-3.6% y/y), missing analysts' consensus estimate of $30.077 bln.
The company also announced about plans to reduce its quarterly dividend by 92% from $0.12 to $0.01 per share beginning with the Board's next dividend declaration, which is expected to occur in December 2018.
GE rose to $11.36 (+1.79%) in pre-market trading.
Coca-Cola (KO) reported Q3 FY 2018 earnings of $0.58 per share (versus $0.50 in Q3 FY 2017), beating analysts' consensus estimate of $0.55.
The company's quarterly revenues amounted to $8.245 bln (-9.2% y/y), generally in line with analysts' consensus estimate of $8.196 bln.
KO rose to $46.90 (+0.95%) in pre-market trading.
Retail sales growth slowed noticeably in the year to October, following four consecutive months of firm sales growth during the summer, according to the latest monthly CBI Distributive Trades Survey.
The survey of 104 firms, of which 45 were retailers, also showed that sales volumes were significantly below average for the time of year in October. Orders placed with suppliers fell, but are expected to rebound next month. Similarly, retailers expect sales growth to recover somewhat in November.
Within the retail sector, growth in sales volumes was reported only in the non-store (i.e. internet and mail order) and footwear & leather sub-sectors. Sales either stayed flat or fell elsewhere, with notable declines seen in the furniture & carpets, hardware & DIY, and other normal goods sub-sectors.
However, the picture on internet retail sales was more upbeat, with year-on-year growth in October speeding up to its quickest pace since January 2017. Internet sales are expected to expand at an even faster pace next month.
Seasonally adjusted GDP rose by 0.2% in the euro area (EA19) and by 0.3% in the EU28 during the third quarter of 2018, compared with the previous quarter, according to a preliminary flash estimate published by Eurostat, the statistical office of the European Union. In the second quarter of 2018, GDP had grown by 0.4% in the euro area and by 0.5% the EU28. Compared with the same quarter of the previous year, seasonally adjusted GDP rose by 1.7% in the euro area and by 1.9% in the EU28 in the third quarter of 2018, after +2.2% and +2.1% respectively in the previous quarter
In the third quarter of 2018 the seasonally and calendar adjusted, chained volume estimate of Gross Domestic Product (GDP) was unchanged with respect to the previous quarter and increased by 0.8 per cent over the same quarter of previous year.
The third quarter of 2018 had two working days more than the previous quarter and the same number compared to the same quarter of previous year.
The quarter on quarter change is the result of an increase of value added in agriculture, forestry and fishing and in services and a decrease in industry. From the demand side, there is a null contribution by both the domestic component (gross of change in inventories) and the net export component.
The carry-over annual GDP growth for 2018 is equal to 1.0
The estimated Spanish annual inflation in October 2018 is 2.3%, according to the advance indicator prepared by the INE. This indicator provides an advance of the CPI which, if confirmed, would imply maintenance in its annual rate, since in the month of September this variation was also 2.3%. In this behavior, the decrease in the prices of electricity stand out, as opposed to the increase registered in 2017, and the rise in gas prices. For its part, the annual variation of the leading indicator of the HICP is in October in the 2.3%
At 100.1 points, the barometer is now as good as on its long-term average of 100.0. Since May of this year, the KOF Economic Barometer has thus been fluctuating around its long-term average. The Swiss economy is therefore in the coming months likely to grow with average rates. In October, the KOF Economic Barometer fell by 2.2 points, from 102.3 points in September (revised from 102.2 points) to 100.1 points. It is noteworthy that this decline is quite broadly visible in various indicator bundles.
EUR/USD
Resistance levels (open interest**, contracts)
$1.1536 (1787)
$1.1484 (771)
$1.1455 (91)
Price at time of writing this review: $1.1366
Support levels (open interest**, contracts):
$1.1317 (3158)
$1.1279 (2704)
$1.1237 (2584)
Comments:
- Overall open interest on the CALL options and PUT options with the expiration date November, 19 is 88165 contracts (according to data from October, 29) with the maximum number of contracts with strike price $1,1450 (5954);
GBP/USD
Resistance levels (open interest**, contracts)
$1.2988 (832)
$1.2928 (371)
$1.2886 (621)
Price at time of writing this review: $1.2772
Support levels (open interest**, contracts):
$1.2729 (1418)
$1.2697 (1074)
$1.2662 (1061)
Comments:
- Overall open interest on the CALL options with the expiration date November, 19 is 25115 contracts, with the maximum number of contracts with strike price $1,3500 (3215);
- Overall open interest on the PUT options with the expiration date November, 19 is 32093 contracts, with the maximum number of contracts with strike price $1,3000 (3171);
- The ratio of PUT/CALL was 1.28 versus 1.28 from the previous trading day according to data from October, 29
* - The Chicago Mercantile Exchange bulletin (CME) is used for the calculation.
** - Open interest takes into account the total number of option contracts that are open at the moment.
A mixed start to trading on the stock markets of Europe is expected. Quotes in the US fell, and most Asian stock indices rose after a negative start. The caution in the markets is maintained against the background of growing trade tensions between the US and China, as well as political instability in Europe.
-
"Treasury Estimates Annual Net Marketable Debt to Total $1.338 Trillion in 2018"
-
Digital Tax To Come Into Effect In April 2020
-
New Tax on UK-Generated Revenues of Specific Digital Platform Business Models
-
Established Tech Giants to Shoulder Burden of New Digital Tax
-
Digital Services Tax Only Paid by Companies Which Are Profitable
-
Digital Services Tax Will Only Be Paid by Cos Generating GBP500M/Year in Global Revenues
Japan's unemployment rate declined in September, according to rttnews.
The jobless rate fell to 2.3 percent from 2.4 percent in August. This was the lowest rate since early 1990s. The rate was expected to remain unchanged at 2.4 percent.
The jobs-to-applicant ratio rose slightly to 1.64 from 1.63 a month ago.
The unemployment rate is the lowest it has been in a generation and it will fall further over the coming year, Marcel Thieliant, an economist at Capital Economics, said.
The upshot is that wage growth probably won't reach the 2.5 percent annual rate required to meet the BoJ's 2 percent inflation target, the economist added.
The number of dwellings approved in Australia fell by 1.9 per cent in September 2018 in trend terms, according to data released by the Australian Bureau of Statistics (ABS) today.
"The fall was mainly driven by private dwellings excluding houses, which decreased by 2.7 per cent in September," said Daniel Rossi, Director of Construction Statistics at the ABS. "Private sector houses also fell, by 1.5 per cent."
Among the states and territories, dwelling approvals fell in September in the Australian Capital Territory (8.4 per cent), Northern Territory (6.9 per cent), South Australia (3.9 per cent), Queensland (2.3 per cent), Western Australia (2.1 per cent), New South Wales (1.3 per cent) and Victoria (1.0 per cent) in trend terms. Tasmania was the only state to see an increase in dwelling approvals (1.5 per cent) in trend terms.
Approvals for private sector houses fell 1.5 per cent in September in trend terms. Private sector house approvals fell in Queensland (3.1 per cent), South Australia (3.0 per cent), Western Australia (2.2 per cent) and Victoria (1.7 per cent). New South Wales recorded an increase of 0.5 per cent.
In Q3 2018, GDP in volume terms accelerated slightly: +0.4% after +0.2%. Household consumption expenditures recovered (+0.5% after −0.1%). Total gross fixed capital formation grew almost as quickly as in the previous quarter (GFCF: +0.8% after +0.9%). Overall, final domestic demand excluding inventory changes accelerated: it contributed 0.5 points to GDP growth, after 0.2 points in the previous quarter.
Imports slowed down in Q3 (+0.3% after +0.7%), whereas exports accelerated (+0.7% after +0.1%). All in all, foreign trade balance contributed positively to GDP growth, +0.1 points, after −0.2 points in Q2. Conversely, changes in inventories contributed negatively to GDP growth (−0.2 points after +0.2 points).
Production in goods and services accelerated in Q3 2018 (+0.7% after +0.3%). It bounced back in goods (+0.8% after −0.2%), and it grew at a slightly faster pace than in the previous quarter in services (+0.6% after +0.4%).
Output in manufactured recovered (+0.8% after −0.1%). Production in refineries bounced back (+11.3% after −9.7%) ; it had been notably low in Q2 due to maintenance work. Conversely, construction was at a standstill (+0.0% after +0.6%).
| Raw materials | Closing price | % change |
| Oil | $66.68 | -1.35% |
| Gold | $1,231.20 | -0.37% |
| Index | Change items | Closing price | % change |
| Nikkei | -34.80 | 21149.80 | -0.16% |
| SHANGHAI | -56.74 | 2542.10 | -2.18% |
| ASX 200 | +63.00 | 5728.20 | +1.11% |
| FTSE 100 | +86.76 | 7026.32 | +1.25% |
| DAX | +134.86 | 11335.48 | +1.20% |
| CAC 40 | +21.98 | 4989.35 | +0.44% |
| DJIA | -245.39 | 24442.92 | -0.99% |
| NASDAQ | -116.92 | 7050.29 | -1.63% |
| S&P 500 | -17.44 | 2641.25 | -0.66% |
| Pare | Closed | % change |
| EUR/USD | $1,1388 | -0,11% |
| GBP/USD | $1,2797 | -0,24% |
| USD/CHF | Chf1,00185 | +0,48% |
| USD/JPY | Y112,35 | +0,42% |
| EUR/JPY | Y127,78 | +0,17% |
| GBP/JPY | Y143,784 | +0,37% |
| AUD/USD | $0,7060 | -0,42% |
| NZD/USD | $0,6522 | -0,04% |
| USD/CAD | C$1,31288 | +0,27% |


© 2000-2026. All rights reserved.
This site is managed by Teletrade D.J. LLC 2351 LLC 2022 (Euro House, Richmond Hill Road, Kingstown, VC0100, St. Vincent and the Grenadines).
The information on this website is for informational purposes only and does not constitute any investment advice.
The company does not serve or provide services to customers who are residents of the US, Canada, Iran, The Democratic People's Republic of Korea, Yemen and FATF blacklisted countries.
Making transactions on financial markets with marginal financial instruments opens up wide possibilities and allows investors who are willing to take risks to earn high profits, carrying a potentially high risk of losses at the same time. Therefore you should responsibly approach the issue of choosing the appropriate investment strategy, taking the available resources into account, before starting trading.
Use of the information: full or partial use of materials from this website must always be referenced to TeleTrade as the source of information. Use of the materials on the Internet must be accompanied by a hyperlink to teletrade.org. Automatic import of materials and information from this website is prohibited.
Please contact our PR department if you have any questions or need assistance at pr@teletrade.global.
transfers