- Analytics
- News and Tools
- Market News
CFD Markets News and Forecasts — 31-10-2018
Raw materials | Closing price | % change |
Oil | $64.99 | -1.66% |
Gold | $1,217.50 | -1.48% |
Index | Change items | Closing price | % change |
Nikkei | +463.17 | 21920.46 | +2.16% |
SHANGHAI | +34.74 | 2602.78 | +1.35% |
ASX 200 | +25.20 | 5830.30 | +0.43% |
FTSE 100 | +92.25 | 7128.10 | +1.31% |
DAX | +160.12 | 11447.51 | +1.42% |
CAC 40 | +114.91 | 5093.44 | +2.31% |
DJIA | +241.12 | 25115.76 | +0.97% |
S&P 500 | +29.11 | 2711.74 | +1.09% |
NASDAQ | +144.25 | 7305.90 | +2.01% |
Pare | Closed | % change |
EUR/USD | $1,1314 | -0,26% |
GBP/USD | $1,2767 | +0,48% |
USD/CHF | Chf1,00762 | +0,25% |
USD/JPY | Y112,93 | -0,14% |
EUR/JPY | Y127,76 | -0,40% |
GBP/JPY | Y144,149 | +0,31% |
AUD/USD | $0,7075 | -0,39% |
NZD/USD | $0,6518 | -0,53% |
USD/CAD | C$1,3158 | +0,35% |
| Time | Country | Event | Period | Previous value | Forecast |
|---|---|---|---|---|---|
| 00:00 | France | Bank holiday | |||
| 00:30 | Australia | Import Price Index, q/q | Quarter III | 3.2% | 1.1% |
| 00:30 | Australia | Export Price Index, q/q | Quarter III | 1.9% | |
| 00:30 | Australia | Trade Balance | September | 1.604 | 1.7 |
| 00:30 | Japan | Manufacturing PMI | October | 52.5 | 53.1 |
| 01:45 | China | Markit/Caixin Manufacturing PMI | October | 50.0 | 49.9 |
| 06:45 | Switzerland | SECO Consumer Climate | Quarter IV | -7 | -8 |
| 07:00 | United Kingdom | Nationwide house price index, y/y | October | 2% | 1.9% |
| 07:00 | United Kingdom | Nationwide house price index | October | 0.3% | 0.2% |
| 08:15 | Switzerland | Consumer Price Index (MoM) | October | 0.1% | 0.2% |
| 08:15 | Switzerland | Consumer Price Index (YoY) | October | 1% | 1.1% |
| 08:30 | Switzerland | Manufacturing PMI | October | 59.7 | 58.5 |
| 09:30 | United Kingdom | Purchasing Manager Index Manufacturing | October | 53.8 | 53 |
| 12:00 | United Kingdom | BoE Interest Rate Decision | 0.75% | 0.75% | |
| 12:00 | United Kingdom | Asset Purchase Facility | 435 | 435 | |
| 12:00 | United Kingdom | BOE Inflation Letter | |||
| 12:30 | U.S. | Continuing Jobless Claims | October | 1636 | 1640 |
| 12:30 | U.S. | Unit Labor Costs, q/q | Quarter III | -1% | 1% |
| 12:30 | U.S. | Nonfarm Productivity, q/q | Quarter III | 2.9% | 2.2% |
| 12:30 | U.S. | Initial Jobless Claims | October | 215 | 213 |
| 12:30 | United Kingdom | BOE Gov Mark Carney Speaks | |||
| 13:45 | U.S. | Manufacturing PMI | October | 55.6 | 55.9 |
| 14:00 | U.S. | Construction Spending, m/m | September | 0.1% | 0.1% |
| 14:00 | U.S. | ISM Manufacturing | October | 59.8 | 59 |
| 19:00 | U.S. | Total Vehicle Sales, mln | October | 17.44 | 17.1 |
Major US stock indexes rose significantly against the background of strong quarterly reports of US companies and the rise in prices of shares of technology firms.
So, General Motors showed adjusted quarterly earnings of $ 1.87 per share, which was significantly above the analysts' average forecast of $ 1.25. The automaker's revenue also exceeded forecasts, helped by higher prices in North America. And Facebook’s quarterly earnings of $ 1.76 per share exceeded the analysts ’average forecast by $ 0.32. Meanwhile, social network revenue was slightly below market expectations, as well as the number of new users. However, the latest Facebook report showed better spending than expected.
Investors also reacted positively to data from Automatic Data Processing (ADP), which showed that the growth rate of employment in the US private sector accelerated in October, contrary to experts' forecasts. According to the report, in October the number of employed increased by 227 thousand people compared with September, at the level of 218 thousand, which was revised from 230 thousand. Analysts had expected that the number of employees would increase by 189 thousand
Most of the components of DOW finished trading in positive territory (22 out of 30). The growth leader was the shares of Visa Inc. (V, + 3.87%). Walmart Inc. shares turned out to be an outsider. (WMT, -2.04%).
Almost all sectors of the S & P showed an increase. The technological sector grew the most (+ 2.5%). Only the utility sector declined (-0.7%)
At the time of closing:
Dow 25,115.76 +241.12 +0.97%
S & P 500 2,711.74 +29.11 +1.09%
Nasdaq 100 7,305.90 +144.25 +2.01%
| Time | Country | Event | Period | Previous value | Forecast |
|---|---|---|---|---|---|
| 00:00 | France | Bank holiday | |||
| 00:30 | Australia | Import Price Index, q/q | Quarter III | 3.2% | 1.1% |
| 00:30 | Australia | Export Price Index, q/q | Quarter III | 1.9% | |
| 00:30 | Australia | Trade Balance | September | 1.604 | 1.7 |
| 00:30 | Japan | Manufacturing PMI | October | 52.5 | 53.1 |
| 01:45 | China | Markit/Caixin Manufacturing PMI | October | 50.0 | 49.9 |
| 06:45 | Switzerland | SECO Consumer Climate | Quarter IV | -7 | -8 |
| 07:00 | United Kingdom | Nationwide house price index, y/y | October | 2% | 1.9% |
| 07:00 | United Kingdom | Nationwide house price index | October | 0.3% | 0.2% |
| 08:15 | Switzerland | Consumer Price Index (MoM) | October | 0.1% | 0.2% |
| 08:15 | Switzerland | Consumer Price Index (YoY) | October | 1% | 1.1% |
| 08:30 | Switzerland | Manufacturing PMI | October | 59.7 | 58.5 |
| 09:30 | United Kingdom | Purchasing Manager Index Manufacturing | October | 53.8 | 53 |
| 12:00 | United Kingdom | BoE Interest Rate Decision | 0.75% | 0.75% | |
| 12:00 | United Kingdom | Asset Purchase Facility | 435 | 435 | |
| 12:00 | United Kingdom | BOE Inflation Letter | |||
| 12:30 | U.S. | Continuing Jobless Claims | October | 1636 | 1640 |
| 12:30 | U.S. | Unit Labor Costs, q/q | Quarter III | -1% | 1% |
| 12:30 | U.S. | Nonfarm Productivity, q/q | Quarter III | 2.9% | 2.2% |
| 12:30 | U.S. | Initial Jobless Claims | October | 215 | 213 |
| 12:30 | United Kingdom | BOE Gov Mark Carney Speaks | |||
| 13:45 | U.S. | Manufacturing PMI | October | 55.6 | 55.9 |
| 14:00 | U.S. | Construction Spending, m/m | September | 0.1% | 0.1% |
| 14:00 | U.S. | ISM Manufacturing | October | 59.8 | 59 |
| 19:00 | U.S. | Total Vehicle Sales, mln | October | 17.44 | 17.1 |
U.S. commercial crude oil inventories (excluding those in the Strategic Petroleum Reserve) increased by 3.2 million barrels from the previous week. At 426.0 million barrels, U.S. crude oil inventories are about 2% above the five year average for this time of year.
Total motor gasoline inventories decreased by 3.2 million barrels last week and are about 6% above the five year average for this time of year. Finished gasoline inventories increased while blending components inventories decreased last week.
Distillate fuel inventories decreased by 4.1 million barrels last week and are about 5% below the five year average for this time of year. Propane/propylene inventories increased by 1.0 million barrels last week and are about 3% below the five year average for this time of year. Total commercial petroleum inventories decreased last week by 6.4 million barrels last week.
U.S. stock-index futures surged on Wednesday, pointing to a higher open, as solid quarterly results from General Motors (GM) and Facebook (FB) lifted market sentiment.
Global Stocks:
Index/commodity | Last | Today's Change, points | Today's Change, % |
Nikkei | 21,920.46 | +463.17 | +2.16% |
Hang Seng | 24,979.69 | +394.16 | +1.60% |
Shanghai | 2,602.78 | +34.74 | +1.35% |
S&P/ASX | 5,830.30 | +25.20 | +0.43% |
FTSE | 7,155.64 | +119.79 | +1.70% |
CAC | 5,090.42 | +111.89 | +2.25% |
DAX | 11,443.04 | +155.65 | +1.38% |
Crude | $66.30 | +0.18% | |
Gold | $1,217.90 | -0.60% |
(company / ticker / price / change ($/%) / volume)
ALCOA INC. | AA | 34.75 | 0.60(1.76%) | 7908 |
ALTRIA GROUP INC. | MO | 65.9 | 0.03(0.05%) | 3741 |
Amazon.com Inc., NASDAQ | AMZN | 1,561.50 | 31.08(2.03%) | 106484 |
American Express Co | AXP | 103.57 | 1.49(1.46%) | 2000 |
AMERICAN INTERNATIONAL GROUP | AIG | 42.07 | 1.11(2.71%) | 20904 |
Apple Inc. | AAPL | 215.96 | 2.66(1.25%) | 512917 |
AT&T Inc | T | 30.67 | 0.20(0.66%) | 39442 |
Barrick Gold Corporation, NYSE | ABX | 12.6 | -0.11(-0.87%) | 217048 |
Boeing Co | BA | 352.12 | 2.21(0.63%) | 20208 |
Caterpillar Inc | CAT | 119.44 | 1.98(1.69%) | 7958 |
Chevron Corp | CVX | 112.03 | 1.18(1.06%) | 2671 |
Cisco Systems Inc | CSCO | 45 | 0.42(0.94%) | 15685 |
Citigroup Inc., NYSE | C | 65.2 | 0.67(1.04%) | 28939 |
Deere & Company, NYSE | DE | 134.18 | 1.42(1.07%) | 225 |
Exxon Mobil Corp | XOM | 79.5 | 0.72(0.91%) | 2265 |
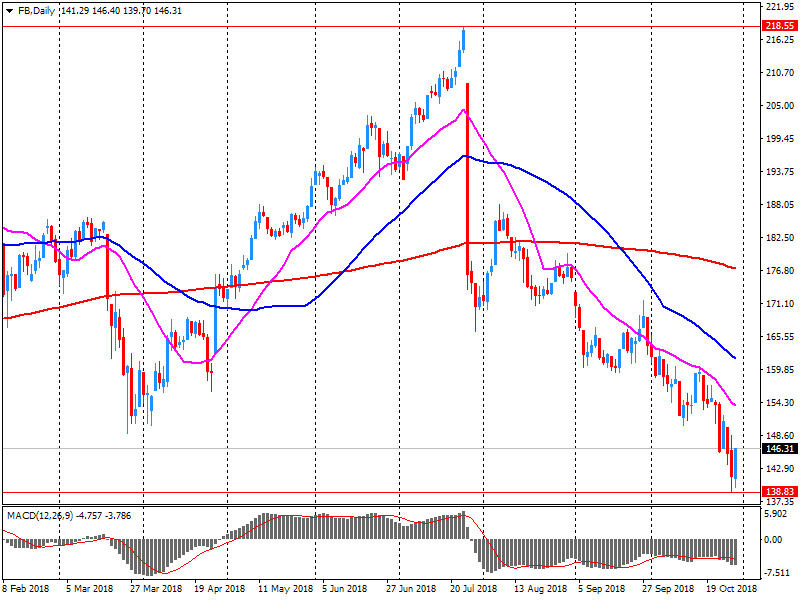
Facebook, Inc. | FB | 154.6 | 8.38(5.73%) | 1363742 |
FedEx Corporation, NYSE | FDX | 218.3 | 1.77(0.82%) | 146 |
Ford Motor Co. | F | 9.68 | 0.22(2.33%) | 525937 |
Freeport-McMoRan Copper & Gold Inc., NYSE | FCX | 11.55 | 0.14(1.23%) | 113248 |
General Electric Co | GE | 10.2 | 0.02(0.20%) | 945476 |
General Motors Company, NYSE | GM | 35.9 | 2.36(7.04%) | 1595057 |
Goldman Sachs | GS | 221.76 | 2.48(1.13%) | 3562 |
Google Inc. | GOOG | 1,055.99 | 19.78(1.91%) | 10438 |
Hewlett-Packard Co. | HPQ | 24.25 | 0.58(2.45%) | 600 |
Home Depot Inc | HD | 177.68 | 1.44(0.82%) | 1688 |
HONEYWELL INTERNATIONAL INC. | HON | 143.47 | 0.51(0.36%) | 186 |
Intel Corp | INTC | 48.21 | 0.45(0.94%) | 87271 |
International Business Machines Co... | IBM | 116.75 | 1.35(1.17%) | 33608 |
Johnson & Johnson | JNJ | 141.49 | 0.74(0.53%) | 1894 |
JPMorgan Chase and Co | JPM | 107.85 | 1.15(1.08%) | 9716 |
McDonald's Corp | MCD | 178.99 | 0.50(0.28%) | 1057 |
Merck & Co Inc | MRK | 73.2 | 0.33(0.45%) | 3384 |
Microsoft Corp | MSFT | 104.95 | 1.22(1.18%) | 225974 |
Nike | NKE | 75.25 | 0.74(0.99%) | 3745 |
Pfizer Inc | PFE | 43.08 | 0.19(0.44%) | 902 |
Procter & Gamble Co | PG | 89.29 | 0.10(0.11%) | 1114 |
Starbucks Corporation, NASDAQ | SBUX | 59 | 0.41(0.70%) | 1399 |
Tesla Motors, Inc., NASDAQ | TSLA | 333.71 | 3.81(1.15%) | 49584 |
The Coca-Cola Co | KO | 47.53 | -0.10(-0.21%) | 7893 |
Twitter, Inc., NYSE | TWTR | 34.4 | 0.54(1.59%) | 96408 |
Verizon Communications Inc | VZ | 58.47 | 0.29(0.50%) | 10908 |
Visa | V | 134.75 | 1.99(1.50%) | 6771 |
Wal-Mart Stores Inc | WMT | 102.7 | 0.28(0.27%) | 15377 |
Walt Disney Co | DIS | 115.75 | 0.99(0.86%) | 3605 |
Yandex N.V., NASDAQ | YNDX | 28.84 | 1.28(4.64%) | 103631 |
General Electric (GE) upgraded to Buy from Neutral at UBS
American Intl (AIG) upgraded to Buy from Hold at Deutsche Bank
Facebook (FB) added to Analyst Focus List at JP Morgan
Prices of products sold by Canadian manufacturers, as measured by the Industrial Product Price Index (IPPI), edged up 0.1% in September. Higher prices for chemicals and chemical products and energy and petroleum products were largely offset by lower prices for primary non-ferrous metal products. Prices for raw materials purchased by Canadian manufacturers, as measured by the Raw Materials Price Index (RMPI), decreased 0.9%, primarily due to lower prices for crude energy products.
Real gross domestic product rose for a seventh consecutive month, edging up 0.1% in August. Growth was concentrated in oil and gas extraction and finance and insurance, which more than offset declines in 12 of 20 industrial sectors.
The output of services-producing industries edged up 0.1%, while output was essentially unchanged for goods-producing industries.
The mining, quarrying and oil and gas extraction sector posted the largest increase in activity in August, rising 0.9% to nearly offset the declines in the two previous months.
The oil and gas extraction subsector was up 1.9%, led by a 3.2% rise in non-conventional oil extraction as crude bitumen and total crude production in Alberta reached record levels. Conventional oil and gas extraction (+0.8%) was up for the third month in a row, largely as a result of growth in natural gas extraction.
“Despite a significant shortage in skilled talent, the labor market continues to grow,” said Ahu Yildirmaz, vice president and co-head of the ADP Research Institute.”We saw significant gains across all industries with trade and leisure and hospitality leading the way. We continue to see larger employers benefit in this environment as they are more apt to provide the competitive wages and strong benefits employees desire.”
Mark Zandi, chief economist of Moody’s Analytics, said, “The job market bounced back strongly last month despite being hit by back-to-back hurricanes. Testimonial to the robust employment picture is the broad-based gains in jobs across industries. The only blemish is the struggles small businesses are having filling open job positions.”
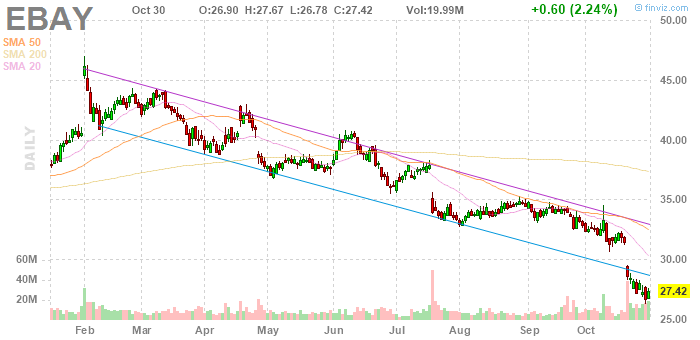
eBay (EBAY) reported Q3 FY 2018 earnings of $0.56 per share (versus $0.48 in Q3 FY 2017), beating analysts’ consensus estimate of $0.54.
The company’s quarterly revenues amounted to $2.649 bln (+6% y/y), generally in line with analysts’ consensus estimate of $2.650 bln.
EBAY rose to $29.49 (+7.55%) in pre-market trading.
According to preliminary estimates, in October 2018 the Italian consumer price index for the whole nation (NIC) was stable on monthly basis and increased by 1.6% with respect to October 2017, up from +1.4% in September 2018.
The acceleration of inflation was mainly due to prices of Regulated energy products (from +5.6% in September to +9.3%) and of Services – miscellaneous (from +0.5% to +2.3%) only partially offset by prices of Unprocessed food and of Services related to transport that slowed their growth respectively from +2.4% to +0.8% and from +2.5% to +1.9%.
Excluding energy and unprocessed food, core inflation was +0.8% (up from +0.7% in September) and inflation excluding energy was +0.9% (as in the previous month).
Planned Growth Is Conservative
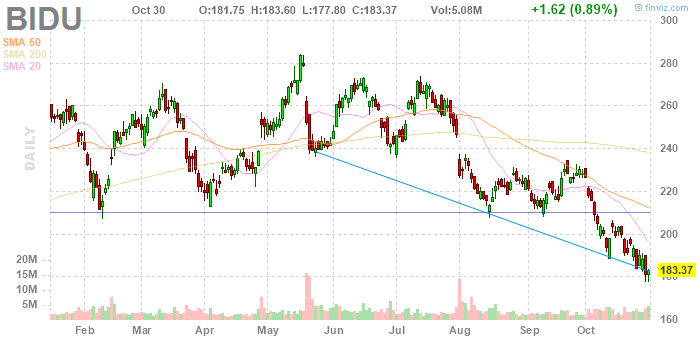
Baidu.com (BIDU) reported Q3 FY 2018 earnings of $2.77 per share (versus $3.89 in Q3 FY 2017), beating analysts’ consensus estimate of $2.53.
The company’s quarterly revenues amounted to $4.110 bln, beating analysts’ consensus estimate of $4.016 bln.
BIDU fell to $182.60 (-0.42%) in pre-market trading.
The euro area (EA19) seasonally-adjusted unemployment rate was 8.1% in September 2018, stable compared with August 2018 and down from 8.9% in September 2017. This remains the lowest rate recorded in the euro area since November 2008. The EU28 unemployment rate was 6.7% in September 2018, stable compared with August 2018 and down from 7.5% in September 2017. This is the lowest rate recorded in the EU28 since the start of the EU monthly unemployment series in January 2000. These figures are published by Eurostat, the statistical office of the European Union. Eurostat estimates that 16.574 million men and women in the EU28, of whom 13.153 million in the euro area, were unemployed in September 2018. Compared with August 2018, the number of persons unemployed decreased by 35 000 in the EU28 and increased by 2 000 in the euro area. Compared with September 2017, unemployment fell by 1.793 million in the EU28 and by 1.309 million in the euro area.
Euro area annual inflation is expected to be 2.2% in October 2018, up from 2.1% in September 2018, according to a flash estimate from Eurostat, the statistical office of the European Union. Looking at the main components of euro area inflation, energy is expected to have the highest annual rate in October (10.6%, compared with 9.5% in September), followed by food, alcohol & tobacco (2.2%, compared with 2.6% in September), services (1.5%, compared with 1.3% in September) and non-energy industrial goods (0.4%, compared with 0.3% in September).
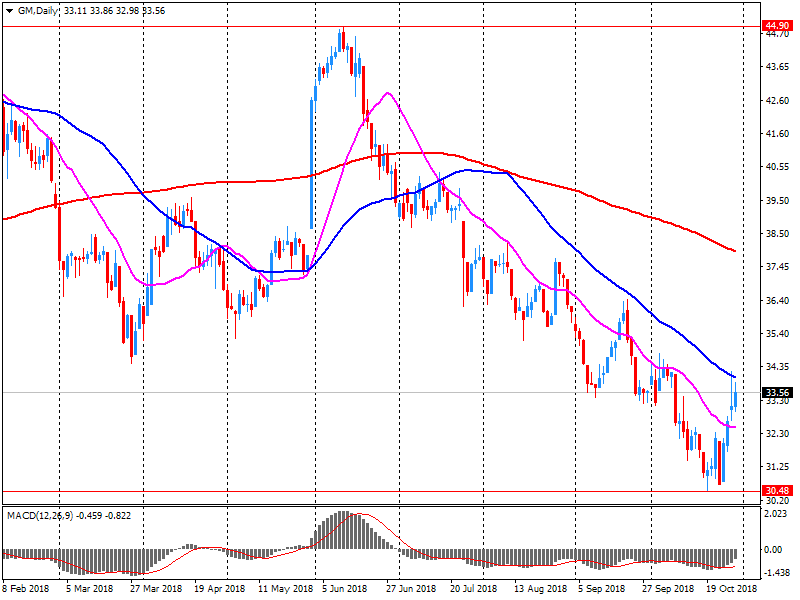
General Motors (GM) reported Q3 FY 2018 earnings of $1.87 per share (versus $1.32 in Q3 FY 2017), beating analysts' consensus estimate of $1.25.
The company's quarterly revenues amounted to $35.791 bln (+6.4% y/y), beating analysts' consensus estimate of $34.848 bln.
GM rose to $36.80 (+9.72%) in pre-market trading.
Facebook (FB) reported Q3 FY 2018 earnings of $1.76 per share (versus $1.59 in Q3 FY 2017), beating analysts' consensus estimate of $1.44.
The company's quarterly revenues amounted to $13.727 bln (+32.9% y/y), generally in-line with analysts' consensus estimate of $13.821 bln.
FB rose to $153.55 (+5.01%) in pre-market trading.
The Spanish GDP registers a growth of 0.6% in the third quarter of 2018 to the previous quarter in terms of volume. This rate is similar to that registered in the second quarter of the year. GDP growth stood at 2.5% year-on-year, a rate similar to that of the quarter preceding. The contribution of national demand to the annual growth of GDP is 3.0 points, three tenths lower than that of the second quarter. For its part, the demand external contribution is -0.5 points, three tenths higher than that of the last quarter
Over a year, the Consumer Price Index (CPI) should rise by 2.2% in October 2018, as in September, according to the provisional estimate made at the end of the month. The stability in inflation should come from an acceleration in energy prices and in services prices, offset by a larger drop in those of manufactured products and a slowdown in fresh food prices.
Over one month, consumer prices should recover barely: +0.1% after −0.2% in September. Energy prices should be more dynamic than in the previous month. Those of manufactured products should be stable over one month. Services prices should drop markedly less than in the previous month. Lastly, food prices should edge down in the wake of those in fresh food prices.
Year on year, the Harmonised Index of Consumer Prices should rise by 2.5%, as in September. Over one month, it should rebound to +0.1% after a −0.2% downturn in the previous month.
EUR/USD
Resistance levels (open interest**, contracts)
$1.1485 (1188)
$1.1455 (851)
$1.1416 (91)
Price at time of writing this review: $1.1348
Support levels (open interest**, contracts):
$1.1330 (3760)
$1.1302 (3362)
$1.1269 (2698)
Comments:
- Overall open interest on the CALL options and PUT options with the expiration date November, 19 is 88870 contracts (according to data from October, 30) with the maximum number of contracts with strike price $1,1450 (5954);
GBP/USD
Resistance levels (open interest**, contracts)
$1.2922 (1144)
$1.2849 (538)
$1.2797 (503)
Price at time of writing this review: $1.2715
Support levels (open interest**, contracts):
$1.2679 (1372)
$1.2658 (1087)
$1.2631 (1083)
Comments:
- Overall open interest on the CALL options with the expiration date November, 19 is 25605 contracts, with the maximum number of contracts with strike price $1,3500 (3215);
- Overall open interest on the PUT options with the expiration date November, 19 is 32428 contracts, with the maximum number of contracts with strike price $1,3000 (3177);
- The ratio of PUT/CALL was 1.27 versus 1.28 from the previous trading day according to data from October, 30
* - The Chicago Mercantile Exchange bulletin (CME) is used for the calculation.
** - Open interest takes into account the total number of option contracts that are open at the moment.
A positive start to trading on the stock markets of Europe is expected, as the improved mood on Wall Street yesterday and in Asian trading today helps to lift the mood in the futures market.
-
The pursuit of prices to 2% inflation remains
-
The global economy continues to grow as a whole
-
Trade protection can be a brake on the growth of the global economy
-
China's economy remains stable due to financial stimulus
-
The impact of trade friction between the US and China is so far limited on the Japanese economy.
-
The functioning of the government bond market has somewhat improved after the July policy changes.
-
JGB yields begin to respond more to the movement of profitability abroad
-
Market movements should be monitored closely to prevent monetary policy adverse effects.
According to provisional data, turnover in retail trade in September 2018 was in real terms 2.6% and in nominal terms 0.7% smaller than in September 2017. The number of days open for sale was 25 in September 2018 and 26 in September 2017.
Compared with the previous year, turnover in retail trade was in the first nine months of 2018 in real terms 1.0% and in nominal terms 2.6% higher than in the corresponding period of the previous year
Both headline business confidence and firms' views of their own activity were steady in October at low levels, up 1 point and down 1 point respectively.
Employment intentions lifted 1 point, profit expectations declined 2 points, and investment intentions bounced 6 points but remained negative.
Both residential and commercial construction intentions dropped sharply.
In the October ANZ Business Outlook Survey headline business confidence lifted 1 point to a net 37% of respondents reporting they expect general business conditions to deteriorate in the year ahead. Firms' perceptions of their own activity prospects eased 1 point to a net 7% expecting an improvement, a weak level. The retail sector bounced 5 points but remains the least positive (-8%), while manufacturing is now t
Industrial production in Japan was down a seasonally adjusted 1.1 percent on month in September, according to rttnews.
That missed expectations for a decline of 0.3 percent following the 0.2 percent gain in August.
On a yearly basis, industrial production sank 2.9 percent - again missing forecasts for a fall of 2.1 percent following the 0.2 percent increase in the previous month.
Upon the release of the data, the METI downgraded its assessment of industrial production, saying that it is picking up slowly but showing signs of decrease in part.
The Bank of Japan left its monetary policy unchanged and kept short-term interest rates at the level of -0.1%. The target yield of a 10-year JGB Treasury bond remained at around 0%. The Bank of Japan also kept its commitment to acquire Japanese government bonds worth 80 trillion yen per year.
But the Bank of Japan issued a slightly stronger warning about financial vulnerability than it did three months ago, reflecting growing concern that years of ultra-low interest rates are detrimental to bank profits and may prevent them from increasing lending.
"Long-term downward pressure on financial institutions' profits from low interest rates can destabilize the financial system. Although these risks are currently considered to be insignificant, it is necessary to pay close attention to future policy developments."
As expected, the policies of the central bank supported the commitment to maintain short-term interest rates at the level of -0.1% and long-term rates around zero percent by voting 7 against 2.
In the quarterly report, the central bank reduced the main consumer inflation forecast for 2018/19 to 0.9% against 1.1% in July, and for 2019/20 to 1.4% against 1.5% in the previous year. The average CPI for 2000/21 also declined from 1.6% to 1.5%.
The average real GDP forecast for the 2018/19 fiscal year was 1.4% versus 1.5% in July. Real GDP forecast for 2019/20 remained unchanged at 0.8%.
Inflation remains well below the Bank of Japan target of 2%, despite Japan's steady economic expansion, forcing the central bank to maintain stimulus, despite the impact on banks' profits over the years at almost zero interest rates.
The central bank took steps in July to make its policy more sustainable, for example, by allowing bond yields to move more flexibly around its target. But these measures have done little to revive the bond market and did not render assistance to banks.
China's manufacturing PMI fell to a seven-month low of 50.8 in September from 51.3 in August, indicating that the manufacturing sector grew at a relatively slow pace in the month amid the escalating China-US trade war. 10 of the 13 sub-indices were lower than their respective levels in the previous month, while 2 sub-indices were higher than their respective levels in the previous month.
The new export orders index dropped by 1.4 pts from the previous month to 48.0 in September, the lowest level since March 2016, suggesting that the escalating China-US trade war may have weakened export demand for Chinese products. In comparison, the new orders index dropped slightly by 0.2 pts in September, implying that the domestic demand fared relatively well in the month. Meanwhile, the output index slid 0.3 pts in September, showing a moderation in the output growth in September. Also noteworthy is that the input prices index rose to 59.8 in September, well above the critical 50-mark, indicating a fast rise in prices of production inputs in the month.
The Swiss National Bank (SNB) reports a loss of CHF 7.8 billion for the first three quarters of 2018. A valuation loss of CHF 3.7 billion was recorded on gold holdings. The loss on foreign currency positions amounted to CHF 5.3 billion. The profit on Swiss franc positions was CHF 1.5 billion. The SNB's financial result depends largely on developments in the gold, foreign exchange and capital markets. Strong fluctuations are therefore to be expected, and only provisional conclusions are possible as regards the annual result.
The loss on foreign currency positions amounted to CHF 5.3 billion. In terms of current income, interest and dividend income contributed CHF 7.2 billion and CHF 2.7 billion respectively. There was a divergence between bond and equity valuations. Price losses of CHF 8.5 billion were recorded on interest-bearing paper and instruments. By contrast, price gains on equity securities and instruments came to CHF 8.2 billion. Exchange rate-related losses totalled CHF 14.8 billion.
In September 2018, the seasonally adjusted number of new dwellings consented fell 1.5 percent compared with August 2018, following a 6.8 percent rise in August, and a 9.7 percent fall in July.
In the year ended September 2018, the actual number of new dwellings consented was 32,548, up 5.4 percent from the September 2017 year.
The annual value of non-residential building work consented was $6.7 billion, up 4.9 percent from the September 2017 year.
The Consumer Price Index (CPI) rose 0.4 per cent in the September quarter 2018, according to the latest Australian Bureau of Statistics (ABS) figures. This follows a rise of 0.4 per cent in the June quarter 2018.
The most significant rises this quarter are international holiday travel and accommodation (+4.3 per cent), tobacco (+1.8 per cent), property rates and charges (+2.3 per cent), automotive fuel (+1.4 per cent) and fruit (+2.4 per cent). The rise is partially offset by falls in child care (-11.8 per cent) and telecommunications equipment and services (-1.5 per cent).
Child care (-11.8 per cent) saw the largest fall this quarter following the introduction of the Child Care Subsidy on 2 July, which replaced the Child Care Rebate and Child Care Benefit.
| Raw materials | Closing price | % change |
| Oil | $66.47 | -1.66% |
| Gold | $1,222.60 | -1.07% |
| Index | Change items | Closing price | % change |
| Nikkei | +307.49 | 21457.29 | +1.45% |
| SHANGHAI | +25.94 | 2568.05 | +1.02% |
| ASX 200 | +76.90 | 5805.10 | +1.34% |
| FTSE 100 | +9.53 | 7035.85 | +0.14% |
| DAX | -48.09 | 11287.39 | -0.42% |
| CAC 40 | -10.82 | 4978.53 | -0.22% |
| DJIA | +431.72 | 24874.64 | +1.77% |
| S&P 500 | +41.38 | 2682.63 | +1.57% |
| NASDAQ | +111.36 | 7161.65 | +1.58% |
| Pare | Closed | % change |
| EUR/USD | $1,1343 | -0,40% |
| GBP/USD | $1,2707 | -0,71% |
| USD/CHF | Chf1,00515 | +0,33% |
| USD/JPY | Y113,08 | +0,65% |
| EUR/JPY | Y128,28 | +0,39% |
| GBP/JPY | Y143,699 | -0,06% |
| AUD/USD | $0,7103 | +0,61% |
| NZD/USD | $0,6553 | +0,47% |
| USD/CAD | C$1,31115 | -0,13%
|


© 2000-2026. All rights reserved.
This site is managed by Teletrade D.J. LLC 2351 LLC 2022 (Euro House, Richmond Hill Road, Kingstown, VC0100, St. Vincent and the Grenadines).
The information on this website is for informational purposes only and does not constitute any investment advice.
The company does not serve or provide services to customers who are residents of the US, Canada, Iran, The Democratic People's Republic of Korea, Yemen and FATF blacklisted countries.
Making transactions on financial markets with marginal financial instruments opens up wide possibilities and allows investors who are willing to take risks to earn high profits, carrying a potentially high risk of losses at the same time. Therefore you should responsibly approach the issue of choosing the appropriate investment strategy, taking the available resources into account, before starting trading.
Use of the information: full or partial use of materials from this website must always be referenced to TeleTrade as the source of information. Use of the materials on the Internet must be accompanied by a hyperlink to teletrade.org. Automatic import of materials and information from this website is prohibited.
Please contact our PR department if you have any questions or need assistance at pr@teletrade.global.
transfers