- Analiza
- Novosti i instrumenti
- Vesti sa tržišta
Novosti i prognoe: devizno tržište od 04-01-2022
- GBP/USD seesaws near two-month high, inside bearish chart pattern.
- 50-SMA adds strength to the rising wedge’s support around 1.3465.
- Wedge’s resistance, seven-week-old horizontal line guard short-term upside.
- RSI, MACD join sustained trading beyond the key SMA to favor bulls.
GBP/USD keeps the previous day’s pullback from a two-month high of around 1.3530 during the inactive initial Asian session on Wednesday.
The cable pair refreshed the multi-day top the previous day while justifying MACD rebound and firmer RSI line. However, a 12-day-old rising wedge challenges the buyers.
Even so, the sellers may wait for a confirmation of the bearish chart pattern before taking a fresh entry. The 50-SMA level around 1.3465 increases hardships for the bear’s arrival.
In a case where the quote drops below 1.3465, the 200-SMA level near 1.3330 will offer an intermediate halt during the expected south-run targeting December 2021 low of 1.3160.
On the flip side, GBP/USD buyers can aim for the wedge’s resistance line and multi-day-old horizontal hurdle surrounding 1.3610 during further advances.
Following that, November’s high of 1.3697 and October's peak surrounding 1.3835 will be in focus.
GBP/USD: Four-hour chart
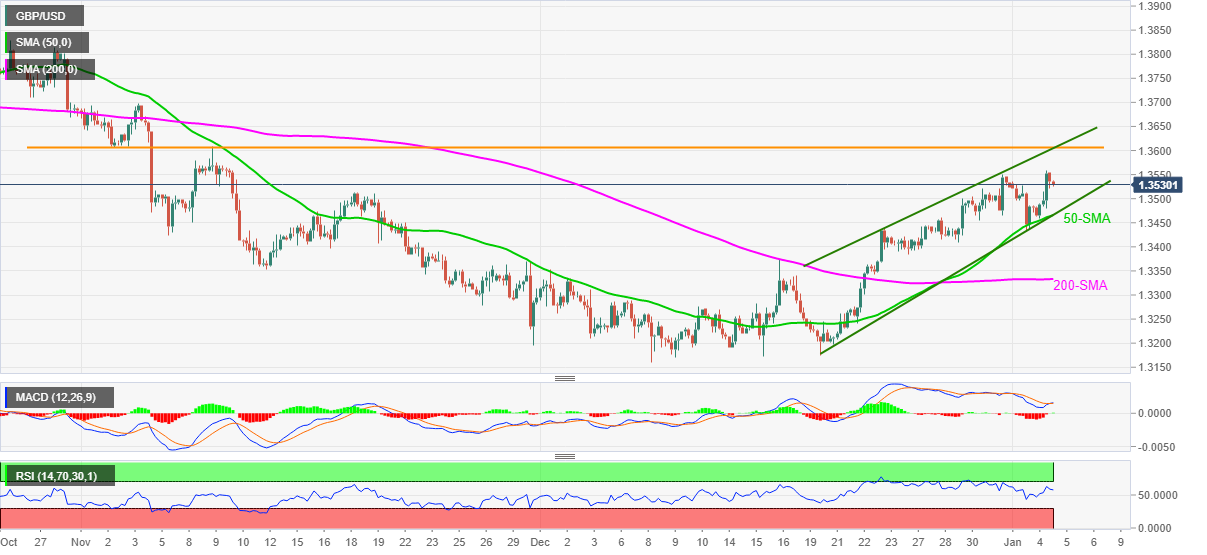
Trend: Further upside expected
- WTI crude oil seesaws around six-week top after a two-day uptrend.
- API stocks marked surprise draw for the latest week, OPEC+ held 400K bpd policy.
- USD pullback adds to the bullish bias ahead of the key data/events.
WTI crude oil prices grind higher surrounding $77.00 during Wednesday’s Asian session.
The black gold rose to the fresh high since November 26 the previous day during the two-day uptrend, backed by likely positives from the Organization of the Petroleum Exporting Countries (OPEC) and its allies, known as OPEC+, as well as a jump in the API stockpile draw. It should be noted, however, that cautious sentiment ahead of the US ADP Employment Change for December and Federal Open Market Committee (FOMC) Meeting Minutes, not to forget the official inventory data from the US Energy Information Administration (EIA) probe the oil bulls.
That said, the latest industry inventory figures from the American Petroleum Institute (API) dropped more than double the previous draw of 3.09M to -6.432M for the week ended on December 31.
On a different page, the OPEC group matched wide market expectations to go ahead with the 400,000 Barrels Per Day (BPD) output hike. “World oil markets are widely expected to remain prone to geopolitics in 2022, with ‘saber-rattling’ over the persistent Russia-Ukraine standoff and ongoing Iranian nuclear negotiations likely to be closely monitored by OPEC+,” said CNBC after the verdict.
Elsewhere, the US ISM Manufacturing PMI dropped to the lowest in 11 months in December, 58.7 versus 60.0 forecast and 61.1 prior, whereas November’s JOLTS Jobs Openings came in lower than the upwardly revised previous reading of 11.091M to 10.562M.
The downbeat US data joined the market’s firmer sentiment, amid hopes of less severe virus contagion, joined downbeat US inflation expectations to probe the US dollar bulls and favor oil buyers the previous day. the US inflation expectations, as per 10-Year Breakeven Inflation Rate numbers from the Federal Reserve Bank of St. Louis (FRED) eased from a six-week high to 2.57% at the latest, which in turn tamed Fed rate-hike chatters.
That said, the US data and risk catalysts are likely to direct short-term oil moves. While the US ADP and FOMC Minutes are the keys for clear direction, weekly prints of the EIA Crude Oil Stocks Change for the week ended on December 31, expected -3.4M versus -3.576M prior, will also be important to watch.
Technical analysis
Although RSI conditions challenge further upside, WTI bulls remain hopeful until witnessing a clear downside past the 100-DMA level of $74.55. Alternatively, the late November’s swing high, close to $79.00, and the $80.00 threshold restricts short-term advances.
- EUR/USD remains pressured around two-week low despite the latest sideways grind.
- Steady RSI backs bearish moving average crossover, break of 12-day-old support.
- Weekly horizontal line tests intraday sellers, bulls need 200-SMA break for conviction.
EUR/USD stays depressed around 1.1285 near a fortnight low amid the initial Asian session on Wednesday, following a two-day south-run.
In doing so, the major currency pair justifies the bearish cross of the 50-HMA under 200-HMA, as well as a clear downside break of an upward sloping trend line from December 19, currently around 1.1305.
Given the steady RSI line baking the aforementioned bearish technical catalysts, the latest grind to the south may continue.
However, a horizontal area comprising lows marked since December 19, around 1.1275-70 may challenge the EUR/USD sellers before directing them to the year 2021 low near 1.1185.
Adding to the downside filters are the levels surrounding 1.1230 and the 1.1200 threshold.
Meanwhile, the corrective pullback may aim for the previous support line near 1.1305 but may remain elusive until crossing the 200-HMA level close to 1.1325.
Following that, a run-up towards 1.1360 and December’s high around 1.1385 can’t be ruled out.
EUR/USD: Hourly chart
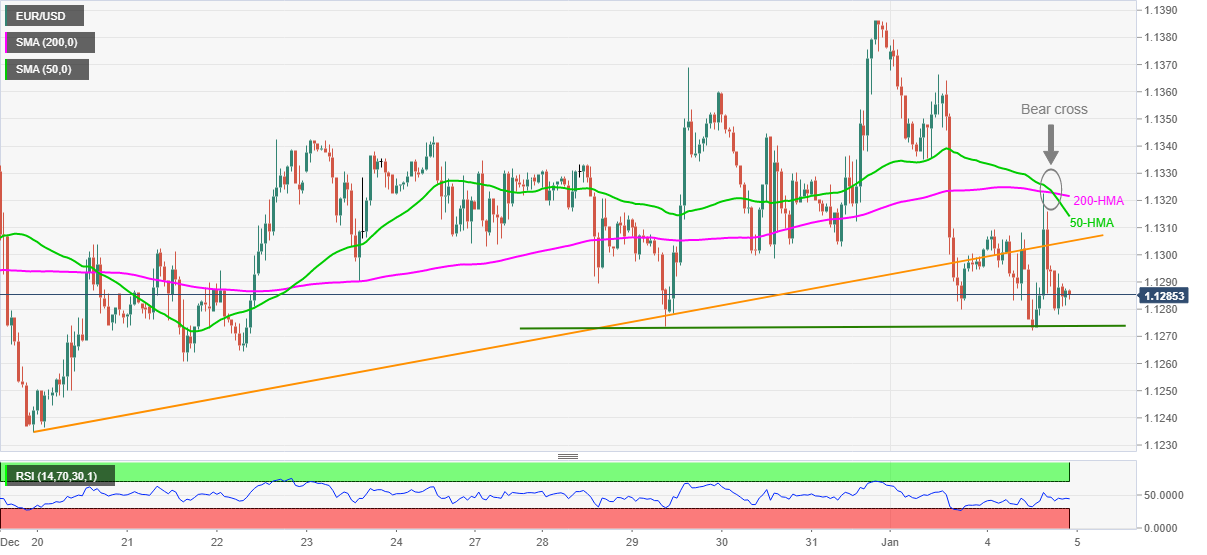
Trend: Further weakness expected
- The NZD/JPY marches firmly upwards gains 0.98%.
- Central bank policy divergence between the RBNZ and the BoJ favors the NZD.
- NZD/JPY Price Forecast: The double-bottom in the daily chart targets 80.00.
The NZD/JPY pair surges as the New York session ends, trading at 78.65 at the time of writing. Risk-sensitive currencies like the New Zealand dollar advanced against safe-haven peers, sharply against the low-yielder Japanese yen, as market participants’ mood deteriorated as the Wall Street’s session progressed.
Despite the aforementioned, NZD bulls keep in control. The NZD/JPY is a pure risk-sentiment play. However, it coincides with central bank divergence between the Reserve Bank of New Zealand (RBNZ) and the Bank of Japan (BoJ) at the time of writing.
In November’s meeting, the RBNZ decided to raise interest rates by 25 basis points, leaving the bank rate at 0.75% while eyeing the Official Cash Rate (OCR) at 2.60% by the end of 2023. Contrarily, the BoJ would keep rates unchanged for the foreseeable future, and although the emergency pandemic stimulus was scaled back, they extended it for smaller firms until March of 2022.
Market mood
The challenge for NZD/JPY traders would be the assessment of the risk sentiment, which is greatly influenced by China. The Omicron variant and the Covid-zero policy maintained by China could undermine appetite for riskier assets, so in that event, the Japanese yen might appreciate.
Therefore, it is recommended for NZD/JPY traders to keep an eye to global equities, Chinese developments, and the Volatility Index (VIX) for clues that would help them position themselves, depending on the risk-market mood.
NZD/JPY Price Forecast: Technical outlook
The NZD/JPY daily chart shows a double-bottom formation. Furthermore, at press time, the “neckline” of the chart pattern confluences with the 200-day moving average (DMA) around the 77.96-78.03 range, which NZD bulls are likely to defend as the double-bottom targets 80.00.
To the upside, the NZD/JPY first resistance would be 79.50. A breach of the latter paves the way for further upside. The following line of defense for JPY bulls would be the double-bottom target at 80.00, followed by November 5, 2021, a daily high at 81.34.
-637769329376649764.png)
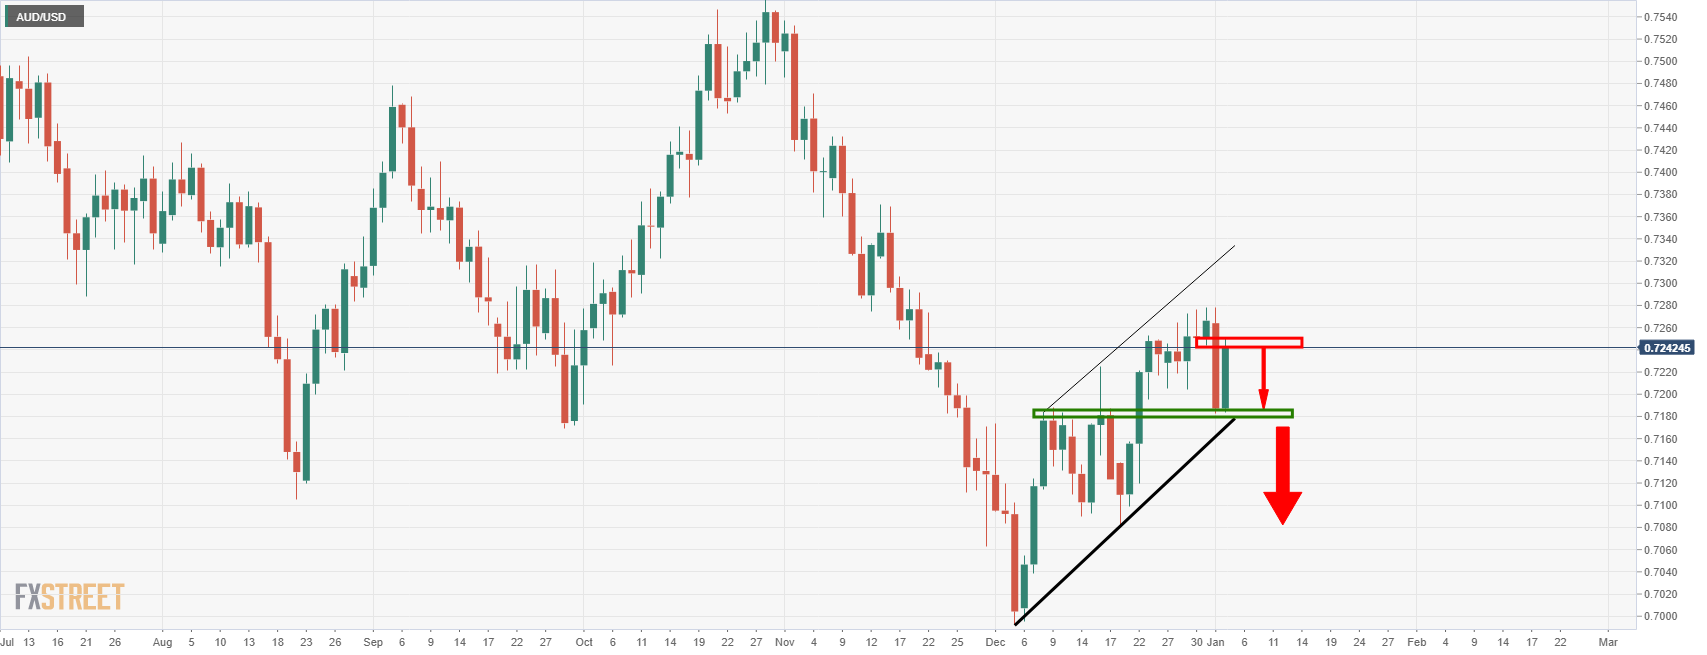
- AUD/USD grinds higher after positing the biggest daily gains in two weeks, also bouncing off fortnight low.
- Virus infections increase but WHO finds another evidence of less severity, gold prices, Aussie PMIs helped bulls to take chance.
- US ISM Manufacturing PMI, JOLTS Job Openings came in softer, inflation expectations eased too.
- US ADP Employment Change, FOMC Minutes will be the key.
AUD/USD retreats towards 0.7200, around 0.7235 by the early Wednesday morning in Asia while fading the previous day’s corrective pullback. The Aussie pair cheered cautious optimism in the markets, as well as upbeat data at home and softer US figures to consolidate Monday’s heavy losses.
Among the positives were the comments from World Health Organization (WHO) official that again tried to placate fears over the South African covid variant, Omicron. "We are seeing more and more studies pointing out that Omicron is infecting the upper part of the body. Unlike other ones, the lungs who would be causing severe pneumonia," WHO Incident Manager Abdi Mahamud told Geneva-based journalists per Reuters.
On the same line was the zero infections in West Australia for the first time in nearly a week. However, Aussie national count refreshed record top infection with close to 53,000 cases a day.
It’s worth noting that a jump in the global vaccinations also keeps policymakers hopeful of overcoming the pandemic, which in turn favored the riskier assets like gold, equities and AUD/USD.
That said, gold rose 0.74% to $1,814 while Wall Street benchmarks also tried to remain positive even as Nasdaq dropped 1.3% and S&P 500 stepped back from record top. Further, the US 10-year Treasury yields refreshed a six-week high before easing to 1.65% by the end of Tuesday’s North American session.
Talking about data, Australia’s Commonwealth Bank Manufacturing PMI surged to 57.7 in December versus the earlier forecast of 57.4. For the US, the ISM Manufacturing PMI dropped to the lowest in 11 months in December, 58.7 versus 60.0 forecast and 61.1 prior, whereas November’s JOLTS Jobs Openings came in lower than the upwardly revised previous reading of 11.091M to 10.562M.
Also, the US inflation expectations, as per 10-Year Breakeven Inflation Rate numbers from the Federal Reserve Bank of St. Louis (FRED) eased from a six-week high to 2.57% at the latest, which in turn tamed Fed rate-hike chatters and helped AUD/USD to rebound. Additionally probing the Fed hawks were comments from Minneapolis Fed President and 2022 voting FOMC member Neil Kashkari, who said on Monday that he now sees two rate hikes in 2022, versus the money market bets of three rate lifts.
Alternatively, cautious sentiment ahead of this week’s key data docket from the US and steadily rising covid cases join the news of a new virus variant that spreads faster than Omicron challenging the market sentiment and AUD/USD prices.
For the day, AUD/USD traders should pay attention to the risk catalysts ahead of the US ADP Employment Change for December and Federal Open Market Committee (FOMC) Meeting Minutes. While the anticipated easing in the ADP may help the Aussie pair to keep the latest rebound, the hawkish tone of the policymakers in the FOMC Minutes will be enough to keep the quote weak.
Read: US ADP December Preview: Suddenly its inflation, not jobs
Technical analysis
The AUD/USD pair’s failure to keep the bounce off 100-SMA joins bearish MACD signals and RSI retreat to favor sellers. However, confirmation of the monthly rising wedge and a downside break of 200-SMA becomes necessary for the bears to take an entry, which in turn highlights the 0.7170 level as the key support.
Alternatively, further advances may aim for 0.7250 but a six-week-old horizontal area restricts short-term upside around 0.7280. Adding to the upside filter is the stated wedge’s upper line near 0.7285.
- XAU/USD bulls step in with eyes on the $1,820s eyed.
- The price is in a consolidation area, with $1,808 on the downside in focus.
- Traders are awaiting key US data this week, while the stock market cheers a positive start.
The price of gold (XA/USD) is firmly bid at $1,815 and rises 0.75% following a rise from $1,798.51 to a high of $1,816.81. The US dollar was offered at the end of the European session which helped the precious metal to rally from the lows of the day to test a 61.8% Fibonacci retracement of the hourly drop which leaves XAU/USD consolidating into the Wall Street close.
In this regard, US stocks were on fire again with the Dow Jones Industrial Average hitting yet another closing record on Tuesday at 36,799.65 points. US data was firm to start the year creating positive vibes amongst traders returning from the holiday season eager for gains.
US data in focus
Investors are betting on a strong recovery as the covid fears abate which sent a wobble into the tech sectors, weighing on the Nasdaq that ended down 1.4% in its biggest decline since December. The S&P 500 was mostly unchanged.
US data showed demand for workers was historically high again in November, with a record 4.5 million Americans quitting their jobs as labour shortages continue to strain employers, though the impact of the latest virus wave has yet to show.
This week's US Nonfarm Payrolls will be key in this regard and the pace of that momentum in terms of US growth. however, remains at the helm of the Federal Reserve. The minutes of the last meeting will be released on Wednesday.
These are from the December 14-15 Federal Open Market Committee meeting in which Fed Chair Powell confirmed the Fed's intention to begin tapering QE and lift interest rates in 2022. Traders will be paying close attention to the language for clues to when a rate hike could fall as it gears up for a potential rate hike as potentially soon as this quarter to deal with rising inflation.
Meanwhile, ahead of Friday's pivotal December labour market report, Wednesday's ADP employment report will give Wall Street a peak as to how many new jobs were created last month. traders will be looking for an outsized number that could nudge up the current consensus estimate of +422K for December NFP.
As for Omricon, the news could not get much better for markets that tend to err on the more positive side of cautionary optimism. Early laboratory studies have shown the more transmissible variant replicates less efficiently once inside the lung tissue. Scientists are using the word “milder” with much trepidation to describe the illness conferred by the Omicron variant of SARS-Cov-2.
However, it is widely accepted that even if the variant is milder, the sheer number of people it infects might lead to more hospitalisations overall, with healthcare workers having to isolate due to testing positive. Nevertheless, with angst surrounding the omicron variant having sparked a safe-haven bid in gold, it could be vulnerable to some downside if the covid bid is unsound in the CTA space.
Meanwhile, analysts at TD Securities stated that higher gold prices are inconsistent with global markets pricing in a 70% probability for a Fed rate hike in March, which places a cap on prices. ''Participants remain focused on the central bank's exit, but the virus' spread threatens both demand and supply-side forces, which could affect the US growth outlook, suggesting that the Fed may want to remain cautious until the Omicron wave this winter subsides.''
Gold technical analysis
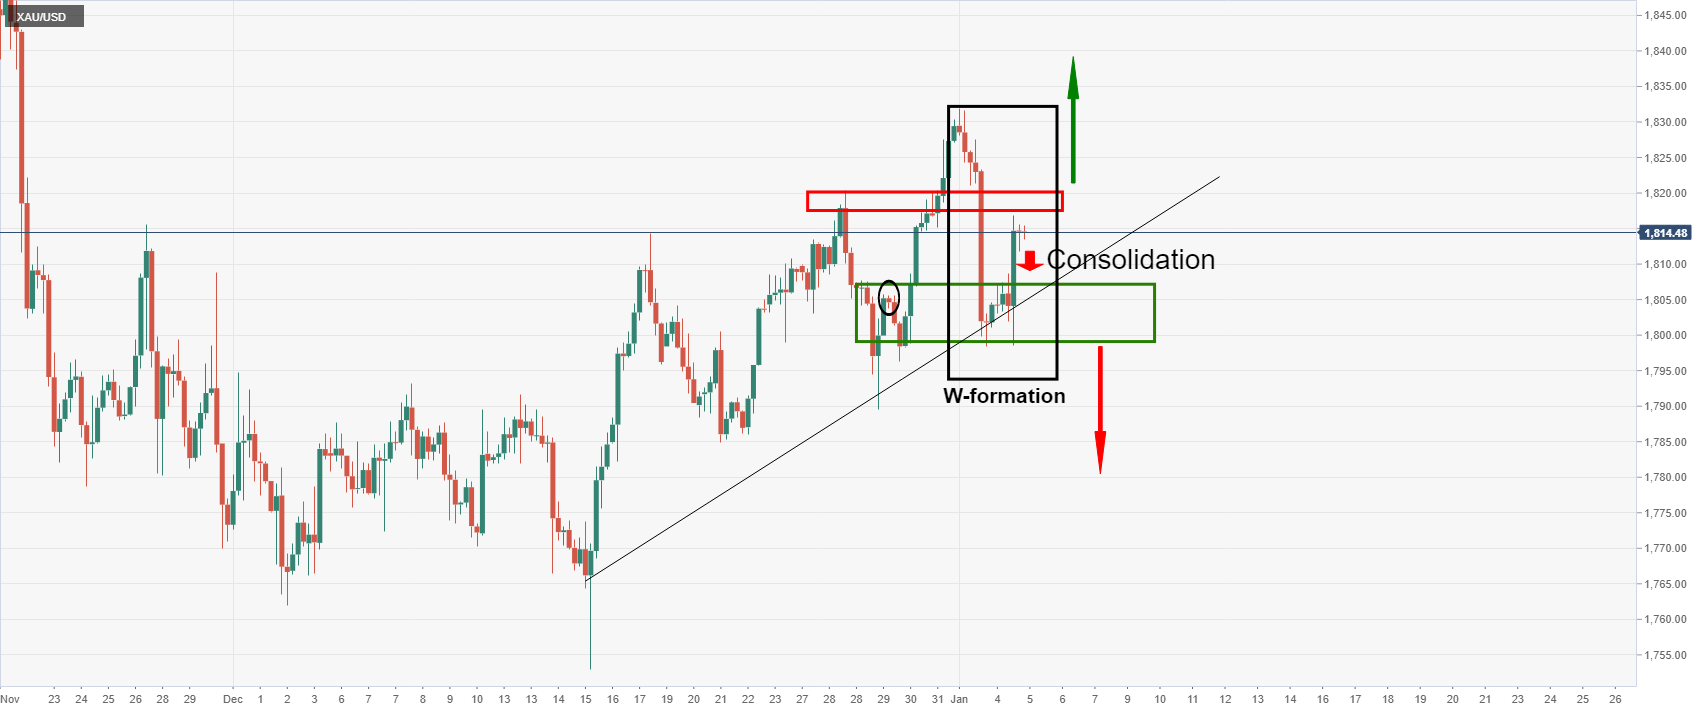
The price is moving into a phase of consolidation while trapped between the support and resistance in the 4-hour chart. There is some mitigation likely on the card to the downside with $1,808 eyed and the same could be said of the upside into $1,821.
- The yen got broadly battered on Tuesday amid a sharp rise in global developed market bond yields.
- The pair is now eyeing a break above key trendline resistance and a move to 84.50.
AUD/JPY surged nearly 1.5% on Tuesday, its largest one-day move since October, and has in recent trade moved above the 84.00 level for the first time since early November. With Monday’s stumble that saw the pair drop momentarily back below the 83.00 level now well in the rear-view mirror, AUD/JPY is looking to break above a resistance trendline that has been capping the price action going back to 8 December, so for nearly one-month. At current levels, the pair trades about 0.5% higher on the week. A clean break above this trendline and the 84.00 level would open the door to a move to the next area of resistance around 84.50. Longer-term bulls will likely be betting on an eventual move back to Q4 2021 highs around 86.00.
In terms of the drivers of Tuesday’s strength, the first thing to note is that Monday’s drop never really made that much sense at the time anyway. Recall, that the pair dropped under 83.00, its worst decline in over a month, despite gains in strongly risk-on market conditions in global equity, bond and commodity markets. FX markets seem to have recognised the error of their ways on Tuesday and, amid a continued surge in long-term global developed market yields (including in Australia), have sent the yield-sensitive yen decisively lower. After all, if global bond, equity and commodity markets are moving to price in a rosier long-term economic outlook, it makes sense for AUD/JPY to move higher, not lower.
- GBP/USD has eased back from earlier session highs above 1.3550, but remains well supported above 1.3500.
- UK PM Boris Johnson again played down the need for tougher UK lockdowns, which may have helped sterling.
GBP/USD has eased back from earlier session highs above 1.3550 (the pair’s highest levels since early November) in recent trade and is back to roughly in line with where it opened on the year in the 1.3520s. That means it still trades higher by about 0.4% or over 50 pips on the day, having rallied from Asia Pacific levels in the 1.3475 area, with Monday’s dip abck towards the 50-day moving average in the 1.3420 area (at the time) now having proven to have been a good entry point for the short-term bullish speculators.
Technicians note support in the 1.3550 area (recent highs) and in the low 1.3400s (this week’s lows and the 50DMA). For now, it seems the pair’s bullish trend, which has seen it rally from lows under 1.3200 as recently as mid-December (a more than 2.5% rally), remains intact. Providing there isnt a sharp downturn for the pair in the coming days, GBP/USD’s 21DMA should cross to the north of its 50DMA, which may increase short to medium-term buying interest in the pair.
GBP/USD was primarily driven by risk appetite and USD flows on Tuesday. Regarding the former, risk appetite remains positive, as emphasises by the recent rallies in long-term developed market government bond yields to price in a more optimistic economic outlook for 2022 and beyond, which seemed to aid GBP on the day. Indeed, risk-sensitive sterling was the second-best performing G10 currency on the day after AUD, perhaps aided by the fact that UK PM Boris Johnson continues to signal that a tightening of lockdowns is not at present needed to curb Omicron transmission in the UK.
The pair was also given a helping during US hours following mixed US economic data (headline ISM manufacturing and JOLTS Job Openings disappointed). But the data has not been interpreted as broadly altering the prevailing narrative of that the US economy is in a state of strong growth, high inflation (though this is expected to ease in 2022) and a tight labour market. This story will receive further inputs later in the week in the form of the ISM Services PMI survey and the official December jobs report, but all arrows at this stage point towards the Fed pressing ahead tightening this year. Wednesday sees the release of the FOMC minutes, which are expected to contain a hawkish bias to reflect the hawkish policy announcement, with traders on the lookout for Quantitative tightening chatter. That suggests upside risks for the USD later this week.
- The New Zealand dollar advances some 0.38% as the Wall Street end of the session approaches.
- US ISM Manufacturing PMI came worse than expected, but purchasers’ prices diminished 14.2 points.
- NZD/USD has a neutral-bearish bias, but failure to break above 0.6830 would open the door for further losses.
The New Zealand dollar edges slightly up during the New York session, clinging to the 0.6800 figure at the time of writing. The market sentiment is mixed, though the NZD has risen in tandem with other risk-sensitive currencies like the AUD and the GBP against the greenback, despite higher US Treasury yields, with the 10-year benchmark note at 1.66%, up to three basis points in the day.
In the meantime, an absent New Zealand economic docket, spurred by holidays in New Zealand, kept the NZD/USD pair leaning on US economic data. Meanwhile, the US economic docket featured the US Institute for Supply Management (ISM) Manufacturing PMI for December in its final reading, which came at 58.7 vs. 60 estimated by analysts, worse than expected.
Despite being poor data, the decline came at the expense of “sharp declines in delivery times and prices were key drivers of the decline and signal at least some welcome improvement in terms of diminishing inflationary pressure,” as commented by Wells Fargo analysts. Further, the analysts noted that “the biggest message from today’s report is that the prices paid component plunged 14.2 points in December.”
Therefore, once the data crossed the wires, the NZD/USD spiked to 0.6820, facing strong selling pressure and returning to the 0.6800 figure almost immediately. Rallies in the NZD/USD could be viewed as opportunities for USD bulls to position themselves as long as US T-bond yields keep rising.
NZD/USD Price Forecast: Technical outlook
The NZD/USD 1-hour chart shows that the pair has a neutral-bearish bias, as the hourly simple moving averages (SMAs) remain above the spot price.
During the New York session, the NZD/USD upward move faced strong resistance around the 0.6820 area, retreating to the 0.6800-10 area, as NZD bulls would not be able to sustain the trend, despite poor US economic data, with the ISM Manufacturing PMI for December, falling short of expectations.
To the upside, NZD/USD’s first resistance would be the R1 daily pivot at 0.6836. A decisive break of the latter would expose the January 3 daily high at 0.6856, followed by the R2 daily pivot at 0.6888.
On the other hand, failure to break the abovementioned would open the door for USD bulls to enter fresh bets vs. the NZD, as the bond yield differential shrank as Federal Reserve tightening expectations have increased since December 2021 last monetary policy meeting.
The first support would be 0.6800. A breach of that level would expose the January 4 daily low at 0.6764, followed by the December 22 swing low at 0.6740.
- AUD/USD bears eye a run to test 0.71 the figure for the coming days.
- Bears need to break 0.7180 for a fast run to 0.7150 support.
AUD/USD is correcting in a weekly and daily move that may have run its course. The following illustrates the market imbalances and structures in a top-down analysis from a bearish perspective.
AUD/USD daily chart
As illustrated, the price is attempting to rally from the trendline support within the rising channel. However, if the bulls fail to break the resistance through 0.7250, the focus could quickly shift back to the downside and bears will be looking for a downside continuation and break of 0.70 the figure as per the weekly chart:
AUD/USD Weekly chart
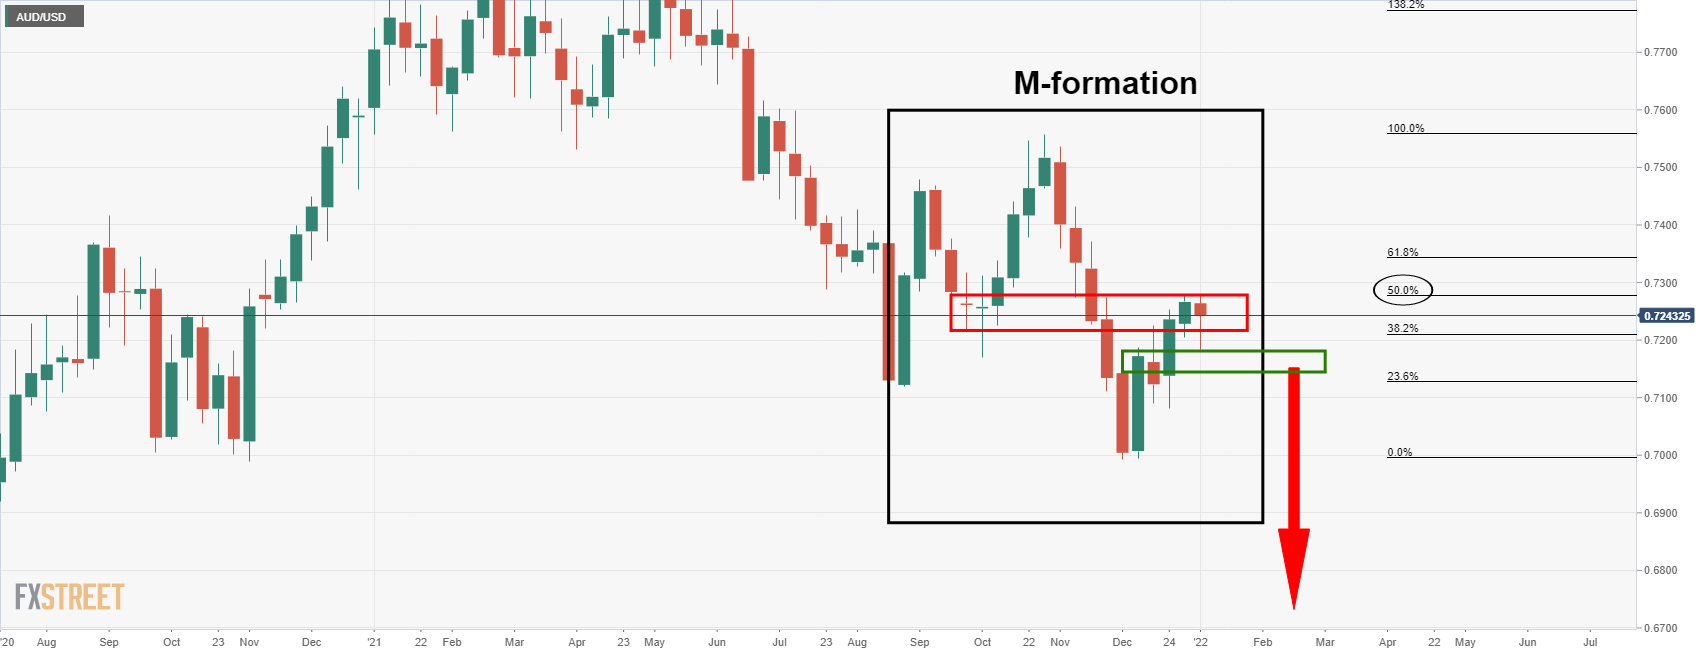
As illustrated, the price has met the M-formation's neckline which would be expected to act as resistance. This also has a confluence with the 50% mean reversion of the weekly bearish impulse. 0.7150 support is key in guarding against a downside continuation towards and through the weekly lows of 0.6995.
AUD/USD H1 charts
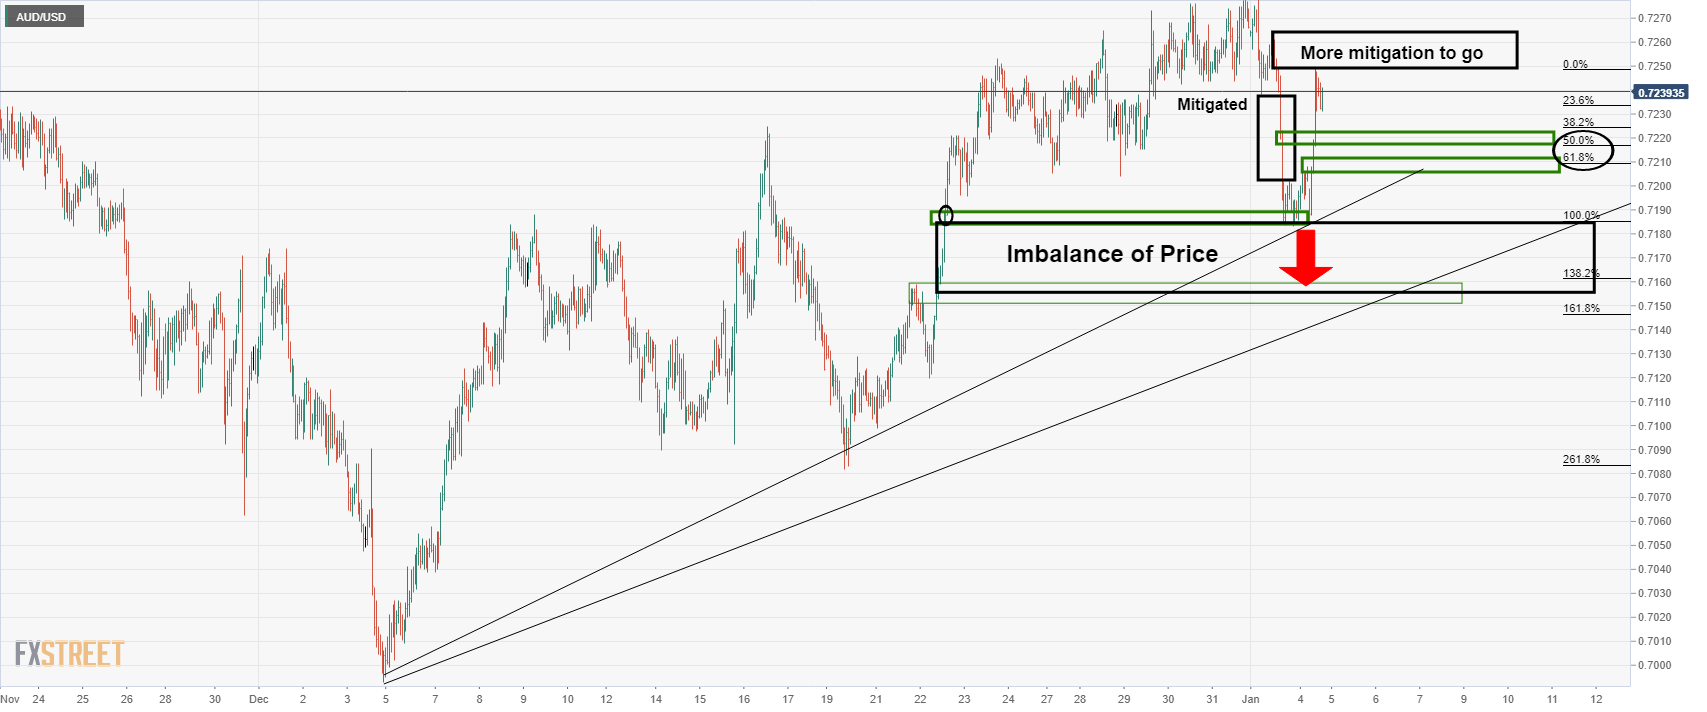
Meanwhile, from a nearer term outlook, the bears are stepping in following a recent surge to the upside that has mitigated almost all of the prior imbalance from the bearish impulse. With that being said, the bulls will be keen to mitigate all of the imbalance to towards 0.7253 which could play out as follows:
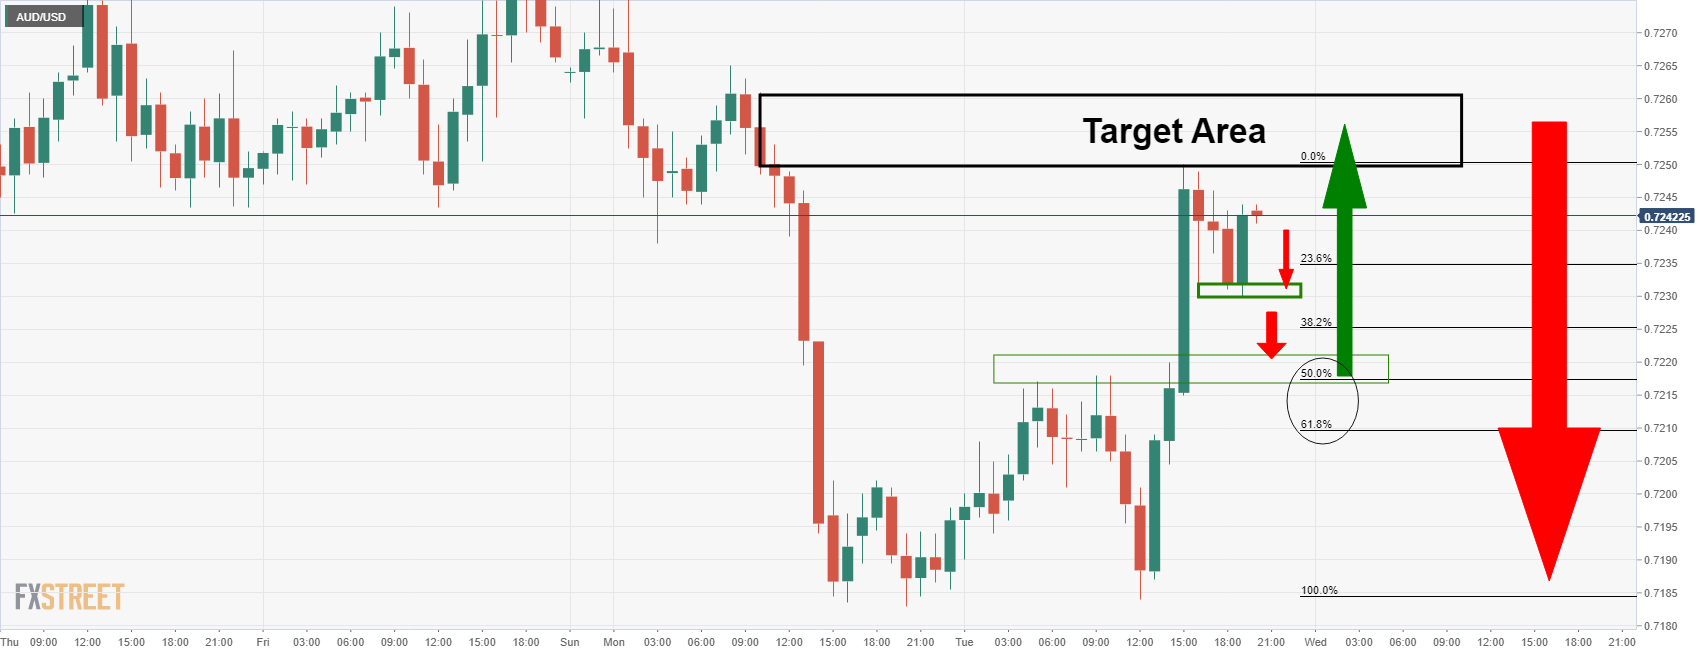
Or...
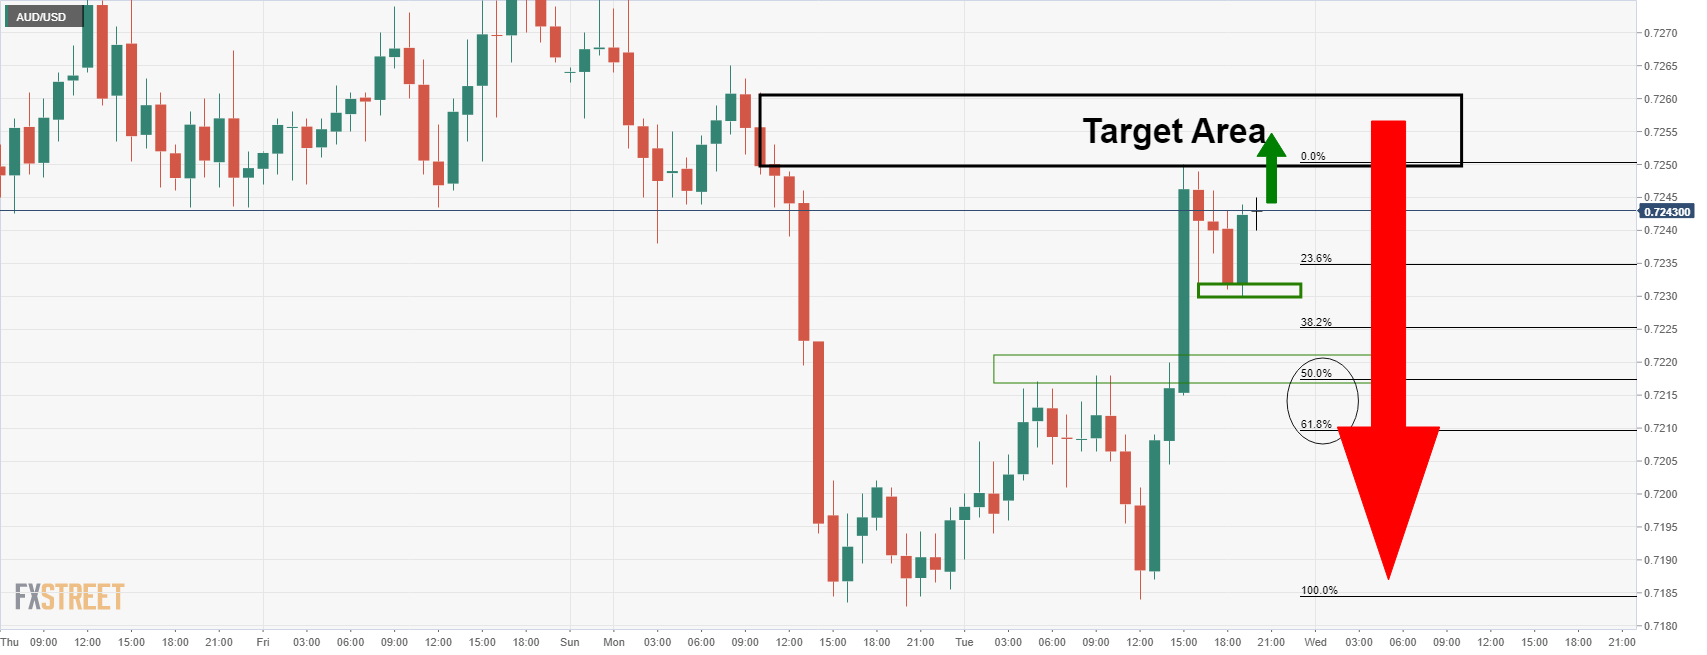
Should the bears have already gathered enough sell liquidity, then the price can easily deteriorate from here which leaves the 61.8% Fibo as the last defence ahead of a restest of the hourly lows at the dynamic trendline support near 0.7180. If that breaks, then sell stops around 0.7150 could be quickly tested exposing 0.71 the figure for a test in the coming days.
- USD/CAD has risen back to the 1.2700 level in recent trade after bouncing at the 50DMA in the 1.2660s.
- Strength in oil prices post-optimistic OPEC+ meeting has underpinned the loonie, as has a generally more risk-on FX market tone.
USD/CAD has risen back to the north of the 1.2700 level again having found support in recent trade just above its 50-day moving average at 1.2664. The pair is still trading with reasonable losses on the day of around 0.3% or just over 30 pips, as FX markets adopt a significantly more risk-on posture on Tuesday. That compares to Monday’s more defensive/risk-off bias that saw USD/CAD rally as high as 1.2780, with the 21-day moving average, which as at the time close to 1.2790, coming in to provide resistance. From a technical perspective, USD/CAD is currently locked between a 1.2660-1.2780ish range, with weekly extremes at either end of this range combined with the 50 and 21DMAs likely to act as support and resistance and make a breakout more difficult.
Oil prices hit fresh multi-week highs on Tuesday, with WTI pushing above $77.50 earlier in the session, providing support for the loonie. OPEC+’s decision to press ahead with a 400K barrel per day output hike in February amid an upbeat take on the outlook for demand seemed to instil some optimism in oil markets. There is clearly potential for more gains on the cards as market participants bid economically sensitive stocks and long-term yields higher in a vote of confidence in the economic outlook for 2022 and beyond. That suggests downside risks for USD/CAD, so bears might be looking for a test of December lows in the low-1.2600s at some point in the coming days/weeks.
But this might be a tall order as FX strategists have been noting upside risks to the dollar this week. Wednesday’s December Fed meeting minutes are likely to include hawkish chatter about the potential for quantitative tightening in 2022 once rate hikes are underway. Meanwhile, further US data later this week (ISM services PMI and the official jobs report) are unlikely to alter the prevailing narrative that the US economy is in a state of strong growth, high inflation (though this is expected to ease in 2022) and seeing a very tight labour market.
What you need to know on Wednesday, January 5:
The greenback kept advancing on Tuesday, posting the most notorious advance against the yen. USD/JPY jumped to 116.36, its highest since January 2017, as the dollar surged alongside US government bond yields. Demand for the American currency receded with Wall Street’s opening, with the dollar ending the day unevenly across the FX board.
US indexes were mixed, with the DJIA reaching a record high and holding on to gains, but the Nasdaq Composite shedding roughly 300 points. The S&P posted an all-time high but ended the day with modest losses.
US Treasury yields continued to advance. The yield on the 10-year note hit 1.686%, holding around 1.66% at the end of the day.
The OPEC+ announced its next meeting for early February, agreed to stick to its current policy of increasing 400,000 bpd. Crude oil prices edged higher, flirting with their recent highs but retreating some ahead of the close. WTI settled at $77.00 a barrel.
Gold recovered and retained its gains by the end of the day, closing the day at around $1,814.80 a troy ounce.
The GBP/USD pair jumped to 1.3556, holding on to gains and currently trading at around 1.3550 after UK PM Boris Johnson said in a news conference that, given that the country is not seeing the same numbers in intensive care, the UK has a chance to ride out this Omicron wave without shutting down.
EUR/USD advanced as demand for the greenback reversed, but it was unable to hold on to gains and settled at around 1.1290. Commodity-linked currencies posted gains vs the dollar, with AUD/USD now trading at around 0.7240 and USDCAD changing hands at 1.2700.
Europe keeps reporting record coronavirus contagions, as the Union is in the middle of the peak of the Omicron wave. The number of deaths and hospitalizations is still low, but there’s some disruption in day-to-day activity amid the mandate to isolate those suffering the illness. Meanwhile, France announced the discovery of a new coronavirus variant, IHU, with has more variants than Omicron.
Top 3 Price Prediction Bitcoin, Ethereum, XRP: Crypto market forms multiple bear traps, bullish reversals incoming
Like this article? Help us with some feedback by answering this survey:
- The growth stock-heavy Nasdaq 100 index is sharply underperforming on Tuesday amid a sharp rise in long-term US rates.
- The yield rally reflects a pumping of economic optimism that is lifting “value” and “cyclical” stocks, helping the Dow higher.
- The net result for the S&P 500 is that it has dipped back under 4800 again.
The main news in US equities on Tuesday is rotation from growth stocks into value. The tech-heavy Nasdaq 100 index, which is seen by many as a proxy for growth, has come under heavy selling pressure on Tuesday, dropping around 2.0% from around 16.5K to the 16.15K area. The valuation of so-called growth stocks, which include many big tech names, is disproportionately dependent on expectations for future earnings growth rather than current earnings. Thus, growth stock valuations are disproportionately negatively exposed to a rise in long-term interest rates, which increases the opportunity cost of betting on future earnings growth as opposed current earnings.
And an increase in long-term interest rates is exactly what is being seen on Tuesday. US 30-year yields are up 6bps to around 2.07%, their highest level in months, while 10s are up just nuder 4bps to above 1.65% and near Q4 2021 highs. As a result, big names like Apple, which surpassed $3T in market capitilisation on Monday (the first stock to do so), is down 1.3% on Tuesday, Amazon is down 2.2%, Microsoft is down 2.4%, Alphabet is down 0.7%, Facebook is down 1.2% and Tesla is down 4.7%.
The increase in long-term yields this week which has seen US 10s rally 15bps and 30s 17bps in just two days is a reflection of a sharp increase in optimism about the outlook for the US economy in not just 2022, but the years beyond. That means stocks more exposed to the health of the economic cycle (as their valuation disproportionately depends on current earnings) have been performing well. The Dow, seen by some as a proxy for so-called “value” or “cyclical” stocks as it gives a higher weighting to financial, industrial, material and energy names, is up 0.6%.
The net result for the S&P 500 is that it is down about 0.2% and trading close to the 4780 level, having printed record intra-day highs just under 4820 earlier in the session. Mixed US economic data has largely been ignored and has not been interpreted as broadly altering the prevailing narrative that the US economy is in a state of strong growth, high inflation (though this is expected to ease in 2022) and a tight labour market. This story will receive further inputs later in the week in the form of the ISM Services PMI survey and the official December jobs report, but all arrows at this stage point towards the Fed pressing ahead tightening this year. Wednesday seen the release of the FOMC minutes, which are expected to contain a hawkish bias to reflect the hawkish policy announcement, with traders on the lookout for Quantitative tightening chatter.
- The British pound surged in the New York session up 1.03%.
- The GBP/JPY Tuesday’s upward move stalled near the R3 daily pivot.
- The GBP/JPY has an upward bias as GBP bull’s eye the 2021 year-high.
In the New York session, the British pound rallied against the Japanese yen, trading at 157.08 at the time of writing. A risk-on market mood spurred demand for risk-sensitive currencies like the GBP to the detriment of safe-haven peers like the JPY.
Since the overnight session, the cross-currency was seesawing around the daily pivot point at 155.42, then rallied sharply, breaking the R1, and R2 daily pivot levels, stalling at 157.43, 8-pips short of the R3 daily pivot at 157.51.
In the meantime, the daily moving averages (DMAs) reside below the 153.00 figure, with the 50-DMA being the closest to the spot. At the same time, the 100-DMA is about to cross over the 200-DMA, which would be another bullish signal that could send the GBP/JPY rallying towards the 2021 year-high at 158.22.
Upwards, the path of least resistance for the GBP/JPY as witnessed by the price action first resistance level would be 157.50. A breach of the latter would expose crucial supply zones, like 158.00, followed by the 2021 high at 158.22.
On the other hand, the cross-currency first support level would be the May 28 daily high, previous resistance-turned-support at 156.06, followed by June 23, 2021, daily high at 155.15, followed by the psychological 155.00
GBP/JPY Daily chart
-637769200467369064.png)
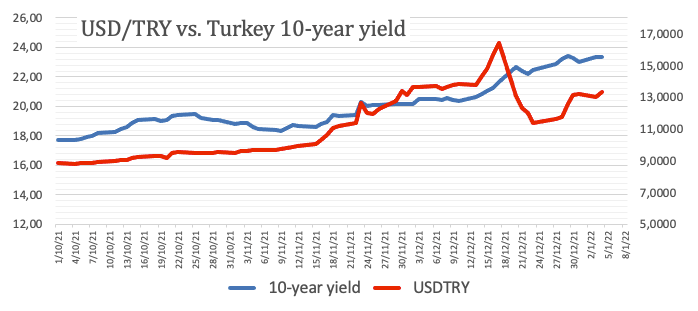
- USD/TRY bears are stepping in at a critical level of resistance on the daily chart.
- TRY could find further stability as we approach planned elections scheduled for no later than mid-2023.
The price has hit a crossroads according to the technical structure of the market and recent price action. The following illustrates this from a daily perspective taking into consideration the prior volumes of transactions conducted just below 14 the figure and the confluence of the 38.2% Fibonacci retracement level as follows:
USD/TRY Daily chart
-637769183713608855.png)
As illustrated in the above chart, the price has made a classic bearish impulse followed by a decelerating correction into a key zone of resistance. The price action has been driven by central banking fundamentals and uncertainties in that regard persist due to the unprecedented course of action by Turkish officials combatting the highest levels of inflation since 2002, (Turkey's consumer price inflation jumped to 36.08 per cent year-on-year in December 2021, up from 21.31 per cent in the previous month).
Most central banks raise interest rates to help cool inflation but Turkey has gone the other way. In a speech on Monday, he said Turkey was "going through a transformation in economy and rising to the next league".
Given that Tayyip Erdogan prioritises exports over currency stability, there is going to be more volatility and inflation risks ahead as the central bank is unlikely to act. Mr Erdogan overhauled the central bank's leadership last year. The bank has already slashed rates to 14 per cent from 19 per cent since September despite the central bank's official inflation target being just 5 per cent.
The further Erdogan digs a hole for himself, the lira could find further stability as we approach planned elections scheduled for no later than mid-2023. The economic turmoil has already started to hit President Erdogan's opinion poll ratings as Erdogan's scheme to curb the lira's weakness has been seen to fail.
- Spot silver jumped back above $23.00 on Tuesday despite a sharp upside in US real yields.
- Precious metals seemingly took advantage of a weakening dollar (against most of its G10 peers) after underwhelming US data.
Despite a continued sharp rise in US real yields that would typically be a negative for precious metals given the increased opportunity cost associated with non-yielding assets, spot silver (XAG/USD) prices have gained ground on Tuesday. Spot prices have in recent trade rebounded back to the north of the $23.00 per troy ounce level after finding support in the $22.60s in the late European morning. Buyers came in ahead of last week’s $22.60 low and the 21-day moving average at $22.55. Short-term silver bulls will now be eyeing a test of recent highs in the $23.40 area which happen also to coincide with the 50DMA at $23.39.
Silver and other precious metals (like gold) have gained ground on Tuesday as they take advantage of dollar weakness (USD is lower against all G10 currencies aside from the euro and yen, which is keeping the DXY flat). US data seems to have net-net weighed on the buck on Tuesday after the ISM manufacturing survey showed activity slowing in December and inflationary pressures as a result of supply chain snags subsiding substantially. Meanwhile, the headline JOLTs Job Opening figure also missed expectations and there appear to be some bets mark participants making bets that this will alleviate some pressure on the Fed to tighten so aggressively this year.
The JOLTs survey did indicate a record number of people quitting their job in November, however, which is seen as one of the best indicators of a hot labour market (people confident they can “do better” than their current job). Meanwhile, the most dovish (historically) Fed member Neil Kashkari said he now sees two rate hikes in 2022, having not long ago wanted the Fed to wait into 2024 before hiking. Real yields seem to be getting the message that economic conditions, despite today’s minor data blips, still warrant some Fed tightening and the Fed seems ready to eagerly oblige.
10-year TIPS yields are above -0.95% on Tuesday, having surged from under -1.10% as recently as last Friday as traders bet on higher long-term interest rates (that will be closer to long-term inflation) as economic optimism prevails over Omicron-related pessimism. Indeed, it very much seems at this stage that Omicron is significantly milder than prior strains and its associated economic damage is far less. The rally in real yields suggests that Tuesday’s bounce in silver and gold may prove nothing more than a dead-cat bounce. If Fed tightening combined with a strong US economy in 2022 does push nominal 10-year yields above 2.0% but keep inflation expectations in check in the mid-2s%, then that means 10-year real yields are headed back towards 0.0%. That suggests substantial downside for precious metals like silver from current levels. Medium-term bears will be looking for XAG/USD to test recent lows in the $21.00s in the coming weeks.
- The single currency slides for the second consecutive day, down some 0.04%.
- US Treasury yields extend their weekly rally, with the 10-year closing to the 1.70% threshold.
- EUR/USD has a downward bias in the near term, as the upward move stalled around the hourly 50, 100, and 200-SMAs, retreating below the 1.1300 figure.
The EUR/USD extends its losses to two days, trading at 1.1292 at the time of writing. The greenback continues to benefit against the low-yielder euro by rising US Treasury yields, led by the 10s, the 20s, and 30s, rising between 5 to 7.5 basis points, sitting at 1.682%, 2.1180%, and 2.090%, respectively.
That said, the buck rebounded after dipping during the London fix, as low as 96.03, flat during the day, at 96.24. Despite the lack of movement of the greenback, market participants begin to position for at least three-rate hikes as portrayed by US money market futures, expecting the first lift-off once the bond-taper ends by March of 2022.
Minneapolis Fed Kashkari (FOMC 2022 voting member) eyes two rate hikes in 2022
European Central Bank Governing Council Member and Head of the Banque of France Francois Villeroy and Minneapolis Fed President Neil Kashkari crossed the wires in the last couple of hours. In the case of Francois Villeroy de Galhau, he said that inflation in France is “now close to its peak and in the euro area.” Additionally said that “we believe that supply difficulties and energy pressures should gradually subside over the course of the year.” His remarks came after Fresh France HICP showed an increase of 3.4% in the annual base inflation, a 13-year high.
In the meantime, Neil Kaskari said that he nows sees two rate hikes in 2022. He expects the first rate hike to be met after the April 2022 economic data is released, signaling his support for a May rate hike.
EUR/USD Price Forecast: Technical outlook
The EUR/USD 1-hour chart shows that bears are in control, as portrayed by the simple moving averages (SMAs) residing above the spot price. Indeed the aforementioned stalled the upward move from 1.1276 up to 1.1320s, as EUR bulls failed to capitalize good macroeconomic data, hurt by technical indicators, alongside the interest rate differentials between the Federal Reserve and the ECB.
On the downside, the first support would be the January 3 daily low at 1.1280. A break under that level could send the pair tumbling towards the S1 daily pivot at 1.1259, intersection with an upslope trendline drawn from the November cycle lows up to the December ones.
- EUR/GBP bears are on the verge of a test of the critical weekly support area.
- Covid risks abate which is helping to keep GBP elevated.
EUR/GBP is on the verge of a downside extension as it takes on critical support in the lows of the day near 0.8335. The pair has fallen some 0.4% from a high of 0.8395 on the day so far. The pound, often regarded as a risk currency, has benefited from a risk-on environment at the start of the week as full markets return.
Omricon variant risks abate
One of the main contributors to the risk-on mood, helping to keep stocks elevated around the world, is down to the improved sentiment surrounding covid-19 and the Omricon variant. Early laboratory studies show the more transmissible variant replicates less efficiently once inside the lung tissue. Plus, will we need second boosters, and how to manage COVID at home.
In the UK specifically, no new measures are needed in Britain to fight the variant, which is "plainly milder" than earlier forms of the coronavirus, Prime Minister Boris Johnson said at the start of the week. This has given the pound a much-needed boost.
"The way forward for the country as a whole is to continue with the path that we are on," he told broadcasters. "Of course, we will keep all measures under review, but the mixture of things that we are doing at the moment is I think the right one."
UK data mixed
meanwhile, Britain’s manufacturers have suffered a fall in export demand. The weight of Covid risks and lockdowns as well as the uncertainties surrounding Brexit are impacting. This was according to fresh data that shows supply chain disruption and staff shortages held back the economy in December.
IHS Markit and the Chartered Institute of Procurement and Supply (Cips) showed growth in UK factory output was limited last month. According to the survey of 650 manufacturers, a key measure of for the Bank of England for early warning signs from the economy, inflows of new work from overseas dropped for the fourth month in a row. Meanwhile, the Final December Manufacturing PMI came in at 57.9 vs. 57.6 preliminary. Final services and composite PMIs will be reported Thursday as the next key gauge.
''We may have to wait until January to get a cleaner read on the U.K. economy but we see headwinds ahead from Brexit (still!), energy shortages, and both fiscal and monetary tightening,'' analysts at Brown Brothers Harriman explained.
Brexit saga continues
As for Brexit, Between January 4 and January 6, there are very important meetings to begin the legal process against the UK which is going to be a weight to the pound.
Moreover, the City AM reported today that ''many British businesses may “give up importing” as a result of new strict rules that came into force on Saturday, on 1 January, a former senior civil servant in charge of Brexit planning has warned.''
''Philip Rycroft, who was permanent secretary at the Department for Exiting the European Union (DExEU) between 2017 and 2019, said the changes that came into play on January 1 will cause 'teething problems, with some sectors hit harder than others.
With the introduction of new barriers to trade with the bloc, Rycroft said businesses may decide it 'is simply not worth the hassle'.''
Additionally, the row regarding fishing rights continues. This will now be likely be referred to a court, where a negative ruling could result in retaliatory measures such as tariffs. This will not go down well in the land of GBP forex as uncertainties will remain. ''While the matter appeared to have been somewhat settled with the issuance of additional fishing licenses to the EU, reports suggest French fishermen are still waiting for 73 of them to be handed out by the UK,'' analysts at Brown Brothers Harriman explained.
EZ inflation data eyed
The biggest event for the eurozone will be the inflation readings. ''Like in Germany, both energy prices and re-weighting issues are likely to weigh on December's inflation figures,'' analysts at TD Securities explained.
''We think underlying core price momentum is a bit stronger than the consensus, though, yielding a stronger core inflation figure. For headline inflation, we expect a bigger drag from energy prices than the consensus.''
EUR/GBP technical analysis
Meanwhile, from a technical standpoint, the price is on the verge of a test of critical weekly support:
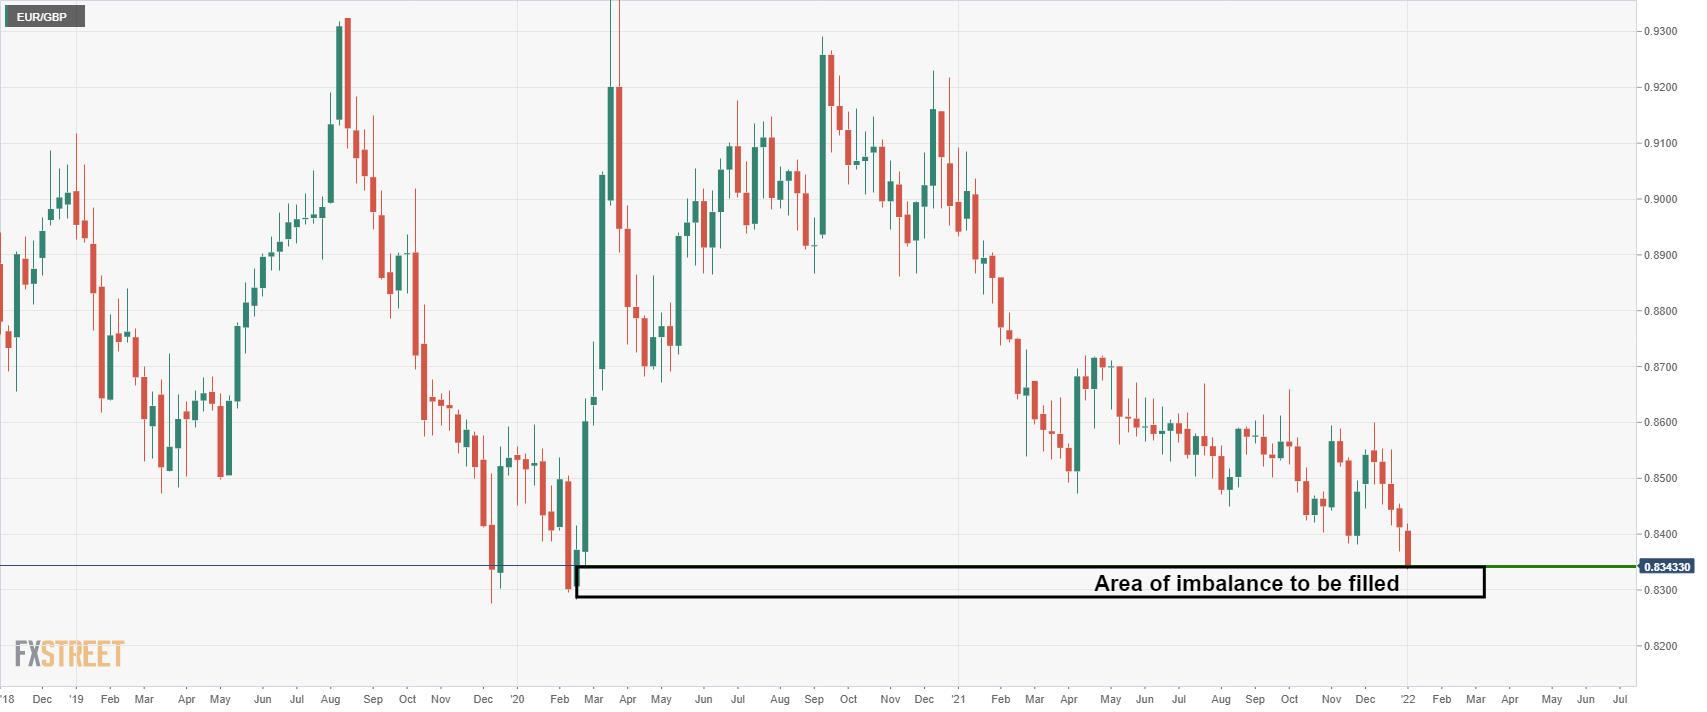
Things to note as per Reuters ''Buzz'' analysis:
- Seasonal pattern: EUR has only closed up in Jan 5 times in last 20-years;
- Cross could also complete a fifth consecutive bear week;
- Increasing bearish momentum and lower RSI readings confirming latest drop;
- Next significant support from 2020 and 2019, 0.8282 and 0.8278 respectively;
- Upside squeeze point a long way off at 0.8598;
UK PM Boris Johnson said in a news conference in Downing Street that, given that we are not seeing the same numbers in intensive care, we have a chance to ride out this Omicron wave without shutting down. Johnson noted that the UK is in the midst of the fastest growth of Covid-19 cases that has ever been seen and that the battle with Covid-19 is over, meaning now is a moment for utmost caution. However, we can find a way to live with the virus, he said, adding that while the weeks ahead will be tough, if we all play our part, the disruptions caused can be less severe than locking down.
Johnson said the government is identifying hospital trusts that might need military staffing support (given high numbers of staff in self-isolation after testing positive) and is recommending to his cabinet that the UK continue with plan B. Further restrictions will depend on when Omicron peaks and how it bows through, Johnson said. His chief scientific advisor Patrick Valance said that up until now, Omicron has largely been an infection of the young and the effect is unknown as it moves up the age brackets.
Market Reaction
UK PM Johnson's decision not too toughen restrictions was widely expected and thus has not triggered any reaction in GBP.
The central bank of Denmark presented its December numbres. Analysts at Danske Bank point out the Danmarks Nationalbank (DN) resumed intervention with the second highest monthly purchases ever.
Key Quotes:
“The big news in today's release was the significant FX intervention that took place in December. It was the second highest monthly FX intervention purchase on record only surpassed by the rally into DKK in January 2015. We have been arguing that DKK strength in December and subsequent need for FX intervention was mainly due to year-end tightness in the DKK money market. The size of the inflow to the FX reserve means it was likely coupled with investor rebalancing flows.”
“The large inflow to the FX reserve will likely fuel speculation that another unilateral rate cut is coming in Denmark. However, we do not want to rush to conclusion.”
“Downwards pressure on EUR/DKK spot has eased to start the year and if the need for intervening in FX markets has ended for now, DN will probably draw the same conclusion as us and stay put on interest rates. Hence, we stick to our view that DN will keep policy rates unchanged despite the sizeable FX intervention in December.”
“The biggest sequential drop in more than a decade for the prices paid component and shorter wait times for desperately needed supplies were the two primary drivers of the 2.4 point decline in the ISM manufacturing index to 58.7 in December”, explained analysts at Wells Fargo.
Key Quotes:
“The drop in December's ISM manufacturing index to 58.7 from 61.1 in November masks what we see as a still strong demand environment in the factory sector. Sharp declines in delivery times and prices were key drivers of the decline and signal at least some welcome improvement in terms of diminishing inflationary pressure and incremental strides with supply chain issues.”
“We still expect inflation to remain stubbornly high and above the Fed's target rate, but it will at least be slowing on a year-over-year basis.”
“The biggest message from today's report is that the prices paid component plunged 14.2 points in December. Not only was that the largest drop of any sub-component, it also marks the biggest monthly drop in the prices paid measure in over a decade. Make no mistake, at 68.2 prices are still rising, but it is no longer the scorching hot 82.4 reading seen in November.”
“Even though the primary drivers of the decline were in categories that will likely bring relief to the manufacturing sector, the headline decline was also driven to a much smaller extent by new orders and production, both of which slipped in December.”
- The USD/CHF slides some 0.32% in the New York session.
- The Swiss franc benefitted from weak US ISM Manufacturing PMI, gained some 50 pips.
- The USD/CHF has a neutral bias, as the DMAs remain horizontal, around the 0.9170-0.9220 area.
At the time of writing during the New York session, the USD/CHF slides, trading at 0.9159. A mixed-market mood, as portrayed by US stock indices fluctuating between gainers and losers, while the greenback gave back early gains, with its US Dollar Index grinding lower down some 0.16%, sitting at 96.06.
In the overnight session, the USD/CHF remained trading in a narrow range of 0.9170-0.9185 to react to poor US macroeconomic data, which showed that the Institute for Supply Management (ISM) Manufacturing PMI rose to 58.7, lower than the 60 estimated by analysts.
Market participants sold the US dollar, spurring a 50-pip drop in the pair, near the S1 daily pivot point at 0.9130.
In the meantime, US Treasury yields keep advancing, with the 10-year benchmark note up some four and a half basis points, at 1.675%, failing to underpin the USD/CHF, which benefitted from safe-haven flows.
USD/CHF Price Forecast: Technical outlook
The USD/CHF has a neutral bias, depicted by the daily moving averages (DMAs) with a horizontal slope residing around the spot price. However, an upslope trendline drawn from December 2020 cycle lows to the June 2021 swing lows provided support, as the downward move pierced the aforementioned, rebounded strongly towards the 200-DMA around 0.9171.
To the upside, the first resistance would be the 200-DMA. A breach of the latter would open the door for a confluence of the 50 and the 100-DMA around 0.9205-15 area, that once broken would open the door towards the December 15 cycle high 0.9294, and then the 0.9300 figure.
On the other hand, a decisive break under the 0.9150 figure would open the door for 0.9100, followed by the November 2 swing low at 0.9085 and then the psychological 0.9000.
-637769122175519634.png)
- US data below expectations, on Wednesday ADP and FOMC minutes.
- DXY turns positive again, holds above 96.00.
- USD/CAD holds a bearish tone but again rejected from under 1.2700.
The USD/CAD pair bottomed at 1.2666 and rebounded back above 1.2700, as the US dollar jumps from instance weakness to strength in a few minutes. Higher US yields continue to be a key driver of USD strength. At the same time, higher equity prices limit gains.
US still strong, data below expectations
The greenback remains with momentum amid higher US yields that reached again multi-month highs. Economic numbers from the US came in below expectations on Tuesday. The ISM Manufacturing Index came in at 58.7 in December below the 60.2 of markets consensus and under the 61.1 of the previous month. On Wednesday, the ADP employment report is due and later the Federal Reserve will release the minutes of the last FOMC meeting.
In Canada, economic figures showed the Industrial Product Price Index rose 0.8% in November, as expected; while the Raw Material Price Index decline unexpectedly 1%. A different report showed the Markit Manufacturing PMI dropped in December to 56.5 from 57.2, and against the 57.5 of market consensus. The numbers had o significant impact on the loonie.
The USD/CAD continues to move with a bearish bias, but again it was rejected from under 1.2700. A recovery above 1.2770 should negate the negative tone. A consolidation in the short term below 1.2680 should expose the recent low.
Analysts at Brown Brother Harriman point out that the Canadian dollar was the only major currency to post gains against the dollar in 2021, “but we may be in for a period of underperformance to start off 2022. For USD/CAD, a break above 1.2835 is needed to set up a test of the December high near 1.2965.”
Technical levels
According to Reuters, Bank of France head and ECB governing council member Francois Villeroy de Galhau said on Tuesday that inflation "is now close to its peak in our country (December showing first signs of stabilisation) and in the euro area". "While remaining very vigilant," he added, "we believe that supply difficulties and energy pressures should gradually subside over the course of the year".
His remarks come after the release of flash French HICP figures on Tuesday which showed YoY inflation remaining at 13-year highs of 3.4% in December. The French central bank thinks inflation will end 2022 under 2.0%.
Market Reaction
The euro has not reacted to Villeroy's latest remarks.
In a post on Medium, Minneapolis Fed President and 2022 voting FOMC member Neil Kashkari said on Monday that he now sees two rate hikes in 2022. That is a switch from his previous forecast for now rate hikes until 2024, he said in the post. He warned in the post that the costs of ending up in a high-inflation regime outweigh the costs of ending up in a low-inflation regime. He expects the threshold for first-rate hikes to be met after the April economic data is released, indicating his potential support for a May rate hike.
Market Reaction
Despite Kashkari, who will be a policy voter in 2022, being known as one of the most dovish Fed members, his "hawkish shift" has not impacted FX markets.
- The DXY has dipped back to near the 96.00 level in wake of the latest US data, erasing early gains.
- The latest ISM manufacturing report fell to 58.7 in December from 61.1 driven by a drop in prices paid.
The DXY has dipped into negative territory on the day in recent trade and is probing the 96.00 level in wake of the latest batch of US data. The index, which is a trade-weighted basket of major USD currency pairs, now trades about 0.15% lower on the day and is about 0.4% lower versus its earlier peaks near 96.50.
It’s latest decline has seen it slip back to the south of its 21-day moving average, which currently resides around the 96.20 level and the bears will be eyeing a test of last week’s lows in the 95.50s should the 96.00 level be broken. Support in the form of the 50DMA at 95.65 is notable, which the level having been associated with good buying interest in the recent past.
US data weighs on the DXY
The latest ISM manufacturing report fell to 58.7 in December from 61.1 in November, below the expected 60.0 and its lowest reading since January 2021. The decline was in part driven by a substantial drop in the prices paid subindex, which slumped to 68.2 from 82.4 in a sign of easing supply chain snags. That marked the lowest reading for the index since November 2020 and was the largest MoM drop in the index since March 2020. Elsewhere, the new orders remained robust above 60.0 and the employment index rose to 54.2 from 53.3, its highest reading since April, in a good omen for Friday’s employment report.
Meanwhile, the latest JOLTs report for November showed a fall to 10.562M job openings from more than 11M in October. However, the report showed a rise in quits in high-end, white-collar jobs, as well as in the hospitality sector, which well-known Fed watcher and chief US economist at SGH Macro said was consistent with increasing wage pressure at the higher ends of the employment spectrum.
The headline miss in the JOLTs report coupled with the deflationary signal encapsulated by the sharp drop in the prices paid ISM subindex seem to have been enough to weigh on the DXY intra-day. This may be because traders might interpret the data as indicating the US labour market isn’t as hot as assumed and that inflation may come down sooner rather than later as supply chains problems ease, combining to exert less pressure on the Fed to tighten monetary policy as swiftly.
- Gold rises on Tuesday despite higher US yields.
- XAU/USD manages to hold above 1800$, more gains could lead to a test of 1830$.
Gold prices are rising on Tuesday after strengthening during the American session even as US yields remain high. XAU/USD held above 1800$ and recently climbed to 1814$, reaching a fresh daily high. Gold is trimming Monday’s losses and is attempting to recover levels above 1815$.
If the bounce to the upside in gold continues, the next level to watch is the 1830$ resistance area (interim resistance at 1823$). A close clearly above 1830$ would suggest more gains ahead for the metal. On the flip side, a slide under 1800$ should increase the bearish pressure, targeting 1790$.
The move higher has been driven by an improvement in risk sentiment and also by a broad-base US dollar decline during the American session. The DXY reversed from weekly highs and is now slightly above 96.00, down 0.15% for the day.
Economic data from the US came in below expectation with the December ISM Manufacturing Index at 58.7 below the 60.2 expected and under the 61.1 of the previous months. On Wednesday, the ADP employment report is due and also the Fed will release the minutes from its latest FOMC meeting. The key event will be n Friday with the Non-farm Payroll report.
Technical levels
- The British pound pares Monday’s losses, up some 0.40%.
- The US Dollar Index advances for the second consecutive day of 2022 but fails to boost the greenback vs. cable.
- US T-bond yields march firmly towards the 1.70% threshold.
- GBP/USD is tilted to the downside and will face strong resistance around the 1.3550-70 area.
The British pound advances for the first time of the week, trading at 1.3525 at the time of writing. European stock indices and US equity futures portrayed an upbeat market mood, Covid-19 Omicron variant woes wane, while investors assess US central bank tightening in the year, as shown by money market futures expecting three rate hikes in 2022.
In the overnight session, the GBP/USD dipped as low as 1.3460, immediately bouncing off Tuesday’s daily low and pushing through the 1.3500 figure, stalling the upward move around the R1 daily pivot point at 1.3531.
In the meantime, the US Dollar Index, which tracks the greenback’s performance against a basket of its rivals, advances 0.11% sits at 96.32. That happens on the back of rising US 10-year Treasury yields, closing to the 1.67% threshold, underpinning the greenback, whereas the GBP/USD pair pares Monday’s losses on the back of risk appetite, and probably the US hitting a million of Covid-19 cases on Monday, as the country gets struck by the Omicron variant wave.
During the European session, the UK economic docket featured the Markit/CIPS Manufacturing PMI for December, which came at 57.9, lower than the 57.6 estimated by analysts.
Some minutes ago, in the US economic docket, the Institute of Supply Manufacturing reported that the Manufacturing PMI for December in its final reading came at 58.7, lower than the 60 estimated by analysts. At the same time, the JOLTS Job Openings came at 10.562M, lower than the 11.075M.
The market reacted to the upside at the data, jumping some 11 pips, short of the confluence of the 50-DMA and a downslope bearish trendline.
GBP/USD Price Forecast: Technical outlook
The GBP/USD is in a downtrend, as depicted by the daily chart, though the trend paused slightly. At press time, the pair is trapped within the 50 and the 100-day moving averages (DMAs) with the shortest time-frame one below the longer time frame. In fact, the 100-DMA intersects with a downslope trendline drawn from May 2021 cycle highs, which lies around 1.3558, which would be a difficult resistance area to overcome.
In the event of breaking above the aforementioned, the following line of defense for USD bulls would be 1.3600. A break above that level would expose the November 4 daily high at 1.3698, followed by the 200-DMA at 1.3743.
On the flip side, the first support would be 1.3500. The breach of the latter could pave the way for further downside action, with the January 3 daily low at 1.3431, followed by the 50-DMA as the first support at 1.3408.
- EUR/USD slips back to the 1.1270 area on Tuesday.
- Higher yields support another bullish move in the dollar.
- US ISM Manufacturing came at 58.7 in December.
The European currency remains under pressure and drags EUR/USD to fresh multi-day lows in the 1.1275/70 band on Tuesday.
EUR/USD weaker on US yields, wait for data
EUR/USD is down for the second straight session and extends the pessimism seen at the beginning of the week/year, always on the back of the strong resumption in the preference for the greenback.
Indeed, the dollar regained upside momentum in response to the acute rebound in US yields across the curve, where the 10y benchmark note manages to approach the 1.70% barrier and the 30y bond trades well above the 2.00% yardstick.
In the calendar, German Retail Sales expanded at a monthly 0.6% in November and contracted 0.2% over the last twelve months, while the Unemployment Change dropped by 23K people and the jobless rate ticked lower to 5.2, all for the month of December.
In the US docket, the ISM Manufacturing surprised to the downside at 58.7 last month.
EUR/USD levels to watch
So far, spot is losing 0.08% at 1.1285 and faces the next up barrier at 1.1386 (monthly high November 30) followed by 1.1464 (weekly high Nov.15) and finally 1.1520 (200-week SMA). On the other hand, a break below 1.1272 (weekly low Jan.4) would target 1.1221 (weekly low Dec.15) en route to 1.1186 (2021 low Nov.24).
- There were 10.562M job openings in November, less than the 11.075M expected.
- The weaker number seemed to weigh on the dollar a tad at the time.
The number of job openings on the last business day of November fell to 10.562 million, the US Bureau of Labor Statistics announced in its latest Job Openings and Labor Turnover Summary (JOLTS) on Tuesday. This reading came in below market expectations for 11.075 million and was lower versus October's 11.091 million reading, which had been revised up from 11.033 million.
Market Reaction
The DXY saw some negative ticks in the wake of the headline misses in the ISM manufacturing and JOLTs reports.
- ISM PMI fell to 58.7 in December from 61.1 in November, below the expected 60.0, its lowest since January 2021.
- The price paid subindex saw its largest drop since March 2020 to 68.2 from 82.4.
According to a survey compiled by the Institute of Supply Management, US Manufacturing PMI fell to 58.7 in December from 61.1 in November. That was lower than the expected reading of 60.0 and was the lowest reading since January 2021, when it also came in at 58.7.
In terms of the sub-indices, in a good omen for Friday's official December labour market report, the employment subindex rose to 54.2 from 53.3, which is its highest reading since April 2021. The new orders index eased slightly to 60.4 from 61.5 in November. The prices paid subindex, in a sign of easing supply chain snags, slumped to 68.2 from 82.4. That marked the lowest prices paid index reading since November 2020 and was the largest MoM drop in the index since March 2020.
Market Reaction
The DXY seems to have slipped a tad after the headline ISM and JOLTs numbers missed, but also given the sharp decline in inflationary pressures as indicated by the large drop in the ISM prices paid index. It still trades in the 96.20s and slightly higher on the day.
- EUR/JPY has rallied above 131.00 on Tuesday as Eurozone/Japan rate differentials widen amid Omicron-optimism.
- Should risk-on market conditions continue, a continued push towards Q4 2021 highs in the mid-133.00s is likely.
Amid broad yen weakness following a recent widening in G10/Japan rate differentials, EUR/JPY has rallied on Tuesday to its highest levels since mid-November above the 131.00 mark. At current levels close to 131.20, the pair is up about 0.7% on the session, its best such on-the-day gain since early December. Yields in Europe have rallied this week in tandem with yields in the US as market participants broadly price in a stronger outlook for the global economy in 2022 and beyond as Omicron-related fears subside. Omicron seems to be decisively “weaker” than delta, which it seems likely to replace as the dominant Covid-19 strain, and is three times less likely to result in hospitalisation. Moreover, these hospitalisations seem significantly less severe, something the UK vaccine minister recently said.
The 10-year German yield is above -0.15% and eyeing a test of post-pandemic highs above -0.10%, meaning it is up about 4bps on the week and over 25bps since the December lows. Japan 10-year yields, meanwhile, are only up 2bps on the week and about 6bps from the December lows, given that (as ever) they remain pinned close to 0.0% by the BoJ’s ongoing Yield Curve Control (YCC) programme. The recent approximate 20bps upwards shift in German/Japan rate differentials since mid-December as a result of the market’s surge in risk appetite in recent weeks has been a key driver of EUR/JPY’s rally from last month’s lows in the 127.50 area.
At current levels above 131.00, the pair is up more than 3.0% versus these recent lows. If optimism about the global economic outlook this year continues to grow, EUR/JPY may soon look to challenge its Q4 2021 high in the mid-133.00s, or perhaps even the 2021 highs just above 134.00. Though the ECB remains a long way from hiking interest rates, its rate of monthly QE buying is set to decline substantially in 2022 versus no change expected to the BoJ’s flagship YCC QE programme. QE policy divergence could well offer EUR/JPY longer-term support.
EUR/USD is trading back under 1.13. In the view of economists at Scotiabank, Italian politics is set to weigh on the common currency.
The 1.1275/85 zone to stand as intermediate support
“The Italian lower house announced today that voting on a new Italian president will start on January 24th, with Draghi possibly pulled away from the PM office. Political uncertainty in Italy has widened the spread of Italian over German 10-yr yields to around its highest since November 2020 and is set to weigh on the EUR for the next few weeks, at least, while the ECB/Fed divergence backdrop continues to pull the currency lower over the medium-term.”
“The 1.1275/85 zone will stand as intermediate support ahead of 1.1220/35 that stands before a test of the 1.12 zone.”
“EUR/USD now faces resistance in the mid-1.13s with ~1.1365 and ~1.1385 following (50-day MA at 1.1369 is the mark to beat on a closing basis).”
According to IHS Markit, Canadian Manufacturing PMI fell slightly to 56.5 in December from 57.2 in November. That was less than the expected decline to 57.5.
IHS Markit comments:
"Canadian manufacturers closed 2021 with a robust expansion in operating conditions as the sector continues to reap the benefits of strong domestic and international demand. Moreover, anticipation of greater customer orders encouraged firms to stockpile at record rates during December."
"Whilst on the whole latest data are positive, it is difficult to ignore the impacts of the pandemic on the sector. Over the last year or so, material shortages have been prominent, and whilst production has continued to expand, the latest uptick was the softest for ten months. In addition, another marked rise in backlogs suggests persisting skill shortages."
"News of the Omicron variant paired with sustained supply shortages has been a cause for concern among some Canadian manufacturers. The impacts of the new variant are still unknown, but policy-makers remain committed to containing the virus."
Market Reaction
USD/CAD did not see any notable reaction to the latest PMI survey result.
- USD/TRY fades Monday’s negative session and regains 13.00.
- The lira remains under pressure following CPI results.
- Attention gyrates to the CBRT event later in the month.
The lira gives away part of Monday’s gains and resumes the downside, motivating USD/TRY to advance further north of the 13.00 hurdle on turnaround Tuesday.
USD/TRY: Upside looks limited around 14.00
USD/TRY started the year on a negative note despite the rebound in the dollar and higher-than-expected inflation figures in Turkey published on Monday. Indeed, Turkish headline consumer prices rose 36.08% in the year to December, way above estimates, and along with an also larger-than-forecast rise in Producer Prices.
The post-CPI knee-jerk in the lira was, however, short-lived as the currency managed to regain ground afterwards and end the session with decent gains vs. the buck.
However, Tuesday contemplates a more familiar scenario for the beleaguered currency, which resumes the downward path amidst persistent dollar strength and its impact on the risk complex and the EM FX space.
Tuesday’s depreciation of the lira comes pari passu with the move higher in yields of the 10y reference bond, which hovers past the 23.00% region.
What to look for around TRY
The lira resumed the downtrend while market participants continue to digest the recent inflation figures and the government measures to promote the shift from dollars to the domestic currency. The reluctance of the CBRT to change the (collision?) course and the omnipresent political pressure to favour lower interest rates in the current context of rampant inflation are forecast to keep the lira under intense pressure. That said, another visit to the all-time high north of the 18.00 mark in USD/TRY should not be ruled out just yet.
Eminent issues on the back boiler: Progress (or lack of it) of the new scheme oriented to support the lira. Constant government pressure on the CBRT vs. bank’s credibility/independence. Bouts of geopolitical concerns. Much-needed structural reforms. Growth outlook vs. progress of the coronavirus pandemic. Potential assistance from the IMF in case another currency crisis re-emerges.
USD/TRY key levels
So far, the pair is gaining 2.55% at 13.3536 and a drop below 12.9953 (weekly low Jan.3) would pave the way for a test of 11.7343 (55-day SMA) and finally 10.2027 (monthly low Dec.23). On the other hand, the next up barrier lines up at 13.8967 (weekly high Jan.3) followed by 18.2582 (all-time high Dec.20) and then 19.0000 (round level).
- NZD/USD has failed to reclaim 0.6800 ahead of US data, with the 21DMA at 0.6788 acting as a magnet.
- The pair risks incurring further losses if optimism about the US economic outlook/prospect of Fed tightening continues to build.
NZD/USD’s failure to reclaim the 0.6800 despite multiple attempts during Asia Pacific and early European trading hours seems to have been taken as a bad omen and the pair dipped as low as the 0.6760s in recent hours. Ahead of the release of the key US ISM Manufacturing PMI for December and JOLTS Job Opening report for November at 1500GMT, the pair is in consolidation mode close to 0.6780, where it trades broadly flat on the day. That follow’s Monday’s US yield surge-fuelled tumble that saw the pair drop back from the mid-0.6800s, a 0.9% decline at the time, which was the pair’s worst performance since 17 December.
As optimism about the US economic outlook in 2022 pushes equities and yields higher there and fuels expectations that the Fed will live up to or perhaps even exceed monetary tightening expectations this year, USD upside risks are growing. That could bode poorly for NZD/USD, even if the RBNZ is well ahead of the Fed when it comes to monetary tightening. The absence of notable New Zealand data this week to spur hawkish RBNZ repricing, versus an abundance of US releases and Fed speak means risk for the pair lay to the downside. Short-term bears may be eyeing an eventual push lower to support around 0.6700.
For now, though, the 21-day moving average at 0.6788 continues to act as a magnet. One notable risk to keep an eye on for NZD/USD is whether New Zealand follows in the footsteps of Australia and endures an Omicron-fuelled surge in Covid-19 cases in the coming weeks/months. Whilst in other parts of the world this hasn’t led to a surge in critical illness and lockdowns, the New Zealand government has a track record of enacting much more forceful measures. If there is a meaningful New Zealand outbreak, it will be interesting to see whether the kiwis follow in the footsteps of the Aussie by placing their faith in the fact that the country’s high vaccination rate will protect people rather than reverting to lockdowns.
According to four sources cited by Reuters, OPEC+ has agreed to stick to its existing plan and press ahead with a 400K barrel per day (BPD) output hike in February, as hinted by sources prior to the meeting and expected by analysts/markets.
Market Reaction
Given that the decision was widely expected, it has not provoked much of an oil market reaction. WTI experienced modest selling pressure and has dropped from close to $77.00 per barrel to the mid-$76.00s, but is still trading about 50 cents higher on the day at the time of writing.
US ISM Manufacturing PMI overview
The Institute of Supply Management (ISM) will release its latest manufacturing business survey result, also known as the ISM Manufacturing PMI at 15:00 GMT this Tuesday. The index is anticipated to decline to 60.2 in December from 61.1 in the previous month. Given that the Fed looks more at the labour market and inflation than growth, investors will keep a close eye on the Employment and Prices Paid sub-component.
As Yohay Elam, Analyst at FXStreet, explains: “While the manufacturing sector is small in comparison to the services one, the release is not only the first for the new year but also the initial hint toward Friday's all-important Nonfarm Payrolls. The employment component and also the Prices Paid one – reflecting inflation expectations – are all of high importance.”
How could it affect EUR/USD?
Ahead of the key release, the US dollar continued drawing support from surging US Treasury bond yields and dragged the EUR/USD pair to a nearly two-week low. A stronger headline print will reaffirm hawkish Fed expectations and provide an additional boost to the greenback. Conversely, a weaker reading might do little to derail the Fed's expected policy path. This, in turn, suggests that the path of least resistance for the greenback is to the upside and down for the EUR/USD pair.
Meanwhile, Valeria Bednarik – Chief Analyst at FXStreet – offered a brief technical outlook for the major: "The daily chart shows that the pair stands below a flat 20 SMA, providing intraday dynamic resistance, while the longer ones keep heading lower far above it. Technical indicators head south around their midlines, failing to confirm, at this point, a bearish extension."
"In the near term, and according to the 4-hour chart, the bearish case is firmer. The pair has fallen below all of its moving averages, while technical indicators extend their declines within negative levels, maintaining their bearish slopes," Valeria added further.
Key Notes
• ISM Manufacturing PMI Preview: Low expectations in three figures open door to dollar upswing
• EUR/USD Forecast: Bears maintain the pressure on yields’ rally
• EUR/USD Price Analysis: Initial contention emerges near 1.1220
About the US ISM manufacturing PMI
The Institute for Supply Management (ISM) Manufacturing Index shows business conditions in the US manufacturing sector. It is a significant indicator of the overall economic condition in the US. A result above 50 is seen as positive (or bullish) for the USD, whereas a result below 50 is seen as negative (or bearish).
- AUD/USD is consolidating around the 0.7200 level aided by decent Asia PMIs as it awaits key US data reports.
- The pair is vulnerable to further selling from a technical perspective, with bears perhaps eyeing a test of 0.7100.
After Monday’s tumble as a result of broad USD strength, but also likely some technical selling pressure, AUD/USD has regained some composure on Tuesday and is pivoting either side of the 0.7200 level. Market commentators are citing strength in China coal prices (a key Australian export), as well as a positive Chinese Caixin Manufacturing PMI survey, which was better than expected at 50.9 in December versus 50.0 forecasts, as supportive of the Aussie. More broadly, ASEAN manufacturing PMI rose to 52.7 from 52.3 in November, indicate of broad economic strength in the region. With AUD/USD up 0.1% at current levels close to 0.7200, the currency is amongst the best performing G10 currencies on the day.
However, aside from a big drop in the yen to multi-year lows versus the US dollar amid catch up to the recent move higher in US (and global) yields), FX markets are tame on Tuesday. Currency traders are awaiting US ISM manufacturing PMI (Deceber) and JOLTS Job Openings (November) data at 1500GMT, ahead of the release of the ISM services PMI and official labour market report (also both for December) later in the week. Note that the Australian manufacturing PMI for December was also released during Asia Pacific hours, with the headline index easing to 57.7 from 59.2 in November.
IHS Markit said that “Some growth momentum was lost for the Australian manufacturing sector in December as the reopening boost faded and supply constraints hampered production according to panellists”. “That said,” the report continued, “current growth momentum remains strong by historical standards and firms have maintained an optimistic view with regards to future output”. The Aussie did not pay any attention to the latest PMI report, just as it has ignored the fact that Covid-19 hospitalisations have in recent days surged to record highs in parts of the country. Traders are betting that there will not be further lockdowns in Australia, given that government authorities seem currently to believe that high vaccination rates will prevent widespread serious illness.
With AUD/USD having recently broken to the south of a short-term bullish trend channel, the scope for further technically driven losses is high. Short-term bears may way target a test of mid-December lows in the 0.7100 area, should the 0.7200 level go. From a technical/quantitive perspective, there is plenty of room for selling pressure to build; the 14-day Relative Strength Index is at a comfortable 49, well above the “oversold” 30 level. Meanwhile, AUD/USD’s Z-score to its 200-day moving average is currently around -1.0 (meaning it is roughly one standard deviation below its 200DMA). Typically a Z-score to 200DMA of lower than -2.0 is an indicator of “oversold” conditions.
Time to stop overlooking USD/JPY – the currency pair is moving fast and has hit 115.88, the highest since 2017. Yohay Elam, Analyst at FXStreet, explains what moves USD/JPY and what is next after hitting four-year highs.
USD/JPY provides the best reactions to yields and US data
“In general, USD/JPY tends to have the best reaction to yields and also to economic releases in the US. The yen is a safe-haven currency like the dollar, and therefore, does not fall when US data is weak – risk-off – or rise in response to good figures from America, risk-on.”
“As a safe-haven currency, the yen best reacts to geopolitical tensions. It can outperform the dollar when tensions rise around North Korea, and also between Russia and Ukraine. In such cases, it tends to decouple from yields. However, in the current environment, USD/JPY is trading in tandem with yields.”
“With the current low level of inflation, the Bank of Japan is set to stay put. That contrasts with the Federal Reserve, which is on course to raise rates in 2022, and the timing remains unknown. This uncertainty is what stirs the dollar. The yen is only a bystander.”
“In the shorter term, USD/JPY is trading in overbought territory according to the four-hour chart, as the RSI is well above the 70 level. That implies a correction. However, the trend remains to the upside and the pair could tackle 116 in short order.”
- A combination of supporting factors pushed USD/JPY to a fresh five-year high on Tuesday.
- The risk-on mood continued undermining the safe-haven JPY and remained supportive.
- Surging US bond yields benefitted the USD and provided an additional boost to the pair.
The USD/JPY pair added to its strong intraday gains and jumped to a fresh five-year high, around the 116.35 region heading into the North American session.
Despite the Omicron-driven rise in COVID-19 infections globally, investors remain optimistic amid hopes of steady economic recovery. This was evident from an extension of the bullish run in the equity markets to record highs, which continued underpinning the safe-haven Japanese yen and acted as a tailwind for the USD/JPY pair.
Bulls further took cues from surging US Treasury bond yields, which pushed the US dollar to a near two-week high on Tuesday and provided an additional boost to the USD/JPY pair. In fact, the yield on the benchmark 10-year US government bond shot to 1.666%, or the highest level since November 24 amid hawkish Fed expectations.
The money markets have been pricing in the possibility for an eventual Fed liftoff by May and two more rate hikes by the end of 2022. This was further reinforced by the fact that the US 2-year notes, which are sensitive to rate hike expectations along with 5-year notes, soared to their highest since February 2020.
The combination of factors assisted the USD/JPY pair to prolong its recent upward trajectory witnessed over the past one month or so and surge past the 2021 swing high, around mid-115.00s. The subsequent strength took along some short-term trading stops near the 116.00 mark and contributed to the ongoing strong bullish momentum.
Market participants now look forward to the US economic docket, highlighting the release of the ISM Manufacturing PMI and JOLTS Job Openings data. Apart from this, the US bond yields should influence the USD. Traders will further take cues from the broader market risk sentiment for some short-term opportunities around the USD/JPY pair.
Technical levels to watch
- EUR/USD accelerates losses well south of 1.1300 on Tuesday.
- The loss of further ground could revisit the December low near 1.1220.
Increasing selling pressure now forces EUR/USD to shed further ground and challenge the area of 2-week lows around 1.1270.
If losses accelerate, then the pair is expected to attempt a move to the December’s low in the 1.1220 zone, which is regarded as the latest defence for a test of the 2021 low at 1.1186 (November 24).
The broader negative outlook for EUR/USD is seen unchanged while below the key 200-day SMA at 1.1749.
EUR/USD daily chart

The S&P 500 has surged to a new high and also confirmed a bullish “triangle” continuation pattern. Analysts at Credit Suisse look for this to clear the way for strength and see next resistance at 4825/26 ahead of 4886/87 and eventually the 4970/5000 area.
Strong tone to be maintained for now
“The S&P 500 has confirmed the looked for bullish ‘triangle’ continuation pattern, clearing the way for further strength at the beginning of the year with resistance seen next at 4807/09, then the beginning of what we see as its ‘typical’ extreme (10% above the 200-day average) at 4825/26.
“Whilst we would look for 4825/26 to cap at first, we look for a move above here in due course with trend resistance from last April now seen at 4886/87.”
“Big picture, we look for a move to the ‘measured triangle objective” at 4970/75 with scope for 5000.”
“Support is seen at 4758 initially, then 4744, with the 13-day exponential average and recent price gap at 4736/26 ideally holding to keep the immediate risk higher.”
As cited by Reuters, five-year five-year forward Eurozone inflation expectations (i.e. inflation expectations over the five-year period beginning five years from now) rose above 2.0% for the first time since late October on Tuesday. As noted by Reuters, five-year five-year forward inflation expectations are seen as a key gauge of the market's long-term Eurozone inflation expectations, as well as a gauge of the credibility of ECB policy to hit its 2.0% target in the long-run.
The return to 2.0% will thus be looked on positively by ECB members as a show of market confidence in the appropriateness of their current policy stance. The gauge has rallied from as low as 1.85% in December as Omicron-related pessimism has been priced out by markets.
Market Reaction
There has not been any euro reaction to the latest developments in inflation expectations given that inflation expectations have also been rising elsewhere.
Norges Bank is buying 250mill NOK/day to balance the budget, whereas actual petroleum tax payments should have led to 750 mill/day of sales. Until the central bank changes gears, we will see higher Nibor and a stronger NOK, as reported by economists at Nordea.
The August Budget vs. reality
“Norges Bank announced in late December that they will buy 250 million NOK/day in January. This decision seems to us to be based on the very outdated 2022 budget from August 2021. Gas prices have come a long way since then.”
“Using updated data, the right decision would have been for the central bank to instead sell NOK at around 750 million/day.”
“Until Norges Bank turns around, we will see tighter structural liquidity, higher Nibor, and a stronger NOK.”
- EUR/GBP turned lower for the second successive day and dropped to a near two-year low.
- Divergent BoE-ECB monetary policy outlooks continued attracting sellers at higher levels.
- The set-up favours bearish traders and supports prospects for additional near-term losses.
The EUR/GBP cross continued losing ground through the mid-European session and dropped to the lowest level since February 2020, around mid-0.8300s in the last hour.
Following an early uptick to the 0.8400 neighbourhood, the EUR/GBP cross met with a fresh supply on Tuesday and drifted into the negative territory for the second successive day. The British pound continued with its relative outperformance against its European counterpart amid the divergent Bank of England (BoE) and the European Central Bank (ECB) monetary policy outlooks.
In fact, the BoE delivered a surprise rate hike in December and the markets expect another three to four rate increases in 2022. Conversely, the ECB officials had talked down the need for any action to counter inflation. Apart from this, a stronger US dollar was seen as another factor that weighed on the shared currency and continued exerting pressure on the EUR/GBP cross.
The British pound was further supported by the fact that the UK Prime Minister Boris Johnson suggested that there would be no further tightening of measures soon. Johnson, however, warned that the health system will remain under strain amid the Omicron-driven surge in COVID-19 infections. This might hold back traders from placing fresh bearish bets around the EUR/GBP cross.
Meanwhile, technical indicators on the daily chart maintained their bearish bias and are still far from being in the oversold territory. This, in turn, suggests that the EUR/GBP cross is more likely to prolong its recent downward trajectory witnessed over the past one month or so. Hence, any attempted recovery move might still be seen as a selling opportunity.
Technical levels to watch
- DXY extends the weekly rebound further north of the 96.00 mark.
- Further upside could well see the 2021 high at 96.93 retested.
DXY remains firm and advances to fresh multi-day peaks near 96.50 on turnaround Tuesday.
If bulls remain in control, then the index could challenge the 2021peak at 96.93 (November 24) ahead of the round level at 97.00 and then 97.80 (high June 30 2020).
In the meantime, while above the 4-month support line (off September’s low) around 94.90, the constructive view in DXY should remain unchanged. In addition, the broader positive stance stays underpinned by the 200-day SMA at 93.01.
DXY daily chart
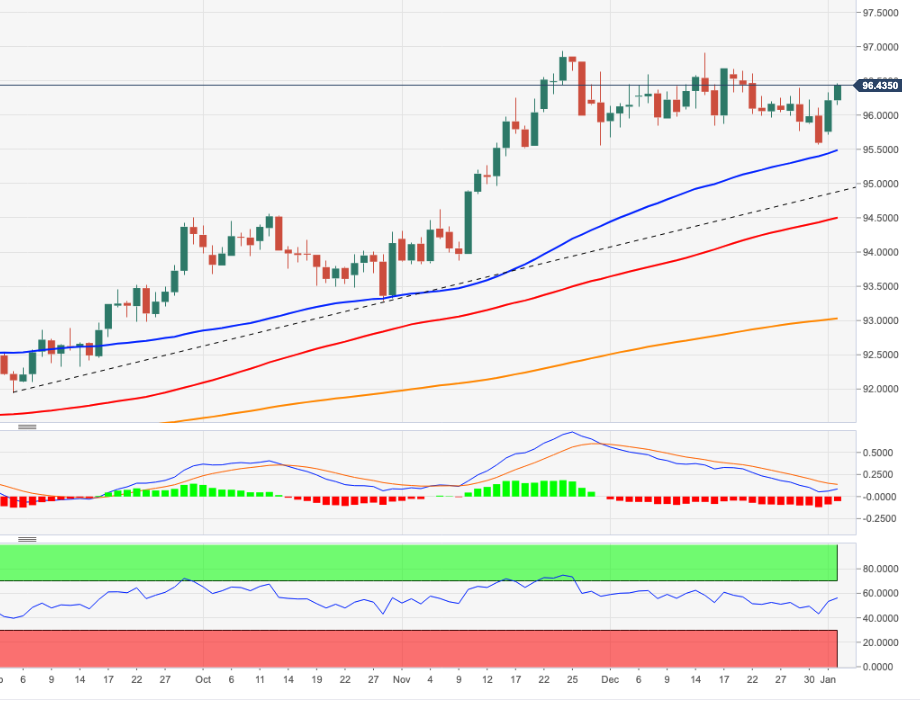
- WTI is trading modestly in the green on Tuesday in the $76.00 and is more composed after Monday’s choppiness.
- The main oil market driver on Tuesday will be the OPEC+ meeting, which starts at 1300GMT.
Whilst Monday’s session was choppy, perhaps exacerbated at the time by poor liquidity conditions with many Asia Pacific markets and London closed for holidays, oil markets appear to have gained composure on Tuesday. Omicron optimism-related risk-on vibes that have sent US yields soaring and pushed major US and European indices to record highs this week appear to be giving oil markets modest support on, with front-month WTI futures about 20 cents higher on the day and trading comfortable in the $76.00s, up from Monday’s lows in the $74.00s.
“The chief reason behind the return of investor confidence is Omicron,” said an analyst at Oanda. “Yes, the virus variant is much more contagious, but it is not leading to a proportionally larger number of hospital admissions... (so) it won't stop the global economic recovery”. HSBC’s chief multi-asset strategist Max Kettner adds that “UK hospitalisations have increased in the past couple of days, but the link clearly appears to be weaker than during the previous winter wave... As such, the sensitivity of cases to hospitalisations has barely budged so far. If that trend was to continue, that's good news”. The UK’s vaccine minister said on Monday that people currently being hospitalised with Covid-19 are broadly showing less severe symptoms than before. The French finance minister also expressed confidence on Tuesday that despite surging Omicron infections, the government’s 2022 economic outlook remains intact.
OPEC+ is the main oil market focus on Tuesday, with the cartel meeting to decide on future output policy. All indications from insider sources suggest the group will agree to continue with the 400K barrel per day output hikes into February. As to the expected timing, a meeting of OPEC+’s Joint Ministerial Monitoring Committee is currently underway and may culminate in a recommendation for OPEC+ policy. Markets will be more focused on the meeting of OPEC+ oil ministers which is slated to begin at 1300GMT and will actually result in a policy decision. Analysts at RBC Capital Markets said OPEC+ is unlikely to deviate from the current policy given the positive price outlook and pressure from the US to boost supply, as well as given the lack of major new Covid-19 curbs on travel in key markets. “Though Omicron cases continue to climb in key geographies, the absence of widespread lockdown restrictions will likely keep near-term demand concerns in check”.
- USD/CAD attracted fresh buying on Tuesday amid a modest USD strength.
- Elevated US bond yields continued acting as a tailwind for the greenback.
- Bullish oil prices underpinned the loonie and capped gains ahead of OPEC+.
The USD/CAD pair reversed an intraday dip and moved back closer to the top end of its daily trading range, around mid-1.2700s during the mid-European session.
The pair attracted some dip-buying near the 1.2725-20 region on Tuesday and might now be looking to build on the previous day's solid rebound from the 100-day SMA support. The US dollar continued drawing support from elevated US Treasury bond yields and climbed to a one-and-half-week high. This, in turn, was seen as a key factor that acted as a tailwind for the USD/CAD pair.
The markets have been pricing in the possibility for an eventual Fed liftoff by May and two more rate hikes by the end of 2022. This, along with the risk-on environment, pushed the yield on the 2-year and 5-year US government bonds to leves not seen since March 2020. Moreover, the benchmark 10-year note held steady near the highest level since November 24 and underpinned the buck.
That said, the underlying bullish tone – as depicted by an extension of the recent strong runup in the equity markets – held back traders from placing aggressive bets around the safe-haven USD. Apart from this, an uptick in crude oil prices extended some support to the commodity-linked loonie and might keep a lid on any meaningful upside for the USD/CAD pair, at least for now.
Market participants now look forward to the US economic docket, highlighting the release of the ISM Manufacturing PMI and JOLTS Job Openings data for some impetus during the North American session. Apart from this, headlines coming out of the OPEC+ meeting will influence oil price dynamics and allow traders to grab some short-term opportunities around the USD/CAD pair.
Technical levels to watch
USD/IDR is forecast to navigate the 14,200-14,330 range for the time being, in opinion of Quek Ser Leang at UOB Group’s Global Economics & Markets Research.
Key Quotes
“USD/IDR dropped to 14,170 in late Dec before rebounding quickly. The rapid rebound amidst waning momentum indicates that downward pressure has eased.”
“The current movement is viewed as part of a consolidation phase and USD/IDR is likely to trade between 14,200 and 14,330 for this week.”
- EUR/JPY fades Monday’s downtick and regains 131.00.
- Next to the upside comes 131.15 ahead of 131.41.
EUR/JPY quickly leaves behind the daily pullback recorded at the beginning of the week and now refocuses the attention to the 131.00 yardstick and above.
The recent breakout of the critical 200-day SMA (130.50) should prop up extra gains in the cross in the short-term horizon. That said, bulls now face the next minor barrier at the Fibo level (of the October-December drop) at 131.15 just before the 131.41 level (November 10) and then another Fibo retracement at 132.17.
While above the 200-day SMA, the outlook for EUR/JPY should point to extra gains.
EUR/JPY daily chart
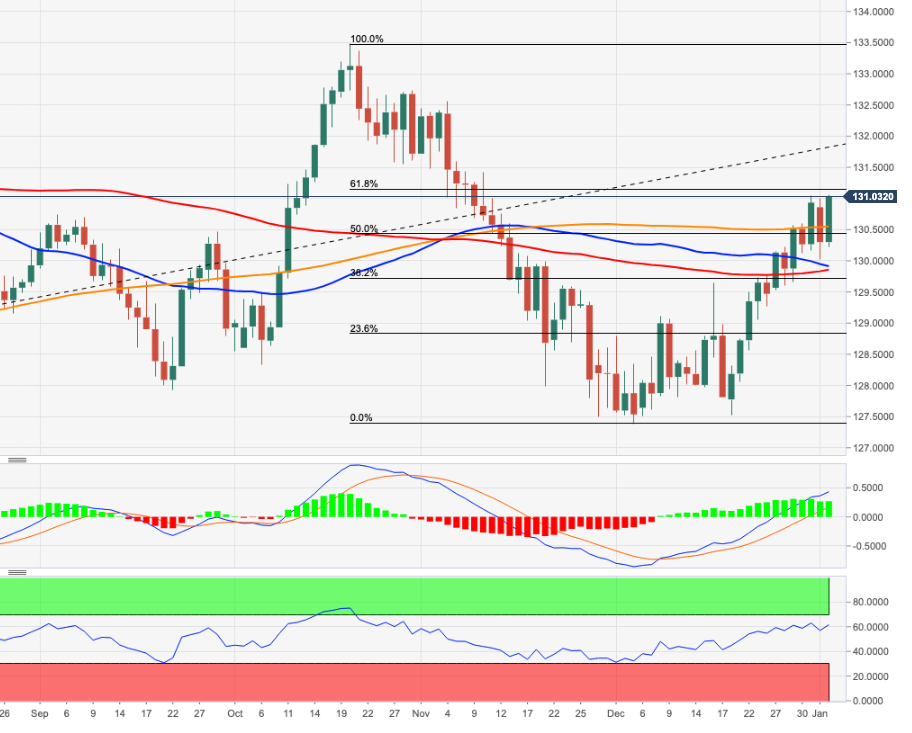
According to Quek Ser Leang at UOB Group’s Global Economics & Markets Research, USD/MYR could still retest the 4.1520 support zone.
Key Quotes
“USD/MYR dropped to a 1-1/2 - month low of 4.1620 last Friday. While the rapid decline over the past couple of weeks appear to be running ahead of itself, there is room for USD/MYR to test 4.1520.”
“For this week, a sustained drop below this major support level is unlikely. Resistance is at 4.1800 followed by 4.1920. Looking ahead, the next support below 4.1520 is at 4.1400.”
- GBP/USD regained positive traction on Tuesday and shot back above the 1.3500 mark.
- The risk-on mood, softer US bond yields undermined the USD and extended support.
- The worsening COVID-19 situation in the UK might keep a lid on the intraday move up.
The GBP/USD pair rallied nearly 50 pips from the daily swing low and shot back above the key 1.3500 psychological mark during the first half of the European session.
The pair attracted some buying near the 1.3460-55 area on Tuesday and reversed a part of the overnight slide to a three-day low, around the 1.3430 region. The prevalent risk-on mood, along with a softer tone around the US Treasury bond yields acted as a headwind for the safe-haven US dollar. This, in turn, was seen as a key factor that assisted the GBP/USD pair to regain positive traction.
The British pound further benefitted from the fact that the UK Prime Minister Boris Johnson suggested that there would be no further tightening of measures soon. Johnson, however, warned that the country's health system will remain under strain amid the current Omicron-driven surge in COVID-19 infections. This might hold back traders from placing bullish bets around the GBP/USD pair.
On the other hand, expectations for a faster policy tightening by the Fed should act as a tailwind for the US bond yields. In fact, the money markets have fully priced in the first-rate hike by May and two more by the end of 2022. This, in turn, supports prospects for a further near-term appreciating move for the greenback, which should further contribute to capping the upside for the GBP/USD pair.
On the economic data front, the UK Manufacturing PMI was finalized at 57.9 for December as against the flash estimate of 57.6. The data did little to impress traders or provide any meaningful impetus to the GBP/USD pair. Market participants now look forward to the US economic docket, featuring the release of ISM Manufacturing PMI and JOLTS Job Openings data for some short-term opportunities.
Technical levels to watch
Unlike the previous 5 years, when there was generally a uniform move higher or lower across multiple asset classes, 2021 was an incredibly even year with a roughly equal number of winners and losers. Precious metals and sovereign bonds both lost ground, and EM assets mostly struggled across the board, economists at Deutsche Bank report.
Precious Metals
“After its strongest performance in a decade in 2020, gold fell by -3.6% in 2021, marking its worst annual performance since 2015. Silver (-11.7%) had an even weaker performance, in what was also its biggest decline since 2015, whilst others including palladium (-22.2%) and platinum (-9.6%) lost ground too.”
Sovereign Bonds
“These got off to a weak start and struggled to recover their losses through the year, not helped by the massive stimulus that arrived on the scene at the start. US Treasuries (-2.5%) and UK gilts (-5.2%) both recorded their first negative annual total return since 2013, whilst EU sovereigns (-3.4%) saw their first negative performance since 2006.”
EM Assets
“In equities, they didn’t share the gains seen in developed markets, with the MSCI EM index losing -2.5% over 2021. The regulatory crackdown in China hurt a number of sectors there, and there were concerns about property markets and China Evergrande Group in particular. A number of EM currencies also struggled significantly, including the Turkish Lira (-44.2%) and the Argentine Peso (-18.5%), although this was admittedly not helped by the US dollar’s outperformance (+6.4%).”
2021 may have been a quieter year for markets than 2020, but it was still a fairly eventful one on the whole. However, unlike the previous 5 years, when there was generally a uniform move higher or lower across multiple asset classes- Oil was one of the best places to be, with WTI seeing an annual increase of +55%, while DM equities, cryptocurrencies and the US Dollar were also among the winners, as reported by Deutsche Bank.
Oil
“Oil was the standout performer as WTI (+55.0%) and Brent Crude (+50.2%) were at the top of our standard leaderboard over 2021 as a whole. The rally was supported by a number of factors, including a rise in global mobility after the lockdowns of 2020, as well as the surge in natural gas prices leading investors to seek out alternative sources of energy.
DM Equities
“The multi-year bull run continued in 2021, with the S&P 500 advancing by +28.7% in total return terms. Other DM equity indices put in a solid performance too, with Europe’s STOXX 600 up by +25.8% on a total returns basis.”
Cryptocurrencies
“A notable theme of 2021 has been the widespread growth of cryptocurrencies, with Bitcoin up by +59.8% over the year as a whole. This was driven by a number of factors, among them the search for a hedge against inflation, as well as the broader moves into risk assets amidst low returns elsewhere. Other cryptocurrencies including Ethereum (+399.1%) and XRP (+268.3%) surged over 2021 as well.”
US dollar
“The dollar index strengthened +6.4% over 2021, mostly reversing the -6.7% decline in 2020. The Japanese Yen was the worst performer, weakening -10.2% against USD.”
Other commodities (except precious metals)
“2021 was a great year for commodities more broadly. Industrial metals put in a decent performance, with copper up +26.8%. Over on the London metal exchange, others include tin (+91.2%), aluminium (+41.8%), zinc (+28.5%) and nickel (+24.9%) all recorded very strong gains too. Separately there was a big surge in a number of agricultural commodities, with wheat (+20.3%) seeing its strongest annual gain since 2010 and a 5th consecutive annual increase, whilst corn (+22.6%) and sugar (+21.9%) prices advanced too.”
Quek Ser Leang at UOB Group’s Global Economics & Markets Research suggested USD/THB should remain under pressure as long as the 33.75 level caps the upside.
Key Quotes
“While USD/THB dropped to a 2-month low of 33.15 last week, downward momentum has not improved by much. That said, there is room for USD/THB to test 33.10.”
“For this week, the next support at 32.90 is unlikely to come under threat. Resistance is at 33.40 followed by 33.60. Looking ahead, USD/THB is expected to stay under pressure as long as it stays below the major resistance at 33.75.”
JP Morgan strategists led by Mislav Matejka said in the latest client note that the global stock market party is not over yet.
Key quotes
“Stay bullish -- positive catalysts are not exhausted.”
“Downside risks -- including a hawkish turn by central banks, a slowdown in China’s economy, or more significant coronavirus restrictions -- will either fail to materialize or are already priced into stocks.”
“Key calls is an overweight position on U.K. and euro-area equities, as well as on banks, miners and autos.”
“See a good entry point in emerging-market stocks, with China deceleration “by now largely behind us.”
“Recommend a neutral position on US stocks, citing they “could stall relatively if the tech outperformance starts to wane.”
“The Fed is unlikely to become more hawkish, and consensus earnings growth projections “will again prove too low.”
- EUR/USD struggles for direction around 1.1300 on Tuesday.
- German Unemployment Rate ticked lower to 5.2% in December.
- US ISM Manufacturing next of relevance in the calendar.
The single currency looks to leave behind the pessimism seen at the beginning of the year and now pushes EUR/USD back above the 1.1300 mark, recording modest gains so far on Tuesday.
EUR/USD looks supported around 1.1280
Following Monday’s moderate pullback, EUR/USD attempts to regain some upside traction in response to the lack of direction in the US dollar and the steady performance of yields on both sides of the Atlantic.
The appetite for the risk-associated assets, in the meantime, appears firmer on Tuesday amidst declining concerns around the advance of the omicron strain in spite of the increasing COVID cases around the world. Investors, however, seem to favour the “glass half-full” version and look past the global economic recovery coupled with persistent elevated inflation and the probable normalization of monetary conditions by major central banks later in the year.
In Germany, Retail Sales expanded at a monthly 0.6% in November and contracted 0.2% over the last twelve months. Further data saw the Unemployment Change dropping by 23K people in December and the jobless rate ticking lower to 5.2% in the same period.
Later in the NA session, all the attention will be on the release of the December’s ISM Manufacturing.
What to look for around EUR
EUR/USD met quite decent contention in the 1.1280 region so far this week. As the normal activity resumes in the global markets following the festive period, the pair is seen refocusing on the main driver of the pair’s price action, namely the ECB-Fed policy divergence. In the meantime, the unabated progress of the coronavirus pandemic as well as the fast-spreading omicron variant remain as the exclusive factors to look at when it comes to the economic growth prospects and investors’ morale.
Key events in the euro area this week: German Retail Sales, labour market report (Tuesday) - EMU/Germany Final Services PMIs (Wednesday) - Germany Advanced December Inflation Rate (Thursday) - EMU Advanced December Inflation Rate (Friday).
Eminent issues on the back boiler: Asymmetric economic recovery post-pandemic in the euro area. ECB stance/potential reaction to the persistent elevated inflation in the region. ECB tapering speculation/rate path.
EUR/USD levels to watch
So far, spot is gaining 0.08% at 1.1303 and faces the next up barrier at 1.1386 (monthly high November 30) followed by 1.1464 (weekly high Nov.15) and finally 1.1520 (200-week SMA). On the other hand, a break below 1.1273 (weekly low Dec.29) would target 1.1221 (weekly low Dec.15) en route to 1.1186 (2021 low Nov.24).
- Gold regained some positive traction on Tuesday and recovered a part of the overnight losses.
- The risk-on mood, elevated US bond yields, a modest USD strength capped gains for the metal.
- Investors now look forward to the US macro data for some impetus later during the NA session.
Gold gained some positive traction on Tuesday and reversed a part of the overnight sharp retracement slide from the $1,830-32 region, or the highest level since November 22. The uptick lacked any obvious fundamental catalyst and could be solely attributed to some technical buying near the very important 200-day SMA. The XAU/USD maintained its bid tone through the first half of the European session and was last seen trading just above the $1,800 mark, though the uptick lacked bullish conviction.
Hopes of steady economic recovery, to a larger extent, offset worries about the continuous surge in new COVID-19 cases globally and remained supportive of the optimistic market mood. This was evident from an extension of the recent bullish run in the equity markets to record highs, which acted as a headwind for the safe-haven gold. Apart from this, hawkish Fed expectations, rising US Treasury bond yields and a modest US dollar strength also contributed to cap the upside for the precious metal.
The money markets have fully priced in the first-rate hike by May and two more by the end of 2022. This, along with the prevalent risk-on mood, pushed the yield on the benchmark 10-year US government bond to 1.6420% for the first time since November 24 on Monday. Adding to this, the US 2-year and 5-year notes soared to their highest since March 2020, which continued underpinning the greenback and kept a lid on any further gains for the non-yielding yellow metal, at least for the time being.
Investors also seemed reluctant to place aggressive bets, rather preferred to wait on the sidelines ahead of the key event/data risks. The Fed is due to release the minutes of its December monetary policy meeting on Wednesday. Apart from this, investors will take cues from important US macro releases scheduled at the beginning of a new month. A rather busy week kicks off with the release of ISM Manufacturing PMI and JOLTS Job Openings data later during the North American session.
This week's US economic docket also highlights the release of the ADP report on private-sector employment on Wednesday and the ISM Services PMI on Thursday. The key focus, however, will remain on the closely watched US monthly jobs report – popularly known as NFP on Friday. This will play a key role in influencing the near-term USD price dynamics and provide a fresh directional impetus to the dollar-denominated gold.
Technical outlook
From a technical perspective, a sustained break below the $1,800 mark might shift the bias in favour of bearish traders and prompt some technical selling. The XAU/USD might then accelerate the slide towards the $1,785 horizontal support en-route the $1,770 region and December swing low, around the $1,753 area.
On the flip side, the $1,830-32 region should continue to act as a key barrier, which if cleared decisively should push gold prices further towards the $1,850 region. The upward trajectory could then allow bulls to challenge November 2021 swing high, around the $1,877 with some intermediate hurdle near the $1,870 area.
Gold daily chart
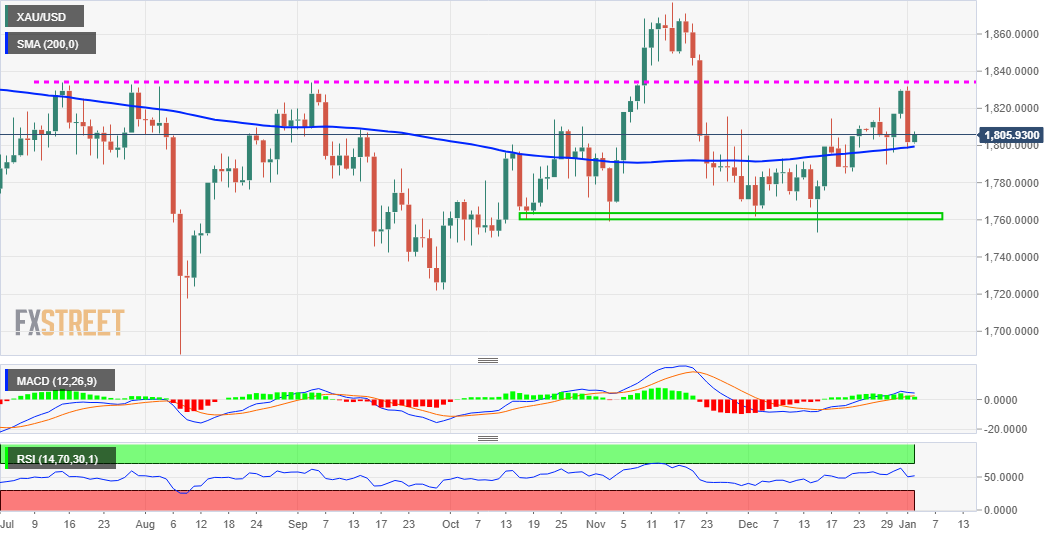
Levels to watch
EUR/USD dribbles below 1.13 again. Economists at Société Générale are watching out closely the 1.1380 and 1.1230 marks to decipher the next move of the world’s most popular currency pair.
Support 1.1230, resistance 1.1380
“A break above the upper band at 1.1380 will be essential for an extended bounce.”
“Break below 1.1230 can lead to next leg of downtrend.”
The first central bank meeting of 2022 will be held today by the National Bank of Poland (NBP). EUR/PLN is now probing the 200-day moving average (DMA) at 4.57. The prospects of raising the benchmark rate by 50 bps should underpin the zloty at this level, in the opinion of economists at Société Générale.
The consensus sees NBP raising its benchmark rate by 50 bps to 2.25%
“Our house call is in line with the market consensus for a 50bp hike to 2.25%. The prospect of a hawkish hike and more details of the tightening path at the press conference tomorrow by governor Glapinski ought to support the zloty and keep EUR/PLN near 4.57 (200-DMA).”
“In case the 200-DMA at 4.57 gets violated, there would be a risk of a deeper pullback towards the lower band of the channel at 4.5000/4.4800.”
“Right shoulder of the pattern at 4.6460 is an important hurdle near-term.”
The UK manufacturing sector activity expanded more than expected in December, the final report from IHS Markit confirmed on Tuesday.
The seasonally adjusted IHS Markit/CIPS UK Manufacturing Purchasing Managers’ Index (PMI) was revised higher from 57.6 to 57.9 in December, beating expectations of 57.6.
Key points
Output, new orders and employment all rise.
New export orders fall for fourth month running.
Selling price inflation hits fresh record high.
Rob Dobson, Director at IHS Markit, commented on the survey
“UK manufacturing production rose at the quickest pace in four months in December, supported by increased intakes of new work, efforts to reduce backlogs of work and higher employment.”
“While the uptick in growth is a positive step, the upturn remains subdued compared to the middle of the year, as supply chain constraints and weak export performance constrained attempts to raise production further.”
“Manufacturers indicated that logistic issues, Brexit difficulties and the possibility of further COVID restrictions (at home and overseas) had all hit export demand at the end of the year.”
GBP/USD reaction
At the press time, GBP/USD is extending gains above 1.3500, currently trading at 1.3510. The spot is up 0.30% on the day.
- USD/INR attempts a rebound as the DXY capitalizes on firmer yields.
- Acceptance above 100-DMA is critical for USD/INR buyers.
- Daily technical setup suggests a pullback before a fresh downswing kicks in.
USD/INR is posting sizeable gains in the European session this Tuesday, reversing the entire drop seen Monday.
The rebound in the pair can be attributed to the notable US dollar demand, courtesy of the sharp rally in the US Treasury bond yields.
The US yields jumped in tandem with the coronavirus cases globally while rising odds of a March Fed rate hike also helped fuel the upswing.
The upbeat sentiment around oil prices weighed negatively on the Indian rupee, in turn, collaborating with the upturn in the spot.
At the time of writing, the spot is trading close to the daily highs of 74.58, looking to find acceptance above the 100-Daily Moving Average (DMA) at 74.50.
The 14-day Relative Strength Index (RSI) is bouncing from near the oversold region, boding well for bulls, as they attempt a rebound.
The December 30 highs of 74.64 will be next on the buyers’ radars should the price close above the 100-DMA on a daily basis.
USD/INR: Daily chart
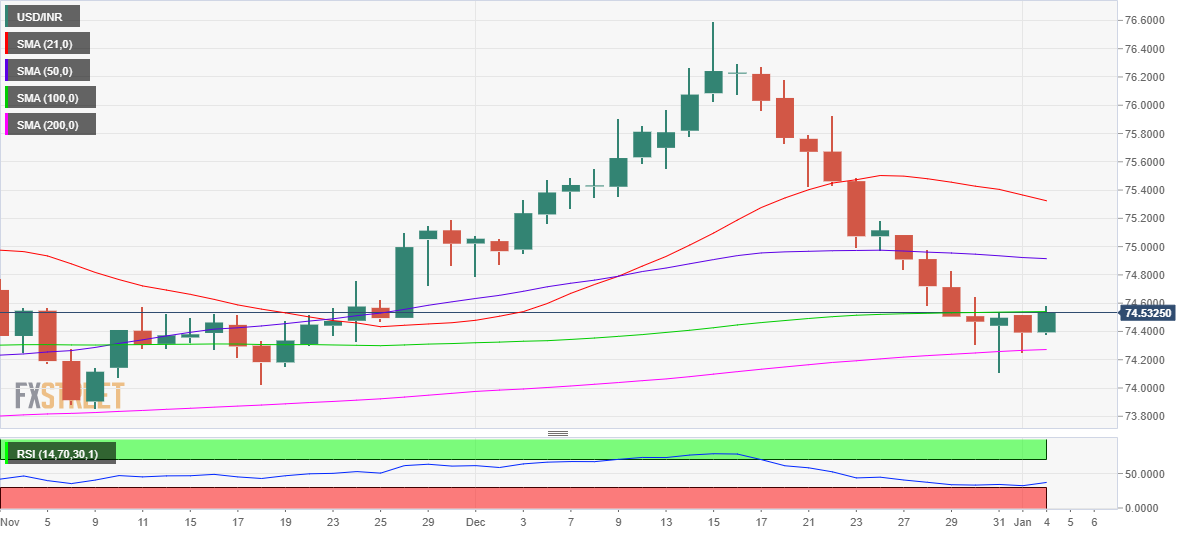
On the other hand, the bulls remain hopeful for recovery so long as the cross holds above the ascending 200-DMA at 74.27.
The downtrend from mid-December peaks of 76.59 will resume on a sustained move below the latter, exposing December 31 lows of 74.10.
Deeper declines will see a test of the 73.50 psychological levels.
USD/INR: Additional levels
EUR/CHF is steady at 1.0370. The pair must overcome the 1.0470 mark to stage a meaningful rebound, according to economists at Société Générale.
Failure at 1.0470 to put 1.0260 and 1.0225/10 back in the spotlight
“The pair is now attempting a move beyond a multi-month descending trend line. This could lead to a short-term up move however daily Ichimoku cloud at 1.0470 could provide resistance. This must be overcome for a meaningful rebound.”
“Failure to cross 1.0470 would mean continuation in downtrend towards next projections at 1.0260 and 1.0225/1.0210.”
GBP/USD has managed to recover to 1.3500 following Monday's decline. In the view of FXStreet’s Eren Sengezer, downside appears limited as 1.3460 support holds.
Technical outlook suggests that GBP/USD could move sideways in the near-term
“Later in the session, the ISM will release the Manufacturing PMI data for December. In case this report points to an ongoing expansion in the manufacturing sector's activity at a robust pace, risk flows could dominate the markets and allow the dollar to outperform its rivals on the back of rising yields.”
“Despite Monday's sharp decline, GBP/USD managed to hold above the 50-period SMA on the four-hour chart, which is currently acting as dynamic support at 1.3460. The Relative Strength Index (RSI) indicator on the same chart is moving sideways near 50, confirming the pair's indecisiveness.”
“In case the pair drops below 1.3460 and starts using it as resistance, the next target on the downside is located at 1.3440 (static level) before 1.3400 (static level, psychological level).”
“Resistances are located at 1.3500 (psychological level, 20-period SMA), 1.3520 (static level) and 1.3550 (December 31 high).”
See: GBP/USD to get a drift lower first regaining its sails to ride higher again – DBS Bank
- AUD/USD regained positive traction on Tuesday and recovered a part of the overnight losses.
- The risk-on mood, upbeat Chinese PMI extended some support to the perceived riskier aussie.
- Elevated US bond yields underpinned the USD and kept a lid on any further gains for the pair.
The AUD/USD pair maintained its bid tone through the first half of the European session and was last seen trading near the daily high, around the 0.7210 region.
A combination of supporting factors assisted the AUD/USD pair to regain positive traction on Tuesday and reverse a part of the previous day's retracement slide from the vicinity of 100-day SMA. Despite Omicron-driven surge in COVID-19 infections globally, hopes of steady economic recovery remained supportive of the underlying bullish sentiment. This, along with better-than-expected China's Caixin Manufacturing PMI, further boosted investors' confidence and benefitted the perceived riskier aussie.
On the other hand, the US dollar drew some support from elevated US Treasury bond yields. In fact, the yield on the benchmark 10-year US government bond surged to 1.6420% for the first time since November 24 amid expectations for a faster policy tightening by the Fed. The money markets have fully priced in the first-rate hike by May and two more by the end of 2022. This, in turn, continued acting as a tailwind for the greenback and capped any further gains for the AUD/USD pair, at least for now.
Investors might also be reluctant to place aggressive bets, rather prefer to wait on the sidelines ahead of this week's key event/data risks. A rather busy week kicks off with the release of ISM Manufacturing PMI and JOLTS Job Openings data from the US later during the early North American session on Tuesday. The Fed is also scheduled to release the minutes of its December monetary policy meeting on Wednesday, which will be followed by the ADP report and the ISM Services PMI on Thursday.
The key focus, however, will remain on the closely watched US monthly jobs report – popularly known as NFP on Friday. This would play a key role in influencing the near-term USD price dynamics and provide a fresh directional impetus to the AUD/USD pair. In the meantime, traders might continue to take cues from developments surrounding the coronavirus saga. Apart from this, the US bond yields will drive the USD demand and allow traders to grab some short-term opportunities around the major.
Technical levels to watch
The mixed outlook could prompt USD/CNH to remain side-lined in the 6.3400-6.3900 range for the time being, suggested FX Strategists at UOB Group.
Key Quotes
24-hour view: “Our view from yesterday that ‘risk for USD is on the downside’ was incorrect as it rose to 6.3750 before closing at 6.3743 (+0.14%). While upward momentum has not improved by much, there is scope for USD to edge higher to 6.3800. A sustained rise above this level appears unlikely. On the downside, a breach of 6.3630 (minor support is at 6.3680) would indicate that the current upward pressure has eased.”
Next 1-3 weeks: “We highlighted yesterday (03 Jan, spot at 6.3550) that downward momentum is beginning to build and we were of the view that USD could test 6.3310. Our view was invalidated quickly as USD soared to our ‘strong resistance’ level at 6.3750. While the ‘strong resistance’ is not clearly breached, the build-up in momentum has fizzled out. From here, the outlook is mixed, and USD could trade between 6.3400 and 6.3900 for now.”
- USD/CHF edged lower on Tuesday and eroded a part of the overnight strong recovery move.
- Subdued USD demand was seen as a key factor that prompted some selling around the major.
- A combination of factors should continue to lend support and help limit any meaningful slide.
The USD/CHF pair remained depressed through the early European session and was last seen trading just a few pips above the daily low, around the 0.9180-75 region.
The pair struggled to capitalize on the previous day's strong rally of nearly 100 pips from the 0.9100 neighbourhood and edged lower during the first half of the trading on Tuesday. Subdued US dollar price action was seen as a key factor that acted as a headwind for the USD/CHF pair and attracted some selling in the vicinity of the 0.9200 mark. The downside, however, remains cushioned amid the upbeat market mood, which tends to undermine the safe-haven Swiss franc.
Despite the continuous surge in COVID-19 cases globally, investors remain optimistic over signs that the Omicron variant might be less severe than feared and is unlikely to derail the economic recovery. This was evident from the recent strong runup in the equity markets, which along with hawkish Fed expectations acted as a tailwind for the US Treasury bond yields. The combination of factors should lend some support to the USD and limit losses for the USD/CHF pair.
Meanwhile, the money markets have fully priced in the first-rate hike by May and two more by the end of 2022. This, in turn, pushed the yield on the benchmark 10-year US government bond surged to 1.6420% for the first time since November 24 on Monday. This should help revive the USD demand and add credence to the short-term positive outlook for the USD/CHF pair. That said, investors seemed reluctant to place aggressive bets ahead of this week's key event/data risks.
The Fed is due to release the minutes of its December meeting on Wednesday. Apart from this, investors will take cues from important US macro data scheduled at the beginning of a new month. A rather busy week kicks off with the release of ISM Manufacturing PMI and JOLTS Job Openings data later during the early North American session on Tuesday. The Fed is also scheduled to release the minutes of its December monetary policy meeting on Wednesday.
This will be followed by the ADP report and the ISM Services PMI on Thursday. The key focus, however, will remain on the closely watched US monthly jobs report – popularly known as NFP on Friday. This will play a key role in influencing the near-term USD price dynamics and provide a fresh directional impetus to the USD/CHF pair. Hence, it will be prudent to wait for a strong follow-through buying before confirming that the pair has bottomed out.
Technical levels to watch
GBP’s recovery from Covid peaked at 1.4212 in May 2021. In November, the Bank of England’s shock decision to refrain from the rate hike it flagged sent the cable to the year’s low of 1.32. In 2022, economists at DBS bank expect the GBP/USD pair to trade in a lower 1.28-1.33 range.
GBP caught between BoE hikes and Brexit/political risks
“In 2022, BoE rate hike expectations are likely to be offset by calls for earlier Fed hikes and Brexit risks.”
“Worries persist that the British government might trigger Article 16 and set off a trade war with the EU. The Guardian newspaper noted that Tory MPs could turn on Prime Minister Boris Johnson if his falling approval rating slips below the Conservative Party.”
“GBP to trade in a lower 1.28-1.33 range into 2022.”
Economists at DBS Bank expect the Swiss franc to weaken above 0.95 per US dollar on Federal Reserve hikes vs. dovish Swiss National Bank.
SNB to maintain its expansionary monetary policy
“Barring any unforeseen shocks, expect CHF to depreciate above 0.95 per USD in 2022.”
“As a negative-yielding currency, CHF was more resilient than EUR and JPY in 2021. We do not expect this to persist in 2022 on a stronger USD from Fed hike expectations.”
“There is no urgency for the central bank (SNB) to join its G10 counterparts in normalising monetary policy. SNB’s inflation forecast (0.5% in 2021, 0.7% in 2022, and 0.6% in 2023) indicates no imminent threat to price stability.”
“SNB will maintain its expansionary monetary policy and stands ready to intervene in the exchange rate market when necessary to support the nascent recovery from the pandemic.”
- The index adds to Monday’s gains above the 96.00 mark.
- US yields seem to be taking a breather following the recent climb.
- The ISM Manufacturing will take centre stage later in the NA session.
The greenback, in terms of the US Dollar Index (DXY), adds to recent gains and challenges the area of recent tops around the 96.30 zone.
US Dollar Index looks to yields, data
The index advances for the second session in a row on turnaround Tuesday amidst alternating risk appetite trends and steady activity in US yields so far.
Indeed, the upside momentum in US yields witnessed at the beginning of the year seems to have entered in an impasse, although they keep navigating in the upper end of the range. On that, the closely watched 2y-10y spread rose to levels last seen in early December around 85 pts.

The recent and strong bounce in US yields follows the investors’ adjustment to the idea of 2-3 interest rate hikes by the Federal Reserve in the current year along with the strong performance of the US economy, which should underpin further the constructive outlook for the dollar in 2022.
Shifting to the US calendar, the ISM Manufacturing for the month of December will be the sole release later in the NA session seconded by the November JOLTs Job Openings.
What to look for around USD
The index managed to regain the 96.00 barrier and above at the beginning of the new year, almost exclusively on the back of the move higher in US yields. As markets slowly return to normality, the dollar is forecast to remain bolstered by the Fed’s intentions to hike the interest rates later in the year amidst persevering elevated inflation, supportive Fedspeak and the solid performance of the US economy.
Key events in the US this week: ISM Manufacturing PMI (Tuesday) - ADP Report, FOMC Minutes (Wednesday) - Initial Claims, ISM Non-Manufacturing, Factory Orders (Thursday) - Nonfarm Payrolls, Unemployment Rate (Friday).
Eminent issues on the back boiler: Start of the Fed’s tightening cycle. US-China trade conflict under the Biden’s administration. Debt ceiling issue. Potential geopolitical effervescence vs. Russia and China.
US Dollar Index relevant levels
Now, the index is gaining 0.02% at 96.23 and a break above 96.39 (weekly top Dec.29) would open the door to 96.90 (weekly high Dec.15) and finally 96.93 (2021 high Nov.24). On the flip side, the next down barrier emerges at 95.57 (monthly low Dec.31) followed by 95.51 (weekly low Nov.30) and then 94.96 (weekly low Nov.15).
The US Dollar Index (DXY) appreciated 7.7% YTD to the year’s high at 96.9 in November when the Federal Reserve started tapering asset purchases. According to economists at DBS Bank, the US dollar is likely to be supported into the two Fed hikes they expect in 4Q22.
USD to remain firm into the two Fed hikes expected in 4Q22
“We expect the Fed to complete tapering by mid-2022, delivering two hikes in 4Q22.”
“DXY appreciation in 2022 will be less aggressive and choppier than that seen in 2H21.”
“Based on past experiences, we expect the DXY to appreciate into the first Fed hike and depreciate thereafter.”
GBP’s strong recovery from 2021’s year-end lows is losing momentum. As Benjamin Wong, Strategist at DBS Bank notes, technical readings suggest the cable needs to cool its December rally as it heads towards the weekly chart’s 1.3627 key resistance.
December rally to cool off
“The technical indicator is now positioned into a stretched reading as GBP starts to walk into a resistance zone fashioned by a weekly chart pivot at 1.3627, which trails from the early June 2021’s 1.4248 peak. Ahead of that, the 100-day moving average (DMA) resistance also sits at 1.3563; and the 200-DMA, which successfully contained and retarded a rally from 1.3412, is above the 1.3627 pivot at 1.3745.”
“GBP is now walking into a price zone where resistance of sorts is likely to hinder its progress unless it pulls over a sustained rally over 1.3755.”
“While in the short-term GBP/USD should see a cooling-off phase and struggle to maintain upside impetus, its 2021 performance is not that bad. The 50-month moving average marked at 1.3203 offers robust support (having been tested twice and held); hence a decline from current levels does not appear sustainable to develop into an outright bearish path. 1.3203 and 200-week moving average pegged at 1.3143 remain levels where buyers would attempt to regain the wheel. Only such a breach under these supports unlocks the 50% Fibonacci retracement of GBP’s rally from covid ashes at 1.2830.”
The Japanese yen was the weakest G10 currency in 2021. In 2022, JPY has scope to depreciate into a 115-120 range per USD, economists at DBS Bank report.
BoJ to spend more time discussing than moving to phase out its pandemic measures
“In sharp contrast to abovetrend inflation in Western countries, Japan is a long way from achieving its 2% inflation target. Our economists forecast low CPI inflation of 0.5% in 2022 and 2023.”
“The central bank (BoJ) is likely to spend more time discussing than moving to phase out its pandemic measures. Barring any economic shocks that render the JPY a safe-haven.”
“JPY to depreciate between 115 and 120 per USD in 2022.”
EUR/USD has declined below 1.1300 amid renewed dollar strength. As FXStreet’s Eren Sengezer notes, the door is open for additional losses.
Near-term technical outlook points to additional losses
“The dollar's market valuation should remain the primary driver of EUR/USD's movements on Tuesday. In case US T-bond yields continue to rise on the back of an upbeat market mood, the pair could find it difficult to reverse its direction.”
“The 200-period SMA on the four-hour chart is currently acting as a dynamic hurdle near 1.1300. The 100-period SMA is enforcing that resistance area as well. Unless EUR/USD manages to flip that level into support, sellers are likely to continue to dominate the pair's action.”
“1.1270 (static level) aligns as interim support ahead of 1.1240 (static level). The latter held as support when the pair fell 100 pips back in mid-December, punctuating the importance of this level.”
NZD/USD consolidated between 0.6750 and 0.7200 in 2H21. Economists at DBS Bank expect the kiwi to remain stable around the 0.68 level into 2022.
USD supported by the two Fed hikes in 4Q22
“Although the RBNZ expects further removal of monetary stimulus over time, it also considers high house prices as unsustainable and a challenge to monetary and financial stability. Hence, consensus might be overly enthusiastic in expecting the official cash rate to increase to 1.50% in 2022. We see USD supported by the two Fed hikes in 4Q22.”
“Consensus expects real GDP growth to slow to 3.5% in 2022 from a projected 5.3% in 2021, and CPI inflation to ease to 2.7% from 3.5%. The central bank (RBNZ) expects the cash rate to increase to 1.50% from a projected 0.75% at the end of 2021.”
“NZD to consolidate within 0.68 into 2022.”
The Indonesian rupiah has held up well into the Fed taper. The trading range was significantly narrower between 13,865 and 14,630 (5%-wide) this year compared to 13,575-16,625 (22%-wide) last year. In 2022, economists at DBS Bank expect USD/IDR to trade around the 14,500-15,000 region.
BI to keep rates low for most of 2022
“IDR to depreciate into 14,500-15,000 per USD ahead of two Fed hikes in 4Q22.”
“The central bank (BI) intends to keep rates low for most of next year to help the nascent recovery (from the third covid wave) gain traction. In line with BI’s guidance, we have pencilled in a rate hike to 3.75% from 3.50% in 4Q22.”
“We expect real GDP growth to pick up to 4.8% in 2022 from a projected 3.6% in 2021, and CPI inflation double to 3.0% from 1.5%.”
- NZD/USD gained some positive traction on Tuesday and recovered a part of the overnight losses.
- The prevalent risk-on mood was seen as a key factor that benefitted the perceived riskier kiwi.
- Elevated US bond yields acted as a tailwind for the USD and kept a lid on any meaningful upside.
The NZD/USD pair traded with a mild positive bias through the early European session and was last seen hovering just a few pips below the 0.6800 round-figure mark.
The pair attracted some buying during the first half of the trading on Tuesday and recovered a part of the previous day's retracement slide from the 0.6855 region, or a one-month high. The prevalent risk-on mood was seen as a key factor that extended some support to the perceived riskier kiwi. Despite the continuous rise in COVID-19 cases globally, investors remain optimistic over signs that the Omicron variant might be less severe than feared and is unlikely to derail the economic recovery. This was evident from the recent strong runup in the equity markets to record highs.
The uptick, however, lacked bullish conviction and so far, has struggled to find acceptance above the 0.6800 mark amid a modest US dollar strength. Expectations for a faster policy tightening by the Fed triggered a massive rally in the US Treasury bond yields on Monday, which, in turn, continued acting as a tailwind for the greenback. In fact, the money markets have fully priced in the first-rate hike by May and two more by the end of 2022. This, in turn, pushed the yield on the benchmark 10-year US government bond to 1.6420%, or the highest level since November 24.
Moreover, investors also seemed reluctant to place aggressive bets, rather might prefer to wait on the sidelines ahead of this week's key event/data risk. A rather busy week in terms of important US macro data kicks off with the release of ISM Manufacturing PMI and JOLTS Job Openings data later during the early North American session. The Fed is also scheduled to release the minutes of its December meeting on Wednesday, which will be followed by the ADP report and the ISM Services PMI on Thursday. The key focus, however, will remain on the closely watched US monthly jobs report (NFP) on Friday.
The mixed fundamental backdrop warrants some caution for bullish traders and makes it prudent to wait for a sustained strength above the 0.6855 resistance zone before positioning for any further gains. This would reaffirm that the NZD/USD pair has formed a near-term bottom near the 0.6700 round-figure mark, or the 2021 low touched on December 15 and set the stage for some meaningful appreciating move.
Technical levels to watch
USD/JPY is still expected to edge higher in the next weeks, noted FX Strategists at UOB Group.
Key Quotes
24-hour view: “We highlighted yesterday that USD could rise to 115.50 but a clear break of this level is unlikely. USD subsequently dipped to 114.94 before bouncing back up to 115.36. While upward momentum has not improved by much, USD could edge above the major resistance at 115.50. For today, the next resistance at 115.80 is unlikely to come under threat. Support is at 115.20 followed by 115.00.”
Next 1-3 weeks: “Our view from yesterday (03 Jan, spot at 115.20) still stands. As highlighted, there is room for USD to edge above Nov’s peak near 115.50. Barring a surge in momentum, a sustained rise above this level appears unlikely (next resistance is at 115.80). On the downside, a breach of 114.80 (‘strong support’ level was at 114.60 yesterday) would indicate that the current upward pressure has eased.”
AUD/USD witnessed aggressive selling on Monday. During the Asian session on Tuesday, the aussie has regained some positive traction and has moved back above the 0.7200 mark. But as FXStreet’s Haresh Menghani notes, a break below 0.7180 would set the stage for further losses.
AUD/USD defends ascending trend-line support, at least for now
“The overnight corrective pullback from the vicinity of 100-day SMA stalled near an ascending trend-line extending from the 2021 low. The mentioned support, currently around the 0.7180 region, should now act as a pivotal point for short-term traders.”
“A convincing break below 0.7180 will set the stage for additional losses and accelerate the fall towards the 0.7100 round-figure mark. Some follow-through selling below the 0.7085 horizontal support might turn the pair vulnerable to challenge the key 0.7000 psychological mark.”
“Any subsequent positive move beyond the 0.7220 level might now confront resistance near the 0.7250-55 area. This is followed by the 0.7275-80 region, which nears the 100-DMA. A convincing breakthrough will be seen as a fresh trigger for bullish traders and set the stage for additional gains.”
Gold fell sharply on Monday but managed to hold above $1,800 so far. That said, any meaningful recovery still seems elusive ahead of this week's key event/data risk, FXStreet’s Haresh Menghani reports.
XAU/USD to test the $1,800 level one more time
“The Fed is due to release the minutes of its December meeting on Wednesday. Apart from this, the US economic docket features the release of ISM Manufacturing PMI and JOLTS Job Openings data later on Tuesday. This will be followed by the ADP report on Wednesday and the ISM Services PMI on Thursday. The key focus, however, will remain on the closely watched US monthly jobs report on Friday.”
“A sustained break below the $1,800 mark might prompt some technical selling and turn the XAU/USD vulnerable to slide further. The downward trajectory could drag gold towards the $1,785 horizontal zone en-route the next relevant support near the $1,770 region and December swing low, around the $1,753 area.”
“The $1,830-32 region should continue to act as a key barrier, which if cleared decisively should push XAU/USD further towards the $1,850 region. Bulls might then aim to challenge November 2021 swing high, around the $1,877 with some intermediate hurdle near the $1,870 area.”
Here is what you need to know on Tuesday, January 4:
The greenback outperformed its rivals on Monday, supported by the sharp upsurge witnessed in the US Treasury bond yields. The US Dollar Index erased the losses it suffered in the last week of 2021 and continues to edge higher in the early European session on Tuesday. The benchmark 10-year US T-bond yield, which rose nearly 8% on Monday, is currently posting small daily gains at 1.63%. The ISM Manufacturing PMI for December and November JOLTS Job Openings will be featured in the US economic docket in the second half of the day. Statistics Canada will release the Industrial Product Price Index data for November as well.
The risk-positive market environment at the start of the week provided a boost to US T-bond yields. The S&P 500 and the Dow Jones Industrial Average gained 0.64% and 0.68%, respectively, amid easing concerns over the potential negative impact of the coronavirus Omicroin variant on global economic activity. US stocks futures indexes are up between 0.2% and 0.3% in the early European session, suggesting that the market mood is likely to remain upbeat on Tuesday.
EUR/USD fell sharply in the second half of the day and lost more than 60 pips on Monday before settling below 1.1300. The dollar's market valuation continues to drive the pair's action.
GBP/USD snapped a three-day winning streak on Monday and seems to have gone into a consolidation phase around 1.3470 early Tuesday. British Prime Minister Boris Johnson reiterated that they will not reintroduce explicit lockdowns but warned of rising pressure on the healthcare system.
Gold fell sharply amid surging US Treasury bond yields on Monday but managed to hold above $1,800 so far. Another leg higher in yields could cause XAU/USD to test that level one more time.
USD/JPY rallied to its highest level in five years as the JPY struggled to find demand as a safe haven. The pair is currently trading a little above 115.70, rising 0.35% on a daily basis.
Bitcoin lost nearly 2% on Monday and continues to edge lower toward $45,000 on Tuesday. Ethereum erased a small portion of its losses after touching a daily low of $3,680 on Monday but ended up closing the day in the negative territory.
- USD/JPY jumped to the highest level since January 2017 during the early part of trading on Tuesday.
- The risk-on mood continued undermining the safe-haven JPY and continued pushing the pair higher.
- Elevated US bond yields acted as a tailwind for the USD and remained supportive of the strong move.
The USD/JPY pair maintained its strong bid tone heading into the European session and was last seen trading near a five-year high, around the 115.75-80 region.
A combination of supporting factors assisted the USD/JPY pair to gain follow-through traction on Tuesday and build on its recent bullish breakout through the key 115.00 psychological mark. Despite the continuous surge in new COVID-19 cases, investors remain optimistic over signs that the Omicron variant might be less severe than feared and is unlikely to derail the economic recovery. This was evident from the recent strong runup in the equity markets to record highs, which undermined the safe-haven Japanese yen.
Bulls further took cues from the overnight sharp spike in the US Treasury bond yields and a modest US dollar strength. In fact, the yield on the benchmark 10-year US government bond surged to 1.6420% for the first time since November 24 amid expectations for a faster policy tightening by the Fed. The combination of factors acted as a tailwind for the greenback. This was seen as another factor that provided an additional boost to the USD/JPY pair and contributed to the strong move up to the highest level since January 2017.
It will now be interesting to see if bulls are able to capitalize on the momentum or opt to take some profits off the table ahead of this week's key event/data risks. A rather busy week kicks off with the release of ISM Manufacturing PMI and JOLTS Job Openings data later during the early North American session on Tuesday. The Fed is due to release the minutes of its December meeting on Wednesday. Apart from this, investors will take cues from the ADP report on Wednesday and the ISM Services PMI on Thursday. The key focus, however, will remain on the closely watched US monthly jobs report – popularly known as NFP on Friday.
Technical levels to watch
- German Retail Sales arrived at -2.9% YoY in November vs. -3.3% previous.
- Retail Sales in Germany stood at 0.6% MoM in November vs. -0.5% expected.
Germany's Retail Sales rose by 0.6% MoM in November versus -0.5% expected and -0.5% last, the official figures released by Destatis showed on Tuesday.
On an annualized basis, the bloc’s Retail Sales came in at -2.9% in November versus -3.3% booked in October.
FX implications
The euro shrugs off encouraging German Retail Sales data.
At the press time, the major trades at 1.1290, little changed on the day.
About German Retail Sales
The Retail Sales released by the Statistisches Bundesamt Deutschland is a measure of changes in sales of the German retail sector. It shows the performance of the retail sector in the short term. Percent changes reflect the rate of changes of such sales. The changes are widely followed as an indicator of consumer spending. The positive economic growth usually anticipates "Bullish" for the EUR, while a low reading is seen as negative, or bearish, for the EUR.
- EUR/USD drops back below 21-DMA as US Treasury yields hold the advance.
- The pair remains within an ascending triangle formation on the daily chart.
- RSI stays bearish, a test of 1.1260 appears inevitable, with eyes on the US data.
EUR/USD is pressurizing daily lows below 1.1300, as the bears are fighting back control after a brief breather in the Asian trades.
The US Treasury yields remain at higher levels, keeping the dollar underpinned while maintaining the bearish pressure intact on the major.
Rising coronavirus cases globally combined with the hawkish Fed’s expectations continue to keep the sentiment lifted around the yields worldwide.
Traders now await the US ISM Manufacturing PMI for fresh trading impetus, especially after the German Final Markit Manufacturing PMI failed to impress EUR bulls.
Looking at EUR/USD’s daily chart, the price is extending its range within a month-long ascending triangle formation.
Essentially, the pair has been pivoting around the 21-Daily Moving Average (DMA) over the past month, unable to find the recovery momentum above the latter. The 21-DMA now stands at 1.1307.
Daily closing below the latter will expose the rising trendline support at 1.1260. A failure to resist above that level will confirm a triangle breakdown, opening up the downside towards the 2021 lows of 1.1186.
The 14-day Relative Strength Index (RSI) is inching lower below the midline, suggesting that the downside bias remains intact.
EUR/USD: Daily chart
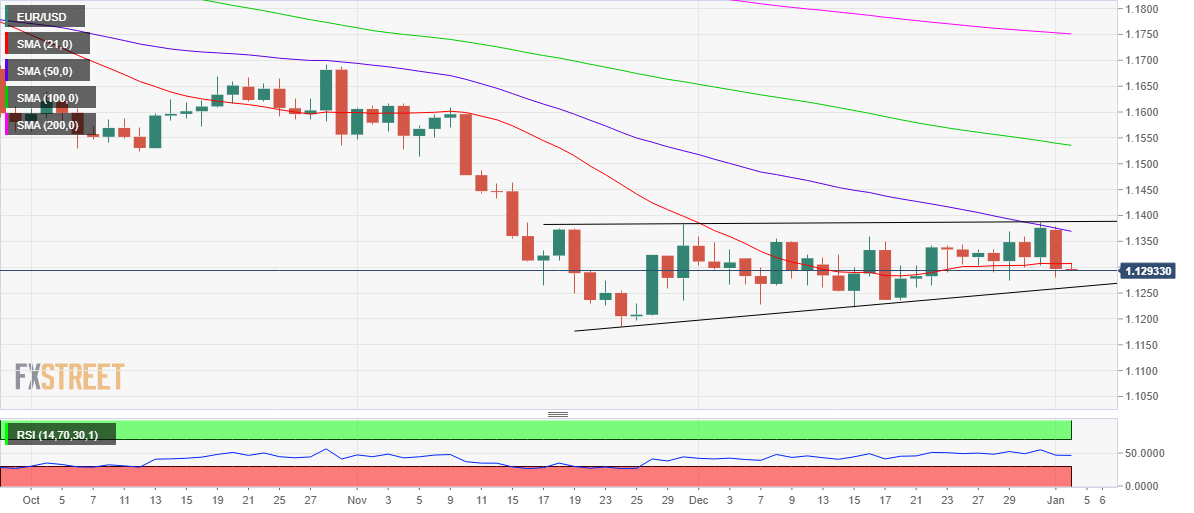
On the flip side, recapturing 21-DMA support-turned-resistance will reinforce the bullish interests.
A fresh advance towards the bearish 50-DMA at 1.1369 will be in the offing should the recovery momentum pick up pace.
The next critical resistance is pegged at the horizontal triangle resistance at 1.1388.
EUR/USD: Additional levels to consider
In light of preliminary readings for natural gas futures markets from CME Group, open interest extended the choppy activity and rose by just 705 contracts at the beginning of the week. On the other hand, volume shrank for the second session in a row, this time by nearly 2.3K contracts.
Natural Gas looks to test the 200-day SMA
Prices of natural gas charted decent gains at the beginning of the year. The move was on the back of rising open interest and leaves the door open to potential extra gains with the next target at the key 200-day SMA, today around the $4.00 mark per MMBtu.
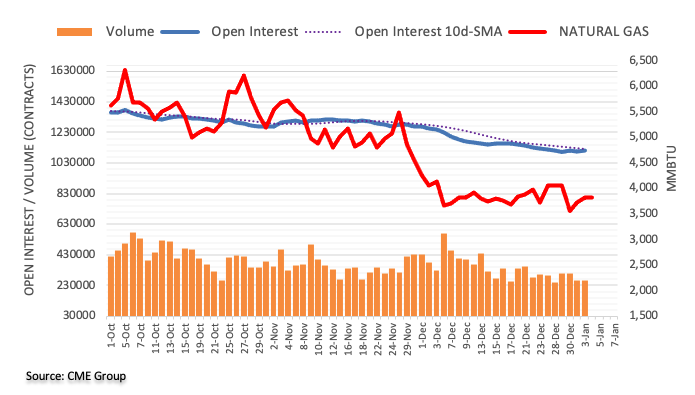
- EUR/JPY retreats from intraday high, consolidates heaviest daily fall in two weeks.
- Sustained U-turn from 50-SMA, firmer RSI keep buyers hopeful.
- Key Fibonacci retracement levels, fortnight-old resistance line test short-term advances.
Having witnessed a dull start of 2022, EUR/JPY regains upside momentum, up 0.35% intraday around 130.80 heading into Tuesday’s European session.
The cross-currency pair dropped the most in two weeks the previous day but couldn’t break the 50-SMA support, around 130.10 by the press time.
The following recovery gains support from the firmer RSI line to direct EUR/JPY buyers towards the 131.00 round-figure before poking 61.8% Fibonacci retracement of October-December downside, near 131.15.
It should be noted, however, that an upward sloping resistance line from December 22, close to 131.45 will challenge the pair’s advances past 131.15.
Meanwhile, a downside break of the 50-SMA level surrounding 130.10, won’t be a green pass for the EUR/JPY bears as the 130.00 psychological magnet and six-week-old horizontal support near 129.65, will act as validation points for the bearish trend.
Following that, the 129.00 and the 128.00 round figures may act as intermediate halts before directing sellers towards December’s low of 127.40.
EUR/JPY: Four-hour chart
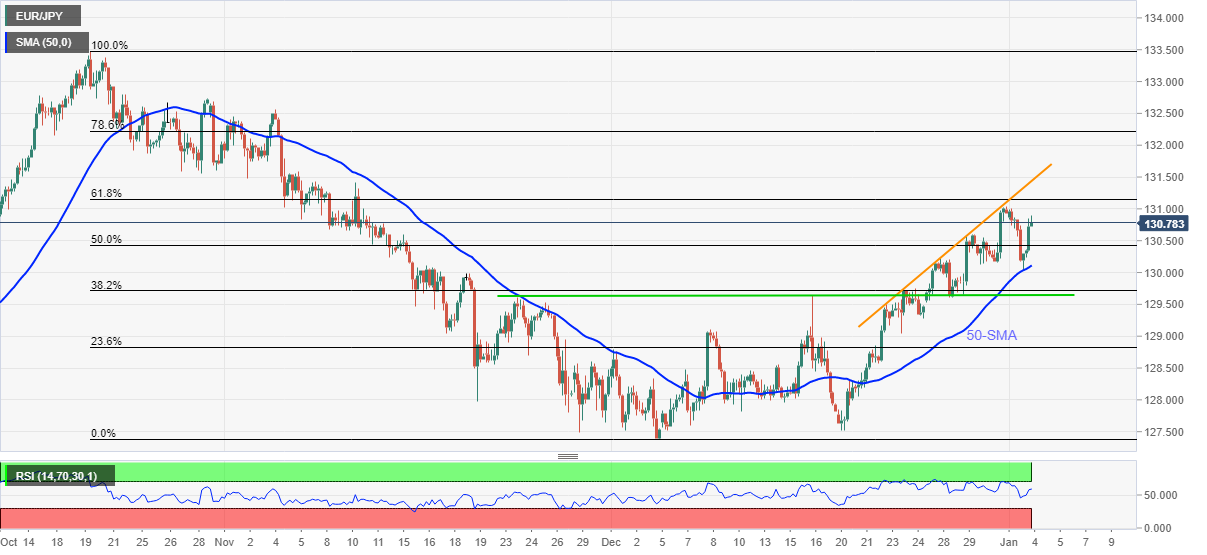
Trend: Further upside expected
NZD/USD is now seen moving within the 0.6740-0.6845 range in the short-term horizon, suggested FX Strategists at UOB Group.
Key Quotes
24-hour view: “We expected NZD to ‘consolidate and trade within a range of 0.6820/0.6860’ yesterday. However, NZD plummeted to 0.6775 before closing on a weak note at 0.6788 (-0.83%). While oversold, strong downward momentum indicates that NZD could weaken further. That said, in view of the oversold conditions, any weakness is likely limited to a test of 0.6770. On the upside, a breach of 0.6815 would indicate that the current weakness has stabilized.”
Next 1-3 weeks: “Yesterday (03 Jan, spot at 0.6845), we highlighted that there is room for NZD to edge higher to 0.6885. We added, a breach of 0.6780 would indicate that the mild upward pressure has eased. We did not expect the subsequent sharp sell-off as NZD breached the ‘strong support’ level (low of 0.6775). Upward pressure has eased and NZD has likely moved into a consolidation phase. From here, NZD could trade within a 0.6740/0.6845 range.”
CME Group’s flash data for crude oil futures markets noted open interest increased by around 19.3K contracts on Monday after two daily drops in a row. In the same line, volume went up by around 189.2K contracts, adding to the previous day’s build.
WTI keeps targeting $80.00
Monday’s uptick in prices of the barrel of the WTI was accompanied by rising open interest and volume, indicative that extra gains appear on the cards in the very near term. Against that, crude oil remains focused on the key barrier at $80.00 per barrel.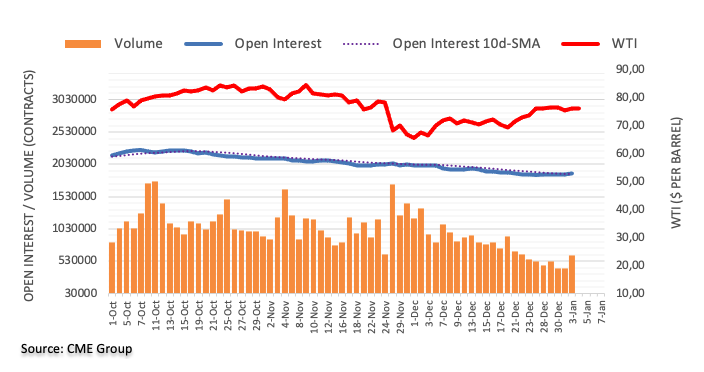
- USD/CAD pares the biggest daily fall in a fortnight, refreshes intraday low at the latest.
- Yields await fresh clues to extend run-up, USD pullback favors oil buyers.
- OPEC+ meeting, US/Canada PMIs for December will be in focus.
After a strong start of 2022, USD/CAD declines 0.20% intraday to 1.2730 while consolidating recent gains ahead of Tuesday’s European session.
The Loonie pair tracked US Treasury yields to the north while rising the most in two weeks. The recent weakness, however, could also be linked to the mildly bid prices of Canada’s main export item, WTI crude oil.
Despite recently easing to $75.95, WTI crude oil prints 0.15% intraday gains, up for the second consecutive day. In doing so, the black gold cheered cautious optimism in the markets ahead of the OPEC+ verdict. In this regard, Reuters said, “OPEC+ is expected to stick to its plans to increase output in February when it meets on Tuesday, seeing a mild and short-lived impact on demand from the Omicron coronavirus variant, three sources from the oil producer group told on Monday.”
Elsewhere, the US Treasury yields remain steady around the highest levels in six weeks, after the biggest daily jump in multiple days. That said, the 10-year bond coupon pokes 1.63% while the 2-year yields seesaw near the highest level since March 2020. Additionally, the US Dollar Index (DXY) struggles to extend the previous day’s gains, the heaviest in two weeks.
While firmer US stock futures and mixed performance of the Asia-Pacific shares could be linked for the market’s latest consolidation, fears of the South African covid variant and faster rate hike by the US Federal Reserve (Fed) keep favoring the USD/CAD buyers.
Even so, Canadian Markit Manufacturing PMI for December and the US ISM Manufacturing PMI for the said month, expected 57.5 and 60.2 versus 57.2 and 61.1 in that order, will be important to the USD/CAD traders.
Furthermore, updates from the OPEC+, virus news and US Treasury yields are also important to forecast short-term USD/CAD performance.
Technical analysis
Unless crossing a two-week-old resistance line, near 1.2765 by the press time, USD/CAD stays directed towards the 100-DMA level of 1.2630. That said, bearish MACD signals and a steady RSI line keep sellers hopeful.
In opinion of FX Strategists at UOB Group, GBP/USD is now expected to navigate between 1.3370 and 1.3560 in the next weeks.
Key Quotes
24-hour view: “We highlighted yesterday that GBP ‘is unlikely to strengthen much further’ and expected it to ‘consolidate and trade between 1.3480 and 1.3550’. The sharp drop to a low of 1.3431 came a surprise. The subsequent rapid rebound from the low amidst oversold conditions indicates that GBP is unlikely to weaken further. For today, GBP is more likely to trade sideways between 1.3440 and 1.3520.”
Next 1-3 weeks: “We noted yesterday (03 Jan, spot at 1.3525) that the recent sharp rise appears to be overdone but there is room for GBP to advance further. We added, a breach of the ‘strong support’ at 1.3430 would indicate that the upward pressure has eased. During NY hours, GBP dropped sharply to within one pip of our ‘strong support’ (low of 1.3431). While the ‘strong support’ is not breached, upward pressure has more or less dissipated. The current movement is viewed as part of a consolidation phase and GBP is likely to trade between 1.3370 and 1.3560 for now.”
Traders scaled back their open interest positions in gold futures markets by nearly 2.5K contracts on Monday, considering advanced figures from CME Group. Volume, instead, reversed two consecutive daily retracements and went up by almost 65K contracts.
Gold looks supported around $1,800
Gold prices started the new year well on the defensive. The marked pullback, however, was against the backdrop of shrinking open interest, indicative that a deeper drop is not favoured at least in the very near term. That said, the key $1,800 mark per ounce troy continues to stand at quite a decent support for the time being.
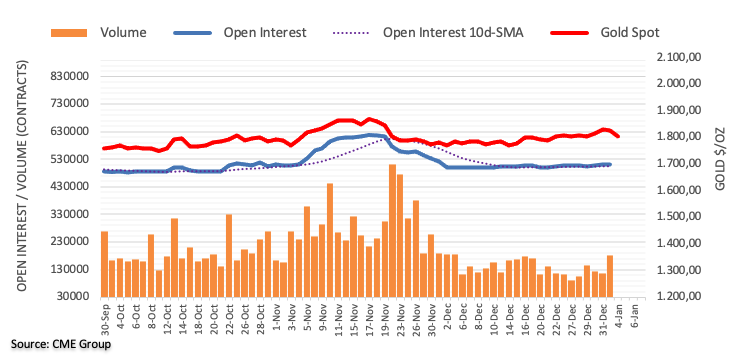
- Platinum struggles to overcome the biggest daily losses in a month.
- Steady RSI, sustained trading below key SMAs keep sellers hopeful.
Platinum (XPT/USD) holds lower grounds near $960 heading into Tuesday’s European session.
The precious metal dropped the most in a month the previous day amid failures to the 50-DMA. Also keeping the XPT/USD bears was the steady RSI line and successful trading below the 100-DMA.
That said, the 21-DMA level near $954 precedes 23.6% Fibonacci retracement of November-December downside, around $947, to restrict short-term declines of the metal.
During the commodity’s weakness past $947, $926 and the yearly low of $898 will be crucial to watch.
On the contrary, recovery moves may initially aim for the 50-DMA level surrounding $980, a break of which will direct XPT/USD bulls towards the 100-DMA, around $992 by the press time.
In a case where platinum prices rally past $992, 50% and 61.8% Fibo. levels, respectively around $1001 and $1,026, will lure the commodity buyers.
Platinum: Daily chart
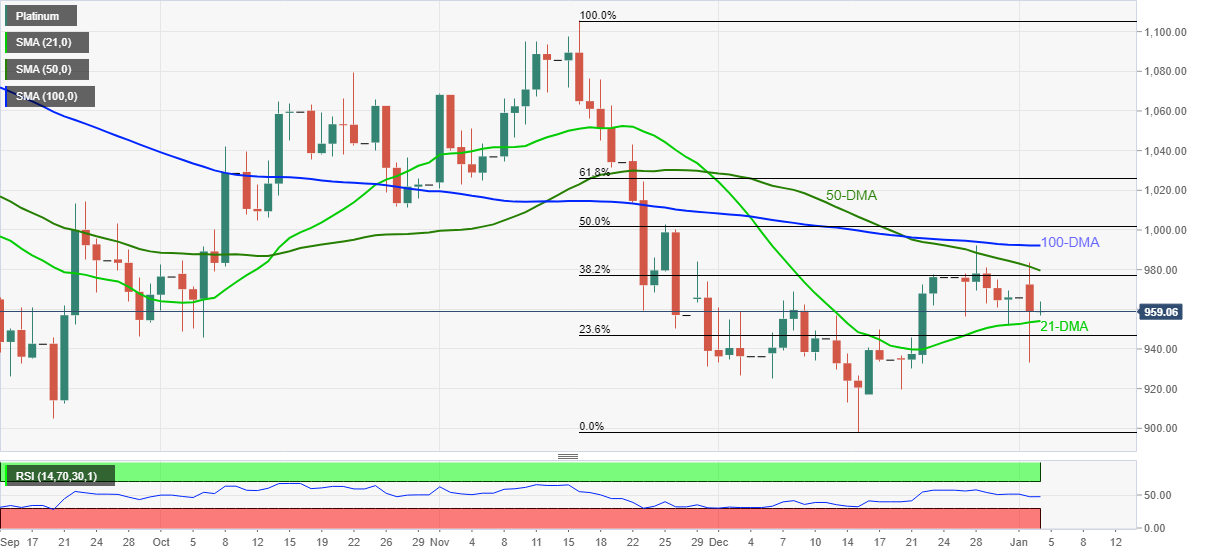
Trend: Further weakness expected
According to FX Strategists at UOB Group, EUR/USD could now trade within the 1.1240-1.1395 range in the next weeks.
Key Quotes
24-hour view: “Yesterday, we held the view that ‘there is room for EUR to advance to 1.1390 before the current upward pressure should ease’. EUR subsequently rose to 1.1379 before falling sharply to 1.1278 NY hours. The rapid drop appears to be overdone and EUR is unlikely to weaken much further. For today, EUR is more likely to consolidate and trade between 1.1275 and 1.1345.”
Next 1-3 weeks: “Our view from yesterday (03 Jan, spot at 1.1370) where EUR is likely to trade with an upward bias towards 1.1415 was proven wrong quickly as it dropped below of ‘strong support’ level of 1.1310 (low of 1.1278). While downward momentum has improved a tad, the outlook for EUR is unclear for now. From here, EUR could trade between 1.1240 and 1.1395.”
Japanese Prime Minister Fumio Kishida said on Tuesday, his government will compile a five-year plan to promote start-ups in Japan.
Additional quotes
“Decided not to make any overseas travel before start of parliament session later this month to focus on covid response.”
“Will strive to do as many face-to-face meetings with overseas leaders as possible this year.”
“Authorities must guard against the risk of domestic omicron infections.”
“Will review border restrictions next week.”
Market reaction
USD/JPY is trading near five-week highs of 115.78, adding 0.40% on the day.
- USD/JPY Price Analysis: Extends the rally to five-year highs, closes in on 116.00
- GBP/USD stays pressured for the second consecutive day, fades bounce off intraday low.
- UK ports fear unfair Brexit advantage, Stormont collapse looms.
- UK PM Johnson fears considerable pressure on medical system as cases jump, US infections also jump.
- Final readings of UK Manufacturing PMI, Yields may entertain traders ahead of US ISM Manufacturing PMI.
GBP/USD remains on the back foot around 1.3473, down 0.07% intraday during the second loss-making day ahead of Tuesday’s London open.
While firmer US Treasury yields dragged the Cable pair from a two-month-high the previous day, the coronavirus fears in the UK and Brexit woes exert additional downside pressure on the pair. That said, the market’s indecision ahead of the second-tier data from Britain and the US seems to challenge the GBP/USD downside of late.
The US Treasury yields jumped to the six-week top for 30-year, 20-year, 10-year and 5-year notes on Monday as fears concerning the South African covid variant joined firmer expectations of the US Federal Reserve’s (Fed) faster rate hike in 2022.
With a sustained jump in the coronavirus cases at home, recently rose by around 158,000 infections, UK Prime Minister (PM) Boris Johnson warned that the National Health Services (NFS) will be under substantial strain in the upcoming weeks. On the other hand, Reuters’ tally mentioned, “COVID worries have been front and center once again for investors since the start of the holiday season. The number of new COVID-19 cases has doubled in the last seven days to an average of 418,000 a day, mostly attributed to the highly transmissible but milder Omicron variant,” according to a Reuters tally.
It should be noted that a jump in the money market bets for the Fed’s three rate hikes in 2022 and stronger US inflation expectations also exerted additional downside pressure on the GBP/USD prices. “Money markets have fully priced in a first U.S. rate increase by May, and two more by the end of 2022,” said Reuters. Further, US inflation expectations, as per the 10-Year Breakeven Inflation Rate numbers from the Federal Reserve Bank of St. Louis (FRED), jumped to a fresh high in six weeks to portray further prices pressure ahead, allowing Fed hawks to keep controls.
On a different page, some of the new Brexit rules are active from the 2022 start and hence challenge the movement of goods, which in turn tests the strained supply chain. Also, the Financial Times (FT) said, “Brexit customs checks later this year risk undermining the commercial ‘level playing field’ for UK regional ports, the body representing some of the country’s largest port operators has warned.” Some of the pro-Brexit updates also cheered freedom from foreign takeovers. Even so, the Northern Ireland (NI) issue flashes a grave sign of Brexit progress. In this regard, the Times said, “Boris Johnson has been told it is “inevitable” that Northern Ireland’s fragile power-sharing government will collapse if he fails to solve the dispute with the EU over the implementation of the border protocol.”
Moving on, the final reading of the UK Manufacturing PMI for December, expected to confirm 57.6 figure, will precede the US ISM Manufacturing PMI for December, forecast 60.2 versus 61.1 prior figures, to direct short-term GBP/USD moves.
Read: ISM Manufacturing PMI Preview: Low expectations in three figures open door to dollar upswing
Technical analysis
Although the GBP/USD prices grind between the 50-DMA and 100-DMA, the RSI line suggests that the bulls are tired and hence short-term declines toward the 50-DMA level surrounding 1.3400 can’t be ruled out. However, the 38.2% Fibonacci retracement (Fibo.) level of the October-December fall adds strength to the stated support near 1.3400 and challenges the GBP/USD bears.
On the flip side, 50% Fibo. near 1.3500 round figure will restrict short-term upside moves of the GBP/USD prices ahead of the 100-DMA level of 1.3560.
- Gold price remains at the mercy of the Treasury yields’ price action.
- US economic events and coronavirus updates will remain in focus.
- Gold 2022 Outlook: Correlation with US T-bond yields to drive yellow metal.
Will the Fed hike rates in March? Are surging covid cases globally putting pressure on the health infrastructure? These factors will continue to play out in the coming days, impacting the price action in the Treasury yields and gold. Traders will also shift their attention towards the US top-tier economic releases due later in the week, including the ISM PMIs, FOMC minutes and Nonfarm Payrolls, for the next direction in the bright metal.
Read: New year, new hope for gold and silver investors
Gold Price: Key levels to watch
The Technical Confluences Detector shows that the gold price is facing strong resistance around 1,807, which is the convergence of the Fibonacci 23.6% one-day, Fibonacci 61.8% one-week and SMA50 one-day.
The next significant barrier is seen at $1,811, the confluence of the Fibonacci 38.2% one-day, SMA5 one-day and Fibonacci 23.6% one-month.
Further up, the Fibonacci 38.2% one-week at $1,814 will challenge the bearish commitments.
On the flip side, bears need acceptance below $1,800, where the SMA200 and SMA100 four-hour meets with the SMA200 one-day.
Sellers will then target the Bollinger Band one-day at $1,797.
Here is how it looks on the tool
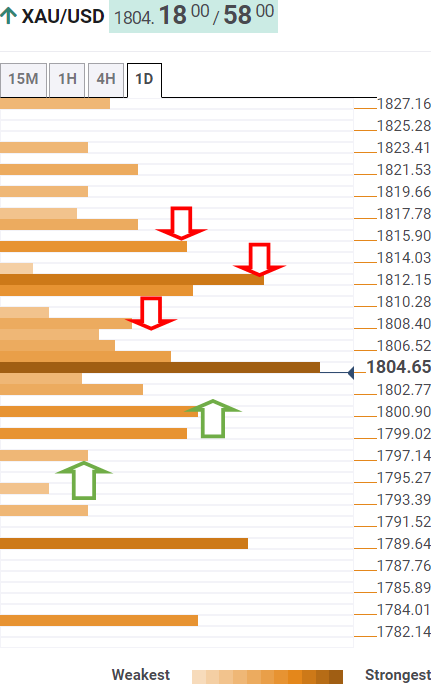
About Technical Confluences Detector
The TCD (Technical Confluences Detector) is a tool to locate and point out those price levels where there is a congestion of indicators, moving averages, Fibonacci levels, Pivot Points, etc. If you are a short-term trader, you will find entry points for counter-trend strategies and hunt a few points at a time. If you are a medium-to-long-term trader, this tool will allow you to know in advance the price levels where a medium-to-long-term trend may stop and rest, where to unwind positions, or where to increase your position size.
- AUD/USD consolidates the biggest daily fall in a month.
- Bearish chart formation, downbeat MACD line keep sellers hopeful.
- Key moving averages challenge buyers, bears can aim for losses below 2021 bottom on confirming rising wedge.
AUD/USD retreats from an intraday high near 0.7215 while paring the previous day’s heavy losses ahead of Tuesday’s European session.
In doing so, the quote bounces off, a convergence of the 21-DMA and support line of the stated wedge formation, around 0.7180.
Should the quote breaks 0.7180, theory suggests AUD/USD prices mark a 300-pip slump. However, 0.7090 and 2021 bottom surrounding the 0.7000 psychological magnet may offer intermediate halts during the fall.
Alternatively, 50-DMA and the upper line of the stated wedge, close to 0.7255 and 0.7280, restrict short-term recovery moves of the AUD/USD. Adding to the immediate upside hurdle is the 100-DMA level surrounding 0.7290.
In a case where the quote rises past 0.7290, the late September’s peak near 0.7320 and the mid-November’s high of 0.7371 will be in focus.
Overall, AUD/USD bears are up for another battle to retake controls but 0.7180 is the key.
AUD/USD: Daily chart
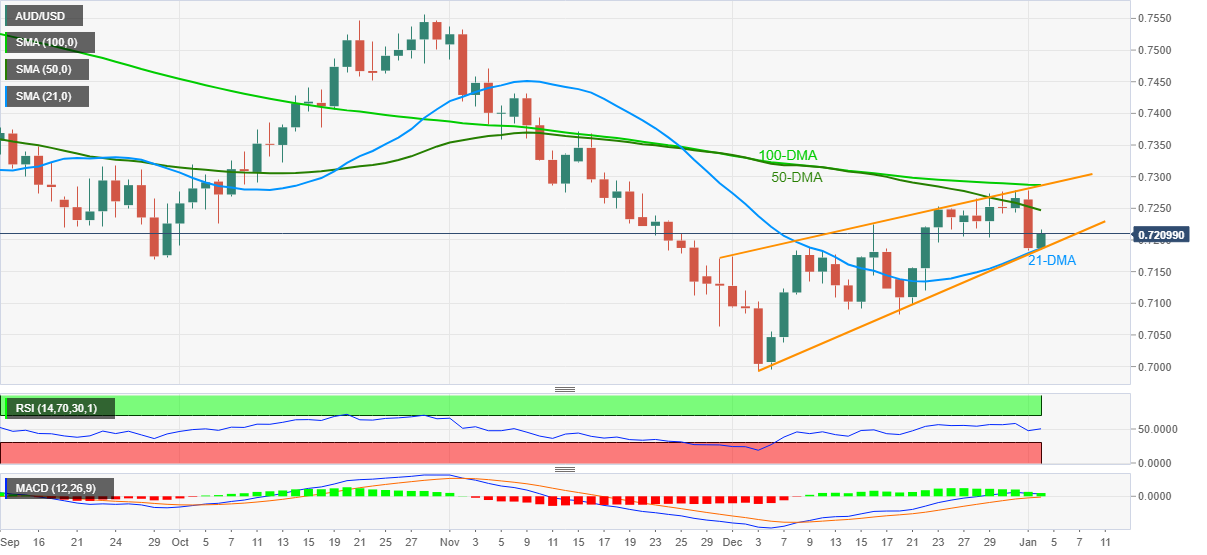
Trend: Bearish
- EUR/USD struggles to rebound after dropping the most in three weeks.
- US Treasury yields stay sidelined around six-week top, German Bund coupons refreshed two-month high.
- Record high covid infections challenge health/economic systems but Fed rate-hike concerns stay on the table.
- Second-tier data may entertain traders ahead of FOMC Minutes, US NFP, risk catalysts are more important.
EUR/USD treads water around 1.1300 heading into Tuesday’s European session, following the heaviest daily fall since December 17. In doing so, the major currency pair tracks steady Treasury yields while waiting for second-tier data from Germany and the US.
US Treasury yields, German Bund coupons and the Wall Street benchmark together offered a rosy start to 2022. However, fears concerning the South African covid variant and financial market fears from China propelled the US Treasury yields more, which in turn favored the US Dollar Index (DXY) to gain more than what’s lost on Friday. Also favoring the greenback were the Reuters’ news saying, “Money markets have fully priced in a first U.S. rate increase by May, and two more by the end of 2022.”
It should be noted, though, that the recently sluggish bond markets seem to test the EUR/USD traders ahead of German Retail Sales for November, expected -0.5% MoM versus -0.3% prior, as well as the US ISM Manufacturing PMI for December, forecast 60.2 versus 61.1 prior figure.
Daily covid infections from Spain, France and the US keep refreshing all-time high in recent days. On top of that, the doubling of the virus numbers in the last few days also highlights Omicron's fears even as policymakers try to placate the bears.
Additionally, firmer US inflation expectations, as per the 10-Year Breakeven Inflation Rate numbers from the Federal Reserve Bank of St. Louis (FRED), jumped to a fresh high in six weeks to portray further prices pressure ahead, allowing Fed hawks to keep controls. The same adds strength to the US Treasury yields.
Elsewhere, chatters of relief in tax payment from Germany, in 2023, as well as French aid to companies hit by the pandemic, propel the European yields but fails to recall the EUR/USD buyers.
Above all, ECB v/s Fed story keeps EUR/USD sellers hopeful ahead of this week’s key economics and FOMC minutes. Given the higher odds of the Fed’s rate hike, each of the incoming data becomes important to watch.
Read: ISM Manufacturing PMI Preview: Low expectations in three figures open door to dollar upswing
Technical analysis
Not only the pullback from the 50-DMA level surrounding 1.1370 but a downbeat break of the 21-DMA, at 1.1310 by the press time, also keep EUR/USD sellers hopeful to test an ascending support line from November 24, close to 1.1255 at the latest.
- Silver remains on the back foot after breaking 13-day-old support the previous day.
- U-turn from the key moving averages, receding bullish bias of MACD favor sellers.
- Monthly horizontal support-zone, 78.6% Fibonacci retracement to restrict short-term downside.
Silver (XAG/USD) grinds lower around $22.75, down 0.60% intraday, heading into Tuesday’s European session.
The bright metal reversed from a convergence of the 100-DMA and 50-DMA while breaking an upward sloping trend line the previous day. Adding to bearish bias is the MACD line’s inability to cross the 0.0000 mark, recently down.
Even so, horizontal area from the mid-December and 78.6% Fibonacci retracement of September-November upside, respectively near $22.50 and $22.25, will challenge the short-term XAG/USD downside.
During the silver’s further declines past $22.25, the $22.00 threshold may act as a buffer ahead of September’s low near $21.40.
Meanwhile, the corrective pullback may initially aim for the previous support line, close to $23.00, before heading towards the stated DMA confluence around $23.35.
Even if the XAG/USD bulls cross the $23.35 hurdle, the 50% Fibonacci retracement level of $23.45 will probe the upside momentum.
Silver: Daily chart
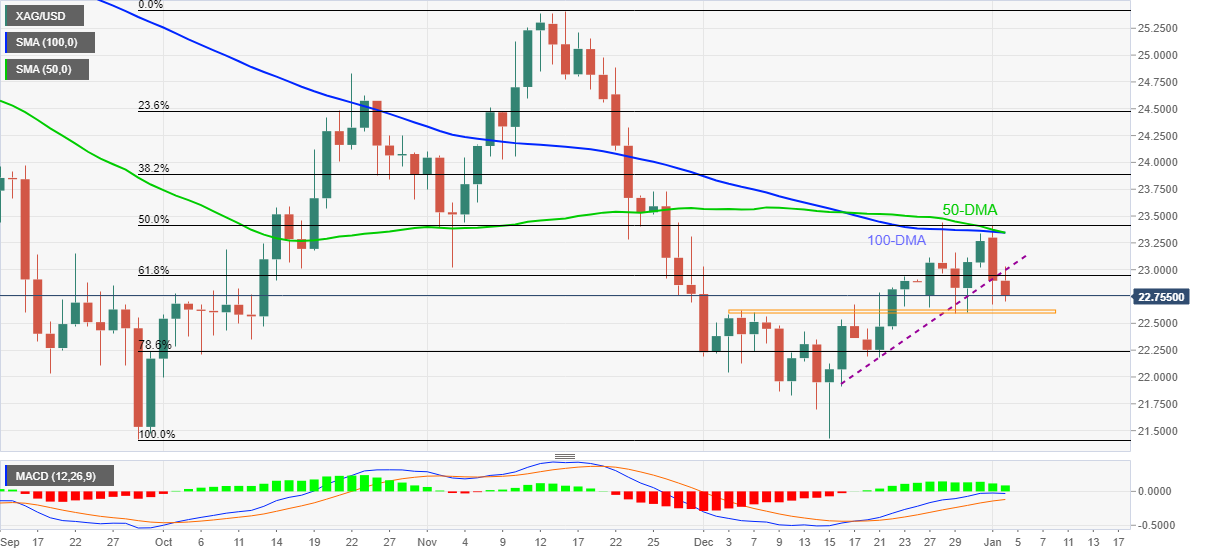
Trend: Further weakness expected
- Asian equities trade mixed as China bucks the uptrend amid full markets.
- Wall Street ignored firmer yields amid stimulus hopes, Omicron, Fed chatters propel bond coupons.
- China Caixin Manufacturing PMI jumped to six-month high in December, Australia PMI rose as well.
- PMIs will decorate the calendar but virus updates, yields shouldn’t be missed as well.
Asian shares fail to cheer full markets even as Japan’s Nikkei 225 and Australia’s ASX 200 kick-start 2022 on a positive side, up more than 1.50% each. The reason could be linked to pessimism surrounding China and firmer Treasury yields. That said, MSCI’s index of Asia-Pacific shares outside Japan drops 0.08% heading into Tuesday’s European session.
Stocks in Japan, New Zealand and Australia tracked firmer Wall Street benchmarks to begin the New Year on a firmer footing. Adding to the bullish bias could be hopes of further monetary easing from the key economies like the US and China.
It should be noted, however, that the worsening virus conditions in Beijing and elsewhere join firmer US Treasury yields to challenge the Asia-Pacific bulls. China’s Zhengzhou announced partial lockdown after record covid cases while Aussie policymakers also raised concerns over the shortage of the rapid testing kits due to a slew of people up for checking after the COVID-19 numbers rallied to an all-time high.
Alternatively, China’s Caixin Manufacturing PMI jumped to a six-month high in December while Australia’s Commonwealth Bank Manufacturing PMI also rose past 57.4 forecast and prior in the last month.
Markets in Indonesia print mild gains but South Korean traders turned cautious amid the latest rise in the covid cases. Further, Hang Seng remains on the back foot amid fears of Evergrande default and hardships for Chinese IT companies at home and abroad. Additionally, India’s BSE Sensex rise 0.30% at the latest amid indecision over the surge in virus cases and cautious optimism in Asia.
That said, DJI 30 and S&P 500 refreshed record top during the first trading day of 2022 while the US Treasury yields rallied to the six-week high the previous day.
Looking forward, US ISM Manufacturing PMI for December, expected 60.2 versus 61.1, will offer immediate direction to the markets. However, major attention will be given to the Fed rate-hike concerns and virus updates for clear direction.
Read: US Treasury yields hover around multi-day top after biggest jump in three months
- USD/INR bulls are stepping in at a critical level of support.
- The 38.2% Fibo could come under pressure in the coming days.
USD/INR has been in a strong downtrend of late as the US dollar falls to climb higher through critical highs scored towards the last trading weeks of the year in 2021. While DXY remains subdued, the emerging market currencies will continue to sigh with relief.
However, the tables could be starting to turn as the US dollar comes up for air at the start of the year. The following illustrates the meanwhile prospects of a bullish correction in USD/INR as a consequence from a daily perspective:
USD/INR daily chart
-637768648451394628.png)
As illustrated above, the price is holding at support near 74.40. The bulls could be encouraged to move in to clean up some of the imbalance of the recent price run, perhaps as far as the 38.2% Fibonacci retracement area near 75.10.
- USD/JPY clears November 2021 highs in a bid to recapture 116.00.
- US Treasury yields consolidate near multi-week highs on Fed rate hike expectations.
- Ascending triangle breakout on the 1D chart calls for more upside.
USD/JPY is sitting at the highest levels since January 2017, fast-approaching the 116.00 mark, as the US dollar sees a renewed buying interest across the board in Asian trading.
The major continues to draw support from the recent strength in the US Treasury yields across the curve, as investors price in a March Fed rate hike while surging Omicron covid cases globally also keep the returns on the market elevated.
It's worth noting that Treasury yields moved higher throughout 2021 amid concerns about the coronavirus pandemic and inflation. The benchmark 10-year rates jumped above 1.60%, rising as much as 13 basis points on the day.
Looking forward, the Fed-driven sentiment and covid updates will continue to have an impact on the yields, in turn, impacting the major. Also, of note remains the US ISM Manufacturing PMI for trading USD/JPY in the day ahead.
USD/JPY’s daily chart shows that the price has stormed through the ascending triangle resistance at 115.55, triggering a fresh advance to 115.81 multi-year highs. A daily closing above that resistance is needed to confirm the triangle breakout, opening doors for a rally towards 116.00.
The next critical upside target is seen at the 116.50 psychological level.
USD/JPY: Daily chart
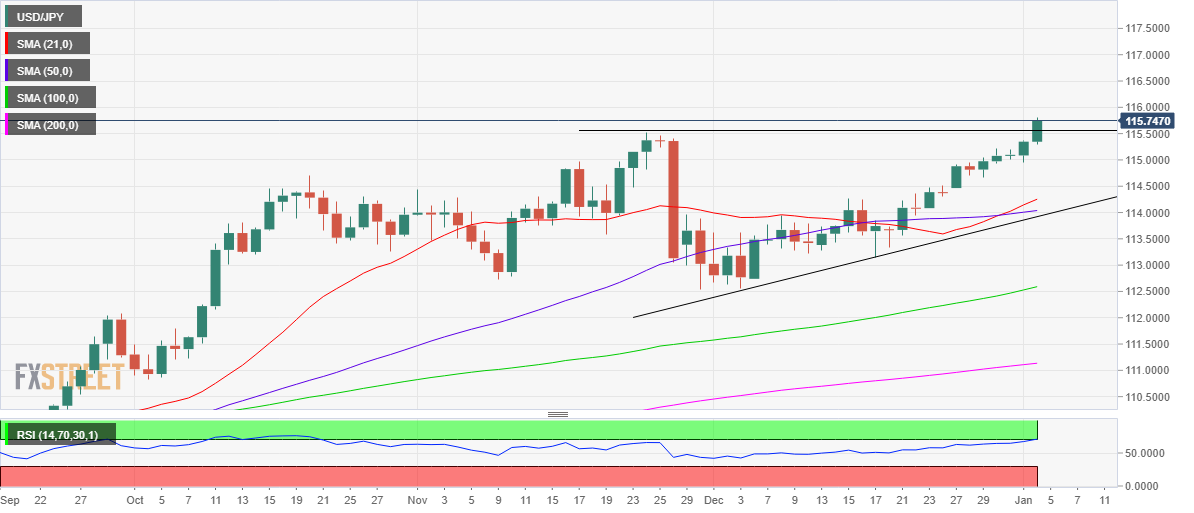
The 14-day Relative Strength Index (RSI), however, peeps into the overbought region, warranting caution for bulls.
Any retracement will challenge the daily lows of 115.29 before taking on the 115.00 support area. Monday’s low of 114.95 will be next on the sellers’ radars.
USD/JPY: Additional levels to consider
- GBP/JPY reverses previous day’s losses, bounces off three-week-old support line.
- Weekly ascending channel, 78.6% Fibonacci retracement guards immediate upside.
- Bearish need cautious until witnessing clear downside break of 200-SMA.
- Firmer RSI, sustained trading above key SMA favor bulls.
GBP/JPY rises 0.25% intraday around 155.86, grinding higher at the two-month top during Tuesday’s European morning.
The cross-currency pair snapped a three-day uptrend the previous before bouncing off an ascending support line from December 16. The recovery moves also take clues from firmer RSI, not overbought.
It should be noted, however, that the quote still holds the previous downside break of a one-week-long ascending trend channel, which triggered Monday’s declines.
Hence, a clear upside break of the stated channel’s resistance line, around 156.00 by the press time, becomes necessary for the GBP/JPY buyers to keep reins.
Following that, 78.6% Fibonacci retracement (Fibo.) level of October-December 2021 downside, near 156.25, may offer an intermediate halt during the quote’s rally towards the last year's top of 158.22.
Alternatively, the stated support line, previous resistance, can challenge the intraday GBP/JPY sellers around 155.00. Also adding to the downside filter is the 61.8% Fibo. level near 154.70.
In a case where GBP/JPY drops below 154.70, the early November’s swing low near 152.40 may act as an intermediate halt before directing bears to the 200-SMA level of 152.10.
GBP/JPY: Four-hour chart
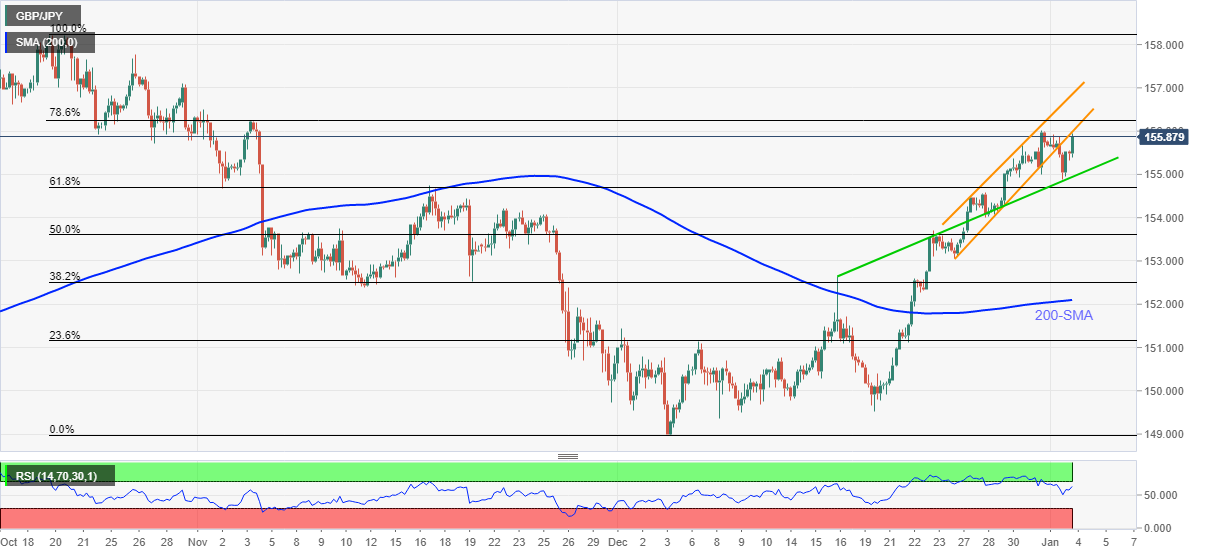
Trend: Bullish
- EUR/GBP bulls are stepping in to guard against a break of weekly lows.
- Brexit and the coronavirus are risks for the pound for the days ahead.
- EZ inflation readings will be the key event for the euro this week.
EUR/GBP is firming at the lows of a weekly bear trend near 0.8380 and is steady within a narrow range in Asia between 0.8377 and 0.8390 so far. The price will be determined on the back of the divergences between sentiment for the European Central bank and the Bank of England while Brexit politics will be thrown into the mix as well.
Bank of England tightening expectations have fallen back a bit due to the coronavirus spread, domestic politics and Brexit as being a toxic cocktail and a major risk to growth prospects. Firstly, Brexit will come roaring back into the headlines this week.
A senior French official said that “At the start of January, January 4 to be precise, we will have meetings with the EU commissioners to define the process and the measures that need to be taken. Between January 4 and January 6, there are very important meetings to begin the legal process against the UK.”
The pound will also be vulnerable to the prospects of tighter restrictions depending on the spread of the coronavirus. So far, however, the plans are unchanged but voluntary social distancing is already happening and hospitals and under pressure.
The BBC reports that ''Prime Minister Boris Johnson said it would be "folly" to think the pandemic was over and pressure on hospitals would be "considerable" over the coming weeks. Speaking during a visit to a vaccination centre in Aylesbury, he said the "mixture of things we're doing at the moment" were the correct measures.
Brexit woes in vouge
A more prevalent threat to the pound at the month is UK and European politics. ''The UK will trail other developed countries in its economic recovery from the pandemic in 2022, with economists polled for a Financial Times survey predicting that it will be held back by political uncertainty and the lingering after-effects of Brexit,'' the FT reported. The article states that Brexit was damaging trade and exacerbating supply bottlenecks, and political uncertainty looked increasingly likely to deter investment.
'' 'A combination of a ragged edge over Brexit and political uncertainty will continue to hamper what might otherwise have been a strong recovery,' said Jagjit Chadha, director of the National Institute of Economic and Social Research. 'Recoveries are driven by optimism about the future . . . Brexit will impose chronic pessimism about the future of the UK economy,' said Paul de Grauwe, professor at the London School of Economics.''
EZ inflation data slated
Meanwhile, from the calendar this week, eurozone inflation will be the theme. ''Like in Germany, both energy prices and re-weighting issues are likely to weigh on December's inflation figures,'' analysts at TD Securities explained.
''We think underlying core price momentum is a bit stronger than the consensus, though, yielding a stronger core inflation figure. For headline inflation, we expect a bigger drag from energy prices than the consensus.''
EUR/GBP technical analysis
The hourly chart shows that the price is correcting from weekly lows. Should the bears engage, however, a fresh low could be printed imminently. However, the bias remains to the upside in a phase of consolidation for the foreseeable days ahead until the lows are broken:

Citigroup’s Global Head of Commodities Strategy Ed Morse expressed his take on the outlook for Brent oil in 2022.
Key quotes
“I think we're moving from a period that's been over a year in which we've had inventories drawing down not enough supply to meet demand to a period in which we're going to see, starting no later than the second quarter we believe, inventory is starting to grow around the world in an accelerated basis.”
“So, we think this is going to be a year where prices are going to go down rather than up.”
“And we're looking at Brent going from an average of over $75 a barrel this past quarter to maybe $10 or $12 or $15 lower than that by the fourth quarter of this current year.”
- US 10-year Treasury yields seesaw near six-week high, 2-year coupon clings to March 2020 high.
- Omicron fears, Fed rate-hike concerns propel yields ahead of the key US data flow.
- US ISM Manufacturing PMI to decorate daily calendar, FOMC Minutes, jobs report are crucial for the week.
US Treasury bond coupons stabilize around multi-day top during early Tuesday, after the previous day’s stellar run-up. The reason could be linked to an absence of major data/events, as well as cautious sentiment ahead of the US ISM Manufacturing PMI. However, fears relating to the South African covid variant and Fed’s rate-hike keep bond bears hopeful.
That said, the US 10-year Treasury yields take rounds to 1.625-630% of late, after rising to 1.64% the previous day. Further, the two-year bond yields ease to 0.776% versus the latest peak of 0.802%, also the highest level since March 2020. It’s worth noting that the US Treasury yields jumped to the six-week top for 30-year, 20-year, 10-year and 5-year notes on Monday.
Although the bond yields remain firmer, US equities remained firmer amid hopes of stimulus. Even so, S&P 500 Futures and Asia-Pacific shares trade mixed by the press time.
Growing fears of the coronavirus, backed by record-high infections, joined escalating US inflation expectations to underpin the previous run-up of the US Treasury yields. The latest pullback, however, may have a little fundamental backup. Even so, firmer China Caixin Manufacturing PMI and hopes of further stimulus from the US, Beijing and Europe could be spotted as responsible for the latest corrective move.
Reuters tally suggested the doubling of the covid cases at the latest, which in turn poured cold water on the face of the previous studies that suggested Omicron as less severe than the earlier variants of the COVID-19. The jump in infections strain national medical systems in the key economies and hint at another round of pandemic that could weigh on economics.
Additionally, the US inflation expectations, as per the 10-Year Breakeven Inflation Rate numbers from the Federal Reserve Bank of St. Louis (FRED), jumped to a fresh high in six weeks to portray further prices pressure ahead, allowing Fed hawks to keep controls.
Looking forward, the US ISM Manufacturing PMI for December, expected 60.2 versus 61.1, will offer immediate direction to the markets. However, major attention will be given to the Fed rate-hike concerns and virus updates for clear direction.
Bank of Japan (BOJ) Governor Haruhiko Kuroda said on Tuesday that the central bank “will guide policy appropriately with a close eye on domestic, overseas economic developments.”
Additional quotes
“Expect the global economy to recover driven by advanced economies.”
“Uncertainty over global economic outlook heightening due to inflation in Europe, US as well as rising omicron cases.”
The Bank of Korea (BOK) Governor Lee Ju-yeol warns against growing credit risk from heavily indebted households and self-employed, as the country will continue to tighten monetary policy.
Key quotes
"First and foremost, efforts should be made for thorough risks management.”
"There is the possibility of growing credit risk mainly among some households and self-employed with excessive leverage and facing a slowdown in business in the process of normalizing loose financial measures."
"With external uncertainty very high, in particular, such internal vulnerable factors could develop into a weak ring in the financial system, which warrants heightened monitoring to brace for potential danger."
- USD/CAD bears are lurking below the counter trendlines on the weekly and daily charts.
- Bears will look for a restest of the weekly trendline support near 1.2520.
USD/CAD has been testing the downside although has recently recovered. However, the weekly chart is seeing the price run into the M-formation's neckline. This could be expected to act as resistance, considering the break of the trendline support.
USD/CAD weekly chart
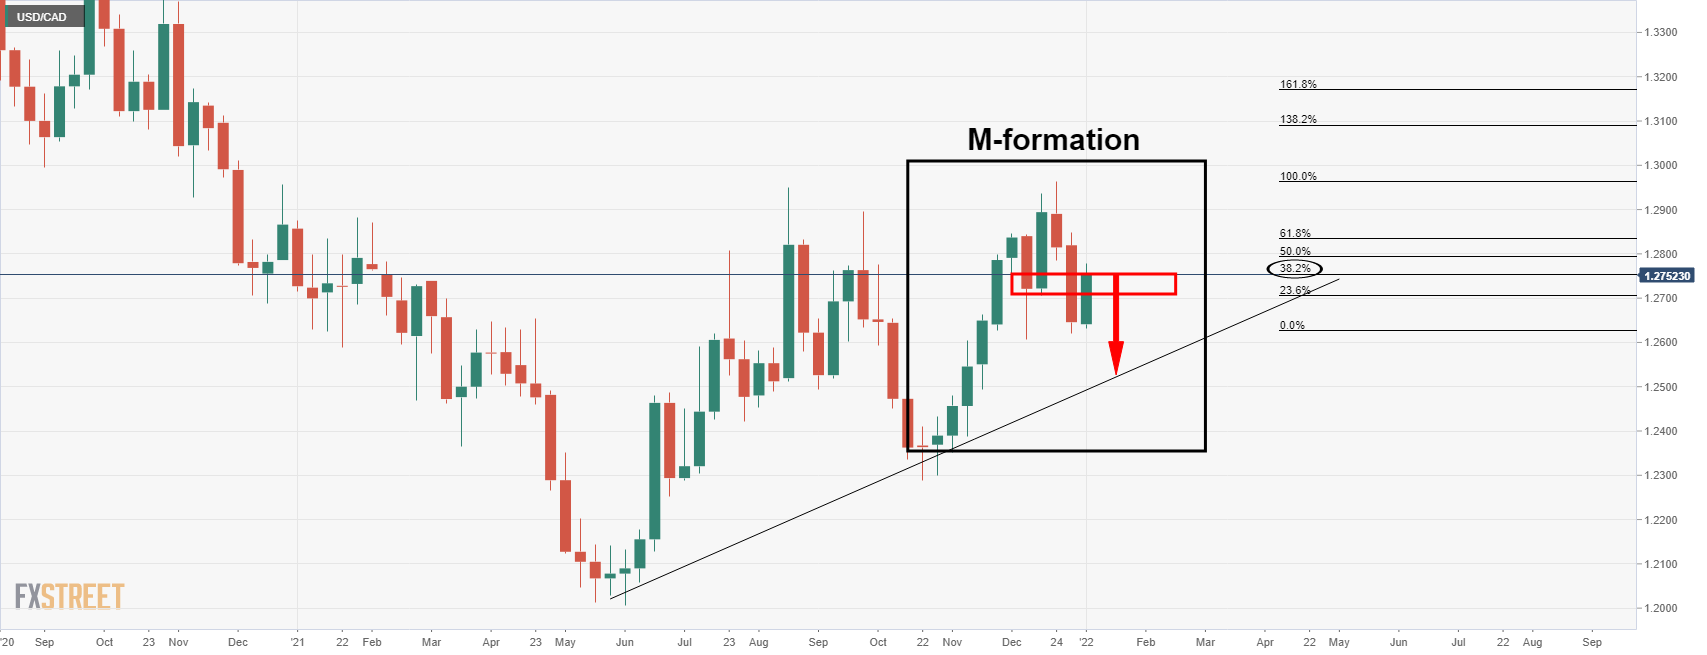
There is also a confluence of Fibonacci levels on both the weekly and daily charts in this area. A restest of the trendline near 1.2520 could be on the cards for the weeks ahead.
USD/CAD daily chart
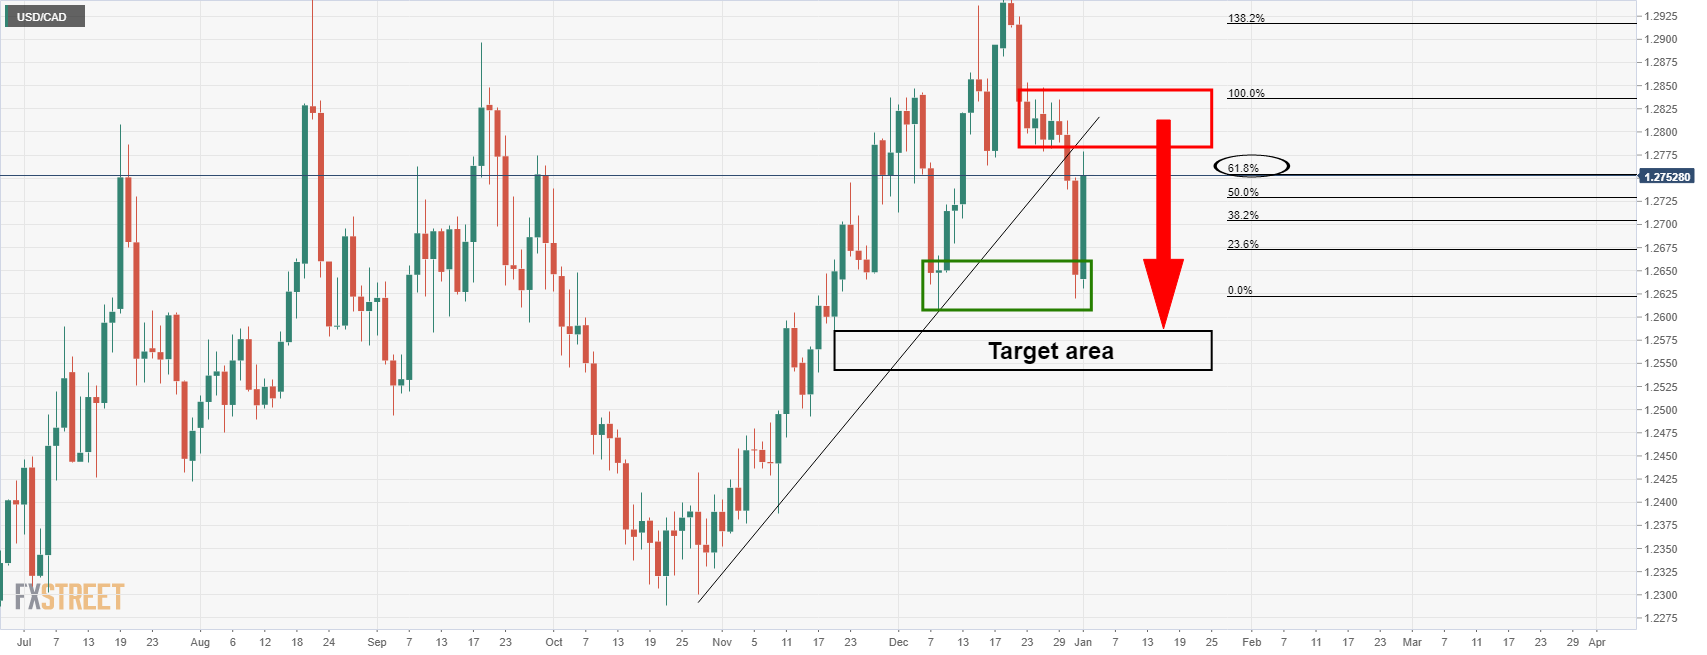
The nearer-term target area is based on an imbalance of price between 1.2585 and 1.2540. The 61.8% Fibonacci is also a compelling area of resistance on the daily chart.
USD/CAD H4 chart
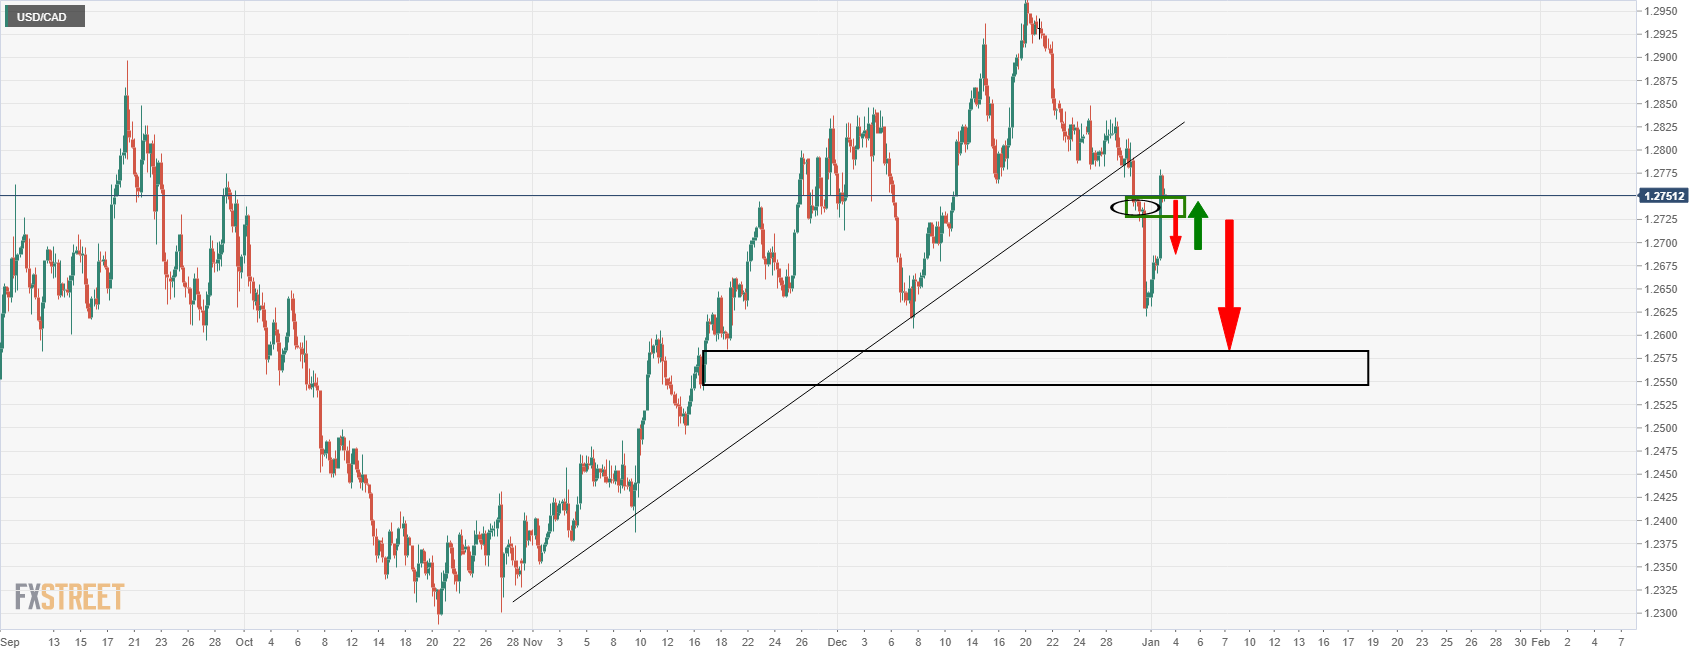
As illustrated, there is a wall of support at this juncture. The bears would be prudent to wait for a bearish confirmation on a break of this 4-hour structure prior to engaging to target towards the 1.2540/85.
Analysts at Standard Chartered believe that China’s Q4 2021 GDP is likely to have expanded to 3.6%.
Key quotes
“Growth may have accelerated sequentially in Q4, despite expected fall in y/y growth due to a high base.”
“We expect GDP growth to have slowed further to 3.6% y/y in Q4 from 4.9% in Q3 due to a high base.”
“Exports likely remained resilient; retail sales growth may have edged up on NEV sales boost.”
“CPI inflation may have moderated on falling vegetable prices; PPI inflation likely eased further.”
“Money and TSF growth likely accelerated, benefiting from the RRR cut and government bond issuance.”
- AUD/USD seesaws around intraday high, pares biggest daily loss in a month.
- China Caixin Manufacturing PMI rose past market forecasts in December.
- Risk appetite stays weaker as virus woes, Fed rate-hike concerns keep US bond yields firmer.
- Aussie virus infections refresh record top, fears of supply crunch of testing kits loom.
AUD/USD takes rounds to 0.7200, easing from intraday high, following China’s Caixin Manufacturing PMI release on early Tuesday.
The Aussie pair dropped the most in four weeks the previous day as yields propelled the US dollar. The recent corrective pullback, however, remains doubtful as bond coupons refrain from stepping back amid fears of the South African covid variant, namely Omicron.
That said, China’s Caixin Manufacturing PMI crossed 50.0 market consensus and 49.9 prior levels to print 50.9 level in December.
In addition to the strong activity numbers from the major customer, signals for further easy money policies from the People’s Bank of China (PBOC) favored by Bloomberg’s analysis as well as the latest jump in the covid numbers, also favor AUD/USD prices.
However, the worsening virus conditions at home and abroad join firmer hopes of the faster Fed rate lifts in 2022 to propel the US T-bond yields and weigh on the quote.
It’s worth noting that Australia’s national count of daily covid infections crossed 40K during the latest run-up to refresh record tops while conditions in the US aren’t any better. “COVID worries have been front and center once again for investors since the start of the holiday season. The number of new COVID-19 cases has doubled in the last seven days to an average of 418,000 a day, mostly attributed to the highly transmissible but milder Omicron variant,” according to a Reuters tally.
In addition to the virus woes, fears of a labor shortage also test AUD/USD bulls. As per the latest updates from the National Australia Bank’s (NAB) survey of 1600 business houses, “About four in 10 businesses are suffering ‘very significant’ impacts from labor shortages."
Elsewhere, the US inflation expectations, as per the 10-Year Breakeven Inflation Rate numbers from the Federal Reserve Bank of St. Louis (FRED), jumped to a fresh high in six weeks to portray further prices pressure ahead, allowing Fed hawks to keep controls.
Against this backdrop, the US 10-year Treasury yields stay firmer around a six-week high while the US stock futures remain directionless. Further, stocks in Asia-Pacific trade mixed even as the Wall Street benchmarks rose the previous day.
Moving on, today’s US ISM Manufacturing PMI for December, expected 60.2 versus 61.1, will offer immediate direction to the AUD/USD prices. However, major attention will be given to the Fed rate-hike concerns and virus updates for clear direction.
Technical analysis
AUD/USD fades bounce off 0.7180 key support confluence, including the 21-DMA and support line of the short-term rising wedge formation. Should the quote breaks 0.7180, theory suggests AUD/USD prices mark a 300-pip slump. However, 0.7090 and 2021 bottom surrounding the 0.7000 psychological magnet may offer intermediate halts during the fall.
Alternatively, 50-DMA and the upper line of the stated wedge, close to 0.7255 and 0.7280, restrict short-term recovery moves of the AUD/USD.
China's December Caixin manufacturing PMI came in at 50.9 vs. 50.0 expected and November’s 49.9, showing that the country’s production increases at the quickest rate for a year.
China's official manufacturing PMI on Friday expanded to 50.3 in December from 50.1 booked in November and against 50.1 expected, the National Bureau of Statistics (NBS) reported.
Comments from Dr. Wang Zhe, Senior Economist at Caixin Insight Group
“The index returned to expansionary territory and reached the highest level since June.”
“Supply was strong and demand rebounded. With the easing of supply constraints, output expanded for the second month in a row and at a faster pace.”
“Total new orders increased, the third expansion over the past four months, as the impact of scattered Covid-19 flare-ups was under control. Overseas demand remained sluggish because of the pandemic’s impact in foreign countries and rising logistics costs due to a shortage of containers. The gauge for new export orders stayed in contractionary territory for the fifth consecutive month.”
Market reaction
AUD/USD keeps its recovery mode intact above 0.7200 on the upbeat Chinese Caixin PMI data, trading at 7203, as of writing. The spot is up 0.15% on the day.
- US Dollar Index pares biggest daily jump in two weeks.
- Confirmation of bullish chart pattern, firmer MACD signals favor buyers
- 200-SMA, six-week-old resistance line guard immediate upside.
- Horizontal area from November 18 adds to the downside filter.
US Dollar Index (DXY) seesaws around 96.17, down 0.05% intraday during early Tuesday after rising the most in two weeks the previous day.
The greenback gauge’s heavy run-up on Monday crossed a two-week-old resistance line, which in turn confirmed a falling wedge bullish chart pattern. Adding to the upside bias are the bullish MACD signals.
However, a convergence of the 200-SMA and 23.6% Fibonacci retracement (Fibo.) of November’s upside, near 96.20, restricts the quote’s immediate upside.
Following that a descending resistance line from November 24, close to 96.55, will be the key for DXY bulls to watch.
Meanwhile, pullback moves may aim for the previous resistance line, part of the wedge, near 96.00, a break of which will direct the bears towards 38.2% Fibo. level close to 95.77.
It should be noted, however, that a horizontal area surrounding 95.50-55, comprising the wedge’s support line and multiple lows marked since late November, appears a tough nut to crack for the US Dollar Index bears.
DXY: Four-hour chart
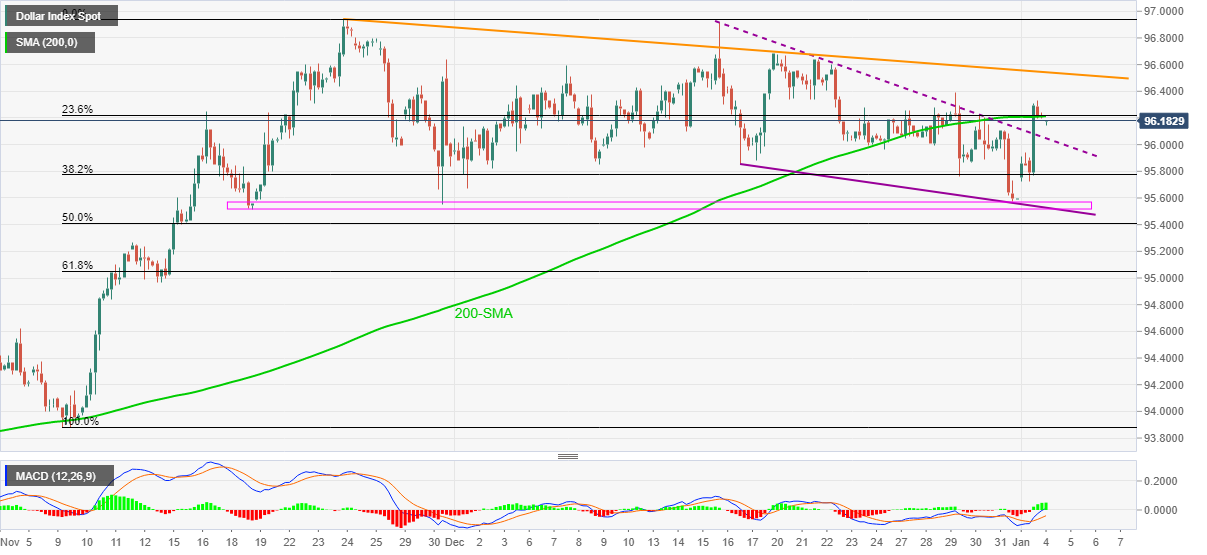
Trend: Further upside expected
| Time | Country | Event | Period | Previous value | Forecast |
|---|---|---|---|---|---|
| 00:30 (GMT) | Australia | ANZ Job Advertisements (MoM) | December | 7.4% | |
| 00:30 (GMT) | Japan | Manufacturing PMI | December | 54.5 | |
| 01:45 (GMT) | China | Markit/Caixin Manufacturing PMI | December | 49.9 | 50 |
| 07:00 (GMT) | Germany | Retail sales, real adjusted | November | -0.3% | -0.5% |
| 07:00 (GMT) | Germany | Retail sales, real unadjusted, y/y | November | -2.9% | -4.9% |
| 07:30 (GMT) | Switzerland | Consumer Price Index (MoM) | December | 0.0% | -0.1% |
| 07:30 (GMT) | Switzerland | Consumer Price Index (YoY) | December | 1.5% | 1.6% |
| 07:45 (GMT) | France | CPI, m/m | December | 0.4% | 0.3% |
| 07:45 (GMT) | France | CPI, y/y | December | 2.8% | 2.9% |
| 08:55 (GMT) | Germany | Unemployment Change | December | -34 | -15 |
| 08:55 (GMT) | Germany | Unemployment Rate s.a. | December | 5.3% | 5.3% |
| 09:30 (GMT) | United Kingdom | Net Lending to Individuals, bln | November | 2.31 | |
| 09:30 (GMT) | United Kingdom | Purchasing Manager Index Manufacturing | December | 58.1 | 57.6 |
| 09:30 (GMT) | United Kingdom | Consumer credit, mln | November | 0.7 | 0.8 |
| 09:30 (GMT) | United Kingdom | Mortgage Approvals | November | 67.199 | 65.4 |
| 13:30 (GMT) | Canada | Industrial Product Price Index, m/m | November | 1.3% | 0.8% |
| 13:30 (GMT) | Canada | Industrial Product Price Index, y/y | November | 16.7% | |
| 15:00 (GMT) | U.S. | ISM Manufacturing | December | 61.1 | 60.1 |
| 15:00 (GMT) | U.S. | JOLTs Job Openings | November | 11 |
- USD/CHF takes offers to refresh intraday low, pares heaviest jump since December 06.
- US 10-year Treasury yields remain steady around multi-day tops after rising the most in three months.
- Virus woes, Fed rate-hike concerns propel yields, US dollar.
- Swiss CPI, US ISM Manufacturing PMI decorate calendar.
USD/CHF refreshes intraday low to 0.9173 while paring the previous day’s heavy run-up during Tuesday’s Asian session. The Swiss currency (CHF) tracks steady yields and a lack of major catalysts to print mild losses, down 0.15% on a day.
That said, the quote rallied the most in nearly a month the previous day as the US dollar tracked firmer Treasury yields to print notable gains the previous day.
That said, the US Dollar Index (DXY) jumped the most in three weeks on Monday after the US Treasury yields jumped to the six-week top for 30-year, 20-year, 10-year and 5-year notes.
Speedy spread of the coronavirus and a jump in the cases linked to the South African covid variant, namely Omicron, provide a first push to the US bond yields. On the same line were the rising hopes of faster Fed rate hikes in 2022. Both these catalysts weigh bond prices and fuel yields.
“COVID worries have been front and center once again for investors since the start of the holiday season. The number of new COVID-19 cases has doubled in the last seven days to an average of 418,000 a day, mostly attributed to the highly transmissible but milder Omicron variant,” according to a Reuters tally.
The US inflation expectations, as per the 10-Year Breakeven Inflation Rate numbers from the Federal Reserve Bank of St. Louis (FRED), jumped to a fresh high in six weeks to portray further prices pressure ahead, allowing Fed hawks to keep controls.
Talking about the data, final prints of the US Markit Manufacturing PMI for December, 57.7 versus 57.8 prior, as well as softer figures of the US Construction Spending for November, failed to provide any clear direction to the USD/CHF pair as yields dominated the moves.
Amid these plays, the Wall Street benchmark printed losses by the S&P 500 Futures remain directionless at the latest.
Moving on, today’s Swiss Consumer Price Index (CPI) for November, market consensus 1.6% YoY versus 1.5% prior, will offer immediate direction to USD/CHF traders ahead of the US ISM Manufacturing PMI for the said month, expected 60.2 versus 61.1. However, major attention will be given to the Fed rate-hike concerns and virus updates for clear direction.
Technical analysis
Although failures to cross the 20-DMA, around 0.9200 at the latest, keep USD/CHF sellers hopeful, the 200-DMA level near 0.9175 holds the key to the pair’s further downside.
In recent trade today, the People’s Bank of China (PBOC) set the yuan (CNY) at 6.3794 vs the last close of 6.3550.
About the fix
China maintains strict control of the yuan’s rate on the mainland.
The onshore yuan (CNY) differs from the offshore one (CNH) in trading restrictions, this last one is not as tightly controlled.
Each morning, the People’s Bank of China (PBOC) sets a so-called daily midpoint fix, based on the yuan’s previous day closing level and quotations taken from the inter-bank dealer.
- USD/TRY remains pressured after reversing from two-week top.
- Downside break of key SMAs, bearish MACD signals keep sellers hopeful inside short-term ascending trend channel.
- Recovery moves need validation from $14.50, bears can aim December’s low.
USD/TRY carries the previous day’s pullback from a fortnight high of around $13.00, down 0.24% intraday, during Tuesday’s Asian session.
The USD/TRY pair’s heaviest daily loss since December 23, portrayed on Monday, pulled the quote back below the 100-SMA and 200-SMA amid bearish MACD signals.
However, a two-week-long ascending trend channel defends USD/TRY bulls around $13.00.
Hence, sellers need to wait for the $13.00 breakdown for fresh entries before targeting the 23.6% Fibonacci retracement (Fibo.) level of the December 20-23 downturn, near $12.15.
In a case where USD/TRY bears keep reins past $12.15, the last month’s low near $10.25 and the $10.00 psychological magnet should return to the charts.
Alternatively, 100-SMA and 200-SMA guard the immediate upside of the pair, respectively around $13.15 and $13.45.
Adding to the resistance is the 50% Fibo. of $14.30 and the upper line of the stated channel, near $14.50.
USD/TRY: Four-hour chart
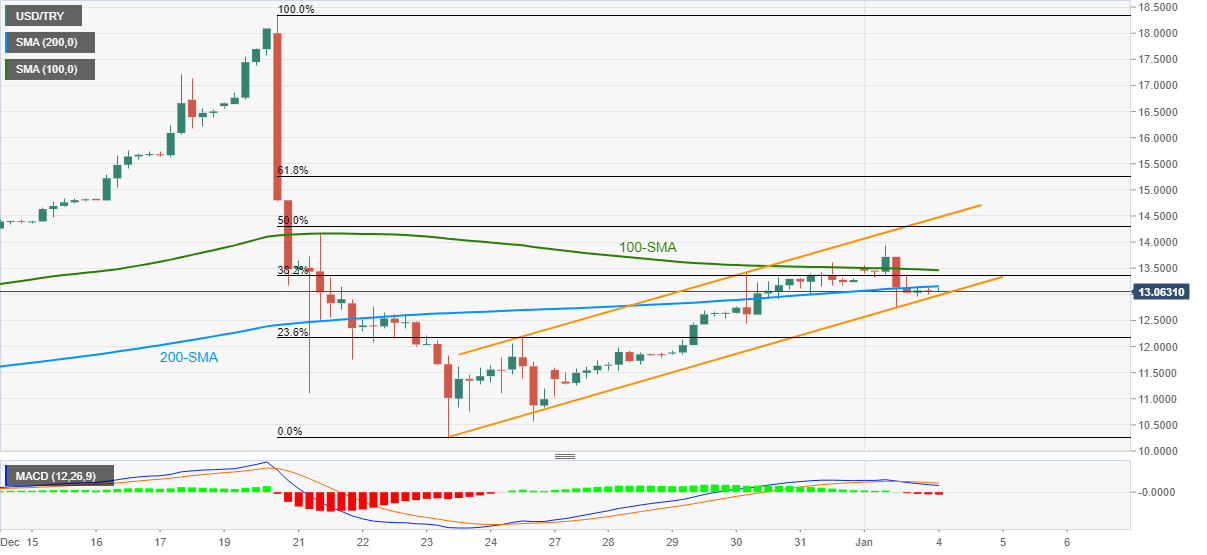
Trend: Further weakness expected
- NZD/USD bulls stepping in at critical daily support.
- Bulls will aim for a breakout of recent highs towards 0.6950.
- Bears seeking a break of the daily support are a retest of current lows near 0.67 the figure.
NZD/USD is attempting to correct to the upside and the following illustrates the M-formation's neckline on the weekly chart where bulls could be headed.
NZD/USD weekly chart, M-formation
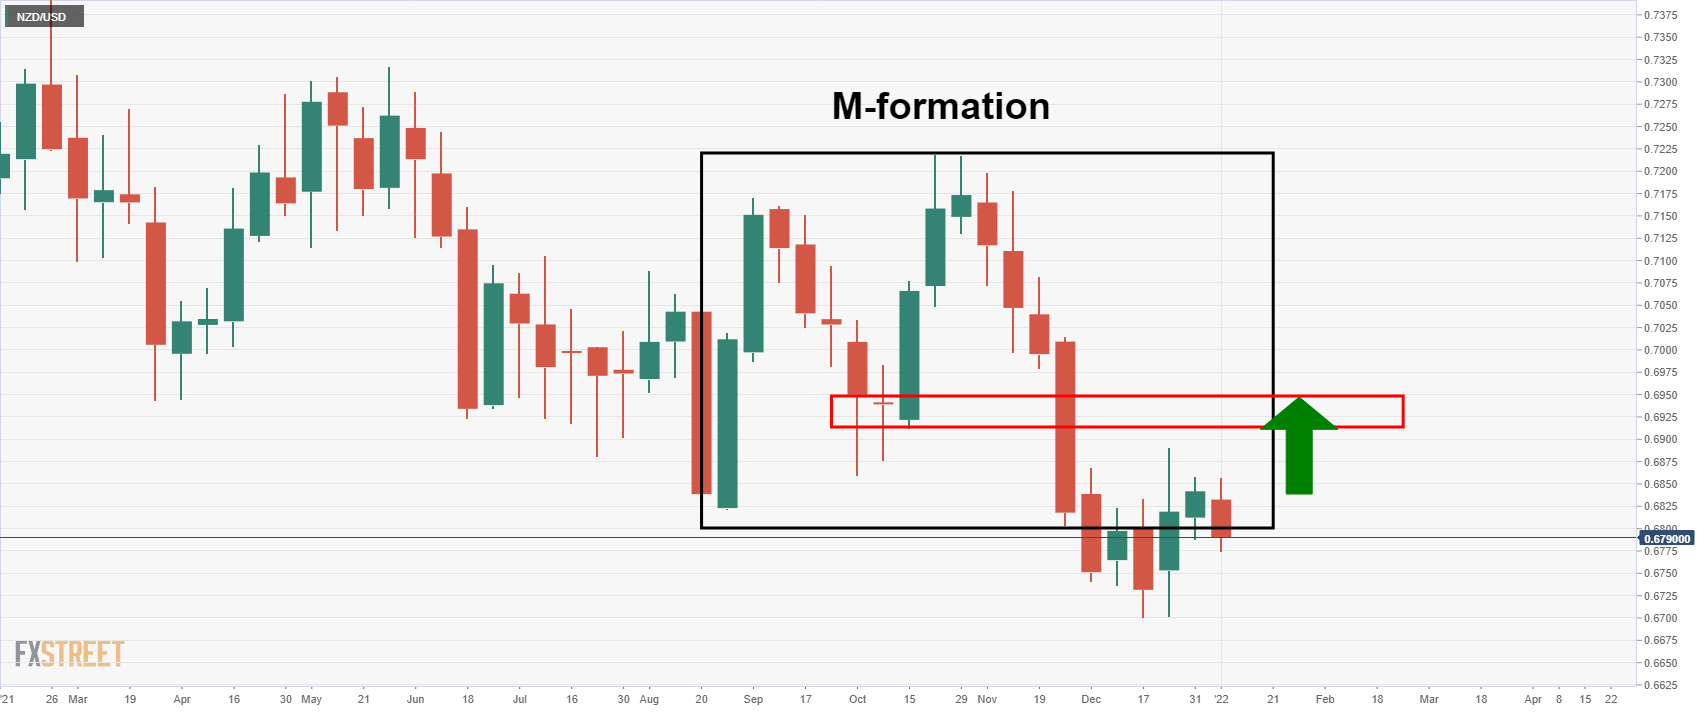
Daily chart
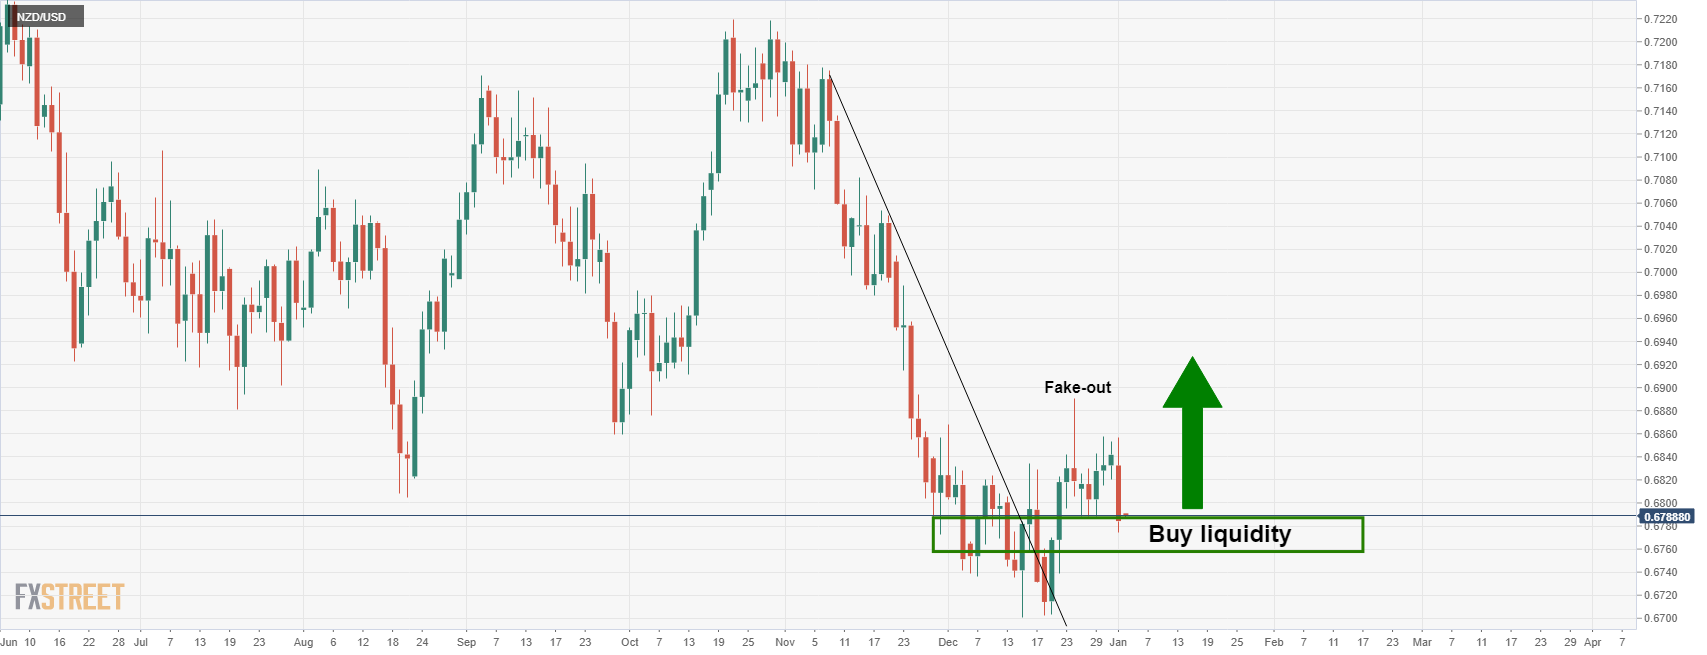
The daily chart is a complex mix of choppy price action that could instead be thought of as accumulation. Buyers are building a portfolio of a position averaging out at the cheapest price possible.
However, given the strength of the recent sell-off, there is every possibility of a continuation of the downside still:
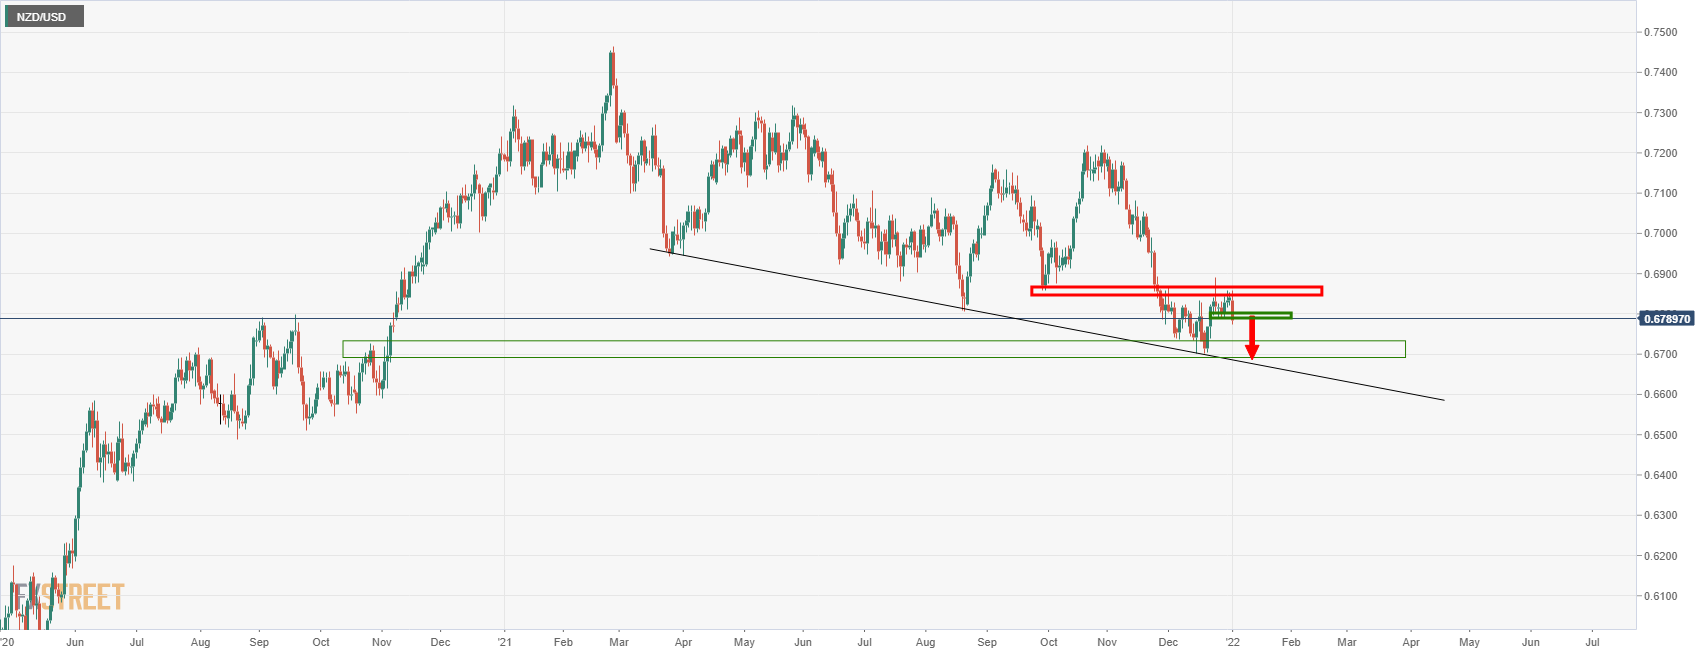
“Inflation could exceed 7% this year to reach levels last seen in the 1990s,” as per the annual survey of economists by The Times.
“Prices rose by 5.1 percent in the year to the end of November, the highest rate in a decade,” added the Times.
Key findings
More than half of the 32 economists polled, who include former Bank of England policymakers, said they expect consumer prices to rise by at least one percentage point from current levels.
Over a third of the economists expect inflation to peak between 6 and 6.5 percent, while 15 percent predict it will surpass 6.5 percent. Two economists, including a former Bank rate-setter, said inflation would top 7 percent.
FX implications
An annual survey of economists by The Times suggests further upside for the GBP/USD pair as inflation fears were cited by the Bank of England (BOE) policymakers while announcing the latest rate hike. That said, the pair consolidates recent losses around 1.3475 by the press time.
Read: GBP/USD Price Analysis: Grinds higher between 50 and 100 DMAs
- EUR/USD consolidates the biggest daily losses in a fortnight.
- US Treasury yields retreat from multi-day top amid quiet markets, light calendar in Asia.
- Coronavirus woes, expectations of faster rate-hike from Fed propelled yields the previous day.
- German Retail Sales, US ISM Manufacturing PMI to decorate calendar.
EUR/USD licks its wounds near 1.1305, refreshing intraday high during Tuesday’s Asian session. The major currency pair dropped the heaviest in two weeks the previous day after a jump in the US Treasury bond yields propelled the US dollar.
A faster pace of the coronavirus spread exert pressure on the medical system and raise concerns over another round of widespread economic and health losses. The risk-off mood also takes clues from the rising hopes of faster Fed rate-hikes in 2022. Both these catalysts weigh bond prices and fuel yields, which in turn favor EUR/USD bears.
That said, the health ministries from Spain and France have reported record covid cases while the US also marked a doubling of the virus numbers. “COVID worries have been front and center once again for investors since the start of the holiday season. The number of new COVID-19 cases has doubled in the last seven days to an average of 418,000 a day, mostly attributed to the highly transmissible but milder Omicron variant,” according to a Reuters tally.
It’s worth noting that the US inflation expectations, as per the 10-Year Breakeven Inflation Rate numbers from the Federal Reserve Bank of St. Louis (FRED), jumped to a fresh high in six weeks to portray further prices pressure ahead, allowing Fed hawks to keep controls. The same adds strength to the US Treasury yields.
Talking about data, the softer prints of the US Markit Manufacturing PMI for December failed to entertain traders ahead of today’s US ISM Manufacturing PMI for the said month, expected 60.2 versus 61.1.
Amid these plays, the DXY rose around 0.60% on Monday, the biggest daily gains since mid-December while the US Treasury yields jumped to the six-week top for 30-year, 20-year, 10-year and 5-year notes. That said, the Wall Street benchmarks also began 2022 on a firmer footing amid hopes of further stimulus.
In addition to the US ISM Manufacturing PMI, German Retail Sales for November, expected -0.5% MoM versus -0.3% prior, will also direct short-term EUR/USD moves. However, major attention will be given to the virus fears.
Read: ISM Manufacturing PMI Preview: Low expectations in three figures open door to dollar upswing
Technical analysis
EUR/USD pulled back from the 50-DMA, around 1.1370 at the attest, during the previous day to conquer the 21-DMA immediate resistance, near 1.1310. The DMA breakdown joins downbeat oscillators to direct the quote towards an ascending support line from November 24, close to 1.1255 by the press time.
| Pare | Closed | Change, % |
|---|---|---|
| AUDUSD | 0.71903 | -0.86 |
| EURJPY | 130.315 | -0.35 |
| EURUSD | 1.12977 | -0.62 |
| GBPJPY | 155.468 | -0.1 |
| GBPUSD | 1.34782 | -0.27 |
| NZDUSD | 0.67851 | -0.48 |
| USDCAD | 1.27446 | 0.92 |
| USDCHF | 0.91883 | 0.94 |
| USDJPY | 115.345 | 0.25 |
- GBP/USD pares the biggest daily losses in two weeks.
- Key DMAs restrict short-term moves, RSI suggests buyer’s exhaustion.
GBP/USD seesaws around 1.3480 during the initial Asian session on Tuesday. The cable pair dropped the most in two weeks while stepping back from early November highs the previous day.
Even so, the quote remains between the 50-DMA and 100-DMA, suggesting further sideways momentum.
It’s worth noting that the RSI line suggests that the bulls are tired and hence short-term declines toward the 50-DMA level surrounding 1.3400 can’t be ruled out.
However, the 38.2% Fibonacci retracement level of the October-December fall adds strength to the stated support near 1.3400 and challenges the GBP/USD bears.
Should the quote drops below 1.3400, tops marked during late November and mid-December, around 1.3370-75, will act as an extra filter to the south.
On the flip side, 50% Fibo. near 1.3500 round figure will restrict short-term upside moves of the GBP/USD prices ahead of the 100-DMA level of 1.3560.
Following that, the 61.8% Fibonacci retracement level and a three-month-old horizontal line, respectively around 1.3580 and 1.3610, will challenge the pair buyers.
To sum up, GBP/USD rebound seems to find less acceptance but bears need to break the 50-DMA to retake controls.
GBP/USD: Daily chart
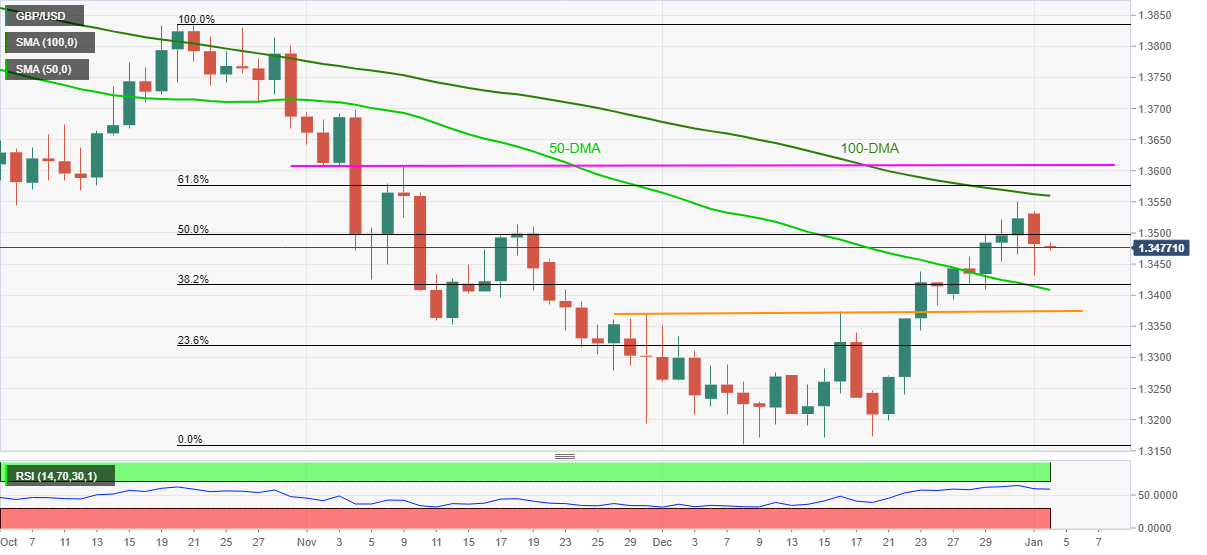
Trend: Sideways


© 2000-2026. Sva prava zaštićena.
Sajt je vlasništvo kompanije Teletrade D.J. LLC 2351 LLC 2022 (Euro House, Richmond Hill Road, Kingstown, VC0100, St. Vincent and the Grenadines).
Svi podaci koji se nalaze na sajtu ne predstavljaju osnovu za donošenje investicionih odluka, već su informativnog karaktera.
The company does not serve or provide services to customers who are residents of the US, Canada, Iran, The Democratic People's Republic of Korea, Yemen and FATF blacklisted countries.
Izvršenje trgovinskih operacija sa finansijskim instrumentima upotrebom marginalne trgovine pruža velike mogućnosti i omogućava investitorima ostvarivanje visokih prihoda. Međutim, takav vid trgovine povezan je sa potencijalno visokim nivoom rizika od gubitka sredstava. Проведение торговых операций на финанcовых рынках c маржинальными финанcовыми инcтрументами открывает широкие возможноcти, и позволяет инвеcторам, готовым пойти на риcк, получать выcокую прибыль, но при этом неcет в cебе потенциально выcокий уровень риcка получения убытков. Iz tog razloga je pre započinjanja trgovine potrebno odlučiti o izboru odgovarajuće investicione strategije, uzimajući u obzir raspoložive resurse.
Upotreba informacija: U slučaju potpunog ili delimičnog preuzimanja i daljeg korišćenja materijala koji se nalazi na sajtu, potrebno je navesti link odgovarajuće stranice na sajtu kompanije TeleTrade-a kao izvora informacija. Upotreba materijala na internetu mora biti praćena hiper linkom do web stranice teletrade.org. Automatski uvoz materijala i informacija sa stranice je zabranjen.
Ako imate bilo kakvih pitanja, obratite nam se pr@teletrade.global.
транcфери