- Analiza
- Novosti i instrumenti
- Vesti sa tržišta
Novosti i prognoe: devizno tržište od 03-01-2022
- AUD/USD holds off from breaking below 0.7180 ahead of key data events.
- Chinese Manufacturing is coming up today while traders await critical US data as well.
AUD/USD has been in the hands of the bears to start the year as the US dollar firms along with US yields. For Tuesday, the price is holding above critical support near 0.7180 while bears step off the gas ahead of key data events that start today in China's Caixin Manufacturing PMI for December.
China data in focus
Based on a survey of 430 industrial businesses In China, the Caixin Manufacturing PMI Purchasing Managers' Index evaluates the efficiency of the manufacturing sector. This data is often regarded as a leading indicator for global growth. The Aussie is a high beta currency and would be expected to react to such data. Moreover, China is Australia's largest trading partner.
- China: Four reasons why growth could be better than expected in 2022 – Morgan Stanley
However, the data could be ignored in part as traders look ahead to the positive implications of the action that Chinese policymakers have already taken to help improve prospects for growth in 2022 and beyond.
The Chinese have ''hit pause on their deleveraging efforts and have already started to ease both monetary and fiscal policies in the last few weeks,'' analysts at Morgan Stanley explained.
“China’s zero-Covid approach has prevented disruptions to factory production and even led to a rise in its share of global exports.”
“A favourable global backdrop should further drive strong trade growth.”
Nonetheless, there will be no surprises if we see some expansion moderating the data today. ''In Nov all country PMIs were in expansion but rising Omicron concerns could weigh on sentiment in Dec. While we expect further expansion, some moderation is likely,'' analysts at TD Securities argued.
US data eyed
Looking elsewhere, the US calendar kicks off this week as well. The highlight will be Friday's jobs data in the form of Nonfarm Payrolls. ''The late-December COVID surge likely came too late to prevent a pickup in US payrolls after the gain in November (210k) appeared to be held down by an overly aggressive seasonal factor,'' analysts at TD Securities said.
meanwhile, the Federal Open market Committee minutes will also be a key event. ''Following the FOMC's decision to double the pace of QE tapering and the projection of a significantly more hawkish dot plot, focus will now turn to the elements that led to the evolution of views among policymakers (including on "maximum employment") after the November meeting,'' the analysts at TDS explained.
AUD/USD technical analysis
AUD/USD Price Analysis: A fast trip to 0.7150 is on the cards on a break of 0.7180
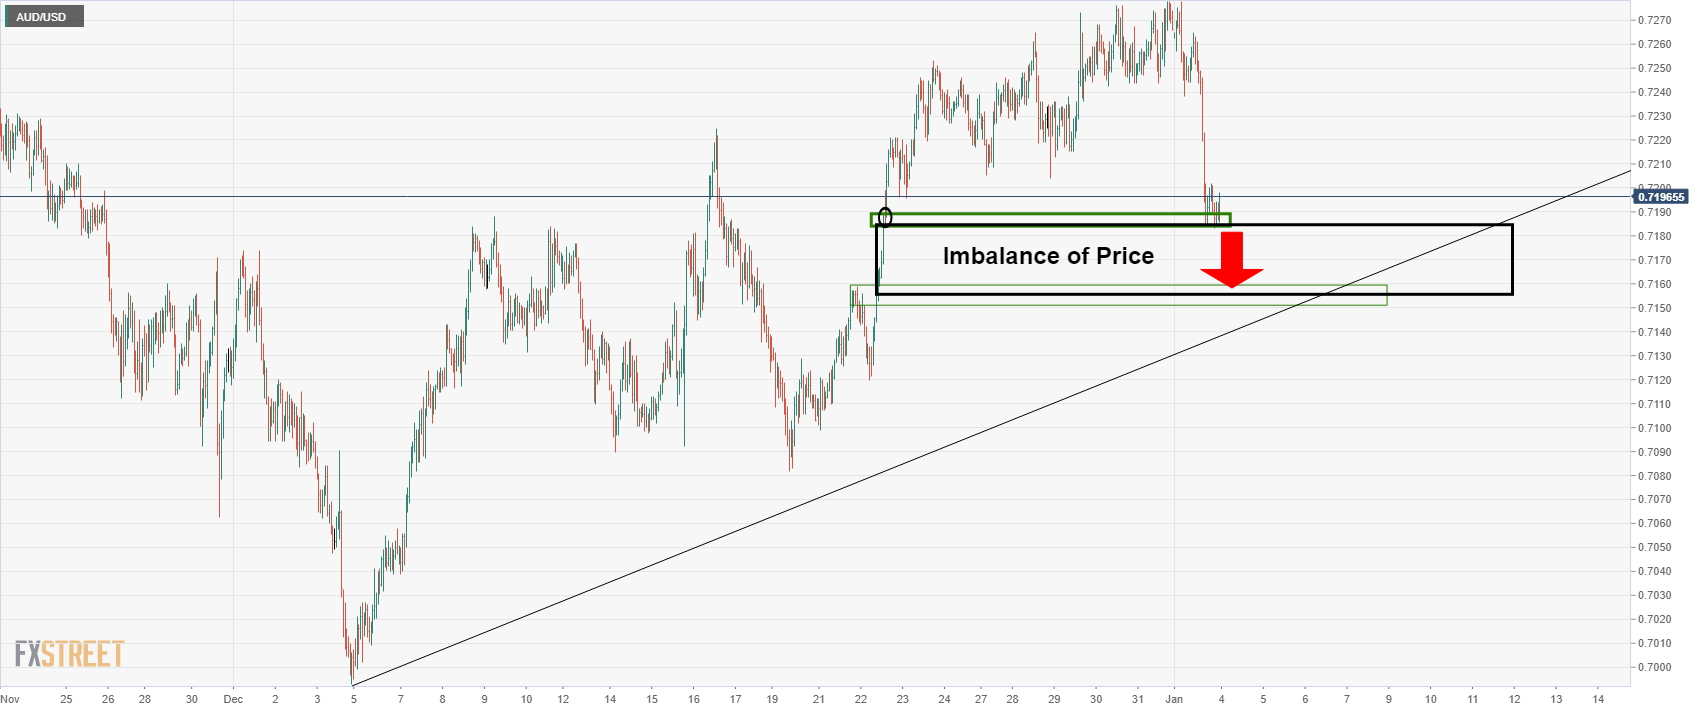
The bears have backed off from key support at this important juncture of the bearish impulse. However, if 0.7180 should give, then this could lead to a breakout and opens risk towards 0.7155 in mitigation of the price imbalance between here and there as illustrated above.
US inflation expectations, as measured by the 10-year breakeven inflation rate per the St. Louis Federal Reserve (FRED) data, rose to the highest since November 24 while flashing a 2.60% level by the end of Monday’s North American session, per the FRED website.
Given the firmer inflation expectations backing fears of the Fed’s early rate hike, the US Treasury yields remain firmer and help the US dollar at the latest.
That said, US 10-year Treasury yields rallied the most in three months the previous day, firmer around 1.62% at the latest.
In addition to the strong inflation expectations, rapidly spreading coronavirus also weighs on the market sentiment and propels the US Treasury yields, as well as the US dollar.
With the firmer US dollar, the commodities remain on the back foot, mainly the gold prices ahead of today’s US ISM Manufacturing PMI.
Read: Gold Price Forecast: XAU/USD sellers attack $1,800 as coronavirus fuels yields, US ISM PMI eyed
- Gold remains pressured after the biggest daily fall in six weeks.
- US T-Bond Yields rallied to multi-day high as virus cases rally, Fed rate-hike concerns gain momentum.
- US ISM Manufacturing PMI can offer immediate direction, FOMC Minutes, NFP will be the key.
- Gold Price Forecast: Defying the 1,800 threshold on dollar’s demand
Gold (XAU/USD) stays defensive at around $1,800 after printing the biggest daily losses since November 22. That said, the yellow metal seesaws near the short-term support line amid a lack of fresh catalysts during the early Asian session on Tuesday.
Firmer US Treasury bond yields drowned commodities and propelled the US Dollar Index (DXY) the previous day. Even so, equities had a nice start in 2022.
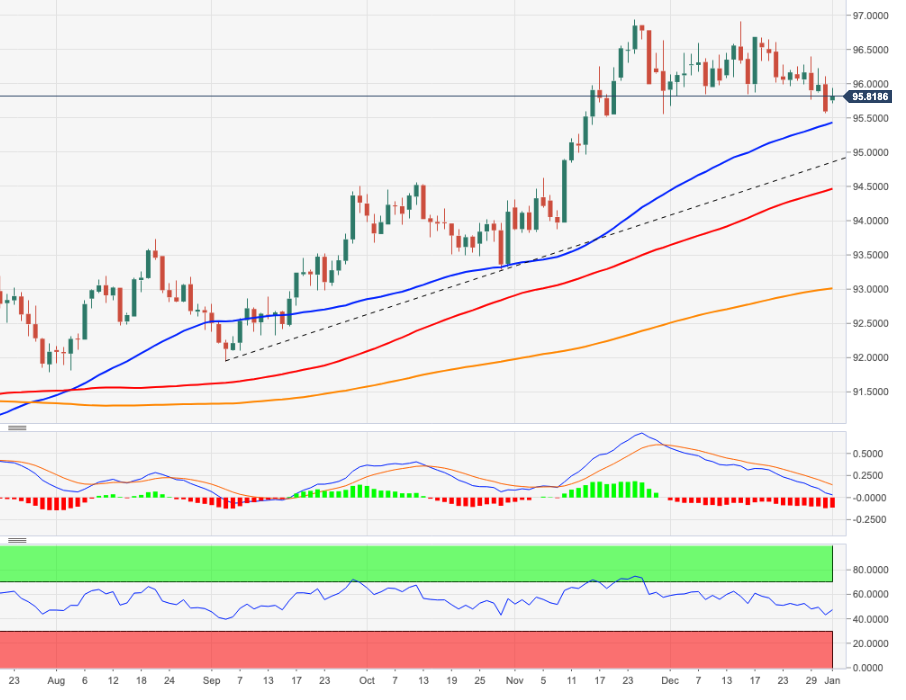
That said, the DXY rose around 0.60% daily, around 96.00 at the latest, rising the most since mid-December on Monday. On the other hand, the US Treasury yields jumped to the six-week top for 30-year, 20-year, 10-year and 5-year notes.
The worsening coronavirus conditions raise challenges for the market sentiment and policymakers who previously expected the South African covid variant, namely Omicron, to be less severe than the previous virus variant. The risk-off mood also takes clues from the rising hopes of faster Fed rate-hikes in 2022. Both these catalysts weigh bond prices and fuel yields.
“COVID worries have been front and center once again for investors since the start of the holiday season. The number of new COVID-19 cases has doubled in the last seven days to an average of 418,000 a day, mostly attributed to the highly transmissible but milder Omicron variant,” according to a Reuters tally.
The US inflation expectations, as per the 10-Year Breakeven Inflation Rate numbers from the Federal Reserve Bank of St. Louis (FRED), jumped to a fresh high in six weeks to portray further prices pressure ahead, allowing Fed hawks to keep controls.
It’s worth noting that the softer prints of US Markit Manufacturing PMI for December, final reading failed to have a notable market impact as gold traders are more interested in today’s US ISM Manufacturing PMI for the said month, expected 60.2 versus 61.1.
Other than the US PMI, virus updates and Fed chatters will also direct short-term gold price moves. However, Wednesday’s Federal Open Market Committee (FOMC) Meeting Minutes and Friday’s US Nonfarm Payrolls (NFP) will be crucial to watch for clear direction.
Read: ISM Manufacturing PMI Preview: Low expectations in three figures open door to dollar upswing
Technical analysis
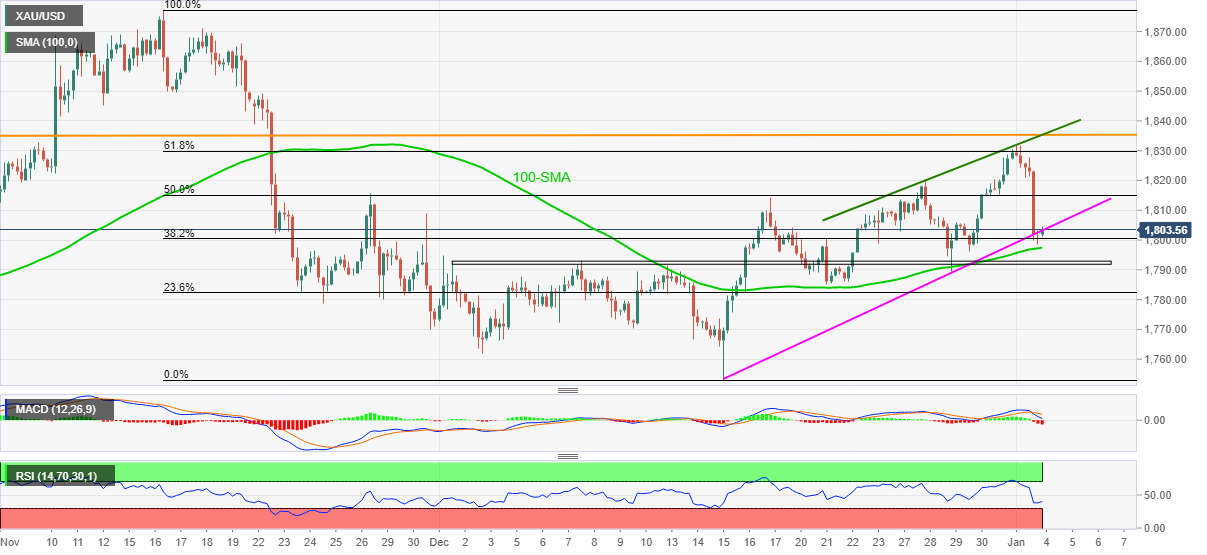
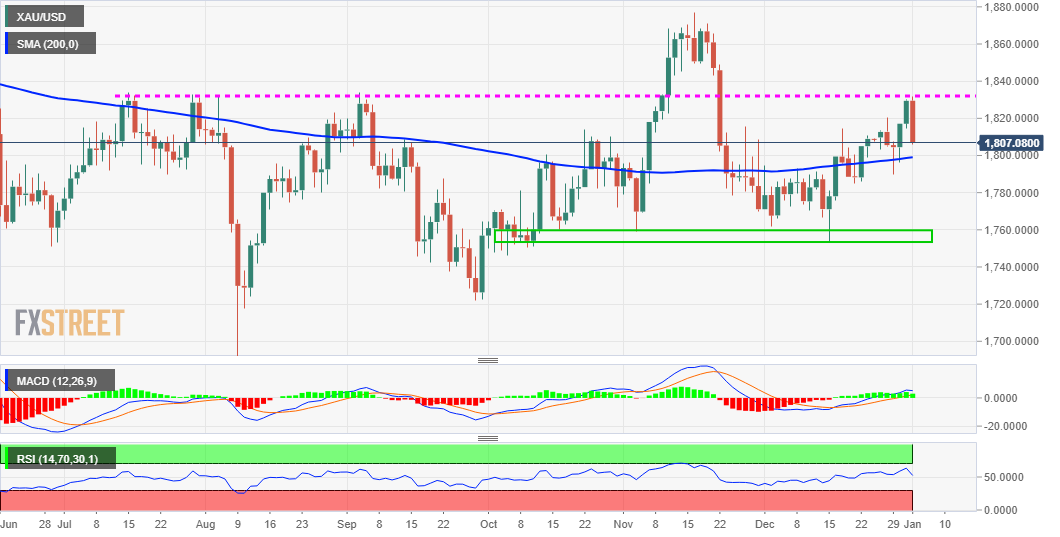
Gold’s pullback from 61.8% Fibonacci retracement of (Fibo.) of November 16 to mid-December downside takes clues from bearish MACD signals and descending RSI line, not oversold, to keep sellers hopeful.
Even so, an ascending support line from December 15, near the $1,800 threshold, quickly followed by the 100-SMA level surrounding $1,797, challenges the gold sellers.
Adding to the downside filter is the monthly horizontal area near $1,793-91, a break of which should give a free hand to the gold bears targeting the last monthly low near $1,753.
On the flip side, a convergence of weekly resistance line and tops marked in July, as well as in September, restricts short-term recovery moves of gold, in addition to the 61.8% Fibo. level surrounding $1,830.
Following that, a run-up towards $1,850 and $1,870 can’t be ruled out before directing gold buyers to November’s peak of $1,877.
Gold: Four-hour chart
Trend: Further weakness expected
- WTI remains sidelined after bouncing off two-week low.
- Steady RSI, sustained trading beyond 61.8% Fibonacci retracement keeps buyers hopeful.
- Six-week-old resistance line guards immediate upside, 200-SMA adds to the downside filter.
WTI takes rounds of $75.85 during the early Asian session on Tuesday, after a volatile day that initially refreshed a fortnight low before flashing mild gains.
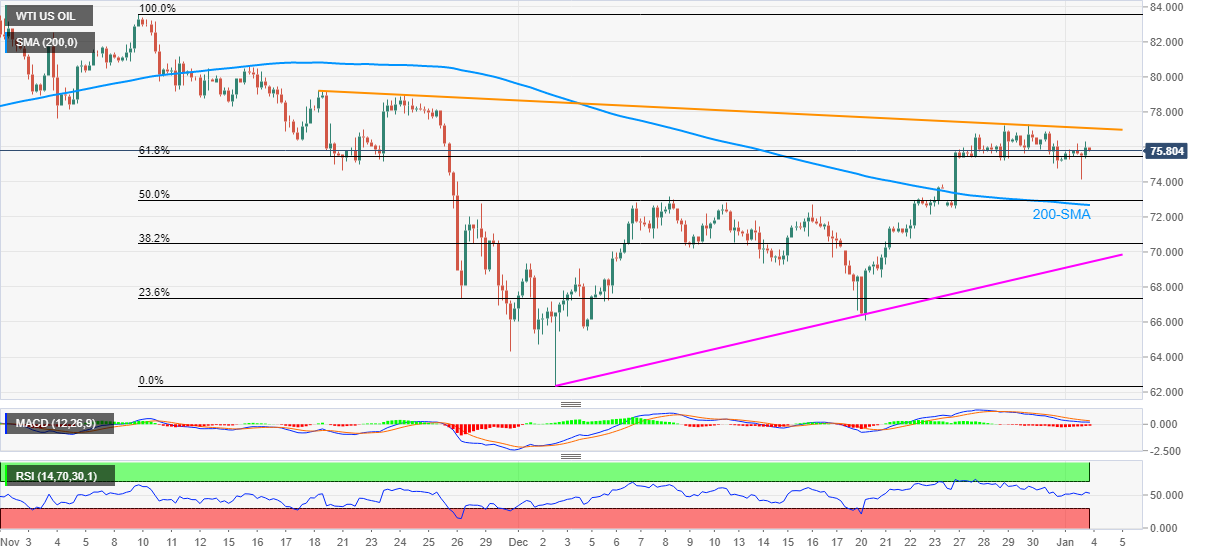
The 61.8% Fibonacci retracement (Fibo.) of November-December downside defended the black gold the previous day amid a steady RSI line and receding bearish bias of the MACD.
With this, oil prices can portray another attempt to cross a descending trend line resistance from November 19, around $77.10.
Following that, the monthly high near $77.25 may act as an extra filter to the north before directing the oil buyers towards the late November tops surrounding $79.00 and $79.20.
Meanwhile, pullback moves need a clear downside break of the 61.8% Fibo. level, around $75.50, to challenge the 200-SMA around $72.70.
In a case where WTI crude oil prices stay beneath the 200-SMA, a monthly support line near $69.45, will be in focus.
To sum up, oil prices grind higher and defend short-term supports amid steady oscillators, which in turn suggest further upside momentum.
WTI: Four-hour chart
Trend: Further recovery expected
“A wall of maturing debt and a surge in seasonal demand for cash will test China’s financial markets this month, putting pressure on the central bank to ensure sufficient liquidity,” said Bloomberg News Wire during early Tuesday morning in Asia.
Key quotes (from Bloomberg)
Demand for liquidity may total about 4.5 trillion yuan ($708 billion) in January, 18% more than the amount seen last year, according to calculations by Bloomberg based on official data and analysts’ estimates.
An increase in the amount of policy loans coming due and demand for cash to be spent during the Lunar New Year, which takes place earlier in 2022, are drivers.
A recent reduction in the reserve requirement ratio for banks could provide relief but some market watchers predict the central bank could ease again to avoid a liquidity crunch. That comes after policymakers indicated a shift from deleveraging the economy to supporting growth.
Further policy easing will be a double-edged sword for the People’s Bank of China. While such a move could soothe concerns about higher funding costs and prevent a liquidity squeeze, it may also fuel asset bubbles that Beijing wants to avoid.
Ahead of the Lunar New Year in 2019 and 2020, the authorities lowered the reserve ratio to pump in cash. However, they avoided supplying extra funds last year, stoking fears about a tighter policy stance and sending short-term funding costs soaring.
FX reaction
AUD/USD can seek solace in the news considering the sign of further liquidity from the biggest customer. That said, the pair consolidates recent losses around 0.7190, the lowest level in two days at the latest. It's worth noting that the virus-led partial lockdown in Ningbo is impacting operations of the world's largest port weighed on the market sentiment and AUD/USD prices.
Read: AUD/USD Price Analysis: A fast trip to 0.7150 is on the cards on a break of 0.7180
- USD/CAD grinds higher following a notable bounce off monthly bottom.
- US T-bond yields jumped the most in three months on covid fears, Fed rate-hike concerns.
- Oil prices are seesawed amid virus fears, OPEC+ headlines and firmer USD.
- US, Canada PMIs will decorate calendar, risk catalysts in focus.
USD/CAD hovers around 1.2750, after the biggest daily rise in a fortnight, during the early Tuesday morning in Asia. The Loonie pair portrayed the broad US dollar strength, backed by the surge in the US Treasury bond yields. That said, the volatile prices of Canada’s main export item, WTI crude oil, failed to contribute to the latest moves.
Fears of the South African covid variant, namely Omicron, fuelled the US bond yields at the start of 2022. The virus strain has spread faster than initially feared and pushes some of the global medical systems again on the brink of a breakdown even as policymakers stay hopeful to overcome the pandemic with optimistic studies.
“COVID worries have been front and center once again for investors since the start of the holiday season. The number of new COVID-19 cases has doubled in the last seven days to an average of 418,000 a day, mostly attributed to the highly transmissible but milder Omicron variant,” according to a Reuters tally.
Not only the virus woes but firmer hopes of faster rate hikes by the US Federal Reserve (Fed) in 2022 also propelled the US Treasury yields and the US dollar across the board. The US inflation expectations, as per the 10-Year Breakeven Inflation Rate numbers from the Federal Reserve Bank of St. Louis (FRED), jumped to a fresh high in six weeks to portray further prices pressure ahead, allowing Fed hawks to keep controls.
That said, softer prints of US Markit Manufacturing PMI for December, final reading, joined Construction Spending for November to flash lower than previous readouts and couldn’t affect the US dollar.
Amid these plays, Wall Street benchmarks closed higher and the US Treasury yields jumped to the six-week top for 30-year, 20-year, 10-year and 5-year notes.
It’s worth noting that sustained output increase by OPEC+ and fears of virus weighing on the oil demand challenged the WTI crude oil prices. Even so, the black gold ended Monday’s trading with mild gains of around $75.85.
Moving on, Canadian Markit Manufacturing PMI for December and the US ISM Manufacturing PMI for the said month, expected 57.5 and 60.2 versus 57.2 and 61.1 in that order, will entertain the USD/CAD traders. Given the recently high yields and firmer USD, backed by the COVID-19 fears, the pair is likely to remain firmer heading into Friday’s key jobs report.
Technical analysis
USD/CAD needs to overcome a two-week-old resistance line, near 1.2765 by the press time, to justify the bounce off the 100-DMA level of 1.2630. That said, bearish MACD signals and a steady RSI line keep sellers hopeful.
- USD/JPY bulls are moving in hard on a critical level of resistance.
- The week ahead will be a busy one with full markets returning and eager for volatility around critical events.
Monday marked the final day of the holiday season for all markets. The rest of the week will be supercharged on both volumes returning and high stake calendar events which could make for a wild ride. USD/JPY is going to be a major focus on forex given its ascent through 115.
At the time of writing, USD/JPY rallied from a low of 114.94 to a high of 115.36, extending the holiday drift to the upside. The moves in USD/JPY has dovetailed with the rally in stocks. The performance of global equities will be key at this juncture and more of the same could see the pair overcome 115.52, the high of November.
Bonds maintain a corrective tone after long end yields surged in late December and the Federal Open Market Committee minutes and Nonfarm Payrolls will be key this week in that respect.
''Following the FOMC's decision to double the pace of QE tapering and the projection of a significantly more hawkish dot plot, the focus will now turn to the elements that led to the evolution of views among policymakers (including on "maximum employment") after the November meeting,'' analysts at TD Securities said.
As for the main event of the week, the analysts explained that ''the late-December COVID surge likely came too late to prevent a pickup in US payrolls after the gain in November (210k) appeared to be held down by an overly aggressive seasonal factor.''
USD/JPY technical analysis
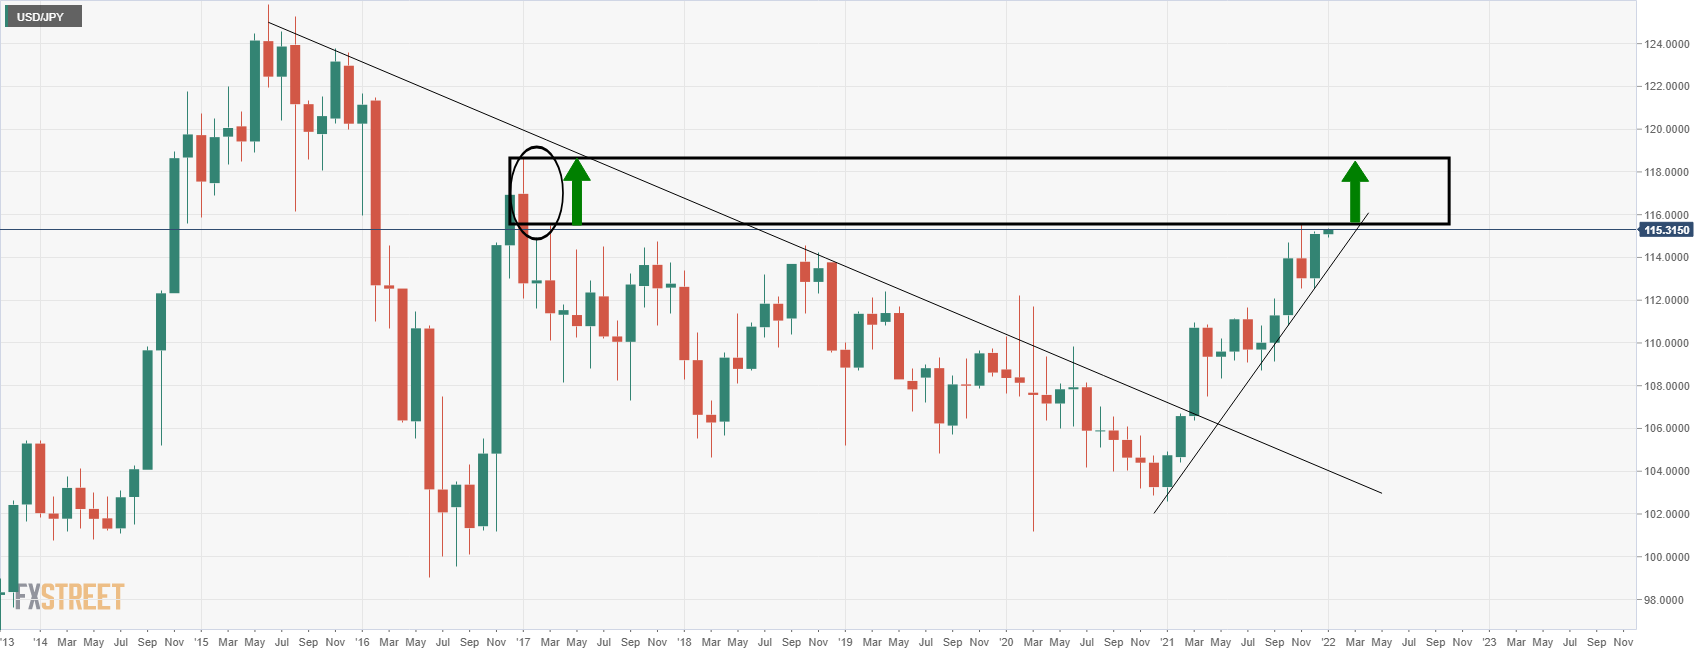
USD/JPY is attempting to break into a key area on the monthly chart. If it breaches the 116 figure, then there are real prospects of mitigation between here and 118.60 for the first quarter of the year.
- AUD/USD bears in control and they target the imbalance of price.
- Support at this juncture near 0.7180 is critical in guarding against 0.7150.
AUD/USD has been n the hands of the bears to start the year. The greenback has picked up a strong bid while many markets have been closed.
However, with full volumes coming back into play, the question is whether the ranges can be broken in a continuation of the dominant trends that have formed in some forex pairs. The following illustrates the bearish bias in AUD/USD for the sessions ahead on a break of critical support.
AUD/USD H1 chart
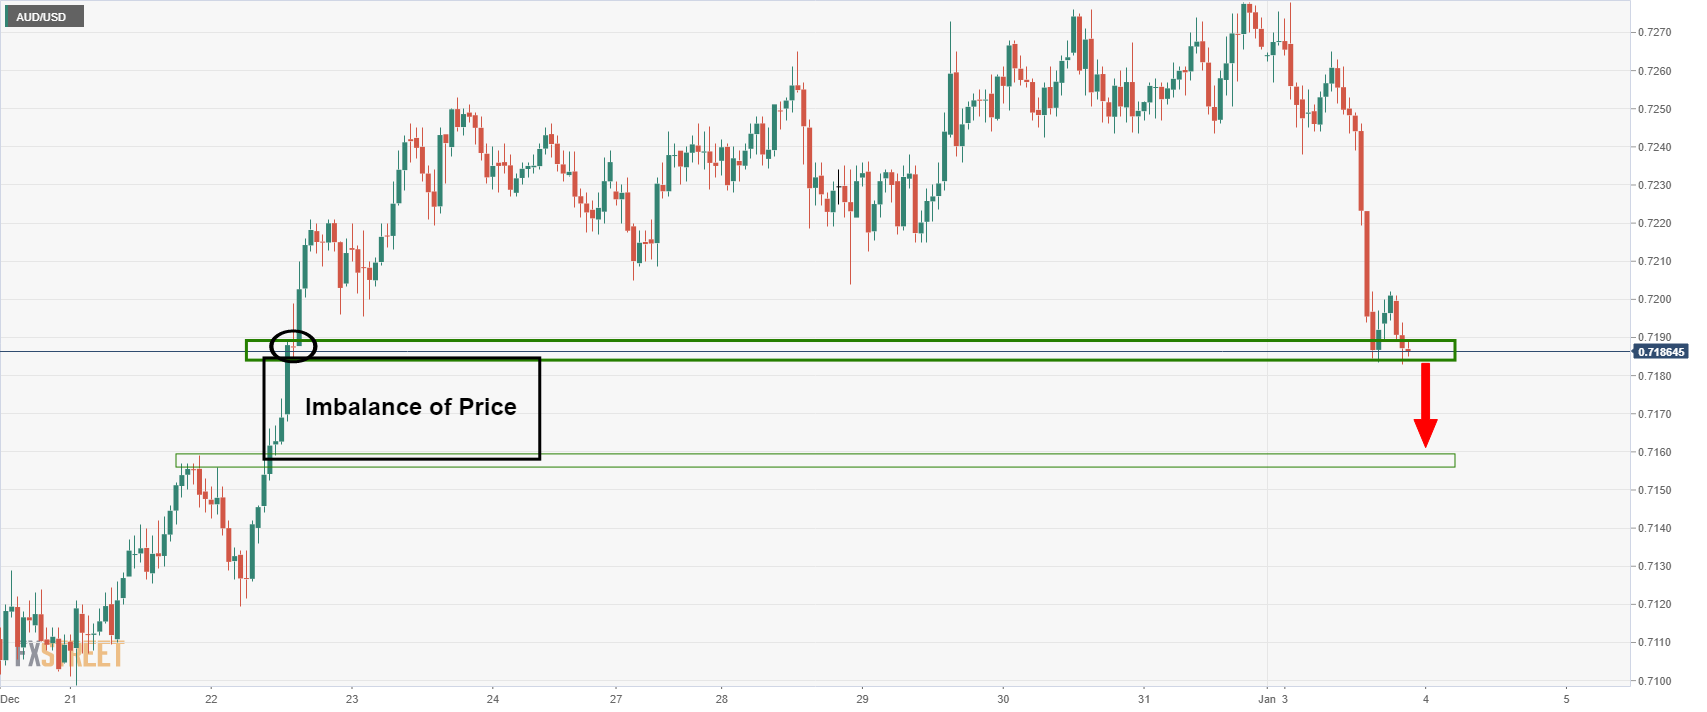
The bears are taking on the support at this important juncture of the bearish impulse. This could lead to a breakout and opens risk towards 0/.7155 in mitigation of the price imbalance between here and there as illustrated above.
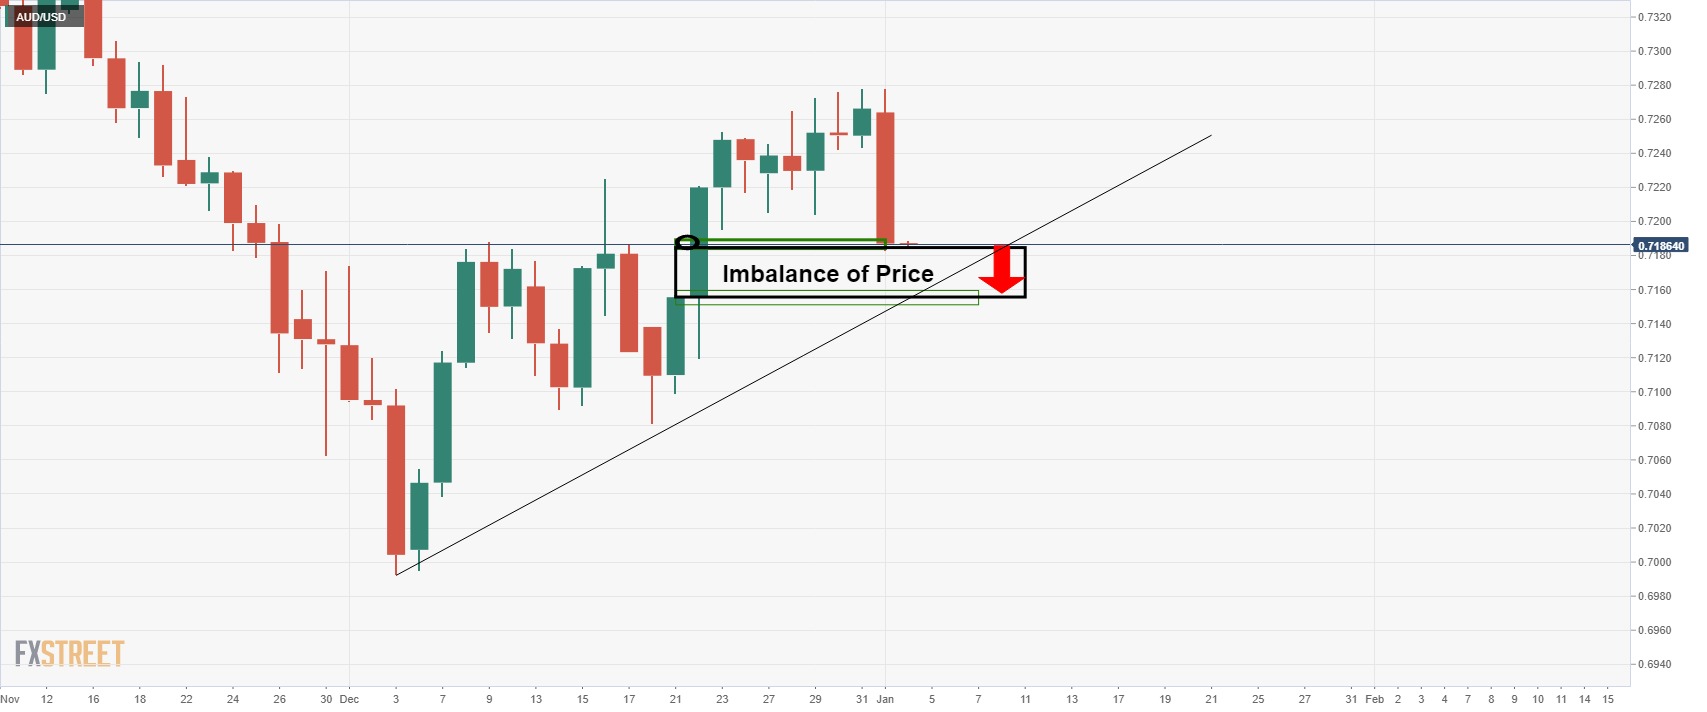
This is also illustrated on the following daily chart:
- AUD/JPY dropped 1.0% to back under the 83.00 level on Monday despite as safe-haven currencies like the yen outperformed.
- The more defensive FX market bias contradicted the risk-on mood in global equity and bond markets.
- Support at key moving averages around 82.70 and in the 82.50 zone may be seen as a near-term buy opportunity.
Despite gains in strongly risk-on market conditions in global equity, bond and commodity markets, risk-sensitive currencies in the G10 suffered on the first trading day of 2022, whilst the safe-haven US dollar and yen benefitted. Given AUD’s status as one of the more risk-sensitive G10 currencies, AUD/JPY had a rough time on Monday, pulling back sharply from the six-week highs it printed during Asia Pacific trade in the 0.8380s to nearly 100 pips lower in the 82.90 area. At current levels underneath 83.00, the pair is trading lower by about 1.0% on the day, the worst one-day performance in one month.
As it gradually advanced in the 83.00s over the course of last week and early on Monday’s session, AUD/JPY had been testing an uptrend that has been capping the price action since early December. Failure to break above this uptrend ultimately seems to have been taken as a bearish signal by technicians, who have on Monday forced the pair back towards its 50 and 200-day moving averages, both of which sit around 82.70. A break below here would bring in focus a test of the key 82.50 level, which acted as strong resistance and then support in December.
The mismatch between FX (which has been more risk-off) and equities, bonds and commodities (where conditions have been more risk-on) provoked some head-scratching on Monday. Should US equities and bond markets continue to price in a more positive 2022 outlook in the coming days, it's hard to see how this could result in further AUD/JPY weakness. Bulls may well view the pair at current levels as a good short-term buy-the-dip opportunity, especially if the pair drops further to 82.50. But bulls will be wary of concerns about the Omicron outbreak in Australia, which has really been accelerating and could explain why the pair faired worse than its NZD and CAD peers on Monday.
- In a choppy start to the year, GBP/JPY fell back from near-156.00 to 155.00 before bouncing to 155.50.
- If risk-on conditions continue, the pair may well retest 156.00, but does risk entering overbought conditions according to the RSI.
Things were bumpy for GBP/JPY on the first trading day of 2022. Despite a resolutely risk-on market bias (when looking at moves in global equity and bond markets, anyway), FX markets have been more mixed. The US dollar outperformed amid a surge in yields, but the yen also performed well while more risk-sensitive currencies faired badly, amid an apparent shift from risk into safe-havens. Analysts said that with many market participants in Europe and the Asia Pacific region still on holiday amid multiple market closures, traders shouldn’t read too much into Monday’s out-of-synch FX market moves.
Nonetheless, the safe-haven bid that support the yen at one point sent GBP/JPY below 155.00 from earlier highs near 156.00. The yen bid has eased somewhat in recent trade, enabling GBP/JPY to recover back towards the 155.50 mark, where it trades lower on the day by about 0.2% versus earlier losses of more than 0.5%. Monday’s price action confirms the 155.00 level as an important area of near-term support, having acted as a good intra-day buy level now for three successive sessions. If stocks and yields can keep on pushing higher as market participants express a sunnier take on the 2022 outlook as Omicron worries subside, short-term GBP/JPY bulls could push the pair back to 156.00.
Medium-term bulls should beware that any push past 156.00 could tip GBP/JPY into overbought territory. The 14-day Relative Strength Index (RSI) is currently at 66, close to the 70 level above which currency pairs are often viewed as overbought. Indeed, over the course of the last two weeks, the pair has rallied more than 4.0% (from under 150.00). Some consolidation might, thus, be in order, before the pair has a run at last year’s 158.00 highs. But with the BoJ as dovish as ever and the BoE likely to implement multiple further rate hikes in 2022, the risks this year are to the upside.
- EUR/USD bears eye a run towards the imbalance of price all the way down to 1.10 the figure.
- For the meanwhile, the dynamic support is holding up the bears.
EUR/USD has been in a long-term downtrend since the middle of 2021. For the weeks ahead, there is a bias towards 1.10 and the following illustrates this in a top-down analysis.
The weekly chart has made a significant retracement to test the vicinity of 50% mean reversion. This leaves the focus on the downside in accordance with the dominant bearish trend.
EUR/USD weekly chart
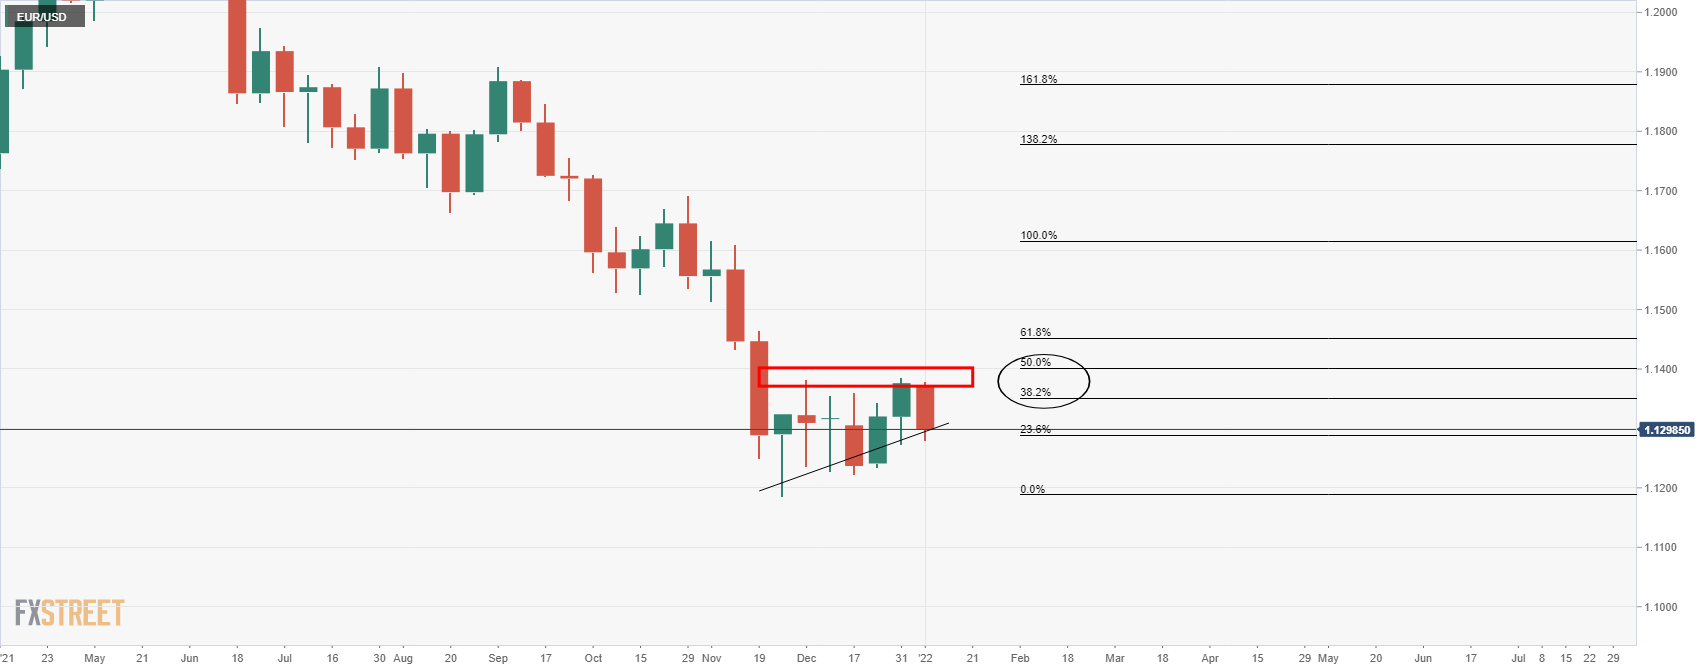
However, there is still an imbalance of price that could yet be mitigated prior to further downside.
EUR/USD daily charts
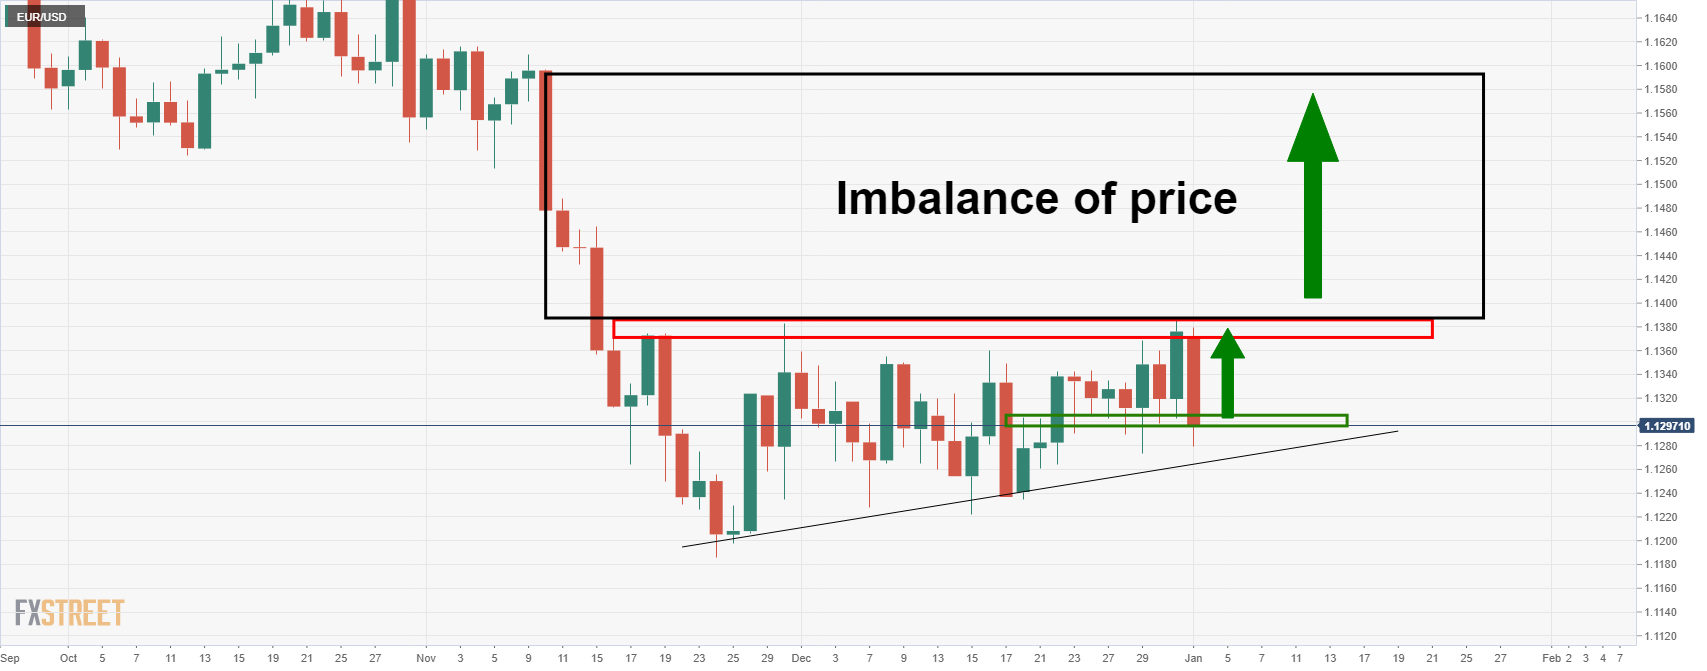
Should the bulls break the resistance on the daily chart, then there will be prospects of a continuation to mitigate some of, if not all of, the imbalance of price as illustrated above.
On the other hand, considering the bearish trend, a break of both horizontal and dynamic support would reveal the downside imbalance as follows:
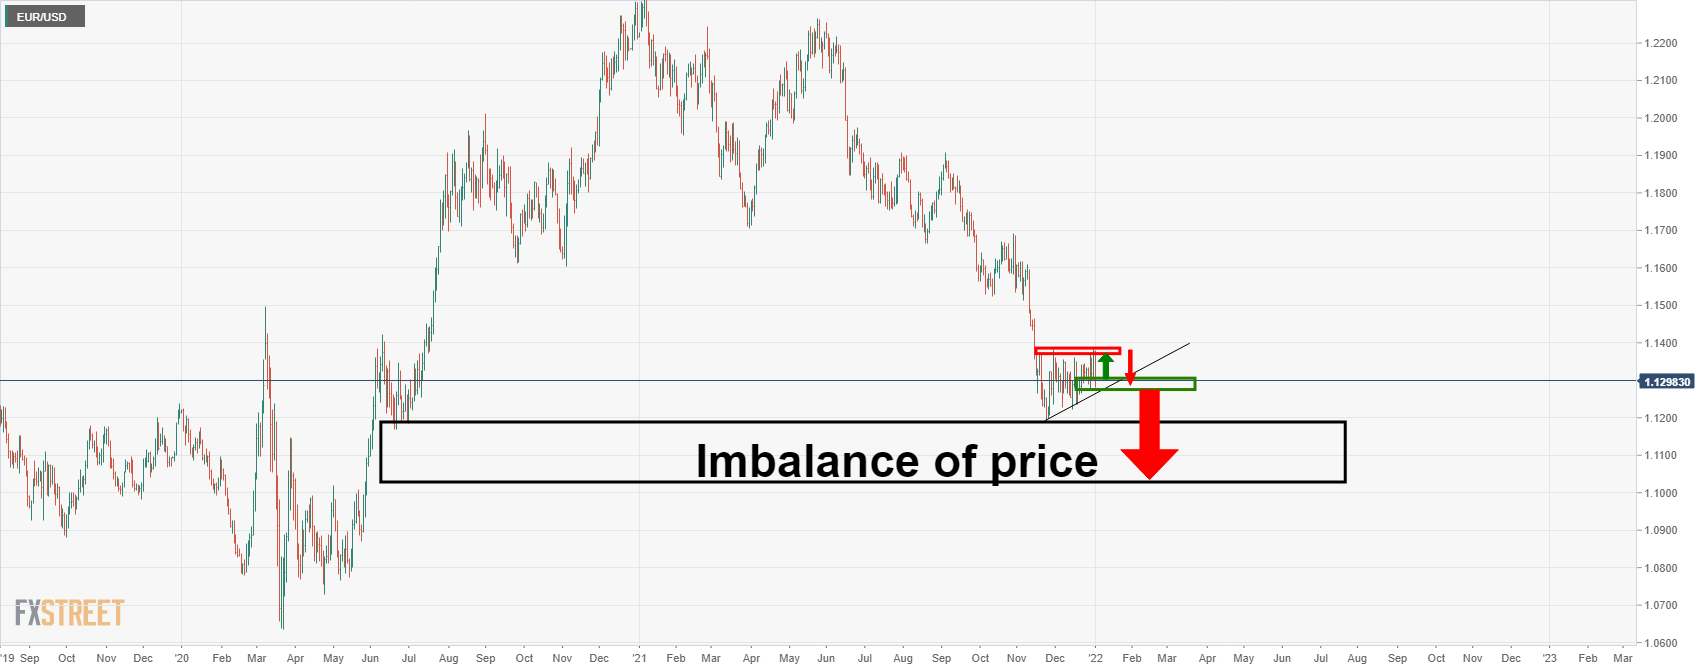
In any case, both areas of imbalance will be filled eventually:
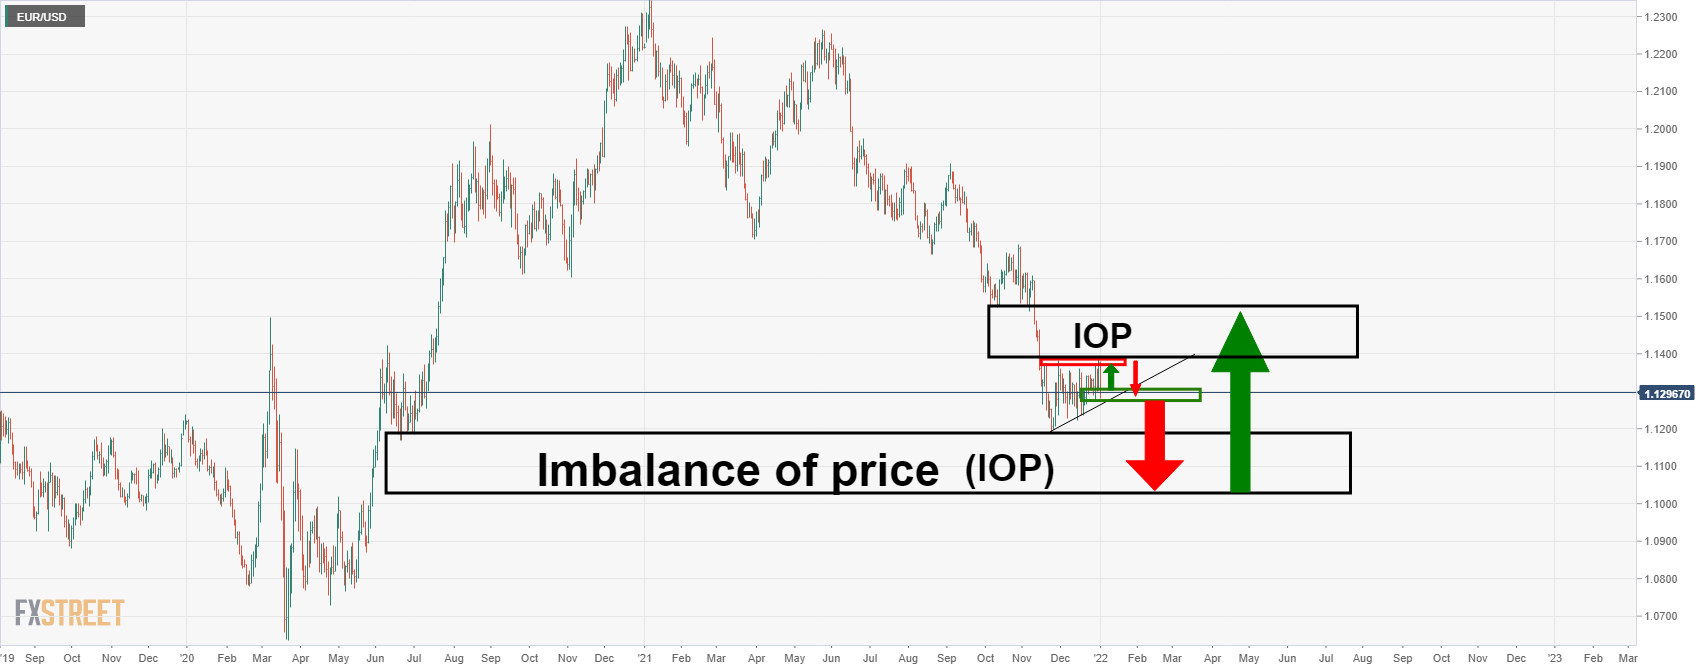
The higher probability is to trade with the trend. In the above scenario, a bearish breakout of the dynamic support opens risk towards 1.10 the figure for the weeks ahead.
What you need to know on Tuesday, January 4:
The greenback is the best performer on Monday, appreciating against all of its major rivals on the back of soaring US government bond yields. The yield on the 10-year US Treasury note kick-started the day at 1.53%, jumping to 1.635% mid-US afternoon, holding nearby as the day comes to an end.
Coronavirus-related concerns dampened the market’s mood as the Omicron variant is indeed a tsunami of contagions as the WHO anticipated a couple of weeks ago, affecting not only the northern hemisphere. So far, governments have avoided imposing restrictions, but the situation may worsen if the health systems begin to stress.
US stock advanced despite the dismal mood, with the DJIA adding over 100 points.
The EUR/USD pair trades a few pips below the 1.1300 level, while GBP/US lost the 1.3500 threshold. Commodity-linked currencies edged lower vs the greenback, with AUD/USD trading around 0.7190 and USD/CAD currently at 1.2754.
The dollar appreciated even against safe-haven assets, with USD/JPY trading above 115.00.
Gold plunged to 1,798.29, ending the day at around $1,802. Crude oil prices were little changed on a daily basis, recovering from an intraday dip. WTI settled at around $76.00 a barrel.
Shiba Inu, MATIC, Terra and Solana top the list of cryptocurrencies offering high returns
Like this article? Help us with some feedback by answering this survey:
- Spot gold prices have fallen back sharply on Monday from around $1830 to the $1800 area as yields rise sharply.
- Upside has been most pronounced in the long-end for both real and nominal yields, as Omicron-worries are priced out.
A sharp rise in long-term US real and nominal bond yields has triggered heavy selling pressure in spot gold (XAU/USD), with prices slumping back from Asia Pacific levels around $1830 to current levels over 1.5% lower at $1800. For now, spot prices Whilst the short-end of the US yield curve is enjoying solid gains with 2s up about 4bps to post-pandemic highs near 0.80% as traders bet more confidently on near-term Fed hawkishness, the real action is occurring at the long-end. 5s are up over 10bps to 1.36%, 7s are up 12bps to 1.55%, 10s are up 13bps to 1.63%, as are 30s which have moved above 2.0% for the first time since November.
More important for gold given its negative correlation to real yields, 10-year TIPS are up nearly 10bps and probing the -1.0% level again. Recall that when real yields rise, the opportunity cost of holding non-yielding gold also rises, dimming its appeal. The surge in yields appears to have its roots in a surge in confidence about the long-term outlook for the US economic recovery, despite the ongoing risks presented by Omicron.
Market participants have ignored negative headlines about schools in the US delaying post-Christmas holiday restarts and are focusing on the fact that the number of deaths and hospitalisations, despite record infection rates in the US, Europe and UK, remain low. As a result, governments seem more reluctant than in the past to reimpose lockdowns. All of this optimism is not only hurting gold’s appeal from the yield standpoint, but also as a safe-haven asset.
The move higher in US bond yields essentially marks a return to pre-Omicron emergence levels. Whilst short-end rates are at post-pandemic highs on Fed rate hike expectations, 10s and 30s still have some way to go (the former hit 1.77% last March and the latter surpassed 2.50%). Markets are in a very optimistic mood on Monday as the new year gets underway, with US equities near-record highs as the likes of Tesla and Apple surge (the latter the first company to hit the $3T market capitalisation mark). Should yields continue to rise as Omicron worries subside, gold could be in trouble.
Bank views
Given the new year is just getting underway, it's worth taking some time to assess the outlook of some banks for gold. BNP Paribas “remain bearish on gold prices in 2022, given the rising U.S. rates environment”. “While the price could rise further in the near term”, the bank adds, “we forecast it to fall to $1,800 per ounce by the end of the first quarter, $1,650 by the end of 2022 and $1,600 by the end of 2023”. Citi is also bearish, seeing the precious metal “averaging about $1,685 throughout 2022, driven by a combination of dollar strength and higher U.S. real yields”.
Goldman Sachs warns that “gold may fare better if inflation concerns build further and central banks are perceived to be accommodating more of that shock, particularly since positions appear to have been materially reduced”. TD Securities agree, saying they “think gold continues to do well, mainly because we expect inflation to be quite elevated and we continue to expect significant monetary accommodation for the foreseeable future, which will result in highly negative real rates across much of the yield curve”.
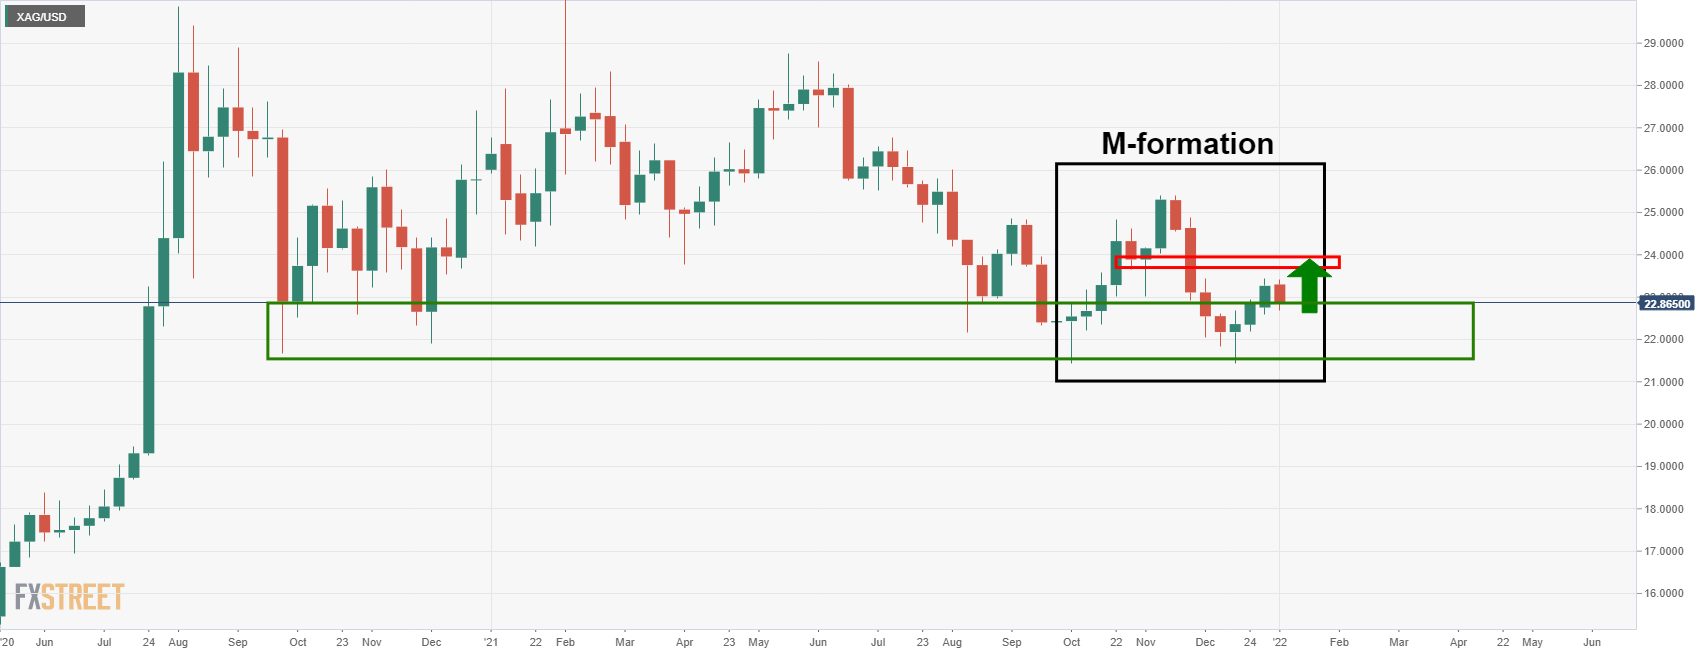
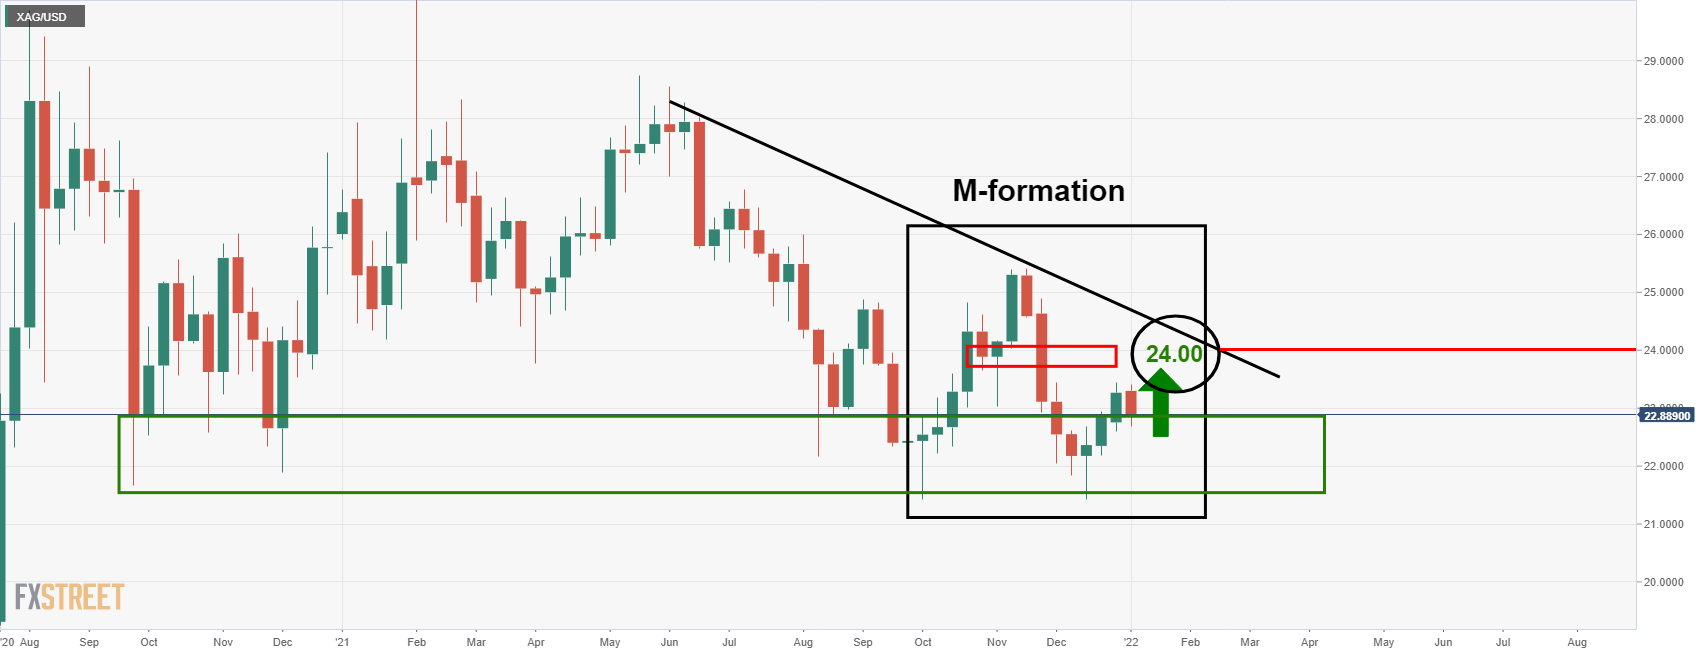
- XAG/USD bulls are moving in on following a sharp sell-off.
- The weekly M-formation is compelling as with eyes on 24 the figure.
Silver is rising in a corrective phase. The weekly M-formation is drawing the bulls in towards the neckline near 23.89. However, we have seen a sharp weekly rejection to the downside near 23.50.
Silver weekly chart
The bulls will need to step up at this juncture as the price heads towards a dynamic support area on the lower time frames as follows:
Silver H4 chart
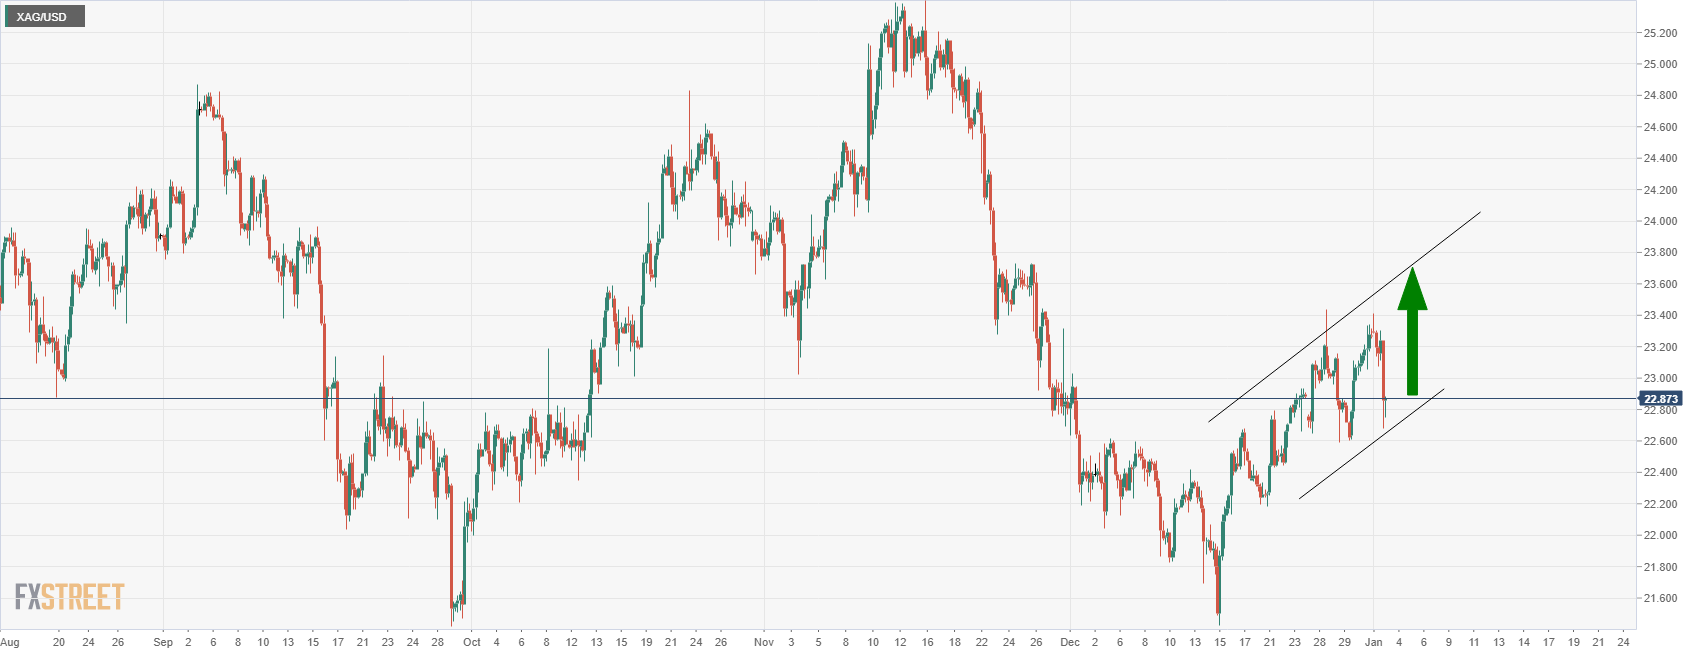
As illustrated, the price is climbing within a bullish channel. The 22.60s is offering support and bulls need to now tale control beyond the 23.40s.
Silver, H1 chart
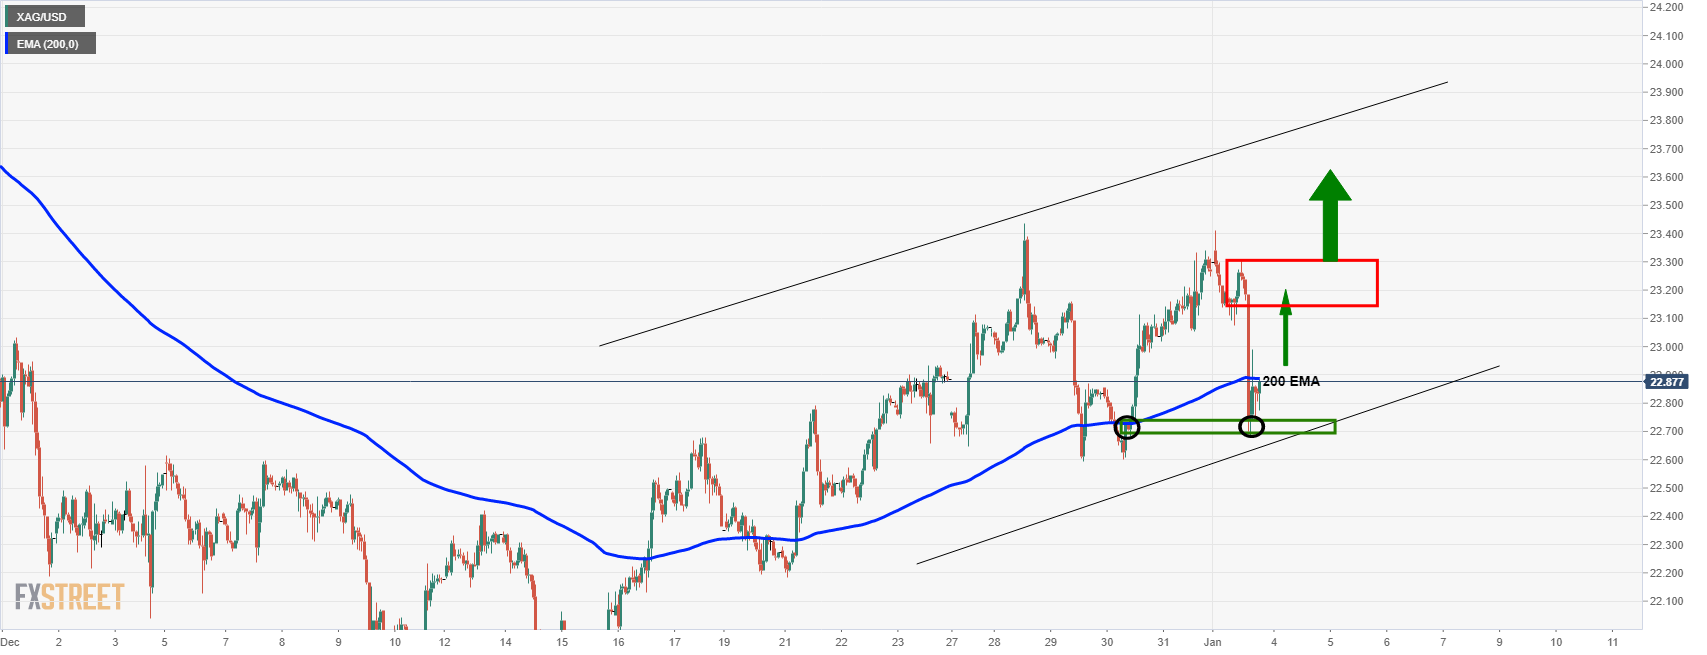
Froman hourly perspective, the price is taking on the 200 EMA following a sharp move into the end of December order block near the lows of the day. A break of the 200 EMA will leave the bulls in good stead to take back control with the broader corrective trend. A break of the resistance will open risk to the M-formation's neckline as illustrated above. Bulls can target 24.00:
- GBP/USD is on the backfoot as the BoE expectations are dialled dback.
- Covid, Brexit and UK politics are in focus and weight for the pound.
- Technically, the pound has broken below a critical support line.
GBP/USD has started out the week on the backfoot. The pair is currently down some 0.44% but off the lows of the day located at 1.3430. The price has recovered to near 1.3470 after falling from 1.3535 earlier on the day.
There are prospects of a deeper run towards 1.34 the figure for the sessions ahead although a run on 1.35 the figure and nearby liquidity are still on the table for the meantime. This is illustrated below under technical analysis.
Meanwhile, from a fundamental perspective, full markets will not return until Tuesday with much of the world's banks on holidays still observing New Year's day that fell on a weekend. Volumes are therefore thin and true economic drivers will not kick in until Tuesday.
In this regard, the greenback remains rangebound with many markets remaining on holiday. DXY is up by some 0.65% and now trading above 96 after rallying within the 95.625/327 range. The index stays in the middle of the 95-97 trading range that has largely held since mid-November.
BoE hike expectations dialled back
The British pound has therefore run out of steam near 1.3550 as Bank of England tightening expectations have fallen back a bit. Coronavirus, domestic politics and Brexit are a risk to growth prospects.
Brexit will come roaring back into the headlines this week. A senior French official said that “At the start of January, January 4 to be precise, we will have meetings with the EU commissioners to define the process and the measures that need to be taken. Between January 4 and January 6, there are very important meetings to begin the legal process against the UK”
As for covid, so far plans are unchanged but social distancing is already happening voluntarly and hospitals and under pressure. The BBC reports that ''Prime Minister Boris Johnson said that England will continue with its Plan B Covid measures amid growing pressures on the NHS. He said it would be "folly" to think the pandemic was over and warned that pressure on hospitals would be "considerable" over the coming weeks.''
GBP/USD technical analysis
The bias is for a move to the upside in a correction of the recent bearish impulse followed by a downside continuation to test 1.34 the figure.
However, the 15-min chart is offering a bearish reversion pattern and the price is meeting 15-min resistance:
GBP/USD 15-min chart
As illustrated above, the price could be destined for a meanwhile move to the downside prior to further upside as follows:
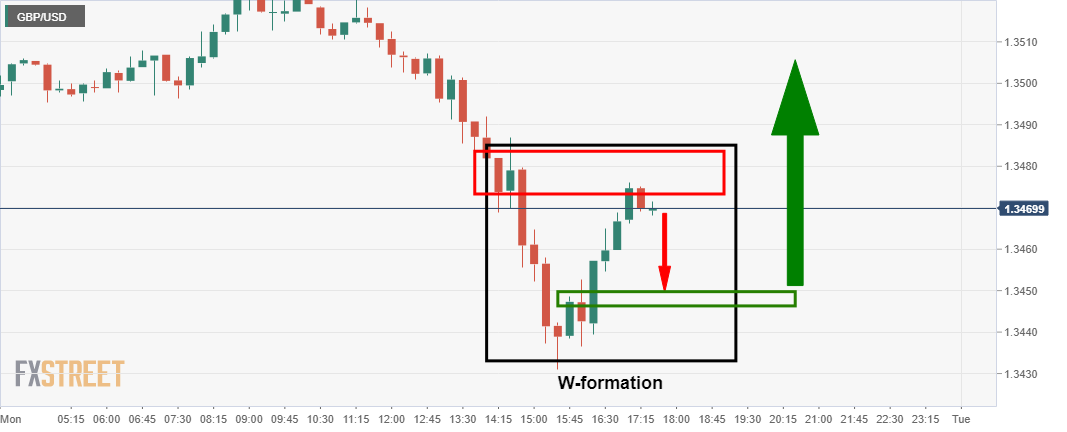
GBP/USD H4 chart
The M-formation is a bullish reversal pattern seen on the 4-hour chart.
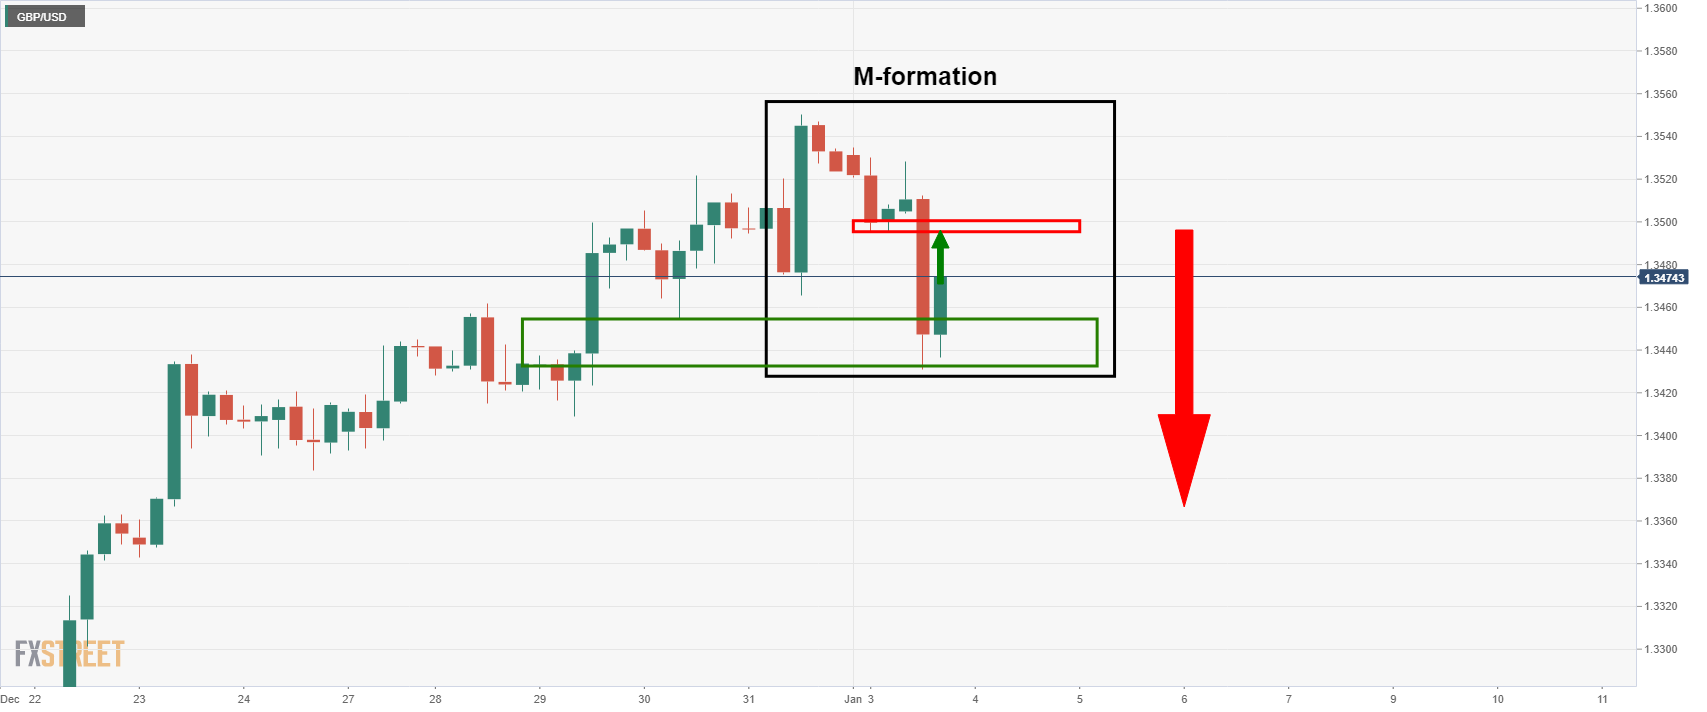
GBP/USD H1 chart
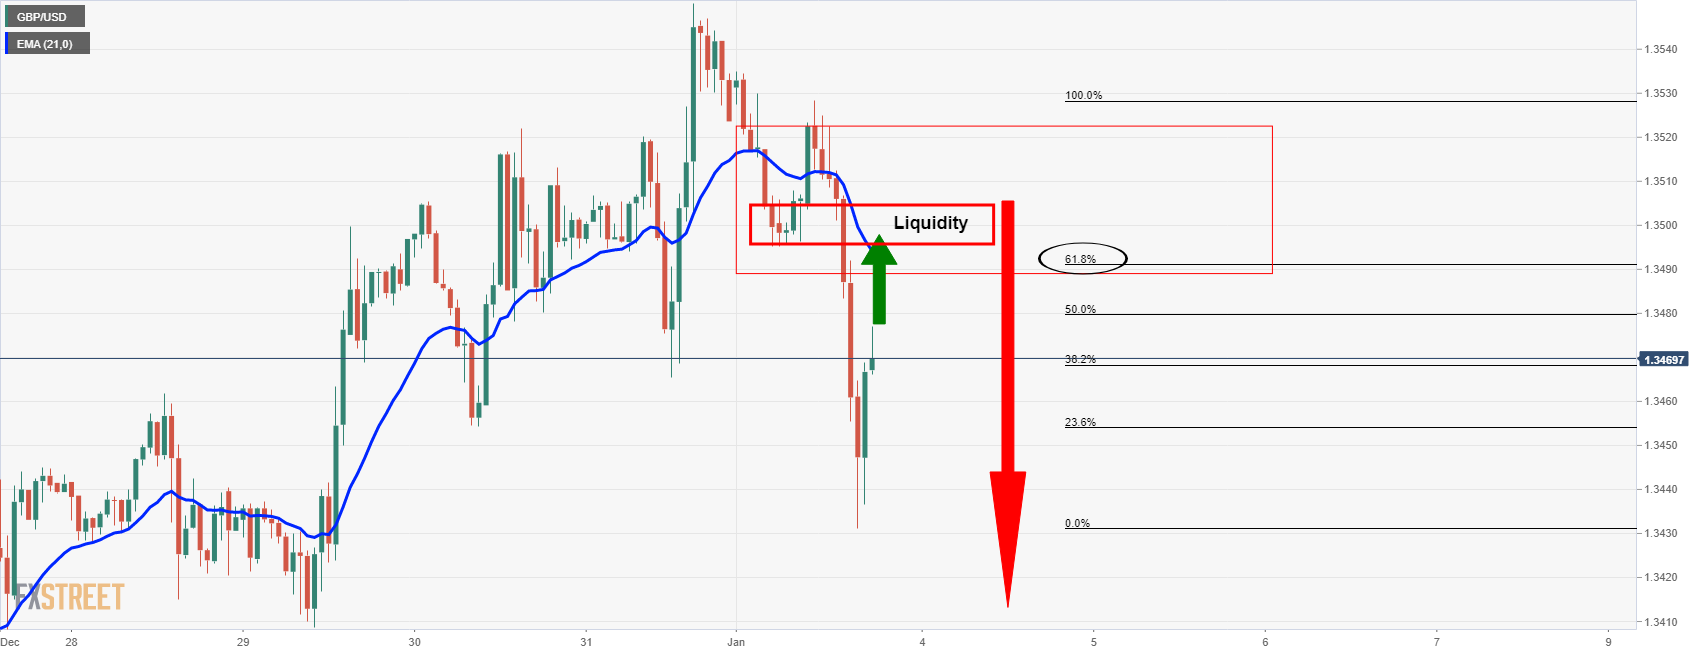
The hourly chart's bearish impulse could be where the trade is. The bears will be keen to see a discount from this juncture into the liquidity zone around 1.35 the figure. A discount will be on the table for a downside continuation towards a test of 1.34 the figure.
Having said that, the price has already corrected a significant length of the bearish impulse and has reached a 38.2% Fibonacci retracement level as follows:
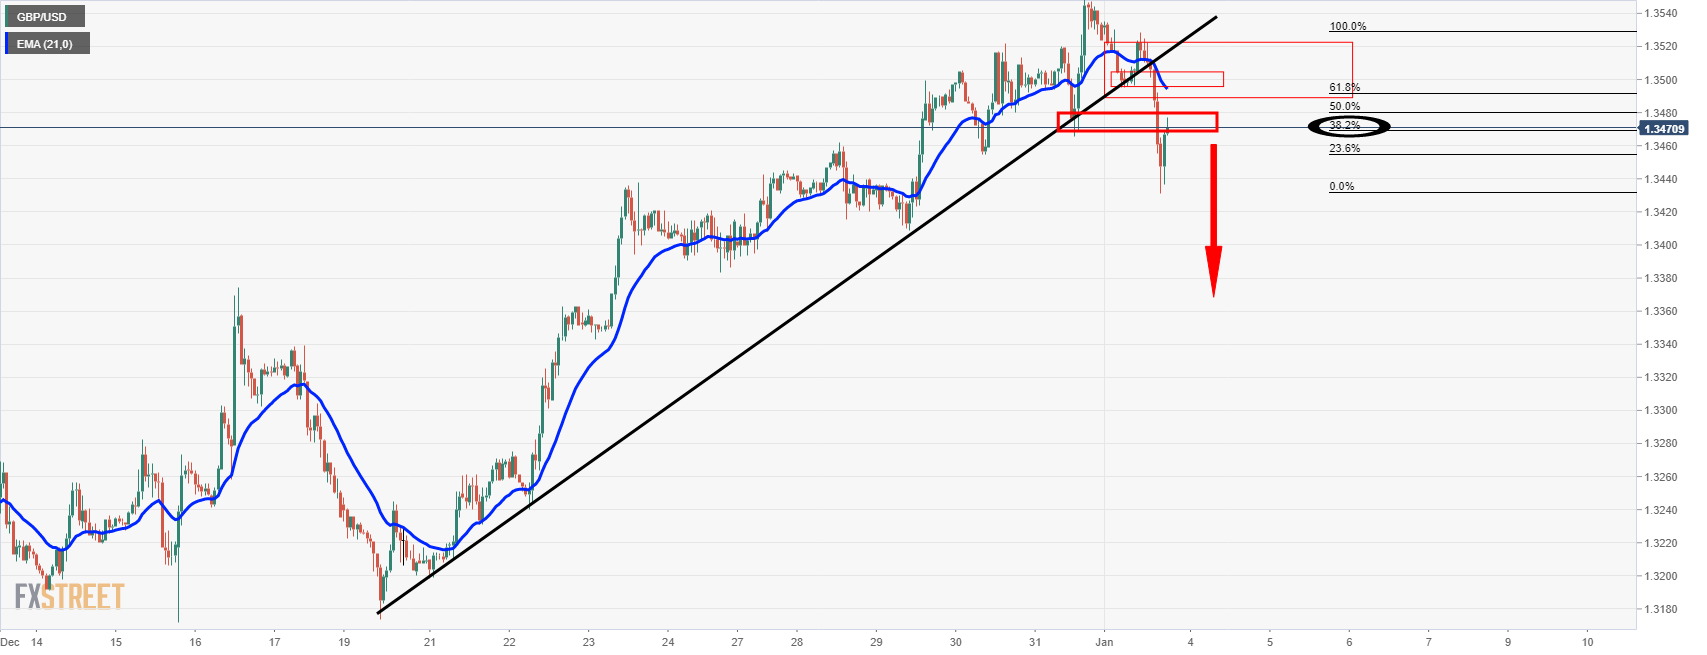
Bears are already engaging, therefore, there are prospects of a downside continuation already and a retest of 1.35 liquidity and the counter-trendline may not be seen so soon.
- NZD/USD has dropped back sharply in recent trade, falling under 0.6800 as the dollar broadly picked up.
- The main drivers this week will be the key US December jobs report, as well as the December ISM surveys.
NZD/USD has stabilised in recent trade after pulling back sharply from Asia Pacific/early European session highs in the 0.6840 area to current levels in the 0.6780s. The 21-day moving average at 0.6786 seems to be offering some support where last week’s lows at 0.6790 failed. FX markets have been choppy and difficult to make sense of on Monday, with the dollar and yen seemingly gaining ground amid a safe-haven bid, but typically more risk-off resilient currencies like CHF and EUR suffering alongside the more risk-sensitive currencies like NZD, AUD and CAD.
Liquidity conditions remain thin/somewhat impaired amid the absence of many Asia Pacific and European market participants. Markets in the UK, Australia, New Zealand, Canada, Japan and China were all closed on Monday. A break below support around current levels for NZD/USD would likely signal continued drop back towards December lows around 0.6700. NZD/USD’s failure to break above trendline resistance last week in the mid-0.6800s seems to have been taken as a bearish signal. The main drivers of the pair and FX markets more broadly this week will be the key US December jobs report, as well as the December ISM surveys.
At current levels, NZD/USD’s Z-score to 200DMA is roughly -1.8, meaning it trades about 1.8 standard deviations below its 200DMA. As recently as mid-December, the pair’s Z-score was closer to -3.0. Looking back at the last five or so year, apart from during times when FX markets were undergoing violent repricing (such as during the March 2020 Covid-19 panic), a Z-score near or below -2.0 has been an indicator that conditions have become oversold and, at the very least, some consolidation lays ahead.
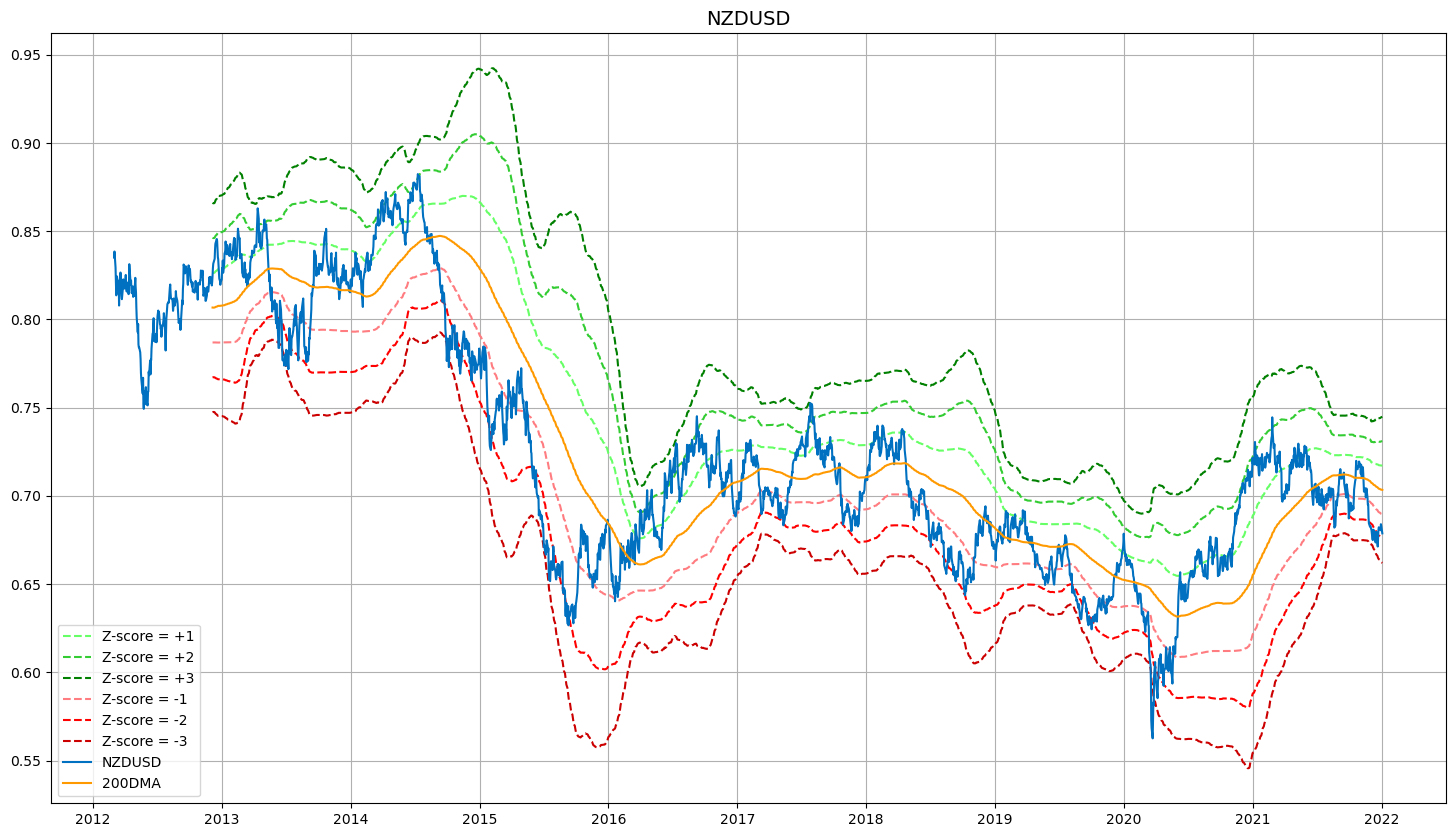
And consolidation has been just what NZD/USD has seen over the past few weeks. Whether this can continue into early 2022 is another question as the Fed primes itself for a potential rate hike as soon as March. NZD/USD’s Relative Strength Index score of close to 43 suggests there is plenty of room for some further selling pressure. But the RBNZ is ahead of the Fed when it comes to policy normalisation and looks set to extend its lead, a fact that seems to have e been neglected by FX markets as of late. Perhaps the NZD isn’t as vulnerable to the dollar’s advances as say the euro, yen and Swiss franc, central banks are decisively more dovish.
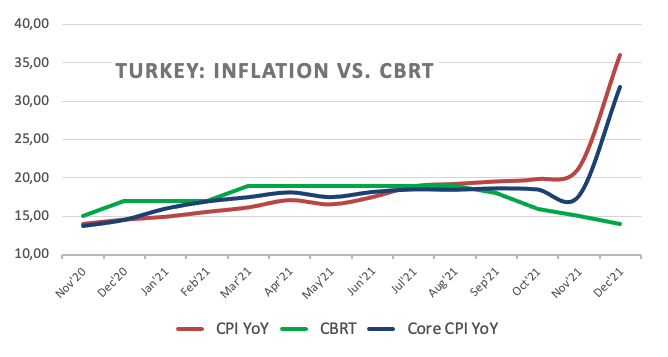
Turkish President Recep Erdogan said on Monday that he was saddened by the high level of inflation in 2021, but noted that he had brought down inflation in the past and would do so again. Erdogan added that he would investigate the exorbitant price hikes and blamed the high inflation on rising commodity prices and the weaker exchange rate. Erdogan added that he would add additional support to civil servant wages.
His remarks come after data on Monday revealed inflation in Turkey topping 30% YoY in December 2021. Inflation in Turkey surged last month due primarily to a massive near 30% MoM drop in the value of the lira versus the US dollar over the course of the month that took the lira's Q4 2021 losses to more than 35%. Turkey has faced a crisis of confidence in its currency in recent months as investors flee the country after the CBRT axed rates from 19.0% in September to 14.0% in December despite surging inflation.
This has sent real yields in Turkey into deeply negative territory, hence the capital flight that has pressured the exchange rate. The lira was offered some respite after the Turkish government introduced a new policy to compensate Turkish savers against losses as a result of lira depreciation, which some analysts saw as a sort of semi-alternative to rate hikes. This allowed USD/TRY to fall back from above its December record highs above 18.00. The currency pair now trades around 13.00, but the prospect of further decline is limited so long as the CBRT rate remains so far under inflation.
Market Reaction
The lira ignored Erdogan's comments. No one is expecting the Turkish President to lose faith in his "new economic programme" of pressuring the CBRT to cut rates despite high inflation just yet.
- US dollar jumps as US 10-year yield hits 1.60% and the 30-year 1.99%.
- USD/JPY rises for the fourth day in a row, eyes 115.35/50.
The USD/JPY continues to move to the upside, and it has reached a strong resistance area located between 115.35 and 115.50. It printed a fresh five-week high at 115.36, slightly above the previous top boosted by a stronger rally across the board.
The DXY is up 0.60% so far on Monday, trading above 96.20. Equity prices are modestly higher in Wall Street. The relevant moves at the beginning of the year come from the bond market as Treasuries slide. The US-30 year is at 1.999%, the highest in a month, while the 10-year rose above 1.61%. The 2-year stands above 0.80%, at the highest since March 2020.
Economic data from the US on Monday showed no surprises on Monday. The Markit Manufacturing PMI (final) came in at 57.7 in December, below the flash reading of 57.8. On Wednesday, the ADP employment report is due and on Friday the non-farm payroll. “The recent COVID surge likely came too late to prevent a strong and above-consensus reading for payrolls in this week's report for December”, argue analysts at TD Securities. They forecast an increase in payrolls of 500K.
Looking at recent highs
The USD/JPY peaked in November at 115.51, a multi-year high. From the current level to the mentioned high, resistance is expected to emerge. With the pair around 115.30, the positive momentum remains intact.
On the contrary, a slide under 115.00 would clear the way for a correction, with support levels seen at 114.75 and 114.60.
Technical levels
- USD/CAD has surged back to the north of the 1.2750 mark, its biggest one-day gain since November.
- The dollar is strengthening amid a surge in US yields that is weighing most heavily on risk-sensitive currencies like CAD.
It’s been a choppy, mixed start to the year in global financial markets, with equities higher in the US and Europe, oil prices swinging between gains and losses, whilst other commodities are hammered by a significantly stronger US dollar. The US dollar seems to be being driven by a safe haven bid that seems concentrated purely in FX markets (otherwise stocks would be lower), and this has also seen the yen supported (hence why they are the two best performing G10 currencies). Commodity and risk-sensitive currencies such as the Canadian, Australian and New Zealand dollar’s have all been getting hit hard and are each down 1.0-1.2% on the day versus the buck.
There isn’t one specific news event/fundamental catalyst behind Monday’s indecisive, mixed market tone. Notably, for FX markets, US bond yields are surging, with the 10-year up 10bps on the day to 1.60%. Unusually, this doesn’t seem to be having an effect on the outperforming yen (which is typically highly vulnerable to higher US yields), but it seems to be weighing on the rest of the G10. With Canadian, Australian and New Zealand bond markets shut on Monday for belated New Year’s Day holiday, CAD, AUD and NZD have all been robbed of the protection of a move higher in their own respective government bond yields that might have shielded the currencies from the dollar’s US yield rally-driven advances.
As to why US yields are surging, analysts at TD Securities said “it appears the sell-off today is being driven by the market viewing the Federal Reserve as still being likely to hike by mid-2022 despite the surge in COVID cases”. It's worth adding “that it's still early in the New Year and most of the world is off for the holiday, so thinner liquidity may certainly be exacerbating market moves” the analyst said.
In the last few hours, USD/CAD has surged back to the north of the 1.2750 level, having started 2022 underneath 1.2650. That amounts to an on-the-day gain of about 1.0%, which marks the pair’s best one-day performance since 26 November, the day the world first panicked about Omicron. The pair is likely to find some resistance in the 1.2800 area, given this area coincides with the 21-day moving average and has been an important balance area in the past. In the grand scheme of things, Monday’s move isn't significant, as it leaves USD/CAD trading close to the centre of December’s 1.2600-1.2950ish ranges.
- US dollar gains momentum during the American session as US yields rise.
- Cable trims last week gains moves further away from monthly highs.
The GBP/USD pair failed to hold above 1.3500 and tumbled, reaching 1.3428, the lowest level since last Wednesday. Cable remains near the daily low, under pressure amid a stronger US dollar across the board.
After a three-day rally, GBP/USD is falling sharply trimming last week gains. From the highest level in almost two months, it hit last week at 1.3551, cable is now under pressure, back under the 55-day simple moving average. The 1.3400/05 zone is the next support to consider.
The decline of GBP/USD took place amid a rally of the US dollar. The greenback benefited from higher US yields. The 10-year rose to 1.60%, the highest since November 26, the 30-year stands at 1.97% at the highest in a month. The 2-year Treasury yield reached the highest since March 2020.
Economic data released in the US showed no surprises. The final Markit Manufacturing PMI came in at 57.7, below the flash reading of 57.8. On Wednesday the ADP employment report is due and on Friday the non-farm payroll.
Technical levels
- The S&P 500 is trading a tad higher on the first session of the year, having seen choppy trade post-open.
- Most banks are bullish on the index for 2022.
US equities saw a choppy start to first trading session of 2022, with the S&P 500 index swinging between 4795 highs and sub-4760 lows in a matter of minutes in wake of the 1430GMT equity cash open. Those lows under the 4760 level were the lowest such levels that the index has traded at in one week. However, at current levels around 4780, the index is trading with modest on-the-day gains of about 0.3%. That means the index is only about 0.7% below the record levels near-4810 it printed last week, indicative of the fact that US equity market sentiment remains very strong at the beginning of the new year.
To the downside, S&P 500 bulls may jump on any dip back to support in the 4750 as a buying opportunity, though the true dip-buying has happened at the 21-day moving average in recent weeks. It proved a great entry point for short-term bulls twice in December. In terms of the other major US bourses, the Nasdaq 100 has been choppy within a 16.3K to 16.5K range and is about 0.4% higher on the day, whilst the Dow is attempting to poke back above 36.5K and trades higher by about 0.25%. The S&P 500 CBOE volatility index, often referred to as Wall Street’s “fear gauge”, is trading subdued just above recent lows in the 17.00 area, only a few points above 2021 lows in the 14.00-15.00 region and well below recent Omicron-uncertainty induced highs in the mid-30s.
Bank views
Given the turn of the year, banks have been releasing their views on how the S&P 500 will perform in the year ahead. Many banks are bullish. BNP Paribas say they “expect to see some compression of price/earnings ratio multiples for the S&P 500 as rates rise... However, strong earnings growth could still translate into about a 10% total return, in our view”. As such, the bank year-end forecast for the S&P 500 is 5,100.
BNY Mellon say “while the kind of returns we’ve seen in the past three years may not be repeated in 2022, we still believe equity markets can deliver another solid year – especially if economies and earnings continue to grow, without inflation becoming a longer-lasting problem”. Their year-end target for the S&P 500 is 4900-5100, which translates to a gain of about 5-10%.
JP Morgan target 5050 by the end of 2022. “This represents a smaller percentage appreciation compared to our 2021 forecast; however, we do think international equities, emerging markets and cyclical market segments will significantly outperform and deliver two- to three-times higher returns” the bank says. “Increasing interest rates and marginally tighter monetary policy should be a headwind for high-multiple markets such as the Nasdaq”.
Unicredit expect the S&P 500 to end 2022 at around 5100. “This would be around 9% above current levels” the bank says and “should be mainly driven by three important sectors in the U.S.: tech, financials and health care. Apart from solid earnings growth estimates, these sectors are highly likely to benefit from a high volume of share-buybacks in 2022”.
Not all banks agree, however. Morgan Stanley Wealth see the S&P 500 dropping to 4400 by the end of the year. “The core of our cautious 2022 view on the S&P 500 is our belief that during a midcycle transition, price-earnings ratios typically compress” the bank says. “As the market’s price-earnings ratio reverts to a more normal 18 from the current 22.5… If that is correct, the S&P 500 will be 3% lower a year from now even with an expected 14% gain in earnings”.
- Final Markit Manufacturing PMI fell to 57.7 in December from 58.3 in November.
- That was slightly below the flash reading of 57.8.
According to IHS Markit, final December Manufacturing PMI for the US was 57.7. That marked a slight downwards revision from the flash estimate of 57.8 and was below October's 57.8 reading.
Comments from Siân Jones, Senior Economist at IHS Markit:
“December saw another subdued increase in US manufacturing output as material shortages and supplier delays dragged on. Although some reprieve was seen as supply chains deteriorated to the smallest extent since May, the impact of substantially longer lead times for inputs thwarted firms’ ability to produce finished goods yet again."
“While shortages remained significant, the end of the year brought with it some signs that cost pressures have eased. The uptick in input prices was the slowest for six months, and firms recorded softer increases in selling prices amid efforts to entice customer spending.”
Market Reaction
The S&P 500 plunged at the time of the release, however, this seems to have more to do with volatility shortly after the first US equity open of 2022, rather than being to do with the latest PMI report.
- EUR/USD slips back to the 1.1300 zone, or new daily lows.
- The greenback gains on higher US yields across the curve.
- US Manufacturing PMI eased a tad to 57.7 in December.
Further improvement in the US dollar keeps the risk appetite subdued and sends EUR/USD to the area of daily lows around 1.1300 at the beginning of the week.
EUR/USD weaker on dollar strength
EUR/USD extends the rejection from recent tops in the 1.1380/90 band and slowly approaches the 1.1300 neighbourhood, where the 20-day SMA also coincides.
The deep knee-jerk in spot came on the back of persistent dollar upside, which is in turn sustained by the move higher in US yields.
Earlier in the euro docket, Markit’s final Manufacturing PMI in Germany came at 57.4 in December and 58.0 in the broader Euroland. Across the pond, the Manufacturing PMI dropped marginally to 57.7 in the same period ahead of November’s Construction Spending.
EUR/USD levels to watch
So far, spot is losing 0.67% at 1.1306 and faces the next up barrier at 1.1386 (monthly high November 30) followed by 1.1464 (weekly high Nov.15) and finally 1.1520 (200-week SMA). On the other hand, a break below 1.1273 (weekly low Dec.29) would target 1.1221 (weekly low Dec.15) en route to 1.1186 (2021 low Nov.24).
- AUD/USD has been under pressure in recent trade as risk-sensitive currencies are sold and safe-havens (including USD) are bought.
- Volumes were light with Australian and UK markets shut but are picking up now the US session gets underway.
AUD/USD has seen quite a sharp pullback in recent trade, dropping from Asia Pacific levels near 0.7250 to current levels underneath 0.7220 upon the arrival of US market participants ahead of the US open. Volumes during the Asia Pacific and early European sessions were much lower than normal and roughly in line with that seen during last week’s thinned holiday trade given the closure of Australian and UK financial markets on Monday. Thus, as trading volumes have started to pick up for the US session, markets seem to have found a little conviction, with the conviction in FX markets on Monday being a preference towards a stronger dollar.
This has weighed on the Aussie, which looks on course to test the key 0.7200 level shortly. At current levels, AUD/USD is trading about 0.7% lower on the session and is the worst performer amongst its G10 peers, with downside in the prices of key Australian metal exports (Copper -1.5%, Gold -1.0%) not helping. With the pair having dropped under short-term trendline support, more selling may well be in store.
The Aussie’s performance is broadly in fitting with G10 FX markets adopting a more defensive/risk-off bias on Monday, with the safe-haven dollar and yen outperforming despite stocks in Europe and the US (in pre-markets, at least) trading higher. There isn't any one theme or new developments that can be pointed at as to why FX markets are in a more risk-off mood, but traders may be taking some profit on risk-sensitive currencies after their recent run of strength.
Some are fretting about record Omicron infection rates in the UK, US and elsewhere and a potential surge in hospitalisations. Elsewhere, some have suggested the surge in the dollar versus some of its G10 peers could be down to a large rise on the day in US bond yields (10s up 9bps to near 1.60% and 2s up roughly 6bps to just under 0.80%). If this was the case, one would expect that USD/JPY (the most sensitive G10 pair to movements in rate markets) would be surging, which at the moment it isn’t.
Tensions between Russia and Ukraine remain elevated into the new year. Yohay Elam, an Analyst at FXStreet, explains how a Russian-Ukranian clash would affect markets and create trading opportunities.
An outright war remains a remote scenario and could trigger a rush to safe havens
“How will the Russia-Ukraine conflict impact markets? Basically, geopolitical worries tend to boost the safe-haven dollar and yen. The Swiss franc could also gain ground but to a lesser extent.”
“Ukraine does not possess critical resources and Western countries are likely to intervene in a conflict between Russia and Ukraine. Sanctions could push oil prices higher in the longer term, but probably not more than that.”
“Overall, a Russian invasion of Ukraine could trigger a dollar-selling opportunity.”
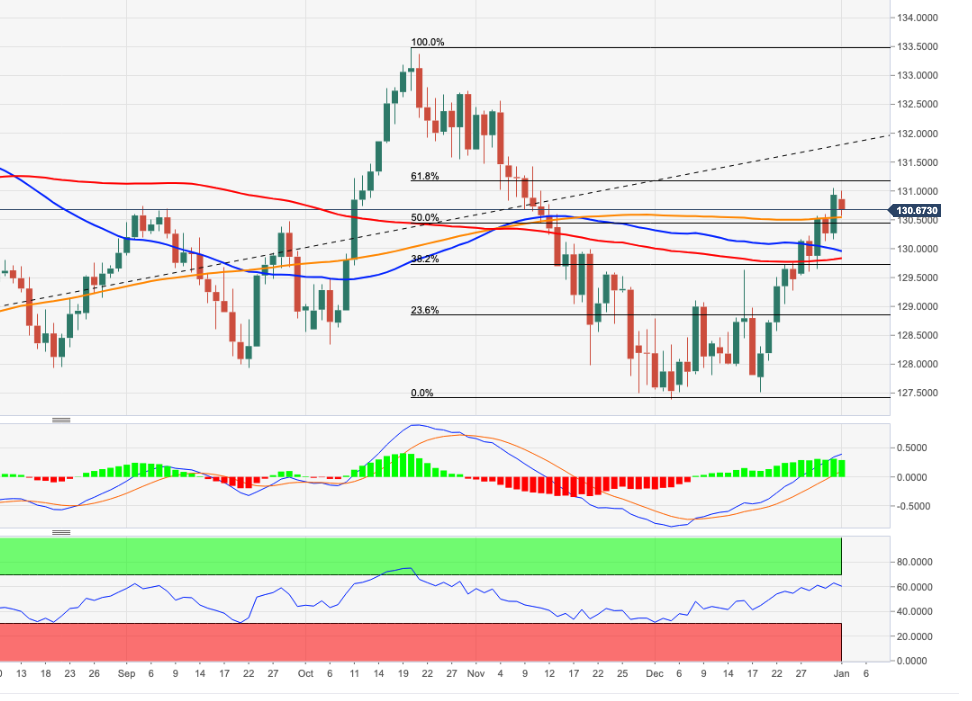
- EUR/JPY met a tough nut to crack at the 131.00 level.
- Higher US yields sustains the selling bias in the Japanese yen.
- The stronger dollar puts the risk complex under pressure.
After another failed attempt to surpass the 131.00 level, EUR/JPY came under pressure and receded to the mid-130.00s, where some initial contention turned up so far on Monday.
EUR/JPY looks to risk trends
EUR/JPY enters the new year on the defensive around 131.00 following two consecutive weekly advances, all after bottoming out in the 127.50/40 region in the last part of 2021.
The renewed bid bias surrounding the greenback put the risk-linked galaxy under pressure on Monday, helped at the same time by soaring US yields as market participants slowly return to the normality after the festive period.
The cross, in the meantime, looks to leave behind the key 200-day SMA, today in the 130.50 zone, to facilitate extra gains in the short-term horizon.
Earlier in the euro docket, the German and EMU final Manufacturing PMI came at 57,4 and 58.0, respectively, for the month of December. Later in the NA session, the final Manufacturing PMI is due seconded by November’s Construction Spending.
EUR/JPY relevant levels
So far, the cross is retreating 0.33% at 130.58 and a surpass of 131.02 (monthly high Dec.31) would expose 131.15 (Fibo level) and then 132.17 (Fibo level). On the downside, the next support comes at 130.50 (200-day SMA) followed by 129.79 (100-day SMA) and finally 127.51 (low Dec.20).
- A combination of factors prompted aggressive selling around gold on Monday.
- The prevalent risk-on mood acted as a headwind for the safe-haven commodity.
- Rising US bond yields, resurgent USD demand contributed to the intraday selling.
Gold witnessed aggressive selling on the first trading day of the new year and stalled a near three-week-old uptrend around the $1,830-32 supply zone, or the highest level since November 22. The intraday selling pressure picked up pace during the early North American session and dragged spot prices to a fresh daily low, around the $1,805 region in the last hour.
Signs that the Omicron variant might be less severe than feared and is unlikely to derail the economic recovery overshadowed concerns about the continuous surge in new COVID-19 cases. The optimism was evident from an extension of the recent bullish run in the equity markets, which was seen as a key factor that acted as a headwind for the safe-haven gold.
Meanwhile, the risk-on mood, along with the Fed's hawkish outlook triggered a fresh leg up in the US Treasury bond yields and further drove flows away from the non-yielding yellow metal. In fact, the yield on the benchmark 10-year US government bond ended 2021 with the largest rise since 2013 and shot to back closer to 1.58%, or over a one-month high on Monday.
Moreover, the so-called dot plot indicated that the Fed officials expect to raise the fed funds rate at least three times in 2022. The combination of factors allowed the US dollar to regain positive traction and recover a major part of Friday's losses. This further undermined demand for the dollar-denominated gold and contributed to the intraday slide.
With the latest leg down, the XAU/USD has now reversed last week's positive move and a subsequent slide below the $1,800 mark will set the stage for further losses. That said, traders might refrain from placing aggressive bets amid quiet holiday trading and ahead of important US macro data scheduled at the beginning of a new month.
This week's US economic docket highlights the release of ISM PMIs and the ADP report. The market focus, however, will remain on the closely-watched US monthly jobs report (NFP) on Friday. Hence, it will be prudent to wait for a strong follow-through selling before confirming that gold has topped out and positioning for any further depreciating move.
Technical outlook
From a technical perspective, a sustained break below the $1,800 mark might prompt some technical selling and turn the XAU/USD vulnerable to slide further. The downward trajectory could drag spot prices further towards the $1,785 horizontal zone en-route the next relevant support near the $1,770 region and December swing low, around the $1,753 area.
On the flip side, the $1,830-32 region should continue to act as a key barrier, which if cleared decisively should push gold prices further towards the $1,850 region. The upward trajectory could further get extended towards November 2021 swing high, around the $1,877 with some intermediate hurdle near the $1,870 area.
Gold daily chart
Levels to watch
- WTI recently slipped under $75.00 to one-week lows, as traders fret over surging Omicron infections and a potential hospitalisation surge.
- Rising OPEC+ and US output also weakens the bull case, with OPEC+ expected to agree to higher output this week.
- The 50DMA may thus continue to act as a significant area of near-term resistance.
Early optimism in oil markets that saw front-month WTI future at one point surpassing the $76.00 during early European trade has given way upon the arrival of US markets participants, with WTI having dropped under $75.00 recently. The main benchmark for US light crude oil now trades at its lowest since last Monday’s surge below key resistance in the $75.00 area and is down about 75 cents on the day (roughly 1.0%). The $75.00 area has so far failed to offer support, implying that oil may see further (technically driven) selling as short-term bears look for a test of the $74.00 level.
In terms of the major themes being cited as driving oil market price action at the start of the week and the first trading session of 2022, there is some focus on surging Omicron infection rates. As cases hit record highs in the UK, Europe and US, investors are bracing for a surge in hospitalisations. Even though the scientific community seems to agree that Omicron is roughly three times less likely to result in hospitalisation (per infection), its high transmissibility means the risk of hospitals filling up again remains worth considering. UK PM Boris Johnson warned on Monday that UK hospitals face considerable pressure in the coming weeks and options (i.e. the potential for tougher restrictions) are being kept under review.
This could be weighing on prices this morning. In terms of oil-specific news, there was some focus on news of a 200K BPD outage in Libya, which will last one week, due to maintenance, but this hardly matters in the grand scheme of things, hence why it didn’t offer prices lasting support. Oil markets are not expected to be as tight as they were a few months ago as OPEC+ and the US continue to raise output. Regarding the former; more OPEC+ sources said the cartel will stick to its 40K barrel per day per month output hike plans when they meet this week, meaning 400K more barrels per day as of February. The group meets on Tuesday to discuss output policy, after agreeing on Monday to appoint Kuwait’s Haitham Al Ghais as its new secretary-general. This appointment isn’t expected to have any bearing on policy.
Meanwhile, last Friday’s Baker Hughes rig count showed US oil and gas firms adding rigs for a 17th consecutive month (a record), while an EIA report showed US output rising 6% to just under 11.5M barrels per day in October, as US output recovered from hurricane outages in September. With the large oil market deficits experienced in mid-2021 seemingly now a thing of the past the case for WTI to return to its October highs in the mid-$80s is weaker. For now, that means it may be a struggle for WTI to get above its 50DMA, which has been offering solid resistance over the last week or so.
- USD/CHF staged a goodish rebound from the 0.9100 mark on Monday, or a near two-month low.
- The prevalent risk-on mood undermined the safe-haven CHF and acted as a tailwind for the major.
- Rising US bond yields benefitted the USD, which contributed to the intraday short-covering move.
The USD/CHF pair trimmed a part of its intraday gains and was last seen trading around the 0.9135 region heading into the North American session.
A combination of supporting factors assisted the USD/CHF pair to defend and attract some buying around the 0.9100 mark on Monday. Despite the continuous surge in new COVID-19 cases, investors remain optimistic over signs that the Omicron variant might be less severe than feared and is unlikely to derail the economic recovery. This was evident from a generally positive tone around the equity markets, which undermined the safe-haven Swiss franc.
On the other hand, the US dollar drew some support from a fresh leg up in the US Treasury bond yields and reversed a major part of Friday's decline to the lowest level since November 30. In fact, the yield on the benchmark 10-year US government bond shot to 1.54%, back closer to a near one-month high touched last week. This, along with the Fed's hawkish outlook further acted as a tailwind for the greenback and provided a goodish lift to the USD/CHF pair.
The uptick, however, lacked bullish conviction and remained capped amid quiet holiday trading. Traders also seemed reluctant to place aggressive bets, rather preferred to wait on the sidelines ahead of important US macro data scheduled at the beginning of a new month. This week's US economic docket highlights the release of ISM PMIs and the ADP report. The market focus, however, will remain on the closely-watched US monthly jobs report (NFP) on Friday.
In the meantime, the US bond yields will play a key role in influencing the USD price dynamics and provide some impetus to the USD/CHF pair. Apart from this, traders will take cues from developments surrounding the coronavirus saga and the broader market risk sentiment to grab some short-term opportunities. Nevertheless, the pair, for now, seems to have stalled its recent downward trajectory, though any meaningful recovery still seems elusive.
Technical levels to watch
UK PM Boris Johnson said on Monday that the way forward is to continue on the same path (no explicit lockdowns), but also to keep everything (i.e. the potential for further restrictions) under review. Pressure on hospitals will be considerable over the next few weeks, Johnson added, saying that the majority of people in intensive care are either vaccinated or boosted. The mixture of things we are doing at the moment, he added, is the right one.
Market Reaction
FX markets have not seen any notable reaction to the latest comments from Johnson. If momentum/speculation of a tightening of curbs in the UK starts to build once again, this is a near-term downside risk for GBP.
- EUR/GBP is subdued at the start of 2022 close to 0.8400 and close to 22-month lows with UK markets shut.
- EUR/GBP was unresponsive to Monday’s final Eurozone manufacturing PMI and awaits further UK/Eurozone PMI surveys and Eurozone inflation this week.
EUR/GBP is starting the year in subdued fashion and meandering within recent ranges close to the 0.8400 level, which is not all too surprising given markets in London (Europe’s busiest FX trading hub) are closed for a UK bank holiday. To the upside, technicians will be eying last Friday’s 0.8415ish highs are resistance and to the downside, last Friday’s near two-year lows in the 0.8360s will offer support.
Markets have broadly been in a risk-on mood for most of the last 10 or so trading sessions, reflective of expectations that the comparatively milder Omicron Covid-19 variant will not wreak lasting economic damage on the global economy. This has helped GBP, which is more risk-sensitive than the euro, thus weighing on EUR/GBP, helping the pair hit 22-month lows at the end of last week under 0.8400. EUR/GBP has also benefitted from BoE/ECB policy divergence and this may well remain the case in 2022 with a few more rate hikes expected from the former but not the latter, as well as some potential quantitative tightening.
Economic data
Final Eurozone Manufacturing PMI figures out this morning offered little surprises with the headline Eurozone aggregative index coming in as expected at 58.0 showing sentiment in the sector remains strongly robust. EUR/GBP has thus not seen any reaction. The survey highlighted factories taking advantage of easing supply chain issues and reportedly buying raw materials at a record pace. Manufacturers expressed optimism that supply chain snags will ease further in 2022 and order books remain full, indicating the potential for strong output growth ahead. Euro traders will be more focused on a trickle of flash December HICP inflation estimates, with France reporting on Tuesday, Italy on Wednesday and Germany on Thursday ahead of the release of the aggregative numbers on Friday.
Last week’s Spanish numbers suggest upside risks to expectations (aggregative Eurozone inflation is seen slipping to 4.7% YoY from 4.9% in November). Final Eurozone service PMI numbers are unlikely to shift the dial, just as the final manufacturing survey results did on Monday. In terms of UK data, final PMI surveys will also be out this week and maybe slightly more interesting; the rapid spread of Omicron in the UK in the latter half of December means there may be negative revisions which could portend a big drop in sentiment in January. Indeed, there is generally a view data that doesn’t cover the period of rapid Omicron spread (like this week’s US and Eurozone data) is a little “out-of-date”, with traders more focused on January numbers to guage the near-term economic damage.
Whilst hot Eurozone inflation could offer the euro some short-term support, expectations of a continued large BoE/ECB policy divergence limit any potential upside. EUR/GBP is likely to be sensitive this week to Omicron news as cases rise in the UK, Europe and elsewhere. Any lockdown chatter in the UK could hurt sterling and see EUR/GBP rebound.
- EUR/USD erodes part of Friday’s advance to the proximity of 1.1390.
- Further north from that level comes the 1.1430 zone.
EUR/USD comes under selling pressure at the beginning of the year following new December’s top near 1.1390 recorded in the last session of the 2020.
There is a temporary hurdle signalled by the 55-day SMA, today at 1.1398, ahead of the 4-month resistance line around 1.1430. The surpass of the latter is expected to mitigate the downside bias and allow for extra gains in the short-term horizon.
The broader negative outlook for EUR/USD is seen unchanged while below the key 200-day SMA at 1.1751.
EUR/USD daily chart

- DXY partially reverses Friday’s pullback and approaches 96.00.
- Recent lows in the mid-95.00s should hold the downside for now.
The recent corrective downside in DXY seems to have met some decent contention in the 95.50 region so far.
A breach of the 95.50 zone should allow for an immediate test of the 55-day SMA at 95.39. On the other hand, if bulls manage to regain control, an attempt to the YTD high just below the 97.00 barrier (November 24) should not be ruled out.
In the meantime, while above the 4-month support line (off September’s low) around 94.80, the constructive view in DXY should remain unchanged. In addition, the broader positive stance stays underpinned by the 200-day SMA at 92.99.
DXY daily chart
- USD/JPY struggled to capitalize on its intraday positive move to an over one-month high.
- The risk-on mood undermined the safe-haven JPY and extended some support to the major.
- The USD drew some support from rallying US bond yields and further helped limit the slide.
The USD/JPY pair dropped to a fresh daily low during the mid-European session, with bears now awaiting a sustained break below the key 115.00 psychological mark.
The pair struggled to capitalize on its intraday positive move and witnessed a modest pullback from the 115.35 region, or the highest level since November 26 touched earlier this Monday. The intraday slide lacked any obvious fundamental catalyst and could be solely attributed to some profit-taking, especially after the recent strong runup of nearly 300 pips over the past one month or so. That said, a combination of factors should limit the downside for the USD/JPY pair.
The optimism over signs that the Omicron variant might be less severe than feared and is unlikely to derail the economic recovery helped offset worries about the continuous surge in new COVID-19 cases. This was evident from a generally positive tone around the equity markets, which should act as a headwind for the safe-haven Japanese yen. Apart from this, a modest US dollar strength and a fresh leg up in the US Treasury bond yields could extend support to the USD/JPY pair.
In fact, the yield on the benchmark 10-year US government bond shot back to 1.54% and might now be eyeing a near one-month high touched last week. This, along with the Fed's hawkish outlook, indicating at least three rate hikes in 2022, assisted the USD to regain positive traction and reverse a major part of Friday's slide. Despite the supporting factors, the USD/JPY pair lacked bullish conviction amid quiet holiday trading on the back of an extended weekend in the US.
Investors also seemed reluctant to place aggressive directional bets, instead preferred to lighten their bullish positions ahead of important US macro data scheduled at the beginning of a new month. This week's US economic docket highlights the release of ISM PMIs and the ADP report on private-sector employment. The focus, however, will remain on the closely-watched US monthly jobs report (NFP) on Friday, which should provide a fresh impetus to the USD/JPY pair.
Technical levels to watch
France's Finance Minister Bruno Le Maire announced on Monday that the government will widen the financial aid for companies hit by the coronavirus pandemic, as reported by Reuters.
La Maire further added that they will lower the threshold for companies to claim state support for turnover losses and noted that the additional cost of widening the aid will be in the range of "some hundred million euros."
Market reaction
This headline doesn't seem to be having a noticeable impact on the shared currency's performance against its rivals. As of writing, the EUR/USD pair was down 0.1% on the day at 1.1355.
- EUR/JPY corrects lower following Friday’s tops around 131.00.
- There is an interim hurdle at the Fibo level at 131.15.
EUR/JPY partially fades Friday’s strong advance after faltering once again around the 131.00 neighbourhood on Monday.
The recent breakout of the critical 200-day SMA (130.50) should prop up extra gains in the cross in the short-term horizon. That said, bulls now face the next minor barrier at the Fibo level (of the October-December drop) at 131.15. Further north is seen the 131.41 level (November 10) ahead of another Fibo level at 132.17.
While above the 200-day SMA, the outlook for EUR/JPY should point to extra gains.
EUR/JPY daily chart
Citing three sources familiar with the matter, Reuters reported on Monday that the Organization of the Petroleum Exporting Countries (OPEC) and its allies are expected to increase the oil output by 400,000 barrels per day in February as planned.
The group known as OPEC+ will have a meeting on Tuesday, January 4, to decide on the oil supply strategy.
Market reaction
This headline doesn't seem to be having a significant impact on crude oil prices. As of writing, the barrel of West Texas Intermediate (WTI) was trading at $76.25, gaining 1.2% on a daily basis.
UOB Group’s Senior Economist Julia Goh and Economist Loke Siew Ting comment on the recently published results from the Exports sector in Malaysia.
Key Takeaways
“Exports expanded at a stronger pace of 32.4% y/y in Nov (Oct: 25.5%) which was in line with our forecasts but higher than Bloomberg consensus (30%). Imports gained 38% y/y (Oct: 27.9%) Higher imports over exports led to narrower trade surplus of MYR18.9bn (Oct: MYR26.3bn).”
“Overall exports in Nov were lifted by robust shipments of electrical and electronic (E&E) products (17.4% y/y), petroleum products (111.6%), palm oil and palm-oil based agriculture products (97.4%), and LNG (99.5%). Exports to key markets included ASEAN, China, USA, EU and Japan, which recorded double-digit growth.”
“With year-to-date (YTD) export growth of 25.7% y/y, this has surpassed our export target of 25%. Nevertheless, we expect a bumpy recovery in the coming months with a projected 2.0% export growth for 2022. The Omicron variant, ongoing supply-chain disruptions, and higher prices of traded goods could pose downside risks to the trade outlook. Domestically, worker shortages and the floods have dampened production in selected sectors and areas.”
- USD/TRY extends the rebound to the 14.00 area on Monday.
- Turkey headline CPI rose 13.58% MoM, 36.08% YoY in December.
- Turkey Manufacturing PMI improved a tad to 52.10 last month.
The Turkish lira extends the rout and pushes USD/TRY to fresh 2-week peaks in levels just shy of the 14.00 hurdle on Monday.
USD/TRY stronger on higher CPI
USD/TRY advances for the sixth consecutive session on Monday in response to the resumption of the buying interest in the greenback and further domestic headwinds facing the lira.
Indeed, TRY suffered another bout of selling pressure after Turkey’s inflation figures showed the CPI rose at a shocking 13.58% MoM in December and 36.08% from a year earlier, while the Core CPI gained 31.88% over the last twelve months.
In addition, the lira continues to give away part of the strong gains recorded soon after the government announced a plan aimed at preventing further dollarization of its economy in past days, as enthusiasm among Turks continues to fizzle out.
Extra results in the Turkish docket showed Producer Prices rose 19.08% on a monthly basis and 79.89% over the last twelve months and a slight improvement in the Manufacturing PMI to 52.10 in December.
What to look for around TRY
The lira resumed the downtrend in past sessions, as markets (and Turks) appear to have digested the recently announced measures by the government to promote the shift from dollars to the domestic currency. The reluctance of the CBRT to change (collision) course and the omnipresent political pressure to favour lower interest rates in the current context of rampant inflation are forecast to keep the lira under persistent pressure. That said, another visit to the all-time high north of the 18.00 mark in USD/JPY should not be ruled out just yet.
Key events in Turkey this week: December Inflation Rate, Producer Prices, Manufacturing PMI (Monday).
Eminent issues on the back boiler: Progress (or lack of it) of the new scheme oriented to support the lira. Constant government pressure on the CBRT vs. bank’s credibility/independence. Bouts of geopolitical concerns. Much-needed structural reforms. Growth outlook vs. progress of the coronavirus pandemic. Potential assistance from the IMF in case another currency crisis re-emerges.
USD/TRY key levels
So far, the pair is gaining 1.15% at 13.3675 and a drop below 11.6665 (55-day SMA) would open the door to 10.2027 (monthly low Dec.23) and finally 9.3734 (200-day SMA). On the other hand, the next up barrier lines up at 18.2582 (all-time high Dec.20) followed by 19.0000 (round level).
- A strong pickup in the USD demand prompted some selling around GBP/USD on Monday.
- The risk-on mood capped the safe-haven USD and helped limit the downside for the pair.
- Investors now look forward to this week’s US macro data for a fresh directional impetus.
The GBP/USD pair remained on the defensive through the first half of the European session, albeit has managed to recover a few pips from the daily swing low. The pair was last seen trading around the 1.3515-20 region, down less than 0.10% for the day.
The US dollar made a solid comeback on the first trading day of the new year and failed to assist the GBP/USD pair to capitalize on its recent gains recorded over the past two weeks or so. The Fed's hawkish outlook, indicating at least three rate hikes in 2022, along with elevated US Treasury bond yields acted as a tailwind for the greenback.
It is worth recalling that the yield on the benchmark 10-year US government bond recorded the largest yearly increase since 2013 and ended 2021 above the 1.50% threshold. This, along with the worsening COVID-19 situation in the United Kingdom, further undermined the British pound and exerted some downward pressure around the GBP/USD pair.
Britain has been reporting a record number of new COVID-19 cases over the past few days, which could force the government to impose more restrictions. It is worth recalling that the UK Prime Minister Boris Johnson had said last week that ministers would keep the latest data under constant review to see if additional stricter measures are needed.
That said, the underlying bullish tone – as depicted by a generally positive tone around the equity markets – capped gains for the safe-haven greenback. This, in turn, assisted the GBP/USD pair to reverse an intraday slide to sub-1.3500 levels. The attempted recovery, however, lacked bullish conviction amid quiet holiday trading.
Nevertheless, the emergence of some dip-buying at lower levels supports prospects for an extension of the recent upward trajectory. Bulls, however, are likely to wait for a sustained strength beyond the 100-day SMA before placing aggressive bets ahead of this week's important US macro data, including the closely-watched NFP report.
Technical levels to watch
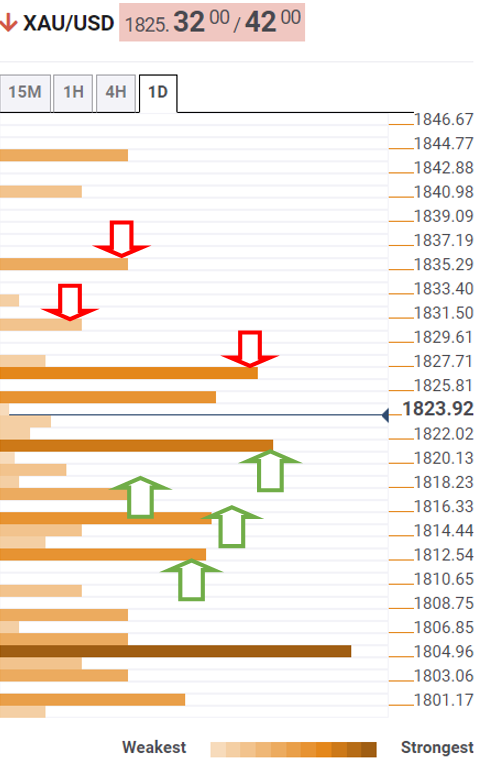
- Gold price pulls back from multi-week highs amid Fed rate hikes speculation.
- Risk-on sentiment at the start of 2022 also bodes ill for the bright metal.
- Gold 2022 Outlook: Correlation with US T-bond yields to drive yellow metal.
Gold is feeling the pull of gravity on the first trading day of 2022, in what seems to be a correction from six-week highs of $1,832. Expectations that the upcoming US first-tier economic events, including the ISM PMIs and Nonfarm payrolls, will confirm a March Fed rate hike are keeping the bulls on the back foot. Additionally, the upbeat market mood is collaborating with the pullback in gold price.
Read: Gold Price Forecast: XAU/USD is down starting out 2022 but not out
Gold Price: Key levels to watch
The Technical Confluences Detector shows that the gold price is trading below strong resistance of $1,827, where the Fibonacci 23.6% one-day coincides with the previous high four-hour and SMA10 one-hour.
The next topside hurdle is seen at the previous day’s high of $1,830, above which the multi-week top of $1,832 will be challenged once again.
The pivot point one-day R1 at $1,835 will be a tough nut to crack for gold bulls.
On the flip side, strong support is pegged at $1,821, the intersection of the Fibonacci 61.8% one-day, Fibonacci 23.6% one-week and previous low four-hour.
The next relevant cap is seen at 1,818, which is the pivot point one-day S1. Friday’s low of $1,815 will be next on sellers’ radars.
The convergence of the SMA100 one-hour and Fibonacci 23.6% one-month at $1,812 will be the line in the sand for gold buyers.
Here is how it looks on the tool
About Technical Confluences Detector
The TCD (Technical Confluences Detector) is a tool to locate and point out those price levels where there is a congestion of indicators, moving averages, Fibonacci levels, Pivot Points, etc. If you are a short-term trader, you will find entry points for counter-trend strategies and hunt a few points at a time. If you are a medium-to-long-term trader, this tool will allow you to know in advance the price levels where a medium-to-long-term trend may stop and rest, where to unwind positions, or where to increase your position size.
Barnabas Gan, Economist at UOB Group, assesses the latest inflation figures in Singapore.
Key Takeaways
“Singapore’s consumer prices rose at its fastest rate since February 2013 at 3.8% y/y (+1.0% m/m sa) in November 2021.”
“Similarly, Singapore’s core inflation accelerated to 1.6% in November 2021, the fastest gain since March 2019.”
“Official estimates for inflation have been revised up to account for the higher-than-expected rise in prices. According to the press release by the Monetary Authority of Singapore (MAS), headline inflation is ‘expected to come in at 2.3%’ in 2021, from a previous range outlook of “around 2.0%” as cited in October’s press release.”
“Given the elevated consumer prices seen year-to-date, we further upgrade our headline inflation outlook to 2.3% for 2021, while keeping our core inflation outlook unchanged at 1.0%.”
- USD/CAD attracted some buying near 100-DMA on Monday amid resurgent USD demand.
- A generally positive risk tone capped gains for the safe-haven USD in quiet holiday trading.
- Investors also seemed reluctant ahead of the OPEC+ meeting and the key US macro releases.
The USD/CAD pair maintained its bid tone through the early part of the European session and was last seen trading just a few pips below the daily high, around the 1.2670-75 region.
The pair managed to defend the 100-day SMA support and gained some positive traction on the first trading day of 2022, snapping three consecutive days of the losing streak. The uptick was sponsored by a strong pickup in the US dollar demand and allowed the USD/CAD pair to recover a part of Friday's losses to an over three-week low.
Growing market bets the Fed will raise rates earlier than most other major central banks, along with elevated US Treasury bond yields acted as a tailwind for the greenback. It is worth recalling that the yield on the benchmark 10-year US government bond recorded the largest yearly increase since 2013 and ended 2021 above the 1.50% threshold.
That said, the underlying bullish sentiment – as depicted by a generally positive tone around the equity markets – capped the upside for the safe-haven greenback. Apart from this, an uptick in crude oil prices underpinned the commodity-linked loonie and kept a lid on any meaningful gains for the USD/CAD pair, at least for the time being.
Investors also seemed reluctant to place aggressive bets amid quiet holiday trading and ahead of the OPEC+ meeting on Tuesday. The alliance is expected to stick to the plan to add 400,000 barrels per day of supply in February. Hence, the market focus will remain glued to important US macro data scheduled at the beginning of a new month.
This week's US economic docket highlights the release of ISM PMIs and the ADP report on private-sector employment, followed by the closely-watched US monthly jobs report (NFP) on Friday. Apart from this, traders will take cues from Canadian monthly employment details before positioning for the next leg of a directional move for the USD/CAD pair.
Technical levels to watch
- WTI price regains poise after the profit-taking slide on Friday.
- Tightening supplies from Libya offers the much-needed impetus to oil bulls.
- WTI recaptures 50-DMA, with a potential bull flag formation on the daily sticks.
WTI (NYMEX futures) is posting 1% gains so far this Monday, kicking off the first trading day of 2022 on the front foot.
The European equities have opened firmer, adding to the market’s optimism, in turn, boosting the higher-yielding oil price. Meanwhile, tightening oil supplies from Libya also offers support to the renewed upside in the black gold.
At the time of writing, the US oil is battling the $76 mark, trading close to the daily highs of $76.11. WTI hit fresh five-week highs of $77.25 on Thursday before ending the year on Friday at $75.26.
Technically, WTI is charting a bull flag formation on the daily sticks, in the wake of the recent consolidation that followed the rally from December 20 troughs.
A daily closing above the falling trendline resistance at $76.84 will validate a bull flag, opening doors for a rally towards the $80 mark.
Ahead of that target, bulls could face some strong resistance around November 26 highs of $78.10.
The 14-day Relative Strength Index (RSI) points higher above the midline, allowing room for more gains.
Oil buyers remain hopeful so long as WTI holds above the bearish 50-Daily Moving Average (DMA) at $75.83.
A sustained breach of the latter will expose the falling trendline support at $74.66. At that level, the horizontal 100-DMA aligns, making it a powerful hurdle.
WTI: Daily chart
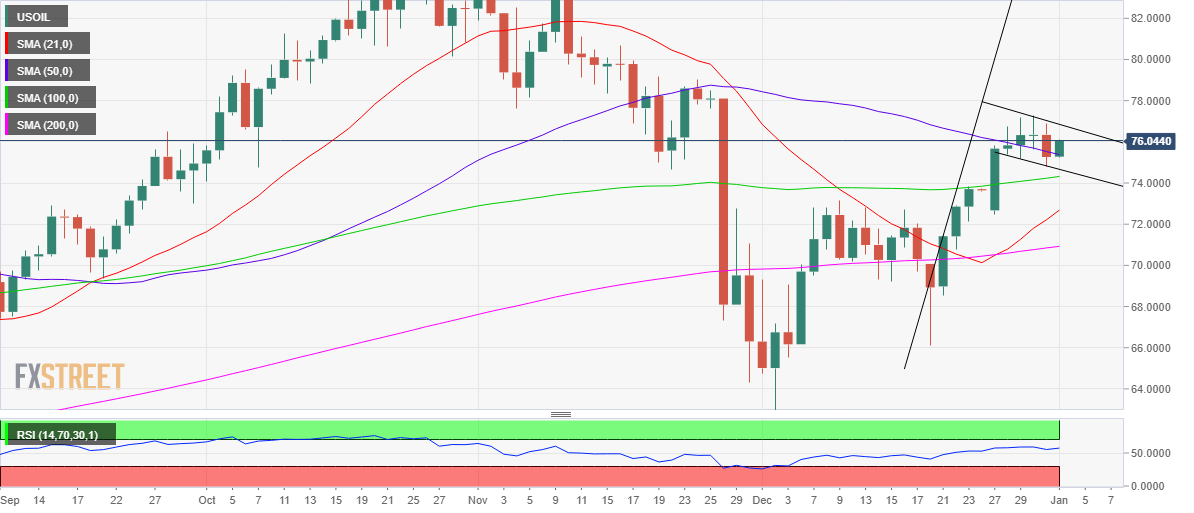
WTI: Additional levels to watch
British pound has lost its bullish momentum following Friday's upsurge. As FXStreet’s Eren Sengezer notes, GBP/USD is set to weaken further if buyers fail to defend 1.3500.
Ascending trend line forms key near-term support at 1.3500
“Later in the day, British Prime Minister Boris Johnson is expected to deliver an update on restrictions after assessing the latest Omicron data. In case investors see the negative impact of the Omicron variant on the British economy as a factor that would cause the Bank of England to pause its policy tightening, the GBP could find it difficult to attract buyers.”
“So far, GBP/USD has managed to stay afloat the ascending trend line coming from December 21 at 1.3500. In case a four-hour candle closes below that level, additional losses toward the next static support at 1.3460 could be witnessed before 1.3440 (50-period SMA).”
“On the upside, 1.3550 (December 31 high) aligns as first resistance ahead of 1.3600 (psychological level) and 1.3635 (static level).”
The Turkish lira recovered to 10.25 on 23 December but cracks have re-emerged since, causing losses to snowball again to 13.60. Economists at Société Générale expect the USD/TRY to consolidate within a 12.50-16.45 range.
Important support sits at 10.25
“After recent sharp up / down swings, a phase of sideways consolidation is not ruled out.”
“The pair is expected to evolve within a range near term, the bounds could be at 12.50/12.45 and 16.45, the 76.4% retracement of the pullback.”
“Recent trough at 10.25 could be an important support.”
Economist at UOB Group Barnabas Gan reviews the latest event by the Bank of Thailand (BoT).
Key Takeaways
“The Bank of Thailand (BOT) kept its one-day repurchase rate unchanged at 0.50% for its 13th consecutive meeting on 22 December 2021. The last time it made a move was in May 2020, when the benchmark rate was cut by 25 bps. The decision to leave the benchmark rate unchanged was unanimous across the committee members, unlike the meeting on 4 August where 2 out of 6 committee members voted for a rate cut.”
“Policy-makers upgraded their 2021 GDP growth outlook to 0.9%, up from 0.7% in their September monetary policy report. For subsequent years, the committee forecasts that GDP growth will average 3.4% and 4.7% in 2022 and 2023, respectively.”
“The latest policy statement was comparatively more cautious given the introduction of the Omicron COVID-19 variant.”
“On inflation, the central bank views that headline inflation will stay within target in the medium term, with headline CPI projections at 1.2%, 1.7% and 1.4% in 2021, 2022 and 2023, respectively.”
“More importantly, barring an uncontrolled surge in COVID Thailand, we think that BOT will likely 19 infection in take a step towards normalisation by inject ing a rate hike of 25 basis points in 4Q22.”
- NZD/USD gained some positive traction during the early part of the trading on Monday.
- Resurgent USD demand acted as a headwind and capped any further gains for the pair.
- The risk-on environment might continue to lend support to the perceived riskier kiwi.
The NZD/USD pair trimmed a part of its intraday gains and was last seen trading just a few pips above the daily low, around the 0.6835-40 region during the early European session.
The pair kicked off the new year on a positive note and climbed back closer to a near one-month high touched last week, though struggled to capitalize on the move beyond mid-0.6800s. A strong pickup in the US dollar demand was seen as a key factor that acted as a headwind for the NZD/USD pair and capped the upside.
The USD made a solid comeback in quiet holiday trading on Monday and reversed a major part of the previous session's decline to the lowest level since November 30. The Fed's hawkish outlook, indicating at least three rate hikes in 2022, along with elevated US Treasury bond yields acted as a tailwind for the buck.
It is worth recalling that the yield on the benchmark 10-year US government bond recorded the largest yearly increase since 2013 and ended 2021 above the 1.50% threshold. That said, the underlying bullish sentiment in the markets might cap the upside for the safe-haven USD and help limit the downside for the NZD/USD pair.
Despite the continuous surge in new COVID-19 cases, investors remain optimistic over signs that the Omicron variant might be less severe than feared and is unlikely to derail the economic recovery. This was evident from a generally positive tone around the equity markets, which could lend some support to the perceived riskier kiwi.
Investors might also refrain from placing aggressive directional bets and prefer to wait for important US macro data scheduled at the beginning of a new month. This week's US economic docket highlights the release of ISM PMIs and the ADP report on private-sector employment ahead of the closely-watched US monthly jobs report (NFP) on Friday.
Technical levels to watch
FX option expiries for January 3 NY cut at 10:00 Eastern Time, via DTCC, can be found below.
- EUR/USD: EUR amounts
- 1.1320 428m
- 1.1400 354m
- GBP/USD: GBP amounts
- 1.3700 306m
- USD/JPY: USD amounts
- 113.25 750m
- EUR/USD drifts lower amidst renewed dollar strength.
- German 10y Bund yields flirt with recent tops around -0.16%.
- Final Manufacturing PMI in Germany and the euro area comes next.
The selling pressure returns to the single currency and drags EUR/USD back to the 1.1330 region after climbing past the 1.1380 level, or new December tops, at the end of last week.
EUR/USD remains capped near 1.1380
EUR/USD comes under pressure amidst the resumption of the sentiment favouring the greenback at the beginning of the new year. Indeed, a mild bounce in US yields accompanies the move higher in the buck in combination with the selling bias in the risk-associated universe. Higher yields are also seen in the German money markets, where yields of the 10y Bund reference navigate the area of multi-week tops around -0.16%.
Later in the domestic calendar, the final Manufacturing PMIs for the month of December in the euro area, Germany and the US will take centre stage along with the November’s US Construction Spending.
What to look for around EUR
EUR/USD managed to break above the monthly consolidative phase and now gradually approaches the key barrier at 1.1400 the figure. As the normal activity resumes in the global markets following the festive period, the pair is seen refocusing on the main driver of the pair’s price action, namely the ECB-Fed policy divergence. In the meantime, the unabated progress of the coronavirus pandemic as well as the fast-spreading omicron variant remain as the exclusive factors to look at when it comes to the economic growth prospects and investors’ morale.
Key events in the euro area this week: EMU/Germany Final Manufacturing PMIs (Monday) - German Retail Sales, labour market report (Tuesday) - EMU/Germany Final Services PMIs (Wednesday) - Germany Advanced December Inflation Rate (Thursday) - EMU Advanced December Inflation Rate (Friday).
Eminent issues on the back boiler: Asymmetric economic recovery post-pandemic in the euro area. ECB stance/potential reaction to the persistent elevated inflation in the region. ECB tapering speculation/rate path.
EUR/USD levels to watch
So far, spot is losing 0.40% at 1.1338 and faces the next up barrier at 1.1386 (monthly high November 30) followed by 1.1464 (weekly high Nov.15) and finally 1.1520 (200-week SMA). On the other hand, a break below 1.1273 (weekly low Dec.29) would target 1.1221 (weekly low Dec.15) en route to 1.1186 (2021 low Nov.24).
New year, same factors moving the greenback – the impact of Omicron and Fed speculation. The highly contagious COVID-19 variant may lead to new restrictions while the Fed's minutes and the NFP could also boost the dollar, FXStreet’s Analyst Yohay Elam reports.
All other factors are only a distraction
“The most important market-mover is Omicron. Markets currently see the glass half-full, hoping that this wave would subside as quickly as it rises. Optimism is good for stocks and weighs on the safe-haven dollar. On the other hand, the sheer number of cases means hospitals could still come under pressure and that could trigger governments to impose restrictions. Now that the holidays are over, it would be politically easier to impose new curbs. When worries take over, stocks fall and the dollar rises.”
“Will the Fed raise rates as soon as March, wait until May as markets price, or up to June? Hints could come with the Fed's meeting minutes published on Wednesday and also Nonfarm Payrolls on Friday. A strong jobs report – especially one accompanied by a robust increase in wages – could send the dollar higher on expectations for an early move from the Fed. Disappointing data would do the opposite.”
“Other factors are minor – these include worries about China's Evergrande, tensions between Russia and Ukraine, and commentary by market analysts about the prospects of the global economy. These factors come into play only in the absence of virus or inflation fears.”
It is reasonable to think that inflation in the eurozone will fall back below the ECB’s 2% target from mid-2022. This is also what the European Central Bank (ECB) expects. According to analysts at Natixis, as long as inflation is not a real threat in the eurozone, the ECB will keep its monetary policy highly expansionary.
The importance of the inflation forecast for 2023
“The ECB has many objectives: Help ensure public debt sustainability; Boost private and public investment, especially in the energy transition; Reduce structural unemployment. These objectives can be pursued as long as expected inflation remains below 2%. As is the case today, the ECB will continue to buy bonds without raising its key interest rates.”
“If expected inflation rose persistently and significantly above 2% (the ECB can tolerate inflation temporarily slightly higher than 2%, such as 2.5%, but not permanently), the ECB would likely do a policy about-turn and, like the Federal Reserve, exit quantitative easing and start planning interest rate hikes.”
“Inflation is forecast to be lower than 2% in 2023. But it is important to watch out for any shock that could push up inflation in 2023: Social crisis and demands leading to faster wage growth, bearing in mind that wage earners’ purchasing power has fallen in 2021; Geopolitical crisis, for example between Europe and Russia, leading to a further sharp rise in European natural gas prices; A flare-up of the health crisis, causing bottlenecks to reappear, particularly in transport.”
- A combination of factors pushed USD/JPY to over a one-month high on Monday.
- The risk-on mood undermined the safe-haven JPY and remained supportive.
- Resurgent USD demand further contributed to the ongoing positive momentum.
The USD/JPY pair edged higher through the early European session and shot to the highest level since November 29, around the 115.35 region in the last hour.
A combination of factors assisted the USD/JPY pair to gain some follow-through traction on the first trading day of the new year and prolong a one-month-old upward trajectory. The latest optimism over signs that the Omicron variant might be less severe than feared and is unlikely to derail the economic recovery remained supportive of the underlying bullish sentiment in the markets. This, in turn, undermined the safe-haven Japanese yen and pushed the pair higher amid resurgent US dollar demand.
The USD made a solid comeback in quiet holiday trading on Monday and reversed a major part of last week's slide to a one-month low. The Fed's hawkish outlook, indicating at least three rate hikes in 2022, along with elevated US Treasury bond yields turned out to be a key factor that acted as a tailwind for the buck. It is worth recalling that the yield on the benchmark 10-year US government bond recorded the largest yearly increase since 2013 and ended 2021 above the 1.50% threshold.
It will now be interesting to see if bulls are able to capitalize on the move or opt to lighten their positions ahead of important US macro releases scheduled at the beginning of a new month. This week's US economic docket highlights the release of ISM PMIs and the ADP report on private-sector employment. The focus, however, will remain on the closely-watched US monthly jobs report (NFP) on Friday.
In the meantime, developments surrounding the coronavirus saga will play a key role in influencing the broader market risk sentiment and drive demand for the safe-haven JPY. Apart from this, traders will further take cues from the US bond yields and the USD price dynamics to grab some short-term opportunities. That said, investors might refrain from placing aggressive directional bets, rather prefer to wait on the sidelines on the back of an extended weekend in Europe and the US.
Technical levels to watch
In opinion of FX Strategists at UOB Group, USD/CNH could grind lower and retest the 6.3310 level in the near term.
Key Quotes
24-hour view: “Despite rebounding sharply from a low of 6.3390 last Friday, the risk for USD is still on the downside. Only a break of 6.3700 (minor resistance is at 6.3650) would indicate that the downside risk has dissipated. Support is at 6.3450 followed by Friday’s low at 6.3390.”
Next 1-3 weeks: “USD dropped sharply last Friday, downward momentum is beginning to build, and a test of Dec’s low near 6.3310 would not be surprising. The downside risk is deemed intact as long as USD does not move above the ‘strong resistance’ level, currently at 6.3750.”
EUR/USD has lost its traction at the start of the new year. The pair remains at the merch of the greenback's market valuation and the correction could extend toward 1.1300, FXStreet’s Eren Sengezer reports.
Key technical support in the near-term aligns at 1.1300
“The number of confirmed coronavirus cases continues to rise at a strong pace both in the US and Europe but, as it currently stands, European countries are more likely to tighten restrictions. A slowdown in the eurozone's economic activity due to tighter restrictions will put additional bearish pressure on EUR/USD in the near-term.”
“EUR/USD is testing 1.1340 (former resistance, static level). In case a four-hour candle closes below that level, additional losses toward 1.1300 (psychological level, 200-period SMA) could be witnessed in the near-term.”
“On the upside, 1.1360 (static level, post-ECB high on December 16) aligns as initial resistance before 1.1385 (December 31 high) and 1.3400 (psychological level).”
Resurgent USD demand assisted USD/CAD to stage a goodish bounce from the 100-day SMA support. The pair inched back closer to the 1.2700 mark, though any meaningful recovery still seems elusive while below this level, FXStreet’s Haresh Menghani reports.
USD/CAD defends 100-DMA/50% Fibo. confluence around 1.2625
“The 100-day SMA and the 50% Fibonacci level of the 1.2288-1.2964 strong move up around the 1.2625 area should now act as a pivotal point for short-term traders. Some follow-through selling would turn the pair vulnerable to break below the 1.2600 mark and set the stage for an extension of the downward trajectory. The next relevant support is pegged near the 1.2540 region, marking the 61.8% Fibo. level, ahead of the key 1.2500 psychological mark.”
“The 38.2% Fibo. level, around the 1.2700 mark now seems to act as immediate resistance. A sustained strength beyond could push USD/CAD back towards the ascending channel breakpoint, which coincided with the 1.2765 horizontal support. This is followed by the 23.6% Fibo. level, around the 1.2800 round figure.”
“A convincing breakthrough at the 1.2800 level is needed to confirm that the recent corrective pullback has run its course and pave the way for the resumption of the prior bullish trend.”
Gold price has started out the first trading day of 2022 on the wrong footing. As FXStreet’s Dhwani Mehta notes, XAU/USD’s four-hour technical setup suggests an extended pullback.
XAU/USD to stay afloat above $1,820
“The retracement in gold price triggers a fresh drop towards the critical demand area around $1,814, which is the confluence of the wedge support and bullish 21-Simple Moving Average (SMA). Ahead of that level, the 1,820 round number could get tested. If gold price yields a rising wedge breakdown on the said time frame, then a sell-off could kick in towards $1,800.”
“Should the buyers regain control, the bright metal could see a retest of the multi-week highs of $1,832, above which a fresh upswing towards the November 22 highs of $1,849 cannot be ruled out.”
- DXY leaves behind Friday’s downtick and eyes 96.00.
- US yields start the week on a mild positive mood.
- Construction Spending, final Manufacturing PMI next on tap.
The greenback, when tracked by the US Dollar Index (DXY), regains the upside traction and trades closer to the 96.00 mark at the beginning of the week.
US Dollar Index looks to data, yields
The index manages to rebound from Friday’s 4-week lows in the 95.60/55 band amidst some tepid recovery in US yields, re-shifting the attention to the key 96.00 yardstick on Monday.
Indeed, the dollar reverses Friday’s pullback in the first session of the new year helped by the soft stance in the risk complex ahead of the opening bell in the old continent.
Later in the US docket, Markit will publish its final reading for the Manufacturing PMI for the month of December along with Construction Spending figures during November.
What to look for around USD
Renewed weakness around the greenback dragged the US Dollar Index (DXY) to fresh monthly lows in the sub-96.00 area on Friday. The muted activity in the US cash markets coupled with month/quarter/year-end flows left the buck vulnerable and exposed it to further decline. As markets slowly return to normality, the dollar is expected to remain propped up by the Fed’s intentions to hike rate as soon as in H2 2022, the persevering elevated inflation, supportive Fedspeak and the solid performance of the US economy.
Key events in the US this week: Final December Manufacturing PMI (Monday) - ISM Manufacturing PMI (Tuesday) - ADP Report, FOMC Minutes (Wednesday) - Initial Claims, ISM Non-Manufacturing, Factory Orders (Thursday) - Nonfarm Payrolls, Unemployment Rate (Friday).
Eminent issues on the back boiler: Start of the Fed’s tightening cycle. US-China trade conflict under the Biden’s administration. Debt ceiling issue. Potential geopolitical effervescence vs. Russia and China.
US Dollar Index relevant levels
Now, the index is gaining 0.24% at 95.89 and a break above 96.39 (weekly top Dec.29) would open the door to 96.90 (weekly high Dec.15) and finally 96.03 (2021 high Nov.24). On the flip side, the next down barrier emerges at 95.57 (monthly low Dec.31) followed by 95.51 (weekly low Nov.30) and then 94.96 (weekly low Nov.15).
- Resurgent USD demand prompted some selling around AUD/USD on Monday.
- The risk-on mood helped limit the downside for the perceived riskier aussie.
- Investors look forward to this week’s key US macro data for a fresh impetus.
The AUD/USD pair maintained its offered tone heading into the European session and was last seen trading just a few pips above the daily low, around mid-0.7200s.
The US dollar made a solid comeback on the first trading day of the new year and reversed a major part of Friday's decline to the lowest level since November 30. This, in turn, was seen as a key factor that prompted some selling around the AUD/USD pair. That said, the underlying bullish sentiment in the markets extended some support to the perceived riskier aussie and helped limit any deeper losses.
Despite the continuous surge in new COVID-19 cases, investors remain optimistic over signs that the Omicron variant might be less severe than feared and is unlikely to derail the economic recovery. This was evident from a generally positive tone around the equity markets, which acted as a headwind for the safe-haven greenback amid thin trading on the back of an extended weekend in Europe and the US.
Investors also seemed reluctant to place aggressive directional bets, rather preferred to wait for a fresh catalyst from important US macro data scheduled at the beginning of a new month. This week's US economic docket highlights the release of ISM PMIs and the ADP report on private-sector employment. The focus, however, will remain on the closely-watched US monthly jobs report (NFP) on Friday.
This, in turn, makes it prudent to wait for a strong follow-through selling before confirming that the AUD/USD pair has topped out in the near term. That said, bulls are likely to wait for a sustained strength beyond the 0.7275-80 region before positioning for an extension of the recent bounce from the vicinity of the key 0.7000 psychological mark touched in December.
Technical levels to watch
- GBP/USD turns south after facing rejection just below 100-DMA.
- The US dollar’s hard bounce weighs heavily on cable this Monday.
- UK government seeks to mitigate workforce disruption from Omicron.
GBP/USD is keeping its range around 1.3500, undermined by the US dollar’s sharp comeback amid discouraging news starting out the first trading of 2022.
Rising covid cases in the UK combined with Fed’s hawkish expectations weigh negatively on the currency pair. The UK reported 1,37,583 new covid cases in 24 hours. It had recorded 1,62,572 cases on Saturday.
Meanwhile, “the British government has asked public sector managers to test their contingency plans against a worst-case scenario of 25% staff absence as part of efforts to minimize disruption from the rapid spread of the Omicron variant of COVID-19,” Reuters reported on Sunday.
Attention now turns towards the US Markit Manufacturing PMI for a fresh trading opportunity in the major, as the UK market is closed in observance of New Year's Day.
Looking at GBP/USD’s daily chart, the pair has failed to clear the downward-sloping 100-Daily Moving Average (DMA) at 1.3562.
Therefore, sellers have returned, knocking down the price briefly below 1.3500. If the corrective pullback from multi-week highs of 1.3550 gathers steam, then GBP bears could test Friday’s low of 1.3465.
The downtick in the 14-day Relative Strength Index (RSI) is backing the retreat in the pair, although the losses could likely be capped, as the indicator still holds above the midline.
GBP/USD: Daily chart
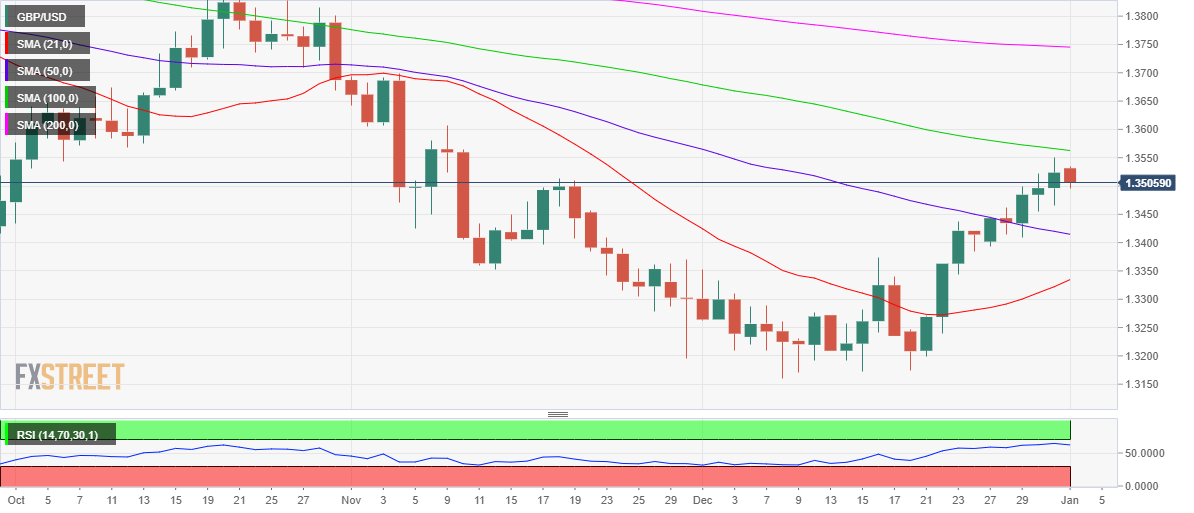
Alternatively, acceptance above the 100-DMA on a daily closing basis will fuel a fresh advance towards the 1.3600 level.
The next stop for GBP bulls is located at the 1.3650 psychological level.
GBP/USD: Additional technical levels
A move to the mid-115.00s in USD/JPY appears doable in the next weeks, noted UOB Group’s FX Strategists.
Key Quotes
24-hour view: “USD closed largely unchanged last Friday at 115.08 (+0.02%) but traded on a firm note in early Asian hours. Upward momentum is beginning to build and USD could rise to 115.40. For today, a clear break of this level is unlikely. Support is at 115.00 followed by 114.80.”
Next 1-3 weeks: “While the advance is USD over the past week has not gained much momentum, there is room for USD to edge above the Nov’s peak near 115.50. Barring a surge in momentum, a sustained rise above this level is unlikely (next resistance is at 115.80). On the downside, a breach of 114.60 would indicate that the current upward pressure has eased.”
Considering advanced figures for natural gas futures, open interest shrank by around 1.2K contracts on Friday, partially reversing the previous day’s uptick. Volume followed suit and dropped by nearly 43.5K contracts following two consecutive daily advances.
Natural Gas could retest the $3.50 zone
Prices of natural gas rebounded from the vicinity of the $3.50 region on Friday. The daily uptick, however, was on the back of shrinking open interest and volume, showing the presence of short covering behind the positive price action. Against this, extra upside could run out of steam and expose another test of the $3.50 zone per MMBtu.
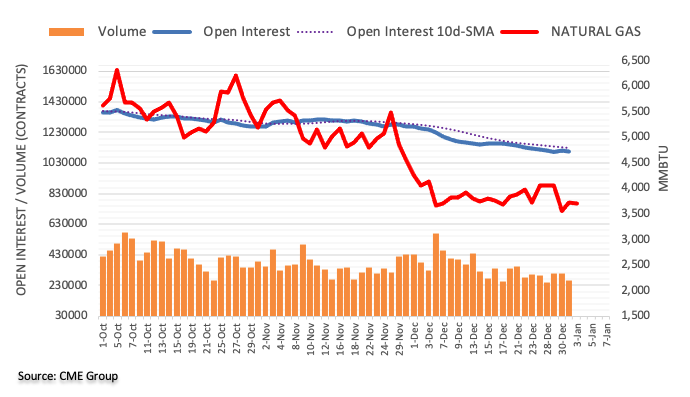
Here is what you need to know on Monday, January 3:
Profit-taking into the New Year holiday caused the greenback to close the last two weeks of 2021 in the negative territory. With trading conditions normalizing on the first day of 2022, the dollar started to gather strength against its rivals with the US Dollar Index rising 0.25% in the early European session. IHS Markit will release the final revision to the December PMI reading for Germany, the euro area and the US. December Construction Spending data will also be featured in the US economic docket.
The market mood remains relatively upbeat on Monday despite reports revealing that shares in China's Evergrande group had been suspended from trading in Hong Kong. US stock index futures are up between 0.35% and 0.55% while the benchmark 10-year US Treasury bond yield is moving sideways around 1.5%.
In the meantime, crude oil prices are rising after Libya’s state-owned National Oil Corp. said over the weekend that its oil output is expected to drop by another 200,000 barrels a day (bpd) over the next week due to maintenance. The barrel of West Texas Intermediate (WTI) was last seen rising 0.7% on the day at $75.90.
EUR/USD capitalized on the broad dollar weakness and reached its strongest level in nearly six weeks at 1.3478 late Friday. The pair is staging a technical correction early Monday and was last seen losing 0.25% at 1.1340.
GBP/USD gained more than 100 pips last week but started the new week on the back foot. The number of confirmed coronavirus cases in the UK continue to rise at a rapid pace and British Prime Minister Boris Johnson is expected to issue an update on Omicron-related restrictions later in the day. Meanwhile, the pair is trading in the negative territory around 1.3500.
Gold extended its year-end rally and rose above $1,830 for the first time since late November. XAU/USD seems to have gone into a consolidation phase early Monday but stays afloat above $1,820 so far.
Despite the dollar weakness, USD/JPY managed to preserve its bullish momentum during the last week of 2021, supported by rising US Treasury bond yields. With the JPY having a tough time finding demand as a safe haven, the pair closes in on the multi-year high it set at 115.53 in late November.
Bitcoin spent the weekend in a relatively tight range below $50,000 and continues to move sideways near $47,000 early Monday. Ethereum managed to register modest gains in the previous two days but stays below key $4,000 handle.
According to FX Strategists at UOB Group, the upside momentum in AUD/USD could extend past the 0.7300 barrier in the next weeks.
Key Quotes
24-hour view: “AUD edged to a high of 0.7277 last Friday before closing at 0.7269 (+0.26%). While upward momentum has not improved by much, AUD could grind higher to 0.7295. A sustained rise above this level is unlikely. Support is at 0.7260 followed by 0.7240.”
Next 1-3 weeks: “The rebound in AUD from the early Dec low of 0.6994 appears to be over-extended but there is scope for AUD to edge higher to 0.7315. The major resistance at 0.7345 is unlikely to come under threat. Support is at 0.7240 but only a breach of 0.7210 would indicate that the current mild upward pressure has eased.”
CME Group’s preliminary readings for crude oil futures markets noted traders trimmed their open interest positions by just 227 contracts on Friday, clinching the second straight drop so far. Volume, instead, extended the choppy activity and went up by around 12.2K contracts.
WTI looks supported around $75.00
Friday’s negative price action in prices of the WTI was amidst shrinking open interest, suggesting that a deeper pullback remains out of favour for the time being. That said, decent support emerges around the $75.00 mark per barrel for the time being, while the immediate hurdle is located in the mid-$77.00s.
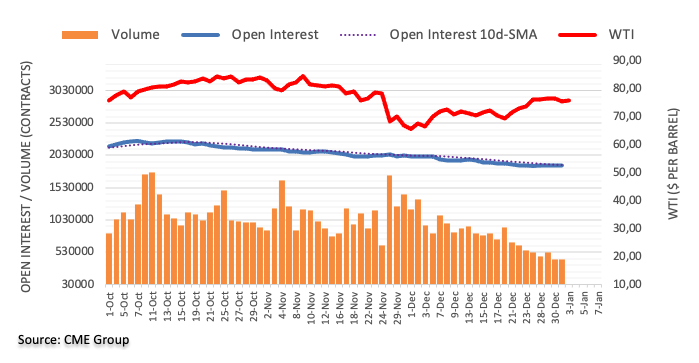
- AUD/JPY retreats from six-week high, recently pressured around intraday low.
- Bullish MACD signals keep buyers hopeful but RSI line, two-month-old horizontal resistance challenge further upside.
AUD/JPY eases after refreshing multi-day top, down 0.10% intraday around 83.55 during early Monday morning in Europe.
In doing so, the cross-currency pair stays above 61.8% Fibonacci retracement (Fibo.) of October-December declines but teases a bearish moving average cross-over by the press time.
However, the bullish MACD signals suggest the quote’s further upside towards a horizontal area comprising multiple levels marked since November 04, around 84.20.
While the RSI conditions suggest a pullback from the stated resistance, failures to do so will need to pierce the 84.70 hurdle before challenging the October 26 peak of 86.25.
Meanwhile, a clear downside break of the stated key Fibo. level surrounding 83.40 will aim for the mid-December swing high near 82.40.
During the quote’s weakness past 82.40, the 50-DMA will easily be seen dropping below the 200-DMA, suggesting a bearish cross and signaling further weakness of AUD/JPY prices.
As a result, an upward sloping trend line from December 03, near 81.55, will be crucial to watch for AUD/JPY sellers.
AUD/JPY: Daily chart
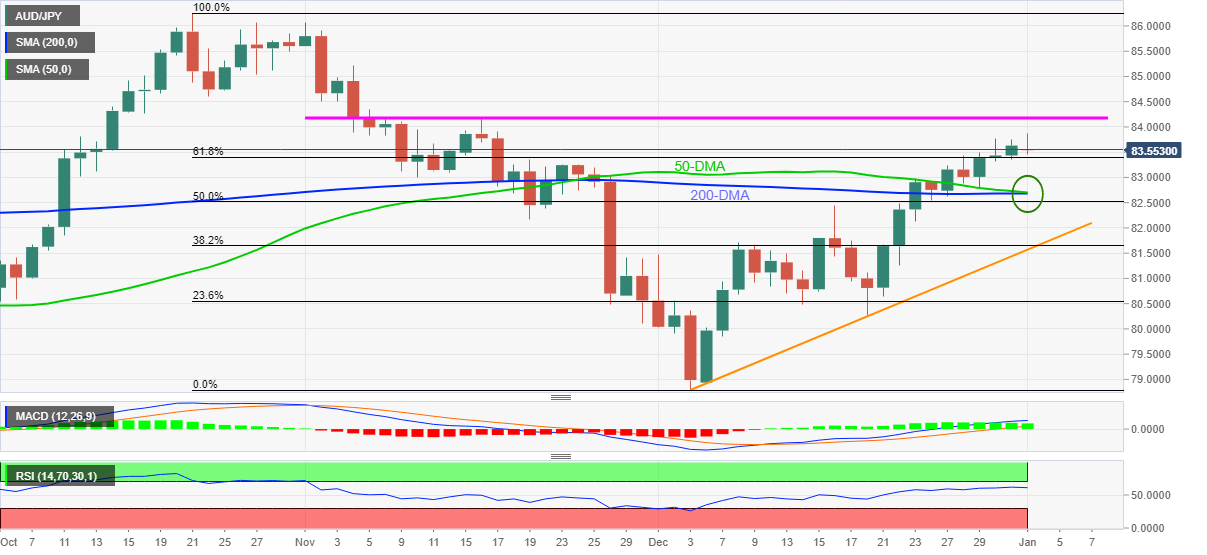
Trend: Pullback expected
Cable is now expected to advance to the 1.3600 region in the short-term horizon, suggested FX Strategists at UOB Group.
Key Quotes
24-hour view: “GBP popped to a high of 1.3551 last Friday before easing off. The combination of overbought conditions coupled with waning momentum suggest that GBP is unlikely to strengthen much further. For today, GBP is more likely to consolidate and trade between 1.3480 and 1.3550.”
Next 1-3 weeks: “While the sharp rise in GBP over the past couple of weeks appears to be overdone, the advance is not showing any sign of weakness just yet. In other words, there is room for GBP to advance further. The next resistance is at 1.3600. On the downside, a breach of 1.3430 (‘strong support’ level) would indicate that the current upward pressure has eased.”
Open interest in gold futures markets rose for the second session in a row on Friday, this time by nearly 5K contracts considering flash data from CME Group. On the other hand, volume dropped for the second consecutive session, now by around 6.7K contracts.
Gold appears capped by $1,830
Prices of the ounce troy of the precious metal traded on a positive mood in the second half of last week, although the move higher seems to have met decent resistance around $1,830. Friday’s uptick in gold was amidst rising open interest, which remains supportive of extra gains going forward, at least in the very near term.
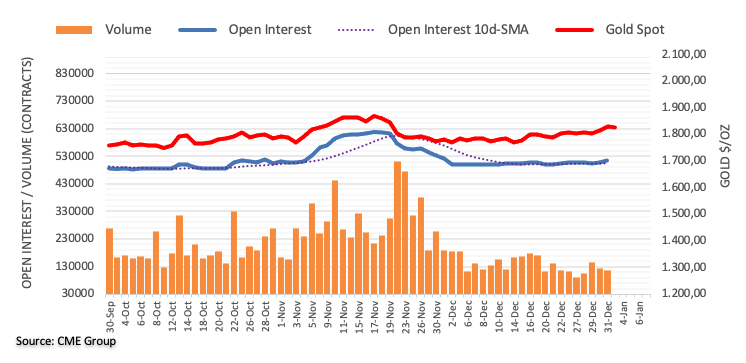
FX Strategists at UOB Group noted EUR/USD could edge higher and revisit the 1.1415 level in the next weeks.
Key Quotes
24-hour view: “Despite gaining +0.40% (NY close of 1.1368) last Friday, upward momentum has not improved by all that much. That said, there is room for EUR to advance to 1.1390 before the current upward pressure should ease. The major resistance at 1.1415 is unlikely to come under threat. Support is at 1.1355 followed by 1.1335.”
Next 1-3 weeks: “EUR traded mostly sideways for the past couple of weeks before rising to a 1-month high of 1.1386 last Friday. Upward momentum is beginning to build and EUR is likely to trade with an upward bias towards 1.1415. At this stage, the prospect for a sustained rise above 1.1415 is not high. On the downside, a breach of the ‘strong support’ at 1.1310 would indicate that the current upward pressure has eased.”
- Palladium stays pressured around intraday low, keeps pullback from five-month-old resistance line.
- 50-DMA, 23.6% Fibonacci retracement level limits immediate downside.
- 11-week-old horizontal line adds to the upside filters.
- RSI retreat, failures to cross immediate hurdle signal for the downside.
Palladium (XPD/USD) fades bounce off intraday low, down 0.12% on a day around $1,919 during early Monday.
The precious metal rose to the highest since November 22 before stepping back from a five-month-long descending resistance line during the last week.
The pullback moves do gain support from the RSI retreat, which in turn directs the sellers towards a convergence of 50-DMA and 23.6% Fibonacci retracement of May-December south-run, near $1,885.
It’s worth noting that September’s low surrounding $1,849 may offer an intermediate halt during the quote’s downside past $1,885 before the bears can aim for the $1,800 threshold.
Meanwhile, recovery moves need to cross the stated resistance line, around $1,965 at the latest, to recall the buyers.
Even so, the $2,000 psychological magnet and tops marked during October-November, near $2,180, will be tough resistances to cross for the XPD/USD bulls before retaking the controls.
Palladium: Daily chart
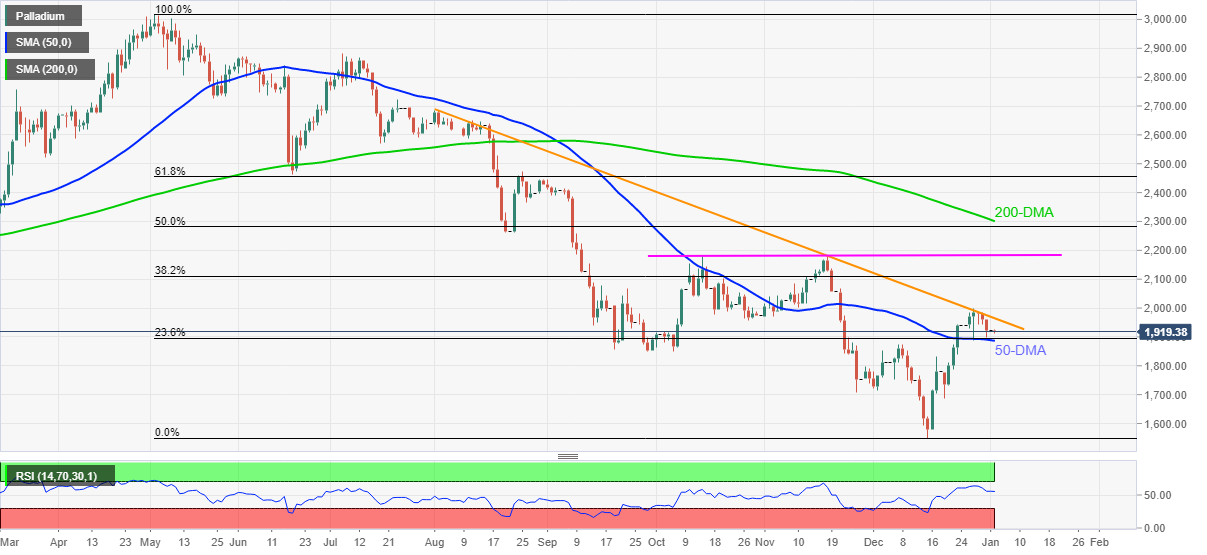
Trend: Further weakness expected
- EUR/USD keeps pullback from seven-week top, grinds lower around intraday low of late.
- Market players struggle for clear direction as equity futures rise, yields rally.
- Omicron woes escalate but policymakers stay hopeful, ECB v/s Fed battle is the key for 2022.
- FOMC Minutes, US NFP will be crucial for this week’s calendar.
EUR/USD prints a dull start to 2022, down 0.25% intraday around 1.1345 during early Monday. The currency pair refreshed a seven-week high the previous day amid broad US dollar weakness. However, the market’s consolidation at the year-start sluggish session triggered the quote’s corrective pullback amid mixed concerns.
Among the major burdens weighing on the EUR/USD prices are the escalating fears concerning the South African covid variant, namely Omicron.
Covid infections in the bloc, as well as globally, refresh record at the latest, which in turn challenge the previous recovery hopes from the old continent. While portraying the covid data, Reuters said, “Worldwide infections hit a record high over the past seven-day period, with an average of just over a million cases detected a day between Dec. 24 and 30.” The news also mentioned, “Over 4,000 flights were canceled around the world on Sunday, more than half of them were the US flights, adding to the toll of holiday week travel disruptions due to adverse weather and the surge in COVID-19 cases.”
Also challenging the market sentiment and favoring the US dollar’s rebound are the news concerning China’s troubled real-estate firm Evergande is on a halt. Additionally, the firm is also instructed by China government to abolish 39 illegal residential buildings. “China Evergrande Group shares will be suspended from trading on Monday pending the release of "inside information", said the firm per Reuters.
On the positive side, news that Germany will unveil tax relief to the locals in 2023 joined studies showing Omicron as less severe than the previous COVID-19 variants to challenge the EUR/USD bears.
Above all, the monetary policy divergence between the US Federal Reserve (Fed) and the European Central Bank (ECB) is the key to watch in the year 2022 as the Fed is likely running faster, than the ECB, towards the monetary policy tightening, which in turn could weigh on EUR/USD prices looking forward.
As a result, Wednesday’s Federal Open Market Committee (FOMC) Meeting Minutes and Friday’s US Nonfarm Payrolls (NFP) will be crucial for the pair traders. For the day, final readings of the US Markit Manufacturing PMI for December may offer immediate direction to markets.
Technical analysis
EUR/USD steps back from the 50-DMA and a horizontal area comprising multiple resistances since mid-November. Given the bullish MACD signals and the pair’s successful run-up beyond 21-DMA, EUR/USD buyers are likely to overcome the immediate hurdle surrounding 1.1390. However, a downward sloping trend line from early September, around 1.1440 by the press time, will be critical to watch for the bulls afterward.
On the contrary, pullback moves may aim for a 21-DMA retest, close to 1.1310 at the latest, before challenging an ascending support line from late November around 1.1250.
- USD/CNH fades bounce off intraday low, down for the second consecutive day.
- Pullback from 50% Fibonacci retracement, downbeat Momentum line favor sellers.
- 200-SMA adds to the upside filters, bears brace for fresh yearly low.
USD/CNH remains on the back foot around $6.3600, down 0.10% intraday during the late Asian session on Monday.
The offshore Chinese Yuan (CNH) currency pair dropped to the lowest since December 08 the previous day. The corrective pullback, however, fails to cross the 50% Fibonacci retracement of December 17-31 downside and recalls the USD/CNH sellers.
The latest weakness eyes the latest swing low near the $6.3500 mark before directing the quote towards the previous day’s bottom surrounding $6.3380.
In a case where USD/CNH drops below $6.3380, the 2021 bottom close to $6.3300 will be crucial to watch.
Alternatively, corrective pullback remains elusive below 50% Fibo. level near $6.3660.
Even if the quote manages to cross the $6.3660 hurdle, the 200-HMA level of $6.3731 will challenge the USD/CNH bulls before directing them to the $6.3800 level to the north.
USD/CNH: Four-hour chart
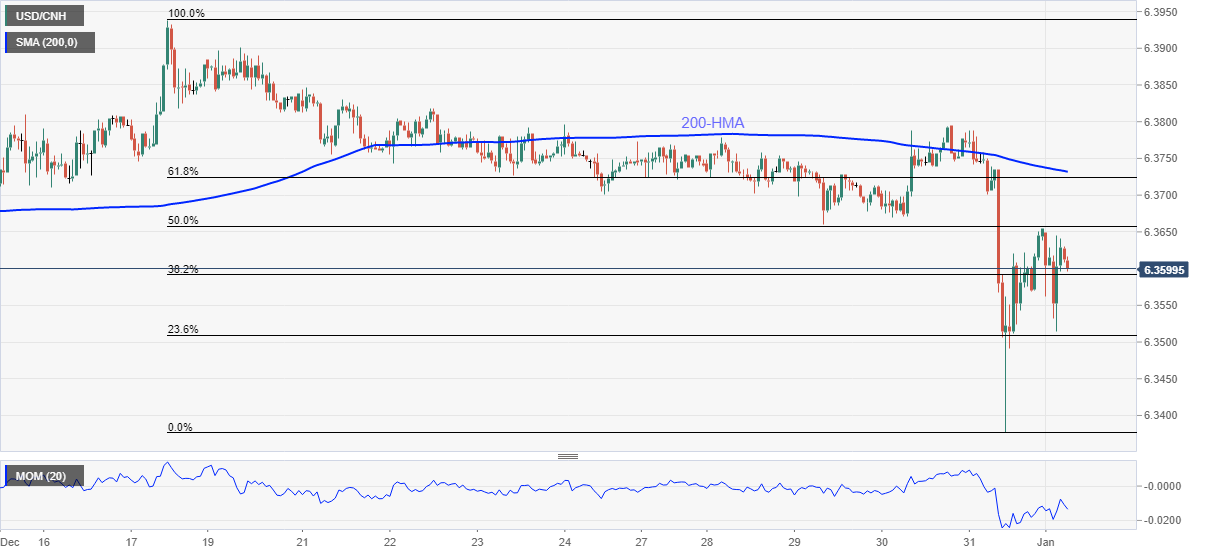
Trend: Further weakness expected
- Asia-Pacific markets remain subdued amid holidays in major bourses.
- Market fears linked to Evergrande, Omicron add to the trading filters amid light calendar.
- Final reading of US Markit Manufacturing PMI for December will be eyed for intraday direction, US jobs report is crucial.
Asian shares portray boring year-start moves amid the holiday season in multiple markets. Also challenging the trading sentiment is the indecision over the South African covid variant, namely Omicron. Even so, Evergrande woes challenge the equity traders during early Monday.
Even as the markets are off in the region majors, namely Japan, Australia, New Zealand and China, an index of Asia-Pacific shares outside Japan drops 0.22% during the late Asia session on Monday.
The reason could be linked to multiple countries reporting record high covid infections but the policymakers stay hopeful citing scientific studies citing Omicron as less severe than the previous COVID-19 variants.
Further, trading of all structured products of China struggled real-estate firm Evergande is on a halt. Additionally, the firm is also instructed by China government to abolish 39 illegal residential buildings. “China Evergrande Group shares will be suspended from trading on Monday pending the release of "inside information", said the firm per Reuters.
While a holiday in Beijing restricts the market’s reaction to the news, Hong Kong’s Hang Sang drops 0.70% intraday due to the same at the latest.
However, South Korea’s KOSPI prints mild gains on firmer prints of Nikkei Markit Manufacturing PMI for December while Indonesia’s IDX Composite rises 0.84% at the latest even as Indonesia inflation rises in December.
On a broader front, S&P 500 Futures rise 0.42% but the US Treasury yields and the US Dollar Index (DXY) stay firmer by the press time.
That said, final readings of the US Markit Manufacturing PMI for December may offer immediate direction to markets. However, major attention will be given to Wednesday’s Federal Open Market Committee (FOMC) Meeting Minutes and Friday’s US Nonfarm Payrolls (NFP).
Indonesia’s annual inflation rate kept moving north in December, according to the latest data published by Statistics Indonesia showed Monday.
Indonesian December’s inflation rate rose to 1.87% on the year when compared with November’s 1.75%, although remained way below the Bank Indonesia’s (BI) 2.5-4.5% target range.
The annualized core figure arrived at 1.56% vs. 1.44% previous and 1.51% expected.
USD/IDR reaction
At the time of writing, the spot adds 0.15% on the day to trade at 14,271. The pair showed little reaction to the inflation data, holding near-daily highs of 14,276.50.
About Indonesia’s CPI
The Inflation index released by Statistics Indonesia is a measure of price movements by the comparison between the retail prices of a representative shopping basket of goods and services. The purchase power of the Indonesian Rupiah is dragged down by inflation. The CPI is used as a key indicator to measure inflation and changes in purchasing trends. Generally speaking, a high reading is seen as positive (or bullish) for the Rupiah, while a low reading is seen as negative (or Bearish).
- US yields are firm at the start of 2022, focusing on US events.
- The FOMC, ISM and NFP will be critical events for the start of the year.
The yield of the US 2-year Treasury note is up over 1% while the 10-year is higher by 13% at the time of writing. This follows the end of year's slump as investors moved out of stocks in the last trading days before the New year celebrations.
Key US data for the month ahead
The week starts off with major trading hubs, such as Sydney and Tokyo as well as London out in observation of New year's day. However, the US markets will and there will be a focus on critical events o the calendar. December jobs report January 7 will be key this week as will the minutes of the recent Federal Reserve meeting. Later in the month, the US Consumer Price Index data will be out on January 12, followed by PPI data on January 13, and Retail Sales on January 14. There will be a small two-week window for Fed speaking engagements in early January, as the media blackout for the January 25-26 FOMC meeting takes effect at midnight January 14. The Beige Book for that meeting will be released on January 12.
Meanwhile, the main event for the week ahead will be in the form of the US jobs market with the US Nonfarm Payrolls report. ''The late-December COVID surge likely came too late to prevent a pickup in US payrolls after the gain in November (210k) appeared to be held down by an overly aggressive seasonal factor,'' analysts at TD Securities explained.
US ISMs on the 4th will also be key. The levels should remain high according to analysts at TD securities. ''We expect the services index to decline more markedly following November's eye-popping jump to 69.1—an all-time high—and given the likely initial impact from Omicron. The MFG index probably fell below the 60 mark for the first time in four months. Anything over 60 is exceptionally strong.''
Federal Open Market Committee minutes will also be key. The minutes follow the FOMC's decision to double the pace of QE tapering and the projection of a significantly more hawkish dot plot will be the focus before then. ''Focus will now turn to the elements that led to the evolution of views among policymakers (including on "maximum
- Silver retreats five-week-old horizontal resistance, pressured around intraday low of late.
- 200-SMA, short-term support line challenges further downside even as RSI pullback favor sellers.
- Upside break of $23.50 will confirm a bullish cup-and-handle chart pattern.
Silver begins 2022 with mild losses of around 0.50% intraday while stepping back from the weekly top towards $23.00 during early Monday.
In doing so, the bright metal eases from a five-week-old horizontal resistance area, surrounding $23.40-45.
Given the RSI line’s retreat from the nearly overbought region, the latest declines in silver prices are likely determined to aim for the 200-SMA level surrounding the $23.00 threshold.
Following that, an upward sloping support line from December 15, around $22.80, will be in focus.
Meanwhile, an upside clearance of the $23.45 will need validation from multiple tops marked during late November surrounding $23.75.
Following that, a confirmation of the bullish cup-and-handle chart pattern will play its role to direct XAG/USD buyers toward the mid-$25.00 zone.
To sum up, silver prices are likely to witness further declines but the bears have miles to go.
Silver: Four-hour chart
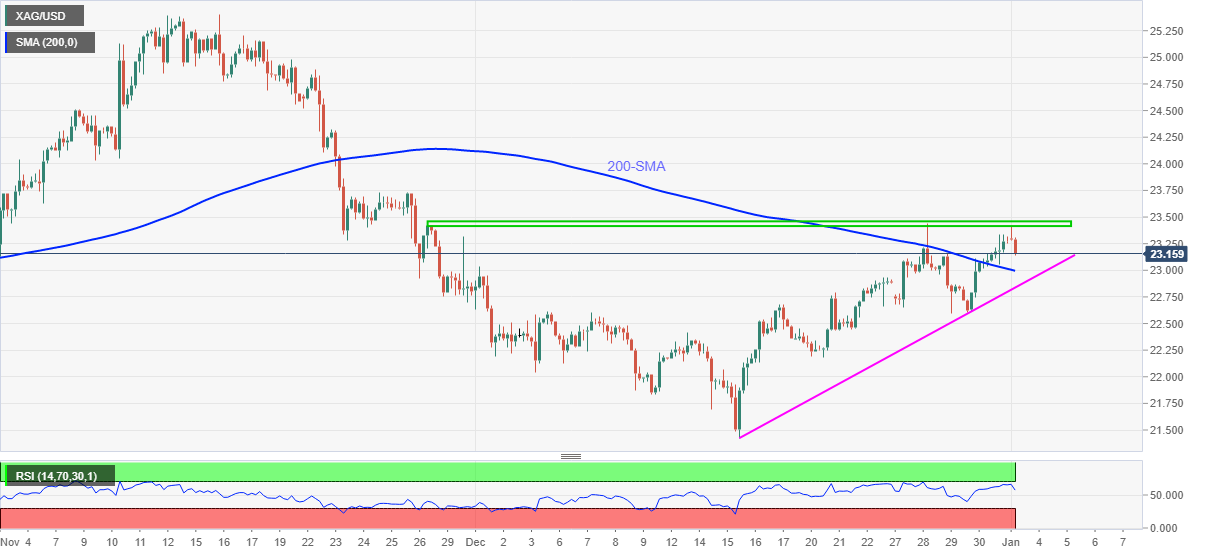
Trend: Pullback expected
- USD/INR is consolidating following a series of downside impulses on the daily chart.
- Should support hold at this point, then there will be a focus on prior support near 74.80.
USD/INR bulls recently stepped in to support what was a strong surge to the downside following a month of losses. The following illustrates the current market structure and potential course for the Indian Rupee for the days ahead.
USD/INR daily chart
-637767765846693631.png)
As illustrated, the price of USD/INR has revisited the trendline breakout area and is now at a critical juncture from which structure would be expected to act as support in the near term.
The price would subsequently be anticipated to correct higher prior to the next impulse to the downside. The 61.8% Fibonacci retracement level is compelling near to 74.80 where it meets a prior support area established in late November.
The People's Bank of China (PBOC) said that it will adopt new schemes aimed at encouraging financial institutions to lend to small businesses under pressure due to the impact of COVID-19, according to a statement posted on its website over the weekend.
Key takeaways
“Will provide capital to qualified banking institutions to spur them to extend more loans to small and micro enterprises under a scheme that will run through June 2023.”
“The measures had been announced by the State Council, or cabinet, on Dec. 15.”
Market reaction
Amid holiday-thinned light trading, USD/CNY is almost unchanged on the day, currently at 6.3521.
Analysts at investment bank Morgan Stanley remain bullish on the Chinese growth story in 2022, as they cite four key reasons why they expect the above forecasts growth.
Key quotes
“The pace of tightening proved to be too aggressive, considering that the recovery in consumption growth was curtailed because of the Delta wave and China’s continued Covid-zero approach, which kept consumption below trend.”
Still, the bank said it is “more bullish than consensus” and sees GDP growth in China accelerating to 5.5% in 2022.”
“Policymakers have already hit pause on their deleveraging efforts and have started to ease both monetary and fiscal policies in the last few weeks.”
“More relief for China’s real estate sector ahead.”
“The energy targets and goals to reduce power consumption also turned out to be “too aggressive” as China’s GDP growth relies heavily on industrial production.”
“China’s zero-Covid approach has prevented disruptions to factory production and even led to a rise in its share of global exports.”
“A favorable global backdrop should further drive strong trade growth.”
- AUD/USD steps back from six-week high, pressured around intraday low.
- Market players remain divided amid off in major bourses, light calendar.
- Australia records all-time high covid infections, trading in China’s Evergrande shares suspended.
- Final readings of US Markit Manufacturing PMI may entertain intraday traders.
AUD/USD remains on the back foot around an intraday low of 0.7245, down 0.18% on a day during early Monday. In doing so, the Aussie pair reverses from a six-week high portrayed the previous day amid negative headlines at home and China while ignoring firmer US equity futures amid an off in major markets.
Australia, unfortunately, marks another record-high daily covid infection number, 37,152 at the latest per ABC News. Even so, Australia Prime Minister Scott Morrisson said, “We're now at a stage of the pandemic where you can't just make everything free, because when someone tells you they want to make something free someone's always gonna pay for it and it's going to be you."
On a different page, Reuters said, “Worldwide infections hit a record high over the past seven-day period, with an average of just over a million cases detected a day between Dec. 24 and 30.” The news also mentioned, “Over 4,000 flights were canceled around the world on Sunday, more than half of them were the US flights, adding to the toll of holiday week travel disruptions due to adverse weather and the surge in COVID-19 cases.”
Other than the virus woes, concerns over China’s Evergande also weigh on AUD/USD prices. As per the latest update, trading of all structured products of the struggled real-estate firm is on a halt. Additionally, the firm is also instructed by China government to abolish 39 illegal residential buildings.
Amid these plays, S&P 500 Futures print 0.40% intraday gains while the US Treasury bonds remain inactive amid an off in Japan. However, the US Dollar Index (DXY) consolidates near the lowest level in over a month, up 0.24% intraday by the press time.
That said, AUD/USD traders may witness a lackluster day moving forward, which in turn can keep the latest losses on the table. However, final readings of the US Markit Manufacturing PMI for December may offer extra directions to the pair traders.
Technical analysis
Failures to overcome the resistance line of a monthly rising wedge join RSI conditions lingering around the overbought region to portray the bull’s exhaustion. Hence, pullback moves seem to be brewing. Furthermore, a downside break of a two-week-old ascending trend line, around 0.7255, adds to the bearish bias for the AUD/USD prices.
That said, a south-run to the late December’s swing low around 0.7200 becomes imminent while corrective pullback beyond 0.7255 will aim for the wedge’s resistance, near 0.7285.
- GBP/USD bears step on the gas at the start of the week into test near to 1.35 the figure.
- US events, Brexit, Covid and central banks outlooks to be the driving forces this week.
GBP/USD is on the back foot to start the week, -0.15% at the time of writing. Cable is sinking from 1.3535 to a low of 1.3507 so far, technically bound for further downside to come for the forthcoming sessions, see below.
Meanwhile, the volumes in forex and markets, in general, are not going to arrive until nations such as Japan, Australia and the UK return from holidays. However, while there is little in the way of domestic data from the Uk, the week will quickly move into gear with a busy US schedule on the calendar.
The main event will likely come at the end of the week from the US jobs market with the US Nonfarm Payrolls report. ''The late-December COVID surge likely came too late to prevent a pickup in US payrolls after the gain in November (210k) appeared to be held down by an overly aggressive seasonal factor,'' analysts at TD Securities explained.
US ISMs on the 4th will also be key. The levels should remain high according to analysts at TD securities. ''We expect the services index to decline more markedly following November's eye-popping jump to 69.1—an all-time high—and given the likely initial impact from Omicron. The MFG index probably fell below the 60 mark for the first time in four months. Anything over 60 is exceptionally strong.''
The other main event will come with the Federal Open Market Committee minutes. These are following the FOMC's decision to double the pace of QE tapering and the projection of a significantly more hawkish dot plot will be the focus before then. ''Focus will now turn to the elements that led to the evolution of views among policymakers (including on "maximum employment") after the November meeting,'' analysts at TD Securities said.
Domestic risks for GBP
As for the pound, the surprise rate hike by the Bank of England at its December meeting gave the currency some time-limited support. The fast spread of the Omicron variant in the UK has been a weight since in particular as the government may opt to impose some new restrictions following the holidays. Brexit is also likely to snap back and make for political turmoil that may also weigh on GBP as markets attempt to re-assess the Brexit policy.
GBP/USD technical analysis
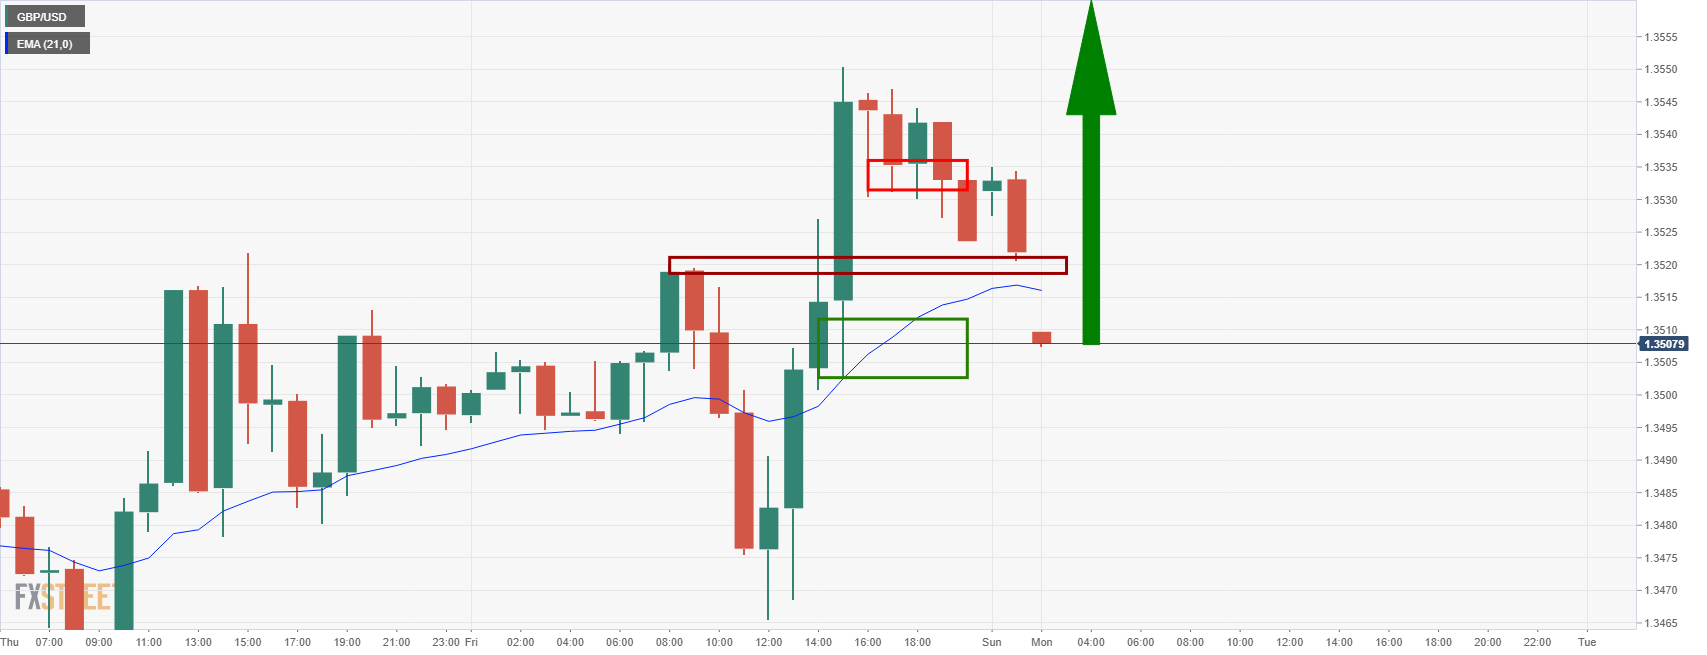
The hourly chart shows prospects of a price running into support near 1.35 the figure and correcting back to the upside for a higher high for the coming sessions.
For the weekly chart, we see a W-formation:
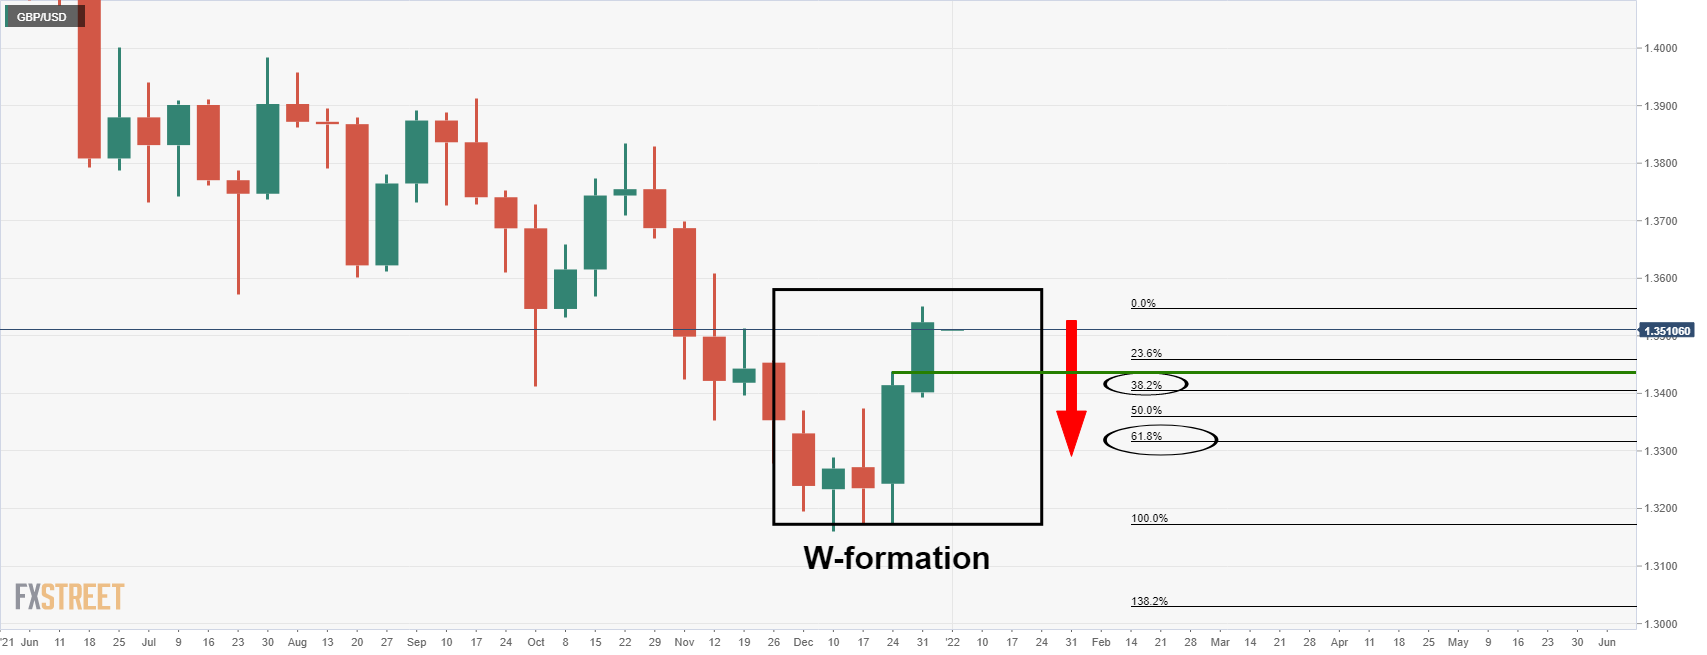
While there are prospects of a shallow correction as per the hourly analysis, the weekly perspective is far more bearish. The W-formation is a reversion pattern that has a high completion rate, in that the price would be expected to be drawn to the neckline of the pattern. The neckline comes in at around a 61.8% Fibonacci retracement near to 1.3320.
- USD/CAD refreshes intraday high, bounces off 18-day low.
- US dollar stays firmer even as market sentiment improves.
- Oil prices struggle amid supply-demand fears ahead of OPEC+ meeting.
- Off in multiple markets, lack of major data challenges short-term moves.
USD/CAD picks up bids to refresh intraday high near 1.2670 during Monday’s Asian session. In doing so, the Loonie pair snaps a three-day downtrend while bouncing off the lowest level since December 08, flashed the previous day.
The recent pullback in Canada’s key export item, namely WTI crude oil, joins the US dollar rebound to recall the USD/CAD bulls. However, an absence of major data/events and mixed clues concerning the South African covid variant, namely Omicron, challenge the recovery moves.
That said, WTI crude oil pares intraday gains around $75.30 amid fears of a reduction in the global energy demand even as Reuters cites OPEC+ report suggesting mild and the short-lived impact of Omicron.
Read: WTI bulls eye $76.00 as OPEC+ sees mild, short-lived impact of Omicron on oil market
Elsewhere, the S&P 500 Futures rise 0.40% intraday but the bonds are inactive amid an off in Japan. Further, the US Dollar Index (DXY) consolidates near the lowest level in over a month, up 0.24% intraday by the press time.
While portraying the covid data, Reuters said, “Worldwide infections hit a record high over the past seven-day period, with an average of just over a million cases detected a day between Dec. 24 and 30.” The news also mentioned, “Over 4,000 flights were canceled around the world on Sunday, more than half of them were the US flights, adding to the toll of holiday week travel disruptions due to adverse weather and the surge in COVID-19 cases.”
On the same line were comments from Anthony Fauci, Director of the National Institute of Allergy and Infectious Diseases, per CNN stating, “When you have so many, many cases, even if the rate of hospitalization is lower with Omicron than it is with Delta, there's still the danger that you're going to have a surging of hospitalizations that might stress the health care system.”
Moving on, the monthly employment data from the US and Canada becomes crucial for USD/CAD traders while today’s final readings of the US Markit Manufacturing PMI for December may offer immediate clues.
Technical analysis
Although the 100-DMA level of 1.2628 puts a floor under the USD/CAD downside, the pair buyers remain cautious until the quote stays below the previous support line from October, around 1.2780.
Libya’s state-owned National Oil Corp. said over the weekend that its oil output is expected to drop by another 200,000 barrels a day (bpd) over the next week, as the main pipeline linking the eastern Samah and Dhuhra fields to the country’s biggest export terminal, Es Sider, will be shut for maintenance, per Bloomberg.
This comes less than two weeks after militias shut down the OPEC member’s biggest field, Sharara, causing output to fall by around 350,000 barrels a day.
The closures will reduce Libyan production to about 700,000 barrels a day, the lowest in more than a year.
Market reaction
Oil prices are licking their wounds this Monday, underpinned by the above news. WTI is trading at $75.28, almost unchanged on the day, as of writing.
The start of 2022 is marred by risks associated with the Chinese property development giant Evergrande Group. reports of missed debt payments are not good news for risk sentiment, the steel industry or the Australian dollar.
Growth in China, the world's second-largest economy, has been slowing for two quarters amid concerns about a deflating property bubble and Evergrande's debt crisis. The property downturn is projected to continue through 2022.
''S&P Global Ratings expects to see more defaults in 2022 and as much as one-third of Chinese developers to be under liquidity pressure. It also forecasts that China residential sales will fall by 10% in 2022 and further decline by 5% to 10% in 2023, with property prices to fall by up to 3%,'' S&P Global stated.
Although Beijing had been offering policy supports to property developers such as Evergrande, analysts fear the moves are inadequate and more defaults are still to come. Moreover, Evergrande's crisis could be "just the tip of the iceberg," according to Stuart Burns, founder and editor-at-large of MetalMiner.
"Firms like Evergrande are off-loading stock to meet interest payments, depressing prices, and the resulting fall in residential property prices is dissuading new construction," Burns said in an interview. "A depressed construction sector in China will weigh on iron ore, steel and aluminium prices in 2022, extending the depressing effect it has already had in the fourth quarter."
Australia has the world's largest estimated reserves of iron ore with 52 billion tonnes, or 30 per cent of the world's estimated 170 billion tonnes. More than 80 per cent of the Chinese import volume comes from Australia and Brazil. Subsequently, Australia runs a surplus current account balance which helps to support the value of AUD in the forex space.
However, China's steel demand is expected to fall 0.7% to 947 million tons in 2022, following a 4.7% decline in 2021, dragged down by weakening property sector and COVID-19 uncertainties, Reuters reported Dec. 15, citing government-backed think tank China Metallurgical Industry Planning and Research Institute, or MPI. The Evergrande crisis and China's ambition to increase domestic production by 30 per cent will hurt Australia's most valuable commodity export.
- NZD/USD struggles to extend four-day uptrend, eases from intraday top.
- MACD conditions, 21-DMA challenge sellers, 0.6860 becomes the key hurdle.
NZD/USD retreats from daily top to 0.6835, down 0.06% intraday, during Monday’s Asian session. In doing so, the kiwi pair marks another failure to cross horizontal resistance established from late September.
Even so, successful trading above 21-DMA joins the bullish MACD signals and firmer RSI line to keep NZD/USD buyers hopeful. However, a clear upside break of a three-month-old horizontal area near 0.6860 becomes necessary for the kiwi pair’s further upside.
Following that, a run-up towards the 50-DMA near 0.6930 can’t be ruled out. Even so, the early October tops close to 0.6985 and the 0.7000 psychological magnet will challenge the NZD/USD bulls afterward.
Meanwhile, pullback moves may aim for the 21-DMA retest, around 0.6790 by the press time.
In a case where NZD/USD bears manage to conquer the stated DMA support, the 0.6735 and the year 2021 low of 0.6701 will pop up on their radars.
NZD/USD: Daily chart
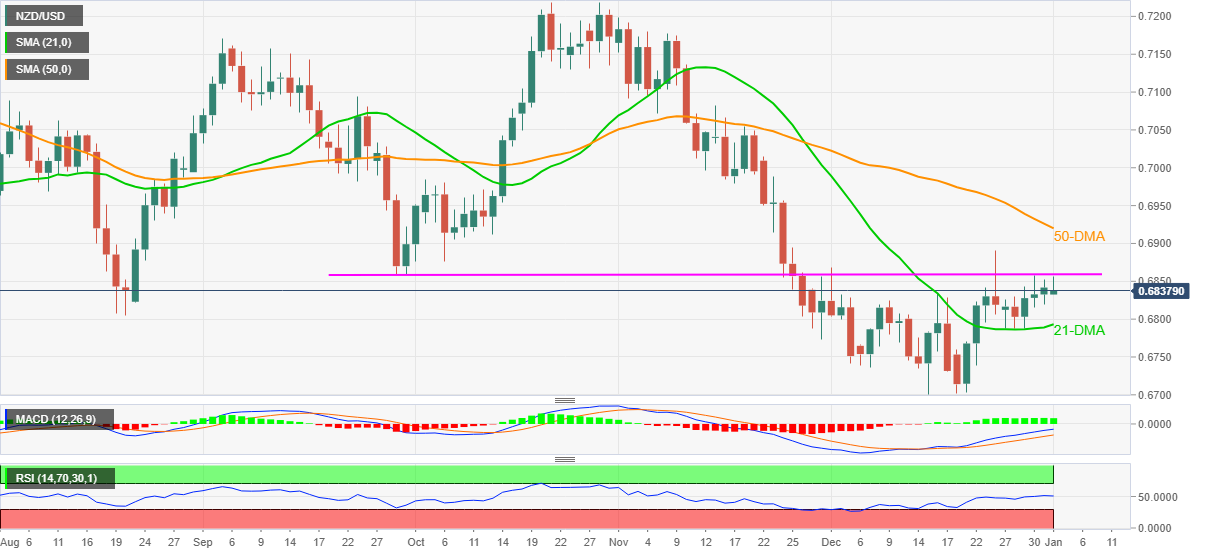
Trend: Further recovery expected
- Gold begins 2022 on a firmer footing after snapping two-year advances in 2021.
- Risk appetite improves despite surging covid infections, Fed rate-hike concerns.
- US PMIs, FOMC Minutes and NFP are the key for short-term direction.
- Will 2022 be better for gold than 2021?
After a disappointment in 2021, gold (XAU/USD) kick-starts 2022 on a firmer foot around $1,830 during Monday’s Asian session. In doing so, the yellow metal cheers market’s risk-on mood amid a light calendar and off in multiple markets ahead of the key weekly events.
That said, the S&P 500 Futures rise 0.55% while the US Dollar Index (DXY) struggles around a one-month low amid cautiously optimistic markets.
Among the key risk catalysts are the market fears over the South African covid variant versus upbeat studies terming the virus strain as less severe than the previous versions of the COVID-19.
While portraying the covid data, Reuters said, “Worldwide infections hit a record high over the past seven-day period, with an average of just over a million cases detected a day between Dec. 24 and 30.” The news also mentioned, “Over 4,000 flights were canceled around the world on Sunday, more than half of them were the US flights, adding to the toll of holiday week travel disruptions due to adverse weather and the surge in COVID-19 cases.”
On the same line were comments from Anthony Fauci, Director of the National Institute of Allergy and Infectious Diseases, per CNN stating, “When you have so many, many cases, even if the rate of hospitalization is lower with Omicron than it is with Delta, there's still the danger that you're going to have a surging of hospitalizations that might stress the health care system.”
In addition to the market’s consolidation, an absence of major data/events and off in multiple bourses also underpin the latest corrective pullback in gold prices.
Even so, recently increasing hopes of the Fed’s faster rate-hikes in 2022 and virus woes are likely to challenge gold buyers. For that matter, the Federal Open Market Committee (FOMC) Meeting Minutes and Friday’s US Nonfarm Payrolls (NFP) will be crucial to watch. For intraday, final readings of the US Markit Manufacturing PMI for December may offer immediate directions.
Technical analysis
A clear upside break of a 10-week-old horizontal resistance, near $1,814-16, enabled gold buyers to refresh monthly top on Friday. The run-up gained support from firmer RSI and bullish MACD signals, keeping gold buyers hopeful of late.
However, tops marked in July and September, around $1,834, become a tough nut to crack.
Adding to the upside filters are multiple levels marked near $1,850 and November’s peak of $1,877.
Meanwhile, pullback moves remain less interesting until staying beyond the previous horizontal resistance, now support around $1,816-14.
Following that, the $1,800 threshold will precede 100-DMA level surrounding $1,794 and an ascending support line from August, near $1,782, becomes the key to watch.
Gold: Daily chart
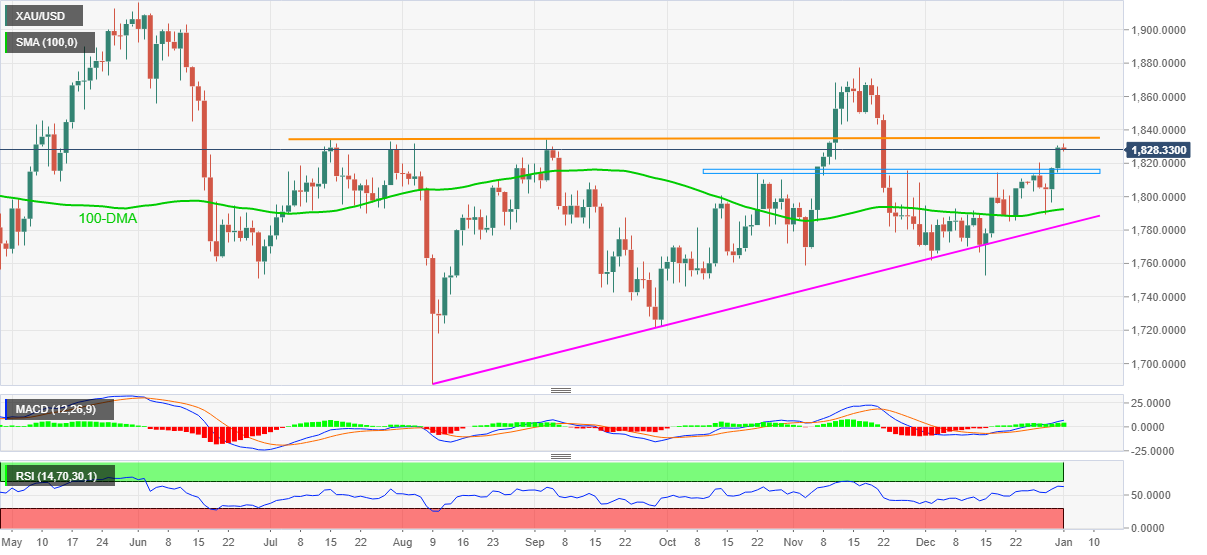
Trend: Further upside expected
| Time | Country | Event | Period | Previous value | Forecast |
|---|---|---|---|---|---|
| 08:30 (GMT) | Switzerland | Manufacturing PMI | December | 62.5 | 61 |
| 08:50 (GMT) | France | Manufacturing PMI | December | 55.9 | 54.9 |
| 08:55 (GMT) | Germany | Manufacturing PMI | December | 57.4 | 57.9 |
| 09:00 (GMT) | Eurozone | Manufacturing PMI | December | 58.4 | 58 |
| 14:45 (GMT) | U.S. | Manufacturing PMI | December | 58.3 | 57.8 |
| 15:00 (GMT) | U.S. | Construction Spending, m/m | November | 0.2% | 0.6% |
JP Morgan conveyed overall bullish bias for S&P 500 in its latest strategy report. The US banker cites using technical analysis, also spots risk catalysts, to suggest further advances of the key US equity gauge.
Important lines
The S&P 500 Index continues in a fairly low volatility bull market.
We expect those conditions to dominate the first half of next year, albeit at a slightly lower rate of change.
We suggest using any short- to medium-term periods of risk-off to add to core long exposure.
In our view, the 4430-4465 Sep-Oct pattern breakout and other nearby support levels mark a new floor.
Read: S&P 500: Will rally continue?
- USD/CHF refreshes intraday high, snaps five-day downtrend to bounce off two-month low.
- Previous support lines from August, January 2021 restrict recovery moves.
- 50% Fibonacci retracement, November’s low on bear’s radar.
- Descending RSI line, the key support breaks keep sellers hopeful.
USD/CHF rebounds from a two-month low to defend the 0.9100 threshold, around 0.9130 during Monday’s Asian session. In doing so, the Swiss currency (CHF) pair rises for the first time in the last six days to offer a positive start to 2022.
The corrective pullback takes place from the 50% Fibonacci retracement (Fibo.) of the January-April 2021 upside. However, the key support-turned-resistance lines challenge USD/CHF buyers. Also adding to the bearish bias is the downward sloping RSI line, not oversold.
That said, the USD/CHF recovery may initially aim for a four-month-old resistance line, near 0.9135, a break of which will direct buyers towards another previous support line, close to 0.9150.
While a clear upside break of 0.9150 enables the pair to aim for the 0.9200 round figure, a descending resistance line from November 24, around 0.9235, will challenge the quote’s further advances.
On the flip side, the 50% Fibo. level of 0.9116 and 0.9100 are likely immediate supports to watch during the quote’s fresh downside.
Following that, November’s low of 0.9088 and 61.8% Fibonacci retracement level of 0.9031 will be in focus.
USD/CHF: Daily chart
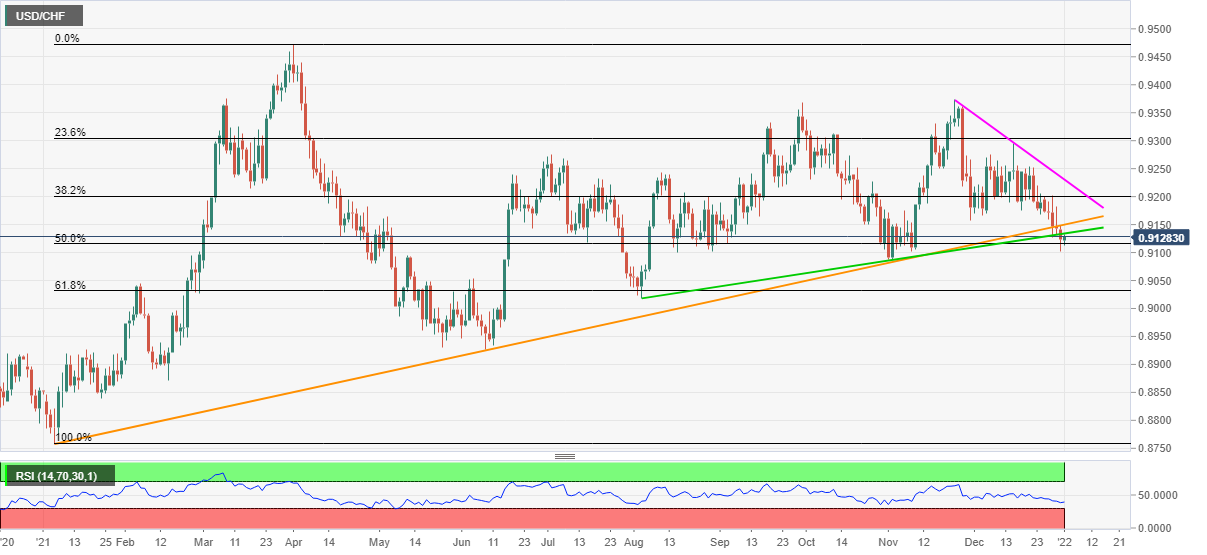
Trend: Bearish
- EUR/USD bulls giving ground back at the start of what could be a busy week.
- Traders are still out on holidays, but US events will make for a jam-packed event week.
EUR/USD is down some 0.1% on the day so far and has been trading between 1.1361 and 1.1379 so far. The markets are still in holiday mode with Australia, New Zealand and Japan out in Asia and London traders will be enjoying a bank holiday in observation of New Year's Day.
US event week ahead
However, the week will quickly move into gear with a busy US schedule on the calendar. At the end of the week, the US jobs market will be the showdown event with the US Nonfarm Payrolls report.
''The late-December COVID surge likely came too late to prevent a pickup in US payrolls after the gain in November (210k) appeared to be held down by an overly aggressive seasonal factor,'' analysts at TD Securities explained.
Before then, however, the US dollar will be taking cues from potentially slowing in the ISMs on the 4th. The levels should remain high according to analysts at TD securities.
''We expect the services index to decline more markedly following November's eye-popping jump to 69.1—an all-time high—and given the likely initial impact from Omicron. The MFG index probably fell below the 60 mark for the first time in four months. Anything over 60 is exceptionally strong.''
The Federal Open Market Committee minutes Following the FOMC's decision to double the pace of QE tapering and the projection of a significantly more hawkish dot plot will be the focus before then.
''Focus will now turn to the elements that led to the evolution of views among policymakers (including on "maximum employment") after the November meeting,'' analysts at TD Securities said.
- USD/TRY pauses five-day uptrend, seesaws around a fortnight high.
- Turkish energy authorities raise electricity, natural gas prices for 2022.
- Market sentiment dwindles with firmer US stock futures, T-bond yields.
- Turkish CPI for December, US Markit Manufacturing PMI should be watched for fresh impulse.
USD/TRY licks its wounds around $13.35 during Monday’s Asian session, after positing the heaviest yearly fall in two decades. In doing so, the Turkish lira pair ignores the downbeat news suggesting further strain to the national inflation.
As per the latest news Reuters, Turkey’s Energy Market Regulatory Authority raised electricity prices around 50% for lower-demand households and more than 100% for high-demand commercial users for 2022. The news adds, “Natural gas prices jumped 25% for residential use and 50% for industrial use in January, national distributor BOTAS said separately. The price rise was 15% for electricity-generating industrial use.”
Higher energy prices will challenge the Turkish government’s latest approach to battle inflation with out-of-the-box approaches. That said, the nation’s headlines Consumer Price Index (CPI) rose to 21.31% in November, expected 30.6% for December during Monday’s publish.
It’s worth noting that Turkish President Recep Tayyip Erdogan tried to regain voters’ confidence ahead of the 2023 elections as the latest polls raise fears for the national leader. "We have been waging the battle to save the economy from the cycle of high interest rates and high inflation," said Erdogan per Reuters.
Elsewhere, receding fears of the coronavirus variant from South Africa, namely Omicron, favor market sentiment at the start of 2022. However, an absence of major traders due to the holiday mood restricts liquidity.
Looking forward, Turkish CPI and final readings of the US Markit Manufacturing PMI for December may offer intermediate clues to the USD/TRY prices.
Technical analysis
USD/TRY’s latest pullback fails to comply with the receding bearish bias of the MACD and the quote’s sustained trading beyond the 21-DMA, which in turn suggests the quote’s further advances.
Even so, the 50% Fibonacci retracement (Fibo.) level of November-December run-up, near $13.95, can challenge short-term USD/TRY upside. Following that, the mid-December peak near $14.65, will precede the $15.00 round figure to lure the bulls.
On the contrary, a downside break of the 21-DMA level of $13.35 will direct the sellers towards the 61.8% Fibo. level near $12.85, a break of which will direct USD/TRY prices towards the 10-DMA support of $12.29.
Overall, USD/TRY remains in the recovery mode with the short-term upside likely limited.
USD/TRY: Daily chart
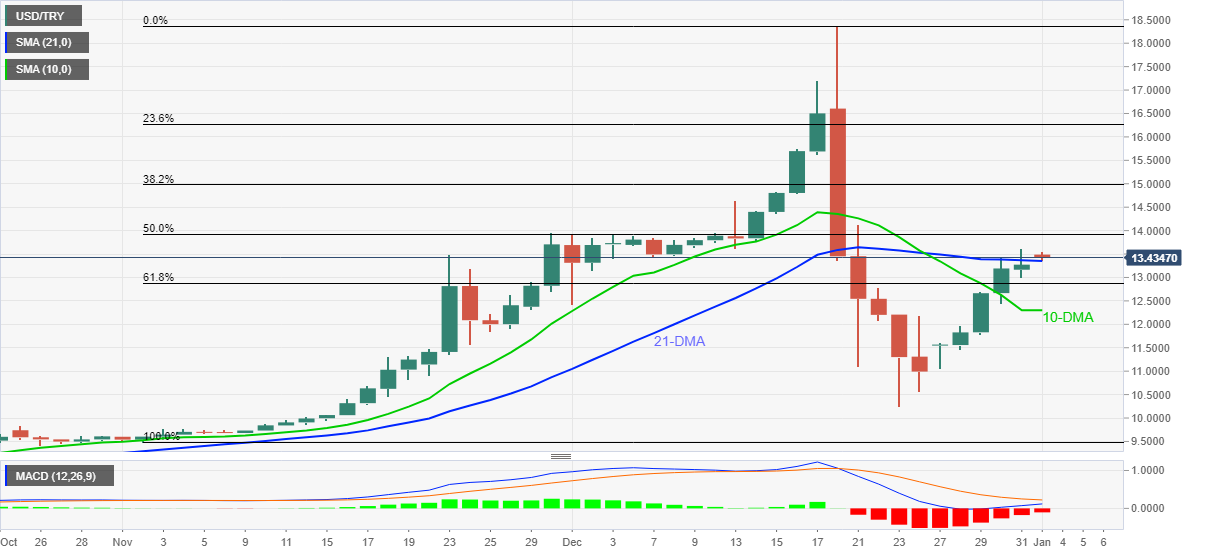
Trend: Further recovery expected
- EUR/JPY is holding tight in bullish territory for the open.
- EUR/JPY bulls seeking a discount from a healthy correction.
EUR/JPY is consolidating a bullish impulse and the focus is on a correction before higher prices through 131 the figure. The following illustrates the bias from an hourly perspective for the opening sessions of the week.
EUR/JPY H1 chart
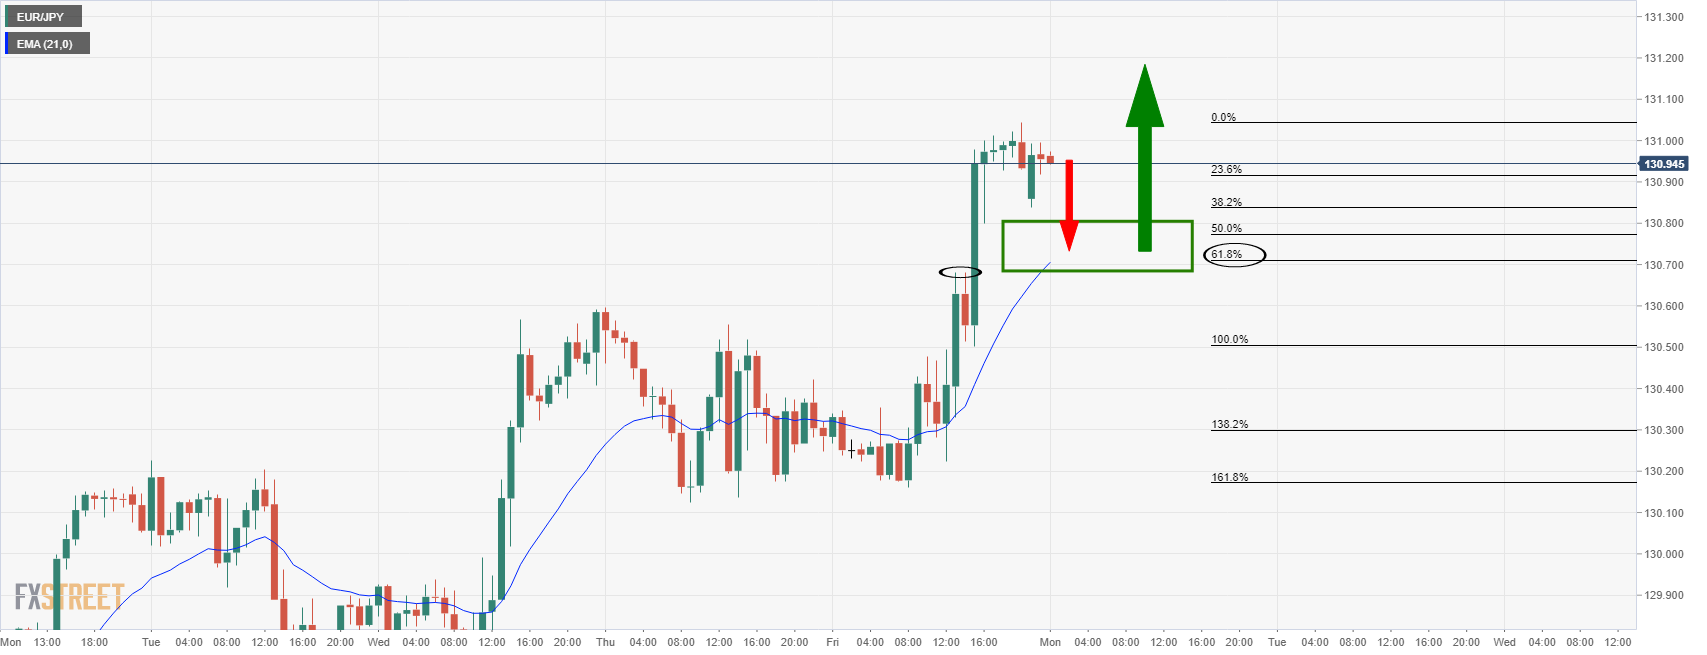
The price on the hourly time frame has an inefficiency as per the wicks between 130.68 and 130.80 and the 61.8% Fibonacci ratio sits near 130.70 and has a confluence with the 21-EMA.
This makes for a compelling area of potential support. Should this area act as support, then an upside continuation through 131 the figure would be expected.
- DXY remains pressured around multi-day low as sellers attack the key support.
- Bearish MACD signals, clear downside break of seven-week-old ascending trend line keep sellers hopeful.
- Further downside will aim for 94.85-80 strong support, 21-DMA guards immediate upside.
US Dollar Index (DXY) remains pressured around late November levels, close to 95.60, during Monday’s Asian session.
In doing so, the greenback gauge keeps Friday’s downside break of the previously important support line from November 16, now resistance around 95.85.
The trend line breakdown gets support from the bearish MACD signals and repeated failures to cross the 21-DMA to suggest further downside of the US Dollar Index.
That said, the November 12-15 lows near the 95.00 threshold may offer an intermediate halt during the gauge’s anticipated plunge to 94.85-80 zone comprising an ascending support line from early September and a three-month-long previous resistance line
Alternatively, recovery moves need to cross the support-turned-resistance line near 95.85 to recall the buyers.
Even so, a convergence of the 21-DMA and descending resistance line from December 15, around 96.20, will challenge the DXY’s further upside.
DXY: Daily chart
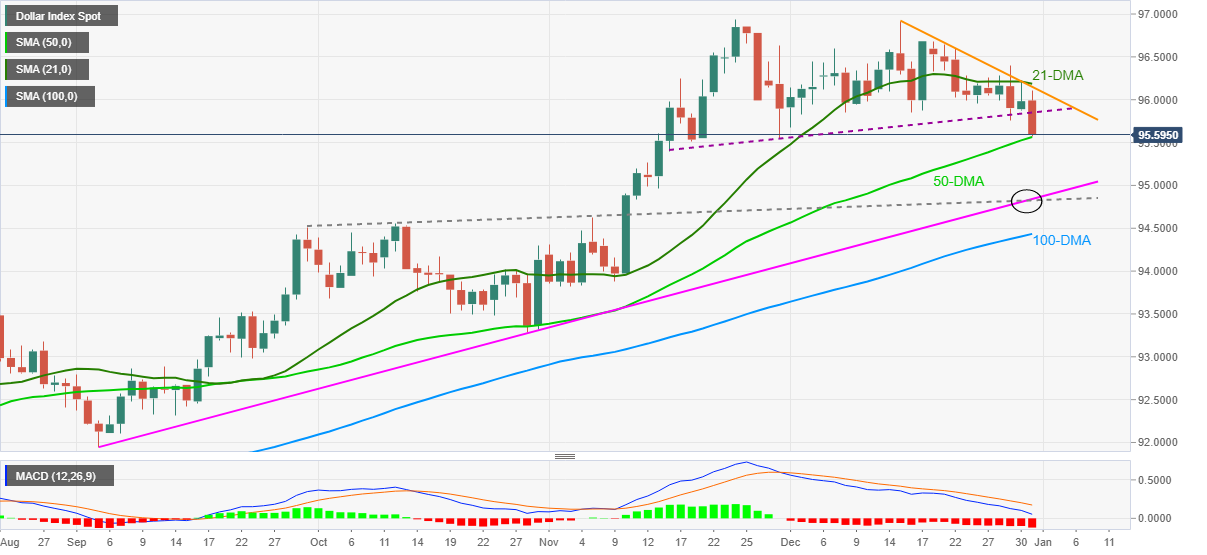
Trend: Further weakness expected
| Pare | Closed | Change, % |
|---|---|---|
| AUDUSD | 0.72773 | 0.34 |
| EURJPY | 130.971 | 0.61 |
| EURUSD | 1.13862 | 0.58 |
| GBPJPY | 155.684 | 0.3 |
| GBPUSD | 1.35347 | 0.3 |
| NZDUSD | 0.68509 | 0.36 |
| USDCAD | 1.26482 | -0.71 |
| USDCHF | 0.9113 | -0.21 |
| USDJPY | 115.024 | 0 |
- USD/JPY is holding in bullish territory in the 115 area.
- Bulls eye the 118 areas on a continuation of the monthly bullish trend.
USD/JPY has enjoyed a decent spell on the bid into the end of the year, rising from a low of 112.53 near the start of December and potentially climaxing around the current levels near 115.15. However, on a break of 115.53, the bulls could be encouraged to target 118.50 for weeks ahead as illustrated below.
Meanwhile, the week ahead will be busy for the US dollar traders. The calendar's highlights will be ISM data, the Federal Open Market Committee minutes and Nonfarm Payrolls at the end of the week. Additionally, US president Joe Biden's nominations for three Fed governor seats could also garner attention.
US events in focus
At the end of the week, the US jobs market will be back in vogue with the US Nonfarm Payrolls report. ''The late-December COVID surge likely came too late to prevent a pickup in US payrolls after the gain in November (210k) appeared to be held down by an overly aggressive seasonal factor,'' analysts at TD Securities explained.
For the day ahead, it is quiet with some major economies in APAC observing New Year's Day. European markets will also be lacking volumes with London on a Bank Holiday as well. Instead, the US dollar will be taking cues from potentially slowing in the ISMs on the 4th. However, the levels should remain high according to analysts at TD securities.
''We expect the services index to decline more markedly following November's eye-popping jump to 69.1—an all-time high—and given the likely initial impact from Omicron. The mfg index probably fell below the 60 mark for the first time in four months. Anything over 60 is exceptionally strong.''
USD/JPY technical analysis
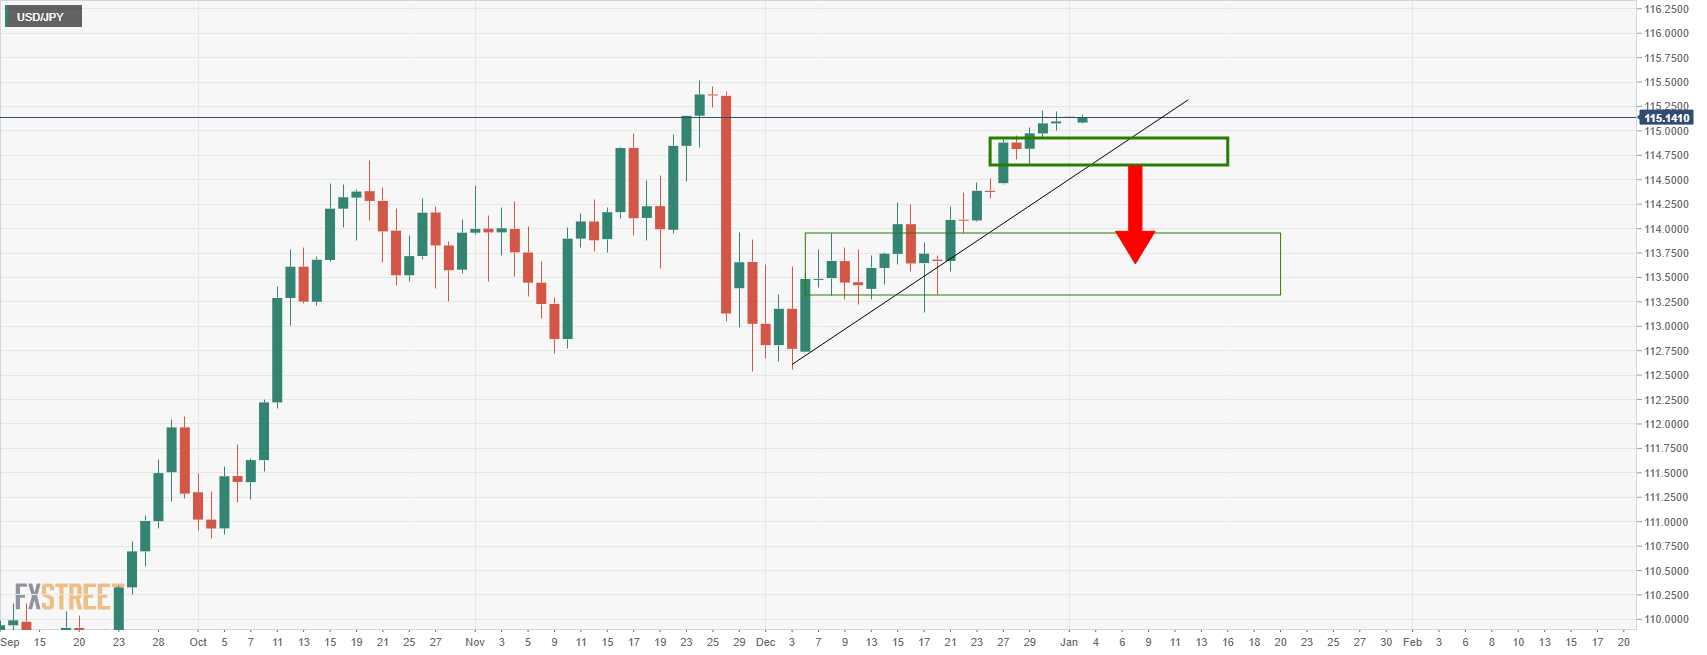
The above daily chart illustrates the rising trend and prospects of a break to the downside below the dynamic support line.
The chart below shows the monthly bias to the upside.
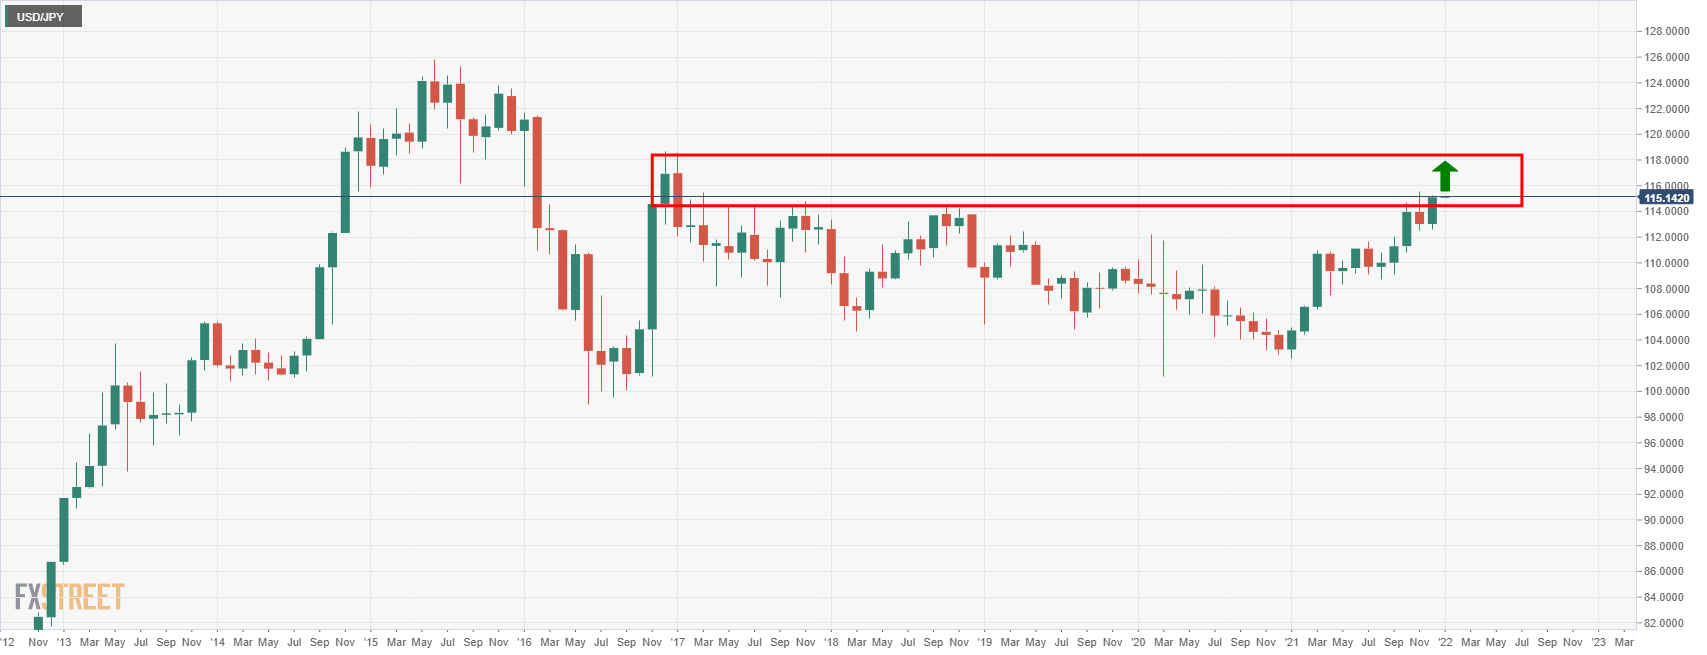


© 2000-2026. Sva prava zaštićena.
Sajt je vlasništvo kompanije Teletrade D.J. LLC 2351 LLC 2022 (Euro House, Richmond Hill Road, Kingstown, VC0100, St. Vincent and the Grenadines).
Svi podaci koji se nalaze na sajtu ne predstavljaju osnovu za donošenje investicionih odluka, već su informativnog karaktera.
The company does not serve or provide services to customers who are residents of the US, Canada, Iran, The Democratic People's Republic of Korea, Yemen and FATF blacklisted countries.
Izvršenje trgovinskih operacija sa finansijskim instrumentima upotrebom marginalne trgovine pruža velike mogućnosti i omogućava investitorima ostvarivanje visokih prihoda. Međutim, takav vid trgovine povezan je sa potencijalno visokim nivoom rizika od gubitka sredstava. Проведение торговых операций на финанcовых рынках c маржинальными финанcовыми инcтрументами открывает широкие возможноcти, и позволяет инвеcторам, готовым пойти на риcк, получать выcокую прибыль, но при этом неcет в cебе потенциально выcокий уровень риcка получения убытков. Iz tog razloga je pre započinjanja trgovine potrebno odlučiti o izboru odgovarajuće investicione strategije, uzimajući u obzir raspoložive resurse.
Upotreba informacija: U slučaju potpunog ili delimičnog preuzimanja i daljeg korišćenja materijala koji se nalazi na sajtu, potrebno je navesti link odgovarajuće stranice na sajtu kompanije TeleTrade-a kao izvora informacija. Upotreba materijala na internetu mora biti praćena hiper linkom do web stranice teletrade.org. Automatski uvoz materijala i informacija sa stranice je zabranjen.
Ako imate bilo kakvih pitanja, obratite nam se pr@teletrade.global.
транcфери