- Analiza
- Novosti i instrumenti
- Vesti sa tržišta
Novosti i prognoe: devizno tržište od 30-12-2021
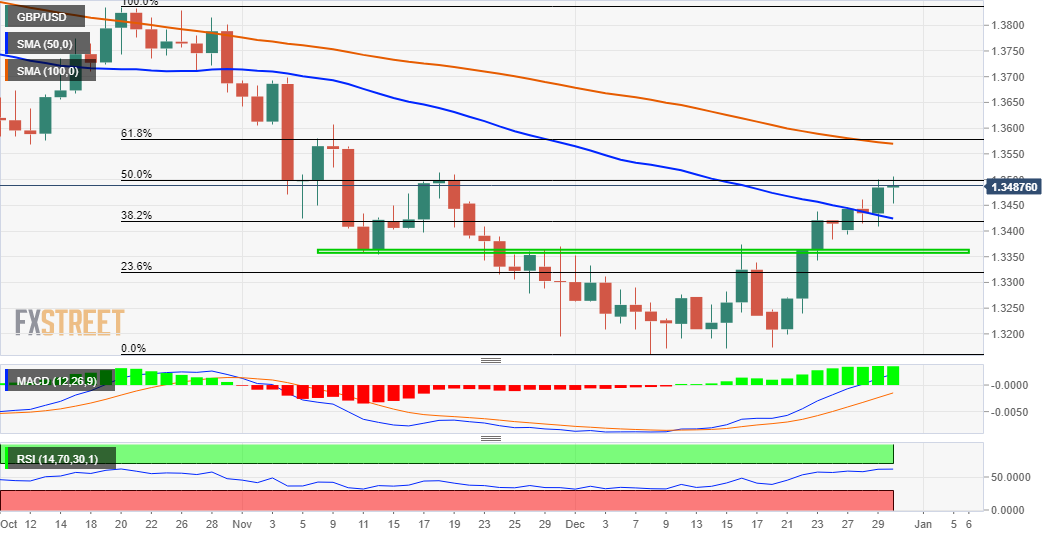
- GBP/USD grinds higher at multi-day top, bulls taking a breather after two-day uptrend.
- UK’s Sefcovic said, “London has breached great deal of trust.”
- Britain aims for ‘surge hubs’ as virus cases refresh record top.
- New Year’s Eve, light calendar to restrict market performance during the last of 2021.
GBP/USD takes rounds to 1.3500 during Friday’s Asian session, after refreshing the 10-week high the previous day. In doing so, the cable buyers pause following two consecutive days of run-up amid lackluster markets and no major catalysts, not to forget the year-end liquidity crunch.
Although the UK continues to suffer from the South African covid variant, namely Omicron, the government’s active response and medical studies taming fears of the virus strain keep GBP/USD buyers hopeful. Also helping the bulls could be the US dollar’s struggle, or preparations for the Fed rate hike in 2022, after a stellar 2021.
That said, Britain’s National Health Services (NHS) unveiled plans for “surge hubs” on Thursday. The so-called temporary medical housing facility became needed after the UK reported 189,213 cases.
The UK isn’t the only one suffering from the virus and has to control some of the year-end celebrations, the US and Europe are also in the line. That said, global policymakers advise people to stay cautious while cheering for 2022. Among them was World Health Organization Director-General Tedros Adhanom Ghebreyesus who urged people, per Reuters, “It's better to cancel now and celebrate later, than to celebrate now and grieve later.”
On a different page, European Commission vice-president Maros Sefcovic conveyed his dislike, for the UK’s Article 16 threats, via German news website Der Spiegel. Even so, the policymaker was sounding cautiously optimistic over finding a Brexit solution. It should be noted that the post-Brexit border checks take effect from January and increase the pessimism on the matter, which in turn should have the GBP/USD prices.
Elsewhere, the US policymakers remain hopeful of reaching an agreement over the Build Back Better (BBB) plan while also trying to placate fears over the Omicron. Talking about data, the US Initial Jobless Claims eased to 198K versus 208K expected during the week ended on December 24. Further, Chicago Purchasing Managers’ Index rose past 62.0 forecast to 63.1 for December.
It’s worth noting that the Wall Street benchmarks posted mild losses whereas the US 10-year Treasury yields consolidated the heaviest daily jump in three weeks, posted the previous day. That said, the S&P 500 Futures remain lackluster around 4,775 at the latest.
Moving on, GBP/USD prices are likely to remain sidelined amid a lack of major data/events and the year-end thin liquidity conditions.
Technical analysis
50% Fibonacci retracement of October-November downside, around 1.3500, restricts immediate moves of the GBP/USD pair. However, a clear upside break of the 50-DMA, at 1.3420 by the press time, keeps buyers hopeful.
Late Thursday, US President Joe Biden and his Russian counterpart Vladimir Putin held a telephonic conversation over the Russia- Ukraine tussles.
“U.S. President Joe Biden and his Russian counterpart Vladimir Putin on Thursday warned each other that an escalation of tensions over Ukraine could rupture relations between the two countries, U.S. and Russian officials said,” per Reuters.
The news also quotes White House press secretary Jen Psaki’s statement saying, “He (Biden) made clear that the United States and its allies and partners will respond decisively if Russia further invades Ukraine.”
On the other hand, Kremlin said, per the news, “Putin told Biden that any sanctions could rupture ties between Russia and the United States and would be a big mistake.”
It was also mentioned in the news that, “But Kremlin aide Yuri Ushakov said Russia was satisfied with their phone conversation, which he said centered on security guarantees that Moscow wants from the West amid a build-up of Russian forces close to the Ukrainian border.”
FX implications
Although the news hints at further challenges to the market sentiment, the year-end liquidity crunch and New Year’s Eve in major Asia-Pacific nations restrict the reaction to the news update. That said, the risk barometer pair AUD/USD remains pressured 0.7245 by the press time.
Read: AUD/USD: Gravestone Doji at monthly top probe bulls below 0.7300, China PMI eyed
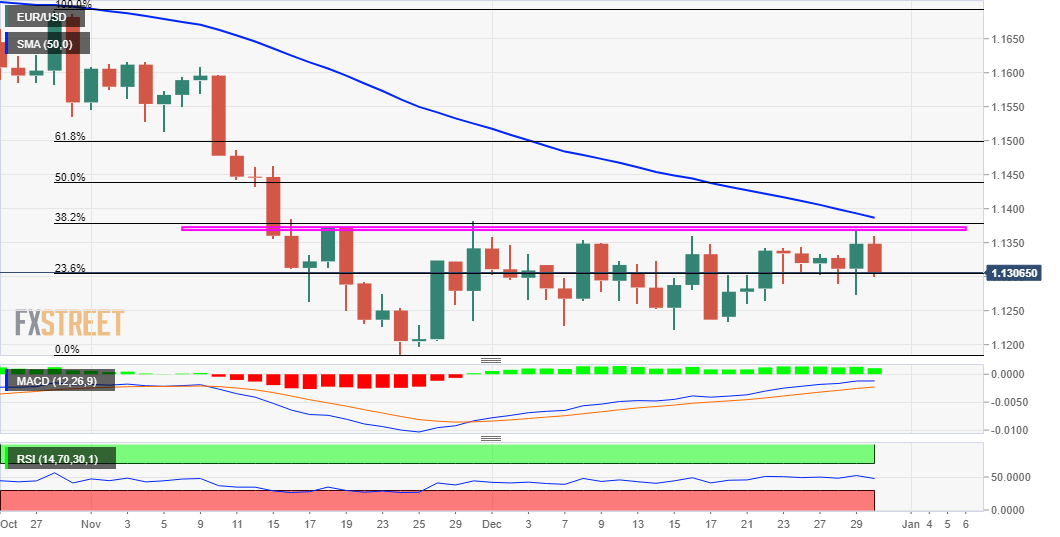
- EUR/USD fades bounce off 100-SMA, dropped the most in two weeks the previous day.
- Steady RSI, sluggish MACD hints at extended grind between 100-SMA and monthly resistance line.
- Mid-November tops add to the upside filters, five-week-old rising trend line acts as additional support.
EUR/USD consolidates the heaviest daily loss in a fortnight with a choppy range above 1.1300 during Friday’s initial Asian session. That said, the quote seesaws near 1.1325 by the press time.
In doing so, the major currency pair struggles to keep the bounce off 100-SMA after taking a U-turn from the monthly high on Wednesday.
Although EUR/USD buyers keep returning from the 100-SMA, sluggish oscillators, namely the MACD and RSI, hints at another inactive daily performance by the pair as it approaches 2022.
That said, a downside break of the 100-SMA level of 1.1300 will have another support to watch, namely a two-week-old ascending trend line near 1.1280.
Also challenging the EUR/USD bears is an upward sloping support line from November 30, near 1.1245.
Meanwhile, an upside clearance of the monthly horizontal hurdle around 1.1360 will need validation from the November 16 peak of 1.1385 to convince the EUR/USD bulls.
Following that, a run-up toward the tops marked during June and March of 2020, respectively near 1.1425 and 1.1500, can’t be ruled out.
EUR/USD: Four-hour chart
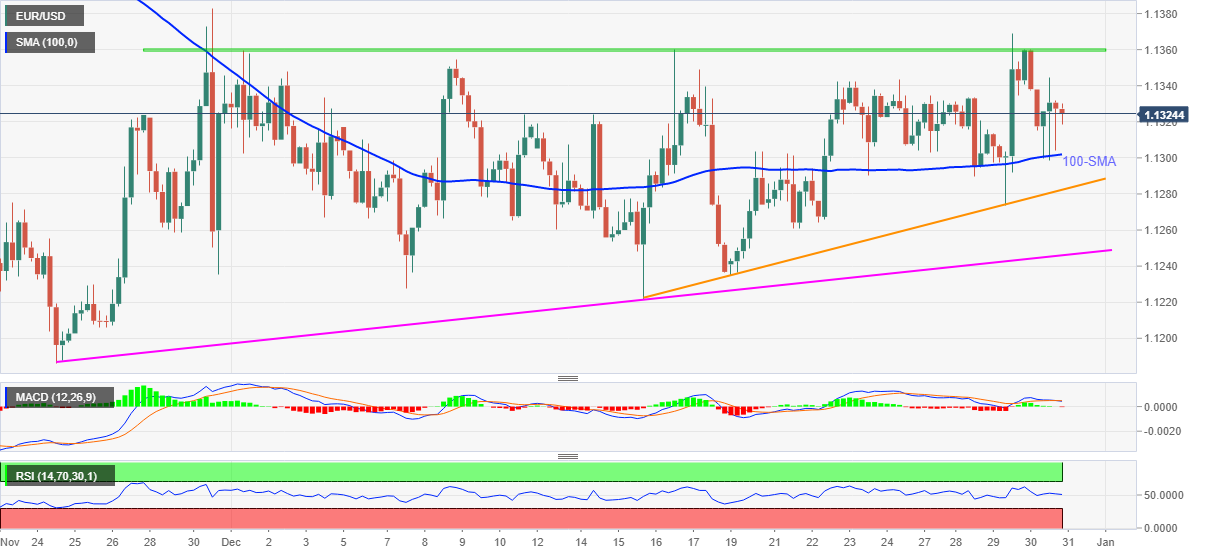
Trend: Sideways
- AUD/USD seesaws after forming bearish candlestick near monthly high.
- Market sentiment dwindles as New Year approaches, Omicron cases rise.
- Aussie PM Morrison refrained from any major activity restrictions after snap National Cabinet Meeting.
- Key markets in Asia-Pacific are off due to New Year’s Eve, China’s official PMI for December will be eyed.
AUD/USD struggles around the monthly top, taking rounds to 0.7250-60 during early Friday morning in Asia.
The Aussie bulls again faced rejection near 0.7275 the previous day, while forming a bearish candlestick chart at the monthly top as mixed sentiment and a light calendar joins thin end-of-year liquidity conditions.
The pair’s latest performance portrayed the market’s inactive status during the final days of 2021, even as the South African covid variant named Omicron continues to hurt the sentiment with a jump in cases.
After witnessing a rally in the daily covid infections at home and abroad, the Australian Prime Minister decided to alter the definition of ‘close contact’ with the infected during the emergency National Cabinet Meeting. “We need to reset how we think about the pandemic, and how we manage ourselves and the things we need to do as governments,” said Aussie PM Morrison.
That said, Australia’s populous state New South Wales (NSW) again reports a jump in the COVID-19 figures while Victoria also prints an all-time high of 5,919 cases and seven virus-linked death per ABC News. “NSW's daily COVID-19 case tally has nearly doubled for the second time in three days, with 21,151 infections and six deaths recorded,” said ABC News.
Elsewhere, Reuters tally for the US coronavirus numbers suggests a record number of newly reported cases, based on the seven-day average, while printing above 290,000 figures for the second consecutive day. “In Europe, where almost one million people have died of coronavirus over the past 12 months, traditional concerts and firework displays that typically draw thousands of people onto the streets were canceled in most major cities, including London, Paris, Zurich, Brussels, Warsaw and Rome,” said Reuters.
Talking about data, the US Initial Jobless Claims eased to 198K versus 208K expected during the week ended on December 24. Further, Chicago Purchasing Managers’ Index rose past 62.0 forecast to 63.1 for December.
While portraying the market mood, the Wall Street benchmarks posted mild losses whereas the US 10-year Treasury yields consolidated the heaviest daily jump in three weeks, posted the previous day.
It’s worth noting that the firmer US data and Omicron fears underpinned the US dollar’s safe-haven demand but cautious optimism of the global policymakers joined the year-end lacklustre moves to restrict the AUD/USD moves.
Given the holiday at home, as well as the light calendar, AUD/USD prices may remain sluggish. However, China’s official PMIs for December will be important to watch. That said, the headline NBS Manufacturing PMI is expected to remain unchanged at 50.1 while Non-Manufacturing PMI may improve to 53.1 versus 52.3, which in turn can help the Aussie pair to overcome the immediate hurdle on firmer readings.
Technical analysis
AUD/USD formed “Gravestone Doji” bearish candlestick near 0.7275 key hurdles comprising monthly rising wedge’s resistance line and 50% Fibonacci retracement (Fibo.) of October-December downside.
Adding to the upside filters is the 100-DMA level of 0.7290 that will act as a validation point for the further rally towards the mid-November swing high of 0.7371.
Alternatively, pullback moves can retest 38.2% Fibo. level surrounding 0.7200 but a three-month-old horizontal area near 0.7175-70 will restrict any further downside.
- Spot gold has been pressing higher in recent trade and look to be on course to test Tuesday’s $1820 highs.
- XAU/USD has been taking its cue on Thursday from falling real yields and rising inflation expectations.
- Traders and analysts have been warning against reading too much into any market moves this week given year-end illiquidity.
Spot gold prices (XAU/USD) have been pressing higher in recent trade and look to be on course to test Tuesday’s $1820 highs. At current levels close just above $1815, spot gold is on course to close out the session about $13 or roughly 0.7% higher. A strong weekly US jobless claims report, that showed initial claims dropping back under 200K (below pre-pandemic levels) and continued claims falling to just above 1.7M (in line with pre-pandemic levels) does not seem to have weighed on the precious metal.
Typically, strong labour market data would weigh on gold as it would be interpreted as having hawkish implications for Fed policy. But the Fed has gone to great lengths in recent weeks, including at its latest meeting, to acknowledge the tightness of the current US labour market, so Thursday’s data does little to surprise the bank or change this narrative. Instead, spot gold has been taking its cue on Thursday from falling real yields and rising inflation expectations.
The 5-year TIPS yields dropped under -1.63% in recent trade, its lowest level since 9 December and is down nearly 10bps on the day. That has not been accompanied by a fall in the nominal 5-year yield of equal magnitude, thus pushing 5-year break-even inflation expectations higher. 5-year breakevens moved above 2.90% on Thursday and look on course to test the early December highs at 2.92%. Remember that lower real yields is a positive for non-yielding gold as its lowers the “opportunity cost” of holding the precious metal, while higher inflation expectations increase the demand for inflation protection, which gold is seen as offering.
It's not clear why the demand for inflation protection in the form of TIPS has surged this week (hence pushing real yields lower). Traders and analysts have been warning against reading too much into any market moves this week, which are said to be exacerbated by low liquidity/volumes given many market participants are away for year-end holidays. Volumes and conviction are set to return next week and at the start of the new year, with plenty of US data to also give markets some direction/provide talking points.
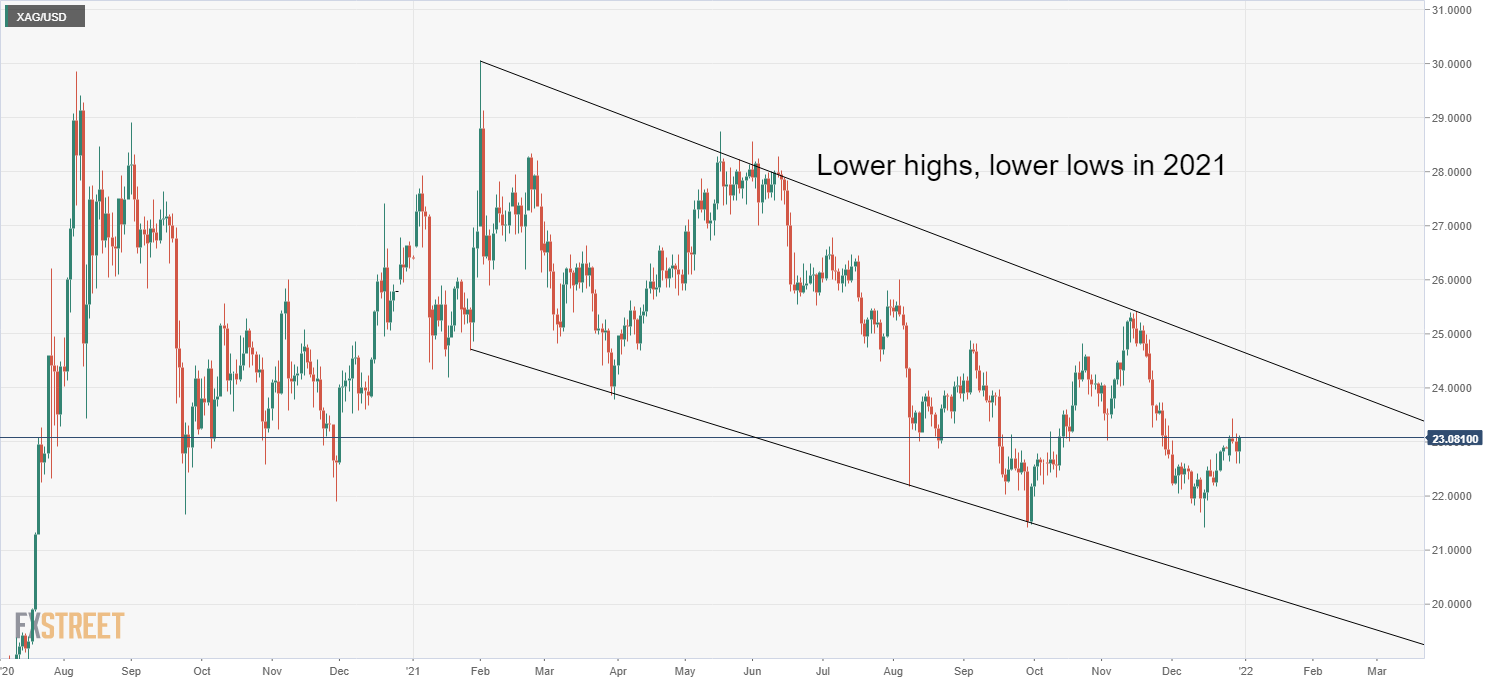
- Spot silver prices have been choppy over the last few days, swinging between an 80 cents $22.60 to $23.40ish range.
- XAG/USD has recovered back above $23.00 on Thursday, putting on course for a 1.0% monthly gain but 12% annual loss.
- XAG/USD traders should keep their eyes on inflation expectations and real yields in 2022 as the Fed pivots hawkishly.
Spot silver (XAG/USD) prices have been choppy over the last few days, swinging between an 80 cents $22.60 to $23.40ish range in low liquidity/volume trading conditions. Right now, spot prices are trading slightly to the north of the $23.00 level again for an on-the-day gain of just over 1.0%. That means XAG/USD should end the month also about 1.0% higher, having recovered more than 7.5% from early monthly lows in the $21.50 area after spot prices found strong support at the late September (and annual) lows. On the year and with one trading session to go, spot silver prices are on course to post losses of slightly more than 12.0%.
Back to spot silver’s price action over the past few days; the confusing moves seem to have taken their cue from bond market developments. Real yields have been falling throughout the week, with 5-year TIPS now under -1.60% having begun the week above -1.50%, which has ultimately offer spot silver and other precious metals support. But nominal yields have been choppy, with the 5-year jumping as high as 1.31% on Wednesday from beginning the week under 1.25%, which coincided with silver prices pulling back from Tuesday’s $23.40 highs to Wednesday’s $22.60 lows. Nominal yields have since backed off, with the 5-year back around 1.27% and this has helped silver recover to current levels above $23.00.
The divergence between nominal (rising on the week) and real yields (falling sharply on the week) has seen break-even inflation expectations surge. 5-year breakevens began the week around 2.75% but have surged to close to 2.90%, the highest since 9 December. Whether this translates into a more lasting upturn and a challenge of November highs in the 3.30% area over the course of Q1 2022 remains to be seen, but could be a source of support for precious metals like silver which are seen as an inflation hedge.
With it seeming increasingly likely that the Fed is going to start its rate hiking cycle in March or, at the latest, May, this may be enough to keep inflation expectations in check, so long as markets believe a proactive Fed will squash inflation. If inflation expectations do fall back from current levels and perhaps head back towards Q2/3 2021 lows in the 2.40% area, this could put upwards pressure on real yields. Given the negative correlation between real yields (seen as a proxy for “opportunity cost”) and non-yielding precious metals, this would present an important headwind. Spot silver’s major patter in 2021 was lower highs followed by lower lows and it seems likely this will continue into 2022, which could see XAG/USD drop under key support in the $21.00s zone.
What you need to know on Friday, December 31:
Major pairs held within familiar levels on Thursday, trading choppily amid thinned market conditions. Most financial markets will be closed on Friday, amid the New Year’s Eve holiday. Wall Street will operate normally, while the bonds markets will close earlier. Market’s are likely to remain choppy.
The macroeconomic calendar will remain empty through all Friday, although China will publish the December official PMIs.
Coronavirus contagions continue escalating to record cases. Italy reported 126K new contagions, Spain 161K.
The EUR/USD pair is trading a few pips above the 1.1300 level, while GBP/USD managed to reach a fresh monthly high of 1.3521. The Canadian dollar was the strongest, as USD/CAD fell to the 1.2740 price zone. The AUD/USD pair, on the other hand, met sellers for a second consecutive day around 0.7275. USD/JPY maintained a positive tone, trading at around 115.10.
Crude oil consolidate gains, while gold prices ticked higher, with both holding within familiar levels.
Wall Street edged higher, with the S&P reaching record highs. US Treasury yields held near Thursday’s high, with the yield on the 10-year note currently at 1.52%.
Top 3 Price Prediction Bitcoin, Ethereum, Ripple: Time to squeeze out the last gains for 2021
Like this article? Help us with some feedback by answering this survey:
- USD/CAD hit more than two-week lows under 1.2750 on Thursday as risk appetite and crude oil prices remains buoyant.
- Trading conditions will be subdued on Friday, which is New Year’s Eve, but will pick up next week.
USD/CAD broke below key support in the 1.2760s to hit its lowest level in over two on Thursday just under the 1.2750 mark. That translates into on the day losses of around 0.3%. Trade has been tentative this week with FX markets largely in holiday mode with many participants in Canada, the US, Europe and elsewhere away for Christmas and New Year’s celebrations. But that hasn’t stopped the loonie from benefitting from a recent drastic improvement in the market's appetite for risk, which has helped push US equity benchmarks to record levels and pushed oil prices to monthly highs around their pre-Omicron levels.
Evidence, in the form of independent studies and real-time data, increasingly points to the Omicron Covid-19 variant being substantially milder than prior strains and the US last week also approved two highly effective at-home Covid-19 treatment pills for at-risk patients. Meanwhile, nations in Europe (the UK, France and Spain) are holding off on locking down to curb the rapid transmission of Omicron with health care systems currently a long way off being at risk of being overwhelmed. This, as well as positive seasonality that typically supports US equities in the final days of the year, has been a key driver the recent upturn in risk appetite. To recap, WTI fell as low as $66.00 last Monday, coinciding with USD/CAD spiking above 1.2950, but has since rallied to the $76.00s, coinciding with USD/CAD dropping over 1.5% to current levels under 1.2750.
Recent selling pressure in USD/CAD has seen the pair relinquish the 21-day moving average in the 1.2800 area which had been acting as a magnet to the price action for most of the last week. Trading conditions will be subdued on Friday given most European markets will be shut or closing shop early for New Year’s Eve and though US and Canadian markets will be open as usual, many market participants will in North America will likely also be exiting early. But in the new year, so long as risk appetite remains healthy and as long as markets continue to bet that the BoC will kick off its rate hike cycle by the end of Q1 2022, USD/CAD might be headed back towards December lows around 1.2600.
- The S&P 500 printed a fresh record high at 4808 and looks on course for a fresh record closing high.
- The index is on course for a monthly gain of about 5.0% and an annual gain of nearly 28%.
The S&P 500 hit a fresh intra-day record high on Thursday at 4808, but for the most part has traded within the ranges established over the last three sessions, where the index has mostly traded between the 4775 and 4805 levels. Right now, the index trades almost bang on the 4800 level and with modest gains of about 0.1% on the session. If it can close at current levels, that would mark a new record closing high.
Trading volumes remain incredibly low, as is typical of the final trading week of the year given the high proportion of market participants away for Christmas/New Year’s celebrations, which goes some way to explain the lack of volatility/trading opportunities. In that regard, things will get a lot more interesting next week with a much busier economic calendar and amid the return of most market participants from holidays.
The S&P 500 is up about 1.5% on the week and an impressive near-6.0% higher versus last week’s sub-4530 lows, supported by a fading of concerns about the impact of Omicron on the global economy and earnings, as well as strong US data that has solidified confidence in the US economic health. Indeed, the latest weekly report that was stronger than expected, with initial claims dropping back under 200K, continued claims falling to a fresh post-pandemic low at 1.716M, putting it broadly back in line with pre-pandemic levels, while the insured unemployment rate dropped to 1.3% from 1.4%. If the S&P 500 can close out the session around 4800, that puts it on course for monthly gains of about 5.0% and annual gains of close to 28%.
Seasonality is another factor being cited by equity analysts as behind recent strength/ongoing support. Analysts noted earlier in the week that the final five days of each calendar year and then the first two of the next are typically associated with gains of about 1.3% in the S&P 500. In terms of the other major indices, the Nasdaq 100 index is on course to gain about 0.3% on the session and after moving back above 16.5K, though remains within the trading 16.4-16.6K trading range established over the last three sessions.
The Dow, meanwhile, managed to pip Wednesday’s peaks and print a fresh intra-day record high above 36.6K for the first time. The index has since slipped back to trade flat on the day around 36.5K. The CBOE S&P 500 volatility index, meanwhile, continues to trade with a negative bias and is back below 17.00 and approaching the mid-November lows just above 16.0.
- NZD/USD has backed off from earlier session highs above 0.6850 and is currently trading in the 0.6830s.
- Some see USD resuming its upwards trajectory in 2022, which would leave NZD/USD vulnerable to a drop back to 0.6700.
NZD/USD has backed off from earlier session highs to the north of the 0.6850 level after failing to mount a test of its early monthly highs in the 0.6860s and is currently trading in the 0.6830s, where it now trades roughly flat on the day. Since the start of last week, the pair has risen substantially in tandem with a drastic improvement in the market’s general appetite for risk that has seen global equities surge amid easing Omicron variant concerns. But for the most part this week, trade has been more subdued. To the downside, the pair has been supported by dip-buying interest every time it crossed under 0.6800 and neared its 21-day moving average at 0.6783, while the pair has struggled to hold above last week’s highs in the 0.6840s.
These trading conditions are typical of the final trading week of the year, which is typically marred by low liquidity/volumes amid a lack of market participants, many of whom in the Americas and Europe are on holiday for Christmas/New Year. That suggests things are unlikely to get substantially more interesting until next week. Indeed, next week sees the usual start of the month blockbuster data releases out of the US that includes the latest labour market report and ISM PMI surveys.
All indications are that the US economy has continued to fire on all cyclinders in December, with the spread of Omicron only really picking up in the latter stages of the month. That might be a downside risk for the January data, but the December data should all justify the Fed’s recent hawkish shift. Indeed, the latest weekly report that was stronger than expected, with initial claims dropping back under 200K, continued claims falling to a fresh post-pandemic low at 1.716M, putting it broadly back in line with pre-pandemic levels, while the insured unemployment rate dropped to 1.3% from 1.4%.
This is in fitting with the rapid progress towards full employment noted by Fed Chair Jerome Powell at this month’s Fed meeting. As a result, some FX strategists see the dollar resuming its upwards trajectory as 2022 begins and a potential first rate hike from the Fed in March nears. NZD/USD’s failure to push beyond early December highs (unlike AUD/USD and GBP/USD) suggests, from a technical perspective, that the pair is at risk of a gradual retracement back towards December lows in 0.6700 area.
- Mexican peso extends monthly gains versus US dollar.
- USD/MXN breaks uptrend line, tests 100-day moving average.
The USD/MXN is falling again on Thursday and is testing the 20.45/50 support area. It reached the lowest level since mid-November. Now the 20.58 level has become the immediate resistance.
The area around 20.50 also contains the 100-day simple moving average. A daily close below would be the first one since September.
Technical indicators point to the downside. The daily RSI is not yet at oversold levels, suggesting the decline could continue in the short term, particularly if the 20.45 support is broken. The next critical support is located at 20.30.
A recovery above 20.60 should alleviate the bearish pressure. While the next resistance stands at 20.70. A level that should favor a retreat if reached in the short term. The 20.90 area is critical: if the dollar rises above it could negate the current negative bias, favoring a consolidation. Only above 21.30 the greenback would start looking stronger.
USD/MXN daily chart
-637764792888292666.png)
- AUD/USD is currently probing fresh monthly higher above 0.7250, though is finding some technical resistance.
- The pair has remained resilient this week to surging Covid-19 infection rates in Australia.
AUD/USD is currently probing monthly highs in the 0.7260 area and set for a second consecutive day of gains as the pair continues to derive support from buoyant risk appetite in global equity and commodity markets. For now, the pair seems to be finding resistance in the form of its 50-day moving average at 0.7265 and has been unable to break above an uptrend that has been capping the price action going back to the end of November.
AUD/USD didn’t see much of a reaction to the latest US weekly jobless claims report that was stronger than expected. For reference, initial claims dropped back under 200K, continued claims fall to a fresh post-pandemic low at 1.716M, which puts it broadly back in line with pre-pandemic levels and the insured unemployment rate dropped to 1.3% from 1.4%.
AUD has remained resilient this week to surging Covid-19 infection rates in Australia as the country’s high vaccination rate and new emphasis on living with the virus (as opposed to the previous zero Covid-19 strategy) renders fresh lockdowns unlikely. Indeed, the Australian government is expected to narrow the definition of “close contact” with a Covid-19 positive person in order to reduce the number of people being forced to self-isolate at any given time, in line with new guidelines in the US and elsewhere.
On the eve of New Year’s Eve, the Aussie looks on course to close out what has been a fairly rough year on a positive note. The Australian dollar has shed roughly 5.6% of its value versus the US dollar this year but is up roughly 2.0% this month. Risk appetite has recovered substantially in the latter parts of the month after a shaky start to the month as concerns about the global economic impact of the Omicron variant have subsided. Meanwhile, strong Australian economic data on the back of a phased ending of lockdowns in October, coupled with hawkish shifts in central banks elsewhere, has got market participants betting that the RBA will pivot policy guidance in a hawkish direction in the coming months to put the RBA’s monetary policy tightening timeline more in line with the Fed’s.
- Weaker US dollar and a EUR/GBP gives cable a boost.
- GBP/USD rebounds at 1.3480 and climbs to fresh highs.
- A positive tone across fanatical markets also helps the upside.
The GBP/USD rebounded at 1.3480 and rose to 1.3521, reaching a new monthly high. It remains near the top, still unable to confirm levels above 1.3515/20 but with the bullish momentum intact.
The decline of EUR/GBP to the 0.8380 zone (2021 lows) is helping the overall tone of the pound that is also being favored by higher equity prices. In Wall Street, the Dow Jones gains 0.16% and the Nasdaq 0.53%.
Higher US yields are not helping significantly the greenback on Thursday. US economic data came in above expectations with Initial Jobless Claims falling under 200K and the December Chicago PMI at 63.1 against expectations of 62. The DXY was unable to benefit from those figures.
If GBP/USD manages to break and holds above 1.3520 it would gain more strength. The next strong resistance could be seen at 1.3560. On the flip side, 1.3445 is the area of immediate support, followed by 1.3400.
The pound is on its way to the second weekly gain in a row, as it continues to recover from levels under 1.3200. The 20-week simple moving average awaits at 1.3555.
Technical levels
- WTI rebounded back above the $77.00 level on Thursday as oil continues to trade with a positive bias.
- OPEC+ is likely to stick to existing policy at the upcoming meeting, meaning another 400K BPD hike from February is likely.
Oil prices have spent Thursday trading within recent ranges, with front-month WTI futures in recent trade rebounding from a brief dip back under the $76.00 level to back above the $77.00 mark and eyeing a test of Wednesday’s post-bullish inventory monthly highs at $77.30. At present, WTI is trading just over 50 cents highs on the session, a continuation of the positive bias that has lifted the American crude oil benchmark from as low as $72.50 at the start of the week to current levels over $4.50 higher.
The main theme driving oil prices on Thursday continues to be the broadly upbeat mood in markets more broadly. US equities are currently trading at record levels with the S&P 500 close to 4800. Market participants have become substantially less pessimistic over the last week or so about how they view the Omicron Covid-19 variant impacting the global economy and crude oil demand – a succession of studies as well as real-time data all points to the fact that the new variant is substantially milder than anything that has come before it. Meanwhile, governments are for the most part not returning to the strict lockdowns seen in the past, as Omicron hasn’t shown much threat of overwhelming health care systems with sick patients (yet).
Should the positive Omicron vibes continue to support risk appetite into the new year, that points to continued upside risks for crude oil prices. In terms of other news being discussed by oil market participants on Thursday, China cut its first batch of 2022 crude oil imports to oil refiners by 11%. This has been framed by local analysts who are more “in the know” that this is a way to put pressure on small refineries to iron out inefficiencies rather than having any bearing on overall Chinese demand for oil imports. That could be why the news hasn’t had a lasting impact on prices.
Elsewhere, according to four sources speaking with Reuters, OPEC+ is likely to stick to existing policy at the upcoming 4 January 2022 meeting, which means hiking output by 400,000 barrels per day (BPD) from the start of February. The sources cited an easing of concerns about the impact that the spread of the Omicron variant of Covid-19 will have on demand and the recent recovery in prices as increasing the cartel's confidence that further output hikes remain appropriate. This is in line with market expectations (for no change in OPEC+ policy) and has thus not impacted crude oil prices.
According to four sources speaking with Reuters, OPEC+ is likely to stick to existing policy at the upcoming 4 January 2022 meeting, which means hiking output by 400,000 barrels per day (BPD) from the start of February. The sources cited an easing of concerns about the impact that the spread of the Omicron variant of Covid-19 will have on demand and the recent recovery in prices as increasing the cartel's confidence that further output hikes remain appropriate.
Market Reaction
This is in line with market expectations and has thus not impacted crude oil price action.
- EUR/GBP fell under 0.8400 on Thursday and is probing the annual lows in the 0.8380s.
- The pair has been under selling pressure since last Monday on better risk appetite and central bank divergence.
- Holiday-thinned trading conditions mean a sustained bearish break this week is unlikely, bears will be eyeing a break below 0.8380 in 2022.
Despite holiday-thinned liquidity conditions in global and European currency markets on the eve of New Year’s, EUR/GBP has slipped under 0.8400 to probe annual lows in the 0.8380s. That translates into on the day losses of about 0.3%. The pair has been under heavy selling pressure since hitting highs last week in the 0.8550 area and at current levels, trades nearly 2.0% lower from these peaks. A surge in risk appetite amid a rush to price out Omicron-related economic pessimism amid numerous studies showing the variant to be far milder than previous strains has aided the risk-sensitive GBP and weighed heavily on EUR/GBP.
Meanwhile, the fact that the UK health case system currently has not yet shown any signs of being overwhelmed despite rampant Omicron infection in the country means that, so far, UK policymakers have refrained from putting England back into lockdown. Prior to the recent surge in risk appetite, the UK had been viewed as the Omicron epicenter in Europe, a perception that had weighed on GBP at the time and contributed to EUR/GBP hitting highs near 0.8600 earlier in the month.
A subsiding of perceptions of the risk posed to the UK economy’s near-term outlook by the rapid spread of Omicron has given FX markets the green light to price in a more hawkish than expected BoE. Recall that earlier in the month, the bank surprised some market participants by hiking interest rates by 15bps and indicating that more is to come in 2022. At the time, GBP struggled to benefit as traders worried the BoE would fail to live up to expectations due to Omicron disrupting the UK recovery. But now pandemic risks are subsiding, central bank divergence may return as a key FX market driver in 2022.
As emphasised in characteristically hawkish commentary on Thursday from ECB policymaking hawk’s Klaas Knot (Dutch central bank head) and Robert Holzman (Austrian central bank head), there is a healthy debate going on at the ECB about its timeline for monetary policy normalisation. A growing throng of policymakers appear concerned about upside risks to the bank’s inflation forecast for 2023 and beyond (which currently sees inflation falling back under 2.0% in order to justify ongoing stimulus). Recall the bank decided it would temporarily increase the pace of QE purchases under the pre-pandemic APP in Q2 and Q3 to make up for the end of the PEPP at the end of Q1.
The bank said it would continue with APP purchases for as long as necessary, but if inflation continues to surprise to the upside in 2022, it seems likely these might be ended by the end of the year. A hot flash December inflation report out of Spain on Thursday raises the risk of an upside surprise from next week’s Eurozone aggregate flash December inflation estimate. This increases the likelihood of upside surprises in 2022.
The ECB is clearly on the road to monetary policy normalisation, as are other major central banks, but even if inflation surprises do force it to unwind stimulus at a faster pace, the bank remains well behind the BoE in this regard. Thus, any potential hawkish ECB pivot may struggle to result in lasting EUR/GBP strength. While holiday-thinned trading conditions mean that a sustained downside break of the annual lows in the 0.8380s seems unlikely on Thursday or Friday, the level is vulnerable to being broken in the new year.
European Central Bank governing council member and Dutch central bank head Klaas Knot said on Thursday that the bank could end its bond-buying programmes sooner if inflation continues to surprise on the upside. Knot added that it is now appropriate for the bank to prepare for gradual monetary policy normalisation and that the ECB is close to "mission accomplished" on inflation.
Market Reaction
Knot is a known hawk and it is known that he was one of the ECB members pushing for a greater acknowledgment of upside inflation risks at the last meeting, thus, the euro has not seen any reaction to the latest comments.
- A combination of supporting factors pushed USD/JPY to a fresh monthly high on Thursday.
- The risk-on mood continued undermining the safe-haven JPY and provided a goodish lift.
- Elevated US bond yields, upbeat US macro data benefitted the USD and remained supportive.
The USD/JPY pair maintained its bid tone through the early North American session and was last seen hovering near the monthly top, around the 115.15-20 region.
The optimism over signs that the Omicron variant might be less severe than feared and is unlikely to derail the economic recovery remained supportive of the underlying bullish sentiment. This was evident from an extension of the recent runup in the global equity markets, which undermined the safe-haven Japanese yen and pushed the USD/JPY pair higher.
This, along with a modest US dollar strength, contributed to the ongoing upward trajectory to the highest level since November 26. The greenback drew some support from elevated US Treasury bond yields and better-than-expected US Initial Jobless Claims data, though lacked bullish conviction amid thin end-of-year trading volumes.
Nevertheless, the USD/JPY pair has now rallied over 250 pips from the monthly swing low, around the 112.60 area touched on December 2, and seems poised to appreciate further. A sustained strength above the key 115.00 psychological mark, which coincided with an ascending channel resistance, adds credence to the constructive outlook.
Hence, a subsequent move back towards challenging the multi-year high, around mid-115.00s, remains a distinct possibility. Market participants now look forward to the release of the Chicago PMI for a fresh impetus. This, along with the broader market risk sentiment, would produce some trading opportunities around the USD/JPY pair.
Technical levels to watch
- Spot gold has stabilised in the $1800 area following a choppy few sessions.
- The precious metal swung as high as $1820 earlier in the week and as low as $1790 on Wednesday.
- Traders will be reluctant to read too much into recent moves given holiday-thinned liquidity conditions.
It’s been a choppy couple of sessions for spot gold (XAU/USD) prices, which slid back from earlier weekly highs at $1820 to underneath $1790 at one point on Wednesday but have since stabilised in the $1800 area on Thursday. Gold has been buffeted by choppiness in bond and FX markets in recent days, though traders have warned not to read too much into the recent price action given holiday-thinned liquidity conditions that will prevail until the end of the week. One thing that can be derived from the recent price action is that the 21-day moving average appears to have become a key level of support for spot gold
Real yields rallied on Wednesday, with the 10-year TIPS trying to push to the north of the -1.0% level having previously traded around -1.06% and this upside seemed to pressure gold at the time. Remember, gold has an inverse relationship to US real yields, given they are a proxy for “opportunity cost” - as real yields rise, so does the opportunity cost of holding non-yielding gold, thus demand for the precious metal is weakened.
The 10-year TIPS yield has since dropped back to the -1.06% area, allowing gold to recover back to the $1800 area. There didn’t seem to be anything behind the recent moves in real yields, with the initial upside spurred by a rally in the nominal 10-year yield, which broke above the 1.50% level for the first time in a few weeks and was carried briefly above 1.55% amid technical selling. Remember that higher bond yields reflect the fact that bond prices have fallen. So long as the 10-year TIPS remains subdued to the south of the $1800 level, spot gold has a decent shot of holding in the $1800 region.
Also helping gold recover from Wednesday’s dip has been a gradual weakening of the US dollar. The DXY dipped under 96.00 on Wednesday for the first time since mid-December after the latest US trade figures showed the country’s monthly trade deficit balloon to over $97B, well above expectations for a monthly deficit figure of $89B. The DXY has since been choppy but continues to trade in the 96.00 area, having seemingly failed to garner any impetus in wake of the latest strong weekly jobless claims report (initial claims fell back under 200K).
- Weekly Initial Jobless Claims fell to 198K in the week ending on 25 December.
- Markets haven't seen much of a reaction amid holiday-thinned trading conditions.
There were 198,000 initial claims for unemployment benefits in the US during the week ending December 25, data published by the US Department of Labor (DoL) revealed on Thursday. This reading followed last week's print of 206K (revised up from 205K) and came in below market expectations for 208K.
Continued jobless claims dropped sharply to 1.716M in the week ending December 18, the data showed, well below expectations for a small rise to 1.868M from 1.856M the week prior (which was revised down from 1.859M). The insured unemployment rate fell to 1.3% from 1.4% in the prior week.
Market Reaction
Markets do not seem to have reacted to the latest weekly jobless claims numbers, though the DXY has seen some positive ticks in recent trade and moved back to 96.00. Whether the latest strong labour statistics, which showed the insured unemployment rate falling to 1.3% from 1.4%, can translate into a sustained dollar rebound in holiday-thinned trading conditions remains to be seen.
- USD/CAD turned lower for the second successive day and dropped to a two-week low.
- The USD struggled to preserve its intraday gains and acted as a headwind for the pair.
- The ascending channel support might help limit losses amid retreating crude oil prices.
The USD/CAD pair edged lower through the mid-European session and dropped to a two-week low, around the 1.2770 region in the last hour.
Following an early uptick to the 1.2810-15 area, the USD/CAD pair met with a fresh supply on Thursday and turned lower for the second successive day. This also marked the third day of a negative move in the previous four sessions and was sponsored by the emergence of some US dollar selling at higher levels.
The underlying bullish sentiment continued to act as a headwind for the safe-haven greenback, which was further pressured by retreating US Treasury bond yields. Despite the continuous surge in new COVID-19 cases, investors remain optimistic amid signs that the Omicron variant might be less severe than feared.
This was evident from an extension of the recent bullish run in the equity markets. This helped offset weaker crude oil prices, which tend to undermine the commodity-linked loonie. The USD/CAD pair, however, has managed to defend ascending trend-channel support, warranting some caution for bearish traders.
Market participants now look forward to the US economic docket, featuring the releases of Weekly Initial Jobless Claims and Chicago PMI. This, along with the US bond yields, will influence the USD. Traders will take cues from oil price dynamics to grab some short-term opportunities around the USD/CAD pair.
Technical levels to watch
- EUR/USD has fallen back after hitting fresh monthly highs on Wednesday and is back to trading just above 1.1300.
- Amid holiday trading conditions, hot Spanish CPI and hawkish ECB rhetoric has not impacted euro trade much.
After hitting its highest levels of the month on Wednesday just under 1.1370 on Wednesday, EUR/USD has pulled back to within recent ranges. Earlier in the session, the pair tested its 21-day moving average at the 1.1300 level, but has since rebounded to around the 1.1330, where it trades lower by about 0.1% on the session. The pair’s failure to break above December’s 1.1240-1.1360ish ranges is not overly surprising given that markets have been very much on holiday mode this week. Indeed, for many European nations, Thursday is the final trading session of the year, whilst for most European nations that do see markets open on Friday, it is a half-day.
Most FX strategists had been expecting that trading conditions this week would be rangebound and the price action thus far has lived up to the bill. Things should get more exciting from next week with the release of the key December US labour market report and December US ISM PMIs surveys. Also out next week is the flash estimate of Eurozone Consumer Price Inflation in December. Ahead of the release of the Eurozone aggregate figures, individual countries will be reporting and the Spanish flash numbers are already out. Data released on Thursday morning showed that the YoY rate of CPI in Spain surged to 6.7% in this month from 5.5% a month earlier, well above expectations for a rise to 5.8%.
The data didn’t provoke much of a reaction in the euro at the time but is an early indication of upside risks to the market’s consensus forecast that next week’s Eurozone flash CPI number will drop to 4.7% this month from 4.9% in November. The euro also largely ignored hawkish commentary from the ECB’s Austrian central bank head Robert Holzmann, who on Thursday called for the bank to phase out negative interest rates and unconventional monetary policy in 2022. In terms of the rest of Thursday’s session, things will for the most part be quiet, though traders will be keeping an eye on the release of the weekly US jobless claims report at 1330GMT, followed by the Chicago PMI at 1445GMT.
- GBP/USD attracted some dip-buying on Thursday and recovered the early lost ground.
- The technical setup favours bullish trades and supports prospects for additional gains.
- A sustained break below the 1.3400 round figure is needed to negate the positive bias.
The GBP/USD pair recovered intraday losses and was last seen trading in the neutral territory, just below the key 1.3500 psychological mark, or the monthly high touched earlier this Thursday.
Looking at the broader picture, the recent strong recovery move from the YTD low paused near a hurdle marked by the 50% Fibonacci level of the 1.3834-1.3161 downfall. This coincides with the November 19 swing high and should act as a key pivotal point for short-term traders.
Given the recent move beyond the 1.3375-80 barrier, the overnight sustained breakthrough the 38.2% Fibo. and the 50-day SMA confluence favours bullish traders. This along with positive oscillators supports prospects for a further near-term appreciating move for the GBP/USD pair.
Hence, a subsequent strength towards the next relevant resistance, near the 1.3565 region, remains a distinct possibility. The mentioned area comprises 61.8% Fibo. level and the 100-day SMA, which if cleared decisively would be seen as a fresh trigger for bullish traders.
On the flip side, the daily swing low, around the 1.3455-50 region, now seems to protect the immediate downside. Any subsequent decline could be seen as a buying opportunity near the 38.2% Fibo. level/50-DMA confluence resistance breakpoint and remain limited near the 1.3400 mark.
Failure to defend the mentioned support levels, leading to a further slide below the 1.3385-75 region might shift the bias back in favour of bearish traders. The GBP/USD pair could then accelerate the fall towards testing the 23.6% Fibo. level, around the 1.3320 area.
GBP/USD daily chart
Levels to watch
- NZD/USD struggled to preserve early gains to a multi-week high amid resurgent USD demand.
- The prevalent risk-on environment helped limit any further slide for the perceived riskier kiwi.
- Investors now look forward to the US economic releases for some short-term opportunities.
The NZD/USD pair managed to rebound a few pips from the early European session low and was last seen hovering in the neutral territory, around the 0.6825-30 region.
The pair struggled to capitalize on its early positive move and witnessed a modest pullback from the vicinity of mid-0.6800s, or a four-week high touched earlier this Thursday. The intraday pullback was exclusively sponsored by resurgent US dollar demand, though the underlying bullish tone in the markets helped limit the downside for the NZD/USD pair.
The greenback made a solid comeback and reversed the previous day's slide back closer to the monthly low amid a fresh leg down in the European currencies. This, along with the overnight sharp spike in the US Treasury bond yields, acted as a tailwind for the greenback and prompted some selling around the NZD/USD pair at higher levels.
In fact, the yield on the benchmark 10-year US government bond shot to 1.56% for the first time since November 29 after a $56 billion auction of seven-year notes saw weak demand. This, along with the Fed's hawkish outlook, indicating at least three rate hikes next year, pushed the two-year yield to the highest since March 2020.
Meanwhile, the optimism led by signs that the Omicron variant might be less severe than feared helped offset worries about the economic impact of the continuous surge in new COVID-19 cases. This was evident from an extension of the recent bullish run in the equity markets, which, in turn, acted as a tailwind for the perceived riskier kiwi.
The mixed fundamental backdrop makes it prudent to wait for a strong follow-through selling before placing any aggressive bearish bets around the NZD/USD pair amid thin end-of-year trading volumes. Traders now look forward to the US macro data – Weekly Initial Jobless Claims and Chicago PMI – for some short-term opportunities.
Technical levels to watch
- USD/CAD bounces from nine-day lows to recapture the 1.2800 mark.
- The pair is rescued by the broad rebound in the US dollar amid light trading.
- Bulls remain hopeful while above this critical daily support line.
USD/CAD is staging a solid comeback from nine-day lows of 1.2770, helped by a sharp corrective upside in the US dollar and weaker oil prices.
The greenback is extending the recovery from monthly lows against its major peers, mainly driven by profit-taking ahead of the New Year Eve celebrations.
Meanwhile, a pullback in WTI prices from higher levels also collaborates with the renewed upside in the CAD pair.
Traders now look forward to the US Jobless Claims data for fresh trading impulse but the risk trends and year-end flows will remain the main market drivers.
Looking at USD/CAD’s daily chart, the price has recaptured the critical 21-Daily Moving Average (DMA) at 1.2802, although needs a daily closing above the latter to confirm a bullish reversal from weekly troughs.
If that happens, bulls will then flex their muscles towards the next upside barrier, located at 1.2850. Further up, a rally towards the 1.2900 round number cannot be ruled out.
The fact that the pair trades above all the major DMAs is supportive of the bullish potential. To add, the 14-day Relative Strength Index (RSI) is trading above the midline, pointing to more gains in the making.
USD/CAD: Daily chart
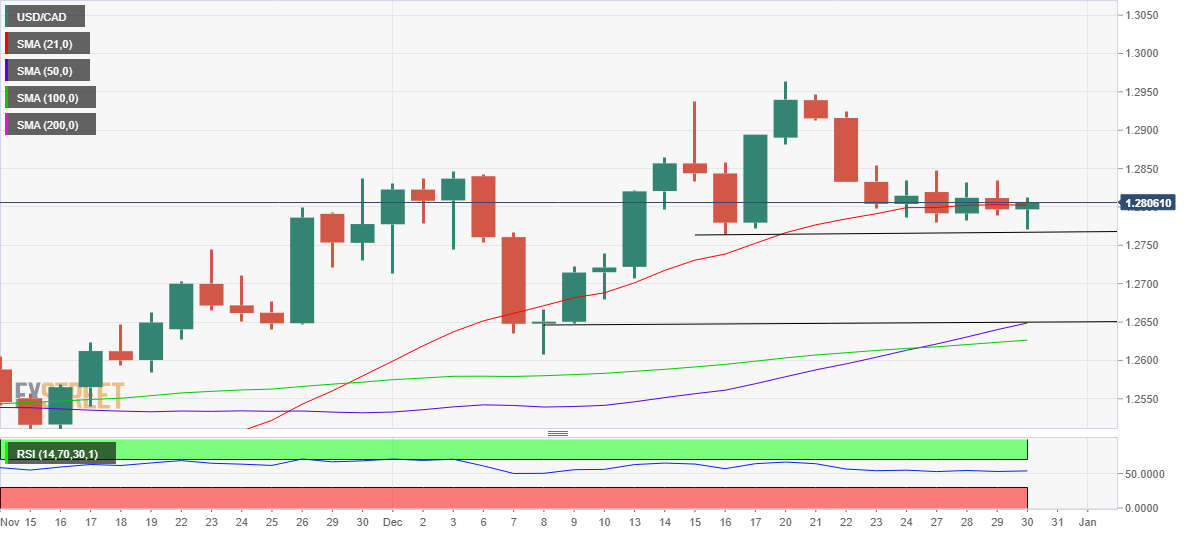
On the flip side, a sharp sell-off towards the December 13 lows of 1.2706 could kick in should the horizontal support line at 1.2770 gets breached on a daily candlestick closing basis.
Further south, the confluence of the upward-sloping 50-DMA and December 9 lows of 1.2648 will be a tough nut to crack for sellers.
USD/CAD: Additional levels to consider
- A combination of factors prompted a short-covering move around USD/CHF on Thursday.
- A strong pickup in the USD demand was seen as a key factor that provided a goodish lift.
- The risk-on mood undermined the safe-haven CHF and remained supportive of the move.
The USD/CHF pair added to its intraday gains and shot to a fresh daily high, around the 0.9180 region during the first half of the European session.
The pair witnessed a short-covering move on Thursday and moved away from the lowest level since November 10, around the 0.9145 region touched in the previous day. The recovery momentum lifted spot prices back above the very important 200-day SMA and was sponsored by a combination of supporting factors.
The underlying bullish tone in the markets undermined the safe-haven Swiss franc and provided a goodish lift to the USD/CHF pair amid resurgent US dollar demand. Despite the continuous surge in new COVID-19 cases, investors remain optimistic amid signs that the Omicron variant might be less severe than feared.
On the other hand, the greenback drew some support from the overnight spike in the US Treasury bond yields. In fact, the yield on the benchmark 10-year US government bond shot to 1.56% for the first time since November 29, while the two-year yield, which is sensitive to interest rate moves, rose to the highest since March 2020.
It, however, remains to be seen if the USD/CHF pair is able to capitalize on the move as investors might refrain from placing aggressive bets amid thin end-of-year trading volumes. Hence, it will be prudent to wait for a strong follow-through buying before confirming that the recent downtrend is over and placing fresh bullish bets.
Market participants now look forward to the US economic docket, featuring the releases of Weekly Initial Jobless Claims and Chicago PMI. This, along with the US bond yields, will influence the USD. Apart from this, traders might take cues from the broader market risk sentiment to grab some short-term opportunities around the USD/CHF pair.
Technical levels to watch
GBP/USD has turned south after testing 1.3500 on Wednesday. The technical outlook suggests that the cable could have a tough time regathering its strength but buyers could look to reclaim control as long as key support levels remain intact, FXStreet’s Eren Sengezer reports.
Buyers are likely to try to reclaim control as long as 1.3400 holds
“The 20-period SMA on the four-hour chart and the trend line form the initial support at 1.3440 and additional losses toward 1.3400 (psychological level, static level) could be witnessed if that level turns into resistance.”
“On the upside, 1.3500 (psychological level, daily high) aligns as initial resistance before 1.3550 (static level, former support).”
Making some comments on the inflation outlook, European Central Bank (ECB) policymaker Robert Holzmann said that “inflation to peak around the turn of the year and then slowly ease.”
He added that it “will be crucial in 2022 to gradually phase out negative interest rates and unconventional monetary policy.”
Earlier this morning, the central bank policymaker Klaas Knot said, inflation in the eurozone could very stay above the central bank's 2% target for the coming years.
Market reaction
EUR/USD keeps lows near 1.1310 on the above comments. The spot is down 0.30% on the day, trading at 1.1313, at the press time.
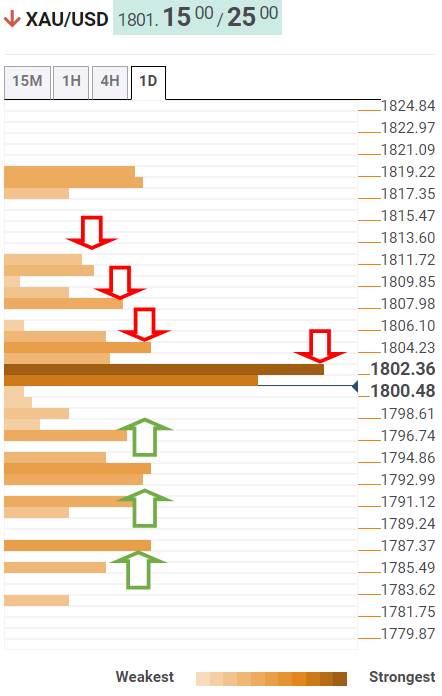
- Gold price remains depressed in a familiar range around the $1,800 mark.
- 10-year US Treasury yields are back above 1.50%, pressurizing gold price.
- Gold 2022 Outlook: Correlation with US T-bond yields to drive yellow metal.
Amid thin-year end liquidity conditions, gold price continues to trade choppy within familiar levels, largely pivoting around the $1,800 mark. The downbeat sentiment around gold price could be attributed to a broad-based US dollar rebound, aided by the recent strength in the Treasury yields. The 10-year rates have recaptured the 1.50% key level, which warrants caution for gold bulls. Going forward the year-end repositioning in the greenback will continue to have a significant impact on gold while thin conditions could exaggerate the moves.
Read: Gold Price Forecast: Year-end flows to keep XAU/USD choppy around $1,800
Gold Price: Key levels to watch
The Technical Confluences Detector shows that the gold price is struggling to recapture strong resistance at $1,803, which is the intersection of the Fibonacci 38.2% one-week, Fibonacci 61.8% one-day and SMA10 one-day.
The immediate upside will then be capped by the Fibonacci 38.2% one-month of $1,806. The previous day’s high of $1,808 will provide another roadblock to gold buyers.
Acceptance above the latter could fuel a renewed uptick towards the previous week’s high of $1,811, above which the December top of $1,820 will be on the bulls’ radars.
On the flip side, the Fibonacci 38.2% one-day at $1,796 will get tested on a sustained move below $1,800.
A dense cluster of healthy support levels is aligned around $1,793, which will be a powerful cap. That price zone comprises of the SMA100 four-hour, Fibonacci 23.6% one-day and pivot point one-week S1.
SMA100 one-day at $1,791 will be the next downside target, below which sellers will aim for the Fibonacci 23.6% one-month at $1,787.
Here is how it looks on the tool
About Technical Confluences Detector
The TCD (Technical Confluences Detector) is a tool to locate and point out those price levels where there is a congestion of indicators, moving averages, Fibonacci levels, Pivot Points, etc. If you are a short-term trader, you will find entry points for counter-trend strategies and hunt a few points at a time. If you are a medium-to-long-term trader, this tool will allow you to know in advance the price levels where a medium-to-long-term trend may stop and rest, where to unwind positions, or where to increase your position size.
- EUR/USD witnessed fresh selling on Thursday amid resurgent USD demand.
- The mixed technical setup warrants caution before placing fresh directional bets.
The EUR/USD pair dropped to the 1.1300 mark during the early part of the European session, reversing Wednesday's positive move to the highest level since November 30. The US dollar made a solid comeback from the vicinity of the monthly low and prompted fresh selling around the major amid thin end-of-year trading volumes on Thursday.
From a technical perspective, the overnight strong intraday rally faltered just ahead of a resistance marked by the 38.2% Fibonacci level of the 1.1692-1.1186 downfall. The mentioned barrier, around the 1.1370-80 region, coincides with the late-November swing high and should now act as a key pivotal point for short-term traders.
Meanwhile, the EUR/USD pair was last seen hovering near the 23.6% Fibo. level, which is followed by the weekly low, around the 1.1275 region touched in the previous day. Some follow-through selling will be seen as a fresh trigger for bearish traders and drag spot prices to the 1.1200 mark en-route the YTD low, around the 1.1185 region.
On the flip side, bulls are likely to wait for a sustained strength beyond the 38.2% Fibo. level before placing fresh bets. The EUR/USD pair might then surpass the 1.1400 mark and test the next relevant resistance near the 1.1440-45 region. The momentum could further get extended towards the key 1.1500 psychological mark.
Meanwhile, neutral technical indicators on the daily chart haven't been supportive of a firm near-term direction, warranting some caution for aggressive traders. The mixed technical set-up suggests that the EUR/USD pair is more likely to extend its two-way price moves and remain confined in a range held since the beginning of this month.
EUR/USD daily chart
Technical levels to watch
- GBP/USD faced rejection near the 1.3500 mark and witnessed a modest pullback on Thursday.
- Resurgent USD demand exerted pressure amid the worsening COVID-19 situation in the UK.
- Britain reported a record number of cases amid an alarming spread of the Omicron variant.
The GBP/USD pair maintained its bid tone through the early European session and was last seen trading near the daily low, around the 1.3465-60 region.
The pair struggled to find acceptance above the key 1.3500 psychological mark and witnessed a modest pullback from the highest level since November 19 touched earlier this Thursday. The US dollar made a solid comeback and reversed a major part of the overnight losses back closer to the monthly low. This, along with the worsening COVID-19 situation in the United Kingdom, attracted some selling around the GBP/USD pair.
The greenback drew some support from the overnight spike in the US Treasury bond yields that followed soft demand for a $56 billion auction of seven-year notes. In fact, the yield on the benchmark 10-year US government bond shot to 1.56% for the first time since November 29. Adding to this, the Fed's hawkish outlook pushed the two-year yield to the highest since March 2020 and provided a goodish lift to the greenback.
Meanwhile, Britain reported a record 183,037 new COVID-19 cases on Wednesday, which could force the government to impose more restrictions. It is worth recalling that the UK Prime Minister Boris Johnson had said last week that ministers would keep the latest data under constant review to see if additional stricter measures are needed. This was seen as another factor that acted as a headwind for the British pound.
It, however, remains to be seen if the GBP/USD pair is able to attract some buying at lower levels or the downtick marks the end of the recent strong recovery from the YTD low touched earlier this month. There isn't any major market-moving economic data due for release from the UK. This warrants some caution for bearish traders makes it prudent to wait for some follow-through selling before confirming that the pair has topped out.
Market participants now look forward to the US economic docket – featuring the usual Weekly Initial Jobless Claims and Chicago PMI – for a fresh impetus. This, along with the US bond yields, will influence the USD price dynamics. Traders might also take cues from developments surrounding the coronavirus saga to grab some short-term opportunities around the GBP/USD pair amid thin end-of-year trading conditions.
Technical levels to watch
EUR/USD touched its highest level in a month at 1.1370 on Wednesday but struggled to preserve its bullish momentum. The pair was last seen edging lower toward 1.1300 as choppy action continues heading into new year, FXStreet’s Eren Sengezer reports.
Year-end flows could ramp up market volatility later in the session
“Later in the session, the US Department of Labor's weekly Initial Jobless Claims data will be featured in the US economic docket alongside the ISM-Chicago's PMI for December. These data are unlikely to trigger a noticeable market reaction but year-end flows toward the end of the European session could open the door to wild fluctuations.”
“On the downside, 1.1300 area, where the 100 and the 200-period SMA's on the four-hour chart are located, act as significant support. In case a four-hour candle closes below that level, additional losses toward 1.1270 (static support) could be witnessed.”
“Initial resistance aligns at 1.1340 (static level) before 1.1360 (post-ECB high). Although the pair managed to rise above that level on Wednesday, it retreated back below it before closing, punctuating the significance of that resistance.”
See: EUR/USD to edge lower amid double asymmetry between the US and the eurozone – Natixis
The double asymmetry (labour supply, central bank behaviour) between the US and the eurozone has complicated effects on asset allocation. Consequently, it is prudent to hedge the risk of euro depreciation against the dollar and it is also reasonable to overweight equities, private equity and real estate in the eur zone relative to those in the US, in the view of analysts at Natixis.
The labour market situation
“The COVID-19 crisis has driven down the labour supply in the US, but not in the eurozone. We should therefore expect stronger labour market pressures in the US than in the eurozone and, consequently, faster growth in wages and in unit labour costs in the US.”
The central banks’ behaviour
“The Fed wants to exit its highly expansionary monetary policy, albeit cautiously and partially. The ECB, meanwhile, apparently has no intention to exit its policy. Evidently, it wants to use a highly expansionary monetary policy to offset the loss of purchasing power caused by the rise in energy prices, boost the employment rate and facilitate the energy transition.”
So what to expect?
“Monetary policy is likely to be more expansionary for a long time in the eurozone than in the US. This can be expected to result in: Significant bond capital flows from the eurozone to the US and a significant depreciation of the euro against the dollar and a catch-up in eurozone asset valuations (equities, real estate, corporate value) with those in the US, given the eurozone’s more negative real long-term interest rates.”
There are two theories to determine a stock market index target. The fundamental approach and the portfolio rebalancing approach. Strategists at Natixis combine these two approaches to define an overall (fundamental and portfolio) approach to share prices.
Combining the two approaches
“The fundamentalist approach to determining share prices simply says that share prices must converge towards their fundamental value, which is the discounted sum of future dividends. If this approach is the only one that explains share prices, the equity risk premium is therefore expected to be relatively stable and does not vary according to the economic cycle, monetary policy, etc. However, high variability in the equity risk premium suggests there are determinants of share prices other than their fundamental value.”
“The idea of portfolio rebalancing approach to share prices is that savers desire a particular structure for their wealth between the various asset classes (money, bonds, equities, real estate). When monetary policy becomes expansionary, there is strong money creation and the proportion of money in wealth increases. Savers then rebalance the structure of their portfolios by using the excess money they hold to buy other assets. At equilibrium, this drives up the prices of other assets, increases the proportion of other assets in wealth and rebalances the structure of portfolios. Indeed, we can see that strong money creation is associated with a sharp rise in stock market indices.”
“When we combine both approaches, we find that the equity risk premium decreases as the proportion of money and bonds in wealth increases. The idea is simple: if the proportion of money in wealth increases, portfolio rebalancing leads share prices to rise above their fundamental value.”
- AUD/USD struggled to preserve its intraday gains amid resurgent USD demand.
- The risk-on mood continued lending some support to the perceived riskier aussie.
- Investors now look forward to the US economic data for some trading opportunities.
The AUD/USD pair surrendered its modest intraday gains and was last seen trading just a few pips above the daily low, around mid-0.7200s during the early European session.
The US dollar made a solid comeback on Thursday and reversed a major part of the overnight losses back closer to the monthly swing low. This, in turn, was seen as a key factor that acted as a headwind for the AUD/USD pair and attracted some selling near the 0.7265 region.
The greenback drew some support from the overnight spike in the US Treasury bond yields that followed soft demand for a $56 billion auction of seven-year notes. In fact, the yield on the benchmark 10-year US government bond shot to 1.56% for the first time since November 29.
Apart from this, the Fed's hawkish outlook, indicating at least three rate hikes next year, pushed the two-year yield to the highest since March 2020 and helped revive the USD demand. That said, the underlying bullish tone might cap the upside for the safe-haven greenback.
The global risk sentiment remained well supported by the optimism over signs that the Omicron variant might be less severe than feared. This was evident from an extension of the recent bullish run in the equity markets, which could further lend support to the perceived riskier aussie.
This warrants some caution before confirming that the AUD/USD pair's recent bounce from the key 0.7000 psychological mark, or the YTD low has lost steam amid thin year-end trading volumes. Market participants now look forward to the US macro data for a fresh impetus.
The US economic docket features the release of Weekly Initial Jobless Claims and Chicago PMI. This, along with the US bond yields, will influence the USD. Traders might also take cues from the broader market risk sentiment to grab some opportunities around the AUD/USD pair.
Technical levels to watch
USD/CAD has reclaimed the 1.2800 level as defends two-month-old ascending trend-channel support. FXStreet’s Haresh Menghani expects the pair to advance towards mid-1.30s on a break above the 1.2835/50 resistance zone.
Convincing break below 1.2770/65 to open up 1.2640/35
“USD/CAD, so far, has managed to defend the lower boundary of an upward sloping channel extending from late October around the 1.2770/65 region, which should act as a key pivotal point for short-term traders. A convincing break below will set the stage for an extension of the recent retracement. The pair might then turn vulnerable to accelerate the fall towards the 1.2700 round-figure mark and extend the corrective slide further towards the next relevant support near the 1.2640/35 region.”
“The 1.2835/50 region now seems to have emerged as an immediate strong barrier. A sustained strength beyond will reaffirm the trend-channel support, which should allow the pair to aim back to reclaim the 1.2900 mark. The momentum could push USD/CAD further to the 1.2960/65 area, or the YTD top, en-route the key 1.3000 psychological mark and the ascending channel resistance, currently near mid-1.3000s.”
Gold keeps the red for the third day in the row amid quiet markets. Year-end flows are set to keep XAU/USD choppy around $1,800, according to FXStreet’s Dhwani Mehta.
Gold’s technical setup paints a bearish picture on the 4H chart
“Gold is extending the previous bearish momentum, as the Treasury yields hold the recent advance. Meanwhile, the market mood remains cautious, underpinning the dollar’s safe-haven demand at gold’s expense.”
“Gold price is extending the recent losses, with bears looking to retest the ascending 100-SMA support at $1,792. The next downside target is seen at the horizontal trendline support at $1,785.”
“On the upside, bulls need to recapture the 50 and 200-SMAs confluence area at $1,802 and $1,805 respectively, above which the 21-SMA at $1,807 will come into play. Recapturing the latter is critical to resuming the uptrend towards the monthly highs of $1,820. Ahead of that level, the previous stubborn resistance at $1,814 will challenge the bulls’ commitments once again.”
See – Gold Price Forecast: XAU/USD at risk of plunging below $1,500 – Credit Suisse
Here is what you need to know on Thursday, December 30:
The greenback faced selling pressure in the second half of the day on Wednesday but managed to limit its losses early Thursday with the US Dollar Index staying in the positive territory above 96.00. In the absence of high-tier data releases, the improving market mood made it difficult for the dollar to find demand but rising US Treasury bond yields are helping the currency show resilience against its rivals. The benchmark 10-year US Treasury bond yield rose nearly 5% on Wednesday and seems to have settled above 1.5%. Later in the session, the US Department of Labor's weekly Initial Jobless Claims report and the ISM Chicago's PMI for December will be the last data releases of the year. In the meantime, US stocks futures are trading flat in the early European session, reflecting a neutral risk sentiment so far.
EUR/USD touched its highest level in a month at 1.1370 on Wednesday but struggled to preserve its bullish momentum. The pair was last seen edging lower toward 1.1300.
GBP/USD climbed above 1.3500 for the first time in five weeks during the Asian trading hours but lost its traction. The pair is currently posting small daily losses near 1.3470.
USD/JPY capitalized on rising US Treasury bond yields and advanced beyond 115.00 in the early European session on Thursday.
Gold dropped below $1,790 pressured by the sharp upsurge witnessed in the 10-year US T-bond yield on Wednesday but managed to erase a large portion of its daily losses. Nevertheless, XAU/USD seems to be having a hard time reclaiming $1,800.
Bitcoin closed the second straight day in the negative territory on Wednesday and stays relatively quiet around $47,000 early Thursday. Ethereum touched its lowest level in three weeks at $3,585 before staging a technical correction toward $3,700.
- USD/JPY gained some follow-through traction on Thursday and jumped to a fresh monthly high.
- Resurgent USD demand remained supportive of the move amid the underlying bullish sentiment.
- A sustained move beyond the 115.00 mark might have already set the stage for additional gains.
The USD/JPY pair continued scaling higher heading into the European session and shot to a fresh monthly high, around the 115.15 region in the last hour.
A combination of supporting factors assisted the USD/JPY pair to prolong its uptrend witnessed since the beginning of this month and gain traction through the first half of the trading on Thursday. The underlying bullish sentiment in the financial markets continued undermining the safe-haven Japanese yen and acted as a tailwind for the USD/JPY pair.
The optimism led by signs that the Omicron variant might be less severe than feared helped offset worries about the economic impact of the continuous surge in new COVID-19 cases. This, in turn, boosted investors' appetite for perceived riskier assets, which was evident from an extension of the recent bullish run in the equity markets.
Bulls further took cues from the overnight spike in the US Treasury bond yields that followed soft demand for a $56 billion auction of seven-year notes. In fact, the yield on the benchmark 10-year US government bond shot back to 1.56% for the first time since November 29, while the two-year yield rose to the highest since March 2020.
This comes on the back of the Fed's hawkish outlook, indicating at least three rate hikes next year, and helped revive demand for the US dollar, which provided an additional boost to the USD/JPY pair. Apart from this, the momentum could further be attributed to some technical buying on a sustained strength beyond the key 115.00 psychological mark.
The mentioned handle coincided with a resistance marked by the top boundary of an upward sloping channel extending from the monthly swing low. A sustained strength beyond could be seen as a fresh trigger for bullish traders and might have already set the stage for a further near-term appreciating move amid thin end-of-year trading volumes.
Market participants now look forward to the US economic docket, featuring the releases of Weekly Initial Jobless Claims and Chicago PMI. This, along with the US bond yields, will influence the USD price dynamics. Apart from this, traders will take cues from the broader market risk sentiment to grab some short-term opportunities around the USD/JPY pair.
Technical levels to watch
One-month risk reversal (RR) of the USD/INR, a measure of the spread between call and put prices, not only drops for the first time in four days but also marks the heaviest fall since December 15, according to data source Reuters.
A call option gives the holder the right but not obligation to buy the underlying asset at a predetermined price on or before a specific date. A put option represents a right to sell.
That said, the daily difference between them slumps to -0.1000 versus the previous day’s reading of +0.013. It’s worth noting that the weekly RR drops for the third time in a line, to -0.013 at the latest.
Amid these plays, USD/INR consolidates losses around the lowest level since November 24, up 0.10% intraday near 74.56.
FX option expiries for December 30 NY cut at 10:00 Eastern Time, via DTCC, can be found below.
- EUR/USD: EUR amounts
- 1.1290 384m
- 1.1310 201m
- 1.1330 357m
- 1.1375 285m
- USD/JPY: USD amounts
- 115.25 300m
- USD/CHF: USD amounts
- 0.9350 280m
- USD/CAD: USD amounts
- 1.2500 255m
- 1.2870 250m
- EUR/GBP: EUR amounts
- 0.8375 531m
- 0.8635 575m
- USD/TRY refreshes weekly top, eases from intraday high at the latest.
- Clear break of 200-SMA, bullish MACD signals keep buyers hopeful.
- Fresh selling will wait for weekly support line break.
USD/TRY remains on the front foot for the fourth consecutive day, up 4.72% intraday despite a recent pullback to $13.28 ahead of Thursday’s European session.
In doing so, the Turkish lira (TRY) pair justifies the upside break of 200-SMA amid bullish MACD conditions, suggesting further advances of the quote. However, 100-SMA challenges the pair’s immediate upside at $13.55.
Although the USD/TRY prices are likely to ease before advancing further, the pullback moves will be worrisome if breaking the aforementioned weekly support line, near $12.40. That said, the 200-SMA level of $12.90 may restrict immediate declines.
In a case where the pair bears dominate past $12.40, the recently flashed multi-day low near $10.25 will be in focus.
Meanwhile, an upside clearance of the 100-SMA level of $13.55 will push the USD/TRY prices towards the $14.00 threshold and then to the December 21 swing high of $14.13.
Following that, the 61.8% Fibonacci retracement (Fibo.) level of December 20-23 declines near $15.35 should lure the pair buyers.
Overall, USD/TRY remains in the recovery mode but intermediate pullbacks can’t be ruled out.
USD/TRY: Four-hour chart
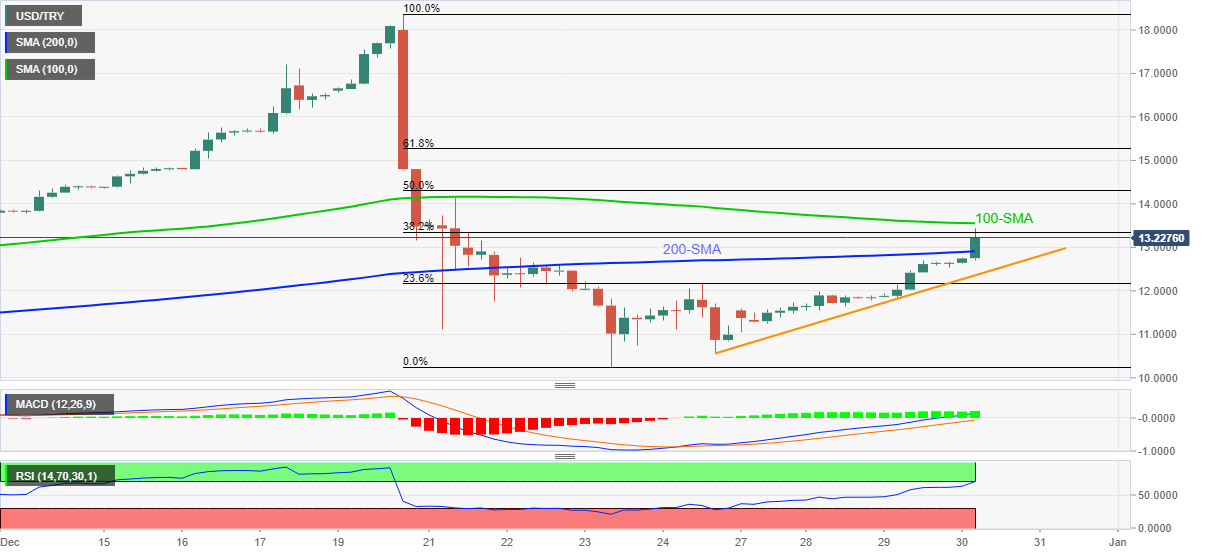
Trend: Gradual recovery expected
The European Central Bank (ECB) policymaker Klaas Knot said in an interview published on Thursday, inflation in the eurozone could very stay above the central bank's 2% target for the coming years.
"I have a different view, I think the chance we remain stuck above 2% is just as big. Not far above 2%, but still,” Knot said.
The ECB this month projected inflation in the monetary union to fall to 1.8% after 2022, although Knot said that “the outlook could prove to be too rosy.”
Related reads
- ECB’s Visco: Central bank unlikely to end tapering before 2023
- EUR/USD eases from monthly top towards 1.1300, focus on coronavirus, yields
- XAU/EUR fades bounce off two-week low, recently pressured around intraday low.
- Market sentiment dwindles amid mixed concerns over Omicron, firmer yields.
- ECB’s Visco said ECB won’t end tapering before 2023.
Gold (XAU/EUR) prints a three-day downtrend as sellers attack €1,587 level heading into Thursday’s European session. In doing so, the yellow metal bears the burden of firmer US Treasury yields amid sluggish final days of 2021.
US Treasury yields rallied the most in three weeks after the US seven-year Treasury bond auction showed disappointing demand for the government securities, previously weighed on the greenback. On the same line were the US data showing that Pending Home Sales for November dropped below the forecast of +0.5% to -2.2% MoM whereas Good Trade Balance hit a record deficit of $-97.8B versus $-83.2B prior. Additionally, the German Bund Yields jumped the most in six weeks to a two-month high the previous day amid hopes that the bloc will be able to overcome the pandemic.
It’s worth noting that the recent comments from ECB Governing Council member Ignazio Visco also weigh on the XAU/EUR prices. The policymaker said, “See no reason to reassess inflation target of 2%.”
Furthermore, recently escalating fears of the South African covid variant, namely Omicron, join geopolitical headlines to also weigh on the gold prices.
The record covid cases in multiple nations seem to push policymakers towards rethinking over the previous easing of activity restrictions during the holiday period. Recently, Australia Prime Minister (PM) Scott Morrison said, “Omicron indicates that Australia needs to reset its pandemic response.”
On the other hand, Reuters quotes US Secretary of State Antony Blinken said, “The US urges Chinese and Hong Kong authorities to release stand news staff members immediately.” Earlier in the day, Saudi Arabia’s King Salman bin Abdulaziz raised concerns over Iran’s lack of cooperation with the international community on its nuclear program and ballistic missile development.
Amid these plays, Treasury yields in the EU and the US remain firmer while stock futures remain pressured.
Looking forward, XAU/EUR traders will need to pay attention to the US Weekly Jobless Claims and Chicago Purchasing Managers’ Index for December, expected 205K and 62 versus 205K and 61.8 respectively, for fresh impulse. Also important will be covid updates and news concerning Iran and China.
Technical analysis
A U-turn from the monthly resistance line joins bearish MACD signals and downbeat RSI line to keep Gold (XAU/EUR) sellers hopeful.
However, a convergence of the 100-SMA and 50% Fibonacci retracement (Fibo.) of November’s upside challenges the metal’s immediate declines around €1,586.
Following the quote’s weakness past €1,586, a joint between upward sloping trend line from November 03 and 61.8% Fibo. will challenge the XAU/EUR bears near €1,570.
Alternatively, recovery moves may initially aim for the 38.2% Fibonacci retracement level near €1,602 before again challenging the aforementioned resistance line near €1,607.
Adding to the upside filters is the late November’s swing high near €1,610, a break of which will recall €1,633-34 area on the chart.
XAU/EUR: Four-hour chart
Trend: Further weakness expected
The European Central Bank (ECB) will not end tapering before 2023, Governing Council member Ignazio Visco said in an interview on Thursday.
Additional quotes
“Will maintain very favorable financing conditions for economy.”
“Expect average inflation of 3% in 2022, then gradually slow to just below 2%.”
“Inflation forecasts below 2% in 2023-24 exposed to downside and upside risks.”
“See no reason to reassess inflation target of 2%.”
“See Italy’s GDP can grow by 2 percentage points in next two years with an efficient implementation of its recovery plan.”
“Sustainability of public budgets is key both in Europe and in each country.”
“It would be helpful a eurozone or EU economy minister.”
“Final omicron impact on the economy is unknown at the moment.”
Market reaction
EUR/USD remains pressured near 1.1325 amid resurgent US dollar demand and these dovish ECB comments. The spot is down 0.20% on the day.
- GBP/JPY retreats from two-month high, stays mildly bid though.
- Clear upside break of previous resistance, firmer RSI and sustained trading beyond 50-DMA favor bulls.
- Seven-month-old horizontal area lures buyers, mid-November high also acts as nearby support.
GBP/JPY bulls take a breather around early November tops, up 0.06% intraday near 155.15 heading into Thursday’s London open.
The cross-currency pair refreshed the multi-day top earlier in Asia while cheering the previous day’s successful break of ascending trend line from December 07. Despite the recent pullback, the quote remains beyond the stated resistance line, now support around 154.85.
Not only the sustained trend line breakout but successful trading above 50-DMA level surrounding 153.00 also keeps GBP/JPY buyers hopeful to aim for the horizontal area comprising multiple tops marked since May, around 156.00.
Following that, 156.85 and 157.30 may entertain the pair buyers before directing them to the yearly peak of 158.22.
Alternatively, a downside break of the resistance-turned-support line near 154.85 will direct the GBP/JPY prices towards November 17 swing high close to 154.75 and then to the 50-DMA near 153.00.
It should be noted that the pair bears will gain momentum on the break of 153.00, which in turn could direct the south-run towards the 150.00 threshold before highlighting the monthly low near 149.00.
GBP/JPY: Daily chart
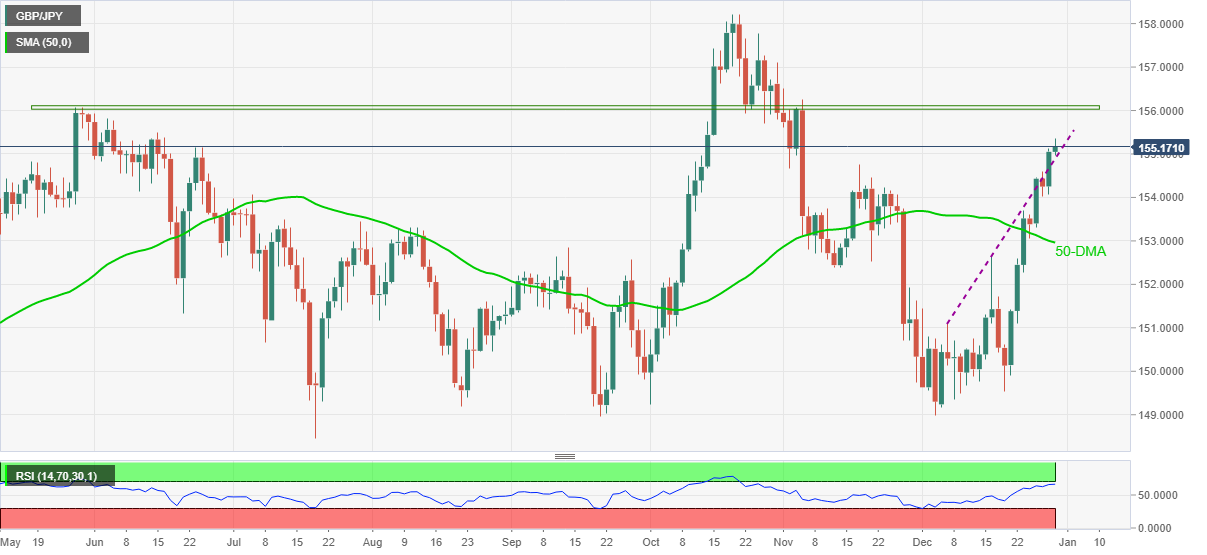
Trend: Further upside expected
- Asia-Pacific shares dribble higher as China-linked headlines battle virus fears, firmer Treasury yields.
- Aussie PM Morrison raises concern over Omicron response, China eyes record bonds issue in 2022.
- Geopolitical concerns over Hong Kong, Iran join Evergrande updates to test advances.
- Year-end positioning may entertain traders, US data is also eyed.
Asian equities grind higher as optimistic headlines from China battle firmer Treasury yields and geopolitical news during a sluggish session on Thursday. That said, MSCI’s index of Asia-Pacific shares ex-Japan rises 0.10% while Japan’s Nikkei 225 drops by the same magnitude at the latest.
China shows readiness to keep the economy liquid via record bond issuance. The dragon nation also eyed foreign trade difficulties. “China plans to sell a record amount of treasury bonds in 2022, while keeping overall interest rates of the issuance lower, as Beijing adopts a proactive policy to stabilize economic growth, a senior official at the finance ministry said,” per Reuters. Alternatively, China’s Vice Commerce Minister said in a statement on Thursday, Beijing will face an unprecedented degree of difficulty next year in stabilizing foreign trade.
It’s worth noting that economic headlines from Beijing ignored looming fears of Evergrande’s default after Bloomberg reported that the due date to pay offshore coupons worth $255 million passed with no sign of payment by the embattled property developer. The payments have a 30-day grace period. That said, Evergrande dropped over 11%, drowning Hang Seng despite firmer gains in China.
Elsewhere, the record covid cases in multiple nations seem to push policymakers towards rethinking over the previous easing of activity restrictions during the holiday period. Recently, Australia Prime Minister (PM) Scott Morrison said, “Omicron indicates that Australia needs to reset its pandemic response.”
On a different page, geopolitical concerns also challenge the risk appetite as Reuters quotes US Secretary of State Antony Blinken said, “The US urges Chinese and Hong Kong authorities to release stand news staff members immediately.” Earlier in the day, Saudi Arabia’s King Salman bin Abdulaziz raised concerns over Iran’s lack of cooperation with the international community on its nuclear program and ballistic missile development.
Amid these plays, stocks in Australia reverse the early Asian gains while those from New Zealand print mild gains by the press time. Further, markets in South Korea and Indonesia also print mild losses while India’s BSE Sensex gains 0.15% by the press time. On a broader front, the US 10-year Treasury yields seesaw around 1.55% while the S&P 500 Futures print mild losses near 4,784.
It’s worth noting that Wall Street closed mixed the previous day even as DJI 30 refreshed all-time high. The reason could be linked to the strong US Treasury yields.
Read: US Treasury yields poke monthly top, S&P 500 Futures remain sluggish amid mixed sentiment
To sum up, global markets are consolidating ahead of the 2021 end amid a lack of major data/events.
At the National Cabinet meeting on Thursday, the Australian leaders agreed to tighten the definition of “close contact” exposure to COVID-19 while cutting the isolation time as part of major changes to dealing with the pandemic, per 7News.
Prime Minister Scott Morrison said, “those states will define a close contact as a fully vaccinated “household contact, or household-like (contact), of a confirmed case only.”
“You are only a close contact if you are, effectively, living with someone or have been in an accommodation setting with someone for more than four hours with someone who has actually got COVID,” he added.
Additional quotes
“There is increasing evidence to the reduced severity of the Omicron variant.”
“We need to reset how we think about the pandemic, and how we manage ourselves and the things we need to do as governments.”
“Omicron is a game-changer.”
Market reaction
AUD/USD is meandering near daily lows of 0.7245, in reaction to the above announcements. The spot is trading flat on the day, having reversed entire gains.
- USD/CHF consolidates the heaviest daily losses around seven-week low.
- 200-DMA, fortnight-old resistance line guards immediate recovery moves.
- Bearish MACD signals, steady RSI keeps sellers hopeful until crossing five-week-old resistance line.
USD/CHF picks up bids to refresh intraday high around 0.9160, up 0.13% intraday heading into Thursday’s European session.
The Swiss currency (CHF) pair dropped to the lowest levels since November 10 the previous day but failed to provide a daily closing below a four-month-old support line. The same helped the quote to portray a corrective pullback from the multi-day bottom of late.
However, bearish MACD signals and sustained trading below 200-DMA keep USD/CHF bears hopeful.
In addition to the 200-DMA level of 0.9175, descending trend lines from December 15 and November 24, respectively, around 0.9200 and 0.9240, also challenge USD/CHF bulls.
That said, the pair sellers will wait for a clear downside break of the stated support line from August, near 0.9130 by the press time for fresh entry.
Should the USD/CHF prices remain below 0.9130, November’s low of 0.9088 will be in focus.
Hence, the pair’s latest recovery moves are not yet suitable to be termed as trend reversal.
USD/CHF: Daily chart
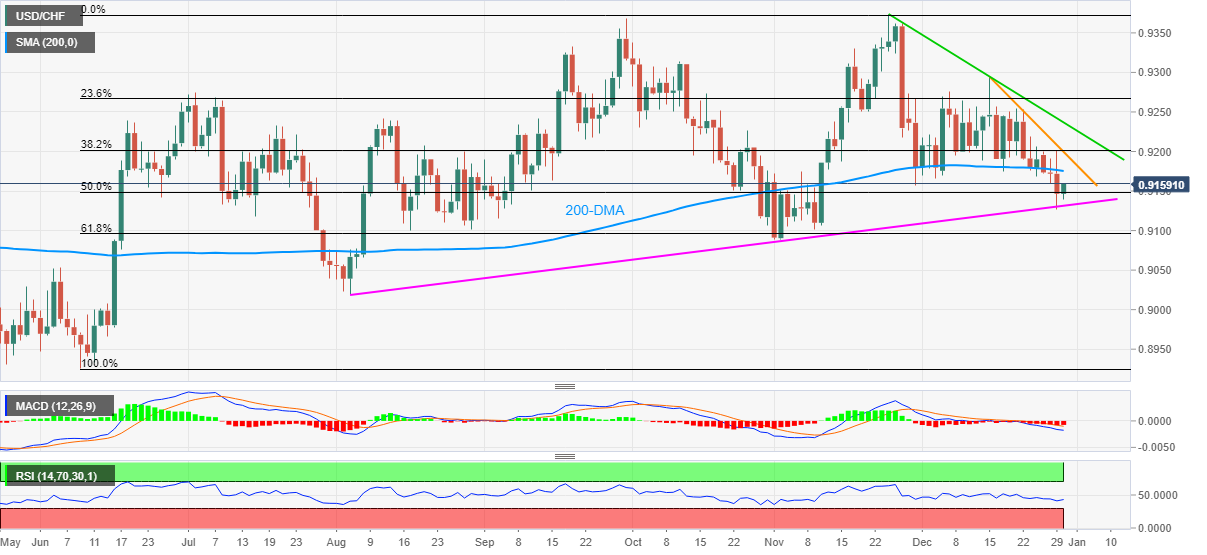
Trend: Further weakness expected
- EUR/USD refreshes intraday low while consolidating recent gains around multi-day top.
- Firmer yields favored bulls the previous day, challenges to sentiment, year-end inaction probe upside momentum.
- Omicron news, geopolitical headlines weigh on risk appetite amid quiet session.
- US Jobless Claims, Chicago PMI will decorate the calendar.
EUR/USD drops back towards 1.1300, down 0.13% intraday around the daily low near 1.1333 as market sentiment dwindles during early Thursday morning in Europe.
The major currency pair refreshed its monthly top, also posted the biggest daily gains in a week, the previous day after the US Dollar Index (DXY) slump on surprise volatility in the US bond market. Also favoring the EUR/USD prices were downbeat US data and global policymakers’ rejection to considering fears emanating from the South African covid variant, namely Omicron.
However, the recent macros challenge the previously optimistic market mood amid thin end-of-year liquidity conditions and trigger the quote’s consolidation of the latest gains near the multi-day high.
That said, the record covid cases in multiple nations seem to push policymakers towards rethinking over the previous easing of activity restrictions during the holiday period. Recently, Australia Prime Minister (PM) Scott Morrison said, “Omicron indicates that Australia needs to reset its pandemic response.”
Before that, Reuters mentioned, “Almost 900,000 cases were detected on average each day around the world between Dec. 22 and 28, with myriad countries posting new all-time highs in the previous 24 hours, including the United States, Australia, many in Europe and Bolivia.”
It’s worth noting that a jump in the US Treasury yields, which rallied the most in three weeks after the US seven-year Treasury bond auction showed disappointing demand for the government securities, previously weighed on the greenback. On the same line were the US data showing that Pending Home Sales for November dropped below the forecast of +0.5% to -2.2% MoM whereas Good Trade Balance hit a record deficit of $-97.8B versus $-83.2B prior. On the contrary, the German Bund Yields jumped the most in six weeks to a two-month high the previous day amid hopes that the bloc will be able to overcome the pandemic.
Talking about geopolitical risks, Reuters quotes US Secretary of State Antony Blinken said, “The US urges Chinese and Hong Kong authorities to release stand news staff members immediately.” Earlier in the day, Saudi Arabia’s King Salman bin Abdulaziz raised concerns over Iran’s lack of cooperation with the international community on its nuclear program and ballistic missile development.
Against this backdrop, the US 10-year Treasury yields seesaw around 1.55% while the S&P 500 Futures print mild losses near 4,784. Further, Asia-Pacific stocks trade mixed to track their Wall Street counterparts.
Looking forward, EUR/USD traders will need to pay attention to the US Weekly Jobless Claims and Chicago Purchasing Managers’ Index for December, expected 205K and 62 versus 205K and 61.8 respectively, for fresh impulse. Also important will be covid updates and news concerning Iran and China.
Technical analysis
Failures to keep the key trend line breakout directs EUR/USD prices towards the 21-DMA and 23.6% Fibonacci retracement (Fibo.) of October-November downside, close to 1.1300, will challenge the declines. Meanwhile, the 50-DMA and November 16 high near 1.1385-90 becomes the key hurdle to watch.
- GBP/USD consolidates recent gains around the highest levels in six weeks.
- Bullish MACD signals, sustained break of 50-DMA keep buyers hopeful.
- 100-DMA, 61.8% Fibonacci retracement level also test the upside momentum.
GBP/USD reverses the early Asian gains while easing to 1.3485 ahead of Thursday’s London open.
In doing so, the cable pair registers a failure to cross the 50% Fibonacci retracement (Fibo.) level of October-December downside, around 1.3500.
However, the quote’s ability to keep the previous day’s 50-DMA breakout amid the bullish MACD signals favor buyers.
That said, the latest pullback moves remain elusive until staying beyond the stated DMA level of 1.3424, a break of which direct GBP/USD sellers towards the mid-December lows near 1.3375.
In a case where the cable bears keep the reins past 1.3375, November 12 swing low near 1.3355 and 23.6% Fibonacci retracement level of 1.3320 will be in focus.
Meanwhile, a clear upside break of 1.3500 will battle the 100-DMA and 61.8% Fibo., respectively around 1.3570 and 1.3580. Also acting as an upside filter is November’s high of 1.3607.
GBP/USD: Daily chart
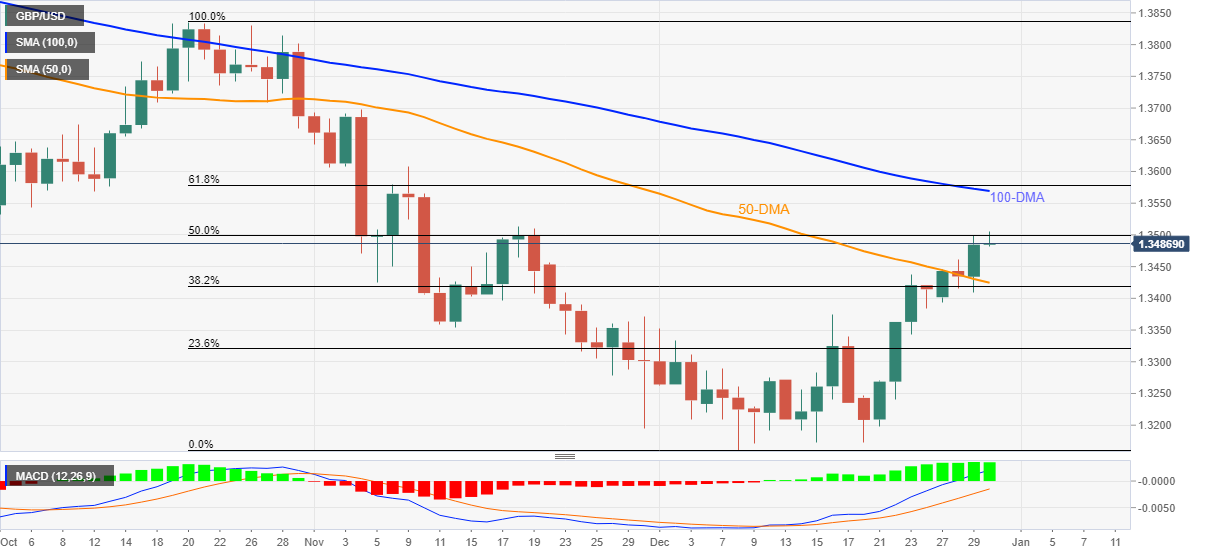
Trend: Further upside expected
According to the latest CNBC survey of about 400 chief investment officers, equity strategists and portfolio managers, inflation will remain the main cause for concern for markets in 2022.
Key findings
“More than half of the respondents said inflation is their biggest worry for 2022.”
“Thirty percent said the Federal Reserve raising rates at the wrong time is their top concern, while 17% said the economic impact of a lingering pandemic is their No. 1 worry.”
“More than 50% of the survey respondents expect the S&P 500 to go up less than 10% in 2022. Nearly 18% think the market will produce another double-digit year, while 10% see a flatline for stocks.”
“Among different asset classes, equities are still investors’ top choice, according to the survey result.”
“In terms of stock preferences, 35% of the respondents said they favor financials and 27% like cyclical names benefiting from the economic recovery. Technology stocks in general became less favorable among investors.”
- AUD/USD retreats from intraday high, stays around six-week top.
- Market sentiment dwindles amid mixed messages, light calendar.
- Record cases in Australia pushes PM Morrison to hold snap cabinet meeting.
- US data, yields also eyed for clear direction, year-end inaction remains as a trading barrier.
AUD/USD bulls take a breather around multi-day top marked the previous day, up 0.10% near 0.7260 during the late Asian session on Thursday.
While the softer US dollar helped the Aussie pair buyers the previous day, fears emanating from the South African covid variant, namely Omicron, join geopolitical headlines to recently weighing on the quote.
Australia reports the record high daily covid infections, around 19,677 at the latest, despite cheering 90% vaccination status. The Pacific major previously announced an easing of activity restrictions among the state borders but is likely to recall some of the lockdown actions during today’s snap cabinet meeting.
Ahead of the meeting, the opposition party leader Anthony Albanese said, per ABC News, “The Prime Minister says he's changing gears but truth is he's stalled recovery. The truth is there's so much uncertainty out there what we need out of today's meeting is some clarity."
Elsewhere, Reuters quotes US Secretary of State Antony Blinken said, “The US urges Chinese and Hong Kong authorities to release stand news staff members immediately.” Earlier in the day, Saudi Arabia’s King Salman bin Abdulaziz raised concerns over Iran’s lack of cooperation with the international community on its nuclear program and ballistic missile development.
It’s worth noting that the AUD/USD pairs cheered downbeat US dollar moves and softer US data the previous day. The US Dollar Index (DXY) poked monthly low on Wednesday amid a jump in the US Treasury yields that rallied the most in three weeks after the US seven-year Treasury bond auction showed disappointing demand for the government securities during the holiday period. Talking about data, the US Pending Home Sales for November dropped below the forecast of +0.5% to -2.2% MoM whereas Good Trade Balance hit a record deficit of $-97.8B versus $-83.2B prior.
Amid these plays, the US 10-year Treasury yields seesaw around 1.55% while the S&P 500 Futures print mild losses near 4,784. Further, Asia-Pacific stocks trade mixed to track their Wall Street counterparts.
That said, AUD/USD traders await words from Australia Prime Minister (PM) Scott Morrison for fresh impulse amid fears of fresh activity restrictions. In absence of this, the quote may extend the latest run-up.
Following that, the US Weekly Jobless Claims and Chicago Purchasing Managers’ Index for December, expected 205K and 62 versus 205K and 61.8 respectively, will decorate the calendar while risk catalysts will be important as well.
Technical analysis
A 50-SMA bullish cross over the 100-SMA joins firmer MACD and RSI conditions to keep AUD/USD buyers hopeful to overcome an upward sloping trend line from November 30, around 0.7270. Following that, the 78.6% Fibonacci retracement (Fibo.) level of November 15 to December 03 downside, around 0.7290, will be on focus.
On the contrary, a one-week-old horizontal support line restricts short-term AUD/USD downside around 0.7200, a break of which will aim for 50-SMA and 200-SMA, respectively near 0.7195 and 0.7175.
China’s Vice Commerce Minister said in a statement on Thursday, Beijing will face an unprecedented degree of difficulty next year in stabilizing foreign trade.
Earlier on, the country’s Finance Ministry said that the Chinese authorities “will guide overall interest rates lower for Treasury bond issuance in 2022."
Market reaction
AUD/USD was last seen trading at 0.7257, posting 0.13% gains on the day.
- USD/INR attempts a tepid bounce, snapping a three-day downtrend.
- US dollar index is off monthly lows amid firmer Treasury yields.
- Daily technical setup suggests a minor rebound could be in the offing.
USD/INR is trading in the green for the first time in four trading days on Thursday, as bulls come up for the last dance before the sell-off resumes.
The pair rebounds from monthly lows of 74.46, tracking the broad bounce in the US dollar across the board. The US dollar index hit fresh one-month lows of 95.76 on Wednesday, although staged a modest recovery on rising Treasury yields. At the time of writing, the gauge is trading at 95.91, modestly flat on the day.
“It looked yesterday that the rupee’s rally had run its course. It now appears that it has a decent chance to finish the year above the 74.50 level. There are a host of risks the rupee faces in the New Year and the current levels are not justified. However, right now it’s all about momentum, low liquidity, and position adjustments, Reuters reports, citing a dealer at a private bank.
Technically, USD/INR is bouncing off critical support of the 100-Daily Moving Average (DMA), now at 74.53.
If the recovery momentum extends, then a fresh upswing towards the horizontal 50-DMA at 74.94 will be on the table.
Acceptance above the latter will expose the 75.50 psychological level.
The 14-day Relative Strength Index (RSI) is recovering from lower levels, backing the upturn in USD/INR price.
USD/INR: Daily chart
Only a daily closing below the 100-DMA could re-ignite fresh selling interest in the spot, putting the 200-DMA support at 74.24 back on buyers’ minds.
Further south, the 74.00 round number will be the level to beat for USD/INR bears.
USD/INR: Additional levels
- US 10-year Treasury yields remain firmer after at monthly high after the heaviest daily jump in three weeks.
- S&P 500 Futures fail to track Wall Street as concerns over Omicron, light calendar tests equity bulls.
- US seven-year bond auction, downbeat US data triggered a rally in the US Treasury coupons.
Market sentiment struggles for clear direction after a volatile Wednesday. Even so, the US Treasury yields stay strong and the stock futures print mild losses by the press time of early Thursday’s Asian session.
The US Treasury yields rallied the most in three weeks the previous day after an auction of the US seven-week Treasury bond showed disappointing demand for the government securities during the holiday period. “The seven-year notes sold at a high yield of 1.48%, around two basis points higher than where they had traded before the auction,” said Reuters.
Adding to the bullish bias for the yields could be the downbeat US data and firmer inflation expectations.
On Wednesday, the US Pending Home Sales for November dropped below the forecast of +0.5% to -2.2% MoM whereas Good Trade Balance hit a record deficit of $-97.8B versus $-83.2B prior. Alternatively, A jump in the US inflation expectations, as portrayed by 10-Year Breakeven Inflation Rate numbers from the Federal Reserve Bank of St. Louis (FRED) back the Fed-rate-hike woes. The inflation gauge refreshed the monthly top to 2.53% at the latest.
It’s worth observing that fears of the South African covid variant, namely Omicron, join recent geopolitical headlines concerning Iran and China to weigh on the market sentiment.
“Almost 900,000 cases were detected on average each day around the world between Dec. 22 and 28, with myriad countries posting new all-time highs in the previous 24 hours, including the United States, Australia, many in Europe and Bolivia,” said Reuters. Recently, US Secretary of State Antony Blinken said, “The US urges Chinese and Hong Kong authorities to release stand news staff members immediately.” Earlier in the day, Saudi Arabia’s King Salman bin Abdulaziz raised concerns over Iran’s lack of cooperation with the international community on its nuclear program and ballistic missile development.
Amid these plays, the US 10-year Treasury yields seesaw around 1.55% while the S&P 500 Futures print mild losses near 4,784. Further, Asia-Pacific stocks trade mixed to track their Wall Street counterparts.
Looking forward, the US Weekly Jobless Claims and Chicago Purchasing Managers’ Index for December, expected 205K and 62 versus 205K and 61.8 respectively, will decorate the calendar and should be observed for fresh clues. However, major attention will be given to the risk catalyst for clear direction
Above all, the year-end liquidity crunch and a light calendar may keep testing the market moves.
US inflation expectations, as measured by the 10-year breakeven inflation rate per the St. Louis Federal Reserve (FRED) data, refreshed monthly high to 2.53% by the end of Thursday’s North American session, per the FRED website.
The firmer inflation expectations keep fears of the Fed’s early rate hike on the table, which also takes clues from the recently higher US Treasury yields.
US 10-year Treasury yields rallied the most in three weeks the previous day, firmer around 1.55% at the latest, after an auction of the US seven-week Treasury bond showed disappointing demand for the government securities during the holiday period. “The seven-year notes sold at a high yield of 1.48%, around two basis points higher than where they had traded before the auction,” said Reuters.
It’s worth noting that the strong yields failed to propel DXY, pressured around a monthly low near 95.90.
Read: US Dollar Index stays pressured around monthly low under 96.00 amid firmer yields, covid woes
- WTI print four-day uptrend the highest levels since November 26.
- Bulls cheer softer USD, upbeat inventories and concerns over Iran.
- Omicron fails to disappoint energy buyers amid upbeat studies, policymakers’ refrain from major lockdowns.
- US data, risk catalysts are the key to fresh impulse.
WTI crude oil remains firmer for the fourth consecutive day during the mid-Asian session on Thursday, up 0.40% intraday at $76.60 by the press time.
The black gold jumped to the highest since November 26 the previous day as the US dollar weakness joined upbeat oil inventories. Also favoring the energy bulls were comments from Saudi Arabia’s King Salman bin Abdulaziz.
The US Dollar Index (DXY) dropped the most in a week to poke the monthly low before closing around 95.88 on Tuesday, sluggish around 95.90 at the latest. In doing so, the greenback gauge tracked a jump in the US Treasury yields and downbeat US data.
US Treasury yields rallied the most in three weeks the previous day after an auction of the US seven-week Treasury bond showed disappointing demand for the government securities during the holiday period. “The seven-year notes sold at a high yield of 1.48%, around two basis points higher than where they had traded before the auction,” said Reuters.
That said, the US 10-year Treasury yields stay firmer around the monthly top near 1.55% by the press time while S&P 500 Futures print mild losses at the latest.
On Wednesday, the US Pending Home Sales for November dropped below the forecast of +0.5% to -2.2% MoM whereas Good Trade Balance hit a record deficit of $-97.8B versus $-83.2B prior.
Moving on, the weekly inventory data from the US Energy and Information Administration (EIA) flashed -3.576M figures versus -3.143M forecast.
It’s worth noting that the ongoing global pressure over Iran for denuclearization seems to escalate the geopolitical tension surrounding the Middle Ease and help the oil prices. Amid these plays, Saudi King Salman raised concerns over Iran’s lack of cooperation with the international community on its nuclear program and ballistic missile development. “The stability and balance of the oil market is a cornerstone of Saudi energy policy, it is important that all producers comply with the OPEC+ agreement which is essential for oil market stability,” added Saudi King Salman.
Elsewhere, fears of the South African covid variant, namely Omicron, escalate amid record high infection, which in turn should have challenged the energy buyers. However, the global policymakers’ rejection to announce heavy activity restrictions during the holiday season seems to defend the bulls.
Looking forward, an absence of major data/events may keep oil buyers hopeful but the US second-tier figures and risk catalyst are worth observing for clear direction.
Technical analysis
A successful break of the two-month-old resistance line, around $77.00 by the press time, becomes necessary for the US oil buyers to approach the $80.00 threshold. In absence of this, the commodity prices may witness a pullback towards the 50-DMA level of $75.70.
- USD/TRY keeps the green for the fourth consecutive session.
- Turkish government’s rescue plan fails to save the day for lira bulls.
- USD/TRY targets 21-DMA on the upside amid bullish daily RSI.
USD/TRY is trading better bid above 12.50, consolidating Wednesday’s massive surge to five-day highs of 12.69.
The lira bears refuse to give up, despite the Turkish government’s experimental plan to stabilize the currency. The government announced that it will promote the conversion of gold savings into liras.
“If the lira's depreciation versus gold exceeds bank interest rates, the central bank will make up for losses incurred by holders of lira deposits,” Hurriyat reports, citing quotes from the Turkish official gazette.
USD/TRY tumbled roughly 7% a day before, shrugging off the government’s efforts and the central bank’s comments. “The CBRT has no commitment to any exchange rate level and will not conduct FX buying or selling transactions to determine the level or direction of the exchange rates,” the bank said.
Wednesday’s rally reversed nearly 25% of the previous week’s losses in USD/TRY. The resurgent US dollar demand also helped the spot gain further ground.
Looking at USD/TRY’s technical chart, the spot’s daily closing above the 50-Daily Moving Average (DMA) resistance, now at 11.78, on Tuesday, prompted a fresh upswing beyond 12.00. having bounced off the critical 100-DMA support in the previous week.
The 14-day Relative Strength Index (RSI) is trading just above the midline, having pierced the 50.00 level amid the renewed upside. The leading indicator points to more gains in the offing for the currency pair.
The next stop for bulls is seen at the mildly bullish 21-DMA at 13.38. A firm break above the latter will open doors for a test of the 15.00 level.
Alternatively, selling resurgence could put the 50-DMA resistance-turned-support at risk, below which Monday’s low of 11.07 will get tested.
The last line of defense for buyers is envisioned at 100-DMA at 10.23.
USD/TRY: Daily chart
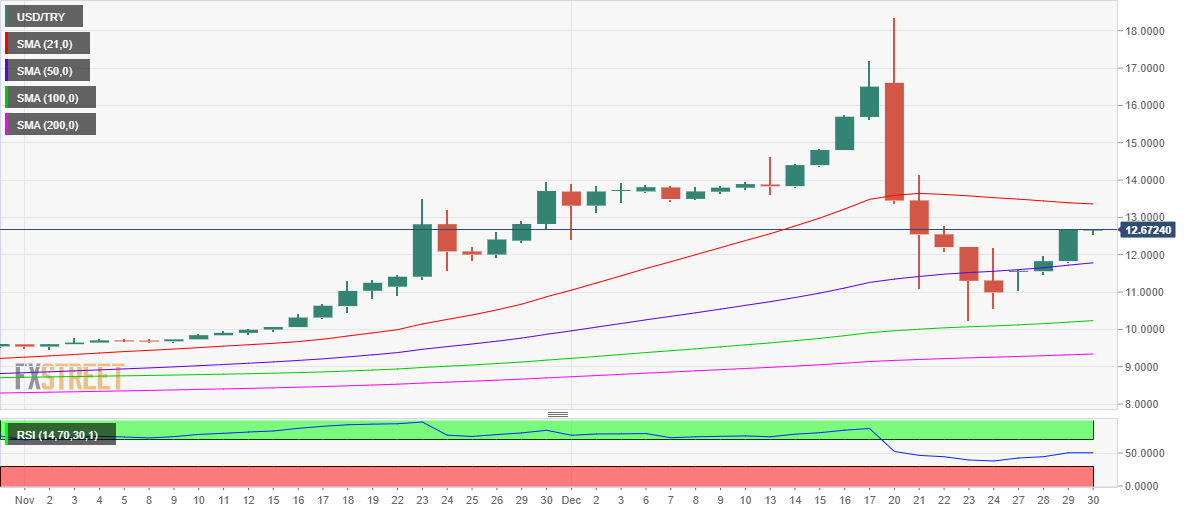
- Silver prices remain pressured around confirming a bearish chart pattern.
- Downbeat oscillators also direct sellers towards 100-SMA.
- 200-SMA adds strength to the $23.15 resistance levels.
Silver (XAG/USD) drops 0.23% intraday to $22.77 during early Thursday in Asia.
The bright metal declined the most in two weeks the previous while confirming a sustained break of the short-term rising wedge bearish formation on the four-hour (4H) play.
The bearish bias also takes clues from the MACD and RSI conditions, suggesting further weakness towards the 100-SMA level of $22.45.
However, the quote’s weakness past $22.45 will be challenged by the $22.00 threshold and $21.80 before directing the XAG/USD bears towards the double bottoms around $21.42, marked in September and December.
Alternatively, recovery moves remain elusive until cross the $23.15 hurdle comprising the stated wedge’s lower line and 200-SMA.
Following that, the 50% Fibonacci retracement level of November 15 to the mid-December downside, near $23.40, will probe silver buyers.
To sum up, silver prices are likely to decline towards the yearly low but the holiday season may restrict moves amid thin liquidity.
Silver: Four-hour chart
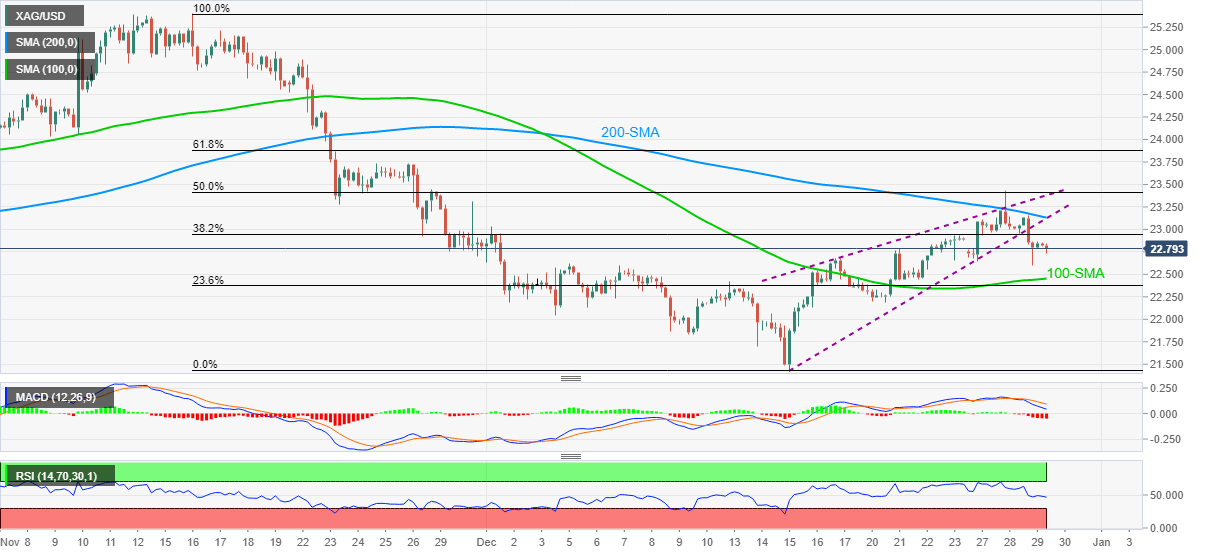
Trend: Further weakness expected
- DXY struggles to overcome four-week low flashed the previous day.
- US 7-year bond auction, Fed rate-hike concerns joined downbeat US data to favor bears of late.
- Hopes of less severe Omicron concerns, year-end liquidity crunch add downside filters.
- US Jobless Claims, Chicago PMI eyed, risk catalyst are the key.
US Dollar Index (DXY) licks its wounds around 95.90 during early Thursday, following the slump to a monthly low the previous day.
The greenback gauge dropped the most in over a week after a jump in the US Treasury yields joined downbeat US data. However, escalating fears of the South African covid variant, namely Omicron, seems to challenge the DXY bears of late.
US Treasury yields rallied the most in three weeks the previous day after an auction of the US seven-week Treasury bond showed disappointing demand for the government securities during the holiday period. “The seven-year notes sold at a high yield of 1.48%, around two basis points higher than where they had traded before the auction,” said Reuters.
That said, the US 10-year Treasury yields stay firmer around the monthly top near 1.55% by the press time while S&P 500 Futures print mild losses at the latest.
In addition to the holiday mood, downbeat US housing and trade numbers also favor the lack of bond demand. On Wednesday, the US Pending Home Sales for November dropped below the forecast of +0.5% to -2.2% MoM whereas Good Trade Balance hit a record deficit of $-97.8B versus $-83.2B prior.
It should be noted, however, that a sustained increase in the coronavirus cases globally and the policymakers’ rejection to introduce heavy lockdown measures probe the greenback bears. ON the same line are escalating odds of the Fed’s sooner rate-hike in 2022. A jump in the US inflation expectations, as portrayed by 10-Year Breakeven Inflation Rate numbers from the Federal Reserve Bank of St. Louis (FRED) back the Fed rate-hike woes. The inflation gauge refreshed the monthly top to 2.53% at the latest.
Amid these plays, the greenback gauge is an inch closer to the negative monthly print but stays positive on the yearly basis amid the hawkish Fed.
Moving on, the US Weekly Jobless Claims and Chicago Purchasing Managers’ Index for December, expected 205K and 62 versus 205K and 61.8 respectively, will decorate the calendar and should be observed for fresh clues. However, major attention will be given to the risk catalyst for clear direction.
Technical analysis
In addition to the quote’s sustained trading below 21-DMA, a clear downside break of the monthly support line, respectively around 96.10 and 96.20, also directs DXY towards the 50-DMA level of 95.52.
| Time | Country | Event | Period | Previous value | Forecast |
|---|---|---|---|---|---|
| 07:00 (GMT) | United Kingdom | Nationwide house price index, y/y | December | 10.0% | |
| 07:00 (GMT) | United Kingdom | Nationwide house price index | December | 0.9% | 0.5% |
| 08:00 (GMT) | Switzerland | KOF Leading Indicator | December | 108.5 | 106.4 |
| 13:30 (GMT) | U.S. | Continuing Jobless Claims | December | 1859 | 1868 |
| 13:30 (GMT) | U.S. | Initial Jobless Claims | December | 205 | 208 |
| 14:45 (GMT) | U.S. | Chicago Purchasing Managers' Index | December | 61.8 | 62 |
The People’s Bank of China (PBOC) set the USD/CNY reference rate at 6.3674 on Thursday while comparing to the previous fix and the previous close at 6.3735 and 6.3680 respectively.
"With 10 billion yuan worth of reverse repos maturing on Thursday, China central bank injects 90 biillion yuan on a net basis on the day," said Reuters after the PBOC fix release.
It's worth noting that market expectations backed 6.3669 as a quote before today's fix published. The reason could be linked to the downbeat US dollar and firmer yields.
China Finance Ministry Official crossed wires via Reuters on early Thursday in Asia while saying, "China will guide overall interest rates lower for Treasury bond issuance in 2022."
Additional comments
In 2022, China will issue a record number of treasury bonds.
In 2022, China will guide overall interest rates for Treasury bond issuance lower.
China will direct more long-term foreign investors into its Treasury bond market.
FX implications
The news should ideally favor AUD/USD considering the rule that an increase in money supply at the largest customer of Australia will benefit the Aussie economy. That said, AUD/USD seesaws around 0.7255 while trying to keep the previous day’s upside momentum at the latest.
Read: AUD/USD Price Analysis: Pokes monthly resistance on the way to 0.7290
- USD/CAD takes offers to refresh fortnight low, down for second consecutive day.
- Oil prices stay firmer around five-week top over geopolitical tensions, EIA inventories.
- USD tracks bond prices to the south amid lacklustre year-end sessions.
- Omicron headlines, energy updates and US data eyed for fresh impulse.
USD/CAD remains pressured around a fortnight low of 1.2775, down 0.15% intraday during Thursday’s Asian session. In doing so, the Loonie pair drops for the second consecutive day while taking clues from firmer oil prices and the downbeat US dollar.
WTI crude oil jumped to the highest since November 26 the previous day, up 0.05% around 76.35 by the press time, following the weekly inventory data from the US Energy and Information Administration (EIA). Adding to the bullish bias were comments from Saudi Arabia’s King Salman bin Abdulaziz who raised concerns over Iran’s lack of cooperation with the international community on its nuclear program and ballistic missile development.
Read: WTI steady above the 50-DMA at $76.30s
Other than the upbeat fundamentals of its own, oil prices and the USD/CAD bears also cheered broad US dollar weakness amid firmer Treasury yields and downbeat data at home. That said, the US Dollar Index (DXY) dropped the most in a week to poke the monthly low before closing around 95.88.
US 10-year Treasury yields jumped the most in three weeks to refresh monthly high around 1.557%, up 7.6 basis points (bps) by the end of Wednesday’s North American session. The benchmark bond coupon remains firmer around 1.55% by the press time.
While tracing the jump in the Treasury yields, increasing odds of the Fed’s early rate hike in 2022 and the weak seven-year bond auction could be cited as the key catalysts. A jump in the US inflation expectations, as portrayed by 10-Year Breakeven Inflation Rate numbers from the Federal Reserve Bank of St. Louis (FRED) back the Fed rate-hike woes. The inflation gauge refreshed the monthly top to 2.53% at the latest.
Talking about the data, the US Pending Home Sales for November dropped below the forecast of +0.5% to -2.2% MoM whereas Good Trade Balance hit a record deficit of $-97.8B versus $-83.2B prior.
It should be noted that the USD/CAD weakness also benefits from thin end-of-year liquidity conditions and policymakers’ rejection of the Omicron fears. “Almost 900,000 cases were detected on average each day around the world between Dec. 22 and 28, with myriad countries posting new all-time highs in the previous 24 hours, including the United States, Australia, many in Europe and Bolivia,” said Reuters.
Looking forward, the US Weekly Jobless Claims and Chicago Purchasing Managers’ Index for December, expected 205K and 62 versus 205K and 61.8 respectively, will decorate the calendar and should be observed for fresh clues. However, major attention will be given to the risk catalyst for clear direction.
Technical analysis
A clear downside break of the seven-week-old ascending support line, near 1.2775, becomes necessary for the USD/CAD bears to aim for November 23 high near 1.2745 and the monthly low near 1.2605. In absence of this, a corrective pullback towards 1.2850 can’t be ruled out.
- NZD/USD extends the previous day’s upside momentum, refreshes intraday high.
- Bullish MACD signals, successful trading above 21-DMA keep buyers hopeful.
- Three-month-old horizontal area, 50-DMA add to the upside filters.
NZD/USD takes the bids to refresh intraday high near 0.6845, up 0.20% on a day during Thursday’s Asian session.
The kiwi pair jumped the most in over a week the previous day while bouncing off 21-DMA. Additionally, bullish MACD signals and firmer RSI to keep NZD/USD buyers hopeful to revisit a three-week-old resistance line near 0.6850.
However, the kiwi pair’s further advances past 0.6850 will be challenged by a horizontal line near 0.6860 comprising September low and tops marked during late November.
In a case where the quote crosses the 0.6860 hurdle, the 0.6900 round figure and the 50-DMA level surrounding 0.6940 will lure the bulls.
Alternatively, a clear downside break of the 21-DMA level of 0.6788 will have multiple supports around 0.6735, portrayed by a short-term horizontal line, a break of which will direct NZD/USD bears towards the yearly low of 0.6701.
NZD/USD: Daily chart

Trend: Further upside expected
- USD/JPY struggles to keep the previous day’s upside momentum around five-week high.
- US Treasury yields rally on disappointing seven-year auction, hopes of Fed rate hike.
- Omicron fears escalate but policymakers may not disturb year-end celebrations.
- US Jobless Claims, Chicago PMI to decorate calendar, risk catalysts are the key.
USD/JPY takes rounds to 115.00 during the initial hours of Tokyo open on Thursday.
The yen pair refreshed a multi-day high the previous day, in contrast to the broad US dollar weakness, amid former yields and the market’s rejection to the South African covid variant, namely Omicron.
US 10-year Treasury yields jumped the most in three weeks to refresh monthly high around 1.557%, up 7.6 basis points (bps) by the end of Wednesday’s North American session. The benchmark bond coupon remains firmer around 1.55% by the press time.
While tracing the jump in the Treasury yields, increasing odds of the Fed’s early rate hike in 2022 and the weak seven-year bond auction could be cited as the key catalysts.
“The seven-year notes sold at a high yield of 1.48%, around two basis points higher than where they had traded before the auction,” said Reuters. On the other hand, a jump in the US inflation expectations, as portrayed by 10-Year Breakeven Inflation Rate numbers from the Federal Reserve Bank of St. Louis (FRED) back the Fed rate-hike woes. The inflation gauge refreshed the monthly top to 2.53% at the latest.
Talking about the virus, daily covid cases kept rising but the hopes that the speedily spreading South African virus variant, namely Omicron, is less severe, keep market players at peace during the year-end holiday season. “Almost 900,000 cases were detected on average each day around the world between Dec. 22 and 28, with myriad countries posting new all-time highs in the previous 24 hours, including the United States, Australia, many in Europe and Bolivia,” said Reuters. It’s worth observing that Japan reported two-month high of 502 cases on Wednesday.
Despite the surging COVID-19 numbers, policymakers are likely to take clues from the global studies terming Omicron as less severe than the previous variant.
On the calendar, the US Pending Home Sales for November dropped below the forecast of +0.5% to -2.2% MoM whereas Good Trade Balance hit a record deficit of $-97.8B versus $-83.2B prior.
Amid these plays, S&P 500 Futures print mild losses while Japan’s Nikkei 225 drops 0.67% at the latest.
Looking forward, the risk catalysts and yields could keep the USD/JPY buyers hopeful even as the year-end sluggish sessions may restrict the pair’s moves. That said, the US Weekly Jobless Claims and Chicago Purchasing Managers’ Index for December, expected 205K and 62 versus 205K and 61.8 respectively, will decorate the calendar.
Technical analysis
October’s high around 114.70 restricts the short-term downside of the USD/JPY prices while 115.25 and the yearly top marked in November, around 115.50, lure the bulls.
| Pare | Closed | Change, % |
|---|---|---|
| AUDUSD | 0.72483 | 0.33 |
| EURJPY | 130.507 | 0.5 |
| EURUSD | 1.13477 | 0.34 |
| GBPJPY | 155.088 | 0.64 |
| GBPUSD | 1.34868 | 0.43 |
| NZDUSD | 0.6827 | 0.4 |
| USDCAD | 1.27934 | -0.12 |
| USDCHF | 0.91471 | -0.29 |
| USDJPY | 114.979 | 0.15 |
- AUD/USD remains firmer after refreshing five-week high, picks up bids of late.
- Bull cross, firmer RSI favor buyers to surpass immediate resistance line.
- Weekly horizontal support restricts short-term downside.
AUD/USD rises to 0.7260, up 0.08% intraday while staying near the highest levels since November 22. In doing so, the Aussie pair justifies a bull cross portrayed on Tuesday, as well as a firmer RSI line during Thursday’s Asian session.
However, an upward sloping trend line from November 30 acts as an extra upside filter around 0.7270 to challenge the Aussie pair’s short-term advances.
Following that, the 78.6% Fibonacci retracement (Fibo.) level of November 15 to December 03 downside, around 0.7290, will be on focus.
On the contrary, a one-week-old horizontal support line restricts short-term AUD/USD downside around 0.7200, a break of which will aim for 50-SMA and 200-SMA, respectively near 0.7195 and 0.7175.
In a case where the AUD/USD drops below 0.7175, it becomes vulnerable to test the last weekly low surrounding 0.7080.
AUD/USD: Four-hour chart
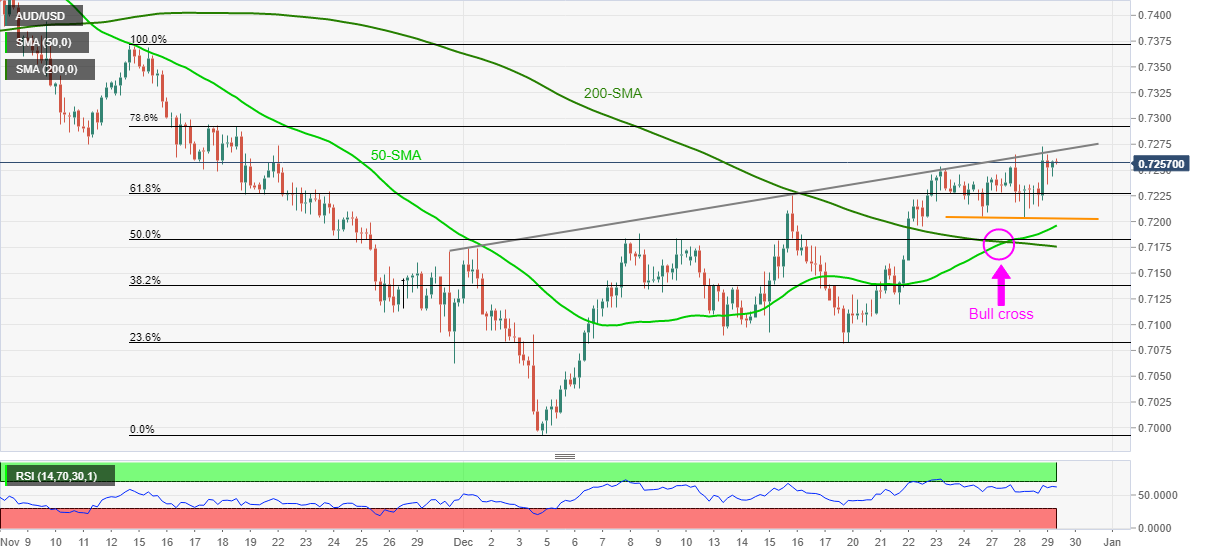
Trend: Further upside expected


© 2000-2026. Sva prava zaštićena.
Sajt je vlasništvo kompanije Teletrade D.J. LLC 2351 LLC 2022 (Euro House, Richmond Hill Road, Kingstown, VC0100, St. Vincent and the Grenadines).
Svi podaci koji se nalaze na sajtu ne predstavljaju osnovu za donošenje investicionih odluka, već su informativnog karaktera.
The company does not serve or provide services to customers who are residents of the US, Canada, Iran, The Democratic People's Republic of Korea, Yemen and FATF blacklisted countries.
Izvršenje trgovinskih operacija sa finansijskim instrumentima upotrebom marginalne trgovine pruža velike mogućnosti i omogućava investitorima ostvarivanje visokih prihoda. Međutim, takav vid trgovine povezan je sa potencijalno visokim nivoom rizika od gubitka sredstava. Проведение торговых операций на финанcовых рынках c маржинальными финанcовыми инcтрументами открывает широкие возможноcти, и позволяет инвеcторам, готовым пойти на риcк, получать выcокую прибыль, но при этом неcет в cебе потенциально выcокий уровень риcка получения убытков. Iz tog razloga je pre započinjanja trgovine potrebno odlučiti o izboru odgovarajuće investicione strategije, uzimajući u obzir raspoložive resurse.
Upotreba informacija: U slučaju potpunog ili delimičnog preuzimanja i daljeg korišćenja materijala koji se nalazi na sajtu, potrebno je navesti link odgovarajuće stranice na sajtu kompanije TeleTrade-a kao izvora informacija. Upotreba materijala na internetu mora biti praćena hiper linkom do web stranice teletrade.org. Automatski uvoz materijala i informacija sa stranice je zabranjen.
Ako imate bilo kakvih pitanja, obratite nam se pr@teletrade.global.
транcфери