- Analiza
- Novosti i instrumenti
- Vesti sa tržišta
Novosti i prognoe: devizno tržište od 29-12-2021
- GBP/USD grinds higher at the highest levels since November 19 after the biggest daily jump in a week.
- Despite record covid infections, UK PM Johnson pushed towards further activity easing.
- New Brexit laws, UK Diplomat Truss’ readiness keep Article 16 threat on table challenge pair bulls.
- US Treasury yields weighed on the greenback, second-tier US data eyed for fresh impulse.
GBP/USD remains on the front foot around 1.3485-90 during Thursday’s Asian session, after refreshing the multi-day top to 1.3599 the previous day.
Alike other major currency pairs, the cable also cheered broad US dollar weakness while ignoring threats from the South African covid variant, namely Omicron, as well as Brexit of late.
On Wednesday, the US Dollar Index (DXY) dropped the most in a week to poke the monthly low before closing around 95.88. The greenback seems to have taken clues from a rally in US Treasury yields and downbeat data to print losses.
That said, US 10-year Treasury yields jumped the most in three weeks to refresh monthly high around 1.557%, up 7.6 basis points (bps) by the end of Wednesday’s North American session. The reason could be linked to a disappointment from the weak seven-year bond auction. “The seven-year notes sold at a high yield of 1.48%, around two basis points higher than where they had traded before the auction,” said Reuters.
At home, the UK refreshed all-time high covid infections with 183,037 daily cases for Wednesday. While conveying the covid numbers, Reuters also said, “Despite the growing number of cases, Prime Minister Boris Johnson has said he will not bring in new restrictions this year in England to limit the spread of Omicron, which now accounts for 90% of all community infections, according to health officials.” It’s worth noting that Sky News reports fresh pressure on UK PM Johnson to ease the self-isolation period for positive cases. “A number of scientists have said that the UK should follow in the footsteps of the US and reduce the COVID self-isolation period to five days, in an effort to protect the NHS,” said the news.
Talking about Brexit, European Commission Vice President Maroš Šefčovič has already warned of a no-deal Brexit if the UK reiterates the threat of activating Article 16. However, British Negotiator Liz Truss is in no mood to turn down the pressure, which in turn suggests another round of drama in the next year’s Brexit talks. Also negative were the fears of a food supply shortage due to the fresh Brexit laws that will be live from early 2022.
It’s worth noting that the US Pending Home Sales for November dropped below the forecast of +0.5% to -2.2% MoM whereas Good Trade Balance hit a record deficit of $-97.8B versus $-83.2B prior.
That said, the GBP/USD traders may keep the latest upside momentum amid a lack of major data/events and the year-end liquidity crunch. However, the US Weekly Jobless Claims and Chicago Purchasing Managers’ Index for December, expected 205K and 62 versus 205K and 61.8 respectively, will be important to watch.
Technical analysis
A clear upside break of September’s low and 50-DMA, respectively around 1.3410 and 1.3425, keeps GBP/USD buyers hopeful to poke the 100-DMA hurdle near 1.3570.
- EUR/USD stays firmer around monthly top after crossing the key hurdle.
- Bullish MACD signals sustained trading beyond 21-DMA also favor buyers.
- 50-DMA, mid-November tops restrict short-term upside moves, 1.1235-30 appears tough nut to crack for bears.
EUR/USD keeps the monthly resistance breakout around 1.1350 during the early hours of Thursday’s Asian session.
The major currency pair jumped to the highest levels since November 30, also posted the biggest daily gains in a week, after crossing the key hurdle to the north. The trend line breakout also gains support from 21-DMA and bullish MACD signals to keep buyers hopeful.
That said, the 50-DMA and November 16 high near 1.1385-90 gains immediate attention of the EUR/USD buyers, a break of which will direct the pair prices towards 50% Fibonacci retracement (Fibo.) of October-November downside, around 1.1440.
It’s worth noting that the 1.1400 threshold and 1.1530 are extra levels to watch during the quote’s successful run-up.
Alternatively, the EUR/USD pair’s downside below the previous resistance line, near 1.1340, won’t be a signal for its plunge as a convergence of the 21-DMA and 23.6% Fibo. level close to 1.1300, will challenge the declines.
Also acting as strong support is the horizontal area comprising multiple lows marked since November 22, around 1.1235-30, a break of which will recall the yearly low of 1.1186 to the chart.
EUR/USD: Daily chart
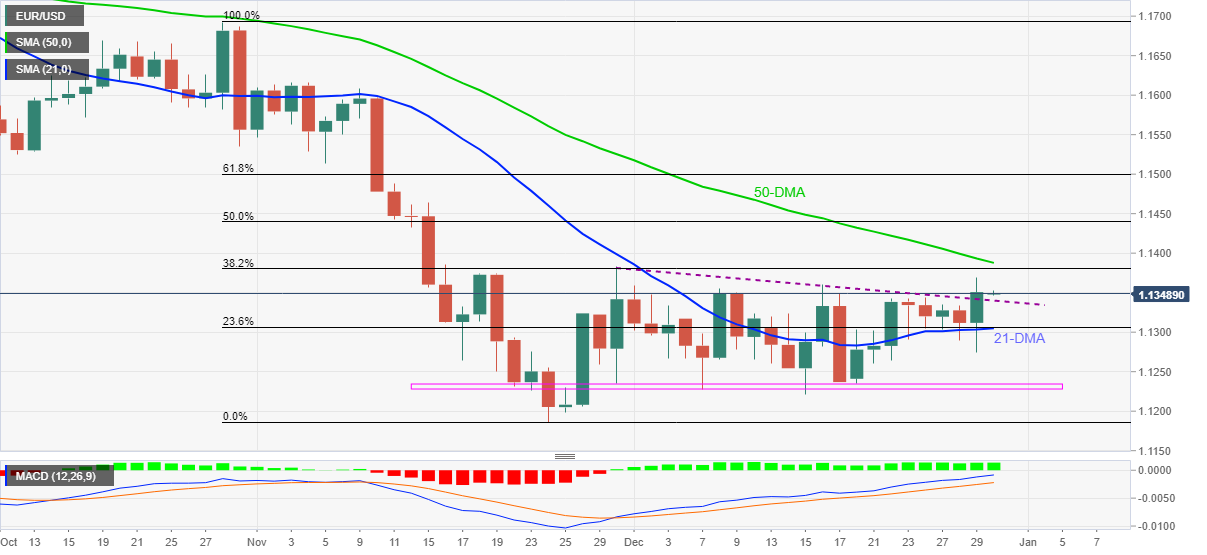
Trend: Further upside expected
- On Thursday, the GBP/JPY advances some 0.53%, as the American session ends.
- The GBP/JPY began its 500-pip rally on December 21 on positive Covid-19 developments in South Africa.
- GBP/JPY has an upward bias, though a break above 155.50 would accelerate the rally towards 156.00.
As the Asian session kicks in, the British pound extends its weekly rally against the Japanese yen, trading at 155.06 at the time of writing. The ongoing GBP/JPY rally paused on Tuesday, allowing late buyers to jump on, closing near the 154.20 area.
That said, the GBP/JPY year-end rally began on December 21, when the pair jumped from 149.80s to 151.40s, as Omicron woes started to wane, once South Africa reported that although the Covid-19 strain was highly transmissible, it caused less severe symptoms. When the news was known, investors’ mood improved, and risk-sensitive currencies like the GBP advanced to the detriment of safe-haven peers.
Once that happened, the GBP/JPY rallied 500-pips and still has some room to go, at least until the May 28 swing high at 156.07.
The cross-currency pair has an upward bias, as portrayed by the daily moving averages (DMAs) residing well below the spot price.
The GBP/JPY Wednesday’s upward move was capped around the June 23 daily high at 155.15, which would be the first resistance on the way up at press time. A break above that level would expose June 15 swing high at 155.48, followed by the May 28 swing high at 156.07.
Contrarily, on the way down, the GBP/JPY first line of defense would be 155.00. A breach of the latter would expose the December 29 daily low at 154.05, followed by the December 23 daily high resistance-turned-support at 153.71, and then the 50-DMA at 152.95.
GBP/JPY Daily chart
-637764162150105841.png)
“We are concerned about Iran's lack of cooperation with the international community on its nuclear program and ballistic missile development,” said Saudi Arabia’s King Salman bin Abdulaziz while addressing the kingdom's advisory Shura Council on late Wednesday.
Also read: Saudi Oil Minister: Oil output could drop 30% due to lack of capex
Additional quotes
Kingdom hopes Iran will change its "negative" behavior in region and choose dialogue and cooperation.
The stability and balance of the oil market is a cornerstone of Saudi energy policy, it is important that all producers comply with the OPEC+ agreement which is essential for oil market stability.
Market reaction
The news joined upbeat oil inventory data to help propel the WTI crude prices to a fresh monthly high of $77.20, around $76.40 during the early Asian session on Thursday.
Read: WTI steady above the 50-DMA at $76.30s
- Gold prices struggle to keep the bounce off one-week low after surprise volatility.
- Market sentiment stays firmer despite a jump in covid infections.
- Yields rally on downbeat seven-year auction, US data came in weaker.
- Gold Price Forecast: Seesawing around 1,800 with a bearish tilt
Gold (XAU/USD) defends $1,800, taking rounds to $1,804-05, as traders approach Thursday’s Asian session. The yellow metal remained surprisingly volatile during the last session amid a rally in the US Treasury yields despite a jump in the global coronavirus cases.
US 10-year Treasury yields jumped the most in three weeks to refresh monthly high around 1.557%, up 7.6 basis points (bps) by the end of Wednesday’s North American session. The reason could be linked to a disappointment from the weak seven-year bond auction.
“The seven-year notes sold at a high yield of 1.48%, around two basis points higher than where they had traded before the auction,” said Reuters. The news also adds, “Seven-year note yields rose as high as 1.472%, the highest since Dec. 9. Benchmark 10-year yields reached 1.558%, the highest since Nov. 29., and 30-year yields reached 1.971%, the highest since Nov. 24.”
Despite the stronger bond yields, Wall Street managed to stop bears, with Dow Jones refreshing a record top during the six-day uptrend, before closing with mild gains of 0.25% on a day around 36,488. Further, S&P 500 rose 0.14% but Nasdaq had to bear the burden of higher yields, down 0.10% while printing two-day declines.
The firmer yields could also be linked to the recently strong expectations of the Fed’s sooner rate hikes in 2022. A jump in the US inflation expectations, as portrayed by 10-Year Breakeven Inflation Rate numbers from the Federal Reserve Bank of St. Louis (FRED) also back the Fed rate-hike woes. The inflation gauge refreshed the monthly top to 2.53% at the latest.
Elsewhere, daily covid cases kept rising but the hopes that the speedily spreading South African virus variant, namely Omicron, is less severe, keep market players at peace during the year-end holiday season. “Almost 900,000 cases were detected on average each day around the world between Dec. 22 and 28, with myriad countries posting new all-time highs in the previous 24 hours, including the United States, Australia, many in Europe and Bolivia,” said Reuters.
Talking about data, the US Pending Home Sales for November dropped below the forecast of +0.5% to -2.2% MoM whereas Good Trade Balance hit a record deficit of $-97.8B versus $-83.2B prior.
Amid these plays, gold buyers remain confused as the metal fails to keep the corrective pullback from the key DMA support. However, thin end-of-year liquidity conditions restrict any hope of clarity even as the aforementioned risk catalysts and US data are likely to offer intermediate moves.
Technical analysis
Despite bouncing off 100 and 200 DMAs, gold prices remain below a two-week-old ascending trend line, backed by a receding bullish bias of MACD and steady RSI.
Given the metal’s failures to bounce back beyond the previous support, not to forget multiple failures to cross the horizontal area from late October, gold bears are likely to keep the controls.
Even so, the 200 and 100 DMA levels, respectively around $1,798 and $1,791 challenge the metals further downside.
Following that, $1,772 may offer an intermediate halt before directing gold prices towards a support zone comprising multiple lows marked since October 18, close to $1,762-60.
Meanwhile, a daily closing beyond the aforementioned horizontal resistance around $1,814 will need validation from the previous support line, currently near $1,822, to recall the gold buyers.
Gold: Daily chart
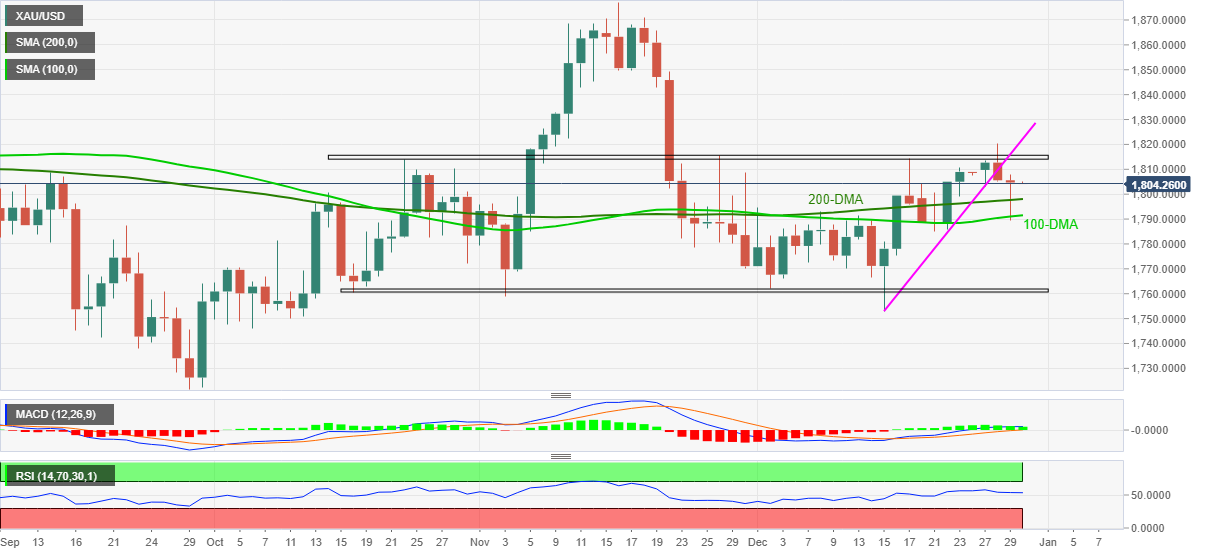
Trend: Further weakness expected
- The Swiss franc advanced during the New York session some 0.28%.
- USD/CHF’s downward move was capped at an upslope trendline respected three previous times.
- USD/CHF had a bearish bias, though upside risks remain.
At press time, as the New York session ends, the USD/CHF pair slides to a new seven-week low, trading at 0.9146. On Wednesday, Swiss franc bulls decisively breached the 200-day moving average (DMA), at 0.9176, the previous support-now-turned dynamic resistance level.
USD/CHF downward move was capped by an upslope trendline
Despite the aforementioned, the USD/CHF freefall was limited by an upslope trendline in the 0.9140-50 area. Why? Because after reaching a daily low beneath the abovementioned at 0.9127, the pair jumped aggressively towards current levels, emphasizing the strength of the trendline.
Nevertheless, once all the daily moving averages (DMAs) reside above the spot price, the bias is downwards, but it would face crucial demand areas on the way down.
USD/CHF’s first support level would be the upslope trendline around 0.9140. A break of that level would expose medium support at the November 9 daily low at 0.9108, followed by strong support at the November 2 swing low at 0.9085.
On the flip side, USD/CHF’s failure to break under the upslope trendline could open the door for USD bulls to reclaim the 200-DMA. The first resistance would be the 200-DMA at 0.9176. A break above that level would expose the 50-DMA at 0.9208 and then the 100-DMA at 0.9213.
USD/CHF Daily chart
-637764128428889816.png)
- On Wednesday, the Australian dollar advances some 0.28% as Wall Street’s session ends.
- Covid-19 Australian developments spurred an emergency meeting of PM Morrison.
- In the US economic docket, Pending Home Sales for November shrank 2.2%, blamed on supply shortages and bottlenecks.
The AUD/USD edges higher as the Wall Street session ends, trading at 0.7250 at the time of writing. US equities ended the session in the green, reflecting investors’ upbeat mood, shrugging off Covid-19 Omicron woes, which according to studies, causes mild symptoms that would not require hospitalization in the case of two doses of vaccinated people.
In the FX market, risk-sensitive currencies like the AUD and the NZD overperform safe-haven peers like the USD, the JPY, and the CHF. Hence, the Aussie dollar rose some 0.32% courtesy of diminished demand for US dollars, as portrayed by the DXY, falling some 0.33%, sitting at 95.90.
In the meantime, the US bond market begins to reflect the hawkish pivot of the Federal Reserve, as witnessed by US Treasury yields in the long term of the curve, rising sharply between six and a half and seven and a half basis points, led by 10s, the 20s, and 30s, sitting at 1.555%, 2.00%, and 1.967%, respectively.
In the Asian session, Covid-19 Omicron cases increased sharply in Australia, spurring a national emergency meeting of PM Scott Morrison ahead of schedule on Thursday, putting a lid on the AUD/USD pair. Nevertheless, good news on Australia – China trading front increased the prospects of the AUD, as China’s Commerce Ministry announced the raise of the importing quota on Australian wool in 2022 to 40,203 tonnes,
In the meantime, the US economic docket featured the Goods Trade Balance for November, which showed a wider deficit than expected, coming at 97.78B more than the 89.00 Billion estimated. Furthermore, Pending Home Sales for the same period, on a monthly basis, shrank 2.2%, worse than the 0.5% increase expected, showing the first signs of inflationary pressures mounting on consumers.
- The risk-sensitive NZD advances on a mixed-market mood.
- US Treasury yields rise, though falter of dragging the greenback, which heads south of the 96.00 threshold.
- NZD/USD has a downward bias and might accelerate the downtrend once the 0.6800 figure is broken.
The New Zealand dollar grinds higher, recovering from earlier losses from the Asian session as the New York session progresses, trading at 0.6827 at the time of writing. Investors’ mood is upbeat as US equities recover some ground, except for the Nasdaq Composite, which falls 0.02%.
US Treasury yields rise but falter to lift the greenback
In the FX market, risk-sensitive currencies like the NZD and the AUD rise, courtesy of a softer USD trading session, with the US Dollar Index falling some 0.27%, under the 96.00 threshold for the first time in the week. Meanwhile, US Treasury bond yields advance sharply during the New York session, with the 10-year Treasury yield up to six basis points, sitting at 1.541%, faltering of boosting the greenback.
In the meantime, the US economic docket featured the Goods Trade Balance for November, which showed a wider deficit than expected, coming at 97.78B more than the 89.00 Billion estimated. Furthermore, Pending Home Sales for the same period, on a monthly basis, shrank 2.2%, worse than the 0.5% increase expected, showing the first signs of inflationary pressures mounting on consumers.
NZD/USD Price Forecast: Technical outlook
The NZD/USD daily chart shows the pair has a downward bias, as the daily moving averages (DMAs) reside well above the spot price with a bearish slope with the shorter time-frame ones, below the longer ones. Technical indicators like the Relative Strength Index (RSI) at 49 aim lower, suggesting that the pair might have another leg-down.
The first line of defense for NZD bulls would be the 0.6800 figure. A breach of the latter would expose December’s 27 and 28 daily low at 0.6788 and then major support at December’s 20 cycle low at 0.6702.
What you need to know on Thursday, December 30:
The dollar seesawed between gains and losses, up during the European session, later down through US trading hours. As traders prepare to close their yearly books, major pairs saw some action for the first time this week.
The EUR/USD pair fell to 1.1279 and then bounced to 1.1368, staying between the monthly extremes. The Pound rallied, with GBP/USD touching 1.3499 before giving up some ground.
Commodity-linked currencies are also up against the dollar, with AUD/USD trading at around 0.7250 and USD/CAD hovering around 1.2800. The USD/JPY pair is currently pressuring the 115.00 level.
Spot gold plummeted to $1,789.38 a troy ounce but managed to recover later in the day, to settle around $1,804.
Crude oil prices surged to fresh monthly highs following encouraging stockpiles-related news. The API report posted a draw of 3.09 million barrels, while the EIA informed that US crude inventories fell by around 3.6 million in the week ended December 24.
European and Asian indexes closed in the red, but Wall Street managed to post some tepid gains. Government bond yields rallied, with that on the 10-year Treasury note hitting 1.55%.
The number of coronavirus contagions in Europe and the US keeps reaching record highs on the daily basis, posing a risk to economic progress.
XRP begins short squeeze as bear trap to return Ripple to $1
Like this article? Help us with some feedback by answering this survey:
- WTI’s US crude oil benchmark rises in the New York session by some 0.62%.
- US EIA inventories fell by 3.6 million barrels, WTI dipped to $75.31 on the release.
- WTI Price Forecast: It has an upward bias that can accelerate towards $79.0, once $77.19 is breached.
US crude oil benchmark, Western Texas Intermediate (WTI), advances during the New York session, trading at $76.39 at the time of writing. Studies on the newly discovered Covid-19 strain Omicron have shown that it causes mild symptoms in people infected. Additionally, people infected with Omicron, but vaccinated at least with two shots, are 50% to 80% less subject of hospitalization.
That said, oil investors reacted positively, pushing WTI prices from $68.50 up to $77.20 in the last eight days, a gain of almost 12.7%, piercing on its way north, critical technical levels, like the 100-day moving average (DMA) and the 50-DMA.
In the meantime, the US Energy and Information Administration (EIA) reported that oil inventories fell in the last week. Oil stockpiles fell by 3.6 million barrels, from 3.1 million estimated by analysts. However, US crude oil production increased to its highest level since May 2020, up to 11.8 million barrels, the highest in 19 months.
WTI Price Forecast: Technical outlook
WTI’s daily chart depicts that black gold has an upward bias. In fact, price action pierced the 50-day moving average (DMA) at $76.05, struggling at the $77.00 handle, retreating towards current levels. Nevertheless, the dip appears to be an opportunity for oil bulls, to re-enter the market at better price levels than Wednesday’s daily high at $77.19.
US crude oil’s first resistance level would be December’s 28 daily high at $76.75. A breach of the latter would open the door for further gains. The next ceiling level would be December’s 29 high at $77.19, followed by November 24 cycle high at $79.02.
- The USD/CAD trims some of Wednesday’s losses, down some 0.05%.
- Covid-19 worries ease, as studies have shown that leads to milder symptoms that could be treated outside the hospital.
- USD/CAD Price Forecast: It is tilted upwards as long as the DMAs reside below the spot price.
The USD/CAD slumps during the New York session, trading at 1.2809 at press time. Investors’ mood is mixed, as US equity indices fluctuate between gainers and losers. In the last couple of weeks, Omicron’s woes eased, as evidence that although it is highly infectious, it leads to milder symptoms, despite breaking the daily record of infections on Tuesday, topping around 1.449 Million worldwide.
In the meantime, the US crude oil benchmark, WTI, retreats from $77.20 monthly highs down to $75.72, a headwind for the commodity-oil-linked Canadian dollar.
The uptick of the USD/CAD in the last hour is courtesy of the slide in crude oil prices, which caused an uptick of 30-pips in the pair, despite broad US dollar weakness across the board. Further, the US Dollar Index, which measures the greenback’s performance against a basket of six currencies, slides down to 95.98, for a 0.24% loss.
In the bond market, US long-maturity Treasury yields advance, with the 10s, the 20s, and 30s, overperforming the shot-term of the yield curve, rising to 1.536%, 1.9875%, and 1.953%, respectively.
In the overnight session, the USD/CAD remained subdued within a 1.2800-35 range, dropping towards 1.2788 near the S1 daily pivot, the first line of defense for USD bulls, who entered the market, lifting prices back above the 1.2800 figure.
USD/CAD Price Forecast: Technical outlook
The USD/CAD daily chart portrays the upward bias in the pair. The daily moving averages (DMAs) reside below the spot price. Furthermore, the 50-DMA just crossed above the 100-DMA, leaving the 200-DMA below the aforementioned.
To the upside, the first ceiling level would be the December 27 cycle high at 1.2847. A break above that level would expose the December 22 daily high at 1.2924, immediately followed by the December 20 swing high at 1.2964.
- A sharp decline of the US dollar across the board boosts XAU/USD.
- Gold back above $1800, after rebounding more than $10.
- The metal is still down for the day but off lows.
Gold rose more than $10 since the beginning of the American session and recently climbed to $1805. Earlier on Wednesday, it tumbled to $1789, the lowest level since last Thursday.
The dollar reversed its trend and dropped sharply, with the DXY falling under 96.00, to the lowest level since December 1. The decline took place even as US yields rallied. The US 10-year peaked so far at 1.55% and the 30 year at 1.96%, both at monthly highs.
The rally of the last hours in gold, together with the up move in yields, is not normal, as the correlation is usually the contrary. The move could reflect thin trading conditions, a weaker greenback of a somewhat resilient gold.
The rebound in XAU/USD from the 20-day moving average now points further to the upside. The next resistance stands at $1815, and a daily close above should clear the way for a test of the next critical resistance located at $1830/35. On the flip side, $1795 is again a support level to consider, followed by $1789 (daily low / 20-day simple moving average).
Technical levels
- The Turkish lira continues its free fall, down some 6% daily.
- The CBRT central bank revealed that it would monitor exchange rates, though it does not have a price target.
- Turkey’s inflation expectations for December are 30.6%, the largest since 2003.
- USD/TRY Price Forecast: As the spot price is above all the DMAs, bullish.
The USD/TRY advances for the third consecutive day, trading at 12.6129 during the New York session at the time of writing. The Turkish lira 6% slides amid concerns over surging inflation and the CBRT unorthodox monetary policy.
On Wednesday, the CBRT said it “will closely monitor exchange rate developments and related risk factors and continue to take the necessary measures and employ due instruments,” as reported in its annual report for 2022. Furthermore, the bank said it would use reserve requirements to support the pursuit of price and financial stability objectives.
Per the CBRT report, the central bank would monitor the decision in the first quarter. It would reassess the policy framework to create a “foundation for sustainable price stability.”
In the meantime, Turkish annual inflation is expected to hit 30.6% in December, per Reuters poll, breaching the 30% threshold for the first time since May 2003. The Turkish Treasury benchmark 10-year bond yield rose to 24.87%, from 24.55% a day earlier.
USD/TRY Price Forecast: Technical outlook
The USD/TRY previous week’s rally stalled on Monday around the 100-day moving average (DMA) at 10.0491, leaving the abovementioned dynamic support level. Furthermore, Monday’s USD/TRY rally was capped at the 50-DMA, though it pierced that level on Wednesday, clearing the way toward higher price levels.
To the upside, the USD/TRY first resistance level would be the December 22 daily high at 12.6737. A breach of the latter would expose the December 3 high at 13.8879, followed by the December 21 high at 14.3800.
-637763909747322617.png)
- US dollar drops across the board, DXY falls under 96.00, to lowest in four weeks.
- US yields at monthly highs, not helping the greenback.
- EUR/USD testing levels above upper limit of current range.
The EUR/USD gained strength after the beginning of the American session on the back of a slide across the board of the US dollar and climbed to 1.1368, reaching the highest level since November 30. A daily close above 1.1350 should be a positive technical development for the euro and the highest close in a month.
USD down, EUR/USD attempts to break range
The decline of the dollar is boosting EUR/USD above a range that has been in place for a month. A consolidation above 1.1360, should point to an extensions of the recovery of the euro.
On the contrary, if EUR/USD is rejected again from the current level, the sideways trading pattern around 1.1290 would remain intact. A daily close under the 20-day moving average, currently at 1.1300, would weaken the short-term outlook.
The greenback weakened even as US yields jumped. The US 10-year stand at 1.53%, up almost 4% and the 30-year at 1.95%, at the highest in a month. In Wall Street, equity prices are mixed, with the Dow Jones un 0.22% and the Nasdaq slides 0.08%.
Economic data released on Wednesday in the US showed Pending Home Sales dropped 2.2% in November, against expectations of a 0.5% increase. A different report showed the advance Goods Trade deficit widened to 97.8 billion dollars in November, from the 83.2 billion of the previous month.
Low volume across financial markets continues to be the key essence of the last week of trading of the year. On Thursday, the key economic number will be US jobless claims.
Technical levels
- EUR/JPY breaking range, targets 130.50/60.
- Euro above key moving averages, strong bullish tone.
The EUR/JPY is rising again after a brief pause and pullback on Tuesday. Recently the cross hit fresh monthly highs at 130.37 and it remains with a solid bullish bias, back above key daily moving averages (20, 55 and 100).
A double bottom pattern, with lows at 127.50 and a neckline at 129.10, has a target around 130.60, near a horizontal resistance. The area around 130.50/60 is set to be a barrier for the euro, that if broken, could clear the way for 131.00.
A decline under 130.00 would alleviate the bullish pressure, while a decline below 129.60 should point for an extension to 129.20. If the euro drops below 129.00, it would weaken significantly, showing difficulties in extending the recovery.
EUR/JPY daily chart
-637763877515541927.png)
- On Wednesday, the British pound surges some 0.31%.
- Thin liquidity conditions, and the lack of economic data, exacerbate volatility in the last days of the year.
- GBP/USD Price Forecast: The 1-hour chart depicts a bullish bias, as GBP buyers eye the 1.3500 figure.
The British pound rallies trading the New York session, trading at 1.3452 at press time. Investors’ mood is mixed, as depicted by Europan stock indices fluctuating between gainers and losers, while US equity futures point towards higher open. Factors like assessments of the Omicron variant and month, quarter, and year-end flow cause market participants to book profits as 2022 looms.
US Treasury yields rise, the DXY falls
In the US money markets, the US 10-year benchmark note advances four basis points, punches through the 1.50% threshold, sits at 1.522%, while the US 2-year Treasury yield stays flat. In the meantime, the US Dollar Index, which tracks the US dollar value against a basket of six rivals, slides some 0.09% down to 96.11, weighing on the buck vs. the risk-sensitive GBP.
With 2022 around the corner, investors are preparing towards a year of higher inflation, central bank tightening, led by the Federal Reserve, the coronavirus pandemic, and China’s economic outlook. As the easy money cycle approaches the end, at least for now, US Treasury yields began to reflect the US central bank hawkish shift, as US 10s, the 20s, and 30s, surged.
An absent UK economic docket left the GBP/USD traders leaning towards the remainder of the minimal economic data from the US. Across the Pond, the Trade Balance posted a deficit of 97.78B, more than the 89.00B contraction expected for November, while in some 30 minutes, Pending Home Sales for November are expected to rise up to 0.5%.
GBP/USD Price Forecast: Technical outlook
The GBP/USD 1-hour chart depicts that the pair remained subdued during the Asian session. Nevertheless, as European traders got to their desks, they pushed the pair through the 100 and the 50-hour simple moving averages (SMAs).
To the upside, the GBP/USD first ceiling level would be the R2 daily pivot at 1.3483. A breach of the latter would expose the 1.3500 figure, immediately followed by the R3 daily pivot at 1.3529.
On the flip side, the first line of defense for GBP bulls would be the R1 daily pivot at 1.3457, followed by the confluence of the 50-SMA and the daily pivot point at 1.3436 then the 100-SMA at 1.3420.
- EUR/USD reversed an early dip to a one-week low touched earlier this Wednesday.
- The USD struggled to preserve its intraday gains and extended support to the pair.
- The second-tier US economic releases did little to provide any meaningful impetus.
The EUR/USD pair recovered its intraday losses to a one-week low and jumped to a fresh daily high, around the 1.1320 region during the early North American session.
The pair extended this week's retracement slide from the vicinity of the 1.1350-60 resistance zone and edged lower through the early part of the trading on Wednesday. This also marked the third day of a negative move in the previous four sessions and was sponsored by some follow-through US dollar buying interest.
Despite the optimism over signs that the Omicron variant might be less severe than feared, worries about the economic impact of the continuous surge in new COVID-19 cases weighed on investors' sentiment. This was evident from the cautious mood around the equity markets, which drove some haven flows towards the buck.
Apart from this, a goodish pickup in the US Treasury bond yields further underpinned the greenback and exerted some pressure on the EUR/USD pair. In fact, the yield on the benchmark 10-year US government bond shot back above the 1.50% threshold amid the Fed's hawkish outlook, indicating at least three rate hikes next year.
The USD, however, struggled to capitalize on the positive move and has now surrendered its intraday gains to a four-day high. This, in turn, assisted the EUR/USD pair to attract some buying near the 1.1275 region, though any meaningful upside still seems elusive amid thin end-of-year liquidity conditions.
Meanwhile, data released from the US showed that the goods trade deficit widened to $97.78 billion in November from $83.2 billion in the previous month. Separately, the Preliminary report indicated that US Wholesale Inventories rose 1.2% MoM in November, though did little to provide any meaningful impetus to the EUR/USD pair.
Wednesday's US economic docket also features the release of Pending Home Sales data. This, along with the US bond yields and the broader market risk sentiment, might influence the USD and produce some trading opportunities around the EUR/USD pair.
Technical levels to watch
- A combination of factors assisted USD/CHF to gain some positive traction on Wednesday.
- A generally positive risk tone undermined the safe-haven CHF and extended some support.
- The USD benefited from an uptick in the US bond yields and provided an additional boost.
- The positive move stalled near the 0.9200 mark amid worries about rising COVID-19 cases.
The USD/CHF pair retreated a few pips from the daily high and was seen trading with only modest intraday gains, around the 0.9185 region heading into the North American session.
Having shown some resilience below 200-day SMA, the USD/CHF pair attracted some buying on Wednesday and moved away from the monthly low, around the 0.9160-55 region touched in the previous day. A generally positive tone around the equity markets undermined the safe-haven Swiss franc and acted as a tailwind for the major.
Apart from this, a goodish pickup in the US dollar demand provided an additional boost to the USD/CHF pair. The Fed's hawkish outlook, indicating at least three rate hikes next year, continued acting as a tailwind for the greenback, which drew additional support from an intraday uptick in the US Treasury bond yields.
Despite the supporting factors, bulls struggled to capitalize on the move and faced rejection near the 0.9200 round-figure mark. The continuous surge in new COVID-19 cases overshadowed the recent optimism led by studies that the Omicron variant might be less severe than feared. This, in turn, capped gains for the USD/CHF pair.
Hence, it will be prudent to wait for a strong follow-through buying beyond the mentioned handle before confirming that the USD/CHF pair has formed a strong base near the 0.9160-55 region. This, in turn, will set the stage for additional gains and push spot prices further towards the 0.9250 heavy supply zone.
Market participants now look forward to the US economic docket, featuring the releases of the November Goods Trade Balance, Wholesale Inventories and Pending Home Sales. Apart from this, the US bond yields would influence the USD. Traders will further take cues from the broader market risk sentiment to grab some short-term opportunities around the USD/CHF pair.
Technical levels to watch
- A combination of factors pushed USD/JPY to a fresh monthly high during the mid-European session.
- A risk-on mood undermined the safe-haven JPY and remained supportive amid rising US bond yields.
- Bulls struggled to make it through a resistance marked by the top end of an ascending trend channel.
The USD/JPY pair refreshed monthly top during the mid-European session, albeit struggled to capitalize on the move beyond the 115.00 mark and quickly retreated a few pips thereafter.
Following the previous day's subdued/range-bound price action, the USD/JPY pair attracted fresh buying on Wednesday and prolonged its recent upward trajectory witnessed since the beginning of this month. Despite the continuous surge in new COVID-19 cases, signs that the Omicron variant might be less severe than feared remained supportive of the underlying bullish sentiment. This was evident from a generally positive tone around the equity markets, which undermined the safe-haven Japanese yen and acted as a tailwind for the major.
The risk-on flow, along with the Fed's hawkish outlook pushed the US Treasury bond yields higher, which acted as a tailwind for the US dollar and provided an additional boost to the USD/JPY pair. Bulls, however, struggled to find acceptance or build on the momentum beyond the key 115.00 psychological mark. A resistance marked by the top boundary of an upward sloping channel extending from monthly swing low capped the upside amid thin year-end trading volumes, warranting some caution before positioning for further gains.
Market participants now look forward to the US economic docket, featuring the second-tier releases of the November Goods Trade Balance, Wholesale Inventories and Pending Home Sales. The data might do little to provide any meaningful impetus. Hence, traders will take cues from the US bond yields, which will influence the USD price dynamics. Apart from this, the broader market risk sentiment will drive demand for the safe-haven JPY and produce some short-term trading opportunities around the USD/JPY pair.
Technical levels to watch
- Gold came under renewed bearish pressure on Wednesday.
- 10-year US Treasury bond yield is testing 1.5%.
- Next near-term technical support is located at $1,790.
Gold closed in the negative territory after jumping to its highest level in more than a month at $1,820 on Tuesday and seems to be having a hard time shaking off the bearish pressure mid-week. XAU/USD was last seen losing 0.6% on a daily basis at $1,795.
The renewed dollar strength on Wednesday is weighing on XAU/USD ahead of the American session. The US Dollar Index is clinging to modest daily gains at 96.35 as investors remain cautious in the face of the surging number of Omicron cases.
There won't be any high-tier macroeconomic data releases in the remainder of the day and investors will remain focused on the risk perception. As of writing, US stocks futures were posting small gains, suggesting that risk flows could return in the second half of the day but thin trading conditions make it difficult to assess the market sentiment.
In the meantime, the benchmark 10-year US Treasury bond yield is edging higher toward 1.5% and not allowing XAU/USD to stage a rebound.
Gold technical outlook
On the four-hour chart, the Relative Strength Index dropped below 50, confirming the view that the bearish pressure is gathering strength. On the downside, the 100-period SMA is forming the first near-term technical support at $1,790 ahead of $1,785 (static level).
On the upside, $1,800 (psychological level) aligns as first resistance before $1,805 (200-period SMA). In case a four-hour candle closes above the latter, buyers could see that as an opportunity to reclaim the control of the pair's action.
Additional levels to watch for
- A strong pickup in the USD demand dragged AUD/USD lower for the second straight day.
- Worries about surging COVID-19 cases drove haven flows towards the safe-haven buck.
- A positive risk tone could lend support and limit losses for the perceived riskier aussie.
The intraday USD buying picked up pace since the early European session and dragged the AUD/USD pair back closer to the daily low, around the 0.7215 region in the last hour.
Having touched an intraday high near the 0.7235 region, the AUD/USD pair met with a fresh supply on Wednesday and turned lower for the second successive day. The downtick was exclusively sponsored by resurgent US dollar demand, which drew some support from worries about the economic impact of the continuous surge in new COVID-19 cases.
Apart from this, the Fed's hawkish outlook, indicating at least three rate hikes next year, further underpinned the greenback. That said, a generally positive tone around the equity markets could hold back traders from placing aggressive bullish bets around the USD and extended some support to the perceived riskier aussie, at least for now.
Meanwhile, the AUD/USD pair, so far, has managed to hold its neck above the 0.7200 round-figure mark. This makes it prudent to wait for some follow-through selling before positioning for an extension of the overnight pullback from the highest level since November 2022. This, in turn, would suggest that the recent bounce from the YTD low has run its course.
Market participants now look forward to the US economic docket, featuring the second-tier releases of the November Goods Trade Balance, Wholesale Inventories and Pending Home Sales data. This, along with the broader market risk sentiment, will influence the USD price dynamics and produce some short-term trading opportunities around the AUD/USD pair.
Technical levels to watch
GBP/USD has reversed its direction after climbing to its highest level in more than a month at 1.3463 on Tuesday. The pair is closing in on key 1.3400 support and additional losses could be witnessed if buyers fail to defend that level, according to FXStreet’s Eren Sengezer.
Sellers eye a drop below 1.3400
“On the downside, the lower-limit of the weekly trading range is forming key support at 1.3400. In case this level turns into resistance, additional losses toward 1.3370 (former resistance) could be witnessed before 1.3330 (200-period SMA).”
“The 20-period SMA acts as interim resistance at 1.3420 before 1.3460 (static level) and 1.3500 (psychological level).”
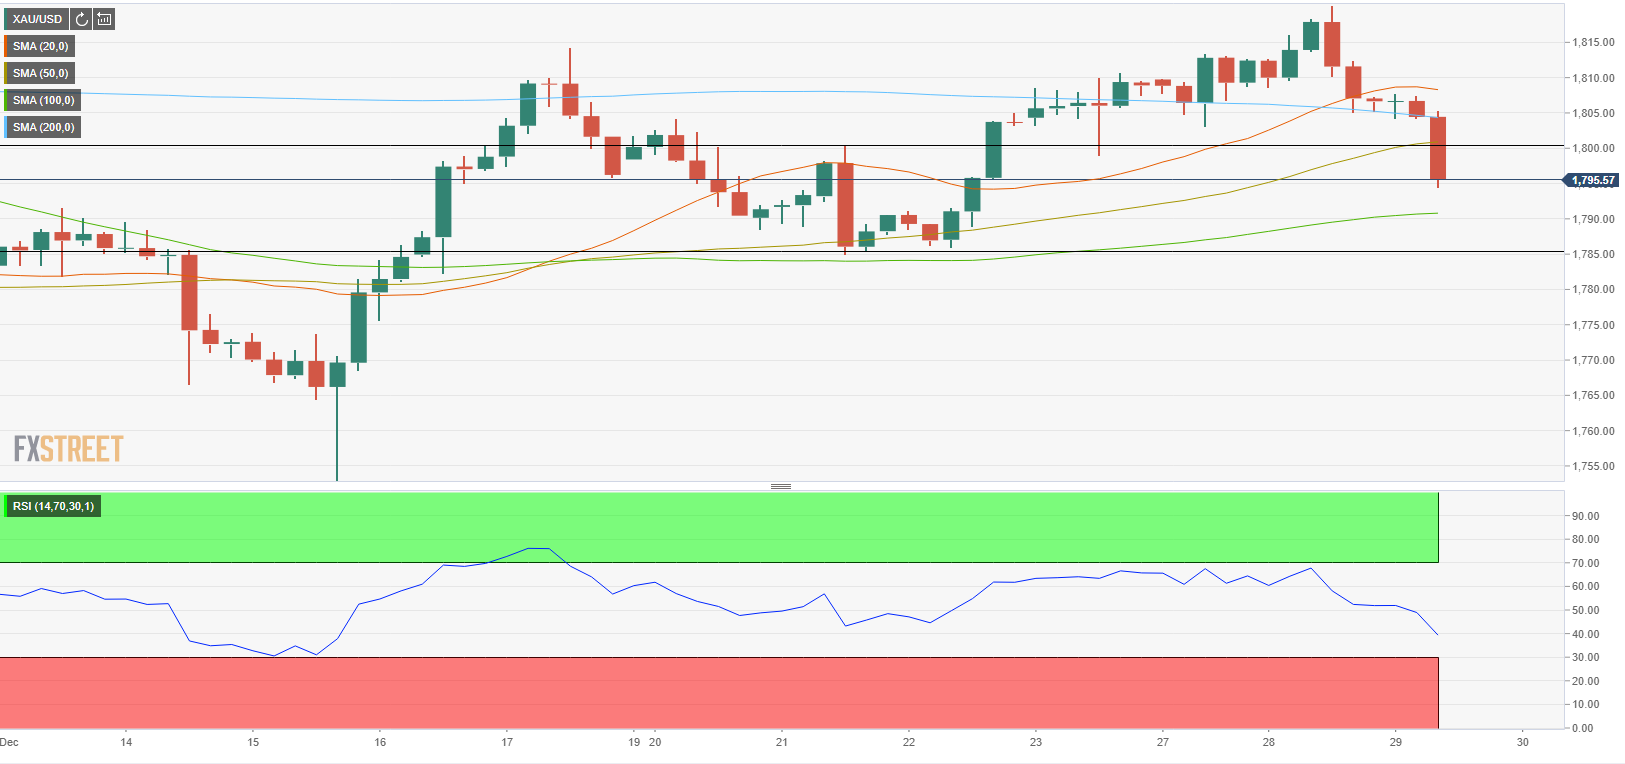
- Gold price keeps falling, with eyes on the critical $1,800 mark.
- Surging coronavirus cases globally lift the US dollar’s safe-haven demand.
- Gold 2022 Outlook: Correlation with US T-bond yields to drive yellow metal.
Gold price is extending the previous correction from monthly highs of $1,820, as the US dollar regains poise amid risk-averse market conditions. Investors remain wary amid surging covid cases globally, despite studies showing the Omicron variant as less severe. Increased March Fed rate hike bets also turn gold out of favor. Also, thin liquidity and year-end profit-taking keep gold price on the defensive.
Read: Gold Price Forecast: XAU/USD down but not out while above the $1,800 mark
Gold Price: Key levels to watch
The Technical Confluences Detector shows that the gold price is approaching a powerful demand area around $1,801-$1800, which is the convergence of the SMA50 one-day, SMA50 four-hour and Fibonacci 38.2% one-week.
A sustained break below the latter will put the SMA200 one-day of $1,798 to test. The next downside target is aligned at $1,794, where the pivot point one-day S2 coincides with the Fibonacci 61.8% one-week.
Sellers will then look out for the pivot point one-week S1 at $1,792, below which the SMA100 one-day at $1,790 will get probed.
On the other hand, if the $1,800 mark holds, then a rebound towards the Fibonacci 23.6% one-week at $1,806 cannot be ruled out.
Further up, the confluence of the Fibonacci 23.6% one-day and SMA5 one-day at $1,809 will come into play, followed by the previous week’s high of $1,811.
The meeting point of the Fibonacci 61.8% one-day and pivot point one-day R1 at $1,815 will be the level to beat for gold bulls.
Here is how it looks on the tool

About Technical Confluences Detector
The TCD (Technical Confluences Detector) is a tool to locate and point out those price levels where there is a congestion of indicators, moving averages, Fibonacci levels, Pivot Points, etc. If you are a short-term trader, you will find entry points for counter-trend strategies and hunt a few points at a time. If you are a medium-to-long-term trader, this tool will allow you to know in advance the price levels where a medium-to-long-term trend may stop and rest, where to unwind positions, or where to increase your position size.
This has not been an easy year despite the strong fiscal and monetary support to covid-struck economies, especially in the Western world. In the view of analysts at Natixis, it does not look like 2022 is going to be calmer than 2021, and not just because of the effects of the pandemic, but also because of the great decoupling of monetary policies between the West and the East.
More exchange-rate volatility seems guaranteed for 2022
“It seems that 2022 will be characterized by a great divergence of monetary policies between the key Western central banks and those in the East. Such monetary decoupling has important consequences – namely, the increase in the cost of financing due to the withdrawal of monetary stimuli in the West could further slow economic growth. This is particularly problematic given recent developments with the Omicron variant of covid in terms of reduced cross-border, but also domestic, mobility.”
“A higher cost of financing in the West, and especially in the US, should entice the appetite of international investors increasing portfolio flows into the US and supporting a strong dollar compared with the yuan and yen. More generally, more exchange-rate volatility seems guaranteed for 2022 on the basis of such monetary-policy divergence.”
In the wake of the pandemic and an unequal economic recovery, global capital markets are being transformed by a number of interrelated forces. The following six areas will be central to better understand the dynamics shaping the future of capital markets, in the view of economists at BNY Mellon.
Democratization of public markets
“Today, market data is readily accessible online and new technologies have significantly reduced the cost of trading and other barriers to entry. This means that more people can trade, at any time, from anywhere. Increased access to markets is a positive development, but it is not without risk. It raises important questions about market and institutional resilience, and investor safeguards, as well as opening a broader discussion on financial education.”
Greater access to new wealth creation opportunities
“New products are being developed that allow retail investors to allocate capital to private market alternatives. Here again, challenges surface when opening these products to a larger community of investors. People need to know about the associated risks, which differ materially from investing in traditional stocks and bonds.”
Blurring of public and private markets
“More companies than ever before are entering public markets worldwide, and yet in the US we are seeing firms remain private for longer, and others electing to transition from public to private. This trend is fuelled by heightened disclosure requirements and regulatory scrutiny for publicly-held firms, as well as investor eagerness to fund private companies. Firms are also exploring other avenues to raise capital and reduce dependency on equity markets.”
Concerns around data and cyber security
“Data is emerging as its own asset class, and data management infrastructure is a key growth area for traditional financial firms. Institutions are actively seeking ways to leverage analytics to remain nimble and promote growth. But questions remain around how firms can innovate safely, benefiting from a more agile use of data while mitigating risks.”
New roles for financial firms
“Blockchain and distributed ledger technologies have the potential to disrupt core functions within capital markets, including trading processes, settlement systems, payments, and capital raising. At the same time, regulators and lawmakers are increasingly vocal about concerns around cryptocurrencies, raising important questions around their future viability as an asset class.”
Transparency around ESG
“ESG is a top priority for financial firms. As investors, asset owners, and corporations navigate their roles in supporting the transition to net-zero and stakeholder capitalism significant questions remain about what market structures and tools are needed to support sustainable investing.”
In its latest policy framework report published on Wednesday, Turkey’s central bank (CBRT) said that it “will closely monitor exchange rate developments and related risk factors and continue to take the necessary measures and employ due instruments. “
Additional takeaways
In 2022 will continue gold ore purchases against try with a view to accumulating reserves.
In 2022, may continue gold buying and selling transactions against fx in its spot market.
Will continue to provide banks with fx liquidity at one-week and one-month maturities at the central bank fx deposit market, with a limit of approximately $50 bln in total.
Will aim to strengthen the effectiveness of the monetary policy as well as boosting forex reserves for the sake of financial stability.
Negotiations to sign swap agreements with other central banks will continue.
Required portion of the fx demand of the state-owned enterprises will be met directly by the central bank and finance ministry according to market conditions.
More than one repo auction may be conducted with maturities between 5 and 12 days -when deemed necessary.
Will use reserve requirements as a supporting instrument in pursuit of the price stability and financial stability objectives.
In 2022, the reserve options mechanism will be completely terminated.
Comprehensive studies will be carried out to increase the amount of gold collected from under the mattress.
Market reaction
USD/TRY is consolidating the spike to 12.54 reached after the central bank statement. At the time of writing, the spot is higher by 2.31% on the day, trading at 12.07.
Separately, the country’s official gazette announced earlier that they will promote the conversion of gold savings into liras.
- USD/CAD added to the overnight recovery gains and edged higher for the second straight day.
- Worries about surging COVID-19 cases benefitted the safe-haven USD and extended support.
- Bullish crude oil prices underpinned the loonie and kept a lid on any further gains for the pair.
The USD/CAD pair trimmed a part of its intraday gains and was last seen trading around the 1.2820-25 region during the early part of the European session.
The pair built on the previous day's goodish bounce from the 1.2770 area, or a one-and-half-week low, and gained some traction during the early part of the trading on Wednesday. The uptick, however, faltered near the 1.2830-35 region amid bullish crude oil prices, which tend to underpin the commodity-linked loonie.
The black gold remained supported by easing concerns over the Omicron variant and Tuesday's report from the American Petroleum Institute, which showed a draw of 3.1 million barrels last week. Investors now await the official crude oil supply data from the US Energy Information Administration, due later during the US session.
Meanwhile, the downside remains cushioned amid a modest US dollar strength. Despite the recent optimism, investors remain worried about the economic impact of the continuous surge in new COVID-19 cases. This, in turn, assisted the safe-haven US dollar to gain traction for the second successive day and acted as a tailwind for the USD/CAD pair.
The mixed fundamental backdrops warrant some caution for bullish traders and before confirming that the recent retracement from the YTD high has run its course. That said, the overnight rebound from support marked by the lower boundary of an ascending channel and the subsequent move up supports prospects for a further near-term appreciating move.
Wednesday's US economic docket, featuring the November Goods Trade Balance, Wholesale Inventories and Pending Home Sales data, might do little to provide any impetus. Hence, traders will take cues from the broader market risk sentiment, which will drive the USD demand. Apart from this, oil price dynamics should produce some trading opportunities around the USD/CAD pair.
Technical levels to watch
EUR/USD has come under modest bearish pressure early Wednesday and dropped below 1.1300 for the first time in a week. As FXStreet’s Eren Sengezer notes, the technical outlook points to additional losses in the near-term.
Sellers could move to the sidelines if EUR/USD reclaims 1.1300 and holds there
“The Relative Strength Index (RSI) indicator on the four-hour chart dropped below 50, confirming the view that sellers are starting to dominate the pair's action. The next target on the downside is located at 1.1260 (static level) ahead of 1.1240 (static level).”
“On the upside, the 200-period and the 100-period SMAs form strong resistance at 1.1300. In case the pair rises above this level and starts using that as support, it could edge higher toward the upper limit of the two-week-old range at 1.1340.”
Towards high volatility. Analysts at Natixis explain why there will be high volatility in inflation, real interest rates and stock market indices (low and higher frequency).
Volatility of inflation
“During the energy transition, it will be very difficult to lower fossil fuel production and consumption at the same time. The mismatch, which then occurs regularly, between fossil fuel supply and demand, will lead to high volatility in energy prices, leading to high volatility in inflation.”
Volatility of real interest rates
“Nominal interest rates are rigid because central banks react little to temporary rises in inflation. This means that the volatility of inflation becomes volatility in real interest rates. If real interest rates are volatile, share prices are volatile, due to the normal negative correlation between real interest rates and equity market indices. But this is a low-frequency volatility of share prices, linked to real interest rate volatility, which in turn is linked to inflation volatility.”
Higher-frequency volatility of stock market indices
“Stock market valuations are currently high. This pushes investors to exercise caution as soon as there is negative news leading to a series of declines in stock market indices. But since real interest rates are negative and inflation is higher, it is very costly for investors to return to cash or bonds, and they return very quickly to equities. This leads to frequent declines followed quickly by upturns in stock market indices.”
- EUR/USD drops back below 21-DMA as the US dollar regains poise.
- US dollar rebounds with Treasury yields amid a cautious market mood.
- The pair looks to test symmetrical triangle support at 1.1244 on the daily sticks.
EUR/USD is resuming the decline below 1.1300, having met fresh supply over the last hour, as the US dollar catches a fresh bid in tandem with the Treasury yields.
The mixed market mood, amid rising covid cases in Europe and the optimism over the less severe effects of the new Omicron variant, benefiting the safe-haven US dollar.
Additionally, rising inflation expectations continue to back the case for a March Fed rate hike, allowing the dollar to keep an upper hand over the euro. The ECB policymakers continue dismissing a 2022 rate hike.
Looking at EUR/USD’s daily chart, the price tested the upper boundary of a month-long symmetrical triangle formation earlier this week.
But sellers continued to lurk near mid-1.1300s, knocking the rates back below the 21-Daily Moving Average (DMA) at 1.1300.
The extended weakness below the latter put the focus back on the triangle support, which is pegged at 1.1244.
The triangle breakdown will get confirmed on a daily candlestick closing below the latter, with the yearly lows of 1.1186 back on sellers’ radars.
The 14-day Relative Strength Index (RSI) has turned south below the 50.00 level, suggesting that there are increased odds of a potential leg lower.
EUR/USD: Daily chart
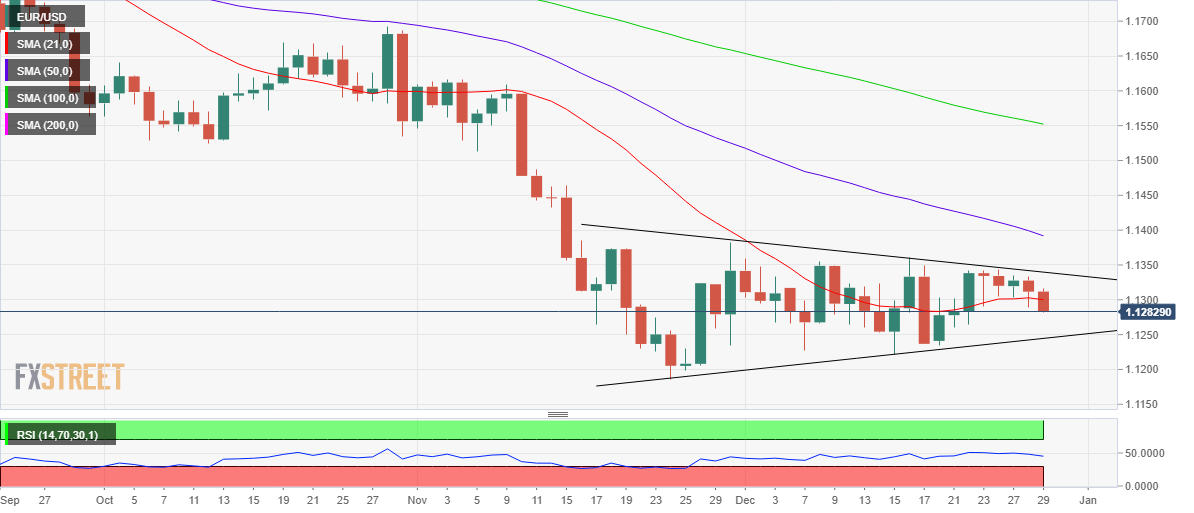
On the flip side, recapturing 21-DMA support-turned-resistance is critical for bulls to regain control.
Fresh buying opportunities will emerge above the latter, opening doors for a rally towards the falling trendline (triangle) resistance at 1.1339.
If the price breaks through that barrier, then an upside breakout from the symmetrical triangle will get validated, triggering a fresh advance towards the bearish 50-DMA at 1.1391.
EUR/USD: Additional levels to consider
- GBP/USD edged lower for the second successive day on Wednesday.
- The worsening COVID-19 situation in the UK weighed on the sterling.
- A modest USD strength also contributed to the intraday selling bias.
The GBP/USD pair witnessed some selling during the early European session and dropped to a fresh daily low, around the 1.3415 region in the last hour.
Despite easing concerns over the fast-spreading Omicron variant, investors remain concerned about the economic impact of the continuous surge in new COVID-19 cases. This, in turn, assisted the safe-haven US dollar to gain some positive traction for the second successive day and acted as a headwind for the GBP/USD pair through the first half of the trading on Wednesday.
The British pound was further undermined by the fact that Britain reported a record 129,471 new cases on Tuesday, which could force the government to impose fresh restrictions. It is worth recalling that the UK Prime Minister Boris Johnson had said last week that ministers would keep the latest data under constant review to see if stricter measures are needed.
That said, a generally positive tone around the equity markets could hold back the USD bulls from placing aggressive bets and extend some support to the GBP/USD pair. This makes it prudent to wait for a strong follow-through selling before confirming that the pair has topped out and positioning for a deeper corrective slide from over one-month high touched on Tuesday.
In the absence of any major market-moving economic releases from the UK, the USD price dynamics will continue to play a key role in influencing the pair's intraday movement on Wednesday. The second-tier US macro data – November Goods Trade Balance, Wholesale Inventories and Pending Home Sales – might also do little to provide any impetus to the GBP/USD pair.
Technical levels to watch
In the past, rising interest rates stemmed the rise in asset prices in OECD countries. But monetary policy now remains expansionary throughout the entire expansion period. What will stem the rise in asset prices if no longer monetary policy? An “exogenous” crisis and/or a fall in demand for an asset once its price becomes too high, according to analysts at Natixis.
What mechanisms may then stem the rise in asset prices today?
“An exogenous crisis, not linked to an economic or financial mechanism (geopolitical crisis, public health crisis); A fall in demand for assets once their prices become too high: if share prices are abnormally high, savers will turn away from equities and share prices will fall; if real estate prices are abnormally high, households will stop buying housing.”
Are there signs today of a fall in demand for high-priced assets?
“Are there now signs of this dynamics where even though interest rates remain low, asset prices stop rising due to a fall in demand for assets? This is clearly not the case at present: asset prices continue to rise and demand for equities is strong, bearing in mind that in the US this takes the form of share buybacks by companies.”
Here is what you need to know on Wednesday, December 29:
The US Dollar Index closed the second straight day in the positive territory and continues to inch higher on Wednesday but markets are likely to remain quiet ahead of the New Year holiday. Later in the day, November Pending Home Sales and Goods Trade Balance will be featured in the US economic docket but these data are unlikely to trigger a noticeable market reaction.
Wall Street's main indexes closed mixed on Tuesday and US stocks futures indexes are posting modest gains in the early European session. The 10-year US Treasury bond yield continues to move sideways in a narrow range below 1.5%.
The US, the UK, France, Greece and Portugal all registered record-high one-day increases in new coronavirus cases on Tuesday but this development doesn't seem to be having a significant impact on risk sentiment. Reports continue to suggest that the Omicron variant is less severe than the Delta variant.
EUR/USD is testing 1.1300 after closing in the negative territory on Tuesday as the dollar's market valuation continues to drive the pair's movements.
GBP/USD turned south after touching its highest level in five weeks at 1.3463 on Tuesday. The pair is currently posting small losses around 1.3420.
USD/JPY preserves its bullish momentum and stays within a touching distance of 115.00 early Wednesday.
Gold climbed to its strongest level since late November at $1,820 on Tuesday but made a sharp U-turn. XAU/USD is edging lower toward $1,800 in the European morning.
Bitcoin lost more than 6% and broke below $50,000 on Tuesday before going into a consolidation phase around $48,000. Ethereum also suffered heavy losses and fell below $4,000 after managing to hold above that level in the previous five days.
In the opinion of analysts at Natixis, it is reasonable to think that the energy transition will lead to lower growth and higher inflation, and therefore to stagflation.
Why the energy transition will be stagflationary
“The energy transition will curb potential growth since it implies that very large investments will not lead to additional production, but will only replace capital that must be destroyed; there is indeed a loss of potential production compared to a situation where investment would generate additional available capital unless all the additional investment is taken from consumption, which is unlikely.”
“The energy transition will increase inflation, first because the cost of producing renewable energy is higher than the cost of producing thermal energy; and second because amortised capital is replaced by new unamortised capital.”
“Stagflation is the most complicated for central banks, as they do not know whether they should react to inflation or to sluggish growth. This is all the more the case if fiscal policy becomes more expansionary in response to weak growth, which makes it even more difficult to implement an interest rate hike. We have to go back to the 1970s and 80s to find stagflation in the OECD countries, and then monetary policies were restrictive, but this will probably not be the case this time around.”
- NZD/USD struggled to capitalize on the attempted recovery from a one-week low.
- A softer risk tone was seen as a key factor that weighed on the perceived riskier kiwi.
- Retreating US bond yields kept the USD bulls on the defensive and helped limit losses.
The NZD/USD pair seesawed between tepid gains/minor losses through the early European session and was last seen trading in the neutral territory, just below the 0.6800 mark.
The pair reversed an early dip to a one-week low, around the 0.6775 region, albeit struggled to capitalize on the attempted recovery amid a softer risk tone. The recent optimism over reports that the Omicron variant might be less severe than previously feared was overshadowed by uncertainty over the economic impact of the continuous surge in new COVID-19 cases. This, in turn, weighed on investors' sentiment, which was evident from a weaker trading sentiment around the equity markets and drove flows away from the perceived riskier kiwi.
The downside, however, remained cushioned, at least for the time being, amid subdued US dollar price action. The flight to safety led to a modest decline in the US Treasury bond yields, which, in turn, was seen as a key factor that kept the USD bulls on the defensive. That said, the Fed's hawkish outlook, indicating at least three rate hikes next year, acted as a tailwind for the greenback and kept a lid on any meaningful gains for the NZD/USD pair.
Moreover, investors also seemed reluctant to place aggressive directional bets amid thin year-end trading conditions. Market participants now look forward to the US economic docket, featuring the second-tier releases of the November Goods Trade Balance, Wholesale Inventories and Pending Home Sales data. This, along with the US bond yields and the broader market risk sentiment, will influence the USD and provide some impetus to the NZD/USD pair.
Technical levels to watch
The Federal Reserve has announced that it will exit quantitative easing by spring 2022 and then hike its key interest rates. But in the view of analysts at Natixis, what the Fed is going to do will have no effect on inflation.
What would it take for US monetary policy to really combat inflation?
“The Fed will stop increasing the size of its balance sheet and hike its key interest rates. But in the medium-term, they are expected to reach only 2 to 2.5%. Given the size of non-resident purchases of US bonds, the Fed's massive bond holdings and the modest terminal level of short-term interest rates, long-term interest rates are likely to remain low (around 2% at the end of 2022).”
“Financial markets also conclude that long-term interest rates will not rise much, real long-term interest rates will remain negative. If real short-term and long-term interest rates remain negative for several years, then monetary conditions will remain expansionary. This means that demand for goods and services will continue to be stimulated by monetary policy, which means that monetary policy is not actually fighting inflation.”
“For monetary policy to really combat inflation, real long-term interest rates would have to rise, requiring a much higher terminal value for the Fed funds rate (above 3% if we believe inflation will return to 3% in the US) and a significant reduction in the size of the Fed’s balance sheet, to steepen the yield curve.”
One-month risk reversal (RR) of silver (XAG/USD) turns positive for the first time in four days on Wednesday, per data source Reuters. That said, the spread between call and put options prints +0.050 level at the latest.
Even so, the weekly print is still down the most since the period ended on December 03, with -0.650 numbers.
Looking at the prices, XAG/USD steps back from the intraday high but prints 0.34% daily gains around $23.10 heading into Wednesday’s European session.
The previous metal refreshed monthly high the previous day but closed negative amid risk-off mood. The latest pick-up in prices could be linked to the cautious optimism in the markets as Omicron woes battle receding fears of the virus during the holiday season.
FX option expiries for December 29 NY cut at 10:00 Eastern Time, via DTCC, can be found below.
- EUR/USD: EUR amounts
- 1.1270-75 625m
- 1.1290-00 438m
- 1.1425 280m
- USD/JPY: USD amounts
- 113.00-05 380m
- 113.35-40 276m
- 114.50-60 728m
- 115.00 585m
- 116.50 552m
- AUD/USD: AUD amounts
- 0.7030 2.9b
- EUR/GBP: EUR amounts
- 0.8400 1.2b
- 0.8550 682m
- 0.8650 673m
- EUR/JPY: EUR amounts
- 128.00 223m
- 130.00 384m
- AUD/JPY: AUD amounts
- 81.15 993m
- 82.10 609m
- USD/JPY regained positive traction on Wednesday and inched back closer to the monthly top.
- A combination of factors might hold back traders from placing bullish bets and cap the upside.
- A sustained strength beyond the 115.00 mark is needed to support prospects for further gains.
The USD/JPY pair built on its steady intraday ascent and moved back closer to the 115.00 psychological mark heading into the European session.
Following the previous day's subdued/range-bound price moves, the USD/JPY pair attracted fresh buying on Wednesday and was last seen trading just a few pips below the monthly high. The uptick, however, lacked bullish conviction and is more likely to remain capped amid a softer risk tone, which tends to benefit the safe-haven Japanese yen.
Uncertainty over the economic impact of the continuous surge in new COVID-19 cases offset the recent optimism led by reports that the Omicron variant might be less severe than previously feared. This was evident from a generally weaker trading sentiment around the equity markets, which, in turn, could act as a headwind for the USD/JPY pair.
Meanwhile, the flight to safety led to a modest downtick in the US Treasury bond yields and kept the US dollar bulls on the defensive through the early part of the trading on Wednesday. This might further hold back traders from placing aggressive directional bets and keep a lid on any meaningful upside for the USD/JPY pair.
Even from a technical perspective, traders might wait for a sustained strength beyond an ascending channel resistance before positioning for a further appreciating move. The mentioned barrier coincides with the 115.00 mark, which should now act as a key pivotal point and help determine the near-term trajectory for the USD/JPY pair.
Market participants now look forward to the US economic docket, featuring the second-tier releases of the November Goods Trade Balance, Wholesale Inventories and Pending Home Sales data. This, along with the US bond yields, will influence the USD. Apart from this, the broader market risk sentiment might provide some impetus to the USD/JPY pair.
Technical levels to watch
- Gold reverses the pullback from monthly peak, refreshes intraday high.
- Market sentiment remains divided amid Omicron, Fed views and year-end holidays mood.
- EU’s Gentiloni cites a long way from economic collapse like fist wave.
Gold (XAU/EUR) refreshes intraday high near €1,599, up 0.15% intraday while heading into Wednesday’s European session.
The metal jumped to the highest in a month the previous day before the risk-off mood dragged it back from €1,607. The latest recovery moves, however, could be considered consolidation of previous losses amid inactive markets amid mixed catalysts.
The second day of over one million covid infections globally and record-high COVID-19 daily cases from France and the UK portray sours sentiment. However, comments from the European Economic Commissioner Paolo Gentiloni Silveri seem to battle the bears.
“EU Economic Commissioner Gentiloni intends to propose a modification of the EU stability pact in 2022,” per German media FAZ. The news adds, “The reform will include a "differentiated consideration" of heavily indebted member states.” It’s worth mentioning that the EU’s Gentiloni also mentioned, per FAZ, “We are still a long way from an economic collapse like the first covid wave.”
Elsewhere, stock futures in the US and Europe recover recent losses as the Treasury yields remain pressured amid chatters surrounding the Fed’s early rate hike and US stimulus.
Above all, a lack of major data/events joins thin end-of-year liquidity conditions to limit the gold prices.
Technical analysis
Gold prices justify the sustained trading beyond 5-DMA, around €1,597, while picking up bids inside a one-month-old ascending trend channel bullish chart pattern.
Adding to the bullish bias is the metal’s successful trading above 50-DMA, an ascending support line from the late September and firmer RSI.
That said, the quote is ready to refresh the monthly peak beyond the latest high of €1,607. However, the upper line of the stated channel near €1,614 will challenge the gold buyers afterward.
Meanwhile, a downside break of the 5-DMA level of €1,597 will drag the quote to the stated channel’s support, close to €1,586.
However, 50-DMA near €1,583 and a three-month-old support line surrounding €1,579 can challenge the gold sellers afterward.
Should the bullion prices drop past €1,579, odds of witnessing a slump towards the monthly low near €1,555 can’t be ruled out.
XAU/EUR: Daily chart
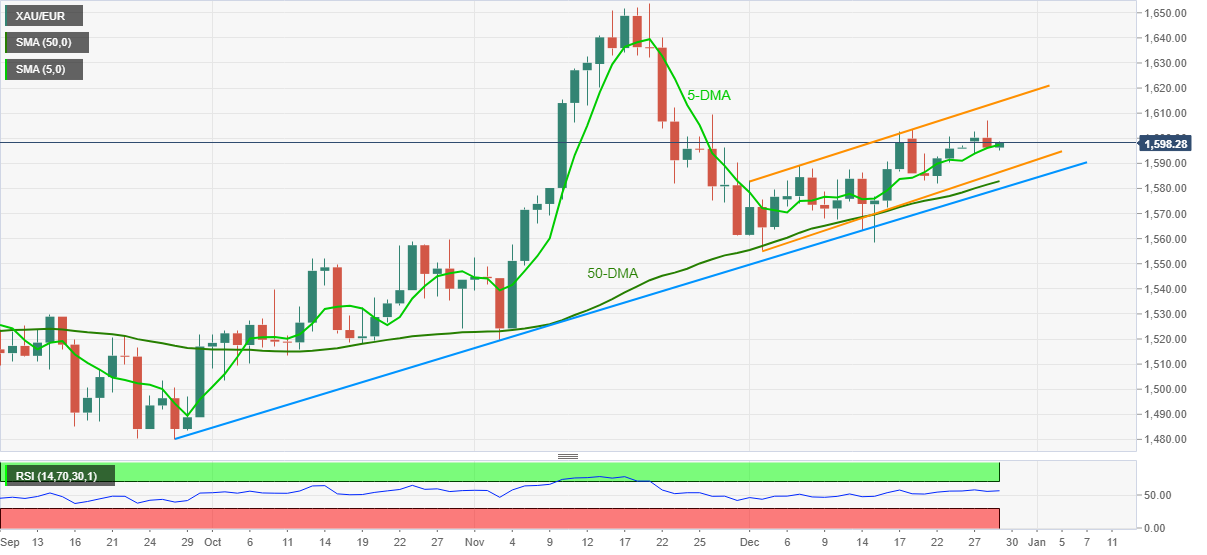
Trend: Bullish
"If the lira's depreciation versus gold exceeds bank interest rates, the central bank will make up for losses incurred by holders of lira deposits," Hurriyat reports, citing quotes from the Turkish official gazette.
Key takeaways
Turkey will promote the conversion of gold savings into liras.
This is a one-time assistance program for depositors who converted their gold savings accounts.
Turkish bill would bring 'order' to the bitcoin market.
The Turkish central bank said that it will support the conversion of gold deposits to lira.
Market reaction
USD/TRY popped and dropped on the above announcement, reaching as high as 12.54 before reversing sharply to 12.05, where it now wavers. The spot is still adding 2.40% on the day.
- AUD/USD stalls rebound amid growing Omicron concerns in Australia.
- DXY traders remain in a wait-and-see mode amid light trading.
- Focus shifts to US economic data for fresh trading impetus.
AUD/USD is defending minor bids above 0.7200, having staged a modest comeback from the Asian session lows of 0.7213.
The bulls are losing steam amid a cautious tone prevalent in the market, courtesy of the looming risks from the Omicron covid variant contagion.
Omicron covid cases exploded and the hospitalization rate rose across Australia on Wednesday, prompting Prime Minister Scott Morrison to schedule an emergency national cabinet meeting ahead of schedule on Thursday.
Earlier on, the aussie’s rebound was triggered by encouraging news on the Sino-Australian trade front. China’s Commerce Ministry announced that Beijing is raising the import quota on Australian wool in 2022 to 40,203 tonnes. The latest statement from China suggests easing of the trade tensions between the two close trading partners.
Amid thin year-end liquidity conditions, the US dollar and the Treasury yields remain on the defensive aiding the recovery in the aussie pair. The dollar bulls shrug off the rising inflation expectations and bets of March Fed rate hike, as year-end flows remain in play.
Next of relevance for the pair remains the US Trade data and Pending Home Sales for fresh trading impetus. Omicron updates worldwide will be also closely followed.
AUD/USD: Additional levels to consider
- GBP/JPY stays firmer around intraday/monthly high despite posting bearish candlestick the previous day.
- Upbeat MACD conditions, successful trading beyond the key DMA favor buyers.
- Late November’s swing high holds the key to further upside.
GBP/JPY seesaws around 154.30, up 0.05% intraday, ahead of Wednesday’s London open.
The cross-currency pair refreshed the highest level in a month before reversing from 154.58. In doing so, the quote prints a bearish spinning top candlestick that challenges the short-term upside of the pair.
However, bullish MACD signals and the sustained trading above 200-DMA, as well as the 50-DMA, keep the pair buyers hopeful.
That said, a clear upside break of the November 17 peak near 154.75 becomes necessary to direct the GBP/JPY prices towards 23.6% Fibonacci retracement (Fibo.) level of September-October upside, near 156.00.
Following that, the 157.00 threshold may offer an intermediate halt during the run-up to the yearly peak of 158.22.
Alternatively, the 50% Fibo. level of 153.57 will restrict the quote’s pullback moves before directing them to the 50-DMA level of 153.00.
In a case where the GBP/JPY remains below 153.00, the 200-DMA and 610.8% Fibonacci retracement, respectively around 152.60 and 152.50, will be in focus.
GBP/JPY: Daily chart
Trend: Further upside expected
- USD/CAD picks up bids towards intraday high, up for the second consecutive day.
- Market sentiment stays divided over Omicron cases and their implications but USD stays firmer.
- Yields drops, oil seesaws near the monthly top as Fed rate-hike concerns grow.
- Second-tier US data, risk catalysts eyed for fresh impulse.
USD/CAD rises 0.08% intraday, marking the biggest intraday gains among the G10 currency pair heading into Wednesday’s European session. That said, the Loonie pair prints 1.2822 as a quote by the press time.
The pair prices recovered from a one-week low the previous day as the US dollar benefited from the risk-off mood and increasing hopes of the Federal Reserve’s (Fed) early rate hike. Adding to the bullish bias is the sluggish prices of Canada’s biggest export item, WTI crude oil.
On Tuesday, the US Dollar Index (DXY) rose the most in a week after mixed data at home joined strong inflation expectations. That said, the US inflation expectations data, as per 10-Year Breakeven Inflation Rate numbers from the Federal Reserve Bank of St. Louis (FRED), stayed near the three-week high of 2.50% at the latest.
It’s worth noting that the firmer prints of nearby Treasury bond coupons also propelled USD/CAD prices of late. The US 10-year Treasury yields remain pressured around 1.475% while the two-year benchmark, which jumped to the highest since March 2020, also flirts with a 0.742% level, down 0.8 basis points (bps). On the contrary, seesaw around -0.232% level, near to the five-week high flashed the previous day.
WTI crude oil prices struggle around $75.90, up 0.10%, after stepping back from the monthly high of $76.75. The second day of over one million covid infections globally and record-high COVID-19 daily cases from France and the UK dim energy demand outlook.
“Quebec, the second most populous Canadian province, has ‘no choice’ but to allow some essential workers to continue working even after testing positive for COVID-19 to prevent staff shortages from impeding its healthcare services, Health Minister Christian Dube said Tuesday,” per Reuters.
Talking about data, the US reported mixed data the previous day with the US Housing Price Index eased below 1.2% forecast to 1.1% in October while S&P/Case-Shiller Home Price Indices stepped back from 19.5% prior to 18.4%, versus 18.5% market consensus. However, the Richmond Fed Manufacturing Index for December crossed the upwardly revised 12.00 figure with 16.00%.
Moving on, a light calendar and cautious sentiment can keep USD/CAD firmer while the US Pending Home Sales and Goods Trade Balance for November will decorate the calendar.
Technical analysis
USD/CAD remains chopped between the weekly resistance line and 50-HMA, respectively around 1.2830 and 1.2805, with firmer RSI conditions favoring the bulls.
Analysts at UBS project a negative outlook for gold in 2022, in the face of the Fed’s aggressive monetary policy normalization and softening inflation.
Key quotes
“Expect the Federal Reserve to withdraw monetary accommodation faster than some other major central banks in 2022 and this divergence in policy could prompt the US dollar to strengthen further.”
“Hold a negative view on gold against a backdrop of rising rates and a belief that inflation will fall.”
Related reads
- Are commodities fading the global economic recovery?
- Gold Price Forecast: XAU/USD down but not out while above the $1,800 mark
- USD/CHF keeps bounce off monthly low after positing bullish candlestick on 4H.
- Fortnight-old descending trend line, 200-SMA act as additional resistances.
- Weekly support line, bullish Doji challenge sellers amid mixed markets.
USD/CHF picks up bids to 0.9175, extending the previous day’s bounce off monthly low during early Wednesday morning in Europe.
The Swiss currency (CHF) pair recently flashed bullish Doji candlestick on the four-hour chart, which joins upbeat MACD conditions to keep buyers hopeful.
However, a one-week-old downward sloping resistance line near 0.9185 challenges the corrective pullback.
Adding to the upside filters is a descending trend line from December 15, near 0.9215, as well as the 200-SMA level of 0.9240.
Meanwhile, pullback moves remain less important until staying beyond the intraday low of 0.9169, a break of which will direct the USD/CHF prices towards refreshing the monthly bottom.
In doing so, a one-week-old descending support line near 0.9154 should gain the pair seller’s attention.
USD/CHF: Four-hour chart
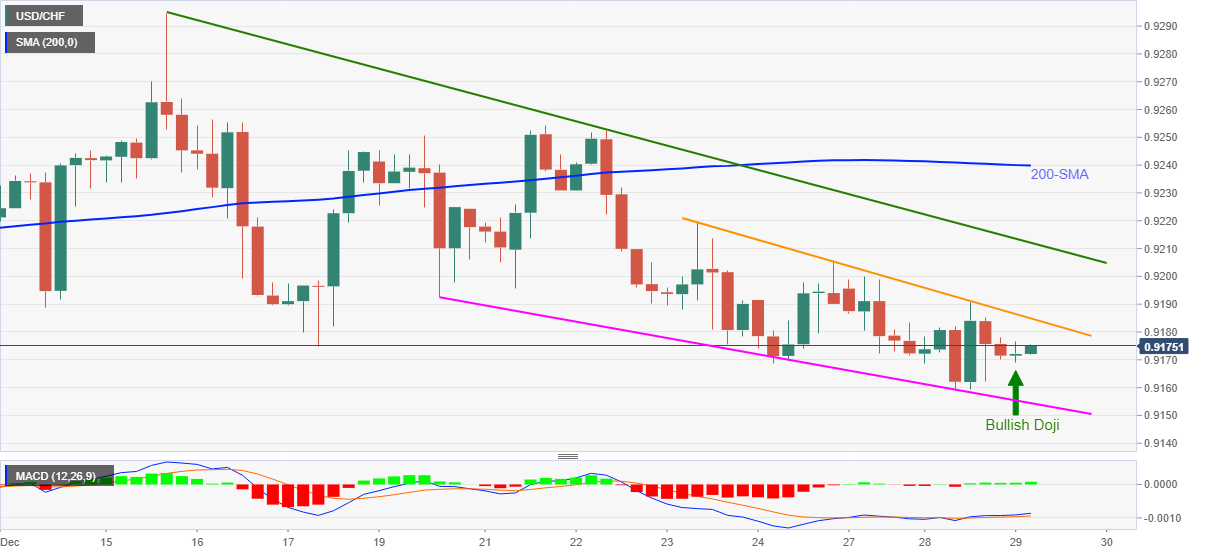
Trend: Further recovery expected
- Asia-Pacific equities traded mixed even as Australia marks positive start of trading week.
- Doubts over China’s economic outlook, a jump in covid cases and Fed rate hike expectations favor bears.
- Stimulus hopes, studies showing fewer odds of Omicron-linked hospitalization keep buyers hopeful amid sluggish markets.
Asian traders continue suffering from indecision although the Aussie equity benchmark rises over 1.0% after a long weekend. Sluggish markets could be linked to the holiday season and mixed messages concerning the South African COVID-19 variant dubbed as Omicron.
While portraying the mood, the MSCI’s index of Asia-Pacific shares ex-Japan drops 0.60% whereas Japan’s Nikkei 225 prints 0.70% intraday losses by the press time of the late Asian session on Wednesday.
It’s worth noting that a record jump in covid infections couldn’t disappoint Australian investors amid the government’s 90% vaccinations and push for boosters. Shares in New Zealand followed the biggest trading partner as NZX 50 rises 0.65% at the latest.
Bloomberg’s aggregate index of eight early indicators hints that China’s economy expanded at a moderate pace in December. Further, a second consecutive day when the global covid cases top one million weighs on the risk appetite.
It’s worth noting that a lack of liquidity during the year-end holiday mood, a light calendar and hopes of fewer hospitalizations due to Omicron keep the markets hopeful. The same could be witnessed in mild gains of Indian shares even as China, Indonesia and South Korea prints losses by the press time.
On a broader front, the US 10-year Treasury yields remain pressured around 1.475% while the two-year benchmark, which jumped to the highest since March 2020, also flirts with a 0.742% level, down 0.8 basis points (bps). Further, the stock futures reversed the early Asian gains heading into the European session.
Given the recent jump in the US inflation expectations, the Fed is expected to announce the much-awaited rate hike earlier in 2022, which in turn offers an additional challenge to the market sentiment. The US inflation expectations data, as per 10-Year Breakeven Inflation Rate numbers from the Federal Reserve Bank of St. Louis (FRED), stayed near the three-week high of 2.50% at the latest.
Looking forward, the current risk-off mood may prevail a bit longer while the US Pending Home Sales and Goods Trade Balance for November will decorate the calendar.
Russian Deputy Prime Minister Alexander Novak said on Wednesday, OPEC and its allies (OPEC+) remain focussed on their policies to stabilize oil markets in the mid-term while resisting calls from Washington to boost output.
Key quotes
“We believe that it would be right for the market to show in the mid-term how we will increase production as demand grows.”
“The producing companies should understand beforehand which investments they have to plan in order to ensure a production increase.”
“The possible release of the strategic stockpiles by the United States and other large consumers will have a limited short-term impact on the oil market.”
“Global oil demand was seen rising by around 4 million barrels per day (bpd) next year after an increase of up to 5 million bpd this year.”
“An oil price of between $65 and $80 per barrel should be comfortable next year. “
Market reaction
WTI was last seen trading at $75.78, almost unchanged on the day.
- GBP/USD clinging onto 50-DMA hurdle amid renewed Brexit tensions.
- Subdued Treasury yields and the US dollar help keep GBP bulls hopeful.
- Omicron concerns also threaten the upside attempts in cable.
GBP/USD remains on the defensive after peaking at five-week highs of 1.3461 on Tuesday, as the pound bears the brunt of the renewed Brexit concerns and a record rise in covid cases in the UK.
According to Politico, European Commission Vice President warned of a Brexit deal ‘collapse’ if the UK exits Northern Ireland (NI) Protocol. Meanwhile, the UK recorded a fresh all-time high in daily covid cases to the tune of above 122,000. The authorities have dismissed new activity restrictions during the year-end holiday season.
There is nothing much on the macro front and, therefore, markets will continue to follow the dollar dynamics, Brexit and Omicron updates.
Looking at GBP/USD’s daily chart, the pair is struggling to find a foothold above the 50-Daily Moving Average (DMA) at 1.3429.
Only a daily closing above the latter will revive the bullish momentum, calling for a test of the 1.3500 level.
The next upside target is pegged at the horizontal trendline resistance at 1.3516.
The 14-day Relative Strength Index (RSI) is trading listlessly but holds well above the midline, suggesting that the bulls could likely fight back control in the near term.
GBP/USD: Daily chart
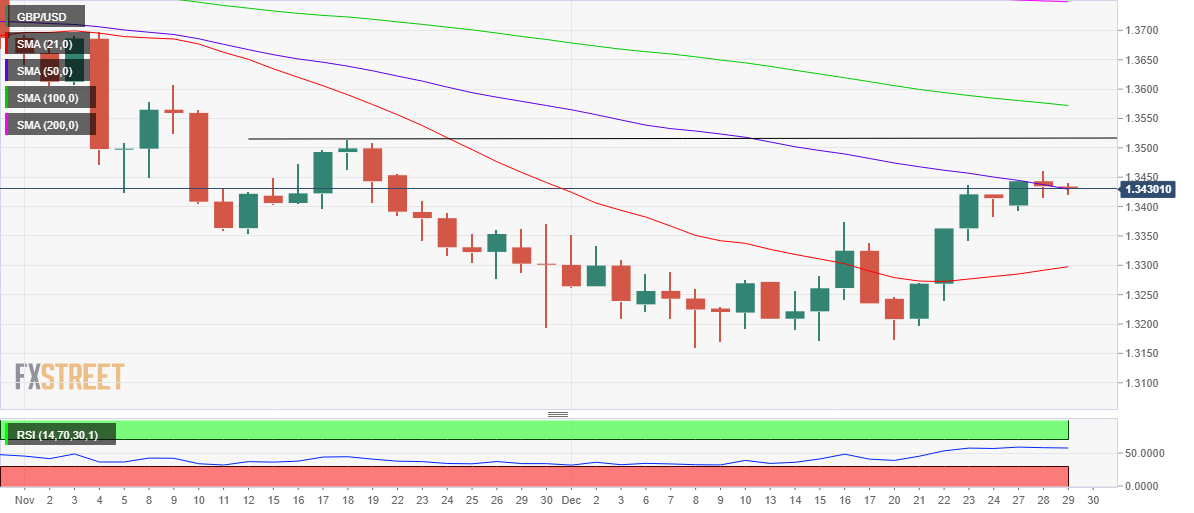
Alternatively, Monday’s low of 1.3392 will protect the immediate downside, below which the December 23 lows of 1.3342 can be tested.
If the bearish pressure intensifies, then a sell-off towards the 21-DMA at 1.3297 will be inevitable.
GBP/USD: Additional technical levels
- Platinum prints heaviest intraday losses in two weeks following the pullback from monthly high.
- Bearish chart pattern joins downbeat RSI, failures to cross 200-SMA to favor sellers.
- Bulls need to cross 50% Fibonacci retracement for confirmation.
Platinum (XPT/USD) remains pressured around $969.00, down 0.85% intraday the late Asian session on Wednesday.
The bullion prices refreshed monthly top while crossing the 200-SMA the previous day, before taking a U-turn from $992.00.
The pullback moves dragged the quote back below the 200-SMA while keeping it inside a two-week-old ascending trend channel formation, forming part of the bearish flag pattern.
That said, the downbeat RSI line, not oversold and failures to cross the key SMA add to the bearish bias for the XPT/USD.
Even so, the platinum sellers will wait for a clear downside break of the stated channel’s support line near $960.00, to convince the bears to challenge the monthly low of $898.00, a break of which will set the ball rolling for theoretical target near $750.00.
On the flip side, the recovery moves remain elusive until staying successful beyond the 200-SMA level of $973.00, albeit the stated channel’s resistance line near $998.00 will act as an additional upside filter.
It’s worth noting that the XPT/USD advances past $998.00 will be challenged by the $1,000 threshold.
Platinum: Four-hour chart
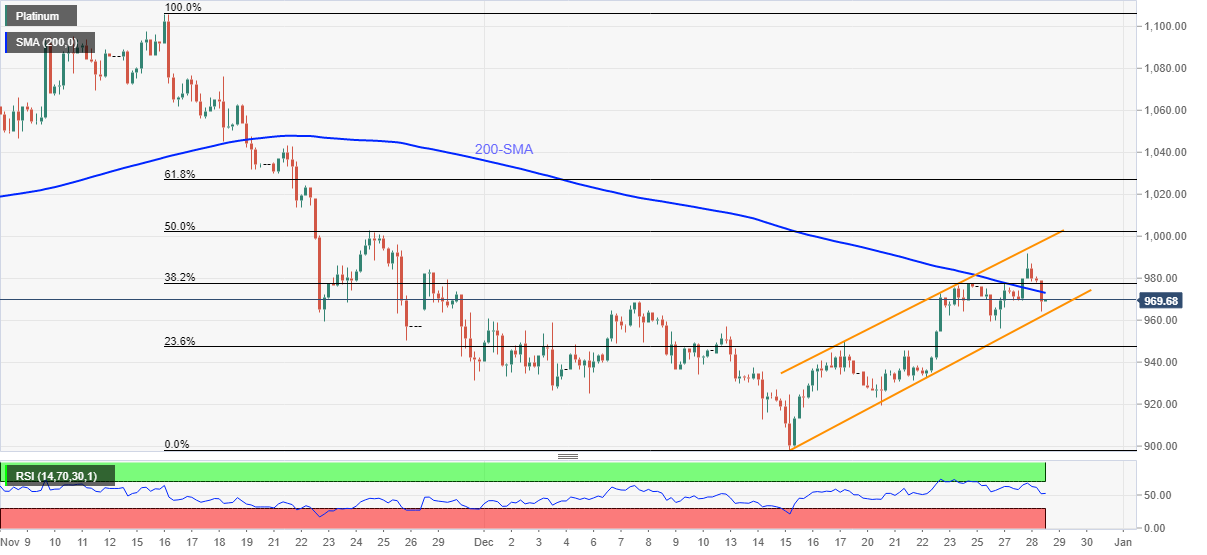
Trend: Further weakness expected
- EUR/USD edges lower around weekly bottom, prints two-day downtrend.
- US Treasury yields drop, German Bund yields stay firmer amid covid, Fed chatters.
- France reports the world’s biggest daily jump in covid infections, US reports 55% jump in seven-day average cases.
- US Pending Home Sales and Goods Trade Balance for November will join risk catalysts to direct intraday moves.
EUR/USD remains on the back foot around 1.1300 during the early Wednesday morning in Europe.
The currency major drops for the second consecutive day but struggles for clues amid thin end-of-year liquidity conditions. Adding to the trading filters is a light calendar and a contrasting play between the US Treasury yields and the German Bund coupon.
The US 10-year Treasury yields remain pressured around 1.475% while the two-year benchmark, which jumped to the highest since March 2020, also flirts with a 0.742% level, down 0.8 basis points (bps). On the contrary, seesaw around -0.232% level, near to the five-week high flashed the previous day.
The contrasting moves of the US and EU bond traders could be linked to the ECB v/s Fed battle. Given the recent jump in the US inflation expectations, the Fed is expected to announce the much-awaited rate hike earlier in 2022 versus the ECB’s likely delay in the monetary policy tightening. That said, the US inflation expectations data, as per 10-Year Breakeven Inflation Rate numbers from the Federal Reserve Bank of St. Louis (FRED), stayed near the three-week high of 2.50% at the latest.
France reported the world’s biggest-ever daily jump in COVID-19 infections with 179,807 new confirmed cases while covid figures from New Zealand and China have been easing of late. The UK also marked a fresh all-time high of the daily virus cases with above 122,000 figures while Reuters said, “The average number of new COVID-19 cases in the United States has risen 55% to over 205,000 per day over the last seven days.” Additionally, Australia’s most populous state New South Wales (NSW) reports doubling of the covid infections for Tuesday, with 11,201 new infections and three virus-led deaths.
It’s worth noting that the mixed US data and the year-end holiday mood also challenge the EUR/USD traders. On Tuesday, the US Housing Price Index eased below 1.2% forecast to 1.1% in October while S&P/Case-Shiller Home Price Indices stepped back from 19.5% prior to 18.4%, versus 18.5% market consensus. However, the Richmond Fed Manufacturing Index for December crossed the upwardly revised 12.00 figure with 16.00%.
Looking forward, the current risk-off mood, as portrayed by downbeat yields and stock futures, is likely to keep exerting downside pressure on the EUR/USD prices. However, a lack of liquidity and hopes of fewer hospitalizations due to Omicron, the South African COVID-19 variant, may restrict the short-term downside of the pair.
Technical analysis
EUR/USD keeps the previous day’s downside break of a one-week-old support line amid sluggish Momentum. That said, 200-SMA and 100-SMA restrict the pair’s short-term downside around 1.1300 and 1.1295 respectively. During the quote’s weakness past 1.1295, the 61.8% Fibonacci retracement of late November’s upside, around 1.1260, can offer an intermediate halt before directing EUR/USD sellers towards the monthly horizontal support zone near 1.1230.
On the contrary, an upside break of the previous support line near 1.1330 needs validation from the monthly descending trend line close to 1.1345 before recalling the bulls.
- USD/INR bounces off four-month-old support line, monthly low to snap two-day downtrend.
- Bearish MACD, 50-DMA challenge recovery moves, 100-DMA adds to the downside filters.
USD/INR pare recent losses around 74.77, up 0.07% intraday during the late Asian session on Wednesday.
The Indian rupee (INR) pair dropped to the lowest levels since November 26 the previous day before bouncing off 74.58. The corrective pullback took place near an ascending trend line from early September, as well as the 100-DMA.
However, the 50-DMA level of 74.96 guards the quote’s immediate upside amid bearish MACD signals.
Even if the USD/INR buyers cross the 74.96 hurdle, the 75.00 threshold and a two-week-old descending trend line close to 75.25, will test the further upside before convincing the bulls.
Alternatively, the 100-DMA adds strength to the 74.58-53 support zone, a break of which will quickly recall the 74.00 round figure to the chart.
However, the USD/INR pair’s further weakness will make it vulnerable to test November’s low of 73.85.
USD/INR: Daily chart
Trend: Bearish bias remains intact
China raises import quota on Australian wool in 2022 to 40,203 tonnes, the country’s Commerce Ministry said in a statement on Wednesday.
The Commerce Ministry also announced that China set import quota on New Zealand wool in 2022 as same as 2021.
Market reaction
AUD/USD is attempting a bounce from daily lows of 0.7213 on these headlines, as they suggest easing of the trade tensions between China and Australia.
The spot was last seen trading at 0.7224, down 0.07% on the day.
Read: AUD/USD Price Forecast 2022: The China threat could temper Aussie’s turnaround
- WTI crude oil prices keep pullback from monthly top.
- Bullish chart formation, sustained break of 200-SMA favor energy buyers.
- A seven-week-old previous resistance line restricts short-term downside.
WTI crude oil prices remain pressured around an intraday low of $75.78 during the mid-Asian session of Wednesday. In doing so, the black gold keeps the previous day’s failures to refresh the five-week high but stays inside an ascending trend channel bullish chart pattern.
Given the firmer MACD and the quote’s successful trading above 200-SMA, not to forget the previous resistance line from November 09, WTI bulls remain hopeful to regain the $76.00 threshold.
Following that, the stated channel’s upper line near $78.30 and late November’s swing high around $79.00 will challenge the commodity prices.
Alternatively, 61.8% Fibonacci retracement (Fibo.) level of November-December downside, near $75.60, restricts immediate declines of the black gold before the support line of the aforementioned channel near $74.90.
In a case where the quote drops below $74.90, 200-SMA and 50% Fibo. level can stop the WTI bears around $73.10, if not then a south-run targeting the resistance-turned-support line near $69.00 can’t be ruled out.
WTI: Four-hour chart

Trend: Further upside expected
- DXY extends the previous day’s recovery moves, seesaws around daily high of late.
- Coronavirus numbers test previously optimistic studies showing less risk from Omicron.
- Fed rate-hike calls add to the bullish bias amid year-end thin liquidity.
- Second-tier US data, risk catalysts to offer intermediate moves.
US Dollar Index (DXY) remains firmer for the second consecutive day, up 0.05% around 96.20 by the press time of early Wednesday morning in Europe.
In doing so, the greenback gauge benefits from the market’s rush for risk-safety amid fears emanating from the US Federal Reserve’s (Fed) next move, as well as from the South African covid variant, namely Omicron.
Although daily covid figures from New Zealand and China have been easing at the latest, France reported the world’s biggest-ever daily jump in COVID-19 infections with 179,807 new confirmed cases. The UK also marked a fresh all-time high of the daily virus cases with above 122,000 figures while Reuters said, “The average number of new COVID-19 cases in the United States has risen 55% to over 205,000 per day over the last seven days.” Additionally, Australia’s most populous state New South Wales (NSW) reports doubling of the covid infections for Tuesday, with 11,201 new infections and three virus-led deaths.
On the other hand, markets' hope of the Fed’s early rate hike got a boost by the firmer US inflation expectations data, as per 10-Year Breakeven Inflation Rate numbers from the Federal Reserve Bank of St. Louis (FRED). The inflation gauge stayed near the three-week high of 2.50% at the latest.
Even so, mixed US data tested the DXY bulls, despite renewing the upside momentum the previous day. That said, the US Housing Price Index eased below 1.2% forecast to 1.1% in October while S&P/Case-Shiller Home Price Indices stepped back from 19.5% prior to 18.4%, versus 18.5% market consensus. However, the Richmond Fed Manufacturing Index for December crossed the upwardly revised 12.00 figure with 16.00%.
Against this backdrop, the US 10-year Treasury yields remain pressured around 1.475% while the two-year benchmark, which jumped to the highest since March 2020, also flirts with a 0.742% level, down 0.8 basis points (bps). Further, S&P 500 Futures reverses early Asian gains whereas Asia-Pacific shares traded mixed by the press time.
Moving on, the US Pending Home Sales and Goods Trade Balance for November will decorate the calendar while risk catalyst may offer intermediate moves to the USD/JPY traders. Though, thin end-of-year liquidity conditions may limit the short-term momentum.
Technical analysis
A convergence of the 10-DMA and 21-DMA, around 96.25, precedes a two-week-old descending resistance line of 96.30, to restrict short-term DXY upside. However, the bears are less likely to take the risk of entries until witnessing a clear downside break of the monthly support line, close to 96.00 by the press time.
- USD/TRY price extends three-day winning streak on Wednesday.
- Turkish regulator files criminal complaints over lira’s moves.
- USD/TRY awaits acceptance above 12.00 after recapturing 50-DMA.
USD/TRY is holding onto Tuesday’s advance while trading just below the 12.00 level, as bulls contemplate the next move amid thin end-of-year liquidity conditions.
The market mood remains mixed amid surging covid cases globally, underpinning the US dollar’s haven demand. Additionally, rising inflation expectations also collaborate with the dollar’s upside, keeping the sentiment buoyed around the spot.
On the TRY-side of the equation, the lira received headwinds from a report carried by the Financial Times (FT), citing that “Turkey’s banking regulator has filed a criminal complaint against more than 20 people, including former central bank governors, journalists and an economist, over alleged attempts to manipulate the country’s exchange rate in a move that could chill criticism of the government’s unorthodox economic policies.”
Meanwhile, the latest Reuters poll revealed that “Turkey's annual inflation rate is expected to have hit 30.6% in December, breaching the 30% level for the first time since 2003 as prices rose due to record lira volatility,”
Looking at USD/TRY’s technical chart, the spot yielded a daily closing above the 50-Daily Moving Average (DMA) resistance, now at 11.70, having bounced off the critical 100-DMA support in the previous week.
The 14-day Relative Strength Index (RSI) is inching closer towards the midline, still below the midline, threatening the recovery momentum in the spot.
Failure to resist above the 50-DMA could recall sellers for a test of Monday’s low of 11.07, below which the 100-DMA at 10.18 will be back in play.
On the upside, the next relevant resistance is seen at Christmas Eve’s high of 12.19 once the 12.00 mark is taken out convincingly.
Further up, a rally towards the 21-DMA at 13.35 cannot be ruled out.
USD/TRY: Daily chart
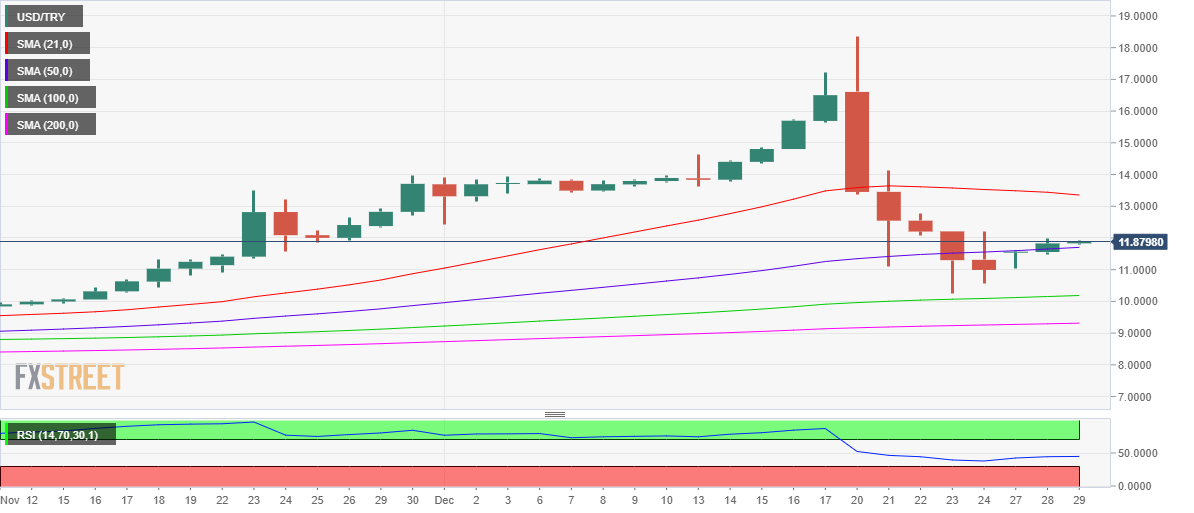
- NZD/USD remains pressured after posting the week’s biggest losses.
- New Zealand, China reports lesser-than-previous covid infections but Australia, Western countries suffer from Omicron.
- US inflation expectations, recent data favor Fed’s early rate hike in 2022, which adds to bears bias.
- US Pending Home Sales and Goods Trade Balance for November will decorate the calendar.
NZD/USD holds onto the previous day’s bearish bias, drops to 0.6800 during early Wednesday morning in Europe.
In doing so, the Kiwi pair fails to cheer the coronavirus-linked positive news at home amid broad pessimism concerning the virus. Also exerting downside pressure on the quote are the firmer expectations of the Fed’s early rate hike in 2022.
While reporting 46 new community cases of Covid-19 in New Zealand, the NZ Herald said, “Testing numbers continue to remain ‘lower than usual’ during the holiday period.” On the other hand, “China reported 197 new confirmed coronavirus cases for Dec. 28, down from 209 a day earlier, its health authority said on Wednesday,” per Reuters.
It’s worth noting that the UK reports the all-time high daily infections, above 122,000 a day after the authorities rejected any new activity restrictions during the rest of 2021. France joins the line with 179,807 new confirmed cases making it the world’s heaviest daily toll. Elsewhere, “The average number of new COVID-19 cases in the United States has risen 55% to over 205,000 per day over the last seven days,” according to a Reuters tally. Additionally, Australia’s most populous state New South Wales (NSW) reports doubling of the covid infections for Tuesday, with 11,201 new infections and three virus-led deaths.
The US inflation expectations remain near the monthly high, per 10-Year Breakeven Inflation Rate numbers from the Federal Reserve Bank of St. Louis, which in turn keeps the hope of an early rate hike from the Fed on the table and weigh on NZD/USD prices.
That said, the US reported mixed data the previous day with the US Housing Price Index eased below 1.2% forecast to 1.1% in October while S&P/Case-Shiller Home Price Indices stepped back from 19.5% prior to 18.4%, versus 18.5% market consensus. However, the Richmond Fed Manufacturing Index for December crossed the upwardly revised 12.00 figure with 16.00%.
Amid these plays, the US 10-year Treasury yields remain pressured around 1.475% while the two-year benchmark, which jumped to the highest since March 2020, also flirts with a 0.746% level. Further, S&P 500 Futures print mild gains whereas Asia-Pacific shared traded mixed at the latest.
Looking forward, the second-tier US data may entertain NZD/USD traders but risk catalysts are the key. Above all, the thin end-of-year liquidity conditions may restrict the pair’s momentum.
Technical analysis
Bull cross, firmer RSI and a successful U-turn from 23.6% Fibonacci retracement (Fibo.) of November-December declines favor NZD/USD buyers to aim for the confluence of the 200-SMA and an ascending trend line from December 09, around 0.6850.
On the flip side, the convergence of the 100-SMA and 50-SMA surrounding 0.6780-75 restricts the short-term downside of the NZD/USD prices even if the quote drops below the immediate Fibonacci support of 0.6790.
| Time | Country | Event | Period | Previous value | Forecast |
|---|---|---|---|---|---|
| 09:00 (GMT) | Eurozone | Private Loans, Y/Y | November | 4.1% | |
| 09:00 (GMT) | Switzerland | Credit Suisse ZEW Survey (Expectations) | December | -10.8 | |
| 09:00 (GMT) | Eurozone | M3 money supply, adjusted y/y | November | 7.7% | 7.6% |
| 13:30 (GMT) | U.S. | Goods Trade Balance, $ bln. | November | -83.20 | |
| 15:00 (GMT) | U.S. | Pending Home Sales (MoM) | November | 7.5% | 0.6% |
| 15:30 (GMT) | U.S. | Crude Oil Inventories | December | -4.715 | -3.143 |
The People’s Bank of China (PBOC) set the USD/CNY reference rate at 6.3735 on Wednesday while comparing to the previous fix and the previous close at 6.3728 and 6.3687 respectively. It's worth noting that market expectations backed 6.3720 as a quote before today's fix published.
- AUD/USD picks up bids to refresh intraday high, aims to reverse previous day’s pullback from monthly top.
- Bullish MACD, sustained bounce off 38.2% Fibonacci retracement level keep short-term buyers hopeful.
- Key SMAs challenge further upside, three-week-old support line lures bears.
AUD/USD consolidates losses from a five-week top while refreshing intraday high around 0.7235 during early Wednesday morning in Asia.
In doing so, the Aussie pair keeps the bounce off 38.2% Fibonacci retracement (Fibo.) of October-December declines amid bullish MACD.
However, 50-DMA and 100-DMA, respectively near 0.7270 and 0.7290, challenge short-term advances of the pair ahead of flashing the 0.7300 threshold on the chart.
In a case where AUD/USD bulls keep reins past 0.7300, the previous support line from August, close to 0.7325, will be in focus.
Alternatively, a downside break of 0.7200 will have multiple supports around 0.7190 before directing the AUD/USD sellers towards September’s low of 0.7170.
Overall, AUD/USD bulls are in for a bumpy ride to the road during the final days of 2021.
AUD/USD; Daily chart
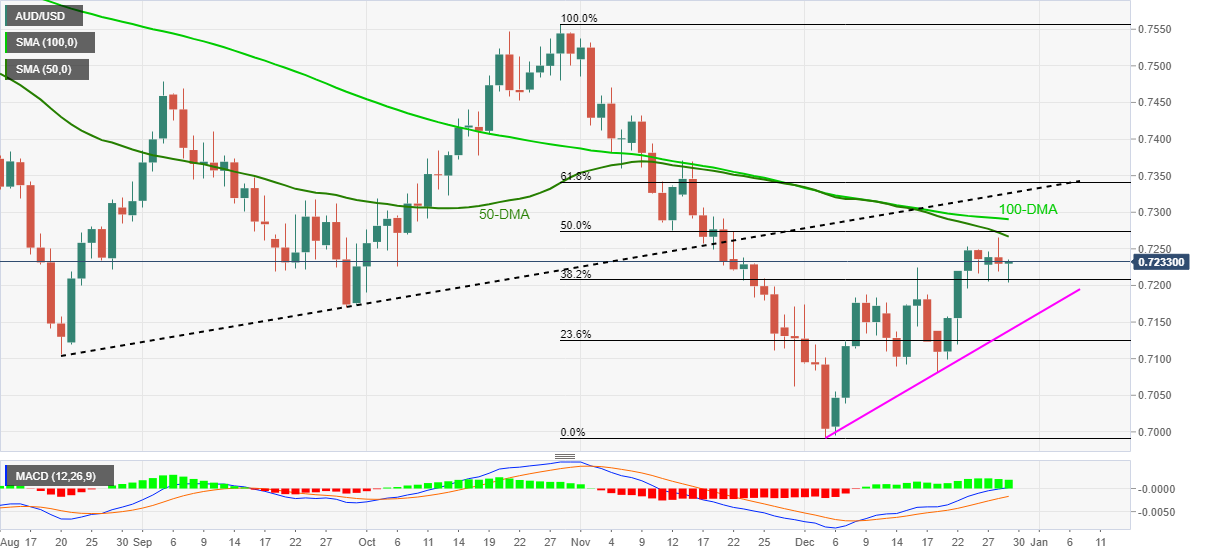
Trend: Limited upside potential
“Turkey's annual inflation rate is expected to have hit 30.6% in December, breaching the 30% level for the first time since 2003 as prices rose due to record lira volatility,” per the latest Reuters poll.
The survey details add, “The 30.6% median forecast of 13 economists would be the highest since May 2003 - with forecasts ranging from 26.4% to 37.3%.”
“The month-on-month rise in prices was seen at 9%, according to the median, with forecasts ranging from 5.5% to 14.6%,” also said Reuters poll.
Additional quotes
The recent lira slide was reversed late on Monday last week when Erdogan announced a scheme to protect lira deposits against currency volatility and state-backed market interventions triggered a 50% surge in the currency's value.
Inflation has been in double digits and well above emerging market peers for most of the last four years, eating into Turks' earnings and hitting support for Erdogan.
According to the Turk-Is trade union confederation, food prices rose 25.75% month-on-month in December. That represented an annual rise of 55%, up from 27% in November, marking the largest rise in food inflation since 1987.
The central bank's year-end inflation forecast was 18.4% in a report published in late October. The government predicted end-2021 annual inflation of 16.2%.
The Turkish Statistical Institute is scheduled to announce December inflation data at 0700 GMT on Jan. 3.
USD/TRY stays firmer
USD/TRY holds onto corrective pullback from six-week low marked on December 23, up 0.70% intraday around $11.92 during early Wednesday morning in Asia.
- EUR/USD struggles to keep the bounce off the key SMAs.
- Weekly support break, downbeat Momentum line keep sellers hopeful.
- Monthly resistance line becomes crucial for bulls, 1.1230 lures short-term bears.
EUR/USD remains lackluster around 1.1312 during early Wednesday morning in Europe. In doing so, the major currency pair keeps the previous day’s downside break of a one-week-old support line amid sluggish Momentum.
However, 200-SMA and 100-SMA restrict the pair’s short-term downside around 1.1300 and 1.1295 respectively.
During the quote’s weakness past 1.1295, the 61.8% Fibonacci retracement of late November’s upside, around 1.1260, can offer an intermediate halt before directing EUR/USD sellers towards the monthly horizontal support zone near 1.1230.
On the contrary, an upside break of the previous support line near 1.1330 needs validation from the monthly descending trend line close to 1.1345 before recalling the EUR/USD bulls.
Following that, the December 2021 peak near 1.1360 and the late November’s high surrounding 1.1385 will be in focus.
Overall, EUR/USD prices are likely to keep the bearish consolidation.
EUR/USD: Four-hour chart

Trend: Further weakness expected
- USD/JPY picks up bids to consolidate previous day’s losses from monthly high.
- Markets remain dicey amid year-end inactivity, virus woes, Fed rate-hike fears weigh on sentiment.
- Lack of major data/events restrict short-term moves but risk catalysts can keep buyers hopeful.
USD/JPY pares recent losses around 114.80, near the monthly peak, as Tokyo opens for Wednesday. The yen pair jumped to the highest since November 26 the previous day before reversing the gains from 114.94.
While the risk-off mood underpinned the US Treasury yields and favored USD/JPY bulls earlier on Tuesday, the market’s indecision and a light calendar seem to have triggered the following pullback. Even so, worsening virus conditions and firmer signals of the Fed’s earlier rate-hike in 2022 keep the USD/JPY buyers hopeful.
France reports the world’s highest ever daily covid cases of 179,807 on Tuesday while the UK reports the all-time high daily infections, above 122,000. Elsewhere, “The average number of new COVID-19 cases in the United States has risen 55% to over 205,000 per day over the last seven days,” according to a Reuters tally.
It’s worth noting that Japan Prime Minister Fumio Kishida signals bringing forward the booster shot timeline the previous day to battle the South African covid variant, namely Omicron.
On the different page, the US inflation expectations remain near the monthly high, per 10-Year Breakeven Inflation Rate numbers from the Federal Reserve Bank of St. Louis, which in turn backs an early rate hike from the Fed and weigh on yields, as well as USD/JPY.
That said, optimism over the studies showing the receding odds of hospitalization due to the Omicron, increased hopes of US stimulus and brighter economic performance in 2022 keep the USD/JPY buyers positive. In this regard, Kyodo News cited economic analysis while saying, “The Japanese economy is expected to accelerate its expansion in fiscal 2022 following a sharp turnaround toward the end of 2021 as private consumption continues to recover thanks to subdued coronavirus infections.”
Amid these plays, the US 10-year Treasury yields remain pressured around 1.475% while the two-year benchmark, which jumped to the highest since March 2020, also flirts with a 0.746% level. Further, S&P 500 Futures print mild gains whereas Japan’s Nikkei 225 drops -0.20% at the latest.
Looking forward, the US Pending Home Sales and Goods Trade Balance for November will decorate the calendar while risk catalyst may offer intermediate moves to the USD/JPY traders. However, thin end-of-year liquidity conditions may limit the short-term momentum.
Technical analysis
Unless declining below 114.25, comprising the 10-DMA and the mid-month top, USD/JPY prices are likely to refresh the yearly top marked in November around 115.55. However, the 115.00 and 115.25 levels may act as intermediate stops during the rise.
| Pare | Closed | Change, % |
|---|---|---|
| AUDUSD | 0.72288 | -0.15 |
| EURJPY | 129.844 | -0.16 |
| EURUSD | 1.13087 | -0.16 |
| GBPJPY | 154.218 | -0.05 |
| GBPUSD | 1.3432 | -0.03 |
| NZDUSD | 0.68045 | -0.06 |
| USDCAD | 1.28157 | 0.3 |
| USDCHF | 0.91722 | -0.03 |
| USDJPY | 114.816 | -0.03 |


© 2000-2026. Sva prava zaštićena.
Sajt je vlasništvo kompanije Teletrade D.J. LLC 2351 LLC 2022 (Euro House, Richmond Hill Road, Kingstown, VC0100, St. Vincent and the Grenadines).
Svi podaci koji se nalaze na sajtu ne predstavljaju osnovu za donošenje investicionih odluka, već su informativnog karaktera.
The company does not serve or provide services to customers who are residents of the US, Canada, Iran, The Democratic People's Republic of Korea, Yemen and FATF blacklisted countries.
Izvršenje trgovinskih operacija sa finansijskim instrumentima upotrebom marginalne trgovine pruža velike mogućnosti i omogućava investitorima ostvarivanje visokih prihoda. Međutim, takav vid trgovine povezan je sa potencijalno visokim nivoom rizika od gubitka sredstava. Проведение торговых операций на финанcовых рынках c маржинальными финанcовыми инcтрументами открывает широкие возможноcти, и позволяет инвеcторам, готовым пойти на риcк, получать выcокую прибыль, но при этом неcет в cебе потенциально выcокий уровень риcка получения убытков. Iz tog razloga je pre započinjanja trgovine potrebno odlučiti o izboru odgovarajuće investicione strategije, uzimajući u obzir raspoložive resurse.
Upotreba informacija: U slučaju potpunog ili delimičnog preuzimanja i daljeg korišćenja materijala koji se nalazi na sajtu, potrebno je navesti link odgovarajuće stranice na sajtu kompanije TeleTrade-a kao izvora informacija. Upotreba materijala na internetu mora biti praćena hiper linkom do web stranice teletrade.org. Automatski uvoz materijala i informacija sa stranice je zabranjen.
Ako imate bilo kakvih pitanja, obratite nam se pr@teletrade.global.
транcфери