- Analiza
- Novosti i instrumenti
- Vesti sa tržišta
Forex-novosti i prognoze od 03-03-2023
- EUR/USD to finish the week above 1.0600 after hitting a weekly low of 1.0533.
- A risk-on impulse and falling UST bond yields are a headwind for the US Dollar.
- US ISM Non-Manufacturing data showed the US economy remains resilient.
EUR/USD reversed its course and is set to finish the week with gains of more than 0.80% on a softer US Dollar (USD) amidst speculations that the US Federal Reserve (Fed) would not hike rates beyond what money market futures expect. The EUR/USD exchanges hands at 1.0635 after hitting a daily low at 1.0588.
EUR/USD trimmed Wednesday’s losses as investors downplayed hawkish Fed commentary
US equities are set to finish the week with gains. The US Dollar Index (DXY), a measure of the buck’s value vs. a basket of peers, slides from a two-and-a-half-month high down to 104.526 after US data reaffirmed a solid economic status in the United States (US).
Business activity in the US improved, as shown by the US ISM Non-Manufacturing PMI for February was 55.1, a tick lower than the previous month’s 55.2, but exceeded expectations of 54.5, indicating that business activity is still strong. The prices index subcomponent, sought by investors for clues about inflation, jumped to 65.5, exceeding estimates of 64.5 but trailing Janiary’s data.
Meanwhile, Federal Reserve officials crossed newswires, with Fed Governor Michelle Bowman and Dallas Fed President Lorie Logan did not comment on monetary policy. The Boston Fed President Susan Collins commented that inflation remains too high and added that
Aside from this, the Eurozone (EU) revealed S&P Global Services and Composite PMIs came above previous readings. Meanwhile, inflationary figures announced on Thursday came below last month’s data but above estimates, a reason for the ECB to continue to hike interest rates.
Even though figures were higher than expected, investors had already priced in a 50 bps rate hike by the European Central Bank (ECB) as announced by its President Christine Lagarde in its last meeting presser. However, recent data have ECB policymakers split on what signal the bank should send to the markets.
EUR/USD Technical levels
Next week, the Bank of Canada (BoC) will have its monetary policy meeting. No change in rates is seen. Analysts at TD Securities point out that the forward guidance is not expected to change significantly from the January meeting.
BoC: Live to hold another day
"The downside surprise on Q4 GDP should allow the BoC to look past the blockbuster January jobs number and keep the overnight rate unchanged at 4.50%. The forward guidance is not expected to change too much from January, though the BoC might want to put more emphasis on the conditional nature of its pause."
"A low-energy BoC meeting would likely direct CAD's focus to the evolving global narratives. We see USDCAD holding the 1.33/1.37 range unless US inflation goes awry this month. In turn, we prefer to play CAD on crosses (recently closing NZDCAD) where scaling into AUDCAD longs appeals to the shift in global growth drivers."
The National Bank of Canada revised its year-end target for the USD/CAD pair from 1.27 to 1.32. however, they warn that the reopening of the Chinese economy, coupled with the disruption of commodity supplies due to the war in Ukraine, will help limit the depreciation of the Canadian Dollar.
Weak Canadian GDP = BoC pause
“While job creation remains strong, a lacklustre GDP report and slower than expected inflation point to a divergence in monetary policy between Canada and the US. While our new spread forecast is not good news for the Canadian dollar in the near term, we still believe that the reopening of the Chinese economy, coupled with the disruption of commodity supplies due to the war in Ukraine, will help limit the depreciation of the CAD.”
“Under our new US scenario for growth and interest rates, we see USD/CAD lingering in the 1.36-1.39 range through the first half of 2023, before making comeback in the second half of the year when the Fed finally ends its tightening campaign. Our new year-end target is 1.32 (1.27 previously).”
- US Dollar weakness further as stocks jump in Wall Street.
- Crude oil prices rise by more than 2%, Gold breaks above $1,850.
- US bonds extend recovery ahead of NFP week.
The US Dollar dropped further late on Friday with EUR/USD reaching fresh highs above 1.0630 and GBP/USD soaring above 1.2000. Risk appetite and a recovery in Treasuries weighed on the Dollar.
Dollar adds to weekly losses in the American session
The DXY broke below European session lows late on Friday and fell below 104.50 as stocks on Wall Street rose further. The Dow Jones was on its way to gain more than 1% and the Nasdaq was up by almost 2%.
In a low liquidity environment, risk appetite pushed the Dollar further lower. After a positive February, the Greenback posted the first weekly loss in a month even as US yields held near monthly highs and after upbeat US economic data.
The Pound gained momentum with GBP/USD soaring toward 1.2050. EUR/GBP trimmed weekly losses falling below 0.8830. EUR/USD rose above 1.0630 while USD/JPY fell to two-day lows below 135.80. Emerging market currencies also appreciated during Friday’s American session. USD/MXN dropped further below 18.00, to test 2018 lows.
Gold broke above $1,850 to the highest level in two weeks. Silver rose to $21.25, the strongest level since February 24. US yields pulled back further with the 10-year to 3.96%.
DXY Technical levels
On Friday, the US February ISM Service PMI was released. Analysts at Wells Fargo point out the report showed that activity is not slowing much and that is keeping pressure on prices and on margins. They argue that it is happening alongside an upswing in hiring, giving the Federal Reserve the green light for further rate increases.
Stop underestimating the Service sector
“The resilience of the service sector was on full display for a second straight month in February. The ISM services index had previously dipped into contraction territory at the end of last year amid a two-month slowing in real consumer spending. A jump to 55.2 in January took most forecasters by surprise and set the stage for a run of better-than-expected January economic data on jobs, spending and production.”
“The continued hiring in services and more neutral stance of maintaining employees in manufacturing suggests employers added jobs at a decent clip in February. When nonfarm employment data are released next Friday, we expect to see employers added 270K net new jobs during the month.”
“The resilience of service sector activity may turn up the pressure on policymakers at the Federal Reserve to do more to combat inflation. The prices paid component cooled, but only slightly, and a reading of 65.6 is consistent with prices continuing to rise. Services inflation will be slower to abate, but still-high price pressure combined with continued tightness in the labor market means the Fed's job of getting inflation on a sustained path back to 2% inflation is not yet done.”
Analysts at MUFG Bank consider the Brazilian Real has room to climb versus the US dollar in the short term. They have a trade idea of shorting USD/BRL at 5.22 with a target at 4.90.
Real not fully pricing improvement in Brazil’s Terms of Trade
“Unlike other EM currencies, the BRL has not benefitted as much so far from China reopening optimism since it emerged towards the end of last year.”
“The further improvement in Brazil’s terms of trade at the start of this year has not fully fed through to a stronger BRL. It reflects in part heightened concerns at the start of this year over domestic policymaking under new President Lula relating to both fiscal and monetary policy. We are assuming that these concerns will not escalate significantly in the near-term, and allow the BRL to be driven more by renewed China reopening optimism.”
“Long BRL positions continue to benefit from the favourable carry pick-up. The BCB is expected to keep rates elevated in the near-term at 13.75% despite government pressure to lower rates.”
“Volatility in the FX market remains at lower levels as well at the start of this year providing support for carry trades. The main risks to the trade include: i) a sharp increase in the domestic policy risk premium priced into the BRL, and ii) rising US yields eventually trigger a bout of higher volatility in FX & financial markets.”
What you need to take care of on Monday, March 6:
The Greenback lost ground on Friday and finished the week lower. Positive data from China and a retreat in US yields kept the DXY in negative territory. US Stocks posted weekly gains after sharp losses in February. The improvement in market sentiment contributed to weakening the Dollar, which posted the first weekly loss in a month after a positive February.
It could be a quiet start of a btoy week that will bring new information, interest rate decisions and fresh guidance from central banks. The Reserve Bank of Australia will have its meeting on Tuesday (25 bps rate hike expected) and the Bank of Canada on Wednesday; Fed Chair Powell will testify to Congress (Tue/Wed) on the Semiannual Monetary Policy Report. China will report trade (Tuesday) and inflation (Thursday).
The key day will be Friday with the Non-farm payrolls report; Canada will also release employment data. During the weekend, China’s annual “Two Session” (parliamentary meeting) kicks off. The Chinese government is set to formalize government titles and announce its GDP target.
EUR/USD posted a modest weekly gain, enough to become the best performance since early January. The rebound occurred from the 20-week Simple Moving Average and was capped below 1.0700. Eurozone inflation data triggered a decline in European bonds. Rising EZ yields helped the Euro.
The benefit from the agreement between the United Kingdom and the European Union was short-lived for the Pound. GBP/USD continues to move sideways, supported by 1.1900, unable to retake 1.2000. EUR/GBP rebounded back to the 0.8850 area.
The Japanese Yen finished the week mixed despite higher yields. USD/JPY is facing a strong resistance around 137.00. EUR/JPY posted the highest weekly close since November, but it was far from the highs below 145.00.
Among majors, the New Zealand Dollar was the best performer. Back in February, the Reserve Bank of New Zealand raised the OCR by 50 basis points to 4.75%, signalsignallinghikes ahead. NZD/USD rose after four weekly slides, still unable to rise above the 20-day SMA at 0.6260.
Considering the most traded currencies acrossgloballyChilean Peso (CLP) and the Mexican Peso (MXN) were the biggesweek's biggest gainersMXN dropped below 18.00 for the first time since 2018.
Yields remainremainnd relevant for currencies, with the US 10-year around 4% and the German 10-year at 2.70%, the highest weekly close since 2011. Bond market volatility expected to continue next week.
Gold had the best week since January, recovering from two-motwo-monthto the $1,850 area despite higher yields. Price rose constantly since Monday. Silver ended a negative six-week streak, rose from four-month lows, back above the $21.00 area. The outlook for metals has improved with the bond market still represents a critical risk in both directions.
Oil prices finished the week up by around 4%. On Friday price,s rose almost 2% after being down 3% on reports that the United Arab Emirates (UAE) is having an internal debate about leaving the Organization of the Petroleum Exporting Countries (OPEC). The latest round of US and Chinese economic activity data helped prices hold above YTD lows but not enough to boost WTI back above $80.00.
Cryptocurrencies failed to benefit from higher equity prices and a weaker Dollar. Bitcoin lost more than 4% on Friday, to the lowest level in four weeks, hit by Silvergate woes.
Like this article? Help us with some feedback by answering this survey:
- USD/JPY retreats from weekly highs amidst an offered US Dollar.
- Upbeat US economic data failed to bolster the US Dollar.
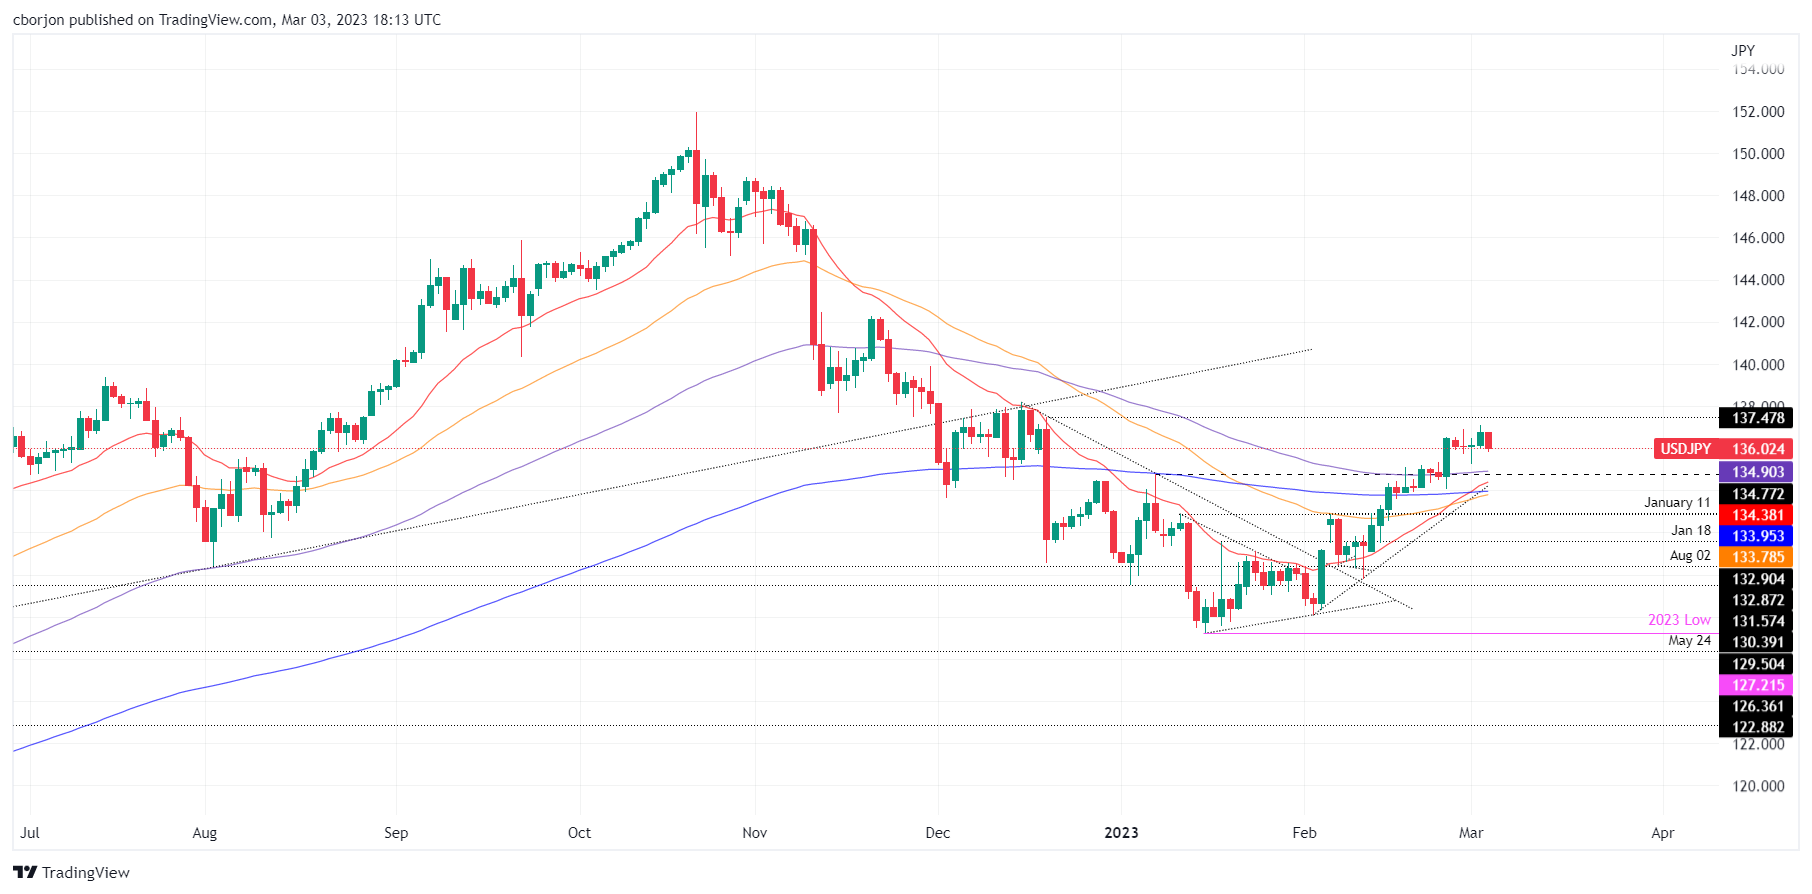
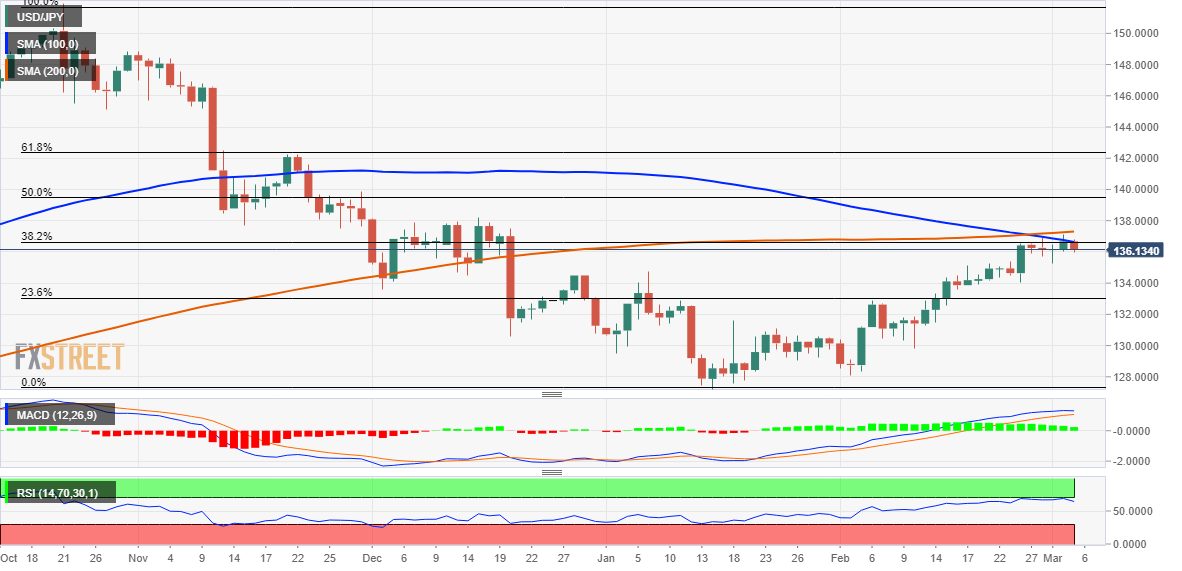
- USD/JPY Price Analysis: Bullish above 136.00; otherwise, a retest of 134.00 is on the cards
The USD/JPY slides from 136.70s toward the 136.00 area on Friday amidst broad US Dollar (USD) weakness even though data cemented the US economy resilience. At the time of writing, the USD/JPY exchanges hands at 136.02.
USD/JPY Price Action
From a daily chart perspective, the USD/JPY is neutral upward biased, despite dropping from weekly highs toward the 136.10s area. If the USD/JPY bears reclaim the 136.00 figure, that would open the door for further losses. The first support would be the March 1 low of 135.25, followed by strong support below 135.00. Firstly the 100-day EMA at 134.90, followed by the 20-day EMA at 134.39, and then the 134.00 mark.
On the other hand, a bullish continuation would continue if USD/JPY bulls hold prices above 136.00. The first resistance would be the December 20 high at 136.77, followed by the psychological 137.00 mark.
USD/JPY Daily chart
USD/JPY Technical levels
- US crude oil benchmark advanced more than 2%, sponsored by China’s data.
- The US Dollar remains offered across the board after the US ISM Services PMI.
Western Texas Intermediate (WTI) resumed its uptrend after a report by the Wall Street Journal (WSJ) spurred a fall of 3% on speculations that one of the largest oil producers worldwide threatened to leave the Organization of the Petroleum Exporting Countries (OPEC). However, those rumors were dismissed, according to Reuters. At the time of writing, WTI is trading at $79.06, up 2.50%.
During the Wall Street opening, rumors that the United Arabe Emirates (UAE) discussed leaving OPEC as the country has been seeking authorization to increase its crude output. Consequently, WTI fell 3% towards three-day lows before recovering some ground.
Oil prices have been bolstered throughout the week by a shortage of crude oil, on speculations that China’s reopening would increase demand for crude. Additionally, business activity in China gathered momentum with Caixin’s Manufacturing and Services PMI’s re-entering expansionary territory.
WTI prices shrugged off an increase in US stockpiles for the tenth straight week, as record exports of US crude made for a smaller increase than in recent weeks.
Meanwhile, US data revealed in the week showed that business activity in the manufacturing and services segment improved to expansionary territory. Although it’s positive news for growth, Federal Reserve officials would continue to tighten monetary conditions to curb inflation to its 2% target.
In the meantime, the US Dollar Index, a gauge of the buck’s value against a basket of peers, is retreating 0.16%, down at 104.752, a tailwind for the US dollar-denominated oil price.
WTI Technical levels
- AUD/USD is set to finish the week with solid gains of 0.28%.
- The US ISM Services PMI was a tick lower than the previous month’s data, signaling the US economy is solid.
- AUD/USD traders eye Federal Reserve speeches throughout the day.
The AUD/USD jumped from around weekly lows below 0.6700 and climbed 0.44% on Friday. Factors like a risk-on impulse and an offered US Dollar (USD) keep the Australian Dollar (AUD) positive in the day. At the time of typing, the AUD/USD is trading at 0.6745.
AUD/USD creeps higher toward 0.6750
Sentiment remains upbeat, a headwind for the safety of the US Dollar. The US ISM Non-Manufacturing PMI for February was 55.1, slightly lower than the previous month’s 55.2. However, it exceeded expectations of 54.5, indicating that business activity is still strong. The Prices Paid Index subcomponent, looked by investors for inflationary pressures, increased to 65.6, above estimates of 64.5. Although it was lower than January’s 67.8, data would keep traders tracking Federal Reserve’s (Fed) officials’ speakers throughout the day.
US Federal Reserve’s (Fed) speakers highlighted the importance of tackling inflation towards the 2% target. On Thursday, Fed Governor Christopher Waller commented that inflation was not easing as expected and signaled his openness to increase rates if price pressures don’t reduce.
Following the release, the greenback weakened as the US Dollar Index recovered from daily lows and reached 104.924. As of writing, it resumed its downtrend at 104.848, down 0.11%.
The AUD/USD recovered after dropping toward 0.6732 and advanced towards 0.6760 before settling at around current exchange rates.
On the Australian side, the S&P Global Services PMI exceeded estimates, while the S&P Global Composite PMI was 50.6, higher than January’s 49.2, signaling the Australian economy is doing far better than expected.
Additionally, the Caixin Services PMI improved in China at 55, compared to 50.5 consensus, expanded at the fastest rhythm in six months in February as removing harsh COVID-19 restrictions revived customer demand, driving a solid increase in employment, a private sector survey showed on Friday.
What to watch?
Federal Reserve speakers will be crossing wires led by the Dallas Fed President Lorie Logan, Atlanta’s Fed Raphael Bostic, Fed Governor Michell Bowman, and the Richmond Fed President Thomas Barkin.
AUD/USD Technical levels
Below are the key takeaways from the US Federal Reserve's semi-annual Monetary Policy Report published on Friday, per Reuters.
Key takeaways
"Financial conditions have tightened further since June and are significantly tighter than a year ago."
"Ongoing increases in the fed funds rate target are necessary."
"Strongly committed to getting inflation back to 2%."
"Business credit quality remains strong, but some indicators of future business defaults are somewhat elevated."
"Financial vulnerabilities remain moderate overall."
"Net negative income does not impede monetary policy work."
"Expecting to return to net positive income at some point."
"Market liquidity remained low in Treasury and other key markets versus pre-pandemic levels."
"Bringing inflation back to 2% likely requires period of below-trend growth, some softening of labor market conditions."
"Underlying momentum in the economy likely remains subdued."
"Valuation pressures in equity markets have increased modestly."
"For core services ex-housing sector, inflation remains elevated; prospects for it slowing may depend in part on an easing of tight labor market conditions."
"Core foreign inflation remains high and inflationary pressures are broad."
"Some signs of increased stress for lower-income households as near-prime, subprime delinquency rates have risen."
"Fed rate control toolkit effective at maintaining federal funds rate."
"Will adjust balance sheet drawdown process if there is a need to."
"Strong reverse repo takeup reflects market rates and investor caution."
"Labor market has remained extremely tight and there is a significant labor supply shortfall relative to the levels expected before the pandemic."
"Tight labor market conditions have largely erased pandemic-induced widening of employment gaps across demographic groups."
"Officials mindful of monetary policy rules, don’t use them to drive policy."
"Rate hikes have narrowed gap between policy rule settings and real-world level."
"Labor force participation rate is likely to remain well below its level from before the pandemic."
Market reaction
The US Dollar Index showed no immediate reaction to this publication and was last seen trading flat at 104.93.
- US Dollar rises marginally after US ISM Service PMI.
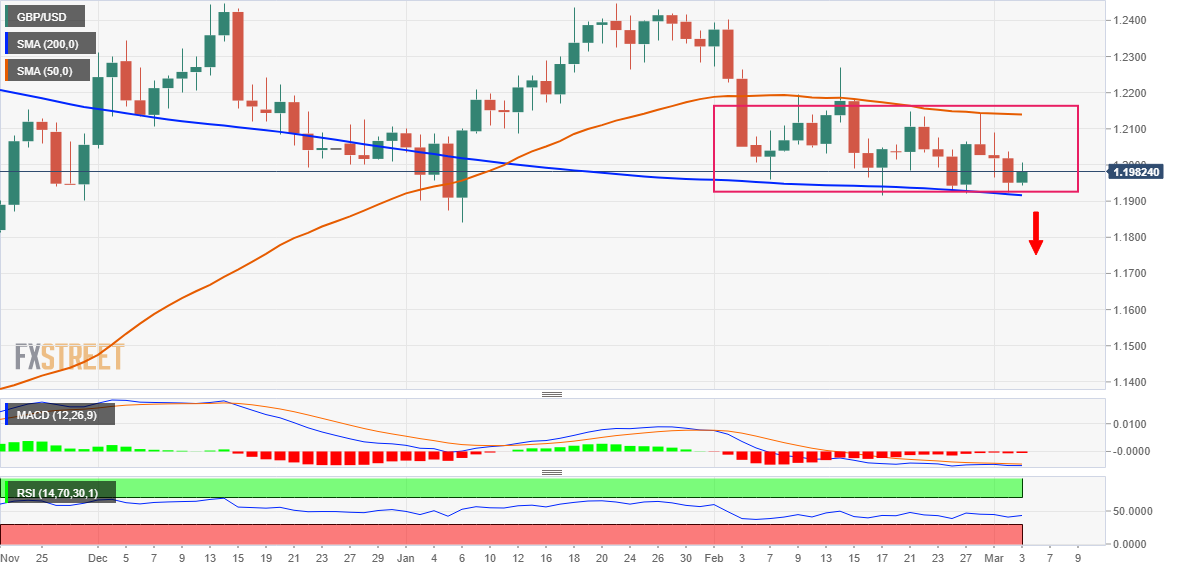
- GBP/USD drops to 1.1960 and rebounds toward 1.2000.
- Pair remains sideways around the 20-week SMA.
The GBP/USD fell to 1.1960 after the release of the US ISM Service PMI and then rebounded. The pair continues to move sideways, near 1.2000, virtually flat for the week.
US data lifts Dollar marginally
The last first-tier release of the week was the US ISM Service PMI for February which came at 55.1, below January's 55.2, and slightly above the market consensus of 54.5. The Prices Paid Index sub-component dropped from 67.8 to 65.6, still above expectations for a slide to 64.5. The Employment Index jumped to 54, versus expectations of a decline to 49.8.
The numbers gave the US Dollar some momentum, but price action remain subdued on Friday with major pairs consolidating. The greenback is moving with a positive intraday bias supported by a rebound in US yields. The US 10-year yield rose from 3.97% to 4.02%.
The GBP/USD is off highs as it keeps moving in a range above 1.1900. It is trading marginally higher for the week, hovering around the 20-week Simple Moving Average. A firm break under 1.1900 should open the doors to more losses.
While on the upside, the immediate resistance emerges at 1.2055 (20-day SMA) followed by the 1.2150 area. A firm break above should clear the way for 1.2200 and more.
Technical levels
Gold is likely to track shifting market expectations around the Fed tightening in the short term, according to strategists at ANZ Bank.
USD is likely to weaken in the second half of 2023
“The Gold market remains vulnerable to market expectations around the Fed’s monetary policy. Strong economic data from the US with sticky inflation raise the risk of more rate hikes; this is likely to be a headwind in the short term.”
“Nevertheless, we see limited upside in the USD, which is a tailwind for gold prices. Even with higher terminal rates, the USD is likely to weaken in H2 2023.”
Hawkish Banxico stance sparked MXN appreciation in February. Looking ahead, economists at MUFG Bank do not see much room for further strengthening.
Banxico will promote more moderate 25 bps hikes in upcoming meetings
“Higher rates for longer will keep the MXN attractive as a carry currency helping to explain further MXN appreciation registered during February. However, we don´t see much room for further strengthening, assuming that Banxico will promote more moderate 25 bps hikes in upcoming meetings. Later this year when it sees clear signs of a more significant inflation slowdown, we expect Banxico to start cutting its policy rate.”
“We keep our view that two major risk factors might contribute to some MXN weakening ahead. Firstly, the slowdown/recession in the US might hit inflows into Mexico from trade, direct investments and wage remittances. Secondly, Lopez Obrador’s nationalistic policies especially on the energy sector may deter private investments. However, the MXN might continue to be supported by investment and exports from companies reallocating global supply chains into Mexico.”
“USD/MXN – Q1 2023 18.400 Q2 2023 18.600 Q3 2023 18.800 Q4 2023 19.000”
- USD/CAD is set to finish the week flat after solid US economic data.
- US ISM Services PMI came slightly below estimates, though it remained at expansionary territory.
- The Bank of Canada is expected to keep rates unchanged at 4.50% at the upcoming monetary policy meeting.
The USD/CAD cements its bullish case by staying above the 1.3600 figure, courtesy of falling oil prices. Heated discussions within the Organization of the Petroleum Exporting Countries (OPEC) sent WTI prices down almost 3%, a headwind for the Canadian Dollar (CAD). At the time of writing, the USD/CAD is trading at 1.3625.
USD/CAD reached 1.3630s post US ISM Non-Manufacturing PMI
Wall Street opened in positive territory. The US ISM Non-Manufacturing PMI for February came at 55.1, below the prior’s month 55.2, but exceeded estimates of 54.5, signaling that activity remains firm. The Prices Paid Index subcomponent, estimated to drop to 64.5, rose by 65.6, below January’s 67.8, higher than expected, but it shows an improvement compared to the last month.
After the ISM’s release, the US Dollar Index (DXY), a measure of the buck’s value, improved toward 104.924, trimmed some of its earlier losses, and is almost flat, while the USD/CAD jumped 15 pips from around 1.3615 to 1.3630s.
US Federal Reserve’s (Fed) speakers highlighted the importance of tackling inflation towards the 2% target. On Thursday, Fed Governor Christopher commented that inflation was not easing as expected and signaled his openness to increase rates if price pressures don’t reduce.
In the meantime, the Wall Street Journal reported that the United Arab Emirates (UAE) is having an internal debate about leaving OPEC, as the country has been seeking authorization to increase its crude output. Consequently, WTI fell 3% towards three-day lows before recovering some ground.
On the Canadian front, Building Permits fell by 4% in January from December and were down 5% YoY, according to data revealed by Statistics Canada. The fall was spurred by aggressive rate hikes of the Bank of Canada (BoC).
The BoC announced that it would pause its tightening cycle and is expected to hold it at around 4.50% at its next meeting.
Therefore, the USD/CAD is expected to appreciate further, even though analysts estimate a stronger Canadian dollar for the year. Improving the global economic outlook would undermine USD/CAD, as traders seeking return will turn to high beta currencies, like the Loonie (CAD). In an alternate scenario, interest rate differentials between the Fed and the BoC would likely favor the US Dollar; hence further upside in the USD/CAD is foreseen.
USD/CAD Technical levels
- US Service sector data surpass expectations, no significant surprises.
- Treasury yields rebound from daily lows.
- XAU/USD retreats further from two-week highs, tests $1,840.
Gold prices weakened after the US data, however remained positive for the day and the week. XAU/USD fell to the $1,840/oz area, pulling back from the two-week high it hit earlier near $1,850.
US ISM Services PMI shows numbers above expectations
The ISM Services PMI came in at 55.1 in February, above the 54.5 expected and slightly under the 55.2 of January. The Prices Paid Index pulled back from 67.8 to 65.5, above the 64.5 of market consensus. Ahead of the NFP week, the Employment Index jumped to 54, against expectations of a slide to 49.8.
Previously, the final reading of the US S&P Global Services PMI showed a positive revision from 50.5 of the flash estimate to 50.6.
The US Dollar edged higher following the report, turned positive versus the Euro and the NZD and trimmed losses versus the Pound and the Yen. US yields rebounded from daily lows. The US 10-year yield rose from 3.97% to 4.02%.
XAU/USD dropped to as low as $1,840/oz, still holding in positive ground for the day. Gold continues to back away from the two-week high it hit earlier on Friday at $1,849.
On a daily basis, Gold is still up for the day but off highs. An intraday support emerges around $1,837. A break lower would expose the $1,830 area. On the upside, the key barrier remains the $1,845/$1,850 range.
Technical levels
Economists at ABN Amro believe that the EUR/USD pair is set to advance nicely over the coming months.
More upside in EUR/USD for 2023 and 2024
“As long as EUR/USD is above 1.0325 the long-term trend is positive.”
“We think there is more upside in EUR/USD for 2023 and 2024. This is mainly driven by a narrowing of the difference in policy rates and government bond yields between the US and the Eurozone as a result of more the more aggressive rate cuts we expect for the Fed compared to the ECB at the end of 2023.”
“Our forecast for the end of 2023 for EUR/USD is 1.12 and to 1.16 end of 2024.”
Business activity in the US service sector continued to expand at a robust pace in February with the ISM Services PMI arriving at 55.1. Although this reading was slightly lower than January's print of 55.2, it came in above the market expectation of 54.5.
The inflation component of the PMI survey, the Price Paid sub-index, edged lower to 65.6 in February from 67.8 but surpassed analysts' estimate of 64.5. The New Orders sub-index rose to 62.6 from 60.4 and the Employment Index advanced to 54 from 50 in the same period.
Market reaction
The US Dollar Index gained traction with the initial reaction and was last seen trading flat on the day at 104.90.
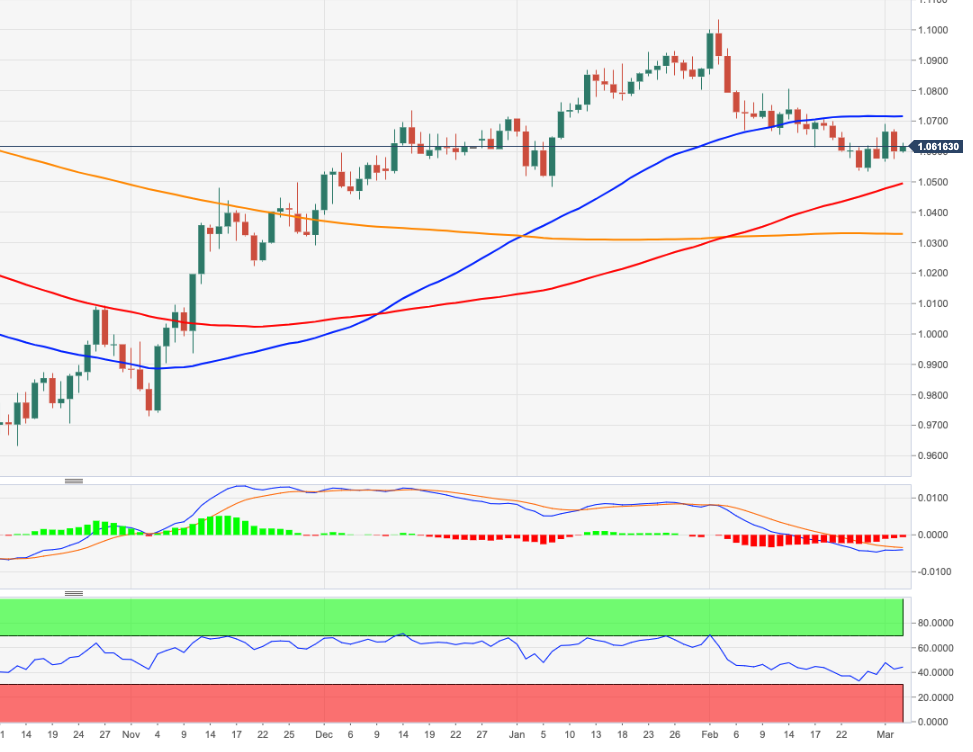
- EUR/USD regains some buying interest beyond 1.0600.
- There is an initial up-barrier at the 55-day SMA near 1.0715.
EUR/USD pick up pace and reverses, albeit partially, Thursday’s decline at the end of the week.
Occasional bullish attempts need to clear the provisional hurdle at the 55-day SMA, today at 1.0714, to allow for extra gains to, initially, the weekly top at 1.0804 (February 14).
Looking at the longer run, the constructive view remains unchanged while above the 200-day SMA, today at 1.0326.
EUR/USD daily chart
Will February’s Dollar gains be quickly reversed? A hawkish Fed can keep the Dollar supported a little further, in the view of economists at ING.
Fed will have little choice but to sound hawkish
“The Fed will have little choice but to sound hawkish. And some upward revisions to the Dot Plot fed funds expectation should support the recent hawkish re-pricing of the Fed curve. A severely inverted US yield curve is not conducive to the kind of benign USD decline that seemed likely in January.”
“Central banks tightening into slowdowns will generate greater headwinds for risk assets. This again is not a particularly positive story for pro-cyclical currencies such as the Euro – at least in the immediate future.”
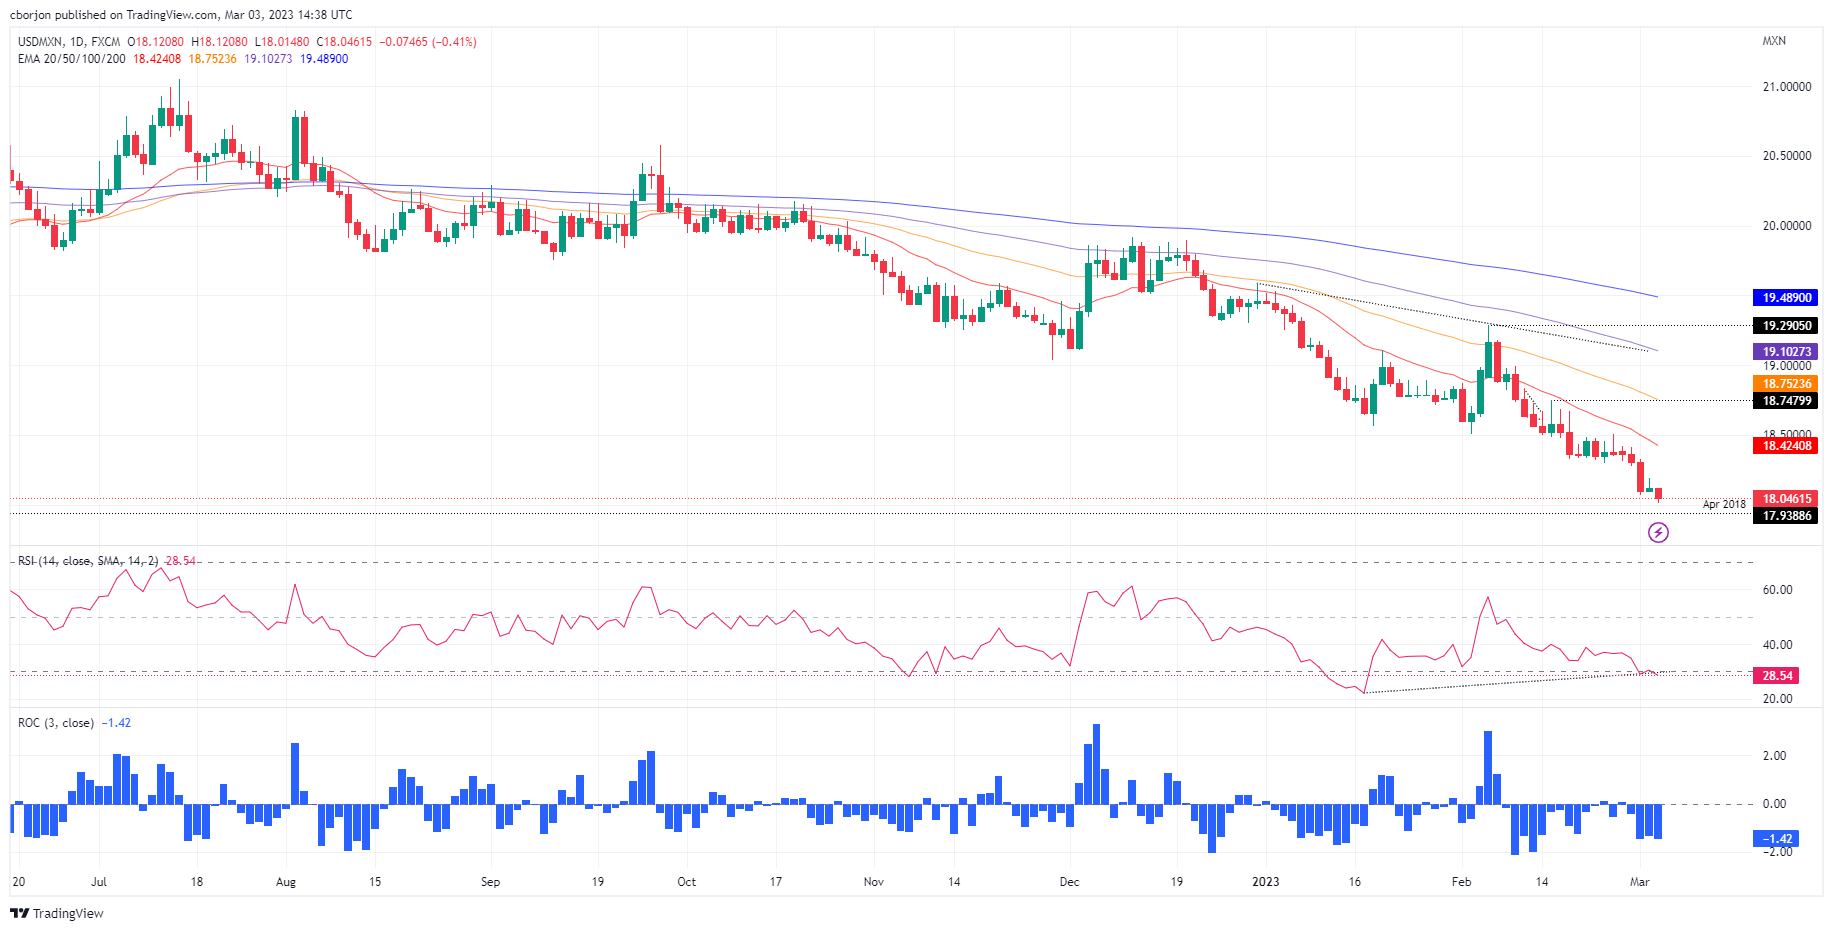
- USD/MXN plunges to multi-year lows around $18.01, despite Banxico’s cutting growth in Mexico.
- An upbeat US ISM Non-Manufacturing PMI could trigger a recovery in the USD/MXN; otherwise, a fall below $18.00 is on the cards.
- USD/MXN Price Analysis: Bad US economy data could trigger a break below $18.00
The Mexican Peso (MXN) appreciates against the US Dollar (USD), as the USD/MXN falls to multi-year lows last seen in April 2018 at 18.0148, despite Banxico (Mexican Central Bank) cutting the growth forecast for Mexico in 2023 and 2024. At the time of writing, the USD/MXN exchanges hand at 18.0479, with losses of 0.39%.
USD/MXN falls to 5-year lows at $18.01, US ISM Services PMI eyed
Wall Street is set for a higher open. Global S&P Services and Composite PMIs improved globally, a sign that the worldwide economy is in better shape than foreseen, as traders moved to riskier assets as bond yields eased. A measure of the greenback, the US Dollar Index, drops 0.25% to 104.657.
On Wednesday, Banxico revealed that Mexico’s economy in 2023 and 2024 would grow at a slower pace than initially expected, blamed on the deterioration of US expectations, namely in the industrial sector, according to an inflation report. Banxico forecasts economic growth of 1.6% for Mexico in 2023, lower than the 1.8% estimated, while for 2024, the projection is reduced to 1.8% from 2.1%.
At around 15:00 GMT, the Institute for Supply Management (ISM) would reveal the Non-Manufacturing PMI for February, expected to come at 54.5, below January’s 55.2. Due to high inflationary readings in the United States (US), the prices subcomponent would be closely monitored by investors, with the ISM Prices Paid Index expected to rise to drop from 67.8 in January to 64.5 in February.
An upbeat US ISM Non-Manufacturing report could trigger flows to the US Dollar, which means the USD/MXN could rise from YTD lows. In addition, speculations that Banxico is near pausing its tightening cycle would reduce the interest rate differentials between the US and Mexico. Also, sentiment deterioration would play an important piece of the puzzle in the future of the USD/MXN pair.
Also read: When is the US ISM Services PMI, and how could it affect EUR/USD?
USD/MXN Technical analysis
The USD/MXN daily chart portrays the pair as downward biased. After the USD/MXN pair consolidated around $18.30, Wednesday’s fall opened the door to test the 18.0000 psychological barriers. A breach of the latter will expose April’s 2018 swing low at 17.9388, followed by July’s 2017 lows of 17.4498. On the other hand, if the USD/MXN recovers above 18.1930, March’s 2 high, that would open the door to test the MTD high at 18.3296.
USD/MXN Technical levels
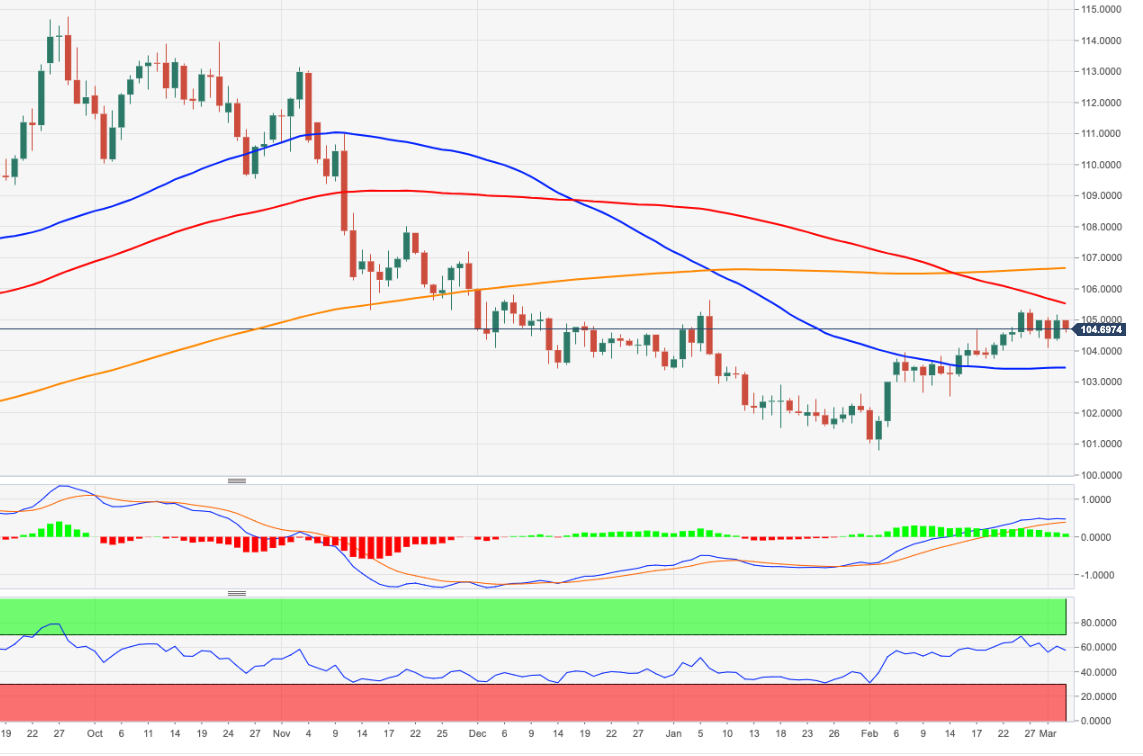
- DXY keeps the choppy trade well and sound below 105.00.
- Recent tops near 105.30 continue to limit the upside in the dollar.
DXY surrenders part of Thursday’s marked advance and returns to the area well south of the 105.00 yardstick on Friday.
So far, the continuation of the range bound theme seems the most likely scenario in the very near term for the index. In the meantime, the dollar needs to clear the February peak at 105.35 (February 27) to allow for extra recovery and a potential challenge of the 2023 top at 105.63 (January 6).
In the longer run, while below the 200-day SMA at 106.54, the outlook for the index remains negative.
DXY daily chart
According to the Wall Street Journal, the United Arab Emirates (UAE) is having an internal debate about leaving the Organization of the Petroleum Exporting Countries (OPEC). Crude oil prices are falling sharply.
UAE has been looking for OPEC+ to authorize an increase in its production. The report from the WSJ adds that UAE is clashing with Saudi Arabia over production levels and Yemen.
Market reaction
Following the report, WTI lost almost 3%. As of writing, it is moving off lows, trading back above 76.00$. Before the rebound, WTI hit three day lows near $75.75.
Economists at Wells Fargo expect the USD/CNY pair to head gradually lower over the coming months.
USD/CNY and USD/CNH to end Q1-2023 at 6.92
“For the time being, we forecast the USD/CNY and USD/CNH exchange rates to end Q1-2023 at 6.92 as broad USD appreciation is still likely, although we forecast only modest Renminbi weakness as the PBoC remains on hold.”
“With the Fed likely to ease monetary policy at a quicker pace than the PBoC over the medium to longer term, the outlook for Renminbi strength over time remains intact, although risks to China's economy and financial markets are abundant as geopolitical tensions with the US have been renewed.”
“We forecast the Chinese currency to reach 6.84 per Dollar by the end of this year and break below 6.80 by mid-2024.”
The Canadian Dollar was the third best performing G10 currency in February. Underperformance should emerge later in the year, economists at MUFG Bank report.
USD/CAD to be more driven by external factors for now
“Stronger domestic data but weaker inflation will be enough to keep the BoC on the sidelines and hence USD/CAD is likely to be more driven by external factors for now and with 2yr UST bond yields at cyclical highs and Fed rhetoric so hawkish, we see upside USD/CAD risks over the short-term before CAD can recover.”
“Slower US growth will likely see USD/CAD lower later in H2 with CAD underperforming non-USD G10 FX.”
“USD/CAD – Q1 2023 1.3600 Q2 2023 1.3500 Q3 2023 1.3400 Q4 2023 1.3200.”
“EUR/CAD – Q1 2023 1.4280 Q2 2023 1.4580 Q3 2023 1.4740 Q4 2023 1.4780.”
“CAD/JPY – Q1 2023 100.00 Q2 2023 98.520 Q3 2023 97.010 Q4 2023 96.210.”
US ISM Services PMI Overview
The Institute of Supply Management (ISM) will release the Non-Manufacturing Purchasing Managers' Index (PMI) - also known as the ISM Services PMI – at 15:00 GMT this Friday. The gauge is expected to come in at 54.5 for February, down from 55.2 in the previous month. Given that the Fed looks more at inflation than growth, investors will keep a close eye on the Prices Paid sub-component, which is anticipated to decelerate from 67.8 in January to 64.5 during the reported month.
Economists at ING offer a brief preview of the important macro data and write: “Consensus is centred around a marginal decrease from 55.2 to 54.5, which would confirm speculation on recession is too premature and would continue to endorse the Fed’s hawkish rhetoric. We think this should allow further stabilisation of the Dollar around current levels.”
How Could it Affect EUR/USD?
Ahead of the key release, retreating US Treasury bond yields prompts some selling around the US Dollar. This, along with the overnight hawkish comments by ECB President Christine Lagarde, assists the EUR/USD pair to regain positive traction on the last day of the week. Any disappointment from the US ISM Services PMI could exert additional downward pressure on the Greenback and continue pushing the pair higher. That said, the market reaction is more likely to remain limited amid growing acceptance that the Fed will continue to tighten its monetary policy to combat stubbornly high inflation.
Hence, a stronger headline print and higher-than-expected Prices Paid Index should be enough to trigger a fresh leg up in the US bond yields, which, in turn, should help revive the USD demand. Apart from this, looming recession risks should continue to act as a tailwind for the safe-haven buck. This, in turn, suggests that the path of least resistance for the EUR/USD pair is to the downside and any subsequent move up might still be seen as a selling opportunity.
Eren Sengezer, Editor at FXStreet, offers a brief technical outlook and outlines important technical levels to trade the major: “EUR/USD is currently trading slightly above the descending regression channel coming from early February. The 20-period and the 50-period Simple Moving Averages (SMA) reinforce that resistance area that aligns at 1.0610/1.0620. Once the pair stabilizes above that hurdle, it could target 1.0650/60 (Fibonacci 23.6% retracement of the latest downtrend, 100-period SMA), 1.0700 (psychological level) and 1.0720 (Fibonacci 38.2% retracement)..”
“On the other hand, if the pair returns within the descending channel, sellers could take action and cause EUR/USD to slide toward 1.0560 (mid-point of the descending channel), 1.0540 (static level) and 1.0500 (psychological level, lower limit of the descending channel), .” Eren adds further.
Key Notes
• ISM Services PMI Preview: Strong figure set to catapult US Dollar to new highs
• US February ISM Services PMI Preview: Will it influence Fed rate hike bets?
• EUR/USD Forecast: Investors struggle to make up their minds about Euro's direction
About the US ISM manufacturing PMI
The Institute for Supply Management (ISM) Manufacturing Index shows business conditions in the US manufacturing sector. It is a significant indicator of the overall economic condition in the US. A result above 50 is seen as positive (or bullish) for the USD, whereas a result below 50 is seen as negative (or bearish).
- USD/JPY comes under selling pressure on Friday and retreats from a fresh YTD peak.
- Retreating US bond yields prompts some USD profit-taking and drags the pair lower.
- The divergent Fed-BoJ policy outlook should help limit deeper losses for the major.
The USD/JPY pair comes under some selling pressure on Friday and reverses the previous day's positive move to the 137.10 area, or its highest level since December 20. The pair maintains its offered tone through the early North American session and is currently placed near the lower end of its daily range, just a few pips above the 136.00 round-figure mark.
An intraday retracement slide in the US Treasury bond yields weighs on the US Dollar (USD), which turns out to be a key factor dragging the USD/JPY pair lower. That said, hawkish Fed expectations should act as a tailwind for the US bond yields and the Greenback. Apart from this, the divergent Fed-BoJ policy outlook should contribute to liming losses for the major.
From a technical perspective, the USD/JPY pair struggled to find acceptance above the 100-day Simple Moving Average (SMA) and failed ahead of the very important 200-day SMA. The said barriers are currently pegged near the 136.75-136.80 region and the 137.25 area, respectively, which if cleared decisively will be seen as a fresh trigger for bullish traders.
The subsequent move-up will further confirm a breakout through the 38.2% Fibonacci retracement level of the recent pullback from over a three-decade high and pave the way for additional gains. The USD/JPY pair might then accelerate the move to reclaim the 138.00 mark en route to the 138.75 zone, the 139.00 round figure and the 139.60 region (50% Fibo. level).
On the flip side, sustained weakness below the 136.00 level might prompt some technical selling and drag the USD/JPY pair to the weekly low, around the 135.25 region. Some follow-through selling below the 135.00 psychological mark will set the stage for a slide towards the next relevant support near the 134.40-134.20 zone en route to the 134.00 round figure.
The latter should act as a strong base for the USD/JPY pair ahead of the Bank of Japan (BoJ) policy meeting next week. That said, a convincing break below could make spot prices vulnerable to sliding further towards the 23.6% Fibo. level support, just ahead of the 133.00 mark.
USD/JPY daily chart
Key levels to watch
EUR/USD edges higher but modest gains encounter selling pressure. Economists at Scotiabank analyze the pair’s technical picture.
Resistance aligns at 1.0650
“EUR/USD has recovered from yesterday’s low around 1.0577 but gains have been slight and the short-term chart suggests that the EUR is running into firm selling pressure in the low 1.06s.
“Renewed weakness and a push under minor support intraday at 1.0580 might see a bit more downward pressure on the EUR develop.”
“Resistance is 1.0650.”
See – EUR/USD: Volatility in a 1.05-1.10 range depending on the data in Q2 – ING
- GBP/USD regains positive traction on Friday and reverses a major part of the overnight losses.
- The four-week-old trading range warrants caution before placing aggressive directional bets.
- Bearish oscillators on the daily chart support prospects for a break below the 200-day SMA.
The GBP/USD pair attracts some dip-buying on Friday and recovers a major part of the previous day's slide to the 1.1920-1.1915 support zone. The pair maintains its bid tone around the 1.2000 psychological mark through the early North American session and is supported by broad-based US Dollar weakness.
Looking at the broader picture, the two-way price moves witnessed over the past four weeks or so constitute the formation of a rectangle on the daily chart. The lower end of the trading band coincides with a technically significant 200-day Simple Moving Average (SMA) and should now act as a pivotal point.
A convincing break below will make the GBP/USD pair vulnerable to weaken further below the 1.1900 mark and test the YTD low, around the 1.1840 region touched in January. Some follow-through selling will complete a bearish double-top pattern formed near the 1.2445-1.2450 area and pave the way for deeper losses.
On the flip side, the overnight swing high, around the 1.2035 area, might act as an immediate hurdle ahead of the 1.2065-1.2070 supply zone. Any subsequent move-up could attract fresh sellers near the 1.2100 mark and remain capped near the 50-day SMA strong barrier, currently around the 1.2135-1.2140 area.
Some follow-through buying could lift the GBP/USD pair towards the 1.2200 mark en route to the February 14 peak, around the 1.2265-1.2270 region. A sustained strength beyond the latter will suggest that the slide from the 1.2445-1.2450 zone has run its course and shift the near-term bias back in favour of bullish traders.
GBP/USD daily chart
Key levels to watch
USD/CAD has eased modestly. A break under the 1.3535 is required to trigger additional losses, economists at Scotiabank report.
CAD shows signs of decoupling from stocks
“CAD’s correlation with equities is weakening and currently stands just below 60%, the weakest since last Jul. If the CAD is decoupling from equity trends, other (typical) fundamental drivers are not obviously supportive.”
“USD/CAD losses would need to extend through the mid-1.35s and below 1.3535 (Monday’s low and potential double top trigger) to extend meaningfully.”
“Solid resistance remains at 1.3665 (the potential double top).”
Lee Sue Ann, Economist at UOB Group, sees the RBA raising the OCR by 25 bps at the March 7 meeting.
Key Takeaways
“The RBA has stated that its priority is to return inflation to target, and that further increases in interest rates will be needed over the months ahead.”
“We are penciling in another two more 25bps hike, which will take the OCR to 3.85%, before looking for a pause.”
GBP/USD holds key support in low-1.19s. Economists at Scotiabank analyze the pair technical outlook.
Paring back BoE rate bets will weigh on the Pound
“Markets continue to imply solid expectations that the policy cycle will extend, with three more 25 bps hikes priced in through Sep; paring back of these rate bets (while the Fed and ECB remain relatively hawkish) will weigh on the Pound.”
“Cable has rebounded from the low 1.19 area for a third time since mid-Feb. While this area is important support on the short-term charts, recall that 1.1916 (currently) is where the 200-DMA lies and provides additional support for the GBP.”
“More range-trading around the 1.20 point may develop from here (resistance is 1.2150) in the short run.”
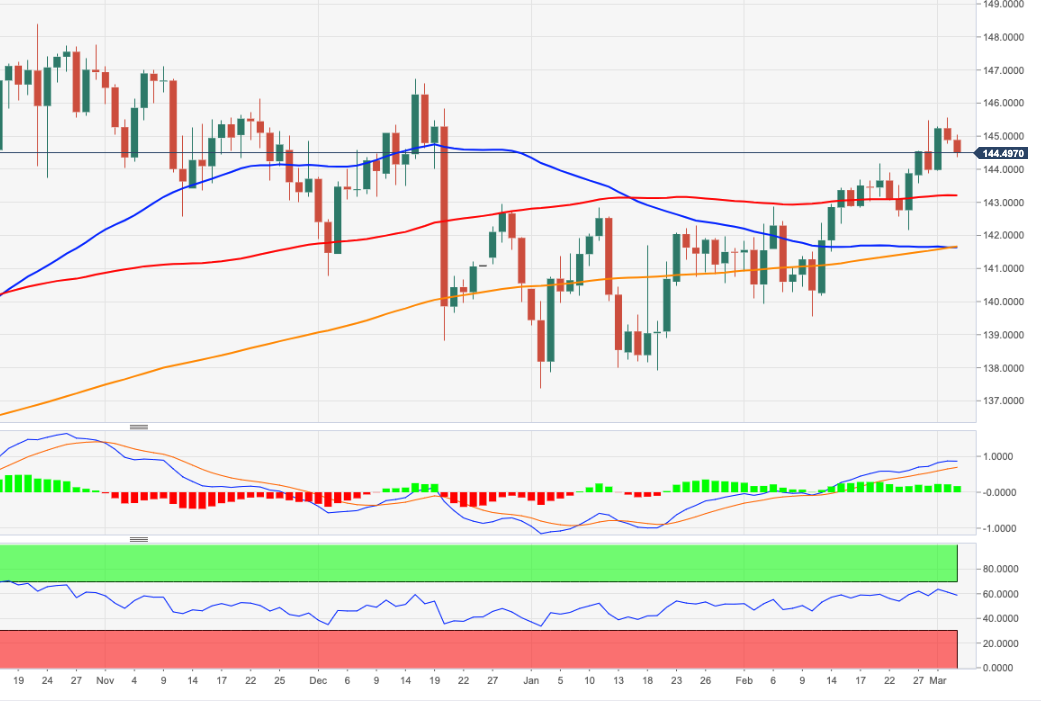
- EUR/JPY extends the pessimism below 145.00 on Friday.
- The next target stays unchanged at the 146.70 region.
EUR/JPY adds to Thursday’s losses and retreats below the 145.00 mark at the end of the week.
The continuation of the current upside momentum faces the next hurdle at the 2023 high at 145.56 (March 2). Once this level is cleared, the par could then confront the December 2022 top at 146.72 (December 15) ahead of the 2022 high at 148.40 (October 21 2022).
In the meantime, while above the 200-day SMA, today at 141.63, the outlook for the cross is expected to remain positive.
EUR/JPY daily chart
S&P 500 has revisited the 3930/3880 support zone. Economists at Société Généraleanalyze the index's technical outlook.
Scope for a short-term bounce
“Formation of a daily bullish engulfing pattern highlights the possibility of a short-term bounce.”
“Recent bearish gap at 4090 is the first layer of resistance; overcoming this can lead to an extended up move towards 4218 and perhaps even towards last August's high of 4320/4370.”
“Defending the 200-DMA at 3930/3880 – which is also the descending trend line drawn since last year and the 38.2% retracement from October – is crucial to avert a deeper pullback.”
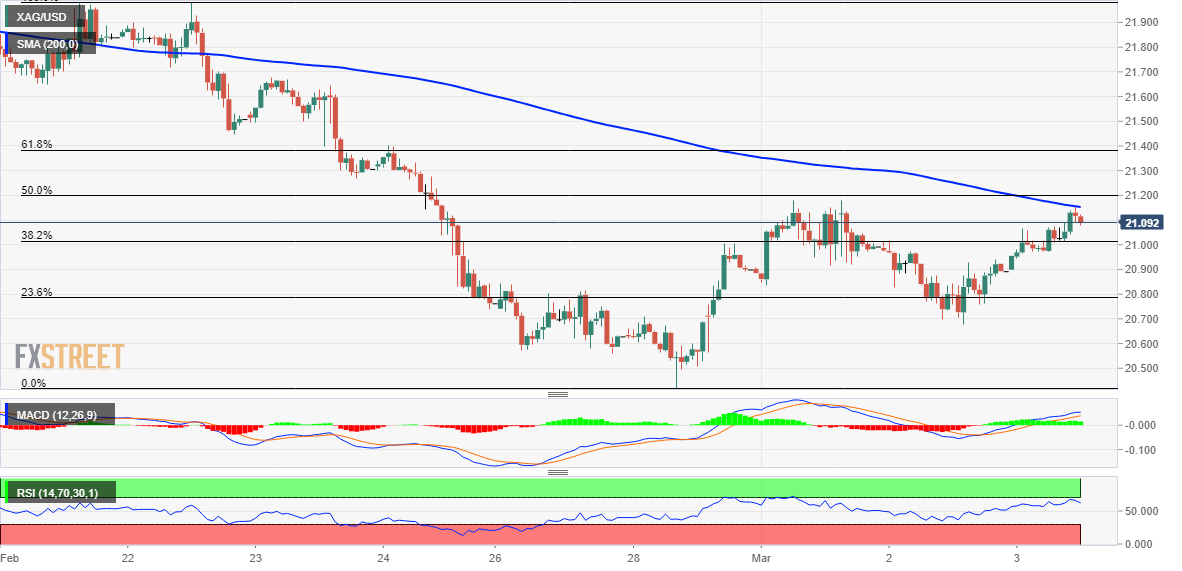
- Silver attracts fresh buying on Friday and steadily moves back closer to the weekly peak.
- The technical setup supports prospects for the emergence of fresh selling at higher levels.
- A sustained move beyond the $22.00 mark is needed to negate the near-term bearish bias.
Silver regains positive traction on Friday and climbs back to the top end of its weekly trading range, around the $21.15-$21.20 region during the mid-European session. Bulls now await a sustained strength beyond the 200-hour SMA before positioning for any further intraday appreciating move.
Any subsequent move up, however, is likely to confront stiff resistance just ahead of the mid-$21.00s, marking the 23.6% Fibonacci retracement level of the recent pullback from the $24.65 zone, or a multi-month top touched in February. A sustained strength, however, might trigger a short-covering move and lift the XAG/USD further towards the 38.2% Fibo. level, around the $22.00 round-figure mark.
That said, technical indicators on the daily chart are still holding deep in bearish territory and have also recovered from the oversold zone. This, in turn, supports prospects for the emergence of fresh selling at higher levels and suggests that the ongoing recovery move from the YTD low, around the $20.40 region set earlier this week, runs the risk of fizzling out rather quickly near the aforementioned handle.
On the flip side, the $20.70-$20.60 zone seems to protect the immediate downside ahead of the $20.40 level. Failure to defend the said support levels will be seen as a fresh trigger for bearish traders and pave the way for further losses. The XAG/USD could then turn vulnerable to weaken further below the $20.00 psychological mark and test the next relevant support near the $19.75-$19.70 region.
The downward trajectory could get extended towards the $19.20-$19.15 intermediate support en route to the $19.00 round figure before the XAG/USD eventually drops to the $18.25-$18.20 strong horizontal support.
Silver 1-hour chart
Key levels to watch
Gold price shed more than 5% in February. XAU/USD is currently trading at a good $1,840, which puts it around $40 or 2% higher than on Tuesday. It appears that the yellow metal has bottomed out, strategists at Commmerzbank report.
There is no longer any expectation of rate cuts this year
“Weighing on Gold was a combination of an appreciating USD and sharply rising bond yields due to a massive upward correction of US interest rate expectations.”
“By the end of the month the expected rate peak had been pushed back into the autumn – what is more, it is now set to total almost 5.5%, which is around 70 bps higher than envisaged at the start of the month. Moreover, there is no longer any expectation of rate cuts this year.”
“The price increase seen this week despite even higher interest rate expectations could indicate that the correction of the gold price is more or less complete and that the price may have bottomed out at the beginning of the week.”
GBP/USD suffered heavy losses and closed below 1.2000 on Thursday. A break under the 1.1920 mark could trigger another leg lower, economists at OCBC Bank report.
Descending triangle?
“Daily momentum and RSI indicators are not showing a clear bias. But on the weekly chart, bullish momentum is fading fast while RSI fell.”
“A potential descending triangle could be forming with support at 1.1920 levels (200-DMA, triangle support). A decisive break to the downside could fuel more downward pressure. Next support at 1.1840, 1.1720 levels.”
“Resistance at 1.2045 (21-DMA), 1.2140 (50-DMA).”
Economist at UOB Group Enrico Tanuwidjaja reviews the latest inflation figures in Indonesia.
Key Takeaways
“Indonesia’s headline inflation rate rebounded higher to 5.5% y/y in Feb from 5.3% in Jan, beating consensus forecast slightly. On month basis, it gained by 0.2%, tad faster than Jan’s pace.”
“Significantly higher food prices and relatively elevated level of prices in key consumer baskets such as transportation, utilities, and clothing underpinned the pick-up in headline inflation last month.”
“Today’s inflation data reinforces our 2023 average inflation forecast of 4% (2022: 4.2%). Our view remains for inflation to edge back to be within BI’s target range of 2-4% only in 2H23.”
ISM will release the February US Services PMI report later in the day. Economists at ING the impact on markets can be sizeable.
Consensus expects a stabilisation in ISM Services
“Consensus is centred around a marginal decrease from 55.2 to 54.5, which would confirm speculation on recession is too premature and would continue to endorse the Fed’s hawkish rhetoric. We think this should allow further stabilisation of the Dollar around current levels.”
“A return to sub-50 levels is seen as rather unlikely and would cause a significant unwinding of hawkish Fed bets and probably the start of a new Dollar downtrend.”
“A read in the 50-53 area would probably be enough to generate some dovish repricing and should weigh on the Dollar. However, as long as jobs data remain strong (payrolls are released next week), we shouldn’t see a USD downtrend fully materialise.”
Economists at MUFG analyze the GBP outlook. The British Pound sees brighter prospects later in the year.
Short-term downside risks
“We maintain our view of short-term downside risks as inflation remains a concern and risk conditions remain fragile. However, assuming inflation falls notably and the Brexit deal just agreed improves relations with Europe, we see scope for some GBP outperformance after a sustained period of negativity for the UK.”
“EUR/GBP – Q1 2023 0.8800 Q4 2023 0.8700 Q3 2023 0.8650 Q4 2023 0.8500”
“GBP/USD – Q1 2023 1.1930 Q2 2023 1.2410 Q3 2023 1.2720 Q4 2023 1.3180”
- EUR/GBP meets with some supply and moves away from a nearly two-week high set on Thursday.
- Bets for more interest rate hikes by the BoE and the ECB warrant caution for aggressive traders.
- A sustained weakness below the 100-day SMA is needed to support prospects for deeper losses.
The EUR/GBP cross comes under some selling pressure on Friday and extends the previous day's pullback from the vicinity of the 0.8900 mark, or a nearly two-week high. The intraday downtick picks up pace during the first half of the European session and drags spot prices to a fresh daily low, around the 0.8845 region in the last hour.
The British Pound draws support from rising bets for additional rate hikes by the Bank of England (BoE) and turns out to be a key factor dragging the EUR/GBP cross lower. It is worth recalling that the BoE Governor Andrew Bailey said on Wednesday that some further increase in bank rates may turn out to be appropriate, though added that nothing is decided. This was followed by hawkish remarks by the BoE Chief Economist Huw Pill on Thursday, noting that Britain's economy is showing slightly more momentum than expected and pay growth is proving a bit faster than the central bank forecast last month.
The downside for the EUR/GBP cross, however, seems cushioned amid expectations that the European Central Bank (ECB) will continue hiking rates in the coming months. In fact, the minutes of the ECB meeting held in February reflected a very hawkish debate and a clear determination to hike rates beyond March. Adding to this, ECB Governing Council member Boštjan Vasle said on Friday that he expects the March rate hike to be followed by additional increases. Separately, ECB policymaker Madis Muller noted that rates will have to remain high for a while, supporting prospects for a 50 bps rate hike in March.
On the economic data front, the composite Eurozone Services PMI for February was revised lower to 52.7 from the 53.0 anticipated. In contrast, the UK Services PMI was finalized at 53.5 against the flash estimate for a reading of 53.3. This further contributes to the offered tone surrounding the EUR/GBP cross. That said, the aforementioned mixed fundamental backdrop warrants some caution before placing aggressive bearish bets and confirming that this week's bounce from the 100-day Simple Moving Average (SMA) has run out of steam.
Technical levels to watch
EUR/GBP has stabilised after Wednesday’s big rally. Economists at ING believe that the pair could trade beyond the 0.8900 mark for now
Unstable risk sentiment should hit GBP harder than EUR
“Yesterday’s Decision Makers Panel survey signalled that firms now expect to raise prices and wages at a slower pace, which favours a more cautious monetary policy approach.”
“We still think the BoE will hike by 25 bps on 23 March, but the market’s pricing for an additional 50 bps of tightening after that seems too aggressive.”
“EUR/GBP may continue to find support beyond the 0.8900 level for now as the Euro may gain more momentum in the crosses and unstable risk sentiment should hit GBP harder.”
In opinion of UOB Group’s Economist Lee Sue Ann and Markets Strategist Quek Ser Leang, the likelihood of USD/CNH grinding lower to 6.8400 appears now diminished.
Key Quotes
24-hour view: “We highlighted yesterday that ‘after such a sharp drop, further sustained decline is unlikely’. However, we were of the view that ‘there is scope for the USD weakness to extend to 6.8550 before stabilization is likely’. Instead of weakening further, USD staged a surprisingly robust rebound to 6.9340 before closing at 6.9229 (+0.62%). The price actions are likely part of a broad consolidation range and USD is likely to trade between 6.8800 and 6.9300 today.”
Next 1-3 weeks: “Yesterday (02 Mar, spot at 6.8800), we noted that the month-long USD weakness has ended. We held the view that while there is room for USD to weaken, any decline is likely to face solid support at 6.8400. USD subsequently popped to a high of 6.9340, just below our ‘strong resistance’ level of 6.9350. We continue to hold the same view but after yesterday’s price actions, the chance of a decline to 6.8400 has diminished. Looking ahead, if USD were to break above 6.9350, it would indicate that it could trade in a broad consolidation range for a period of time.”
- EUR/USD prints decent gains beyond the 1.0600 level.
- ECB De Guindos reiterated that inflation is expected to fall by H2 2023.
- US ISM Non-Manufacturing takes centre stage later in the NA session.
Renewed selling pressure in the greenback allows EUR/USD to pick up pace and reclaim the area beyond 1.0600 the figure at the end of the week.
EUR/USD now looks at US data
EUR/USD keeps the choppy price action well and sound so far this week amidst an equally vacillating performance in the greenback, while yields on both sides of the ocean now give away some gains and investors continue to monitor messages from both the ECB and the Fed.
On the latter, ECB’s Vice-President De Guindos suggested earlier that headline inflation should fall below 6% at some point in mid-year, at the time when he reiterated that decisions on future rate hikes will remain data-dependent and that the economy of the region is doing better than expected.
His colleague Vasle left the door open to further rate raises after the March event, a view shared by Board member Müller. In addition, Müller was unable to predict how far up rates may go.
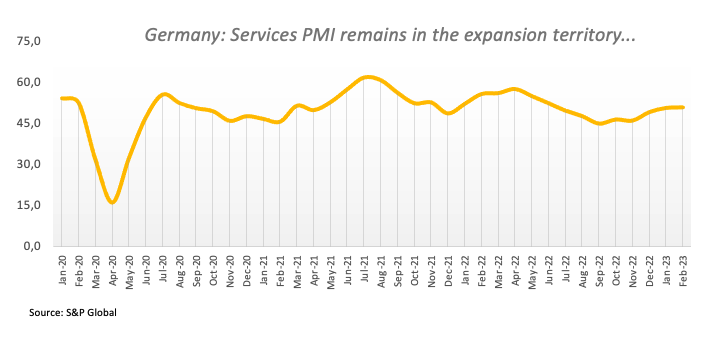
In the domestic calendar, final figures saw Services PMI in Germany and the broader Euroland at 50.9 and 52.7, respectively, for the month of February. In addition, Producer Prices in the euro area contracted 2.8% MoM in January and rose 15% from a year earlier and earlier data saw Germany’s trade surplus widen to €16.7B in January.
In the US, all the attention will be on the release of the ISM Manufacturing seconded by the final prints of the Manufacturing PMI. In addition, FOMC’s Logan, Bostic, Barkin and Bowman are all due to speak later in the NA session.
What to look for around EUR
EUR/USD regains some balance and looks to extend the trade beyond the 1.0600 yardstick amidst the broad-based consolidative mood.
In the meantime, price action around the European currency should continue to closely follow dollar dynamics, as well as the potential next moves from the ECB after the bank has already anticipated another 50 bps rate raise at the March event.
Back to the euro area, recession concerns now appear to have dwindled, which at the same time remain an important driver sustaining the ongoing recovery in the single currency as well as the hawkish narrative from the ECB.
Key events in the euro area this week: Germany Balance of Trade, Final Services PMI, EMU Final Services PMI (Friday).
Eminent issues on the back boiler: Continuation of the ECB hiking cycle amidst dwindling bets for a recession in the region and still elevated inflation. Impact of the Russia-Ukraine war on the growth prospects and inflation outlook in the region. Risks of inflation becoming entrenched.
EUR/USD levels to watch
So far, the pair is advancing 0.16% at 1.0614 and the breakout of 1.0714 (55-day SMA) would target 1.0804 (weekly high February 14) en route to 1.1032 (2023 high February 2). On the other hand, there is an immediate support at 1.0532 (monthly low February 27) seconded by 1.0481 (2023 low January 6) and finally 1.0326 (200-day SMA).
Both AUD and NZD have given up ground to a firmer USD over recent weeks. Economists at CIBC Capital Markets anticipate some further consolidation before lows are established.
Further consolidation before lows are established
“We retain a medium-term positive outlook for both the Australian and New Zealand Dollars. But we anticipate further downside is possible in both AUD/USD and NZD/USD before eventual basing and rebounds develop.”
“The greater degree of tightening still to be delivered by RBA relative to RBNZ is something we see supporting AUD vs NZD, and we target a move to 1.1200.”
“Both also continue to have risks from overall slower global growth. A confirmed recovery in China and eventual turn lower in the USD does provide some counter to that risk. Though we see that more of a 2Q-3Q story than during the current period.”
- AUD/SUD catches fresh bids on Friday and draws support from a combination of factors.
- The upbeat Chinese data benefits the Aussie amid the emergence of some USD selling.
- Recession fears, hawkish Fed expectations should limit the USD losses and cap the major.
The AUD/USD pair regains positive traction on the last day of the week and builds on its steady intraday descent through the first half of the European session. The momentum lifts spot prices to a fresh daily high, around the 0.6765 region in the last hour, and is sponsored by the emergence of fresh selling around the US Dollar.
A modest pullback in the US Treasury bond yields is turning out to be a key factor exerting some downward pressure on the buck. Adding to this, the upbeat Chinese macro data fueled optimism about a strong recovery in the world's second-largest economy, which further dents the Greenback's safe-haven status and provides an additional boost to the China-proxy Australian Dollar. That said, a combination of factors might hold back bulls from placing aggressive bets around the AUD/USD pair and keep a lid on any further gains, at least for the time being.
Firming expectations that the Federal Reserve will stick to its hawkish stance for longer in the wake of stubbornly high inflation should act as a tailwind for the US bond yields and lend support to the USD. The bets were lifted by hawkish commentary by a slew of influential FOMC members, stressing the need for higher rate hikes to fully gain control over inflation. This had pushed the yield on the benchmark 10-year US government bond to its highest level since last November and the rate-sensitive two-year Treasury note to levels last seen in July 2007 on Thursday.
Furthermore, worries about economic headwinds stemming from rapidly rising borrowing costs continue to weigh on investors' sentiment. This is evident from the prevalent cautious mood around the equity markets, which should further help limit losses for the Greenback and contribute to capping the upside for the AUD/USD pair. Even from a technical perspective, the recent breakdown below the very important 200-day Simple Moving Average (SMA) favours bearish trades and suggests that the path of least resistance for spot prices remains to the downside.
Market participants might also refrain from placing aggressive bets ahead of next week's Reserve Bank of Australia (RBA) monetary policy meeting. In the meantime, traders on Friday will take cues from the US ISM Services PMI, due for release later during the early North American session. This, along with the US bond yields and the risk sentiment, will drive the USD demand and produce short-term trading opportunities around the AUD/USD pair.
Technical levels to watch
In February, the Yen weakened versus the US Dollar from 130.08 to 136.15. But the underperformance of the Yen in February is unlikely to become sustained, in the opinion of economists at MUFG Bank.
Yields globally are close to peaking, which points to JPY recovery
“The underperformance of the Yen in February is unlikely to become sustained and we maintain that the inflation angst that has emerged globally will not return to anything like during period of last year when JPY depreciated sharply.”
“Since the Dollar peaked at the end of September, JPY has been 2nd best performing G10 currency to end-January. Some retracement in that context is understandable. But we maintain inflation will subside from here and yields globally are close to peaking which points to JPY recovery, especially with BoJ policy set to change as well.”
“USD/JPY – Q1 2023 136.00 Q2 2023 133.00 Q3 2023 130.00 Q4 2023 127.00”
European Central Bank (ECB) Governing Council member Madis Muller said on Friday, “it is probably not the final hike in March.”
“Rates will have to remain high for a while,” Muller added.
The ECB policymakers added that “high core more worrisome than headline inflation.
Related reads
- ECB’s de Guindos: Interest rate path after March will be data-dependent
- Euro at risk of recording significant losses if core inflation eases over next year – Commerzbank
European Central Bank (ECB) Vice President Luis de Guindos is delivering a speech to CUNEF University students, titled "Prospects for the Euro Zone and the Future of Monetary Policy" this Friday. A Q&A session will follow.
Key quotes
Interest rate path after March will be data-dependent.
Headline inflation will continue to decline, could fall below 6% around mid-year.
But core inflation could however have a more stable performance.
Market reaction
These comments fail to move the needle around the Euro. The EUR/USD pair is trading at 1.0616, adding 0.20% on the day, as of writing.
European Central Bank (ECB) Governing Council member Boštjan Vasle said in a statement on Friday that he expects the March rate hike to be followed by additional increases.
Key quotes
"My personal expectations is that the increase we intend for our March meeting -- that is 0.5 percentage points -- will not be the last one.”
"We will have to continue with increases of our interest rates in the following months.”
"My expectations is that the increase we intend for our March meeting will be followed by additional increases before we reach a level that will be sufficient to bring inflation back to the trajectory towards our goal of 2% inflation.”
“The ECB will also continue to reduce the size of its balance sheet after ending the full reinvestment of maturing debt earlier this month.”
Market reaction
EUR/USD is unfazed by the above comments, keeping its range play intact at around 1.0615, up 0.19% on the day.
A probable advance in USD/JPY to the 137.90 region could be running out of steam, according to UOB Group’s Economist Lee Sue Ann and Markets Strategist Quek Ser Leang.
Key Quotes
24-hour view: “Yesterday, we expected USD to trade sideways between 135.40 and 136.60. However, USD rose briefly above 137.00 (high of 137.09) before retreating quickly. Despite the advance, upward momentum has barely improved. Today, there is scope for USD to edge higher but a break of 137.30 is unlikely. On the downside, a breach of 136.20 would indicate that the current mild upward pressure has eased.”
Next 1-3 weeks: “We have held a positive USD view for more than 2 weeks now. In our most recent narrative from two days ago (01 Mar, spot at 136.35), we noted that USD ‘must break and hold above 136.90 in the next 1-2 days or the chances of a move to 137.90 will rapidly diminish’. While USD rose to a high of 137.09 in NY trade, it retreated and closed at 136.76. Upward momentum has improved a tad but while the outlook for USD is still positive, the major resistance at 137.90 could be out of reach this time around. On the downside, a break of 135.50 (‘strong support’ level previously at 135.00) would indicate that USD is not strengthening further.”
- GBP/USD once again finds support near the 200-day SMA and regains positive traction on Friday.
- Retreating US bond yields prompts some selling around the USD, which is seen as lending support.
- Rising bets for additional rate hikes by the BoE and the Fed warrant caution for aggressive traders.
The GBP/USD pair attracts fresh buyers in the vicinity of a technically significant 200-day Simple Moving Average (SMA) and reverses a part of the overnight losses back closer to the weekly low. The pair sticks to its intraday gains and is currently placed near the top end of the daily range, just a few pips below the 1.2000 psychological mark.
A modest pullback in the US Treasury bond yields prompts some selling around the US Dollar, which, in turn, is seen as a key factor pushing the GBP/USD pair higher. The British Pound draws additional support from rising bets for additional rate hikes by the Bank of England (BoE). It is worth recalling that the BoE Governor Andrew Bailey said on Wednesday that some further increase in bank rates may turn out to be appropriate, though added that nothing is decided. This was followed by hawkish remarks by the BoE Chief Economist Huw Pill on Thursday, noting that Britain's economy is showing slightly more momentum than expected and pay growth is proving a bit faster than the central bank forecast last month.
The downside for the USD, however, seems cushioned, at least for the time being, amid firming expectations for further policy tightening by the Federal Reserve. The US CPI, PPI and the PCE Price Index released recently indicated that inflation isn't coming down quite as fast as hoped. Moreover, the incoming upbeat US macro data, including the Initial Jobless Claims on Thursday, pointed to an economy that remains resilient, which should allow the US central bank to stick to its hawkish stance for longer. Adding to this, a slew of FOMC members backed the case for higher rate hikes to tame stubbornly high inflation. This should act as a tailwind for the US bond yields and continue to lend some support to the Greenback.
It is worth recalling that the yield on the benchmark 10-year US government bond rose to its highest level since last November and the rate-sensitive two-year Treasury note had shot to levels last seen in July 2007 on Thursday. This, along with the GBP/USD pair's two-way price action witnessed over the past four weeks or so, warrants some caution for aggressive traders and positioning for a firm near-term direction. Next on tap is the release of the final UK Services PMI, which will be followed by the US ISM Non-Manufacturing PMI later during the early North American session. The data might provide some impetus to the major and allow traders to grab short-term opportunities on the last day of the week.
Technical levels to watch
Further appreciation potential for EUR/USD is likely to be limited for now, in the view of economists at Commerzbank.
ECB rate expectations have gone far
“The market expects interest rates to peak at just under 4%. In our view, current market expectations are already quite aggressive. A large share of the upside risks for inflation that emerged over the past weeks is likely to be priced into the rate outlook already, which limits the Euro’s future appreciation potential.”
“In view of stubbornly high underlying inflation momentum dovish resistance within the ECB might prevent a sufficient tightening of monetary policy, in particular if core inflation tends downwards over the course of next year. If signs indicating this increase, the Euro would be at risk of recording significant losses.”
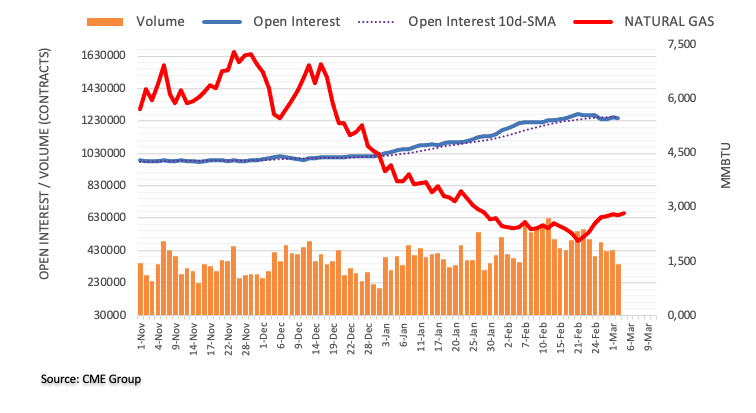
Open interest in natural gas futures markets resumed the downtrend and dropped by around 6.8K contracts on Thursday according to preliminary readings from CME Group. Volume followed suit and shrank by around 91.3K contracts, keeping the erratic performance well in place.
Natural Gas seem to have reached a plateau
Prices of natural gas retreated marginally amidst diminishing open interest and volume on Thursday. So far, further consolidation appears likely around the $2.80 region in the very near term. The breakout of this theme faces the next hurdle at a Fibo retracement around $3.20 per MMBtu.
- Gold price bulls come alive in a bullish reversal week.
- US Dollar retraced a bit despite surging US Treasury 10-year bond yields.
- ISM Services PMI release is still awaited for fresh impulse on XAU/USD.
Gold price bulls have returned to action this week, helping the bright metal break out of a bearish trend that had dominated XAU/USD price action during February. What has been more impressive is that Gold has been able to rally despite US Treasury bond yields gathering strength, which usually supports the US Dollar and weighs on yield-less commodities.
Gold news: Chinese PMI boost
Strong PMI data from China, both in Manufacturing and Services sectors, has really helped Gold price to pick up demand, as the Asian giant is a huge yellow-metal market. Gold traders now await more Federal Reserve clues, which could come from Fed officials' speeches and Friday's ISM Services PMI.
In the meantime, investors keep watching the US 10-year Treasury bond yield market, which rallied past the round 4% resistance on Wednesday and remains above this crucial level. The usual inverse correlation of Gold price with the US Treasury yields could provide downward pressures on XAU/USD if yields stay high, but a retracement in that bond market could propel the bright metal on a notable surge.
United States Services PMIs on the way, watch for inflation clues
The Institute of Supply Management (ISM) will publish the Services PMI on Friday at 15 GMT. If this report reaffirms that rising wage costs are feeding into accelerating price pressures in the sector, the US Dollar is likely to hold its ground against Gold. Hence, the Prices Paid Index component will be watched closely by market participants.
It's worth noting, however, that the CME Group FedWatch Tool shows that markets are fully pricing in at least two more 25 basis points Federal Reserve rate hikes in March and May. Additionally, the probability of the Fed holding the policy rate unchanged in June stands at 25%.
The market turnaround has confirmed that the US Dollar does not have a lot of room on the upside, at least until the February jobs report and inflation data confirm or refute one more 25-bps hike in June.
Gold price targets key resistance
Dhwani Mehta, Senior Analyst at FXStreet, points at a key moving average as the main resistance to beat by Gold price bulls:
At that level, the bearish 21-Daily Moving Average (DMA) coincides, making it a powerful resistance. Gold bulls yearn for a daily candlestick closing above the latter to add extra legs to the ongoing recovery in the bright metal.
Fresh buying opportunities will be created above the 21 DMA hurdle, fuelling a rally toward the mildly bullish 50 DMA at $1,858.
Gold price in 2023: Up-and-down action
Financial markets have been a two-tale story for the early part of 2023, in which Gold price has reflected in its price action like no other asset. XAU/USD rode an uptrend during all of January with the market optimism about inflation slowing down and constant Federal Reserve dovish talk, only to see a drastic turnaround back to the old dynamics in February after a hot US Nonfarm Payrolls (NFP) report. The US economy adding more than 500K jobs in the month of January shifted the market expectations for the Fed easing its monetary policy, and the US Dollar has come back to the market King throne.
Gold price opened the year at $1,823.76 and reached a year-to-date high of $1,960 on February 2, right in between the first Federal Reserve meeting of the year and the surprising release of the US jobs report for January. Gold price went on a big downtrend from there, reaching year-to-date lows just above $1,800, where it found support.
-638134300260205114.png)
Gold price daily chart
Widening policy rate differential with ECB suggests CHF weakness ahead, in the opinion of economists at CIBC Capital Markets.
SNB to remain potentially activist in the FX space
“Beyond the prospect of ongoing monetary tightening, we can expect the central bank to remain potentially activist in the FX space. However, we would expect any activity to be commensurate with the pursuance of the goal of price stability rather than attempting to reduce the balance sheet.”
“We expect additional SNB policy activity, resulting in a 1.75% terminal rate. However, in view of the assumption of the ECB hiking rates towards 3.50%, the widening in nominal rate differential favours a modest uptrend in EUR/CHF.”
“Q2 2023: 1.00 | Q3 2023: 1.01 (EUR/CHF)”
- USD/JPY retreats from the YTD peak touched on Thursday amid a modest USD weakness.
- A softer risk tone benefits the safe-haven JPY and also contributes to the intraday decline.
- The divergent Fed-BoJ policy outlook could lend support and help limit any further losses.
The USD/JPY pair comes under some selling pressure on Friday and reverses the previous day's positive move to its highest level since December 20 - just above the 137.00 mark. The intraday downfall picks up pace during the early European session and drags spot prices to a fresh daily low, around the 136.25-136.20 area in the last hour.
Retreating US Treasury bond yields trigger a modest US Dollar pullback and turn out to be a key factor dragging the USD/JPY pair lower. Apart from this, a softer risk tone benefits the safe-haven Japanese Yen (JPY) and contributes to the offered tone surrounding the major. Any meaningful corrective pullback, however, still seems elusive amid hawkish Fed expectations, which should act as a tailwind for the US bond yields and the Greenback.
In fact, the markets seem convinced that the US central bank will keep interest rates higher for longer to tame stubbornly high inflation. Moreover, a slew of FOMC members this week opened the door for a jumbo 50 bps lift-off at the March policy meeting. This lifted the yield on the benchmark 10-year US government bond to its highest level since last November and the rate-sensitive two-year Treasury note to levels last seen in July 2007 on Thursday.
In contrast, the Bank of Japan (BoJ) will stick to its dovish stance for the foreseeable future. In fact, the incoming BoJ Governor Kazuo Ueda stressed the need to maintain the ultra-loose policy to support the fragile economy and said earlier this week that the central bank isn't seeking a quick move away from a decade of massive easing. Hence, the market focus will remain glued to the upcoming BoJ monetary policy meeting, scheduled next Friday.
In the meantime, the divergent Fed-BoJ outlook should lend support to the USD/JPY pair and limit any meaningful downside, at least for the time being. Market participants now look forward to the release of the US ISM Services PMI, which, along with a scheduled speech by Dallas Fed President Lorie Logan, might influence the USD. Apart from this, the broader risk sentiment could assist traders to grab short-term opportunities on the last day of the week.
Technical levels to watch
IDR succumbed to Dollar strength in February. Economists at MUFG Bank expect the Rupiah to struggle near-term, but see the USD/IDR moving back lower to 14,700 by end-2023.
Rising US 10-year yields to pose headwinds to the IDR
“We anticipate a roughly balanced current account for 2023, with IDR headwinds from potential financial account outflows in H1 reversing to inflows in H2. Hence, the IDR may face some downside pressures in the near-term as yield differentials with the US narrow further.”
“We forecast USD/IDR at 15,300 at the end of Q2.”
“At the end of the year, we see USD/IDR at 14,700, helped by a potential shift in US rate stance towards neutrality, China’s reopening, and a possible commodity market rally.”
UOB Group’s Economist Lee Sue Ann and Markets Strategist Quek Ser Leang see diminishing bets for further weakness in AUD/USD in the short term.
Key Quotes
24-hour view: “We highlighted yesterday that ‘despite the relatively strong bounce, there has been no significant increase in upward momentum and AUD is unlikely to strengthen much further’, and we expected AUD to trade within a range of 0.6715/0.6790. AUD subsequently traded in a relatively quiet manner between 0.6707 and 0.6766. The price actions appear to be consolidative and we expect AUD to trade sideways between 0.6700 and 0.6760 today.”
Next 1-3 weeks: “Our update from yesterday (02 Mar, spot at 0.6755) is still valid. As highlighted, downward momentum is waning rapidly and the odds for AUD to weaken further have diminished considerably. However, only a breach of the ‘strong resistance’ at 0.6800 would confirm that the AUD weakness that started two weeks ago has run its course.”
Economists at ING revise their EUR/USD forecast lower.
1.15 EUR/USD forecast pushed back to the fourth quarter
“Sticky US inflation suggests that clear signs of disinflation may not emerge until the summer. We are therefore revising lower our EUR/USD forecast for the second quarter, where we now see volatility in a 1.05-1.10 range depending on the data.
“We are pushing back our 1.15 EUR/USD forecast to the fourth quarter when our macro and rate strategy teams now look for the substantial compression in two-year EUR:USD swap differentials – a key driver of the spot rate.”
Considering advanced figures from CME Group for crude oil futures markets, open interest went up for the second session in a row on Thursday, now by just 234 contracts. On the other hand, volume dropped markedly by nearly 170K contracts after two consecutive daily builds.
WTI faces the next up-barrier above $80.00
Prices of the WTI kept the bid bias unchanged and advanced modestly on Thursday. The daily uptick was on the back of a small increase in open interest, whereas volume retreated sharply, hinting at the idea that the ongoing rebound could lose some impulse in the very near term. In the meantime, the next target of note emerges at the February high near $80.60 (February 13).
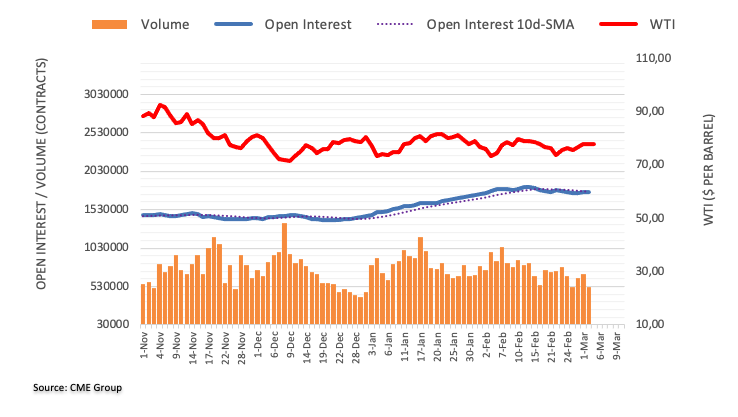
Both the SEK and NOK have had a terrible start to the year. Economists at Nordea expect Scandies to remain under downside pressure.
More short-term turbulence in financial markets
“We are unsure whether the worst is behind given our view for more short-term turbulence in financial markets. While both the Riksbank and Norges Bank will have to follow suit with the ECB and Fed to prevent further weakening of their currencies, this will likely not be enough to help the SEK and the NOK during periods of risk-off.”
“While we think the SEK and the NOK will move broadly sideways until the summer, the risk is clearly to the downside. Longer out, a normalisation of global interest rates should lead to a somewhat stronger SEK and NOK against the EUR. However, we see them both remaining weak in a historical context.”
- NZD/USD regains some positive traction on Friday amid a modest USD weakness.
- The upbeat Chinese data undermines the safe-haven buck and lends some support.
- Recession fears, hawkish Fed expectations to limit the USD losses and cap the pair.
The NZD/USD pair attracts some buyers near the 0.6200 round-figure mark on Friday and recovers a part of the previous day's retracement slide from a two-week high. The pair maintains its bid tone through the early European session and currently trades near the top end of its daily range, around the 0.6225-0.6230 region, though lacks bullish conviction.
A private survey showed that activity in China's services sector expanded at the fastest pace in six months in February and turns out to be a key factor lending some support to antipodean currencies, including the Kiwi. This, along with a modest US Dollar weakness, lends some support to the NZD/USD pair. That said, the prospects for further policy tightening by the Federal Reserve should limit the downside for the Greenback and keep a lid on any meaningful upside for the major, warranting some caution for aggressive bullish traders.
The markets seem convinced that the US central bank will stick to its hawkish stance for longer in the wake of stubbornly high inflation - as depicted by the US CPI, PPI and the PCE Price Index released recently. Moreover, the incoming positive US macro data, including the Initial Jobless Claims on Thursday, pointed to an economy that remains resilient and should allow the Fed to continue lifting interest rates. Adding to this, a slew of FOMC members this week opened the door for a jumbo 50 bps lift-off at the next policy meeting later this month.
This, in turn, remains supportive of elevated US bond yields. In fact, the yield on the benchmark 10-year US government bond rose to its highest level since last November and the rate-sensitive two-year Treasury note shot to levels last seen in July 2007 on Thursday. Furthermore, growing market worries about economic headwinds stemming from rapidly rising borrowing costs favour the USD bulls. Hence, it will be prudent to wait for strong follow-through buying before confirming that the NZD/USD pair has bottomed out in the near term.
Market participants now look forward to the US economic docket, featuring the release of the ISM Services PMI later during the early North American session. Apart from this, a scheduled speech by Dallas Fed President Lorie Logan and the US bond yields will influence the USD price dynamics. Traders will further take cues from the broader risk sentiment to grab short-term opportunities around the NZD/USD pair heading into the weekend.
Technical levels to watch
GBP/USD could accelerate its downside once 1.1900 is cleared, suggest UOB Group’s Economist Lee Sue Ann and Markets Strategist Quek Ser Leang.
Key Quotes
24-hour view: “We did not expect GBP to drop sharply to 1.1924 yesterday (we were expecting GBP to trade sideways). Downward momentum has improved, albeit not much. GBP could weaken further but a sustained decline below the major support at 1.1900 is unlikely. Resistance is at 1.1975, a breach of 1.2005 would indicate that GBP is not weakening further.”
Next 1-3 weeks: “Our latest narrative was from Tuesday (28 Feb, spot at 1.2065) where we held the view that GBP is likely to consolidate and trade in a broad range of 1.1970 and 1.2150. Yesterday, GBP took out 1.1970 and dropped to a low of 1.1924. Downward momentum is beginning to build. However, GBP has to crack another major support at 1.1900 before a sustained decline is likely. The chance of GBP breaking 1.1900 will remain intact as long as the ‘strong resistance’ (currently at 1.2045) is not breached within the next few days. Looking ahead, the next level to watch below 1.1900 is at the Jan’s low near 1.1840.”
CME Group’s flash data for gold futures markets noted traders increased their open interest positions by around 5.6K contracts on Thursday, reaching the third consecutive daily build. Volume, instead, shrank for the second straight session, this time by around 44.3K contracts.
Gold: Next on the upside comes the $1860
The weekly uptrend in gold prices seem to have taken a breather on Thursday. Indeed, the inconclusive price action was on the back of a marked pullback in volume and rising open interest. Against that, the continuation of the underlying upside bias looks favoured in the near term with the immediate hurdle at the 55-day SMA around $1860 per ounce troy.
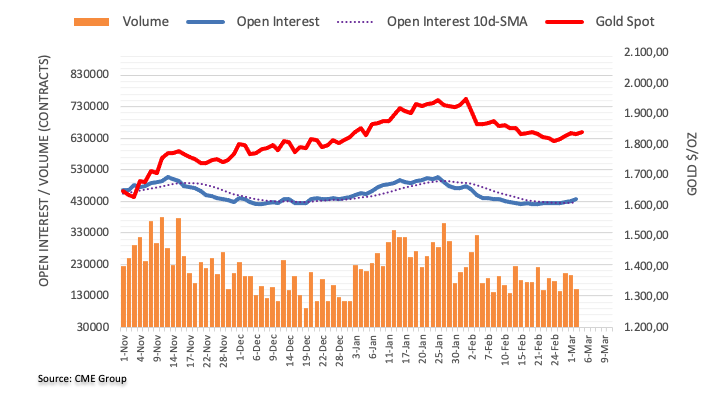
Economists at HSBC expect the Euro to appreciate in the coming weeks.
EUR could benefit from a clear indication of further tightening
“Barring exceptionally hawkish US data or geopolitical deterioration, we believe EUR/USD could stage a modest recovery in the coming few weeks.”
“The EUR has been slow to capitalise on the combination of an improving growth/inflation mix alongside a still-hawkish ECB. It may be better placed to gain as upward USD momentum falters.”
“For the ECB meeting on 16 March, the key for the EUR is how President Lagarde guides expectations for the May meeting and beyond. Any strong hints that the tightening pace is set to slow to 25 bps could weigh on the EUR. Conversely, the EUR could benefit from a clear indication of further tightening. The balance of risks may tip the needle in favour of the EUR.”
In the view of UOB Group’s Economist Lee Sue Ann and Markets Strategist Quek Ser Leang, EUR/USD is expected to navigate within the 1.0530-1.0700 range in the next few weeks.
Key Quotes
24-hour view: “Our expectations for EUR to advance further was incorrect it dropped to a low of 1.0574. While there is scope for EUR to weaken further, any decline is likely part of a lower trading range of 1.0565/1.0655. To look at it another way, a sustained drop below 1.0565 is unlikely.”
Next 1-3 weeks: “We indicated yesterday (02 Mar, spot at 1.0665) that EUR rebound further but a sustained rise above 1.0750 is not high. We did not expect the rapid manner in which EUR gave up most of its gains from the previous day. Instead of rebounding further, EUR is likely to consolidate and trade between 1.0530 and 1.0700 for now.”
- The index gives away part of Thursday’s gains and returns to 104.70.
- The rally in US yields take a breather so far on Friday.
- ISM Non-Manufacturing, Services PMI, Fedspeak next on tap in the docket.
The USD Index (DXY), which tracks the greenback vs. a basket of its main rivals, comes under some selling pressure and returns to the sub-105.00 area on Friday.
USD Index now looks at data
The index maintains the weekly choppiness well in place at the end of the week, this time below the 105.00 region and amidst some impasse in the ongoing rally in US yields.
Indeed, the dollar appears offered after investors seem to have already digested the recent bout of hawkishness from some Fed speakers while keep favouring a 25 bps rate hike at the March 22 meeting.
On the latter, the probability of a 50 bps rate raise stays around 30% (from 0% a month ago) according to CME Group’s FedWatch Tool.
In the US data space, the main focus will be on the ISM Non-Manufacturing seconded by the final S&P Global Services PMI along with a slew of Fed speakers: Dallas Fed L.Logan (voter, centrist), Atlanta Fed R.Bostic (2024 voter, hawk), FOMC M.Bowman (permanent voter, centrist) and Richmond Fed T.Barkin (2024 voter, centrist).
What to look for around USD
The index keeps the erratic performance well in place around the 105.00 region so far this week.
The probable pivot/impasse in the Fed’s normalization process narrative is expected to remain in the centre of the debate along with the hawkish message from Fed speakers, all after US inflation figures for the month of January showed consumer prices are still elevated, the labour market remains tight and the economy maintains its resilience.
The loss of traction in wage inflation – as per the latest US jobs report - however, seems to lend some support to the view that the Fed’s tightening cycle have started to impact on the still robust US labour markets somewhat.
Key events in the US this week: Final Services PMI, ISM Non-Manufacturing (Friday).
Eminent issues on the back boiler: Rising conviction of a soft landing of the US economy. Persistent narrative for a Fed’s tighter-for-longer stance. Terminal rates near 5.5%? Fed’s pivot. Geopolitical effervescence vs. Russia and China. US-China trade conflict.
USD Index relevant levels
Now, the index is losing 0.20% at 104.75 and the breakdown of 104.09 (weekly low March 1) would open the door to 103.45 (55-day SMA) and finally 102.58 (weekly low February 14). On the flip side, the next resistance emerges at 105.35 (monthly high February 27) seconded by 105.63 (2023 high January 6) and then 106.54 (200-day SMA).
Here is what you need to know on Friday, March 3:
The choppy action in financial markets continue in the second half of the week as investors assess the latest central bank commentary and data releases. The US Dollar Index stays on the back foot early Friday following Thursday's rebound and the 10-year US T-bond yield retreats toward 4%. ISM will release the February US Services PMI report later in the day and several FOMC members, including Atlanta Fed President Raphael Bostic and Fed Governor Michelle Bowman, will be delivering speeches ahead of the weekend.
ISM Services PMI Preview: Strong figure set to catapult US Dollar to new highs.
The data published by the US Bureau of Labor Statistics revealed on Thursday that Unit Labor Costs rose by 3.2% in the fourth quarter. This reading came in much higher than the market expectation of 1.6% and provided a boost to US Treasury bond yields. In turn, the US Dollar continued to outperform its major rivals and Wall Street's main indexes turned south after the opening bell. In the second half of the American session, however, the improving risk mood limited the USD's upside and helped US stocks rebound. Bostic said late Thursday that he was in favor of a 25 bps rate hike at the next policy meeting and noted that they could be in a position to pause the current tightening cycle by mid to late summer.
US February ISM Services PMI Preview: Will it influence Fed rate hike bets?
During the Asian trading hours, the data from China revealed that the business activity in the service sector expanded at a more robust pace in February than expected with the Caixin Services PMI climbing to 55 from 52.9 in January. The Shanghai Composite Index is up more than 0.5% and Hong Kong's Hang Seng Index remains on track to post a daily gain of 1%. Nevertheless, US stock index futures trade mixed in the European morning.
Supported by the upbeat Chinese data, AUD/USD stays in positive territory slightly above 0.6750 and NZD/USD clings to modest daily gains above 0.6200.
EUR/USD failed to capitalize on stronger-than-expected inflation data for February on Thursday and closed the day in negative territory, erasing a large portion of the gains it recorded on Wednesday. The pair stays quiet early Friday and trades modestly higher on the day above 1.0600. European Central Bank (ECB) Vice-President Luis de Guindos will speak on monetary policy at 0900 GMT. Eurostat will release the Producer Price Index (PPI) data for January.
GBP/USD suffered heavy losses and closed below 1.2000 on Thursday. The pair seems to have gone into a consolidation phase early Friday and was last seen trading near 1.1980. Former British Prime Minister Boris Johnson said on Thursday that the new Brexit deal for Northern Ireland was not about the UK taking back control and added that he will find it "very difficult" to vote for it.
USD/JPY snapped a three-day losing streak on Thursday but seems to be struggling to preserve its bullish momentum, trading near 136.50 early Friday.
Gold price benefited from the strong PMI data from China and extended its rebound during the Asian trading hours on Friday. XAU/USD was last seen trading above $1,840.
Bitcoin came under heavy bearish pressure early Friday and fell below $22,000 for the first time since mid-February before recovering modestly. At the time of press, BTC/USD was down nearly 5% on the day at $22,350. Following Thursday decline, Ethereum continues to push lower on Friday and was last seen trading at $1,560, where it was down 5.1% on the day.
- USD/CAD meets with a fresh supply on Friday and is pressured by a combination of factors.
- Bullish Oil prices underpin the Loonie and act as a headwind amid a modest USD weakness.
- Recession fears, hawkish Fed expectations should limit losses for the USD and lend support.
The USD/CAD pair attracts some sellers near the 1.3600 round-figure mark on Friday and maintains its offered tone through the early European session. The pair is currently placed around the 1.3575 region, down just over 0.10% for the day, though any meaningful downside still seems elusive.
Crude Oil prices hold steady near a two-week high touched on Thursday amid the latest optimism about a strong fuel demand recovery in China - the world's top importer. This, in turn, is seen underpinning the commodity-linked Loonie, which, along with a modest US Dollar downtick, exerts some downward pressure on the USD/CAD pair. That said, growing worries that rapidly rising borrowing costs will dampen global economic growth and dent fuel demand could cap gains for Oil prices. Apart from this, hawkish Fed expectations support prospects for the emergence of some USD dip buying and should contribute to limiting losses for the major.
The US CPI, PPI and the PCE Price Index released recently indicated that inflation isn't coming down quite as fast as hoped. Moreover, the incoming upbeat US macro data, including the Initial Jobless Claims on Thursday, pointed to a resilient economy. Adding to this, a slew of FOMC members backed the case for higher rate hikes to tame stubbornly high inflation and remains supportive of elevated US bond yields. In fact, the yield on the benchmark 10-year US government bond rose to its highest level since last November and the rate-sensitive two-year Treasury note shot to levels last seen in July 2007, which, in turn, favours the USD bulls.
Apart from this, speculations that the Bank of Canada (BoC) could pause the policy-tightening cycle, bolstered by the softer Canadian CPI report released last week, warrant caution before placing aggressive bearish bets around the USD/CAD pair. Hence, it will be prudent to wait for strong follow-through selling before confirming that the recent upward trajectory witnessed over the past two weeks or so has run its course. Traders now look to the release of the US ISM Services PMI, due later during the early North American session. Apart from this, Oil price dynamics should provide some meaningful impetus on the last day of the week.
Technical levels to watch
Gold price is regaining upside traction. Will XAU/USD buyers recapture critical 21-Daily Moving Average (DMA) resistance? FXStreet’s Dhwani Mehta analyzes the pair’s technical outlook.
Gold to come under intense selling pressure on failure to surpass 21-DMA
“Gold bulls yearn for a daily candlestick closing above 21-DMA at $1,844 to add extra legs to the ongoing recovery in the bright metal.”
“Fresh buying opportunities will be created above the 21-DMA hurdle, fuelling a rally toward the mildly bullish 50-DMA at $1,858.”
“Gold price could come under intense selling pressure on failure to surpass 21-DMA. The previous day’s low of $1,830 will be the first in sight for Gold sellers, below which a test of the $1,820 round level will be inevitable.”
- Gold price eyes the first weekly gain in five, has smooth road till $1,865 resistance confluence.
- Pullback in US Treasury bond yields, US Dollar join fresh chatters surrounding Fed policy pivot to propel XAU/USD price.
- US ISM Services PMI can direct intraday moves, Fed Chair Powell’s testimony, US NFP will be the key to clear directions.
Gold price (XAU/USD) appears well-set to print the first weekly gain in five as the metal buyers cheer a softer US Dollar. Adding strength to the bullion’s latest rebound could be the retreat in the US Treasury bond yields from multi-day highs.
The latest round of Federal Reserve (Fed) talks renew the policy pivot speculations and joined mixed US data to exert downside pressure on the US Dollar, as well as the Treasury bond yields. It’s worth noting that the impressive PMIs from China and the policymakers’ readiness to resume the trade talks between Beijing and Washington also seem to keep the Gold buyers hopeful.
However, the cautious mood ahead of the top-tier data/events and fears of the Sino-American tussle over China’s ties to Russia cap the XAU/USD’s immediate upside. That said, Friday’s US ISM Services PMI for February, expected at 54.5 versus 55.2 prior readings, will be important to watch for intraday directions. Though, major attention will be given to the next week’s Federal Reserve (Fed) Chairman Jerome Powell’s Testimony and the monthly US jobs report for February, encompassing the key Nonfarm Payrolls (NFP).
Also read: Gold Price Forecast: Will XAU/USD buyers recapture critical 21 DMA hurdle?
Gold Price: Key levels to watch
The Technical Confluence Detector shows that the Gold price grinds higher past short-term key hurdles, now supports, which in turn suggests a smooth road unless hitting the wall of resistance around $1,865 comprising Fibonacci 38.2% on one month.
That said, a convergence of the Pivot Point one-day R2, Fibonacci 161.8% on daily and the middle band of the Bollinger on one-day, close to $1,845, appears a small check for the bulls.
Also likely to act as minor resistances are the levels comprising Pivot Point one-day R3 and Pivot Point one-week R2, respectively around $1,849 and $1,862.
Alternatively, previous high on four-hour and Fibonacci 23.6% on one month timeframe together highlight $1,841 as the immediate support.
Following that, Fibonacci 23.6% on one-day and Fibonacci 61.8% on one week, around $1,833 at the attest, can act as the last defense of the Gold buyers.
It’s worth observing that 50-HMA and Fibonacci 61.8% on one-day, close to $1,835, acts as an extra filter towards the south.
Here is how it looks on the tool
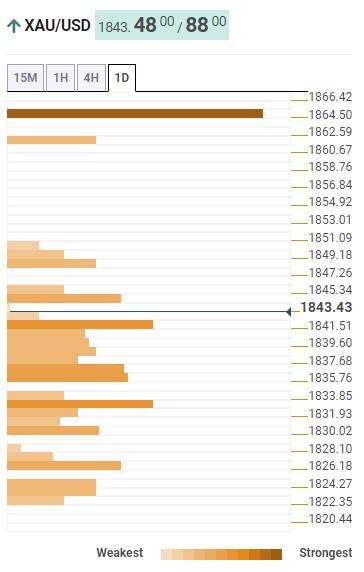
About Technical Confluences Detector
The TCD (Technical Confluences Detector) is a tool to locate and point out those price levels where there is a congestion of indicators, moving averages, Fibonacci levels, Pivot Points, etc. If you are a short-term trader, you will find entry points for counter-trend strategies and hunt a few points at a time. If you are a medium-to-long-term trader, this tool will allow you to know in advance the price levels where a medium-to-long-term trend may stop and rest, where to unwind positions, or where to increase your position size.
In the latest research note, analysts at the US banking giant, Morgan Stanely, revised up their forecasts for the European Central Bank's (ECB) so-called "terminal" rate to 4.0% by the end of this year.
"Following material revisions to our inflation forecast, we now expect the ECB's terminal rate at 4%," Morgan Stanley said.
Related reads
- ECB set to deliver 50 bps rate hike in May – Goldman Sachs
- EUR/USD aims to shift business above 1.0600 amid subdued USD Index, US Services PMI eyed
FX option expiries for Mar 3 NY cut at 10:00 Eastern Time, via DTCC, can be found below.
- EUR/USD: EUR amounts
- 1.0500 1.8b
- 1.0550 577m
- 1.0595 2.2b
- 1.0625 893m
- 1.0675 969m
- 1.0700 1.8b
- GBP/USD: GBP amounts
- 1.2060 645m
- USD/JPY: USD amounts
- 135.00 795m
- 136.00 718m
- AUD/USD: AUD amounts
- 0.6800 951m
- USD/CAD: USD amounts
- 1.3500 591m
- 1.3600 702m
- NZD/USD: NZD amounts
- 0.6100 1b
- Silver price clings to 200-DMA as buyers struggle to extend key trend line breakout.
- Looming bull cross on MACD, nearly oversold RSI conditions favor bullish bias.
- Previous resistance line from early February, 61.8% Fibonacci retracement level restricts immediate downside.
Silver price (XAG/USD) prints mild gains around $21.00 as it braces for the first weekly gain in seven during early Friday in Europe.
In doing so, the bright metal seesaws around the 200-DMA while keeping the previous day’s break out of the one-month-old descending resistance line, now support around $20.60. Adding strength to the $20.60 support is the 61.8% Fibonacci retracement level of the metal’s run-up from October 2022 to February 2023.
The impending bull cross on the MACD indicator and the RSI (14) rebound from the oversold territory also appears to favor the Silver buyers, in addition to the sustained break of the previous key resistance and the successful rebound from the 61.8% Fibonacci retracement level, also known as golden Fibonacci retracement ratio.
As a result, the XAG/USD buyers are all set to extend the latest recovery moves toward the 50% Fibonacci retracement level of $21.36, given the daily closing beyond the 200-DMA level of $21.00.
However, the convergence of a 38.2% Fibonacci retracement and the 100-DMA, around $22.15, appears a tough nut to crack for the bulls afterward.
Meanwhile, pullback moves need to provide a daily closing below $20.60 support confluence, mentioned the previous day, to recall the Silver sellers.
Following that, the $20.00 psychological magnet and October 2022 low near $18.10 could gain the XAG/USD bear’s attention.
Silver price: Daily chart
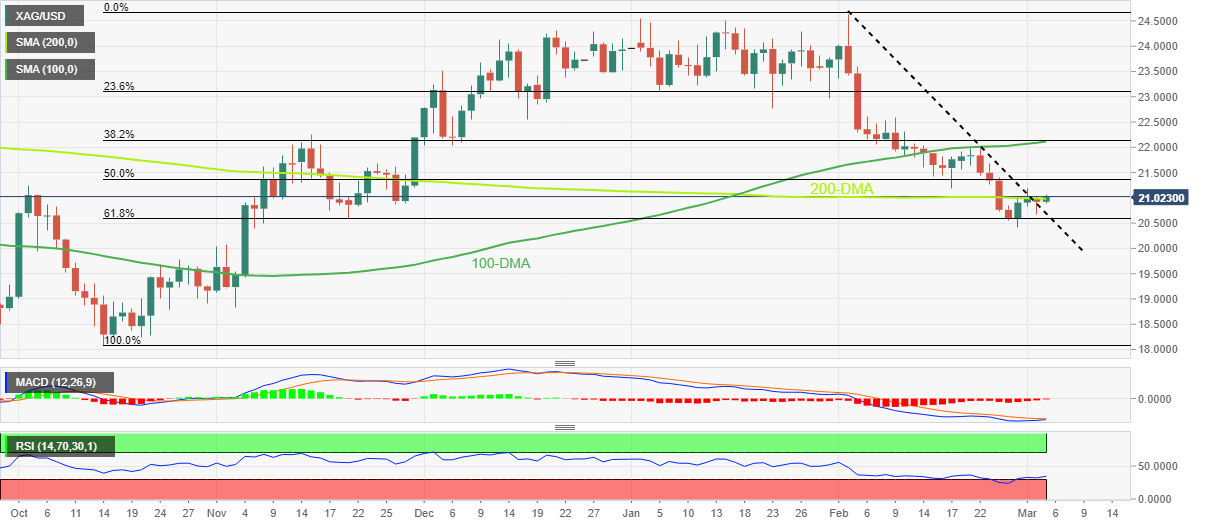
Trend: Further upside expected
- USD/JPY is looking to recapture the 137.00 resistance despite the risk appetite having improved.
- Modest dovish commentary from Federal Reserve Waller has triggered volatility in the USD Index.
- Bank of Japan might infuse more liquidity to fade the impact of a fresh decline in the Tokyo inflation.
- USD/JPY is struggling to shift its auction above the 38.2% Fibo retracement plotted at 136.85.
USD/JPY is juggling in a limited range around 136.60 in the Asian session. The asset has rebounded from 136.50 and is aiming to recapture the immediate resistance of 137.00 as the Tokyo Inflation has softened dramatically for the first time after a nine-month period escalation. Lower food and energy prices have trimmed the headline Consumer Price Index (CPI) while the core inflation that strips off the impact of food and oil steadily improved.
The US Dollar Index (DXY) is on the verge of delivering a downside break below 104.80 amid an absence of recovery signals. The downside pressure in the USD Index has built amid modest dovish commentary from Federal Reserve (Fed) Governor Christopher Waller. Fed Waller cited February’s inflation recovery as a one-time blip and the price pressures will resume their downtrend from next month.
S&P500 futures have recovered the majority of losses recorded in the Asian session, portraying a decent recovery in the risk appetite of the market participants. The demand for US government bonds has recovered marginally amid ease in the risk aversion theme. This has pushed the 10-year US Treasury yields below 4.05%.
Upbeat US Services PMI could fuel hawkish Fed bets
Anxiety among the market participants is gradually escalating ahead of the release of the United States Institute of Supply Management (ISM) Services PMI data. The economic data is seen lower at 54.5 from the former release of 55.2. The New Orders Index which conveys the forward demand is expected to decline to 58.5 from the prior figure of 60.4.
Earlier, the US Manufacturing PMI displayed a fourth-time contraction, however, the New Orders Index was exceptionally higher. A surprise rise in the Services New Orders Index along with the already upbeat Manufacturing demand outlook will clear that the overall forward demand is in an expansionary mode and could propel the Consumer Price Index (CPI), which will bolster expectations of more rates from the Federal Reserve.
Atlanta Fed Bank President Raphael Bostic said on Thursday that the central bank could be in a position to pause the current tightening cycle by mid-to-late summer. He favors a 25 basis points (bps) rate hike in March but has left room opened for more hawkish rate outlook if inflation and labor market data come in stronger.
Tokyo Inflation surprisingly decline
Bank of Japan (BoJ) policymakers are spending sleepless nights, designing strategies for achieving a stable 2% inflation. The central bank is infusing stimulus into the Japanese economy to fuel wages and domestic demand. Japan’s inflation was fueling constantly, however, a recent decline has alarmed the Bank of Japan policymakers.
The annual headline CPI has dropped to 3.4% from the consensus of 4.1% and the prior release of 4.4%. Contrary to that, the core CPI that excludes the impact of energy and food prices have improved to 3.2% from 3.1% as expected and the former release of 3.0%. It seems like the inflationary pressures have been exceptionally battered by the recent fall in food and energy prices.
Reuters reported that “The pace of inflation slowed due in part to the government's energy subsidies to ease the pain on households from soaring electricity bills.”
Commentary from Bank of Japan Governor Nominee Kazuo Ueda on a fresh decline in the Tokyo CPI will be keenly watched.
Meanwhile, Japanese Prime Minister Fumio Kishida has ordered the ruling party to draft additional measures to counter price hikes, as reported by the Kyodo news agency. The agenda behind that would be supporting households to offset the impact of items such as food and energy, which are highly inflated.
On the economic front, a poll by Reuters reported Japan's economy is likely to grow a tad faster than initially estimated in the fourth quarter. Revised Gross Domestic Product (GDP), scheduled for March 9, might grow at 0.8% annualized in October-December, versus an initial estimate of 0.6%.
USD/JPY technical outlook
-638134209411780434.png)
USD/JPY is making efforts in overstepping the 38.2% Fibonacci retracement (placed from October 21 high at 151.94 to January 16 low at 127.22) at 136.85.
A bear cross, represented by the 20-and 50-period Exponential Moving Averages (EMAs) at 133.27, adds to the downside filters.
The Relative Strength Index (RSI) (14) has shifted into the bullish range of 60.00-80.00, which indicates that the bullish momentum is already active.
- AUD/USD grinds near intraday high, defends the first weekly gains in three.
- Bulls keep the reins amid hopes of US-China peace on trade, upbeat China data and mixed Aussie statistics.
- Fresh talks of Fed’s pivot trigger retreat in yields and propel Aussie pair.
- Markets remain dicey ahead of US ISM Services PMI, limiting AUD/USD moves.
AUD/USD appears well-set to snap a two-week downtrend as it seesaws around the intraday top of 0.6752 during early Friday in Europe. In doing so, the Aussie pair cheers the US Dollar’s pullback amid risk-positive headlines about China. However, the cautious mood ahead of the US ISM Services PMI and mixed Aussie data, not to forget chatters of the Reserve Bank of Australia’s (RBA) policy pivot, seems to probe the bullish bias.
Talks surrounding the resumption of the Sino-American trade dialogue seemed to have triggered the market’s optimism of late, which appears to favor the AUD/USD buyers. On the same line could be the hopes for an easy monetary policy from the People’s Bank of China (PBOC). However, the US-China tension at the Group of 20 Nations (G20) meeting, amid the former’s push for sanctions on countries having strong ties with Russia and aiding Moscow in the war with Ukraine, pokes the optimism and checks the Aussie pair’s upside momentum.
It should be noted that the firmer China data and mixed Aussie figures, as well as the unimpressive US statistics, also challenge the pair traders. That said, China’s Caixin Services PMI traced the latest activity data for the dragon nation while printing 55.00 figures for February, versus 50.0 market forecasts and 52.9 previous readings. At home, Australia’s S&P Global PMIs for February came in firmer and help the AUD/USD buyers to keep the reins. Though, downbeat prints of Australia Home Loans and Investment Lending for Homes, for January, seem to cap the quote of late.
On the other hand, the US Jobless Claims dropped to 190K during the week ended on February 24 versus 195K market forecasts and 192K prior. Further, Nonfarm Productivity for the fourth quarter (Q4) eased to 1.7% from 3.0% prior and 2.6% market forecasts while the Unit Labor Costs jumped 3.6% versus 1.6% analysts’ estimations and 1.1% previous readings.
Elsewhere, Thursday’s statements from Federal Reserve Bank of Atlanta President Raphael Bostic renewed concerns about the Fed’s policy pivot as the decision-maker said, “The central bank could be in a position to pause the current tightening cycle by mid to late summer.” It should be observed, however, that Boston Fed President Susan Collins kept supporting the higher rates for longer as she said, “More rate hikes are required to bring inflation back in control.”
Against this backdrop, the 10-year coupons drop two basis points to 4.05% while its two-year counterpart seesaws around 4.89% by the press time. Further, S&P 500 Futures struggle for clear directions after mild losses.
The latest Reuters poll suggesting a peak in the RBA rate during the second quarter (Q2) of 2023 joins the polls suggesting the Fed’s policy pivot to challenge the AUD/USD traders. To overcome the indecision, today’s US ISM Services PMI, expected at 54.5 versus 55.2 prior readings, will be crucial ahead of the next week’s key events.
Technical analysis
AUD/USD portrays a one-month-old falling wedge bullish chart formation. However, a clear break of the 0.6775 hurdle becomes necessary for the buyers to retake control.
- Asian stocks have cheered China’s initiative of making peace with the US.
- Lower Tokyo Inflation has propelled the expectations of more helicopter money from the BoJ.
- An upbeat Caixin Services PMI has trimmed risk of a global recession.
Markets in the Asian domain have shown a broad-based recovery on Friday, following positive cues from S&P500. The 500-stock basket displayed a significant recovery on Thursday after an initiative from China for strengthening bilateral trade with the United States.
In the Asian session, the S&P500 futures have some long liquidations, however, the overall market mood looks moderately optimistic amid subdued performance from the US Dollar Index (DXY). An absence of recovery signs from the USD Index after dropping to near 104.80, indicating weak appeal for the safe-haven assets. The 10-year US Treasury yields have also dropped marginally to 4.05%.
At the press time, Japan’s Nikkei225 soared 1.62%, ChinaA50 added 0.16%, Hang Seng jumped 0.67% and Nifty50 spiked 1.16%.
Japanese stocks are performing stronger after a surprise decline in the Tokyo Inflation data. The annual headline CPI has dropped to 3.4% from the consensus of 4.1% and the prior release of 4.4%. Contrary to that, the core CPI that excludes the impact of energy and food prices have improved to 3.2% from 3.1% as expected and the former release of 3.0%. It seems like the inflationary pressures have been exceptionally battered by the recent fall in food and energy prices.
Tokyo inflation has softened for the first time after nine months of escalation. This might force the Bank of Japan (BoJ) to infuse more helicopter money in the economy in order to spurt the price pressures to keep the Japanese Yen competitive against rival currencies.
Meanwhile, the street is anticipating a sheer economic recovery from China after ditching the lockdown curbs. Reuters reported, “China may aim for a higher 2023 GDP growth target than the 4.5-5.5% proposed in November.” In the Asian session, IHS Market reported solid Caixin Services PMI data. The economic data has landed at 55.0, higher than the consensus of 50.5 and the former release of 52.9.
On the oil front, oil prices are aiming to recapture the critical resistance of $78.00 as China’s economic recovery and a decline in oil stockpiles reported by the US EIA for the week ending February 24 are broadly supporting oil demand recovery.
- GBP/USD grinds near intraday high as it pokes immediate resistance line.
- Bearish MACD signals, 200-EMA challenge the recovery moves.
- Three-month-old ascending trend line restricts immediate downside as RSI shows receding bearish bias.
GBP/USD seesaws around the daily top as it struggles to carry the first daily gains in four near 1.1970 heading into Friday’s London open. In doing so, the Cable pair bounces off an upward-sloping support line from early January while approaching the descending trend line resistance stretched from Tuesday.
Given the quote’s repeated bounces off the stated key support line, around 1.1940 by the press time, coupled with the downbeat RSI (14) suggesting an easing bearish bias, the GBP/USD price is likely to overcome the immediate resistance line, close to 1.1975 by the press time.
However, the pair’s further upside appears limited unless the Cable pair stays below the 200-bar Exponential Moving Average (EMA), around 1.2095.
Following that, the 50% Fibonacci retracement level of the pair’s January month upside, near 1.2140, could act as an extra filter towards the north, a break of which could quickly propel the GBP/USD towards a horizontal area comprising levels marked since January 24, close to 1.2260-70.
On the flip side, a downside break of the ascending support line from January, close to 1.1960, could quickly fetch the GBP/USD towards the year 2023 low, marked in January, around 1.1840. That said, the 1.1920 level may act as an intermediate halt during the anticipated fall.
GBP/USD: Four-hour chart
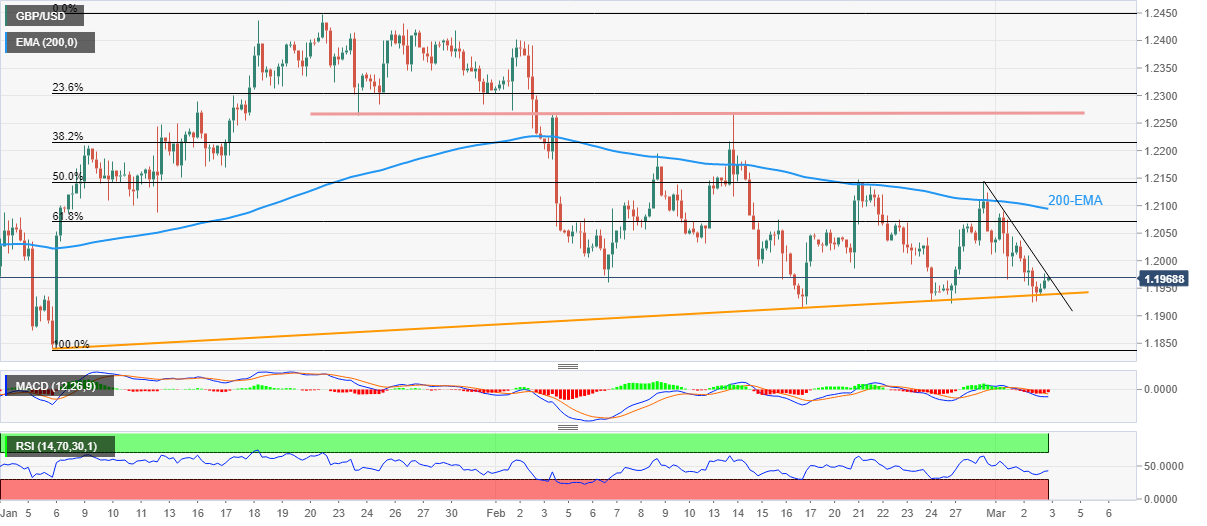
Trend: Limited recovery expected
- Gold price is oscillating near $1,840.00 as the risk profile looks obscure ahead of US Services PMI.
- More rate hikes from the Fed would dent the confidence of US firms.
- Gold price is forming an Inverted H&S pattern that indicates a bullish reversal.
Gold price (XAU/USD) is displaying back-and-forth moves around $1,840.00 in the Asian session after a gradual move from $1,830.00. The precious metal has turned sideways amid mix market mood. The US Dollar Index (DXY) looks vulnerable above 104.80 and is likely to display a downside move further.
Long liquidations in the S&P500 futures have deepened in the Asian session as investors are getting anxious ahead of the release of the United States Services PMI by the Institute of Supply Management (ISM). The 500-US stocks basket futures displayed a sheer recovery on Thursday as geopolitical tensions between the US and China eased.
China’s Vice Commerce Minister said in a statement on Thursday, “China is willing to conduct candid consultations with the US to reduce restrictions on bilateral trade and investment.” He further added, “Need to create a stable and predictable economic and trade environment between China and US to enhance the confidence of business cooperation.”
Meanwhile, fears of more rates from Federal Reserve (Fed) chair Jerome Powell expected in the March monetary policy are not fading as further rate hikes could dent the confidence of producers. Also, the strong labor market could soften if lay-off programs in the technology firms stretch to other sectors.
Gold technical analysis
Gold price is forming an Inverted head and Shoulder chart pattern that indicates a prolonged consolidation and a breakout of the same confirms a bullish reversal. The neckline of the Inverted H&S chart pattern is plotted from February 20 high around $1,848.00. The 50-period Exponential Moving Average (EMA) is acting as a major support for the Gold bulls.
A break into the bullish range of 60.00-80.00 by the Relative Strength Index (RSI) (14) will trigger the upside momentum.
Gold hourly chart
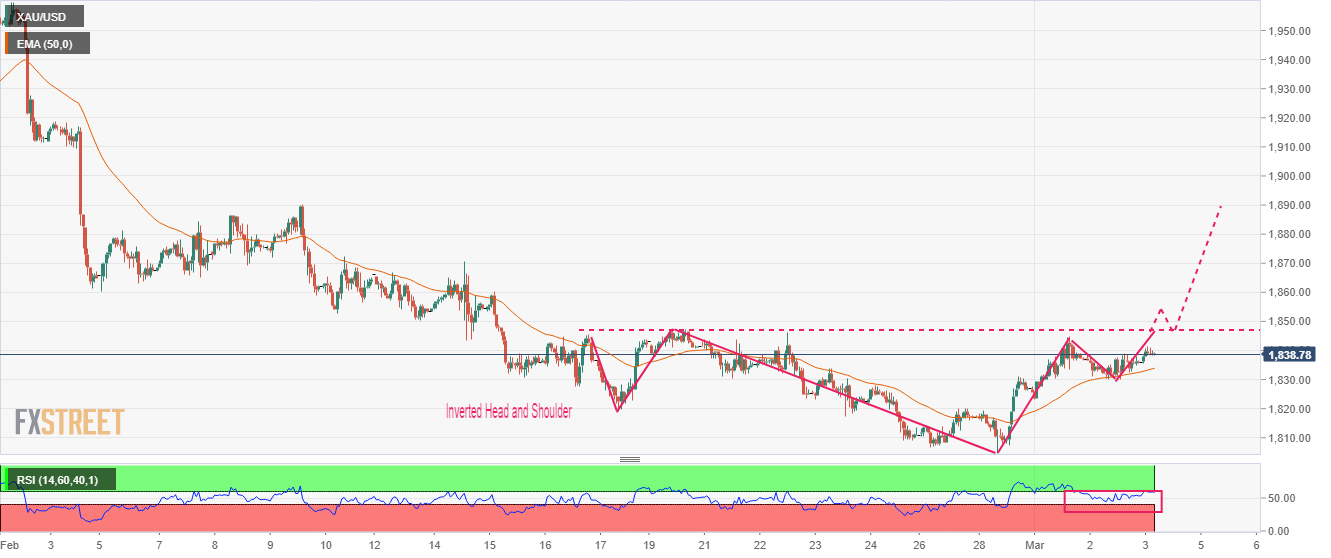
- EUR/USD is looking to shift its auction profile above 1.0600 as the risk-off mood retreats.
- The 10-year US Treasury yields have slipped to 6.05%, indicating a recovery in the risk appetite.
- Eurozone Retail Sales might continue their declining trend ahead.
The EUR/USD pair has scaled above the round-level resistance of 1.0600 in the Asian session after a recovery move. The major currency pair is looking to sustain its auction above 1.0600 as the US Dollar Index (DXY) is displaying a subdued performance despite hawkish commentaries from Federal Reserve (Fed) policymakers.
The USD Index has refreshed its day low at 104.80 and looks prone to more downside. S&P500 futures have recovered some of the losses reported in the Asian session, portraying a minor recovery in the risk appetite of investors. Meanwhile, the alpha generated on the US government bonds has slipped marginally. The 10-year US Treasury yields have slipped to 6.05%.
A decent action is expected from the US Dollar on late Friday as the United States Institute of Supply Management (ISM) will release the Services PMI data.
The economic data is seen lower at 54.5 from the former release of 55.2. The New Orders Index which conveys the forward demand is expected to decline to 58.5 from the prior figure of 60.4. A surprise rise in the New Orders Index will clear that the overall forward demand is in an expansionary mode as Manufacturing New Orders Index PMI was also better than the anticipation, which could propel the Consumer Price Index (CPI) ahead.
On the Eurozone front, after a surprise rise in the Harmonized Index of Consumer Prices (HICP), investors are shifting their focus toward the release of the Retail Sales data. Monday’s Retail Sales (Feb) data is expected to expand by 1.9% against a contraction of 2.8% released earlier on an annual basis. The consensus shows a contraction of 0.4% in February vs. a contraction of 2.7%, recorded in January.
European Central Bank (ECB) President Christine Lagarde is reiterating that the central bank will continue the 50 bps rate hike spree in March, citing that inflationary pressures are extremely sticky.
- USD/INR prints five-week losing streak as bears attack the lowest level in nearly a month.
- Hopes of robust economic recovery in India, hawkish RBI bets underpin INR strength.
- Fresh chatters surrounding Fed’s policy pivot weigh on prices.
- US ISM Services PMI should be eyed for intraday directions.
USD/INR takes offers to refresh multi-day low near 82.20 amid a broad US Dollar pullback during early Friday. In doing so, the Indian Rupee (INR) pair drops to the lowest levels since February 09 during the five-day downtrend.
US Dollar Index (DXY) traces US Treasury bond yields to print mild losses around 104.90 by the press time. That said, the 10-year coupons drop two basis points to 4.05% whereas its two-year counterpart seesaws around 4.89% by the press time. It should be observed that the US 10-year Treasury bond yields rose to a fresh high since early November 2022 while piercing the 4.0% threshold whereas the two-year counterpart rallied to the highest levels since 2007 to 4.94% on Thursday.
The latest pullback in the US Treasury bond yields and the US Dollar could be linked to the fresh fears of the Federal Reserve (Fed) policy pivot. Also underpinning the USD/INR weakness could be the cautious optimism in Asia, mainly due to the strong China data. However, the anxiety ahead of the US ISM Services PMI for February seems to probe the pair sellers of late.
At home, hopes of witnessing a strong recovery of the Indian economy, despite marking downbeat Gross Domestic Product (GDP) figures for the fiscal third quarter (Q3) figures published in the last week. Also, hawkish bias surrounding the Reserve Bank of India’s (RBI) next move seems to exert downside pressure on the USD/INR pair.
Amid these plays, the USD/INR traders seem to witness additional downside unless hitting the 100-DMA support near 82.15. However, upbeat prints of the US ISM Services PMI, expected at 54.5 versus 55.2 prior readings, could propel the pair prices.
Also read: ISM Services PMI Preview: Strong figure set to catapult US Dollar to new highs
Technical analysis
Despite the latest fall, a daily closing below the 100-DMA, around 82.15 by the press time, becomes necessary for the USD/INR bears to retake control. It’s worth noting that the RSI retreats on the daily chart and the MACD also prints bearish signals, which in turn favor the Indian Rupee pair’s latest weakness.
- WTI crude oil price struggles around two-week high, eases from four-month-old resistance line of late.
- Recently firmer MACD signals, upbeat RSI (14) hints at the quote’s further upside, 100-DMA acts as additional resistance.
- WTI bears remain off the table unless the quote stays beyond one-week-old support line.
WTI crude oil buyers take a breather around a fortnight high, printing mild losses near the $78.00 threshold during early Friday. In doing so, the black gold price retreats from a four-month-long resistance line, as well as snapping a three-day winning streak.
It’s worth noting that the bullish MACD signals and the firmer RSI (14), not overbought, joins the quote’s successful trading above the one-week-long ascending support line to keep the WTI bulls hopeful of overcoming the adjacent resistance line, close to $78.30 at the latest.
However, the 100-DMA hurdle surrounding $79.75 and the $80.00 round figure acts as an extra filter towards the north.
In a case where the Oil price remains firmer past $80.00, tops marked in January 2023 and December 2022, respectively near $82.55 and $83.30, could lure the commodity bulls.
Alternatively, pullback moves appear unimpressive beyond the aforementioned support line stretched from the last Friday, close to $77.25 at the latest.
Following that, a quick drop to the previous weekly low of $73.85 can’t be ruled out. Though, a clear downside break of $73.85 will highlight February’s bottom and December 2022 lows, close to $72.50 and $70.25, as the key support to watch during the commodity’s further downside.
WTI: Daily chart
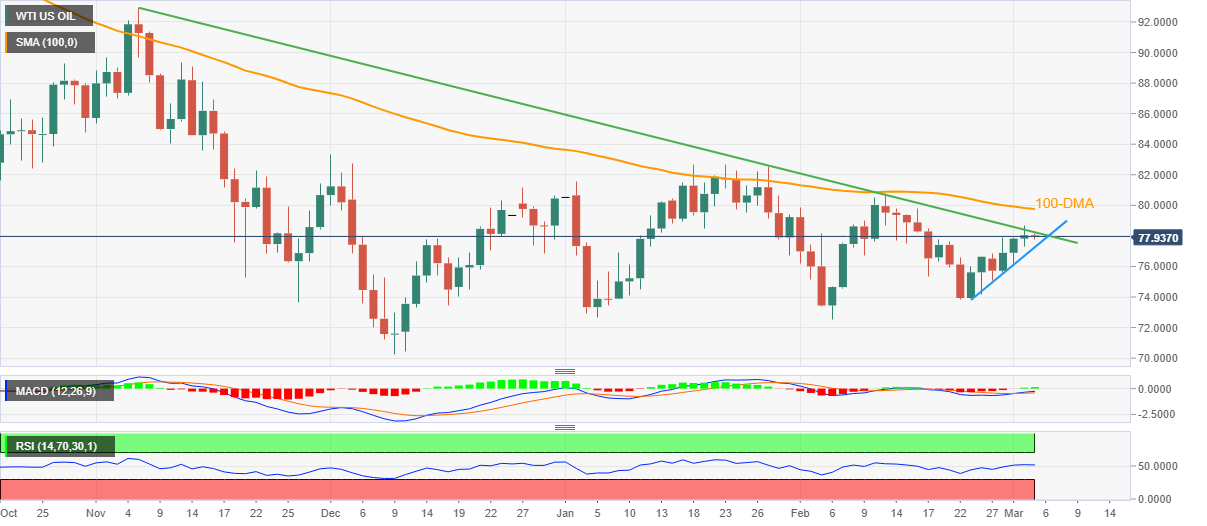
Trend: Further upside expected
- Market sentiment remains sour even as US Treasury bond yields retreat from multi-day top.
- S&P 500 Futures fade bounce off six-week low, stays pressured of late.
- Talks of Fed’s pivot, strong China data and likely resumption of Sino-American trade negotiations are the latest positives to cheer.
- Cautious mood ahead of key US data, Sino-American tussle at G20 probe optimists.
The risk profile remains dicey during early Friday, portraying a cautious mood ahead of the key US ISM Services PMI amid mixed macros and unimpressive data.
While portraying the mood, S&P 500 Futures print 0.25% intraday loss to around 2,975, fading the previous day’s bounce off the lowest levels marked during late January. Further, the 10-year coupons drop two basis points to 4.05% whereas its two-year counterpart seesaws around 4.89% by the press time. Further, S&P 500 Futures struggle for clear directions after mild losses. It’s worth noting that the US 10-year Treasury bond yields rose to a fresh high since early November 2022 while piercing the 4.0% threshold whereas the two-year counterpart rallied to the highest levels since 2007 to 4.94% on Thursday.
Although the cautious mood ahead of the key US activity data seems to weigh on the market sentiment, fresh chatters of the Federal Reserve (Fed) policy pivot and impressive China data appear as the risk-positive catalysts. Also troubling the traders are the mixed bias about the Sino-American ties in the future.
That said, Thursday’s statements from Federal Reserve Bank of Atlanta President Raphael Bostic renewed concerns about the Fed’s policy pivot as the decision-maker said, “The central bank could be in position to pause the current tightening cycle by mid to late summer.” It should be observed, however, that Boston Fed President Susan Collins kept supporting the higher rates for longer as she said, “More rate hikes are required to bring inflation back in control.”
On the same line was the latest Reuters poll on the US Dollar as it states, “A weaker greenback in a year amid an improving global economy and expectations the US Federal Reserve will stop hiking interest rates well ahead of the European Central Bank.” The February 28 to March 2 poll of 69 currency specialists also mentioned that the dollar was forecast to trade lower than current levels against all major currencies in the next 12 months.
Talking about the data, China’s Caixin Services PMI traced the latest activity data for the dragon nation while printing 55.00 figures for February, versus 50.0 market forecasts and 52.9 previous readings. Alternatively, the US Jobless Claims dropped to 190K during the week ended on February 24 versus 195K market forecasts and 192K prior. Further, Nonfarm Productivity for the fourth quarter (Q4) eased to 1.7% from 3.0% prior and 2.6% market forecasts while the Unit Labor Costs jumped 3.6% versus 1.6% analysts’ estimations and 1.1% previous readings.
Elsewhere, the US-China tension at the Group of 20 Nations (G20) meeting, amid the former’s push for sanctions on countries having strong ties with Russia and aiding Moscow in the war with Ukraine, previously probed the risk-off mood. However, chatters of the likely resumption of the Sino-American trade talks seemed to have triggered the market’s optimism afterward.
Moving forward, the market is likely to remain cautiously optimistic amid fresh Federal Reserve policy pivot talks. However, the US ISM Services PMI for February, expected at 54.5 versus 55.2 prior readings, will be crucial to watch for intraday directions. Above all, the next week’s Federal Reserve (Fed) Chairman Jerome Powell’s Testimony and the monthly US jobs report for February, encompassing the key Nonfarm Payrolls (NFP) will be the key for clear guide.
Also read: Forex Today: Dollar, yields and stocks rise after US labor market numbers
- USD/JPY retreats from 10-week high to print the first loss-making day in three.
- Downside break of three-day-old support line, bearish MACD signals favor sellers.
- Rising wedge confirmation needs validation from 200-HMA to convince sellers.
USD/JPY takes offers to extend pullback from the Year-To-Date (YTD) high, marked the previous day. That said, the Yen pair renews its intraday low near 136.50 during early Friday, snapping a two-day winning streak at the latest. In doing so, the quote remains pressured inside a one-week-old rising wedge bearish chart formation.
It’s worth noting that the USD/JPY pair’s downside break of a short-term support line, now resistance around 137.00, on Thursday joined the bearish MACD signals to keep sellers hopeful of witnessing further declines.
The same highlights the lower line of the aforementioned rising wedge, close to 135.85 by the press time, as the key support.
It should be observed, however, that the 200-Hour Moving Average (HMA) level surrounding 135.60 acts as an extra filter towards the south before convincing the USD/JPY bears to aim for 132.80 theoretical target of the rising wedge, if at all the prices remain weak past 135.85.
Meanwhile, a descending resistance line from the latest peak restricts the USD/JPY pair’s immediate upside near 136.75, a break of which will highlight the previous support line from Wednesday and the wedge’s top line, respectively around 137.00 and 137.20 at the latest.
Should the quote remains firmer past 137.20, a run-up towards December 2022 peak surrounding 138.20 can’t be ruled out.
USD/JPY: Hourly chart
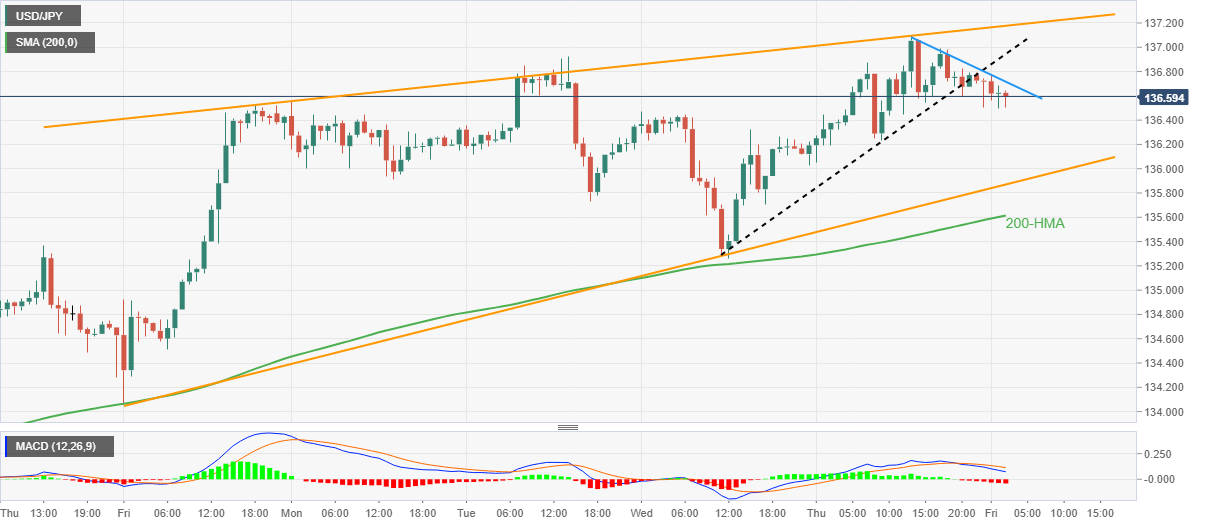
Trend: Further downside expected
- USD/CNH has refreshed its day low near 6.8900 as Caixin Services PMI performed better than anticipations.
- The US Dollar Index (DXY) is struggling to sustain above the immediate support of 104.80.
- A bear cross, represented by the 20-and 50-period EMAs at 6.9144, adds to the downside filters.
The USD/CNH pair has sensed immense selling pressure and has refreshed its day low at 6.8900 in the Asian session. The Chinese Yuan has been strengthened after the release of the solid Caixin Services PMI data. The economic data has landed at 55.0, higher than the consensus of 50.5 and the former release of 52.9.
Solid Services PMI figures after strong Manufacturing PMI released on Wednesday indicating an all-round recovery in the Chinese economy after dismantling pandemic controls. The US Dollar Index (DXY) is struggling to sustain above the immediate support of 104.80. S&P500 futures are continuously adding losses, fading the impact of Thursday’s recovery and portraying a sheer drop in investors’ risk appetite.
USD/CNH sensed selling pressure after failing to sustain above the 50% Fibonacci retracement (plotted from February 27 high around 6.9900 to March 01 low at 6.8634) at 6.9260. The asset is declining toward the horizontal support placed from February 20 low around 6.8545.
A bear cross, represented by the 20-and 50-period EMAs at 6.9144, adds to the downside filters.
Meanwhile, the Relative Strength Index (RSI) (14) is on the verge of drifting below 40.00. A slippage below the same will trigger the downside momentum.
Going forward, a slippage below the intraday low at 6.8900 will drag the asset toward the horizontal support placed from February 20 low around 6.8545 followed by February 14 low at 6.8056.
Alternatively, an upside move above the 61.8% Fibo retracement around 6.9400 will drive the asset toward February 27 high around 6.9900. A breach of the latter will expose the asset to psychological resistance at 7.0000.
USD/CNH hourly chart
-638134074711777332.png)
| Raw materials | Closed | Change, % |
|---|---|---|
| Silver | 20.897 | -0.47 |
| Gold | 1836.02 | -0.08 |
| Palladium | 1448.48 | 1.11 |
- AUD/JPY prints three-day uptrend as it grinds higher after upbeat China data.
- China Caixin Services PMI traces other activity data to propel Australian Dollar (AUD).
- Pullback in key Treasury bond yields from multi-month high probe AUD/JPY buyers.
- Japan inflation, Unemployment Rate eased, Aussie PMIs improved, housing numbers deteriorate.
AUD/JPY picks up bids to print mild gains around 92.15 as it cheers the three-day winning streak during early Friday. In doing so, the cross-currency pair cheers upbeat data from the biggest Aussie customer, namely China. However, mixed figures from Japan and Australia join a pullback in the US Treasury bond yields to restrict the quote’s immediate upside.
That said, China’s Caixin Services PMI traced the latest activity data for the dragon nation while printing 55.00 figures for February, versus 50.0 market forecasts and 52.9 previous readings.
On the other hand, Japan’s Consumer Price Index (CPI) for February eased to 3.4% YoY versus 4.1% expected and 4.4% prior while the Unemployment Rate also eased to 2.4% compared to 2.5% market forecasts and previous readings. Furthermore, Australia’s S&P Global PMIs for February came in firmer and helped the AUD/JPY buyers to keep the reins. Though, downbeat prints of Australia Home Loans and Investment Lending for Homes, for January, seem to cap the quote of late.
Elsewhere, the US-China tension at the Group of 20 Nations (G20) meeting, amid the former’s push for sanctions on countries having strong ties with Russia and aiding Moscow in the war with Ukraine, previously probed the AUD/JPY price. However, chatters of the likely resumption of the Sino-American trade talks seemed to have pushed back the risk-off mood afterward and allowed the pair to recover.
While portraying the mood, the 10-year coupons drop two basis points to 4.05% while its two-year counterpart seesaws around 4.89% by the press time. Further, S&P 500 Futures struggle for clear directions after mild losses.
Looking ahead, AUD/JPY traders should pay attention to the US Treasury bond yields amid a light calendar ahead of the US ISM Services PMI for February, expected at 54.5 versus 55.2 marked in January. Should the bond coupons extend the latest pullback, the AUD/JPY may witness hardships in rising further.
Technical analysis
Unless providing a daily close beyond the 100-DMA, around 92.10 by the press time, the AUD/JPY upside remains elusive.
People's Bank of China (PBOC) Yi Gang said in a statement on Friday, “will keep the yuan exchange rate stable.”
Additional quotes
“Will keep prices stable.”
“Yuan has become more flexible, help stabilize the economy.”
“Will keep liquidity reasonably ample.“
“Size of central bank's structural policy tools at an appropriate level, at 6.4 trillion yuan.”
“Will safeguard bottom-line for preventing systemic risks.”
“Will support a healthy development of platform companies.”
“Will resolve financial risks in key sectors.”
“Will lower financing costs, keep interest rates at appropriate.”
Related reads
- China Caixin Services beats and compliments a slew of positive data from China
- Gold price regains upside momentum after snapping three-day uptrend the previous day.
- Hopes of China’s strong economic rebound, US-China trade deal and mixed Federal Reserve talks seem to favor XAU/USD run-up.
- United States Treasury bond yields ease from multi-month high as Fed policy pivot talks regain market’s attention.
- US ISM Services PMI can direct Gold price ahead of the key week comprising Fed Chair Powell’s Testimony, US NFP.
Gold price (XAU/USD) returns to the buyer’s radar, after a brief absence the previous day, as the US Dollar traces a pullback in the key United States Treasury bond yields during early Friday. That said, the yellow metal approaches a weekly high while printing 0.18% intraday gains around $1,840 by the press time. It’s worth noting that the XAU/USD marked the first daily loss in four the previous day as the US Treasury bond yields propelled the US Dollar amid hawkish Federal Reserve (Fed) talks and challenges to sentiment before the table turned during late Thursday.
United States Treasury bond yields retreat from multi-month high
After a stellar rally to the multi-month top, the United States Treasury bond yields eased late Thursday and extended the pullback amid early Friday morning, which in turn allowed the Gold buyers to retake control via the softer US Dollar.
On Thursday, US 10-year Treasury bond yields rose to a fresh high since early November 2022 while piercing the 4.0% threshold whereas the two-year counterpart rallied to the highest levels since 2007 to 4.94%. However, the bond coupons retreated from their multi-month high as of late. That said, the 10-year coupons drop two basis points to 4.05% while its two-year counterpart seesaws around 4.89% by the press time.
Fresh chatters of Federal Reserve policy pivot renew Gold price run-up
Having witnessed a series of hawkish Federal Reserve (Fed) comments, Thursday’s statements from Federal Reserve Bank of Atlanta President Raphael Bostic renewed concerns about the Fed’s policy pivot as the decision-maker said, “The central bank could be in position to pause the current tightening cycle by mid to late summer.” It should be observed, however, that Boston Fed President Susan Collins kept supporting the higher rates for longer as she said, “More rate hikes are required to bring inflation back in control.”
Not only the Fed talks but the latest Reuters poll on the US Dollar also renew the policy pivot talks and weigh on the US Dollar, as well as propels the Gold price. “A weaker greenback in a year amid an improving global economy and expectations the US Federal Reserve will stop hiking interest rates well ahead of the European Central Bank,” per Reuters poll. The February 28 to March 2 poll of 69 currency specialists also mentioned that the dollar was forecast to trade lower than current levels against all major currencies in the next 12 months.
China-inspired optimism, mixed US data also favor XAU/USD bulls
Apart from the yields, hopes of China’s economic recovery, the US-China trade deal and mixed United States data also allow the Gold price to remain firmer.
China’s Caixin Services PMI traced the latest activity data for the dragon nation while printing 55.00 figures for February, versus 50.0 market forecasts and 52.9 previous readings.
Elsewhere, the US-China tension at the Group of 20 Nations (G20) meeting, amid the former’s push for sanctions on countries having strong ties with Russia and aiding Moscow in war with Ukraine, previously probed the Gold price. However, chatters of the likely resumption of the Sino-American trade talks seemed to have pushed back the risk-off mood afterward and allowed the XAU/USD to recover.
Talking about the United States data, the US Jobless Claims dropped to 190K during the week ended on February 24 versus 195K market forecasts and 192K prior. Further, Nonfarm Productivity for the fourth quarter (Q4) eased to 1.7% from 3.0% prior and 2.6% market forecasts while the Unit Labor Costs jumped 3.6% versus 1.6% analysts’ estimations and 1.1% previous readings.
US ISM Services PMI will be the key ahead of Powell’s Testimony, NFP
Looking ahead, Gold price is likely to extend the latest recovery amid fresh Federal Reserve policy pivot talks. However, the US ISM Services PMI for February, expected at 54.5 versus 55.2 prior readings, will be crucial to watch for intraday directions. Above all, the next week’s Federal Reserve (Fed) Chairman Jerome Powell’s Testimony and the monthly US jobs report for February, encompassing the key Nonfarm Payrolls (NFP) will be the key for clear directions of the XAU/USD.
Gold price technical analysis
Gold price remains on the front foot above the 200-Hour Moving Average (HMA) as it adds to the first weekly gain in five. Adding strength to the XAU/USD upside bias is the upward-sloping support line from Tuesday, around $1,832 by the press time.
It’s worth noting that the bullish bias of the Moving Average Convergence and Divergence (MACD) indicator joins the recently firmer Relative Strength Index (RSI) line, placed at 14, to keep buyers hopeful.
However, a clear upside break of the fortnight-old resistance line, close to $1,843, becomes necessary to convince the XAU/USD bulls.
Also acting as a short-term upside hurdle for the Gold price is the 50% Fibonacci retracement level of the February 09-28 downturn, near $1,848, a break of which could propel the quote towards the tops marked on February 10 and 14, near $1,870.
Meanwhile, Gold’s pullback needs to conquer the immediate support line near $1,832, as well as the 200-HMA support surrounding $1,827 to convince sellers.
Even so, a horizontal area comprising multiple levels marked since February 17, close to $1,820-18, could act as an extra check for the XAU/USD bears before directing them to the previous monthly low of around $1,804.
To sum up, Gold price portrays a bullish consolidation ahead of the aforementioned key fundamental catalysts.
Gold price: Hourly chart

Trend: Recovery expected
- GBP/JPY bulls are in play and a test of trendline resistance is on the cards.
- Bulls eye prospects of a move into the 163.70s.
GBP/JPY is up some 0.1% and has picked up from a low of 163.16 and has reached a high of 163.62 in Asia, recouping the losses overnight that came about with the pound sliding due to speculation growing that the Bank of England may not hike interest rates any further. Bank of England Governor Andrew Bailey on Wednesday raised the prospect that the central bank might not need to raise interest rates again, after hiking them to 4% from just 0.1% in December 2021.
This leaves the focus on the trendline support on a daily basis and questions as to how long it can hold out for:
GBP/JPY daily chart
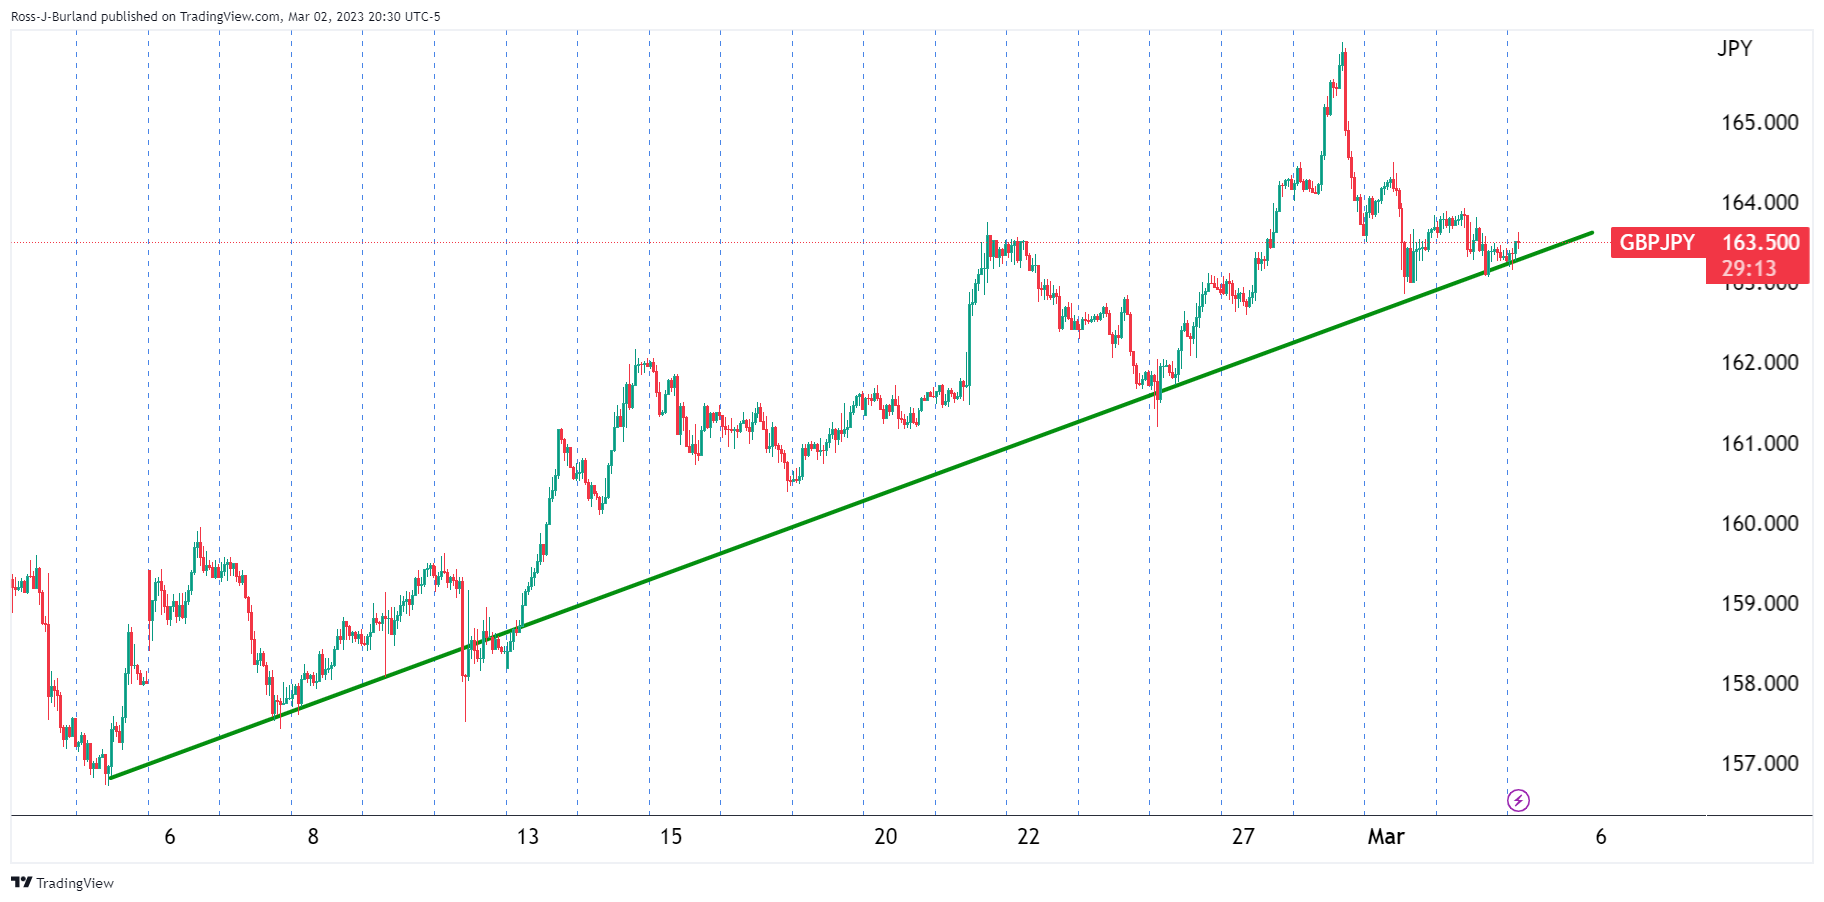
Zooming down to the nearer-term charts, the price is coiled:
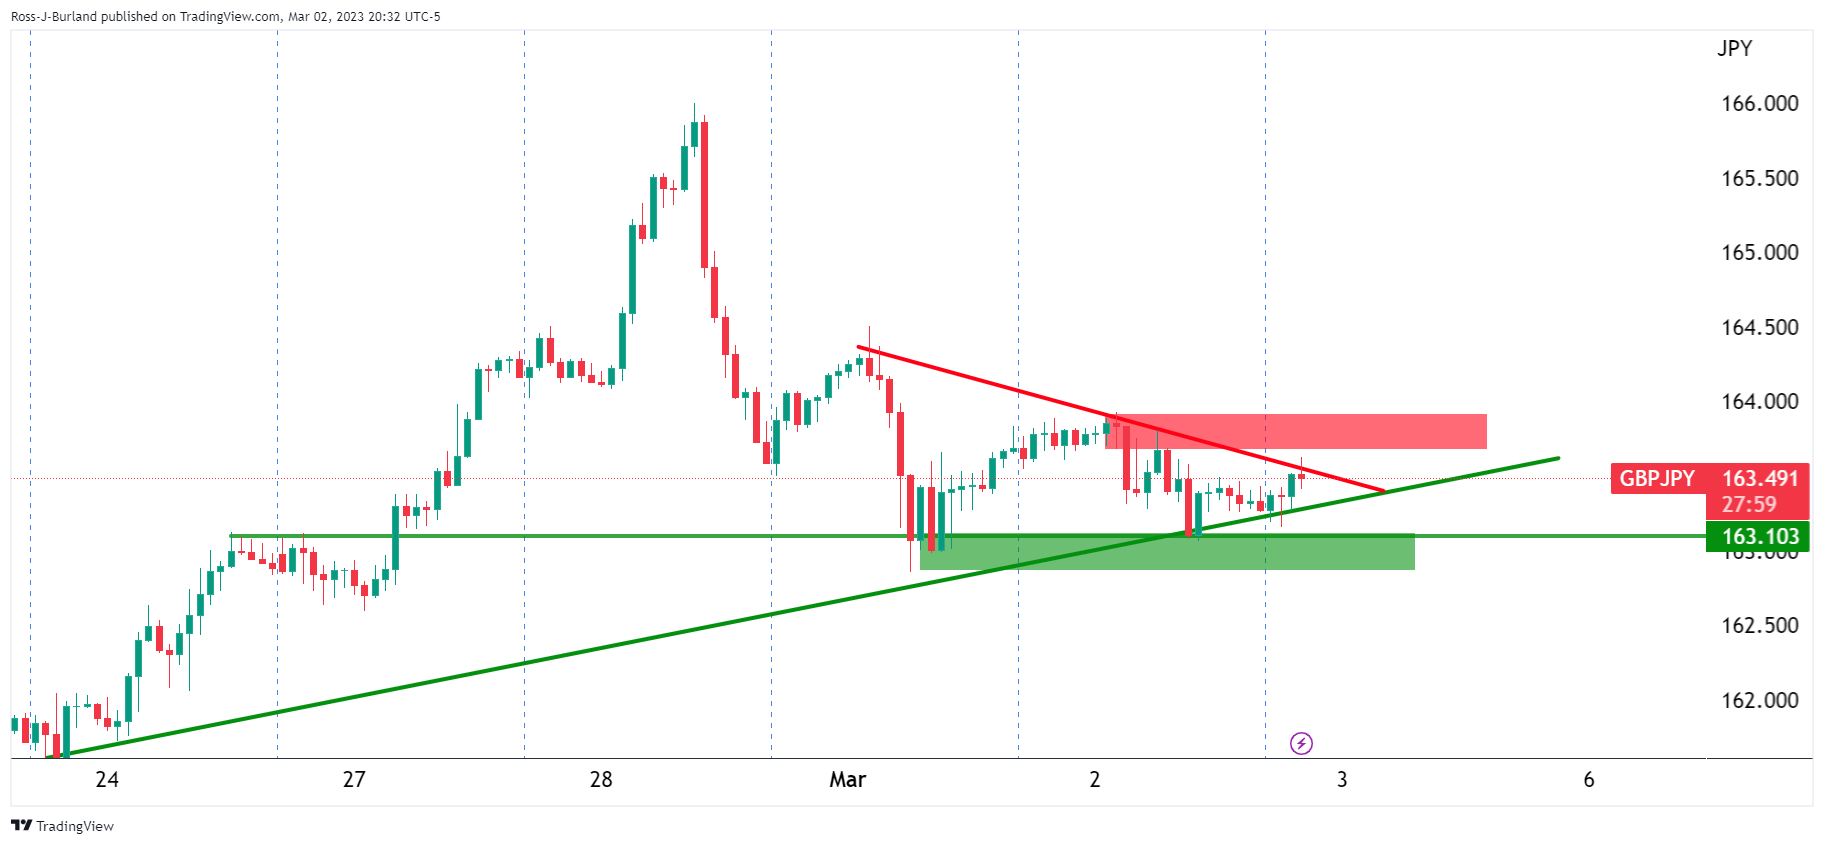
The resistance is being pressured but there are prospects of a correction as follows:
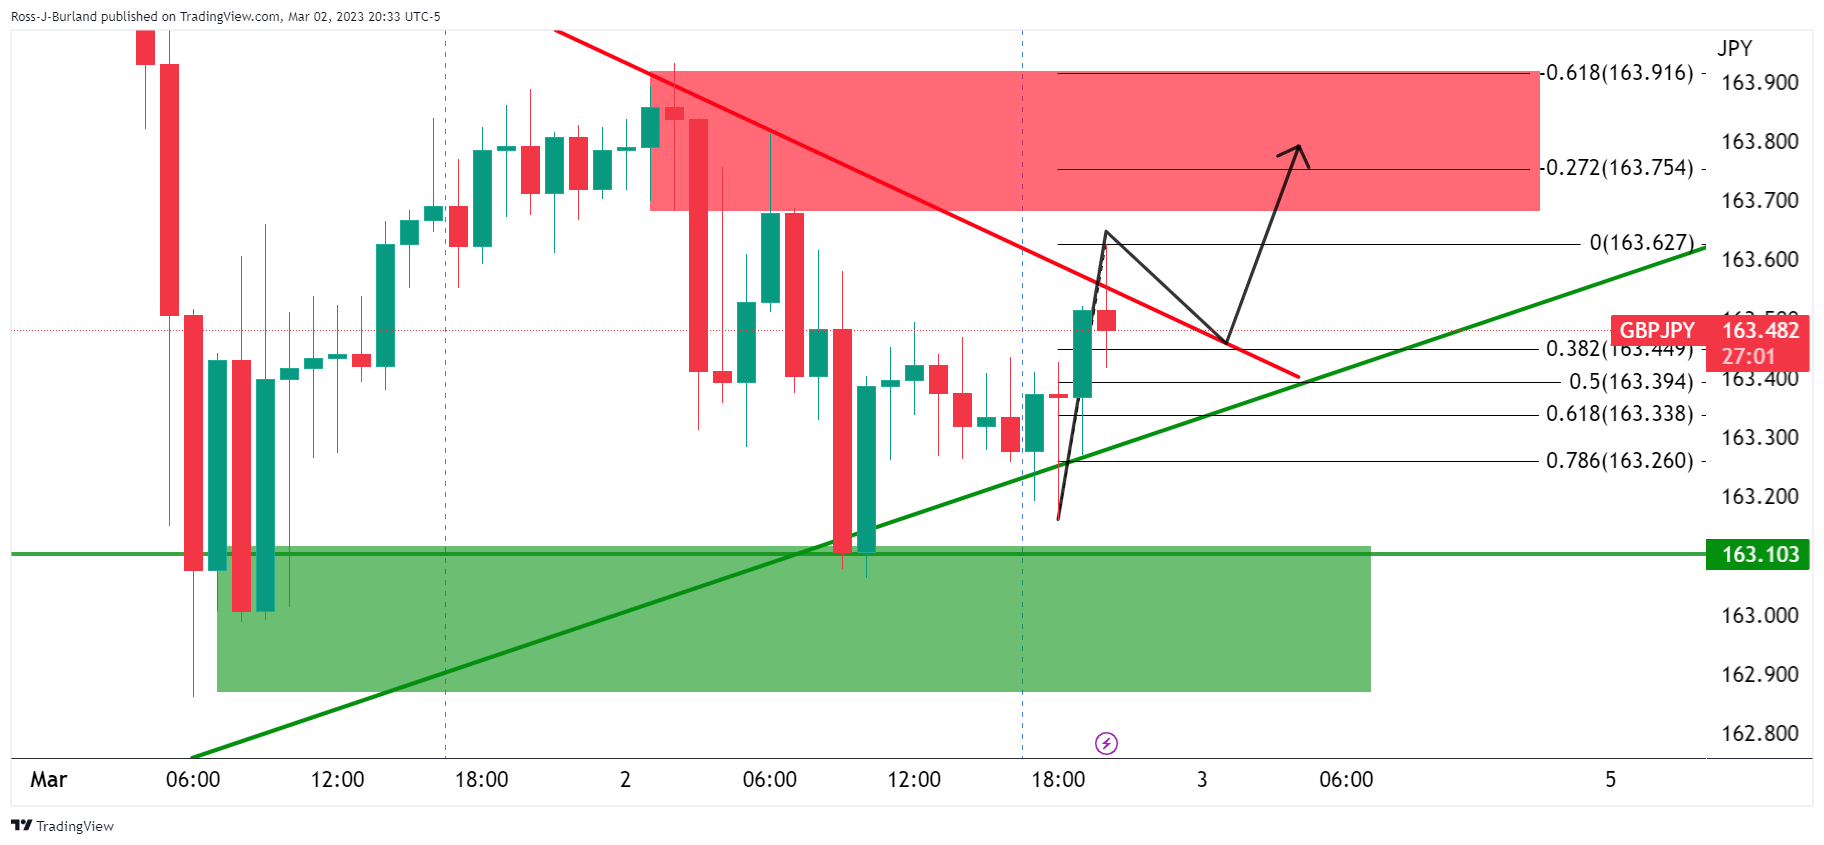
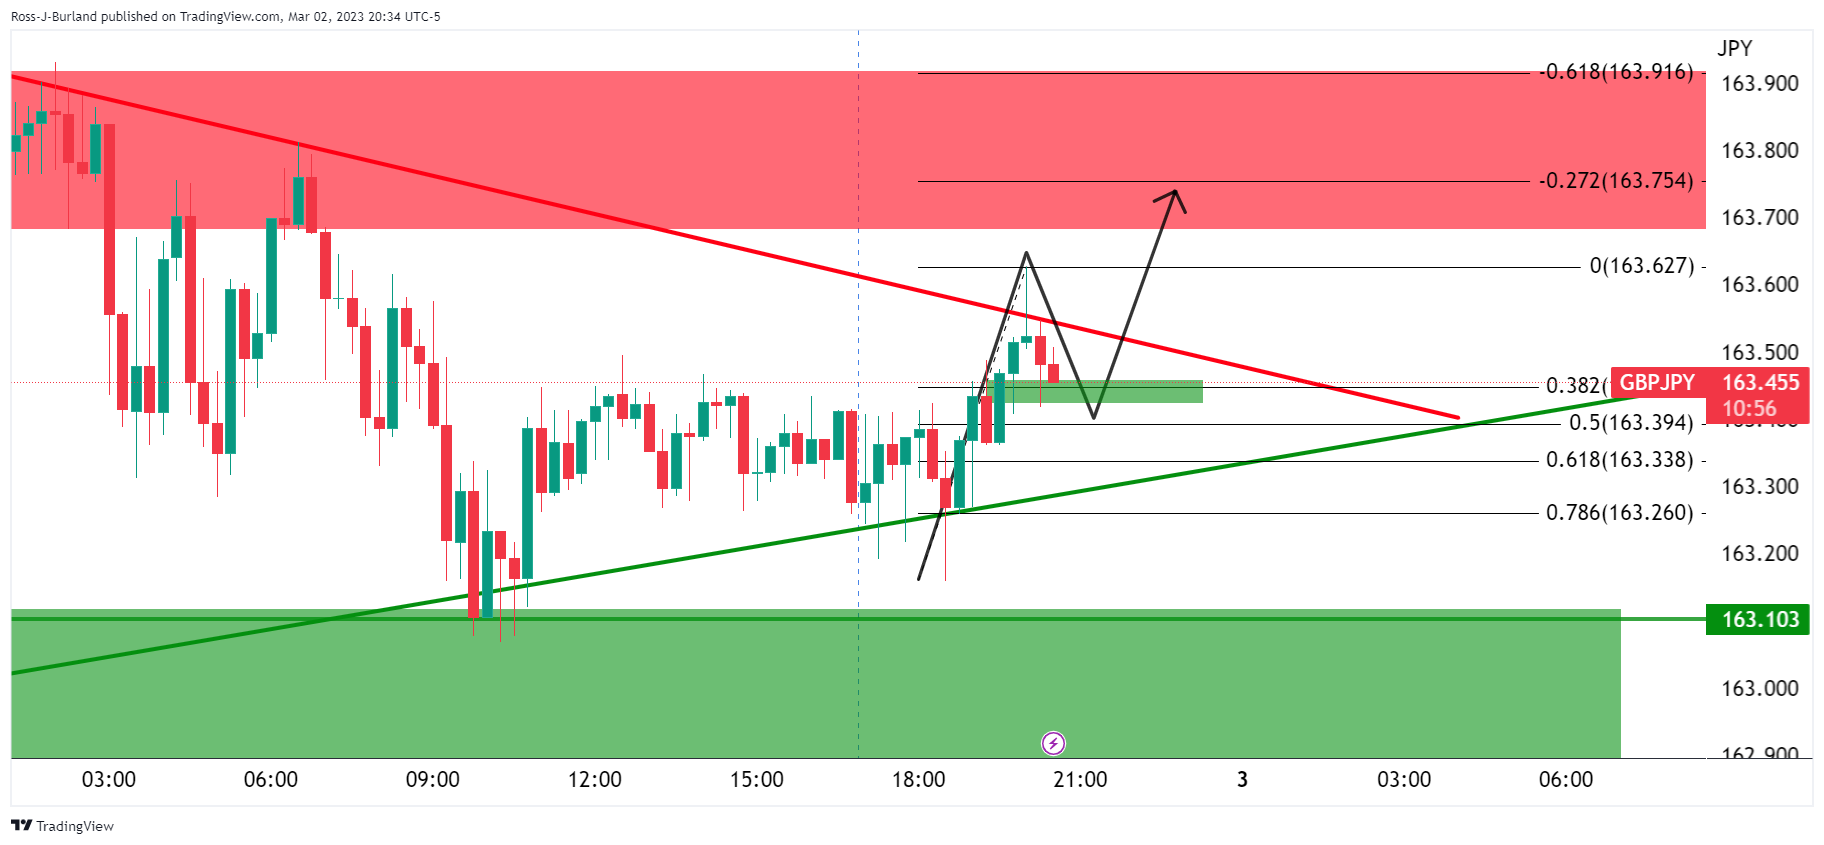
Should the 15-min support holds up, a fuller test of the trendline could result in a breakout from a 50% mean reversion of the bullish impulse as illustrated above.
- AUD/USD has not shown any major reaction to the exceptionally higher-than-expected Caixin Services PMI data.
- A survey from Reuters indicates an interest rate peak for the RBA at 3.85%.
- S&P500 futures have extended loss after a positive Thursday, indicating that investors’ risk appetite is fading away.
The AUD/USD pair has remained lackluster despite the IHS Markit reported hotter-than-anticipated Caixin Manufacturing data. The economic data has landed at 55.0, higher than the consensus of 50.5 and the former release of 52.9.
After the rollback of restrictions on the movement of men, materials, and machines, the Chinese economy is marching effectively on the path of economic recovery. The administration and the People’s Bank of China (PBoC) are dedicated to spurring domestic demand by deploying more stimulus and reform measures.
It is worth noting that Australia is the leading trading partner of China and higher service PMI in China will strengthen the Australian Dollar ahead.
Meanwhile, a recent drop in the Australian monthly Consumer Price Index (CPI) has failed to scale down hawkish expectations from the Reserve Bank of Australia (RBA). The monthly CPI (Jan) dropped significantly to 7.4% from the expectations of 8.0% and the prior release of 8.4%. None of the RBA policymakers has informed that Australian inflation has peaked now. Also, there is an extreme deviation between the current inflation and the desired one. Therefore, the RBA would maintain a hawkish stance for a longer period.
A survey from Reuters on RBA’s interest rate guidance dictates that the central bank will hike its interest rate again by 25 basis points (bps) to 3.60% on Tuesday, followed by one more lift next quarter, before pausing until next year, taking the peak rate higher than previously thought.
Meanwhile, the US Dollar Index (DXY) is eyeing a cushion around 104.80 after a steep correction. The USD Index is expected to remain sideways as investors await US ISM Services PMI data for fresh impetus. S&P500 futures have extended loss in the Asian session after a positive Thursday, indicating the investors’ risk appetite is fading away.
The Chinese Caixin Services PMI has been released as follows:
- Caixin China PMI Services Feb: 55 (est 54.5, prev 52.9).
- Caixin China PMI Composite Feb: 54.2 (prev 51.1).
This date follows data earlier this week with the official manufacturing PMI rising to 52.6 in February from 50.1 prior, the highest reading in over a decade. In addition, average PMIs for manufacturing, services and construction in 2M-2023 reached their highest levels in nearly two years, indicating a broad-based recovery. The rebound in services activity was stronger than manufacturing, as external demand remained relatively soft.
AUD/USD update
Despite the data today, AUD/USD is a touch lower on the release, but remained up on the day at 0.6740 and touch below the highs of 0.6752.
About The Caixin Services PMI™
The Caixin Services PMI™, released by Markit Economics, is based on data compiled from monthly replies to questionnaires sent to purchasing executives in over 400 private service sector companies. The panel has been carefully selected to accurately replicate the true structure of the services economy.
Japanese Finance Minister Shunichi Suzuki said in a statement following the country’s Consumer Price Index (CPI) data release, the government “will accelerate the implementation of measures adopted by extra budget to cope with energy and food price hikes.”
Additional quotes
“ETF purchases by the BoJ is part of BoJ's easing policy.”
“Don't think BoJ ETF purchases are having negative influence on individuals' asset formation.”
“Up to the BoJ to decide on how to dispose of its ETF holding.”
“Expects the Bank of Japan to conduct policy appropriately.”
“Closely watching energy, food price increase, and their impact on people's livelihoods.”
Market reaction
USD/JPY is holding lower ground near 136.50 on the above comments, down 0.14% on the day.
- NZD/USD has extended its revival move above 0.6230 as USD Index has extended losses.
- The US Dollar has failed to capitalize on hawkish commentary from Fed Bostic.
- The Kiwi asset has scaled above the mighty 200-period EMA, indicating that the broader trend is bullish now.
The NZD/USD pair has stretched its recovery above 0.6230 in the Asian session. A revival in the Kiwi asset is backed by a further correction in the US Dollar Index (DXY). The USD Index has extended its losses after surrendering the critical support of 105.00. The USD Index has dropped to near 104.80 and is expected to remain on the tenterhooks ahead of the release of the United States ISM Services PMI data.
S&P500 futures are showing marginal losses in the Asian session after a solid recovery on Thursday, portraying a minor caution amid overall bullish market sentiment. The return provided on 10-year US Treasury bonds is hovering above 4.06%.
The USD Index is struggling to stabilize its feet despite hawkish commentaries from Federal Reserve (Fed) policymakers. Atlanta Fed Bank President Raphael Bostic has favored a 25 basis points rate hike in March but has left room opened for a more hawkish rate outlook if inflation and labor market data come in stronger.
NZD/USD has witnessed stellar buying interest after dropping to near the horizontal support plotted from March 2 low at 0.6200, which was earlier a resistance for the New Zealand Dollar. The Kiwi asset has scaled above the mighty 200-period Exponential Moving Average (EMA) at 0.6220, indicating that the broader trend is bullish now.
A scrutiny of the Relative Strength Index (RSI) (14) indicates that the momentum oscillator has already delivered a bullish reversal. The oscillation range of the RSI (14) has already shifted to 40.00-80.00. Therefore, the momentum indicator has found a cushion at 40.00.
A buying opportunity in the Kiwi asset will emerge it will surpass March 1 high at 0.6276, which will drive the pair toward the round-level resistance at 0.6300 followed by February 14 high at 0.6389.
In an alternate scenario, a breakdown of January 6 low at 0.6193 will drag the asset toward November 28 low at 0.6155. A slippage below the latter will expose the asset for more downside toward the round-level support at 0.6100.
NZD/USD hourly chart
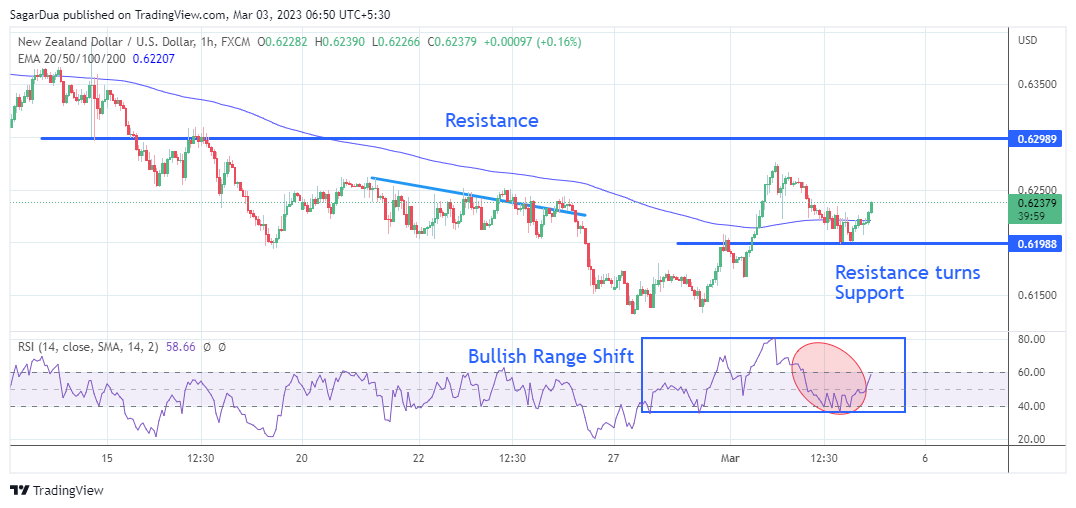
- GBP/USD picks up bids to refresh intraday high, bouncing off weekly low to snap three-day downtrend.
- Former British PM Boris Johnson’s attack on Brexit deal, unimpressive comments from BoE’s Pill probe Cable buyers.
- Fed’s Bostic hints at policy pivot in late summer and weigh on US Treasury bond yields, US Dollar.
- UK S&P Global/CIPS Services PMI, US ISM Services PMI will be crucial for immediate directions.
GBP/USD recovers from the weekly low as it renews its intraday high near 1.1970 while printing the first daily gains in four during early Friday. In doing so, the Cable pair pays little heed to the Brexit-negative headlines, as well as mixed comments from the Bank of England (BoE) officials as the Federal Reserve (Fed) speakers struggle to defend the hawkish bias.
Federal Reserve Bank of Atlanta President Raphael Bostic said on Thursday that the central bank could be in position to pause the current tightening cycle by mid to late summer. On the other hand, Boston Fed President Susan Collins mentioned, per Reuters, that more rate hikes are required to bring inflation back in control. She added that the extent of interest rate hikes will be determined by incoming data.
On the other hand, Chief Economist Huw Pill said on Thursday, per Reuters, that survey indicators that have become available since the publication of the forecast have surprised to the upside, suggesting that the current momentum in economic activity may be slightly stronger than anticipated. On the same line, the latest survey conducted by the Bank of England (BoE) decision maker panel (DMP) showed on Thursday that “businesses’ expectations for their own-price inflation declined in February,” per Reuters.
Elsewhere, ex-UK PM Boris Johnson attacks the incumbent Rishi Sunak’s Brexit deal while saying, “The prime minister had allowed the bloc to retain too much influence in the United Kingdom.” UK’s Johnson also added, “We must be clear about what is really going on here. This is not about the UK taking back control. This is the EU graciously unbending to allow us to do what we want in our own country. Not by our laws, but by theirs." Previously, Ireland’s Democratic Unionist Party (DUP) raised doubts about backing the latest accord over the Northern Ireland Protocol (NIP) in the British Parliament voting.
Amid these plays, Wall Street closed on the positive side, after a downbeat start, whereas the S&P 500 Futures printed mild losses by the press time. Further, US 10-year Treasury bond yields rose to a fresh high since early November 2022 while piercing the 4.0% threshold whereas the two-year counterpart rallied to the highest levels since 2007 to 4.94%. However, the bond coupons have retreated from their multi-month high of late.
It’s worth noting that, the US-China tension at the Group of 20 Nations (G20) meeting, amid the former’s push for sanctions on countries having strong ties with Russia and aiding Moscow in war with Ukraine, previously probed the sentiment. However, the dovish Fed comments and chatters of the Sino-American trade talks seemed to have pushed back the risk-off mood afterward.
Looking ahead, final readings of the UK S&P Global/CIPS Services PMI for February, expected to confirm 53.3 initial forecast, will precede comments from the second-tier BoE and Fed officials to entertain GBP/USD traders. However, major attention will be given to the US ISM Services PMI for February, expected at 54.5 versus 55.2 marked in January.
Also read: ISM Services PMI Preview: Strong figure set to catapult US Dollar to new highs
Technical analysis
A clear upside break of the weekly resistance line, near 1.1990 at the latest, becomes necessary for the GBP/USD bulls to retake control. The Cable pair bears, however, remain off the table unless breaking a two-week-old ascending support line, close to 1.1930 by the press time.
In recent trade today, the People’s Bank of China (PBOC) set the yuan at 6.9117 vs. the last close of 6.9193.
About the fix
China maintains strict control of the yuan’s rate on the mainland.
The onshore yuan (CNY) differs from the offshore one (CNH) in trading restrictions, this last one is not as tightly controlled.
Each morning, the People’s Bank of China (PBOC) sets a so-called daily midpoint fix, based on the yuan’s previous day's closing level and quotations taken from the inter-bank dealer.
- USD/CAD is holding at support as the focus remains on the Fed.
- Bank of Canada expectations are little changed and bias remains bullish fundamentally.
USD/CAD is flat at the end of the week in Asia so far with the price holding around 1.3580, perched below the highs of the day so far at 1.3601.
The US Dollar strengthened on Thursday after Unemployment Claims pointed to a still-strong US labour market. As a consequence, the yield on two-year Treasury notes which are sensitive to interest rate expectations, spiked to levels last seen in July 2007. Futures edged higher, with the market pricing a peak rate climbing to 5.493% in the fed funds by September, before easing a bit later in the session to 5.447%.
The focus is on the Federal Reserve and Atlanta Fed President Raphael Bostic said on Thursday that they are ready to keep lifting rates higher if inflation doesn't slow and was still mulling how recent, stronger-than-anticipated inflation data might shape Fed policy. The impact of higher rates on the economy may only begin to "bite" in earnest this spring, an argument for the Fed to stick with "steady" quarter-point rate increases, Bostic said.
Meanwhile domestically, economic data in Canada has shown that growth was flat SAAR vs. 1.6% expected and a revised 2.3% (was 2.9%) in Q3 and was the weakest since Q2 2021. For December alone, GDP fell -0.1% MoM vs. 0.1% expected and this dragged the y/y rate down to 2.3% vs. 2.8% in November. Bank of Canada expectations are little changed. No change is expected at the next meeting March 8 but WIRP suggests a final 25 bp hike to 4.75% is still priced in for Q3. The BoC has signaled a pause in its hiking cycle and against this backdrop, the loonie is likely to could continue to struggle to regain significant ground against the USD.
- EUR/GBP is consolidating in a 20-pip range after Eurozone HICP-inspired volatility.
- ECB Lagarde is reiterating the need for bigger rate hikes to scale down the sticky inflation.
- A Reuters survey shows UK’s forward PPI and inflation expectations have trimmed this month.
The EUR/GBP pair has continued to consolidate in a narrow range of 0.8860-0.8880 from Thursday’s trading session. The cross has turned sideways after displaying some wild moves inspired by the Eurozone Harmonized Index of Consumer Prices (HICP) data.
After a higher-than-anticipated release of the HICP figures by Germany, Spain, and France, preliminary Eurozone HICP (Feb) has followed similar footprints, landed at 8.5%, surpassed the consensus of 8.2% but remained lower than the prior release of 8.6%.
European Central Bank (ECB) President Christine Lagarde is reiterating the need for bigger rate hikes to scale down the sticky inflation. ECB Lagarde cited “The case for a 50 bps rate hike this month is still on the table as inflation is still too high.” She further added, “We have to use all tools at our disposal to bring inflation down and we don’t know the peak for rates yet,” in an interview with Spanish TV.
Analysts at Goldman Sachs have revised their guidance for ECB’s interest rates to the upside. The ECB is to raise its rates by 50 basis points (bps) in May, compared to the 25 bps rate. A rate hike of 50 bps for March monetary policy has already been announced by ECB President Christine Lagarde. The investment banking firm forecasts a peak for the ECB rates at 3.75% by June versus the previous forecast of 3.50%.
For further guidance, Monday’s Eurozone Retail Sales (Feb) data will be keenly watched. The economic data is expected to expand by 1.9% against a contraction of 2.8% released earlier.
On the Pound Sterling, an absence of clear interest rate guidance from the speech delivered by Bank of England (BoE) Governor Andrew Bailey has pushed the Sterling on the back foot.
The latest survey conducted by the BoE decision maker panel (DMP) showed on Thursday that “businesses’ expectations for their own-price inflation declined in February,” as reported by Reuters. The survey shows that the United Kingdom Producer Price Index (PPI) to increase by an average of 5.4% over the next year, down 0.4% from the previous month.
Also, one-year forward CPI inflation expectations trimmed to 5.9%, down from 6.4% in January.
- EUR/USD picks up bids to pare recent losses inside a trend continuation pattern.
- Two-week-old symmetrical triangle limits immediate Euro moves below 200-EMA hurdle.
- Bearish MACD signals, sustained trading below the key EMA keeps sellers hopeful.
EUR/USD licks its wounds around 1.0600 after posting the biggest daily fall in nearly a month. That said, the Euro pair bounces off the support line of the two-week-long symmetrical triangle during early Friday while paring the previous day’s losses.
It’s worth noting, however, that the bearish MACD signals join the major currency pair’s sustained trading below the 200-Exponential Moving Average (EMA) to challenge the bull's bias.
As a result, the latest rebound appears difficult below the aforementioned triangle’s top line of near 1.0675, as well as the 200-EMA level surrounding 1.0685.
In a case where the EUR/USD price rallies beyond the 1.0685 hurdle, the 1.0700 threshold may act as a validation point for the run-up targeting the mid-February swing high surrounding 1.0800.
On the contrary, a downside break of the stated triangle’s lower line, around 1.0580 by the press time, could join the bearish MACD signals to recall the EUR/USD sellers.
In that situation, the weekly low surrounding 1.0530 could challenge the pair’s further downside ahead of January’s bottom near 1.0480.
Overall, EUR/USD traders can ignore the pair’s latest rebound unless the quote breaks the 1.0685 hurdle. However, the downside room appears limited.
EUR/USD: Four-hour chart
-03032023-638134018267573446.png)
Trend: Further recovery expected
| Index | Change, points | Closed | Change, % |
|---|---|---|---|
| NIKKEI 225 | -17.66 | 27498.87 | -0.06 |
| Hang Seng | -190.25 | 20429.46 | -0.92 |
| KOSPI | 15 | 2427.85 | 0.62 |
| ASX 200 | 3.8 | 7255.4 | 0.05 |
| FTSE 100 | 29.14 | 7944.04 | 0.37 |
| DAX | 22.62 | 15327.64 | 0.15 |
| CAC 40 | 49.97 | 7284.22 | 0.69 |
| Dow Jones | 341.73 | 33003.57 | 1.05 |
| S&P 500 | 29.96 | 3981.35 | 0.76 |
| NASDAQ Composite | 83.5 | 11462.98 | 0.73 |
- US Dollar struggles to extend the previous day’s gains ahead of the key data.
- Treasury bond Yields retreat after refreshing multi-day high.
- Mixed US data, Fed talks probe US Treasury bond yields’ at multi-day high and challenge DXY bulls.
- US ISM Services PMI is expected to ease in February, can act as a downer for greenback on matching forecasts.
US Dollar Index (DXY) grinds higher around 105.00, struggling to extend the previous day’s run-up during early Friday. In doing so, the greenback’s gauge versus the six major currencies portray the cautious mood ahead of the key US ISM Services PMI for February. Also challenging the DXY bulls could be the latest inaction of the US Treasury bond yields after they refreshed the multi-month high.
The comments from Federal Reserve Bank of Atlanta President Raphael Bostic challenged the market’s hawkish Federal Reserve (Fed) bias as the policymaker said the central bank could be in position to pause the current tightening cycle by mid to late summer. On the other hand, Boston Fed President Susan Collins said on Thursday that more rate hikes are required to bring inflation back in control. She added that the extent of interest rate hikes will be determined by incoming data.
Talking about the US data, the US Jobless Claims dropped to 190K during the week ended on February 24 versus 195K market forecasts and 192K prior. Further, Nonfarm Productivity for the fourth quarter (Q4) eased to 1.7% from 3.0% prior and 2.6% market forecasts while the Unit Labor Costs jumped 3.6% versus 1.6% analysts’ estimations and 1.1% previous readings.
Elsewhere, the US-China tension at the Group of 20 Nations (G20) meeting, amid the former’s push for sanctions on countries having strong ties with Russia and aiding Moscow in war with Ukraine, previously probed the sentiment. However, the dovish Fed comments and chatters of the Sino-American trade talks seemed to have triggered a risk-on mood afterward.
Amid these plays, Wall Street closed on the positive side, after a downbeat start, whereas the S&P 500 Futures printed mild losses by the press time. Further, US 10-year Treasury bond yields rose to a fresh high since early November 2022 while piercing the 4.0% threshold whereas the two-year counterpart rallied to the highest levels since 2007 to 4.94%. However, the bond coupons have retreated from their multi-month high of late.
Moving on, the DXY traders should pay attention to the US ISM Services PMI for February, expected 54.5 versus 55.2.
Technical analysis
A three-month-old descending resistance line, around 105.20 appears the key hurdle for the US Dollar Index bulls.
- USD/JPY has picked strength near 136.50 as Tokyo Inflation has softened amid lower energy and food prices.
- Speculation for the Japanese Yen might remain elevated as BoJ Ueda could abandon or phase out YCC.
- Fed Bostic but has left room opened for more hawkish rate outlook if data comes in stronger.
The USD/JPY pair has witnessed buying interest after dropping to near 136.50 in the Asian session. The asset has picked strength as the Statistics Bureau of Japan has conveyed that Tokyo Consumer Price Index (CPI) softened heavily in February.
The annual headline CPI has dropped to 3.4% from the consensus of 4.1% and the prior release of 4.4%. Contrary to that, the core CPI that excludes the impact of energy and food prices have improved to 3.2% from 3.1% as expected and the former release of 3.0%. It seems like the inflationary pressures have been exceptionally battered by the recent fall in food and energy prices.
A decline in headline Tokyo inflation indicates that the impact of higher energy and food prices has started fading now, therefore, it could be considered that Tokyo inflation has peaked for now.
Reuters reported that “The pace of inflation slowed due in part to the government's energy subsidies to ease the pain on households from soaring electricity bills.”
It is worth noting that the novel Bank of Japan (BoJ) leadership has been favoring current monetary policy, which is expansionary in nature, as inflation is coming from international forces and not from domestic demand.
Speculation for the Japanese Yen might remain elevated as BoJ Governor Nominee Kazuo Ueda could abandon or phase out Yield Curve Control (YCC).
Meanwhile, S&P500 futures have incurred some losses in the Asian session after a bullish Thursday, indicating caution in the risk-on mood. The US Dollar Index (DXY) is struggling to shift its auction above 105.00. The upside for the US dollar looks favored as Federal Reserve (Fed) policymakers are favoring more rates from the central bank to scale down inflation.
Atlanta Fed Bank President Raphael Bostic said on Thursday that the central bank could be in a position to pause the current tightening cycle by mid to late summer. He favors a 25 basis points rate hike in March but has left room opened for more hawkish rate outlook if inflation and labor market data come in stronger.
On Friday, a power-pack action is expected from the US Dollar as the United States Institute of Supply Management (ISM) will report the Services PMI (Feb) data. The economic data is seen lower at 54.5 from the former release of 55.2. The New Orders Index which conveys the forward demand is expected to decline to 58.5 from the prior figure of 60.4.
| Pare | Closed | Change, % |
|---|---|---|
| AUDUSD | 0.67295 | -0.31 |
| EURJPY | 144.925 | -0.2 |
| EURUSD | 1.05972 | -0.66 |
| GBPJPY | 163.396 | -0.1 |
| GBPUSD | 1.19477 | -0.54 |
| NZDUSD | 0.62176 | -0.52 |
| USDCAD | 1.35958 | 0.04 |
| USDCHF | 0.94222 | 0.34 |
| USDJPY | 136.756 | 0.45 |
“The Reserve Bank of Australia (RBA) will hike its interest rate again by 25 basis points to 3.60% on Tuesday, followed by one more lift next quarter, before pausing until next year, taking the peak rate higher than previously thought,” as per the latest Reuters poll published early Friday in Asia.
Key findings
All but one of the 28 economists in the Feb. 27-March 2 Reuters poll said the RBA would raise its official cash rate by 25 basis points, reaching a more than decade-high of 3.60%, at its March 7 meeting. One saw a 15 basis-point move.
A strong minority of more than one-third of respondents, 10 of 28, predicted rates to peak even higher at 4.10% next quarter. One economist had a peak of 4.35% in the third quarter.
Several economists foresee trouble ahead for the Australian economy, partly because higher interest rates have already slowed activity in the housing market, where prices are expected to fall more than double the correction during the 2008 financial crisis.
Just over a quarter of economists, 8 of 28, forecast at least one rate cut by year-end.
Also read: AUD/USD Price Analysis: Attempts to deliver a bullish reversal
“We need to bring inflation back to a target range. But of course, we need to do it over a reasonable horizon so as not to unnecessarily crash the economy and turn temporary, slower growth into permanent unemployment,” said Reserve Bank of New Zealand (RBNZ) Governor Adrian Orr while speaking to the NZ Economics Forum at Waikato University early Friday in Asia.
Key quotes
A single mandate is not simpler than the dual mandate.
Other issues around financial stability and unnecessary volatility and that's where the balancing act gets really hard.
Lifting the official cash rate too far or too fast can, for example, lead to a severe downturn; spending and investment collapses, and you ended up with a much higher exchange rate because foreign exchange dealers chase the high-yielding New Zealand dollar, and you crush the export sector.
Market reaction
The news joins the broad-based US Dollar strength to keep NZD/USD bears hopeful around 0.6215 by the press time.
Also read: NZD/USD attempts recovery from 0.6200 as USD Index displays a momentum loss


© 2000-2026. Sva prava zaštićena.
Sajt je vlasništvo kompanije Teletrade D.J. LLC 2351 LLC 2022 (Euro House, Richmond Hill Road, Kingstown, VC0100, St. Vincent and the Grenadines).
Svi podaci koji se nalaze na sajtu ne predstavljaju osnovu za donošenje investicionih odluka, već su informativnog karaktera.
The company does not serve or provide services to customers who are residents of the US, Canada, Iran, The Democratic People's Republic of Korea, Yemen and FATF blacklisted countries.
Izvršenje trgovinskih operacija sa finansijskim instrumentima upotrebom marginalne trgovine pruža velike mogućnosti i omogućava investitorima ostvarivanje visokih prihoda. Međutim, takav vid trgovine povezan je sa potencijalno visokim nivoom rizika od gubitka sredstava. Проведение торговых операций на финанcовых рынках c маржинальными финанcовыми инcтрументами открывает широкие возможноcти, и позволяет инвеcторам, готовым пойти на риcк, получать выcокую прибыль, но при этом неcет в cебе потенциально выcокий уровень риcка получения убытков. Iz tog razloga je pre započinjanja trgovine potrebno odlučiti o izboru odgovarajuće investicione strategije, uzimajući u obzir raspoložive resurse.
Upotreba informacija: U slučaju potpunog ili delimičnog preuzimanja i daljeg korišćenja materijala koji se nalazi na sajtu, potrebno je navesti link odgovarajuće stranice na sajtu kompanije TeleTrade-a kao izvora informacija. Upotreba materijala na internetu mora biti praćena hiper linkom do web stranice teletrade.org. Automatski uvoz materijala i informacija sa stranice je zabranjen.
Ako imate bilo kakvih pitanja, obratite nam se pr@teletrade.global.
транcфери