- Analiza
- Novosti i instrumenti
- Vesti sa tržišta
Forex-novosti i prognoze od 13-10-2021
- The USD/CAD slides for the second day in a row clings to 1.2450.
- Western Texas Intermediate (WTI) crude oil rises again above $80.00, lifts the CAD.
- USD/CAD: Moving averages and the Relative Strenght Index (RSI) suggest that the pair is a downtrend.
The USD/CAD begins the Asian session on the wrong foot slides 0.01%, is trading at 1.2441 during the day at the time of writing.
The market sentiment is a mixed bag, as witnessed by Asian equity futures, seesawing around gainers and losers. On Wednesday, a higher US inflation reading spurred a rally in the US bond market, which triggered a fall in US T-bond yields, ultimately underpinned the greenback, with the US Dollar Index falling 0.50%, finished at 94.00.
Higher crude oil prices boost the Canadian dollar. Western Texas Intermediate (WTI) advances 0.05%, is trading at $80.0, weighs on the USD/CAD pair.
On Wednesday, the US Bureau of Labor Statistics (BLS) released inflation numbers. The Consumer Price Index for September rose by 5.4%, more than 5.3% estimated by analysts. Furthermore, the Core Consumer Price Index, which excludes food and energy costs, increased by 4%, according to estimations.
USD/CAD Price Forecast: Technical outlook
Daily chart
The USD/CAD pair is trading just below the daily moving averages, suggesting that the pair is in a downtrend. Momentum indicators like the Relative Strenght Index (RSI) at 34 indicate the pair has a downward bias.
For sellers to resume the downward trend, they will need a daily close below 1.2421. In that outcome, the first support would be 1.2302. A breach of the latter could tumble the USD/CAD towards 1.2006, but it will find some hurdles on the way south, like the May 27 high at 1.2140
On the flip side, a daily close above the confluence of the 200-DMA and the psychological around the 1.2500-05 area could open the door for further gains for buyers. In that outcome, the following resistance would be the 50-DMA at 1.2619.
KEY ADDITIONAL LEVELS TO WATCH
- GBP/USD extends the previous session’s gains on Thursday in the initial Asian session.
- Lower US T-yields undermine the demand for the US dollar.
- Brexit led-woes, worker shortage, weaker domestic data keep a check on sterling.
The GBP/USD pair extends gains on Thursday. The pair touched a high of 1.3667 in the previous session composed of nearly 100-pips movement. At the time of writing, GBP/USD is trading at 1.3667, up 0.03% for the day.
The US benchmark 10-year Treasury yields recovered to trade at 1.58% before falling to 1.54% on Wednesday following the higher September inflation data and FOMC minutes. The US Consumer Price Index (CPI) was upwardly revised to 5.4% on yearly basis from a previous estimate of 5.3%. Minutes from the Federal Open Market Committee’s September meeting showed the Fed could begin a “ gradual tapering process” by as soon as mid-November. The greenback pared its initial gains and traded lower near 94.00 with fresh losses.
On the other hand, the British pound gains on the USD broad-based selling amid the UK Chancellor, Rishi Suank remarks on supply chain issues during his visit to the US to address G-20 finance ministers. Furthermore, the European Union (EU) offered an “ Express Lane” proposal to solve Northern Ireland Brexit row, which aided the sterling recent gains.
As for now, traders keep their focus on the Bank of England (BOE) Credit Condition Survey, and US Initial Jobless Claims to gauge market sentiment.
GBP/USD additional levels
- NZD/USD snaps two days’ losses on Thursday in the early Asian session.
- US Dollar Index falls below the one-year high near 94.50 to trade negatively.
- Kiwi gains amid mixed play of COVID-19, risk-on sentiment, and inflationary pressures.
NZD/USD prints daily gain on Thursday in the Asian session. The selling pressure in the US dollar pushes NZD/USD higher. After testing the lows near 0.6911, the pair jumbled nearly 60-pips in the US session to give the highest closing in the past five-session. At the time of writing, NZD/USD is trading at 0.6960, up 0.10% for the day,
The US Dollar Index (DXY), which measures the greenback performance against its six major rivals, trades at 94.00, down 0.54% as investors digest the recent inflation readings and FOMC minutes. The US Core Price Index (CPI) jumped 5.4% in September from 5.3% in August whereas the FOMC minutes showed that the Fed is close to starting tapering, possibly in mid-November.
Furthermore, the risk-on sentiment helped the kiwi to gain momentum. It is worth noting that, S&P 500 Futures is trading at 4,358, up 0.08%. The disappointing economic data restricted the gains for the NZD. The ANZ Business Outlook Index in New Zealand fell -8.6 in October.
On the pandemic side, new 55 cases are recorded and Northland and Waikato will remain in alert level 3 for another five days.
As for now, all eyes are on the US Initial Jobless Claims to take fresh trading impetus.
NZD/USD additional levels
- EUR/USD begins the Asian session on the right foot, barely up 0.04%.
- Higher inflationary pressures weakened the US dollar, strengthened the euro and precious metals.
- US CPI annually base rose by 5.4%, higher than the 5.3% foreseen.
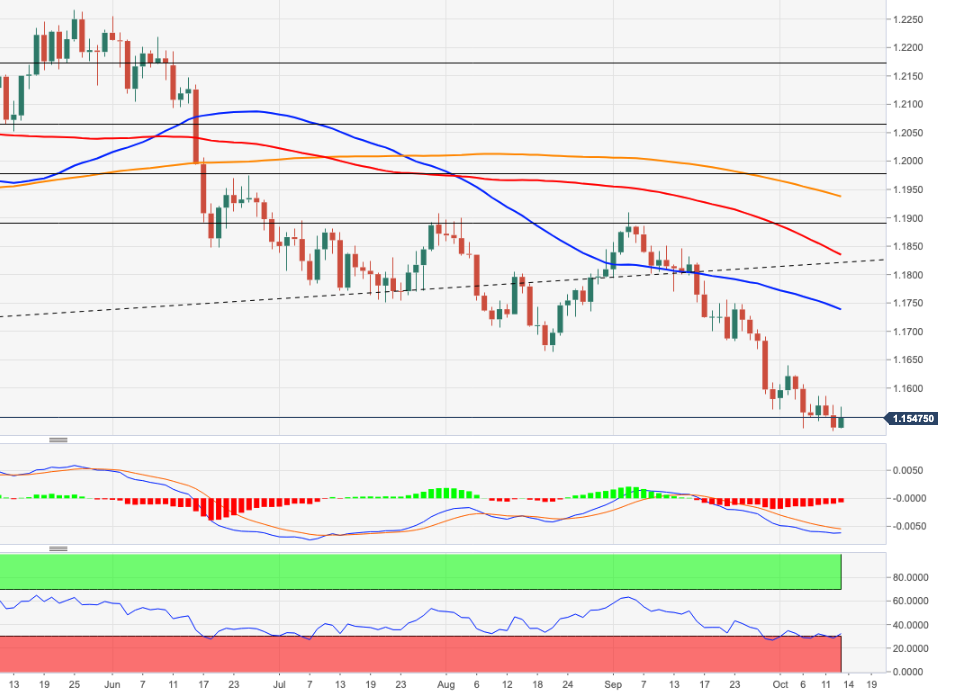
The EUR/USD advances as the Asian session begins trading at 1.1597, barely up 0.04% during the day at the time of writing. On Wednesday, the single currency dipped to the daily low at 1.1524 but bounced off the lows, courtesy of a higher US CPI reading, and finished around the 1.1590’s.
The market sentiment is upbeat, depicted by US equity indices, which rose between 0% and 0.77%, whereas Asian equity futures seesaw between gainers and losers as the Asian session kicks in.
On Wednesday, the US Bureau of Labor Statistics (BLS) released inflation numbers. The Consumer Price Index for September increased by 5.4%, higher than 5.3% estimated by analysts, suggesting that American citizens are struggling with higher prices. Further, the Core Consumer Price Index, which excludes food and energy costs, rose by 4%, unchanged.
The EUR/USD reaction to the news initially was towards a strong US dollar, but it seems that the market had already priced in the increase, selling off the greenback afterward, thus strengthening the euro.
EUR/USD Price Forecast: Technical outlook
Daily chart
The single currency is trading well below the daily moving averages, remains in a downtrend. Wednesday’s price action created a bullish-engulfing candle, meaning prices could be headed north, but strong resistance at the psychological 1.1600 needs to be reclaimed. Also, the October 4 high at 1.1639 adds another strong resistance layer for EUR/USD buyers to account for it.
In the case of a daily close above 1.1600, the first supply level would be the abovementioned 1.1639. A break of the latter could expose the 50-day moving average (DMA) at 1.1719 as the next resistance area.
On the flip side, a mover towards the downside is on the cards, supported by momentum indicators like the Relative Strength Index (RSI), which is at 41 below the 50-midline. Failure at 1.1600 would expose the 2021 year low at 1.1524. A break beneath that level could pave the way towards the July 16 low at 1.1370.
KEY ADDITIONAL LEVELS TO WATCH
- AUD/USD continues its northerly trajectory supported by higher energy and covid vaccinations optimism.
- China remains a significant risk to Australia's export-dependent economy.
AUD/USD is second to only the Canadian dollar on Wednesday in New York closing in the cunt down to Thursday's Asian session's key event that will reveal Australia's jobs data for September. At the closing bell on Wall Street, AUD/USD was 0.45% higher on the day at 0.7380 after travelling from a low of 0.7323 to a high of 0.7381. The pair is just 24 pips off a 38.2% Fibonacci retracement of the 2021 uninterrupted monthly bearish trend. See below for more on the technical picture.
Meanwhile, AUD is picking up a bid as investors seek out commodities as a hedge against inflation and prospects for rising prices in Iron Ore, and even higher LNG and other energy-related exports such as coal are going to serve the nation's surplus balance and currency well.
Additionally, news flow has the potential to be constructive as markets focus on reopening and on high energy costs. However, analysts at Credit Suisse argued that, ultimately, ''the bar for an improvement in the data sufficient to move the dial in a meaningful way on RBA policy is quite high, especially with the Reserve Bank of Australia outlook already priced fairly hawkish, and the likely outcome on the China front still far from clear.''
AUD/USD short squeeze has room to go
On the other hand, it is worth noting that over the course of the past month, net AUD positioning has collapsed to 2015 levels. That leaves the market vulnerable for a continued squeeze on short positioning, especially if unexpected changes in external drivers come about. For instance, Australia is highly dependent on China's business in iron ore.
The Evergrande Gray Rhino event has shaven the prices of Australia's number one export in what was already in a downtrend amidst trade tensions between the two nations. Iron ore prices sat just over $US120 ($164) per tonne of 62 per cent iron ore at the end of last week, well below the prices reached in mid-July this year, when they topped $US200 per tonne. However, they have started to recover from the Sep lows of $106, but considering the Chinese property shake-out, the fastest and largest iron ore crash in history would be expected to resume its southerly trajectory.
UBS estimates there are 10 developers with potentially risky positions with combined contract sales of 1.86tn yuan – or 2.7 times Evergrande’s size. In other words, Evergrande is only the tip of the iceberg. As things stand, Chinese construction is likely to fall over the next year and that would be expected to equate to hundreds of millions of tonnes of less steel that will be needed.
This would equate to hundreds of million tonnes of iron ore equivalent also. This puts iron ore on track to fall below $100 a tonne and perhaps to even match its 2015 price crash to somewhere below $50 in the near future. If prices were to somehow not fall further and continue to recover significantly higher, then AUD would become even more attractive that has so far been protected by the unexpected energy crisis that has driven coal and LNG prices wild in Asia.
However, China has already commissioned oodles of new coal mines to resolve the issue by the northern Spring. So, if the reopening of the economy in Australia is already priced in and should we see a continuation of the route in iron ore prices followed by falling coal and LNG prices, as well as domestic housing collapse, then AUD could be in for a very rough ride. With respect to housing, Chinese investment is expected to drop out at the same time that the Reserve Bank of Australia and APRA are tightening credit availability for its property market.
All of this means that the risk to reward to being short could start to be attractive again from a fundamental basis, while technically, as the analysis below will show, there could still be room left in this correction yet to go.
Aussie jobs data coming up
Meanwhile, the Australian Employment data is the key focus in Asia today.''We expect employment will have fallen -120k in August, which is slightly below consensus. But we expect the unemployment rate will only rise to 4.7%,'' analysts at ANZ Bank said. We also see China’s Consumer Price Index later in the day.
AUD/USD technical analysis
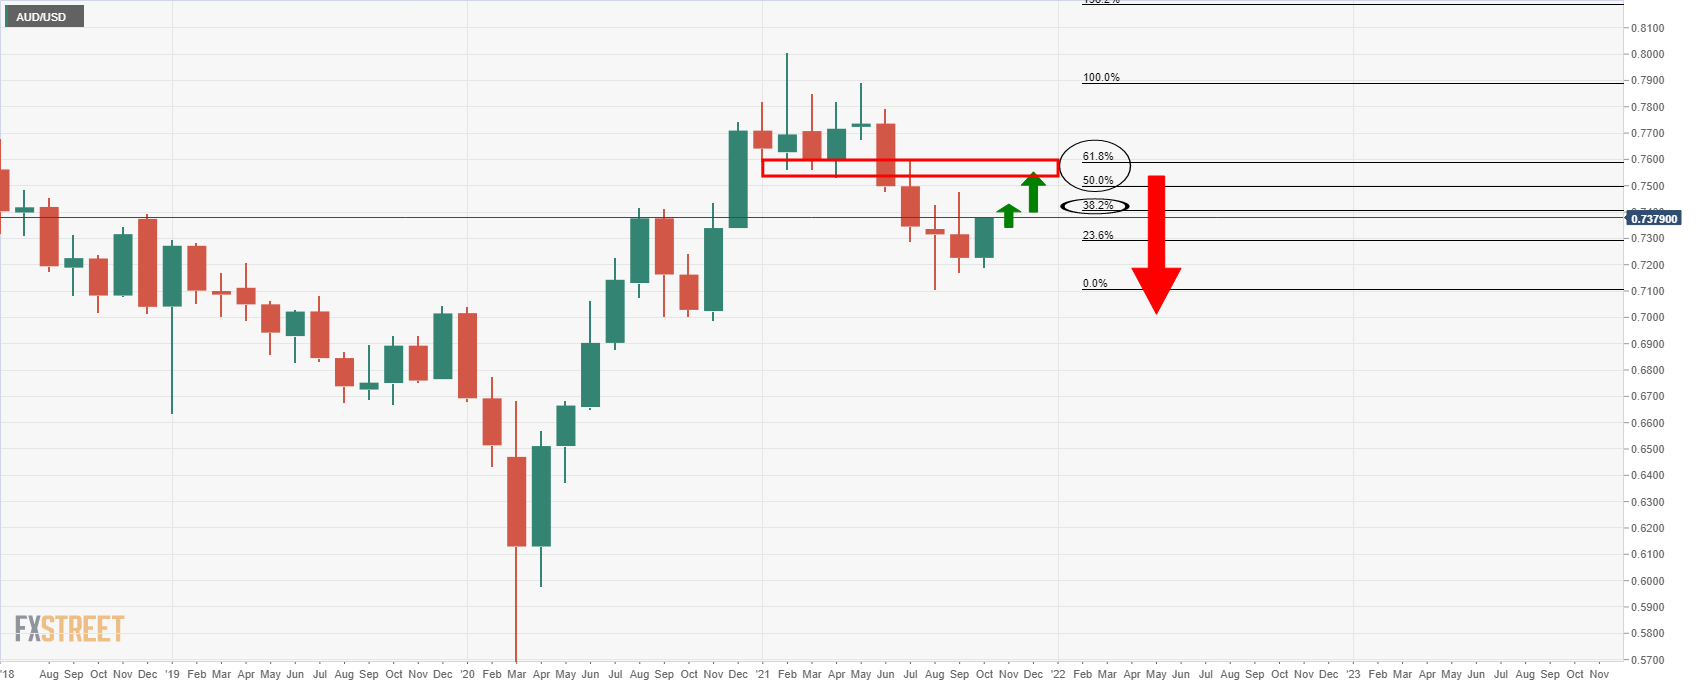
AUD/USD has started to correct five months of an uninterrupted bearish trend and the price is en-route to the 38.2% Fibonacci retracement of the impulse as illustrated above, near 0.7410. However, it may not be long before the bears re-engage once the positioning equilibrium levels out and the price starts to look rich again. On the other hand, that may not be for a while and until the April lows are tested again near to a 61.8% Fibo retracement near 0.7600.
- WTI barely advances, courtesy of the OPEC+ which lowered its estimates for the rest of 2021.
- The US Dollar Index is down, bracing to 94.00.
- As US stock indexes rise, the market sentiment is upbeat towards the end of the New York session.
Western Texas Intermediate (WTI) US crude oil benchmark barely advances 0.05%, is trading at $79.94 during the New York session at the time of writing. The market sentiment has improved through the American session, as depicted by US equity indexes rising between 0.01% and 0.65%. Meanwhile, the US Dollar Index, which influences the price of crude oil, is declining 0.51%, clinging to 94.00
WTI sluggish advance on Wednesday lies on the back of the OPEC+, which revised lower its estimate for 2021 global oil consumption in its monthly report. Furthermore, the group added that the spike in natural gas prices could boost crude oil use like power generation, but it could curb the demand in other areas such as refining.
Oil has surged due to the rebound in activity from the pandemic, which has increased consumption, depleting inventories. Also, shortages in natural gas and coal have driven demand for the so-called black gold.
WTI Price Forecast: Technical outlook
Daily chart
WTI is trading around the week tops but retreated under $80.00, testing the close of Tuesday’s price action. The daily moving averages are located below the price, indicating that crude oil is in an uptrend. Momentum indicators like the Relative Strength Index (RSI) above 70, in oversold levels, means that WTI could be headed for a correction lower before resuming the upward bias.
In case of a WTI’s correction lower, the first demand zone would be the October 6 high at $79.53. A breach of the latter, WTI could tumble towards the October 7 low at $76.60.
On the flip side, a daily close above $80.00 indicates that oil prices might be headed for consolidation, awaiting for RSI to exit oversold levels before resuming the uptrend.
KEY ADDITIONAL LEVELS TO WATCH
What you need to know on Thursday, October 14:
The dollar sold-off on Wednesday dragged lower by falling US Treasury yields. The market mood was dismal throughout most of the day, with Asian indexes closing in the red after a mixed Chinese Trade Balance, which posted a surplus off $66.76 billion, much better than anticipated. Exports were sharply up, although imports contracted.
Yields were weaker ever since the day started, but accelerated their slump following the release of US inflation data. The September Consumer Price Index was upwardly revised to 5.4% YoY from a previous estimate of 5.3%, while the core annual reading was confirmed at 4%.
The US Federal Reserve published the Minutes of its latest meeting. As expected, the document showed that policymakers are ready to kick-start tapering, a gradual reduction in the pace of asset purchases, aiming to end it in mid-2022.
Wall Street once again struggled to advance, with the three majors indexes closing mixed around their opening levels. JP Morgan announced upbeat third-quarter earnings, reporting profits of $11.7 billion.
The EU announced a series of proposals that would reduce the burden on Irish Sea trade created by Brexit’s Northern Ireland Protocol. Meanwhile, BOE’s Governor Andrew Bailey reiterated his hawkish message.
The EUR/USD pair trades near the 1.1600 figures near fresh weekly highs, while GBP/USD hovers around 1.3660. Commodity-linked currencies resumed their advances with USD/CAD trading at 1.2430 a fresh multi-month low, and the AUD/USD approaching 0.7400 ahead of the release of Australian employment figures.
Gold benefited the most from the broad dollar’s weakness, now trading at $1,791 a troy ounce. Crude oil prices remain steady, with WTI at around $80.50 a barrel.
Top 3 Price Prediction Bitcoin Ethereum Ripple: Crypto market bound for a brief correction
Like this article? Help us with some feedback by answering this survey:
''Finance leaders from the G20 major economies on Wednesday endorsed a global deal to revamp corporate taxation and pledged to avoid premature withdrawal of fiscal support while keeping a close eye on inflationary pressures,'' according to a final draft communique seen by Reuters.
''The G20 finance ministers and central bank governors also called on the International Monetary Fund to establish a new trust fund to channel a $650 billion issuance of IMF monetary reserves to a broader range of vulnerable countries.''
G20 finance leaders endorse OECD pact to adopt 15% global minimum corporate tax, reallocate taxing rights for large multinationals.
G20 finance leaders reaffirm resolve to use 'all available tools for as long as required' to address covid-19 and its impact.
G20 finance leaders pledge to sustain economic recovery, avoid any premature withdrawal of support measures.
G20 finance leaders say central banks will act as needed to ensure price stability while looking through inflation pressures where they are transitory.
G20 finance leaders say support IMF to secure additional donor contributions to CCRT funds to provide debt service relief for poor countries
G20 finance leaders call for further contributions to expand IMF's poverty reduction and growth trust -draft
G20 finance leaders call on IMF to establish new resilience and sustainability trust to channel reserve assets to a broader range of vulnerable countries-draft.
G20 finance leaders call for early engagement of borrower countries, private creditors in common framework debt restructuring process
G20 finance leaders urge Chad's private creditors to act swiftly on common framework debt restructuring process.
G20 finance leaders say look forward to 'ambitious' replenishment of world bank IDA fund for poor countries by December 2021.
G20 finance leaders say committed to strengthening resilience of non-bank financial intermediation sector.
G20 finance leaders reiterate that no 'global stablecoins' should start operations until all legal, regulatory and oversight requirements addressed.
G20 finance leaders say encourage concerted efforts to reform the world trade organization.
G20 finance leaders say will strive to address bottlenecks of covid-19 tools in low and middle-income countries in coming months.
- Gold bulls bust through bearish commitments and prints fresh highs for October.
- US dollar gives back significant ground as 30-year US Treasury yields drop heavily.
- Stagflation theme gains traction in markets are cold energy sapping winter-time approaches.
The price of gold on Wednesday has rallied into key resistance territory where it has printed the highest levels since the weekly bar from the 13 Sep. At the time of writing, gold is trading at $1,792.50 and 1.85% higher. The price has travelled from a low of $1,757.89 to a high of $1,796.24 where it tests the 200-day EMA.
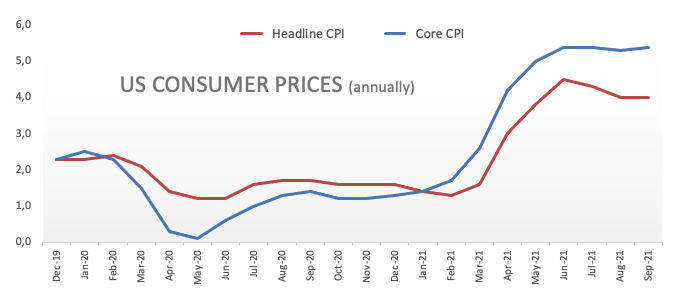
In key data today, US inflation data showed prices rose solidly in September, stoking expectations the Federal Reserve will announce a tapering of stimulus next month, with the potential for rate hikes by mid-2022. The Consumer Price Index rose 0.4% last month, versus a 0.3% rise expected by economists polled by Reuters.
In the 12 months through September, the CPI increased 5.4%, up from a 5.3% year-on-year advance in August, Reuters reported. ''Excluding the volatile food and energy components, the so-called core CPI climbed 0.2% last month, up from 0.1% in August.''
In more recent trade, the Federal Reserve released the minutes from its September meeting which gave the signs for a November announcement for tapering of the central bank's bond-buying stimulus. More on this in the link below:
FOMC Minutes: ''A gradual tapering process would likely be appropriate''
Nonetheless, the greenback has fallen into the fourth position on the Currency Strength Indexes behind GBP and the commodity currencies, AUD and CAD. The move does not tally with the foresight with regards to timings of a US rate hike lift-off though. The market had been pricing in a rate hike for December of next year, but since the CPI data and hawkish Minutes, it is now eyeing September.
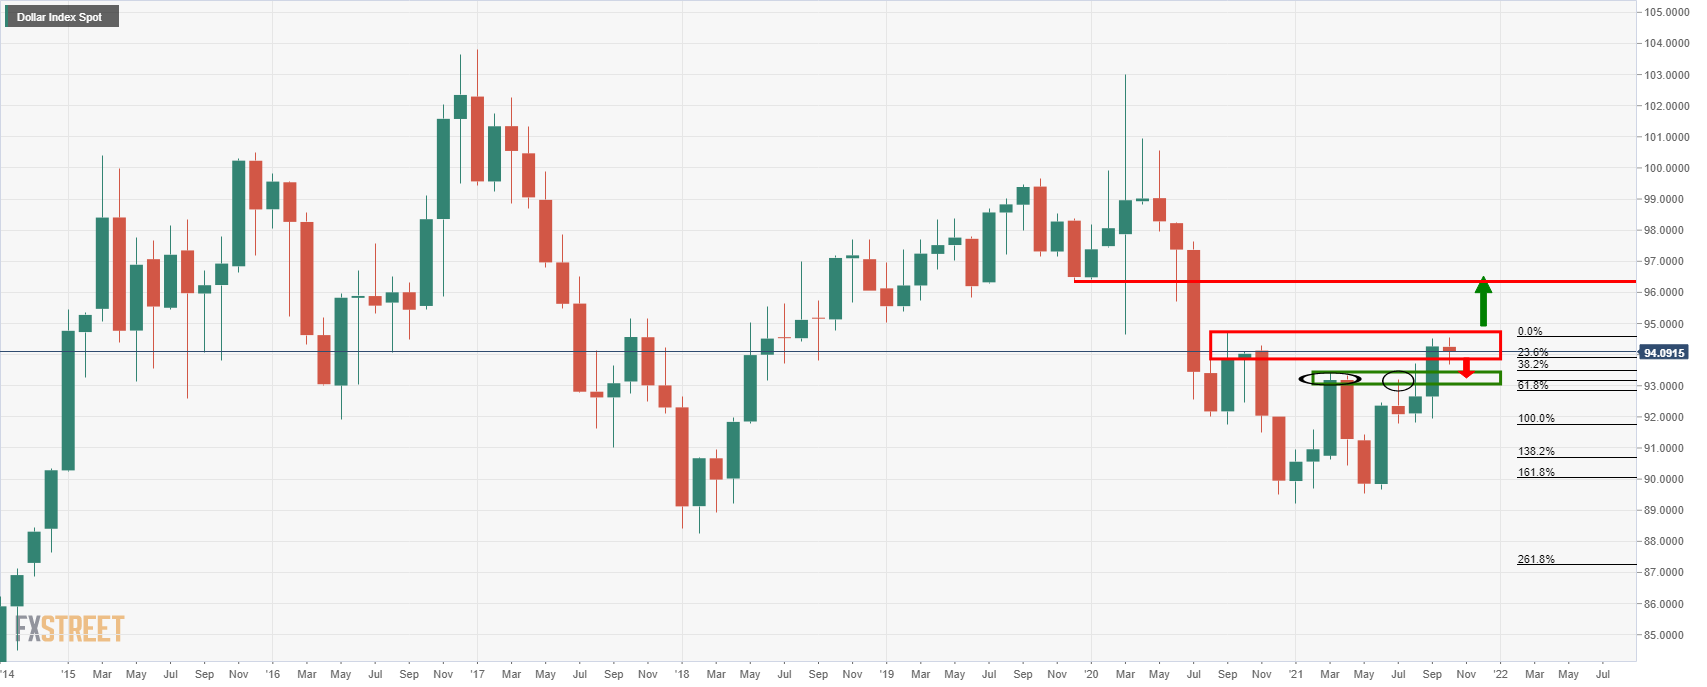
However, given how far the US dollar index has come in just a couple of weeks, rising some 1.7% and running into a wall of resistance as per the Sep 2020 highs, a correction is of no surprise, only the timing of it remains the head-scratcher. What is evident, however, is that yield differentials are playing their part, with the 10 and 30-year Treasury yields down 1.5% and 2.5% respectively on the day. ''If the sell-off in rates continues, differentials may start to play a larger role in FX outcomes,'' analysts at ANZ Bank argued.
US dollar index, monthly chart
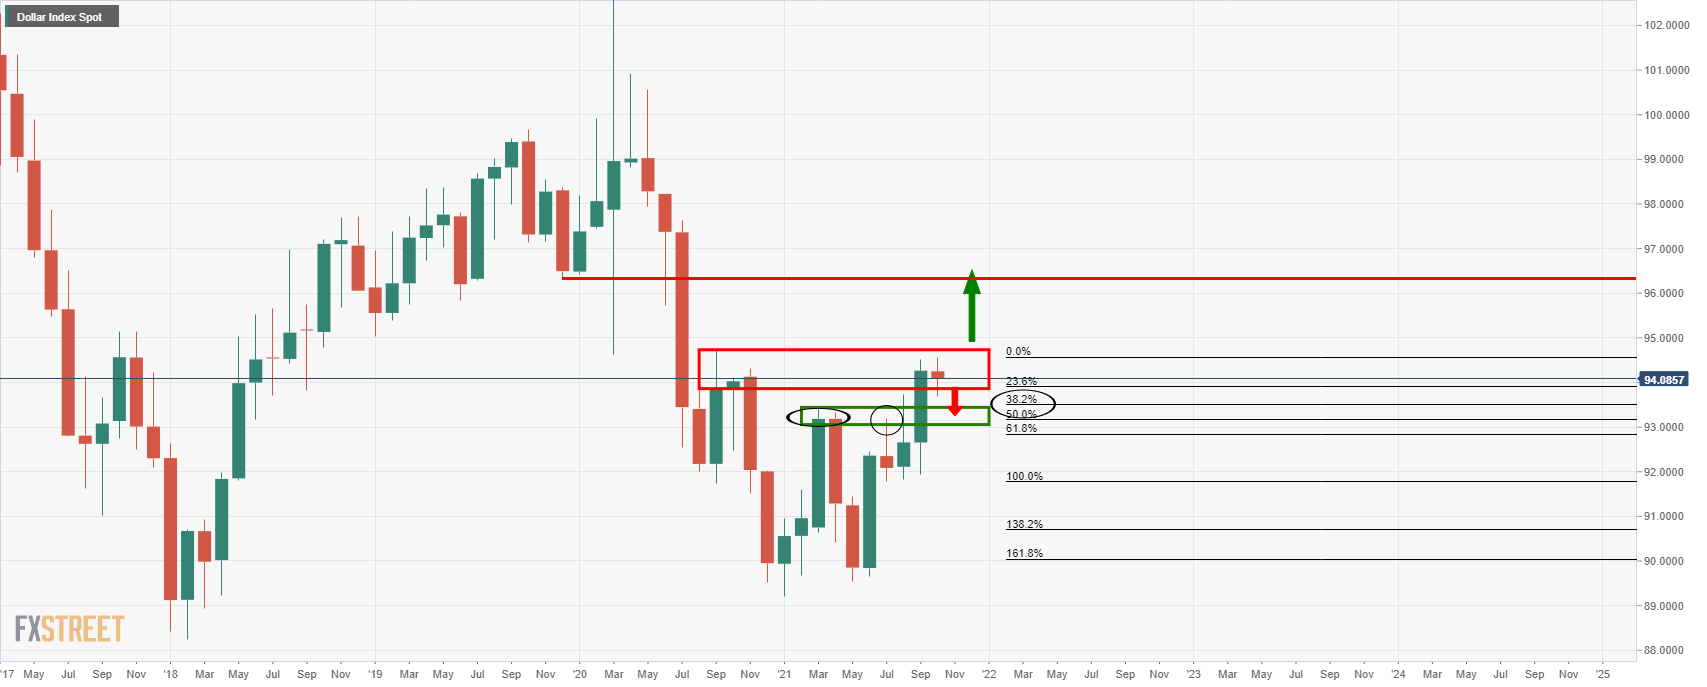
At this juncture, the 38.2% and 50% Fibonacci retracements levels align with the old market structure between March and August 2021 between 93.18 and 93.50.
Gold's fat right tail
Meanwhile, a fundamental and strongly bullish case for gold has been made today by analysts at TD Securities as follows:
Although stagflation has captured share of mind, it has yet to translate into additional gold demand. However, as the global energy crisis intensifies, reasons to own the yellow metal are also growing more compelling. A cold winter could send energy prices astronomically higher, asymmetrically fueling stagflationary winds. This translates into a fat right tail in gold prices. With a low bar for short covering, CTA trend follower purchases could be a potential catalyst.
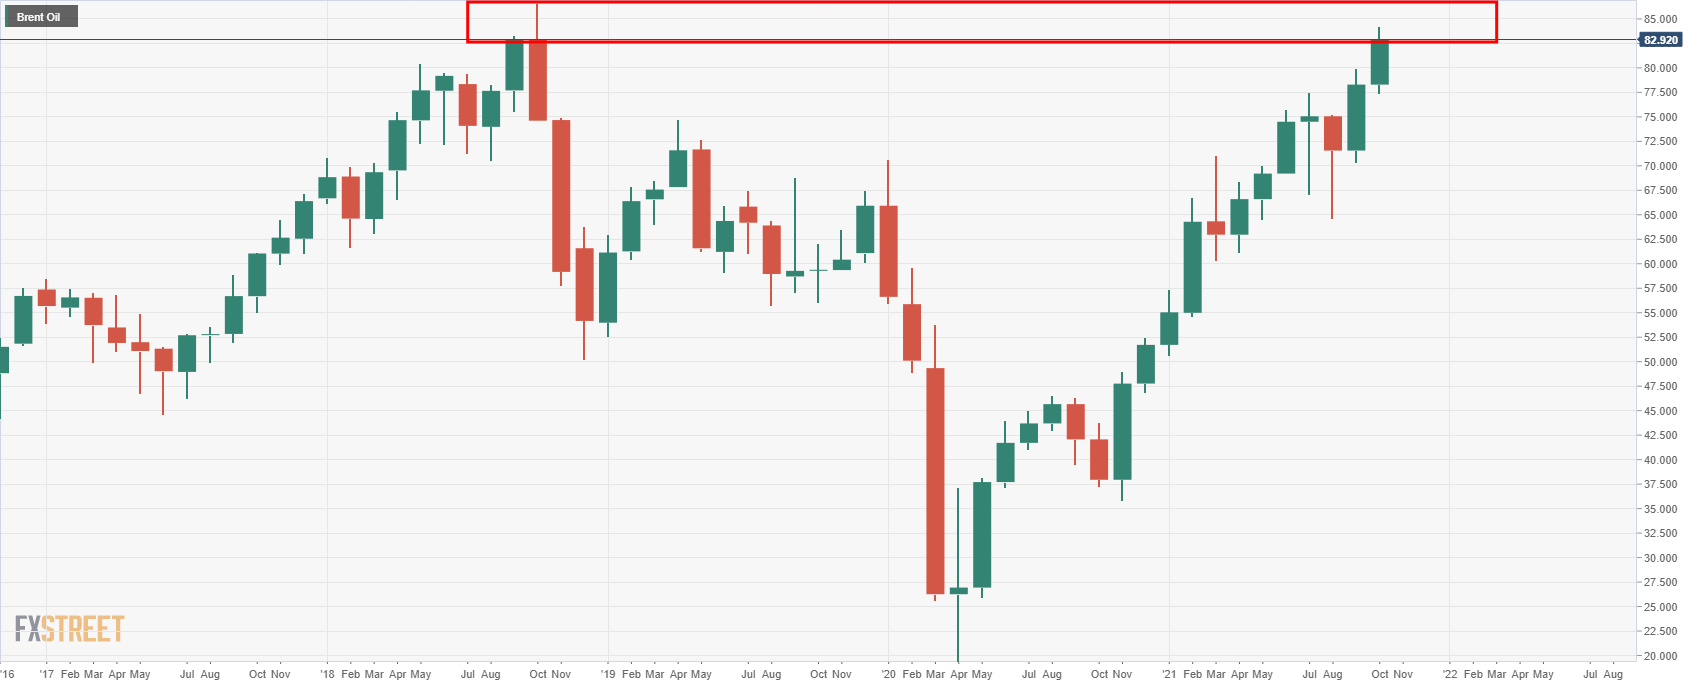
The price of Brent crude, the worlds global benchmark for oil has steadied on the day but remain near to the highest levels since Oct 2018:
Gold technical analysis
- Gold Chart of the Week: XAU/USD bulls step in
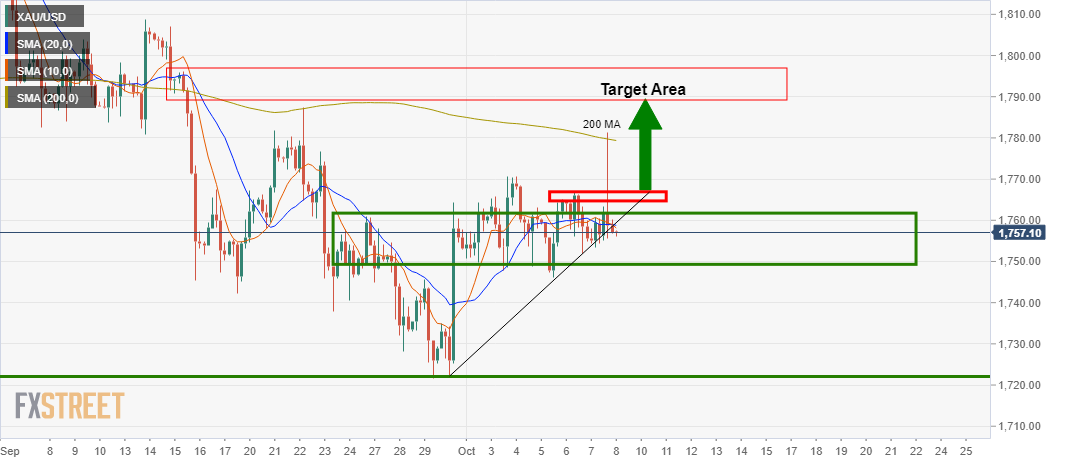
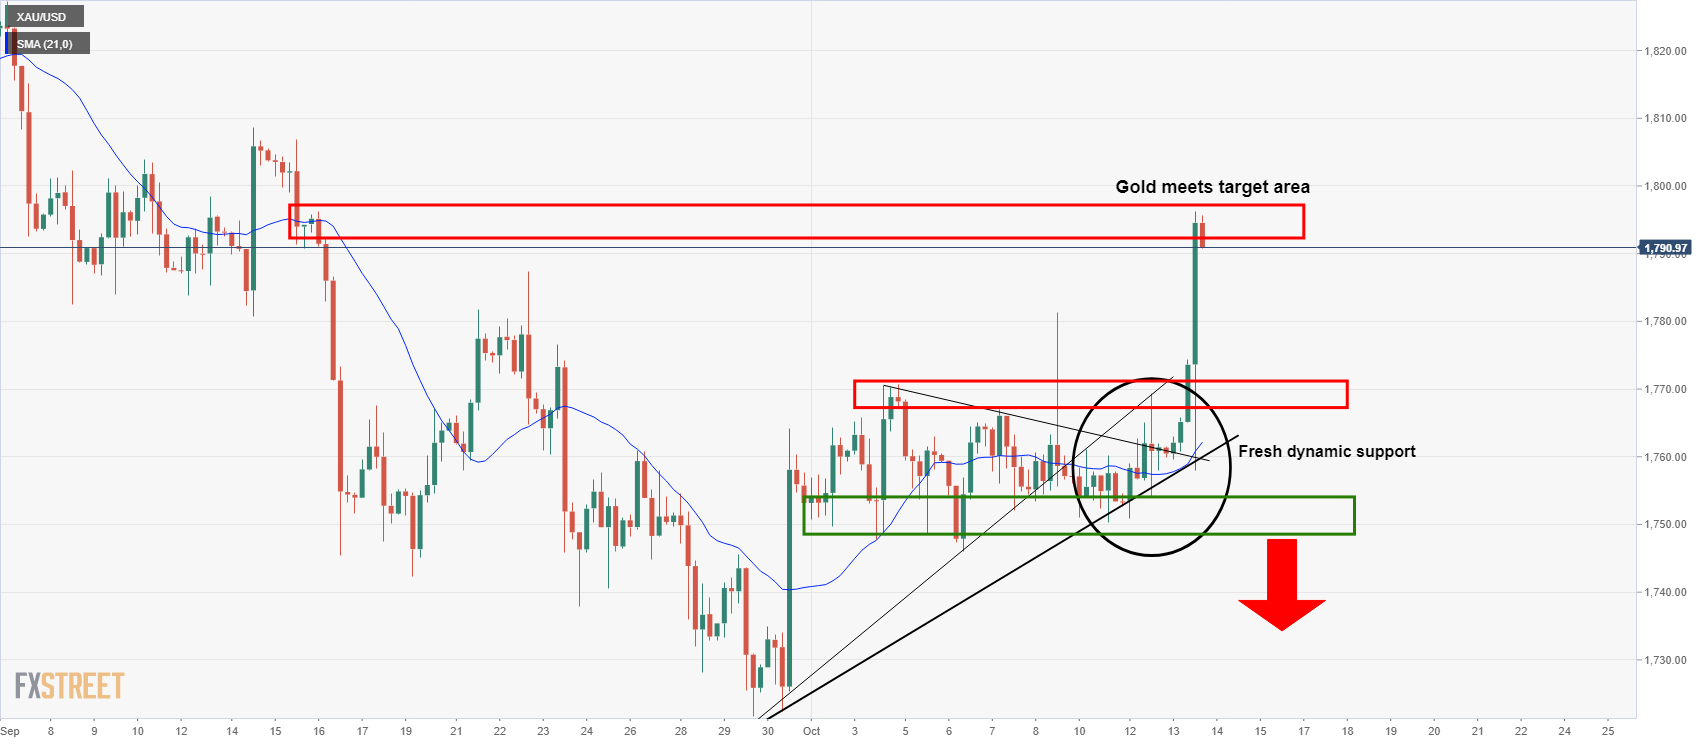
As illustrated on the chart above in analysis at the Asian open this week, from a 4-hour perspective, the target area was between 1,790/1,800 which has been met in today's rally.
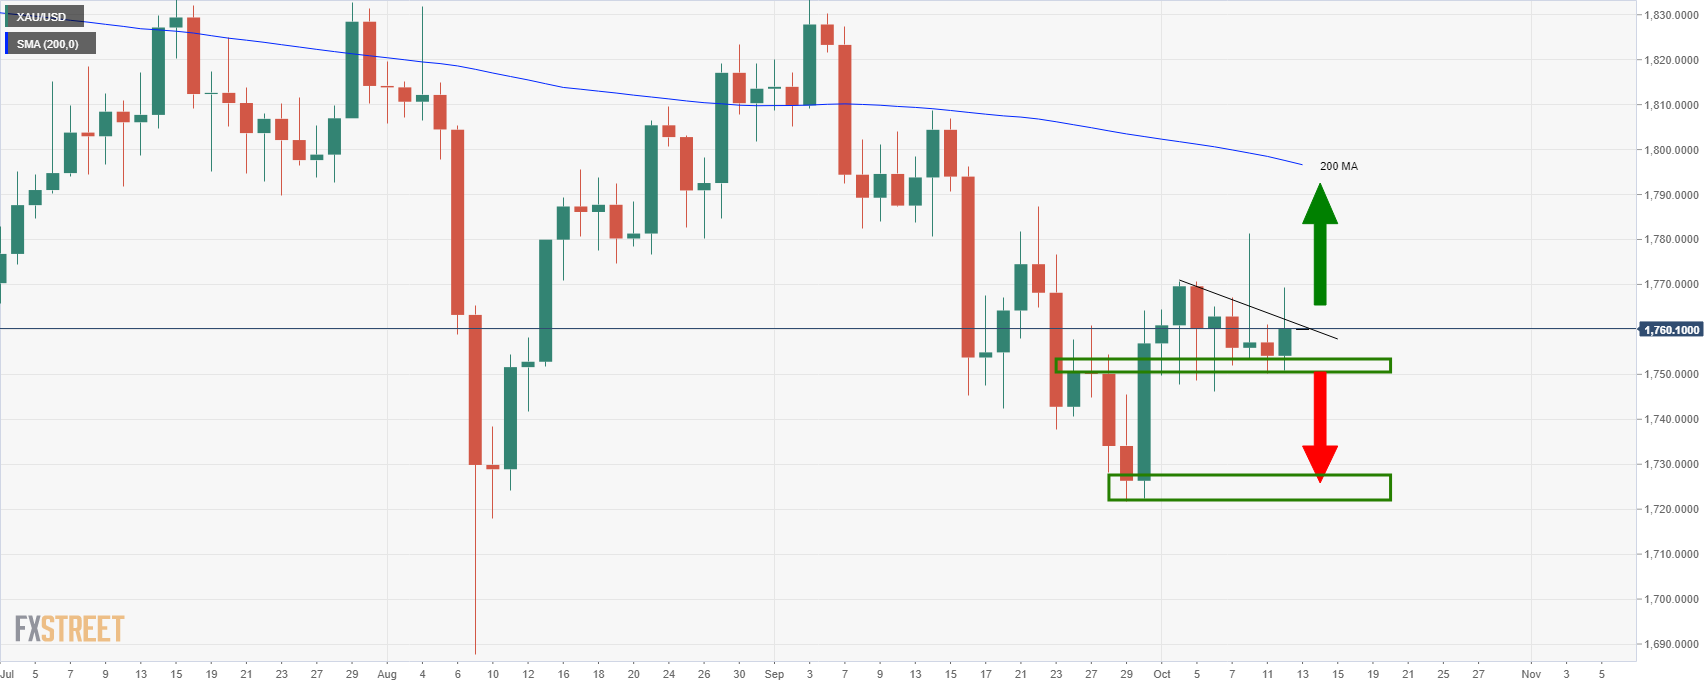
On Tuesday, as the chart below shows, the bears had been testing the grit of the bulls and the price had moved sideways along horizontal support and pushing dynamic support further out along the trend as follows:
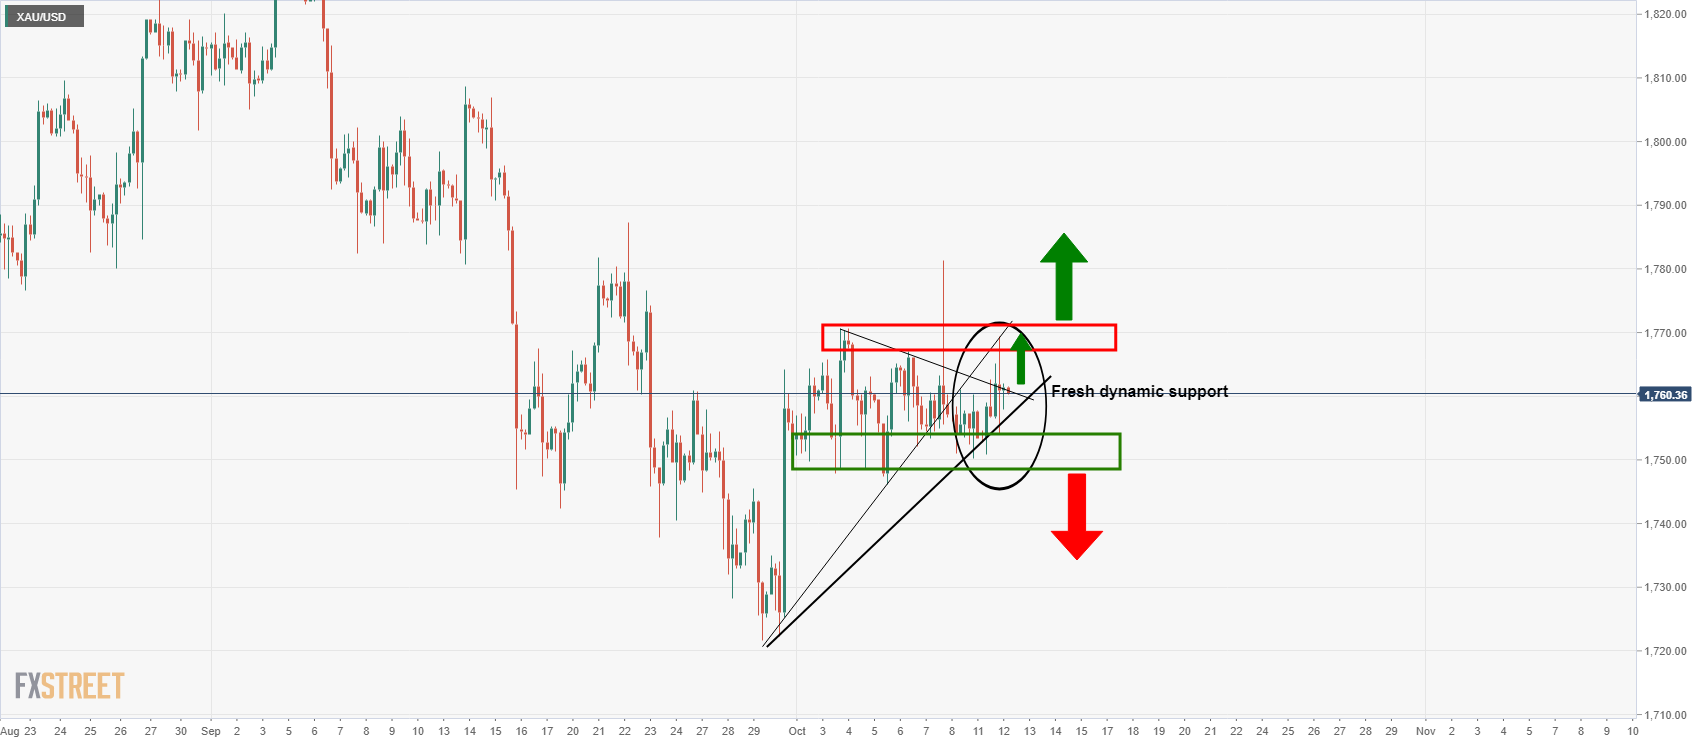
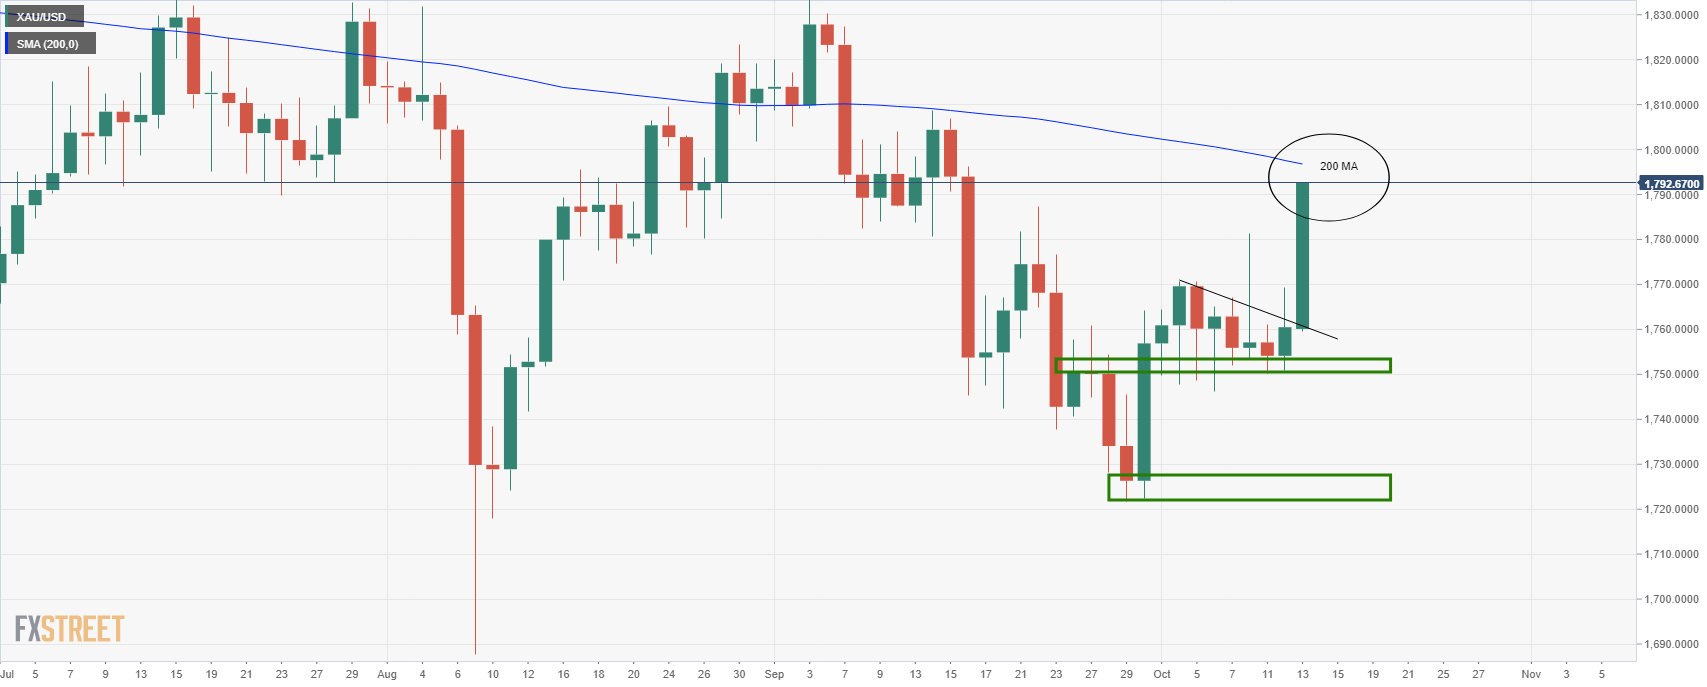
However, the price broke the dynamic resistance which led to the bullish breakout towards the daily 200 MA near 1,800, a move that was illustrated in the daily chart from Tuesday's analysis as follows:
Gold live market, 4-hour chart
Gold live market, daily chart
At this juncture, the price would be expected to stall as traders take profit and assess the landscape of current market themes awaiting the next major catalyst. With that being said, a correction to at least a 38.2% Fibonacci retracement would be expected in the near future. Currently, that level comes in near to $1,780.
- Pound's rally is capped again right below 155.00.
- BoE rate hike expectations are fuelling sterling's rally.
- GBP/JPY is expected to reach 159.80 area – Credit Suisse.
The British pound appreciated for the fifth consecutive day against a weaker Japanese yen on Wednesday, although the pair has been unable to breach the resistance area at 154.80/90.
The pound remains bid on BoE hike expectations
The sterling remains firm across the board, which has reflected in the 3.2% GBP/JPY rally witnessed over the last two weeks. Investors are anticipating that the Bank of England will be the first major central bank to start hiking interest rates following the COVID-19 crisis. The surging energy prices have boosted yearly inflation well beyond the Bank of England’s 2% target for price stability, which has prompted some BoE officials to openly suggest the possibility of accelerating rate hikes, therefore increasing GBP’s attractiveness for investors.
On the other end, the Japanese yen, particularly sensitive to monetary policy differentials is suffering against the GBP and the USD. With the Bank of Japan discarding the possibility of any rate hike for the foreseeable future, and with the yield curve under control, the JPY remains vulnerable against monetary tightening expectations in the rest of the world’s major economies.
GBP/JPY expected to keep rallying towards – 159.80
In a bigger picture, the FX Analysis team at Credit Suisse expect the pound to continue appreciating in the coming weeks, heading to levels near 160.00: “With a major base already seen established in February 2021, we look for a break above 156.62 to further reinforce the positive outlook, with resistance seen next at 159.80.”
Technical levels to watch
- Silver advances on the back of lower US T-bond yields, despite high inflationary pressures.
- FOMC’s September meeting minutes showed that half of its members expect an interest rate hike by 2022.
- Further, the Fed minutes revealed that the pace of the QE reduction would be in the amount of US $15 billion.
Silver (XAG/USD) climbs during the New York session, trading at $23.09, up almost 2.35% at the time of writing. Factors like the August US higher inflation reading with the Consumer Price Index, rising 5.4% (YoY), the energy crisis in Asia and Europe, and falling US T-bond yields boosts the white metal.
Moreover, on Tuesday, Federal Reserve members, across the wires, expressed that they would like to start the QE’s reduction by the November meeting. Additionally, FOMC last meeting minutes just released revealed that half of its members expect an interest rate hike by the end of 2022. Further, the pace of monthly asset purchases will be reduced by $15 billion, with $10 billion in the case of Treasury securities and $5 billion In the case of mortgage-backed securities (MBS).
The market sentiment is slightly upbeat, as depicted by US stock indexes rising between 0.20% and 0.65%, except for the Dow Jones Industrial, which is falling 0.07%.
The US Dollar Index that tracks the greenback’s performance against a basket of peers is down 0.41%, sits at 94.13, underpinned by the slump in the US T-bond 10-year benchmark note rate sliding three basis points to sit at 1.549%, lifting the prospects of higher non-yield metal prices.
XAG/USD Price Forecast: Technical outlook
Daily chart
Silver (XAG/USD) approaches the 50-day moving average (DMA) around $23.28. The longer time frame daily moving averages are located above the spot price, indicating that the white metal is in a downtrend. The Relative Strength Index, known as RSI, a momentum indicator, is at 54, with an upslope, suggesting that silver has some buying pressure.
A daily close above the 50-DMA could open the way for another leg up, towards $24.85, but it would find some hurdles on the way up. The first resistance would be $23.94. A breach of the latter coupled with a break above $24.00. could accelerate the upward trend towards the next supply zone at $24.28 before reaching $24.85.
KEY ADDITIONAL LEVELS TO WATCH
- Kiwi's rebound from 0.6910 stalls below 0.6970/80 resistance area.
- The dollar loses ground with the US yield curve flattening.
- The FOMC minutes confirm QE tapering before the end of the year.
New Zealand's dollar has bounced up from session lows at 0.6910 on Wednesday to erase Tuesday’s losses, favoured by a somewhat softer US dollar. The pair however has stalled below the top of the last week’s trading range at 0.6970/80
The USD treads water as the US yield curve flattens
The kiwi has been favored by a moderate USD weakness on Wednesday with the flattening US yields’ curve weighing on the US dollar. The yield of the US 10-year note has dropped to 1.54% on Wednesday from 5-month highs at 1.61% on Tuesday while the 2-year yield surged to 18-month highs.
The economic calendar has failed to offer support to the dollar. The minutes of Federal Reserve’s September’s meeting have supported the idea that QE tapering might be officially announced next month, stating that “a gradual tapering process that concluded around the middle of next year would likely be appropriate”
Beyond that, some participants have acknowledged that inflation pressures might remain for a longer than expected period and have suggested the possibility of start hiking interest rates by the end of next year.
Previously, the US CPI confirmed market expectations that high inflation remains looming over the post-pandemic recovery, which bears into question Fed Powell’s theory of “temporary” inflation. Consumer prices accelerated to a 0.4% monthly pace in September, from 0.3% in August, with the yearly inflation increasing to 5.4% from 5.3% on the previous month.
Technical levels to watch
The Fed released its minutes of the September monetary policy meeting.
Key points coming through:
Participants reaffirmed that the committee's "substantial further progress" standard regarding its asset purchases was distinct from the criteria given in its forward guidance on the federal funds rate.
The committee had articulated a different, and more stringent, test concerning the conditions that would need to be met before it started raising the target range for the federal funds rate
Participants generally assessed that, provided that the economic recovery remained broadly on track, a gradual tapering process that concluded around the middle of next year would likely be appropriate
Various participants stressed that economic conditions were likely to justify keeping the rate at or near its lower bound over the next couple of years
Participants noted that if a decision to begin tapering purchases occurred at the next meeting, the process of tapering could commence with the monthly purchase calendars beginning in either mid-November or mid-December.
A number of participants raised the possibility of beginning to increase the target range by the end of next year because they expected the labour market and inflation outcomes specified in the committee's guidance to be met by then.
Some of these participants saw inflation as likely to remain elevated in 2022 with risks to the upside.
Participants cited upside risks that inflation would continue for longer than expected, especially if labour and other supply shortages proved more persistent than currently anticipated.
Most participants remarked that the standard of "substantial further progress" had been met with regard to the committee's price-stability goal or that it was likely to be met soon.
Several participants expressed concern that the high degree of accommodation being provided by monetary policy, including through continued asset purchases, could increase risks to financial stability.
A number of participants assessed that the standard of substantial further progress toward the goal of maximum employment had not yet been attained but that, if the economy proceeded roughly as they anticipated, it may soon be reached.
A number of other participants indicated that they believed that the test of "substantial further progress" toward maximum employment had been met.
Some of these participants also suggested that labour supply constraints were the main impediments to further improvement in labour market conditions rather than lack of demand.
All participants agreed that it would be appropriate for the current meeting's postmeeting statement to relay that, if progress continued broadly as expected, a moderation in the pace of asset purchases may soon be warranted.
Participants generally commented that the "illustrative path" of taper developed by Fed staff provided a straightforward, appropriate template that policymakers might follow.
Participants noted that uncertainty remained high.
Participants judged that the current stance of monetary policy remained appropriate to promote maximum employment as well as to achieve inflation that averages 2% over time and longer-term inflation expectations that are well anchored at 2%.
The illustrative path encompassed monthly reductions of $10 bln in treasuries and $5 bln of MBS.
Most participants saw inflation risks as weighted to the upside.
A couple of participants observed that giving advance notice to the general public of a plan along these lines may reduce the risk of an adverse market reaction to moderation in asset purchases.
Several participants indicated that they preferred to proceed with a more rapid moderation of purchases than described in the illustrative examples.
Many participants noted the substantial rise in one- and three-year measures of inflation expectations in the New York Fed's survey of consumer expectations or in the one-year measure in the university of Michigan survey.
Participants observed that the inflation rate was elevated, and they expected that it would likely remain so in the coming months before moderating.
Participants marked up their inflation projections and some expressed concerns that elevated rates of inflation could feed through into longer-term inflation expectations of households and businesses.
Several participants indicated that a rise in the labour force participation rate might lag the improvements in other indicators such as the unemployment rate - a pattern consistent with past business cycle recoveries.
Various participants suggested that a complete return to pre-pandemic labour market conditions was unlikely.
Several other participants suggested that the upward pressure on prices would abate as the covid-related demand and supply imbalances subsided.
Members agreed post-meeting statement was an appropriate means of acknowledging that, in the near future, the committee would likely assess that the standard for reducing the pace of net asset purchases had been met.
A number of others assessed that once the covid-related concerns that were currently weighing on labour force participation passed, the participation rate and the EPOP ratio could return to, or even exceed the pre-pandemic levels.
A few participants noted that there was not yet evidence that robust wage growth was exerting upward pressure on prices to a significant degree, but also that the possibility merited close monitoring.
Market implications
The greenback is rising marginally from the lows of the day on the release. Prior to the minutes, the US dollar had eased back from a one-year high as longer-dated Treasury yields fell after US inflation data, despite it showing that prices rose solidly in September, advancing expectations for Federal Reserve tightening. However, the greenback has been ripe for bearish pickings considering how far it has come in just a couple of weeks, rising some 1.7% and running into a wall of resistance as per the Sep 2020 highs.
US dollar monthly chart
Meanwhile, the Fed funds futures indicate > 95% chance for Dec 22, ~70% chance for a Nov 22 rate hike. That's a big increase vs. last week.
- The euro extends recovery from 1.15.25 lows to levels near 1.1600.
- The US dollar loses ground with all eyes on the FOMC minutes.
- EUR/USD remains bearish, targeting 1.1000 – Credit Suisse.
The euro has continued regaining lost ground against a somewhat softer dollar on Wednesday with the investors awaiting the release of the minutes of the last FOMC meeting. The pair has bounced up from year-to-date lows at 1.1525 to appreciate about 0.5% returning to levels a few pips shy of 1.1600.
The dollar loses ground ahead of the FOMC minutes
The greenback is extending losses on Wednesday, with the market bracing for the release of the last Fed’s meeting minutes The market looking for clues on the possibility that the Bank will announce the tapering of its QE program in November and possibly suggest the timing of the first interest rate hike.
Beyond that, the flattening US bond yield curve has added negative pressure on the USD on Wednesday as the benchmark 10-year note has pulled back to 1.57% from levels past 1.6% on Tuesday. On the macroeconomic calendar, US Consumer Prices Index figures have confirmed the inflationary trend observed over the previous months, adding pressure on the US central bank to normalize its monetary policy.
EUR/USD remains bearish, targeting 1.1000 – Credit Suisse
The current euro recovery, however, is seen as a mere correction by Credit Suisse’s FX Analysis team. In a bigger picture, the pair remains heading lower: “EUR/USD is probing the weekly Ichimoku cloud and is close to the peak of March 2020 at 1.1495. Defending this can result in a rebound, however, 1.1665 could cap (…) Below 1.1495, next support could be at 1.1450 and projections of 1.1380 (…) “Whilst we would expect a fresh hold at 1.1290, we continue to see the broader risks skewed to the downside, with support seen next at 1.1020/00.”
Technical levels to watch
- EUR/GBP holding steady s US dollar drives the forex flows.
- Both EUR and GBP are up significantly as the US dollar corrects lower ahead of FOMC Minutes.
In US dollar volatility, EUR/GBP is sidelined as both the pound and euro rally on falling long-dated US Treasury yields and a weaker US dollar. The US dollar is driving the forex space. Despite higher wages in today's inflation data and firmer rate hike expectations in the US, the greenback has tumbled from near a one-year high on Wednesday.
At the time of writing, EUR/GBP is trading at 0.8485 and flat on the day having travelled between a narrow 0.8472 - 0.8495 range. However, from Brexit developments and UK data to the Federal Reserve minutes at the top of the hour, there is enough happening in the background across the US and UK to keep traders of the pair on their toes.
US interest rate rises eyed
Firstly, US inflation data showed prices rose solidly in September, stoking expectations the Federal Reserve will announce a tapering of stimulus next month, with the potential for rate hikes by mid-2022. The Consumer Price Index rose 0.4% last month, versus a 0.3% rise expected by economists polled by Reuters.
In the 12 months through September, the CPI increased 5.4%, up from a 5.3% year-on-year advance in August, Reuters reported. ''Excluding the volatile food and energy components, the so-called core CPI climbed 0.2% last month, up from 0.1% in August.'' Coming up, the Fed will release the minutes from its September meeting later on Wednesday and they will be parsed for signs of a November announcement that the central bank will announce a tapering of its bond-buying stimulus.
BoE tipped to be the first to raise rates
Meanwhile, the pound has edged higher on the Currency Strength Index, moving into third place behind the Aussie and Canadian dollar, commodity currencies that are stronger on the inflation hedge. Earlier, traders assessed data showing the British economy grew slightly below consensus in August. However, the sentiment is that was not enough to dent expectations the Bank of England (BoE) will increase rates. Britain's economy grew 0.4% in August, leaving it just 0.8% smaller than it was in February 2020, the Office for National Statistics said. Economists polled by Reuters had forecast monthly gross domestic product growth of 0.5% for August.
One of the major driving forces behind the pound is the expectation that the BoE will be the first major central bank to raise interest rates since the beginning of the pandemic. Investors are betting on a rise to 0.15% by December. GBP/USD had rallied to a two-week high of 1.3674 on Monday due to weekend headlines that quoted key members of the BoE, including the governor of the central bank, Andrew Bailey, and fellow policymaker, Michael Saunders, who both warned of inflationary risks and the need to act. Sanders warned that households must brace for "significantly earlier" interest rate rises. Bailey stressed the need to prevent inflation from becoming permanently embedded.
Brexit turns a significant corner
In other positive news for the pound, Brexit headlines have been coming in on Wednesday with updates from Brussels that plans to dramatically reduce checks on goods entering the region in a bid to end nearly two years of wrangling.
However, one key sticking point remains – UK Brexit Minister Lord Frost’s demand to rewrite the Protocol to at least dilute the role of the European Court of Justice (ECJ) in overseeing the rules. If Lord Frost does not back down on this, an EU official said it will be “a very big gap between the ideas we are putting on the table today and what the UK Government is asking for.''
- The US dollar dives for the second day in a row to test support at 1.2425.
- Oil prices, BoC rate hike expectations buoy the CAD.
- USD/CAD: A bearish H&S might push the pair to 1.2303 - DBS Bank.
The US dollar is trading lower against its Canadian counterpart for the second consecutive day on Wednesday. The pair’s recovery attempt seen on the early US trading session has been capped at 1.2470 and the greenback has pulled back again following the release of US Consumer Prices Index data.
Lower US yields, BoC supporting the CAD
On a broader picture, the USD/CAD has depreciated about 2.5% so far in October, with the Canadian dollar going through a steady upside trend, boosted by higher oil prices and market expectations the Bank of Canada will be forced to hike rates early next year to tackle inflation pressures. Beyond that, the flattening US yield curve, with the 10-year note down to 1.57 from five-month highs at 1.61% on Tuesday, has increased bearish pressure on the USD.
Furthermore, US macroeconomic data has failed to provide support to the US dollar. The higher than expected US consumer prices, with September's CPI accelerating to a 0.3% monthly rate and 5.4% year on year in September, have confirmed the inflationary pressures looming over the post-pandemic recovery, adding pressure to the Fed to start rolling back its massive bond-buying program.
The dollar has posted a moderately negative reaction to the data, while the investors await the release of the last FOMC meeting’s minutes to assess the possibilities that the bank will start tapering QE in November and the pace of the Bank’s monetary policy normalization plan.
USD/CAD: A bearish H&S might push the pair towards 1.2303 – DBS Bank
From a technical perspective, Benjamin Wong, Strategist at DBS bank, warns about the potential impact of a bearish H&S figure: “In the term, USD/CAD is pushing lower off a bearish head-and-shoulders reversal. A cursory look suggests this pattern should guide USD/CAD lower as its neckline around 1.2594 has clearly crated, validating the pattern (…) Having a calibrated target should give us a measuring rod, as USD/CAD is teasing the weekly charts’ Kijun support at 1.2478. A textbook scenario can see USD/CAD head towards 1.2303. Concurrently, USD/CAD is also framing a triangle break.”
Technical levels to watch
- GBP/USD climbs around this week’s tops 1.3670’s area, on broad US dollar selling pressure.
- Inflationary pressures threaten to derail the economic recovery.
- UK GDP for August increased by 6.9%, better than expected.
- US CPI rose to 5.4%, the highest gain since 2008.
During the New York session, the British pound advances almost half percent, trading at 1.3651 at the time of writing. The market sentiment is mixed, as US equity indexes seesaw between gains and losses.
Higher US inflation September reading than estimated, coupled with slower growth, threatens to derail the economic recovery. Furthermore, an ongoing energy crunch in Asia and Europe spurred the perception in consumers that companies with higher electricity prices could pass on those costs to them without harming the business.
US Consumer Price Index at higher readings since 2008, overshadowed the UK GDP figure
The UK economic docket featured the Gross Domestic Product for August annually, which rose by 6.9%, two ticks higher than the 6.7% estimated by economists. Despite being a positive figure, investors’ focus was on the United States Consumer Price Index. The GBP/USD barely blinked on the news.
Meanwhile, on the US front, the Consumer Price Index rose by 5.4%, more than the 5.3% YoY reading expected by analysts. The reading is the highest annual gain since 2008. The Core Consumer Price Index, which excludes food and energy, increases by 4% annually, according to estimations. The GBP/USD initial reaction was to the downside, reaching 1.3587, but bounced off the lows and printed a daily high around 1.3646, at the time being.
GBP/USD Price Forecast: Technical outlook
Daily chart
The GBP/USD is approaching the top of the week around 1.3670’s area. However, the daily moving averages (DMA’s) are still above the spot price, maintaining the downtrend on the pair. Also, the momentum indicator like the Relative Strenght Index (RSI) at 49 broke below the 50-midline, suggesting that downward pressure is mounting on the GBP/USD pair.
Failure to break above the 1.3700 figure could tumble the pair towards 1.3411, but it would find some hurdles on the way down. The first support level would be the October 12 low at 1.3567, followed by the September 28 low at 1.3520, and then the September 29 low at 1.3411.
KEY ADDITIONAL LEVELS TO WATCH
- USD/CHF retreats from 0.9300 to test trendline support at 0.9265.
- Below 0.9265, the pair might head towards 0.9215 and 0.9150.
- On the upside, the pair faces an important resistance at 0.9300/10.
The US dollar has been rejected again at 0.9300 resistance area, before losing momentum and drop 0.4% on the day so far, to test trendline support from early August lows, now around 0.9265.
The dollar is losing ground against its main peers on Wednesday, weighed by the flattening US yield curve, with the 10-year note dropping to 1.57%, from five-month highs at 1.61 on Tuesday.
USD/CHF daily chart
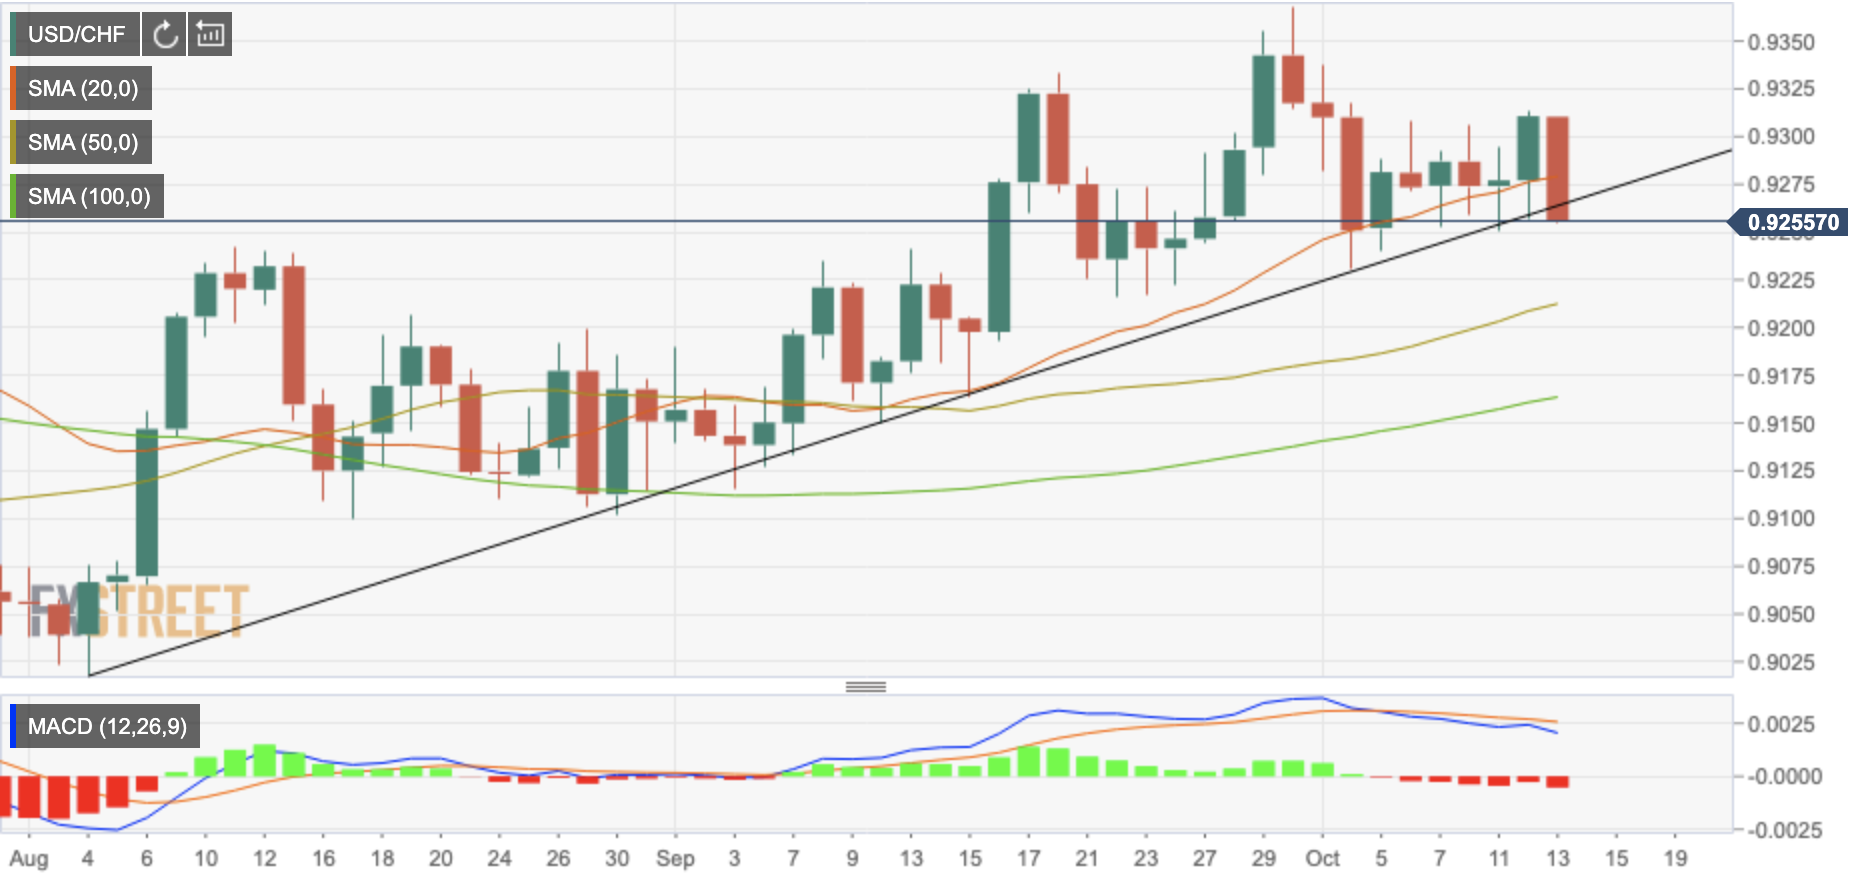
The daily chart, shows the pair below the 20-day SMA, testing the mentioned trendline at 0.9365. A confirmation below here will cancel the near-term uptrend and might empower bears to push the pair towards 0.9215 (September 22, 23 lows, and 50-day SMA) before testing 0.9150 (September 10 low)
On the upside, immediate resistance remains at 0.9300/10 (October 6, 8, and 12 highs). Above here, the pair might attempt another attack to multi-month high 0.9380 (Sept. 30 high, 78,6% Fib. Retracement of the March-June decline) and 0.9435 (Apr. 5 high).
Technical levels to watch
- The Aussie dollar breaks above 0.7350 on a higher US CPI reading.
- A mixed market sentiment put a lid on the AUD gains.
- AUD/USD: A daily close above 0.7400 opens the door for a test of the 100-DMA.
The AUD/USD is rising during the New York session, is trading at 0.7373, up 0.30% at the time of writing.
The market sentiment seesaws between risk-on/off mood, depicted by European stock indexes rising between 0.17% and 0.75%, while across the pond, American equity indexes are losing in the range of 0.25% and 0.52%, except for the Nasdaq Composite, which is in the green.
Factors like the higher US CPI reading, rising energy prices, and the possibility of slower growth dampen the market sentiment throughout the New York session. In the meantime, the US Dollar Index, which measures the greenback’s performance against a basket of six rivals, losses ground as US T-bond yields fall, declines 0.31%, sits at 94.18.
Iron ore is falling 6.20%, trading at $120.00 per metric tonne, putting a lid on the Australian dollar upside move.
On the Australian economic docket, the Westpac Consumer Confidence Change shrank to 1.5% worse than the 2% increase estimated by investors.
On the US front, the Consumer Price Index, on an annual basis, rose 5.4% in September, from a year earlier, a tick higher than the August reading. Meanwhile, the Core Consumer Price Index, which excludes the volatile food and energy prices, climbed 4%, unchanged from a year earlier.
Later on the day, the Federal Open Market Committee’s (FOMC) last meeting minutes will be unveiled at 18:00 GMT.
AUD/USD Price Forecast: Technical outlook
Dail chart
The Aussie dollar is approaching the top of the week. The 50-day moving average (DMA) at 0.7302 is the first support level, whereas the 100 and the 200-DMA remain above the spot price, acting as resistance levels.
Momentum indicator like the Relative Strength Index (RSI) at 59, aiming slightly up, supports the upward trend, but a daily close above 0.7400 could motivate AUD/USD buyers in their attempt to push the pair higher. In that outcome, the first resistance level would be the 100-DMA at 0.7416. A breach of that level could move the pair towards the September 3 high at 0.7477, immediately followed by 0.7500.
KEY ADDITIONAL LEVELS TO WATCH
- The dollar remains near three-year highs at 113.80, supported above 113.00.
- The Japanese yen edges up after a four-day downtrend.
- USD/JPY's rally is heading to 120.00 – ING.
The US dollar is regaining some ground against the Japanese yen on Wednesday’s US trading session. The pair’s reversal from three-year highs at 113.80 has found support at 113.25, before ticking up to 113.45.
The yen edges up against a softer US dollar
The Japanese yen appreciated earlier on Wednesday, supported by a somewhat weaker dollar, on the back of a flattening US yield curve. The 10-year bond yield has dropped to 1.57% after having peaked at 1.61 on Tuesday, while the 2-year yield has surged to 18-month highs at 0.36%
Furthermore, the US macroeconomic calendar has confirmed the inflationary pressures threatening economic recovery. US consumer prices accelerated at a 0.4% monthly pace and 5.4% year-on-year in September, from 0.3% and 5.3% respectively in September.
These figures bring into question Fed Powell’s theory of a “transitory” high inflation and bolster expectations the Federal Reserve may announce the rolling back of its massive monetary stimulus program in November.
USD/JPY: Seen rallying towards 120.00 – ING
According to the FX Analysis team at ING, however, USD’s rally is far from being finished. They expect the pair to reach prices at 120.00: “Pressure is building for a topside break out in USD/JPY. We think the US macro/Fed story will be a positive one for the dollar over the next 15 months (USD/JPY to trade to 120), while home-grown developments look slightly JPY bearish.”
Technical levels to watch
- The euro ticks up against a weaker USD and returns to 1.1580.
- The greenback pulls back as the US bond yields' curve flattens.
- EUR/USD remains negative, heading towards 1.1000 – Credit Suisse.
The euro is taking advantage of a somewhat softer dollar on Wednesday to regain lost ground. The pair has bottomed at year-to-date lows at 1.1525 to appreciate about 0.4% on the day, reaching session highs near 1.1580 so far.
The dollar loses ground as the US yield curve flattens
The greenback is trading lower against its main peers on Wednesday, weighed by a flattening US bond yield curve. The benchmark 10-year note has pulled back to 1.57% from levels above 1.6% on Tuesday, while shorter-term yields are building up. The yield of the 2-year Treasury bond has climbed to 0.35%, its highest level in 18 months.
On the macroeconomic calendar, US Consumer Prices have confirmed the inflationary trend observed over the previous months. Consumer inflation accelerated at a 0.4% pace in September, from 0.3% in the previous month while the yearly inflation increased by 5.4%, from 5.3% in August.
These figures cast doubt on Fed Powell’s theory of “temporary” high inflation pressures, adding pressure on the US central bank to announce QE tapering in November.
EUR/USD remains bearish, targeting 1.1000 – Credit Suisse
The current euro recovery, however, is seen as a mere correction by Credit Suisse’s FX Analysis team. In a bigger picture, the pair remains heading lower: “EUR/USD is probing the weekly Ichimoku cloud and is close to the peak of March 2020 at 1.1495. Defending this can result in a rebound, however, 1.1665 could cap (…) Below 1.1495, next support could be at 1.1450 and projections of 1.1380 (…) “Whilst we would expect a fresh hold at 1.1290, we continue to see the broader risks skewed to the downside, with support seen next at 1.1020/00.”
Technical levels to watch
- XAU/USD rallies above $1,780 on a higher than expected US CPI reading.
- Fed policymakers across the wires agreed to begin the bond taper by the FOMC November meeting.
- Silver rises in tandem with gold, almost 3% in the day.
Gold (XAU/USD) surges during the New York session, trading at $1,793, up almost 1.86% at the time of writing. Factors like the August US higher inflation reading with its Core component, rising 0.2% (MoM), the ongoing energy crunch in Europe and Asia, and falling US 10-year Treasury yield boosts the non-yielding metal.
Furthermore, on Tuesday, Federal Reserve members, across the wires, expressed that they would like to start the QE’s reduction by the November meeting, propelling investors towards safe-haven assets like gold and silver (XAG/USD), which is advancing almost 3%, around $23.20.
The market sentiment is mixed as depicted by European equity indexes rise between 0.12% and 0.55%, while across the pond, more significant stock indices fall between 0.21% and 0.48%, except for the tech-heavy Nasdaq Composite, which is rising 0.42%.
The US Dollar Index that tracks the greenback’s performance against a basket of peers is down 0.28%, sits at 94.25, underpinned by the slump in the US T-bond 10-year benchmark note rate slumping four basis points to sit at 1.533%, lifting the prospects of higher yellow-metal prices.
US Consumer Price Index rose above 5.4%, a tick higher than expected
Data-wise, the US Bureau of Labor Statistics (BLS) released inflationary numbers for August. The Consumer Price Index increased by 5.4%, higher than the 5.3%, whereas the Core Consumer Price Index, which excludes food and energy prices, remained unchanged at 4%, both readings on an annual basis.
Later on, the Federal Reserve will unveil the last FOMC meeting minutes at 18:00 GMT.
XAU/USD Price Forecast: Technical outlook
Daily chart
Gold (XAU/USD) tests the 200-day moving average (DMA) at around $1,799. A daily close above the latter would change the downward bias in the non-yielding metal, as the 200-DMA is the barometer of a long-term trade in the financial markets. But, besides the 200-DMA, the 100-DMA and a downward slope trendline could exert intense selling pressure around the $1,795 - $1,805 area.
For XAU/USD buyers, a daily close above that zone could pave the way for further gains. The first supply level would be the September 3 high at $1,833. A breach above that level could expose the June 11 high at $1,902.
Momentum indicators like the Relative Strength Index (RSI) is at 59, is aiming aggressively to the upside, suggesting that gold is under intense buying pressure as it remains below oversold levels.
XAU/USD KEY ADDITIONAL LEVELS TO WATCH
- DXY comes under pressure and retreats to the 94.20 region.
- US headline CPI rose 5.4% YoY in September, above consensus.
- The FOMC Minutes are due later in the NA session.
The US Dollar Index (DXY), which gauges the greenback vs. a basket of its main competitors, keeps the selling bias unchanged around the 94.30/20 band midweek.
US Dollar Index now looks to FOMC
Sellers have returned to the market and now drag the index to the negative territory for the first time after two consecutive daily advances, including new 2021 tops at 94.56 recorded on Tuesday.
The move lower in the buck tracks the retracement in US yields, where the 10-year reference hovers around the 1.57% region while the front-end of the curve trades near the 0.34% zone.
The index briefly leapt to the mid-94.00s soon after inflation figures tracked by the CPI rose at an annualized 5.4% in September (vs. 5.3% exp), while the Core print matched estimates at 4.0% YoY. However, the bullish attempt ran out of steam and returned to the 94.30/20 region soon afterwards.
US Dollar Index relevant levels
Now, the index is losing 0.25% at 94.27 and a break above 94.56 (2021 high Oct.12) would open the door to 94.74 (monthly high Sep.25 2020) and then 94.76 (200-week SMA). On the flip side, the next down barrier emerges at 93.77 (20-day SMA) followed by 93.67 (monthly low Oct.4) and finally 92.98 (weekly low Sep.23).
- Wall Street's main indexes are pushing higher on Wednesday.
- Technology shares push higher on improving market sentiment.
- Investors don't seem to be concerned about the September inflation data.
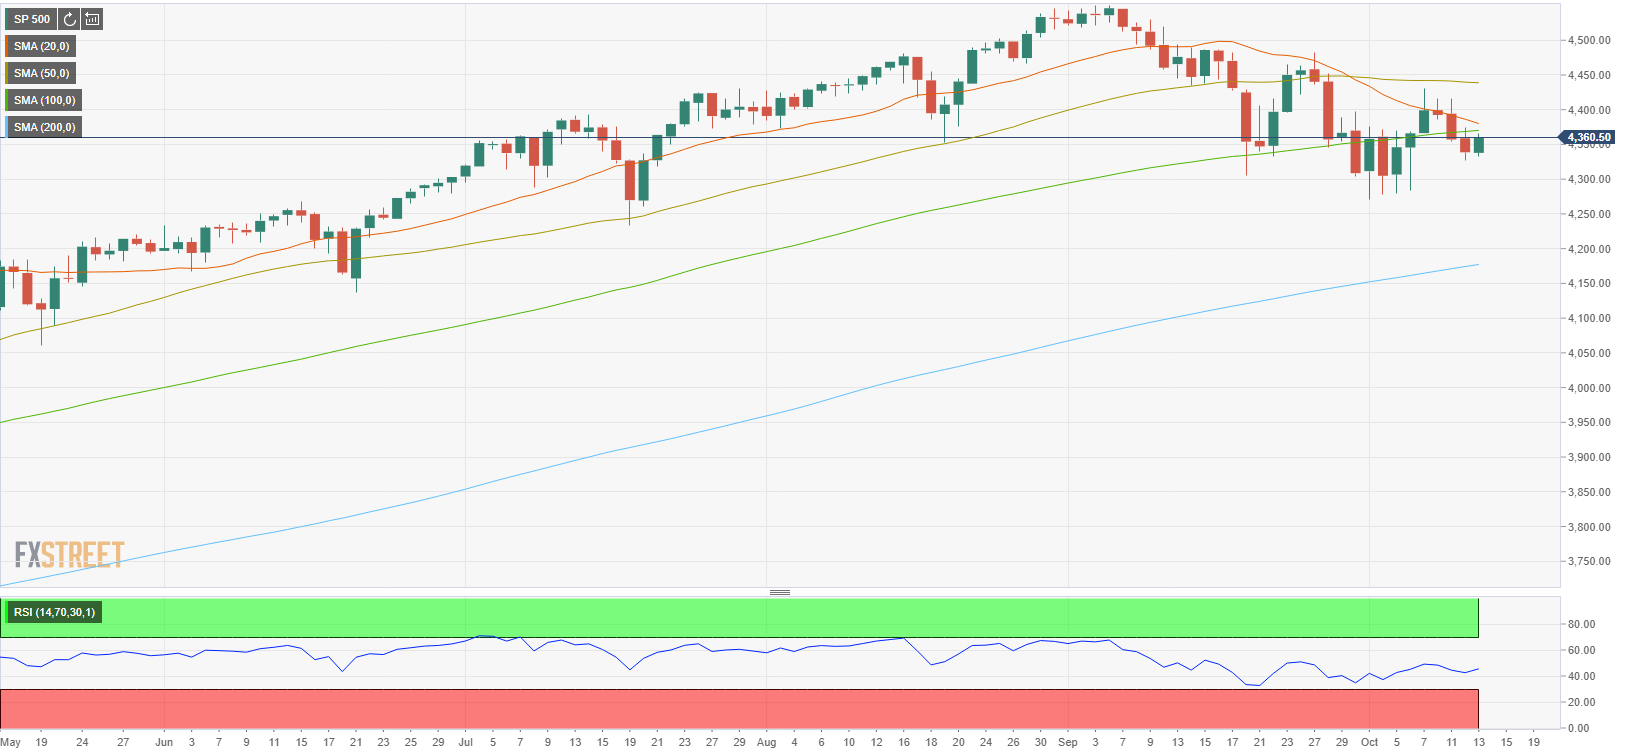
Major equity indexes in the US opened higher after closing the previous two sessions in the negative territory. As of writing, the S&P 500 was up 0.33% on the day at 4,365, the Dow Jones Industrial Average was rising 0.2% at 34,447 and the Nasdaq Composite was gaining 0.6% at 14,552.
Reflecting the improving market mood, the CBOE Volatility Index (VIX) is down nearly 3% at 19.36.
Among the 11 major S&P 500 sectors, the risk-sensitive Technology Index and the Communication Services Index both rise around 0.7% on a daily basis. On the flip side, the Energy Index is down 0.85%.
Earlier in the day, the data published by the US Bureau of Labor Statistics showed that the annual Consumer Price Index edged higher to 5.4% in September from 5.3% in August. Nevertheless, this reading doesn't seem to be impacting the risk sentiment.
S&P 500 chart (daily)
- EUR/USD bounces off Tuesday’s YTD low near 1.1520.
- Further south comes the round level at 1.1500.
EUR/USD reverses two consecutive daily pullbacks, including new 2021 lows in the proximity of the 1.1520 level.
Prospects for the continuation of the downtrend remains well in place, and a break below 1.1524 is expected to put a visit to the 1.1500 neighbourhood back on the radar in the relatively short-term horizon.
In the meantime, the near-term outlook for EUR/USD is seen on the negative side below the key 200-day SMA, today at 1.1935.
EUR/USD daily chart
Gold continues to hold over the 78.6% retracement at $1722. Karen Jones, Team Head FICC Technical Analysis Research at Commerzbank, expects the yellow metal to move back lower from the $1834 resistance level.
See – Gold Price Forecast: XAU/USD to hit $1850 before tanking through next year and beyond – ANZ
Resistance at $1834 to be tough
“The bounce has yet to clear moving average resistance at $1795/$1800 and we have extensive resistance from $1784 to $1834 (55, 200-day moving averages and highs since July) and we look for rallies to struggle on moves into this band. The 55-week ma also is found at $1817.”
“We are relatively neutral but downside risk remains. Below $1722, support is found at $1679.80/$1677.83, and is reinforced by the $1670 June 2020 low.”
“A close above $1834 is needed to retest the $1849 2020-2021 resistance line and $1856/57 4th June low. Above here lies the $1917 May 2021 peak.”
“Below $1670 would target the 2018-2021 uptrend at $1606.”
- GBP/USD reversed its direction after US inflation data.
- US Dollar Index edges higher toward 94.50 following earlier decline.
- Eyes on Brexit headlines, FOMC September Meeting Minutes.
The GBP/USD pair reversed its direction after climbing toward 1.3650 earlier in the day and retraced the majority of its daily advance. As of writing, the pair was up only 0.05% on the day at 1.3592.
DXY recovers on inflation data
Renewed dollar strength on US September inflation report seems to be weighing on GBP/USD at the beginning of the American session. The monthly report published by the US Bureau of Labor Statistics revealed that the annual Consumer Price Index (CPI) edged higher to 5.4% in September from 5.3% in August. Additionally, the Core CPI, which excludes volatile food and energy prices, stayed unchanged at 4% on a yearly basis.
Reflecting the positive impact of the CPI data on the greenback, the US Dollar Index (DXY) rebounded from the daily low it touched at 94.24 and was last seen losing 0.7% at 94.43.
Later in the day, investors will be keeping a close eye on the developments surrounding Brexit. Maroš Šefčovič, European Commission Vice President of Interinstitutional Relations and Foresight, will deliver the EU's proposal on the Northern Ireland Protocol at 1630 GMT.
Moreover, the FOMC will publish the minutes of its September meeting at 1800 GMT.
FOMC Minutes Preview: Fed to reiterate taper message, sending the dollar up, stocks down.
Technical levels to watch for
- DXY recedes from recent 2021 highs around 94.56.
- Intermittent dips are seen as buying opportunities.
DXY faces some selling pressure and corrects from Tuesday’s YTD highs in the 94.55/60 band.
The ongoing price action allows the index to keep the buying bias well in place and open the door to further upside in the not-so-distant future. That said, next target emerges at the September 2020 high at 94.74 and the 200-week SMA, today at 94.76. Further north should come the round level at 95.00.
Looking at the broader picture, the constructive stance on the index is seen unchanged above the 200-day SMA at 91.75.
DXY daily chart
- EUR/JPY’s sharp recovery surpasses the 131.00 mark on Wednesday.
- Further up comes the Fibo level at 131.75 ahead of 132.00.
EUR/JPY keeps pushing higher and now breaks above the key 131.00 barrier midweek.
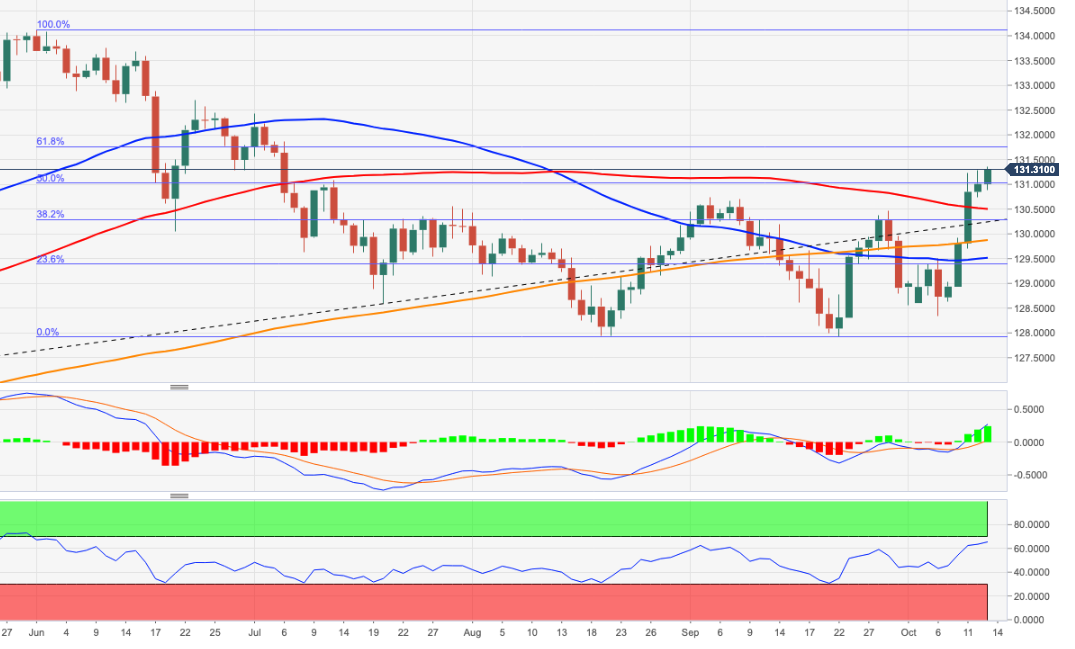
The cross remains underpinned by the recent breakout of the key 200-day SMA and now shifts the attention to the next hurdle at 131.75, where a Fibo level of the June-August drop sits. The continuation of the move should target the round level at 132.00 the figure ahead of another Fibo level at 132.79.
In the broader scenario, while above the 200-day SMA at 129.83, the outlook for the cross is expected to remain constructive.
EUR/JPY daily chart
- EUR/USD pair lost its traction in the early American session.
- Annual CPI in US edged higher to 5.4% in September.
- US Dollar Index is staging a modest rebound after inflation report.
After rising to a fresh daily high of 1.1567 during the European trading hours, the EUR/USD pair came under renewed bearish pressure and was last seen trading at 1.1544, where it was down 0.15% on a daily basis.
Price pressures in US remain intact
The positive impact of the September US inflation report's on the greenback seems to be weighing on EUR/USD in the early American session.
The US Bureau of Labor Statistics announced on Wednesday that the Consumer Price Index (CPI) rose to 5.4% on a yearly basis from 5.3% in August. This reading came in slightly higher than the market consensus of 5.3%. Moreover, the annual Core CPI stayed unchanged at 4% as expected.
At the moment, the US Dollar Index, which touched a session low of 94.24, is down only 0.1% on the day at 94.42. Later in the session, the FOMC's September Meeting Minutes will be looked upon for fresh impetus.
FOMC Minutes Preview: Fed to reiterate taper message, sending the dollar up, stocks down.
Meanwhile, US stock index futures stay afloat in the positive territory, suggesting that the CPI is having little to effect on risk sentiment.
Technical levels to watch for
Inflation in the US, as measured by the Consumer Price Index (CPI), rose to 5.4% on a yearly basis in September from 5.3% in August, the US Bureau of Labor Statistics reported on Wednesday. This reading came in line with analysts' estimates. On a monthly basis, the CPI edged higher to 0.4% from 0.3%.
Further details of the publication revealed that the annual Core CPI, which excludes volatile food and energy prices, stayed unchanged at 4% as expected.
Market reaction
With the initial reaction, the US Dollar Index erased a portion of its daily losses and was last seen losing 0.13% on the day at 94.39.
Russian President Vladimir Putin reiterated on Wednesday that Russia is not using energy as a weapon and said that Russi supplied gas to Europe even during the Cold War, as reported by Reuters.
Additional takeaways
"European gas production will continue to decline."
"Russian gas production will only increase."
"Gazprom has increased gas supplies by around 10%."
"We are meeting requirements on gas supplies from Europe."
"We are increasing gas supplies to Europe, while other partners, including USA, cutting supplies."
"We are ready to increase gas supplies in line with what our partners request."
"Russia will increase gas transit via Ukraine this year."
"Europeans have not pumped sufficient volumes of gas into their storages."
Market reaction
These comments don't seem to be having a noticeable impact on market sentiment. As of writing, the UK's FTSE 100 Index was posting small daily losses at 7,123.
- Gold preserves its bullish momentum ahead of the American session.
- 10-year US Treasury bond yield stays in the negative territory.
- Dollar struggles to find demand ahead of US inflation data.
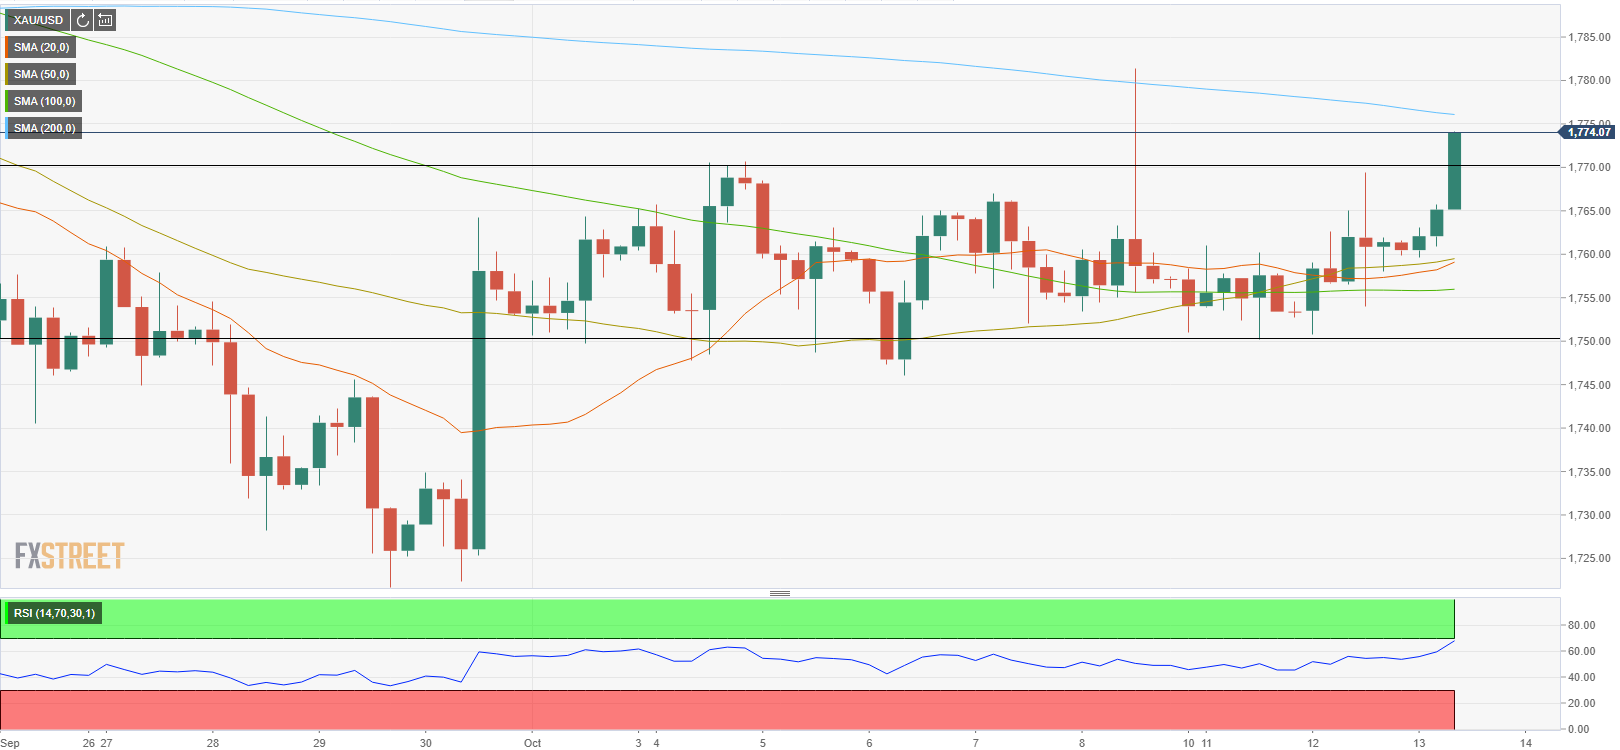
The XAU/USD pair struggled to make a decisive move in either direction in the first couple of days of the week but managed to gain traction ahead of US inflation data on Wednesday. The renewed USD weakness and falling US Treasury bond yields seem to be helping the pair push higher. As of writing, gold was up 0.7% on the day at $1,772.
In the absence of significant data releases and fundamental developments, the positive shift witnessed in market sentiment is making it difficult for the greenback to find demand. With the US stocks futures rising between 0.2% and 0.5%, the US Dollar Index is falling 0.25% on the day at 92.28 to punctuate the broad-based dollar weakness.
Meanwhile, the benchmark 10-year US Treasury bond yield, which fell 3.25% on Tuesday, is staying in the negative territory, providing an additional boost to XAU/USD.
Previewing the Consumer Price Index (CPI) data, "markets are keenly aware that price increases are again playing a part in Fed policy even if the rhetoric is muted," said FXStreet Senior Analyst Joseph Trevisani. "The credit markets tell the story. As inflation rises so should Treasury yields and the dollar. "
US Consumer Price Index September Preview: Inflation averaging, what inflation averaging?
Gold technical outlook
On the four-hour chart, gold is currently trading above the two-week-old trading range and a daily close above $1,770 could open the door for additional gains. However, the Relative Strength Index (RSI) indicator on the same chart is closing in on 70, suggesting that there could be a technical correction before the next leg up.
On the upside, the 200-period SMA acts as the first resistance at $1,775 ahead of $1,787 (September 22 high) and $1,800 (psychological level).
The initial support is now located at $1,770 (former resistance) before $1,760 (50-period SMA) and $1,755 (100-period SMA).
The aussie is moving around the mids 0.73. In the view of economists at ING, the cautious policy stance of the Reserve Bank of Australia (RBA) is not expected to send AUD/USD lower than 0.73 by year-end.
See: AUD/USD still seen lower at 0.72 on a three-month view – Rabobank
Aussie is slightly less vulnerable to external woes than before
“The market might have turned somewhat complacent to the wider implications of China’s real estate woes. More concerning developments in this sense are set to hit AUD harder than other pro-cyclicals, given its high exposure to Chinese sentiment.”
“AUD can count on some protection from rising energy prices and looks already significantly oversold.”
“The firmly dovish RBA should not be of any help in the short-term, but we think AUD/USD can close the year around its current levels: 0.73.”
EUR/GBP has trended lower since the start of the month. Economists at Rabobank forecast the EUR/GBP pair at 0.85 over the next three months while GBP/USD is seen at 1.36.
See: EUR/GBP to move downward to 0.83 over next 12 months – Danske Bank
GBP investors fear headwinds to growth
“The backdrop of lagging economic growth in the UK combined with less monetary and fiscal accommodation is a concern for GBP investors.”
“We expect EUR/GBP to hold close to the 0.85 level in a three-month view.”
“We expect USD strength to keep cable in the 1.36 area on a three-month view.”
The South African rand has had a bad month hit by a stronger dollar. This dynamic is set to continue and economists at ING believe that the USD/ZAR pair could soar as high as 17.00 in 2022.
Trade surpluses to fade
“The SARB admits that the near 6% of GDP current account surplus will dissolve within a year and growth will slow sharply – from 5.3% expected this year to just 1.7% next year.”
“With higher US rates and a stronger dollar, USD/ZAR could be trading at 16 or even 17 next year.”
EUR/USD maintains its conclusive break below major support at 1.1703/1.1695, which finally confirmed a major top for the market. Economists at Credit Suisse believe the pair can free-fall to the 1.1020/00 region.
EUR/USD staying core bearish
“We look for a fall to the March 2020 high and 50% retracement at 1.1495/93 next, where we would expect a fresh pause. However, the size of the top suggests an eventual break lower will be seen, with support seen next at 1.1290.”
“Whilst we would expect a fresh hold at 1.1290, we continue to see the broader risks skewed to the downside, with support seen next at 1.1020/00.”
“Short-term resistance moves to 1.1643/63, which we now expect to cap the market to keep the market biased directly lower.”
The USD/CAD pair is seen trading higher over the coming years as economists at Danske Bank expect to see a stronger USD. Nonetheless, with the BoC set to hike rates, the CAD should limit its decline.
Forecast: 1.26 (1M), 1.29 (3M), 1.31 (6M), 1.33 (12M)
“In light of our expectations of a stronger USD and an eventual setback to reflation sensitive assets we therefore still pencil in a higher USD/CAD over the coming years.”
“Also with the latest move in relative rates we could see more support from markets pricing in forthcoming rate hikes from the Bank of Canada – which in turn should cap the topside. We expect the BoC to hike policy rates in Q3 2022 and deliver a subsequent additional 3 hikes by end 2023.”
“We forecast USD/CAD at 1.26 in 1M (from 1.27), 1.29 in 3M (unchanged), 1.31 in 6M (from 1.32) and 1.33 in 12M (unchanged).”
In its monthly report published on Wednesday, the Organization of the Petroleum Exporting Countries (OPEC) announced that it lowered the 2021 oil demand growth forecast to 5.82 million barrels per day (bpd) from 5.96 million bpd, per Reuters.
Additional takeaways
"OPEC keeps 2022 oil demand growth unchanged at 4.15 million bpd."
"OPEC sees rise in natural gas and thermal coal prices encouraging increased gas-to-oil switching."
"OPEC raises estimated demand for its crude in 2022 by 100,000 bpd to 28.8 million bpd."
"OPEC says its output rose 490,000 bpd to 27.33 million bpd in September."
Market reaction
Crude oil prices showed no immediate reaction to this report and the barrel of West Texas Intermediate was last seen trading at $80.10, where it was down 0.55% on a daily basis.
USD/JPY has set a 34-month high at 113.80. Economists at ING expect the pair to reach the 120.00 level as US yields lift off.
See: USD/JPY set to race higher towards 2017 highs at 118.62 – Credit Suisse
A new type of capitalism to hit the JPY?
“Pressure is building for a topside break out in USD/JPY. We think the US macro/Fed story will be a positive one for the dollar over the next 15 months (USD/JPY to trade to 120), while home-grown developments look slightly JPY bearish.”
“New PM Kishida is floating the idea of a ‘new type of capitalism’, where a capital gains tax could help in income redistribution. Japanese equities are worried.”
“With Japan still in deflation, the BoJ will be the last CB to hike.”
“USD/JPY still shows by far the highest daily correlation with 10-year US yields. Expect upside pressure on both into year-end.”
Strategists at Commerzbank suspect that palladium is in the throes of basing and needs to go back on the radar. A break above the 1046 January 2020 high would open up the 200-day moving average (DMA) at 1122.
Platinum has based at 900
“Platinum has at last managed to erode its 55-day ma at 1000 and introduce scope to test 1046 the 2020 high.”
“It is showing signs of reversal from the 200-week ma at 930.77. The market has traded through here but the new low of 901.68 was not confirmed by the daily RSI and we suspect has based – the market charted a key week reversal a couple of weeks ago.”
“The market will need to regain 1046 (January 2020 high) to reassert upside dominance. This would allow for a deeper recovery to the 55-week ma at 1076.58 and the 200-day ma at 1122.”
“Only below 900 would allow for losses to the 871.75 61.8% retracement and potentially the 825 September 2020 low.”
Despite much discussion of stagflation and the UK returning to the candle-powered 1970s, GBP is actually performing quite well. Yet economists at ING are uncertain whether the Bank of England will act as early as the market expects. Therefore, GBP/USD may plunge to the 1.32 level in a couple of months.
Market is convinced the BoE moves early
“Our team feel that the BoE will hike later than market pricing – warning of some downside risk to GBP. Look out for key speeches from BoE hawks – and whether they seek to correct expectations.”
“Cable could briefly see 1.32 in next two months if the BoE indeed rejects calls for early tightening. And USD should outperform.”
- USD/CAD is edging lower ahead of the American session.
- US Dollar Index continues to pull away from multi-month high set on Tuesday.
- WTI extends downward correction, tests critical $80 level.
The USD/CAD pair stays under modest bearish pressure during the European hours on Wednesday with the greenback struggling to find demand ahead of key events. As of writing, the pair was down 0.16% on a daily basis at 1.2445.
DXY turns south on Wednesday
Falling US Treasury bond yields seem to be weighing on the dollar on Wednesday. the benchmark 10-year US T-bond yield, which lost more than 3% on Tuesday, is currently losing 0.5% at 1.572%. Reflecting the USD's poor performance, the US Dollar Index (DXY) is falling 0.25%. Meanwhile, US stock index futures are rising between 0.15% and 0.5% on the day, making it difficult for the dollar to attract investors.
Later in the session, the US Bureau of Labor Statistics will release the September inflation report. Investors expect the Core Consumer Price Index (CPI) to stay unchanged at 4% on a yearly basis. A stronger-than-forecast inflation reading is likely to provide a boost to the greenback in the second half of the day.
In the late American session, the FOMC's September Meeting Minutes will be looked upon for fresh insights regarding the timing and the pace of reduction in asset purchases. Previewing this event, "FOMC Meeting Minutes from the bank's September decision will likely serve as a reminder that the Fed is about to taper in November – boosting the dollar," said FXStreet Analyst Yohay Elam.
FOMC Minutes Preview: Fed to reiterate taper message, sending the dollar up, stocks down.
On the other hand, the barrel of West Texas Intermediate (WTI) is trading in the negative territory near $80 and helping USD/CAD limit its losses for the time being.
Technical levels to watch for
- GBP/JPY gained strong positive traction for the fifth straight session on Wednesday.
- Encouraging Brexit headlines, hawkish BoE signals acted as a tailwind for the sterling.
- The recent widening of the UK-Japanese yield spread remained supportive of the move.
The GBP/JPY cross shot to the highest level since June 24 during the first half of the European session, with bulls now eyeing a move to reclaim the key 155.00 psychological mark.
The cross prolonged its recent strong bullish momentum from the 149.25-20 area, or monthly lows and continued scaling higher for the fifth consecutive session on Wednesday. This also marked the eighth day of a positive move in the previous nine and was supported by the emergence of fresh buying around the British pound.
Reports that the European Union's new proposals for the Northern Ireland Protocol will involve reduced checks on goods and medicines boosted the sterling. This comes amid the recent widening of the UK-Japanese 10-year yield differential, which weighed on the Japanese yen and contributed to the GBP/JPY pair's ongoing move up.
Over the weekend, the Bank of England (BoE) officials, including Governor Andrew Bailey, signalled an imminent interest rate hike later this year. The money market seems to have fully priced in a 25bps BoE rate hike in December and pushed the UK 10-year gilt yield to the highest level since May 2019, at 1.222% on Monday.
Conversely, the yield on the 10-year Japanese government bond remained near zero due to the Bank of Japan's yield curve control policy. Apart from this, a modest uptick in the equity markets undermined the safe-haven JPY and supports prospects for additional gains, though overbought conditions warrant some caution.
Hence, it will be prudent to wait for some near-term consolidation or a modest pullback before placing fresh bullish bets around the GBP/JPY cross and positioning for any further appreciating move.
Technical levels to watch
- A modest USD pullback assisted AUD/USD to attract some dip-buying on Wednesday.
- Traders now eye the US CPI report and FOMC minutes for a fresh directional impetus.
- A sustained move beyond multi-week tops is needed to confirm a fresh bullish break.
The intraday USD selling picked up pace in the last hour and pushed the AUD/USD pair to fresh daily tops, around the 0.7360 region.
The US dollar witnessed some profit-taking from one-year tops amid the ongoing retracement slide in the US Treasury bond yields. This, in turn, assisted the AUD/USD pair to attract some dip-buying near the 0.7330 region on Wednesday and inch back closer to four-week tops touched in the previous day.
The US bond yields have been rallying since late September when the Fed signalled that it would begin tapering its bond purchases by the end of 2021. Adding to this, the markets have been speculating an interest rate hike in 2022 amid worries over a faster than expected rise in inflation.
However, some repositioning trade ahead of Wednesday's release of the US consumer inflation figures led to a modest pullback in the US bond yields. This, along with the FOMC minutes, will be looked upon to gauge the Fed's view on normalizing monetary policy and influence the USD in the near term.
In the meantime, a generally positive risk tone was seen as another factor that extended some support to the perceived riskier aussie. That said, a combination of factors might hold investors from placing aggressive bullish bets around the AUD/USD pair and keep a lid on any meaningful positive move.
Worries that a widespread rally in commodity prices will stoke inflation and signs of a global economic slowdown have been fueling concerns about the return of stagflation. Apart from this, uncertainty over a spillover from China Evergrand's debt crisis should cap any optimistic move in the markets.
Hence, it will be prudent to wait for some follow-through buying beyond the overnight swing highs, around the 0.7370-75 region, before placing fresh bullish bets. The AUD/USD pair might then aim to reclaim the 0.7400 mark and accelerate the momentum towards the 0.7415-20 static resistance zone.
Technical levels to watch
- EUR/USD moves up and retakes the 1.1550 region.
- EMU Industrial Production came in mixed in August.
- US CPI, FOMC Minutes likely to drive sentiment later.
The single currency manages to leave behind the pessimism seen at the beginning of the week and now lifts EUR/USD back to the mid-1.1500s midweek.
EUR/USD now focuses on US docket
EUR/USD regains some composure and bounces off Tuesday’s new 2021 lows in the 1.1525/20 band.
The soft tone surrounding the greenback allows a mild improvement in the pair on Wednesday, all ahead of key data releases in the US calendar and amidst declining yields in the US cash market.
Indeed, the key US 10-year yields retreat to the 1.57% region so far, shedding around 6 bps since tops recorded in past sessions. In Germany, yields of the German 10-year Bund also shed some ground and return to the -0.12% area.
In the domestic docket, Industrial Production in the broader Euroland contracted at a monthly 1.6% in August and expanded 5.1% from a year earlier.
Across the pond, inflation figures measured by the CPI will be in the centre of the debate seconded by the release of the FOMC Minutes.
What to look for around EUR
EUR/USD remains well under pressure despite the ongoing rebound from recent lows near 1.1520 (October 12). Indeed, dollar dynamics continue to rule the sentiment surrounding the European currency and relegate the pair to trade in the vicinity of 2021 lows for the time being. The firmer tone in the buck along with higher US yields and bouts of risk aversion – particularly in response to inflation jitters and the energy crunch - continue to undermine the performance of the risk universe, while the growth outlook appears under pressure on rising speculations that the inflation could take longer to reverse the ongoing elevated levels. In addition, the likely loss of momentum in the economic recovery, as per some weakness seen in key fundamentals, also caps the upside potential in the pair.
Key events in the euro area this week: German final CPI, EMU Industrial Production (Wednesday) – European Council Meeting (Thursday) - European Council Meeting, EMU Balance of Trade (Friday).
Eminent issues on the back boiler: Asymmetric economic recovery in the region. Sustainability of the pick-up in inflation figures. Progress of the Delta variant of the coronavirus and pace of the vaccination campaign. Probable political effervescence around the EU Recovery Fund. Investors’ shift to European equities in the wake of the pandemic could lend extra oxygen to the single currency. ECB tapering speculations.
EUR/USD levels to watch
So far, spot is gaining 0.22% at 1.1555 and faces the next up barrier at 1.1586 (weekly high Oct.11) followed by 1.1637 (20-day SMA) and finally 1.1640 (weekly high Oct.4). On the other hand, a break below 1.1524 (2021 low Oct.12) could target 1.1500 (round level) en route to 1.1495 (high Mar.9 2020).
- Industrial Production in the euro area declined sharply in August as expected.
- EUR/USD continues to trade in the positive territory above 1.1550.
Industrial Production in the euro area and the EU contracted by 1.6% and 1.5%, respectively, on a monthly basis in August as expected, the data published by Eurostat revealed on Wednesday. In the meantime, July's expansion of 1.5% (euro area) got revised lower to 1.4%.
"In August 2021 compared with August 2020, industrial production increased by 5.1% in the euro area and by 5.3% in the EU," the publication further revealed.
Market reaction
Market participants largely ignored these figures. As of writing, the EUR/USD pair was up 0.25% on a daily basis at 1.1556.
USD/CNH is still seen trading within the 6.4240-6.4800 range in the next weeks, commented FX Strategists at UOB Group.
Key Quotes
24-hour view: “Our expectations for USD to ‘strengthen further to 6.4710’ did not materialize as it traded between 6.4497 and 6.4640 before closing little changed at 6.4555 (-0.05%). Momentum indicators have turned neutral and USD is likely to trade sideways for today, expected to be within a 6.4450/6.4650 range.”
Next 1-3 weeks: “We have held the same view since last Wednesday (06 Oct, spot at 6.4500). As highlighted, USD is likely to trade between 6.4240 and 6.4800 for a period of time. Looking ahead, the odds for a break of 6.4800 first are higher but USD has to close above 6.4880 before a sustained advance can be expected.”
- DXY loses upside traction following recent 2021 highs.
- US 10-year yields extends the breakdown of 1.60%.
- US inflation figures, FOMC Minutes take centre stage in the NA session.
Following Tuesday’s new 2021 highs past 94.50, the US Dollar Index (DXY) now runs out of steam and recedes to the 94.30 in the European morning.
US Dollar Index looks to CPI, FOMC
The index now appears offered and gives away part of Tuesday’s advance to new YTD highs in the 94.55/60 band.
The corrective move in the buck tracks the retracement in US yields. Indeed, the front end of the curve slips back to 0.34% (from 0.36%), while the belly of the curve hovers around the 1.57% (from the vicinity of 1.64%). The closely watched 2y-10y yield gap has now shrunk to 123 pts.
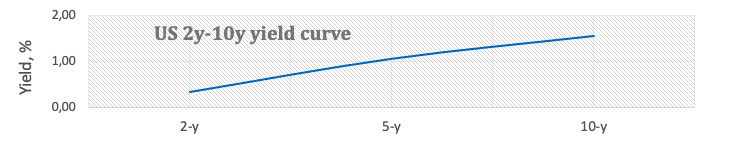
In the meantime, all the attention is expected to gyrate around the release of the US inflation figures for the month of September, all against the backdrop of the ongoing supply constraint and the unabated energy crisis.
Other than the CPI figures, the FOMC will publish its Minutes of the latest meeting, while MBA Mortgage Applications and the speech by FOMC’s Governor L.Brainard (permanent voter, dovish) are also due later in the session.
What to look for around USD
The index clinched new 2021 high at 94.56 on Tuesday despite the move lower in US yields. Positive news from the debt-ceiling and inflation jitters sponsored the selloff in the bonds market seen in past sessions and propelled yields to fresh tops, lending extra legs to the buck at the same time. Looking beyond the immediate term, the dollar remains underpinned by markets’ adjustment to prospects for a “soon” start of the tapering process, probable rate hikes at some point during next year and the rising view that elevated inflation could last more than initially expected.
Key events in the US this week: Inflation tracked by the CPI, FOMC Minutes (Wednesday) – initial Claims (Thursday) – Retail Sales, flash Consumer Sentiment (Friday).
Eminent issues on the back boiler: Biden’s multi-billion Build Back Better plan. US-China trade conflict under the Biden’s administration. Tapering speculation vs. economic recovery. Debt ceiling debate. Geopolitical risks stemming from Afghanistan.
US Dollar Index relevant levels
Now, the index is losing 0.23% at 94.29 and a break above 94.56 (2021 high Oct.12) would open the door to 94.74 (monthly high Sep.25 2020) and then 94.76 (200-week SMA). On the flip side, the next down barrier emerges at 93.77 (20-day SMA) followed by 93.67 (monthly low Oct.4) and finally 92.98 (weekly low Sep.23).
EUR/GBP has been volatile lately, but continues to trade around 0.85. Economists at Danske Bank remain bullish on the pound as the USD-positive environment is usually also benefiting sterling and keep their EUR/GBP forecast intact at 0.83 in 12 months.
BoE is about to start tightening monetary policy
“Like the Fed, the Bank of England (BoE) is about to start tightening monetary policy. QE bond buying is set to end by the end of the year and since our last update, investors have started to price in more aggressive rate hikes from the BoE.”
“We still have a bullish view on GBP, as the ‘positive USD’ environment is usually also benefiting GBP. We target 0.83 in 12M.”
“Near-term, the too aggressive Bank of England pricing may put some upward pressure on EUR/GBP, so we have lifted our 3M target to 0.85 (from 0.84).”
While speaking at an event in Moscow, the Iraqi oil minister noted that they don't expect oil prices to rise further, as reported by Reuters.
Meanwhile, Credit Suisse analysts think that Brent oil has the potential to extend its rally to $100 in case it manages to break above $89.00/$90.00 area.
Brent Oil: Scope for a rally to the $100 landmark – Credit Suisse.
Market reaction
The barrel of West Texas Intermediate (WTI) came under modest selling pressure following these comments and was last seen losing 0.4% on the day at $80.20.
- GBP/USD regained positive traction on Wednesday amid a modest USD profit-taking slide.
- Mixed technical indicators on hourly/daily charts warrant caution for aggressive traders.
- Investors might wait for a fresh trigger from the US CPI report and FOMC meeting minutes.
The GBP/USD pair built on its steady intraday ascent through the first half of the European session and climbed to fresh daily tops, around the 1.3635-40 region in the last hour. The pair, for now, seems to have snapped two successive days of the losing streak and was supported by a modest US dollar pullback from one-year tops.
The ongoing retracement slide in the US Treasury bond yields prompted some USD profit-taking ahead of Wednesday's release of the US consumer inflation figures. This, along with the FOMC minutes, will be looked at to gauge the Fed's path on normalizing monetary policy and influence the near-term USD price dynamics.
From a technical perspective, the GBP/USD pair stalled this week's retracement slide from the 1.3670-75 region and found a decent support near the 1.3570-65 confluence on Tuesday. The latter comprised of 200-hour SMA and over one-week-old ascending trend-line, which should now act as a pivotal point for short-term traders.
Meanwhile, the subsequent positive move supports prospects for additional intraday gains. The outlook is reinforced by the fact that oscillators on hourly charts have been gaining positive traction. That said, technical indicators on the daily chart are yet to confirm a bullish bias, warranting caution for aggressive traders.
Heading into Wednesday's key data/event risks, the GBP/USD pair is more likely to confront resistance near weekly swing highs, around the 1.3670-75 region. Some follow-through buying, leading to a move beyond the 1.3700 mark, will be seen as a fresh trigger for bullish traders and set the stage for a further appreciating move.
The GBP/USD pair might then surpass an intermediate hurdle near the 1.3720-25 region and aim to test the next relevant barrier near mid-1.3700s.
On the flip side, the 1.3600 round-figure mark (nearly 200-hour SMA) now seems to protect the immediate downside ahead of the trend-line support, currently near the 1.3575 region. A convincing break below could trigger some technical selling and turn the GBP/USD pair vulnerable to challenge the key 1.3500 psychological mark.
GBP/USD 1-hour chart
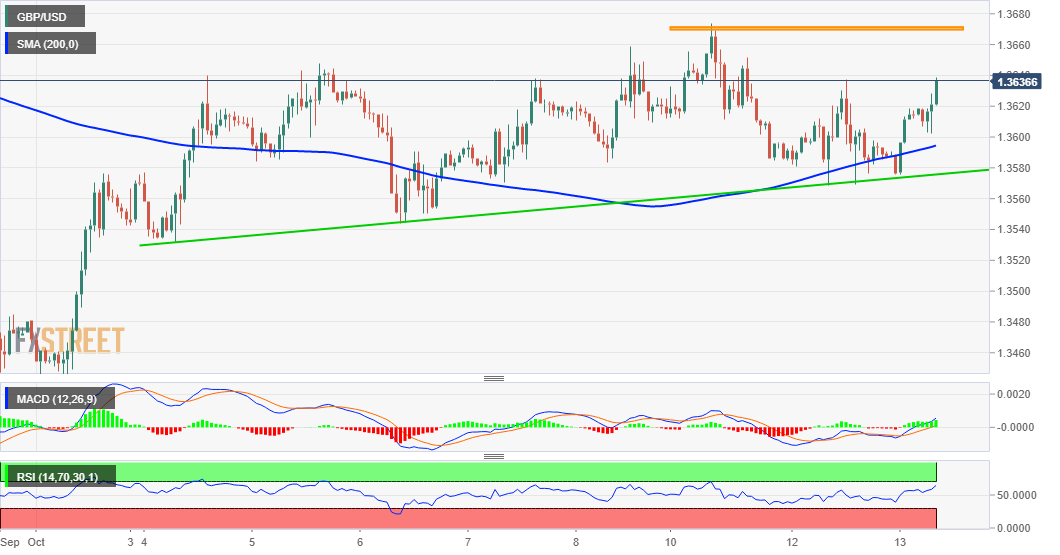
Technical levels to watch
Brent Crude Oil is moving to new YTD highs and seen on course to test its 2018 high. Strategists at Credit Suisse note that Brent Oil could have potential to hit the $100 level.
Initial support moves to $79.08
“Brent Crude Oil has moved to a new high for the year and now achieved its June ‘measured triangle objective’ at $82.50 and stays seen on course for the 2018 high at $86.74, which we expect to cap, at least temporarily.”
“Bigger picture, a weekly close above $86.74 would further increase upward pressure with resistances then seen next at the long-term downtrend from 2008 and psychological level at $89.00/$90.00. Whilst we would expect a fresh cap here, a break can see strength extend to $100.”
“Support moves to $79.08 initially, then $77.50, with the 55-day average at $74.18 ideally holding further weakness.”
According to Reuters, Slovak prosecutors announced on Wednesday that European Central Bank (ECB) policymaker and Slovak central bank Governor Peter Kazimir had been charged with corruption.
"Given the early stage of the criminal case, we will not be giving any further information at the moment," a spokeswoman told reporters.
Market reaction
This development doesn't seem to be having a noticeable impact on the shared currency's performance against its major rivals. As of writing, the EUR/USD pair was up 0.3% on the day at 1.1560.
The Norwegian krone has recently experienced a rally supported by Norges Bank initiating its hiking cycle as well as a surge in natural gas prices. Economists at Danske Bank maintain a negative view on NOK but lower the EUR/NOK profile in light of higher than-anticipated oil and gas prices.
Krone potential exhausted as NOK rates pricing looks stretched
“The NOK has found strong support since summer from both relative rates and soaring energy prices. Meanwhile, we increasingly see the NOK potential as exhausted and highlight that NOK rates pricing looks stretched and that NB will have to lower its daily NOK purchases in the coming month.”
“We maintain a negative view on NOK but lower the EUR/NOK profile in light of higher-than-anticipated oil and gas prices.”
“We forecast EUR/NOK at 10.00 in 1M (from 10.30), 10.20 in 3M (from 10.40), 10.40 in 6M (from 10.60) and 10.40 in 12M (from 10.50).”
An important base is emerging in the GBP/JPY pair. Economists at Credit Suisse expect GBP/JPY to soar towards the 159.80 mark.
See – GBP/JPY: The uptrend is likely on its last legs – DBS Bank
GBP/JPY is basing out
“GBP/JPY has completed a near-term base above 152.86 which we look to clear the way for a test of the 156.08/156.62 highs of 2018 and earlier this year.”
“With a major base already seen established in February 2021, we look for a break above 156.62 to further reinforce the positive outlook, with resistance seen next at 159.80.”
EUR/USD fights back after plumbing to a new 2021 low yesterday on hawkish Federal Reserve (Fed) and dovish commentary from European Central Bank (ECB) policymakers. Economists at Société Générale do not rule out a bounce towards the 1.1750 level.
In vicinity to crucial support
“Fed tapering could commence in November or December and will end somewhere in the middle of next year. The contrast with the (dovish) comments of ECB member Villeroy speaks for itself and was a reminder of the gulf that exists in policy on both sides of the Atlantic, a theme that will continue into 2022.”
“We assume that Villeroy and Lane represent the majority (unanimity?) of the governing council and this speaks of the dangers of even lower levels that could lie ahead for the single currency when the ECB next meets in two weeks.”
“EUR/USD is near potential support of weekly Ichimoku cloud and peak of March 2020 at 1.1495/1.1450.”
“A bounce is expected however 1.1750 could cap upside.”
“Next potential supports could be 1.1380 and 1.1290, the 61.8% retracement from March 2020.”
Gold remains within the $1,750-70 range. Strategists at ANZ Bank expect XAU/USD to reach $1850 but to suffer a reverse back lower in the next year and beyond.
See – Gold Price Forecast: XAU/USD to sink towards $1565/60 on a break below $1691/77 – Credit Suisse
Low yields turn in favour of non-yielding gold investment
“Supportive factors for gold are waning with Fed tapering drawing closer. That said, risk around slower growth against higher inflation still sees a sustained strategic allocation to gold amid prevailing low rates backdrop.”
“We expect gold prices to reach $1850/oz before retreating through next year and beyond.”
EUR/SEK has moved lower, now trading in the 10.10-10.20 range. Economists at Danske Bank remain strategically bearish on the krona forecasting EUR/SEK at 10.50 in 12 months.
Near-term strength should fade out by year-end
“Weak risk sentiment and stronger USD would suggest clear upside risks to EUR/SEK from here. Despite this, the SEK has strengthened in recent weeks seemingly on the back of, in our view unjustified, contagion from the NOK”
“We remain strategically bearish on the krona on the back of deteriorating global growth momentum, fragile market environment, continued appreciation of the USD amid a hawkish Fed and too aggressive medium-term pricing on the Riksbank.”
“In the near-term, the SEK could get some temporary support if the Riksbank inserts a hiking bias at the November meeting, even though it is discounted already, and if the seasonal pattern holds true.”
“We lower our 1-3M estimates to 10.10 (10.20), while keeping 6M at 10.30 and 12M at 10.50.”
- USD/JPY attracted some dip-buying near the 113.35 region, though lacked follow-through.
- Elevated US bond yields extended some support; a modest USD weakness capped gains.
- Investors now eye the US CPI report and FOMC minutes for a fresh directional impetus.
The USD/JPY pair reversed an intraday dip and climbed back above mid-113.00s, closer to the top end of its daily trading range during the early European session.
The pair attracted some dip-buying on Wednesday and recovered over 25 pips from the daily swing lows, around the 113.35 region, though lacked any strong follow-through. The recent widening of the US-Japanese government bond yield differential was seen as a key factor that drove flows away from the Japanese yen and extended some support to the USD/JPY pair.
The US bond yields have been rallying since late September when the Fed signalled that it would begin tapering its bond purchases by the end of 2021. In fact, the yield on the benchmark 10-year US government bond shot to four-month tops on Friday. On the other hand, the Bank of Japan's yield curve control policy held the yield on the 10-year Japanese government bond near zero.
The markets might have also started pricing in the possibility of an interest rate hike in 2022 to counter the risk of inflation becoming too high. This was seen as another factor that pushed the bond yields higher. That said, a modest US dollar weakness kept a lid on any further gains for the USD/JPY pair amid a softer risk tone, which tends to benefit the safe-haven JPY.
Worries that a widespread rally in commodity prices will stoke inflation and signs of a global economic slowdown have been fueling speculations about the return of stagflation. Apart from this, fears about a spillover from China Evergrand's debt crisis weighed on investors sentiment. This was evident from the prevalent caution mood around the global equity markets.
Apart from this, overbought conditions on short-term charts might further hold bullish traders from placing aggressive bets around the USD/JPY pair. Investors now await the release of the US consumer inflation figures and the FOMC monetary policy meeting minutes to gauge the Fed's path on normalizing monetary policy.
This will play a key role in influencing the near-term USD price dynamics. This, along with the broader market risk sentiment, should determine the next leg of a directional move for the major.
Technical levels to watch
The USD/CAD pair has retreated from a recent high of 1.2896. Technically, there are two patterns in play. A triangle pattern that has broken down to allow for a lower USD is likely guided by a separate bearish head-and-shoulders signal. The latter potentially has USD/CAD looking towards its price objective around 1.2303, Benjamin Wong, Strategist at DBS bank, reports.
USD/CAD remains biased lower
“In the term, USD/CAD is pushing lower off a bearish head-and-shoulders reversal. A cursory look suggests this pattern should guide USD/CAD lower as its neckline around 1.2594 has clearly crated, validating the pattern.”
“Having a calibrated target should give us a measuring rod, as USD/CAD is teasing the weekly charts’ Kijun support at 1.2478. A textbook scenario can see USD/CAD head towards 1.2303. Concurrently, USD/CAD is also framing a triangle break.”
“Should USD skid towards the head-and-shoulders target around 1.2302, it would tap closer into the 61.8% to 76.4% Fibonacci support pane of the 1.2007-1.2949 range (that marks the USD rally from June to August, calibrating 1.2229).”
The Federal Reserve presented a set of Dot Plot projections for the Fed Funds target which were way above market expectations – this should support the dollar. Economists at ING see EUR/USD as vulnerable to 1.13 over the coming months.
See: EUR/USD to dive towards 1.10 on a 12-month horizon – Danske Bank
Expect the dollar rally sooner
“The dollar is currently at its highs of the year and we expect it to go higher over coming months. Driving this strength is the bullish cocktail of inflation fears and a very hawkish set of Fed dot plots presented in late September.”
“Clearly many things have to fall into place for a tightening takeoff, but our team sees a strong quarter for US growth and the Fed to announce and start tapering in Nov and Dec respectively.”
“A 2-3% dollar rally over the next two months is possible, (EUR/USD to 1.13), but seasonal December USD weakness means 1.17 for year-end.”
Amid surging energy prices, fears of stagflation dominated the early part of last week, but signs of progress on US fiscal negotiations helped equities finish the week in positive territory. Economists at UBS continue to see equity upside and recommend buying the winners from global growth, including energy and financials.
Stagflation fears are overdone
“Our base case is that while growth rates may have peaked, growth will remain robust in the coming quarters while inflation recedes from this year’s spike. Clearly, stagflation would undermine this scenario, but we think these fears are overdone.”
“We expect only a modest impact on growth and inflation from the current increase in energy prices. The risk to our analysis is a harsh Northern Hemisphere winter that causes energy prices to spike again, disrupts industrial production and delivers a larger hit to GDP.”
“We continue to see equity upside and recommend buying the winners from global growth, including energy and financials. Given that part of the rise in energy has been due to the run down in investment in fossil fuels, we believe investing in traditional energy and industrial metals as well as in greentech is a diversified, realistic way to participate in the transition to net-zero carbon.”
USD/JPY is approaching the 114.55 2018 high. While the pair may lose its bullish momentum here, in the long run, Karen Jones, Team Head FICC Technical Analysis Research at Commerzbank, expects USD/JPY to hit the 117.06 1998-2021 resistance line.
See: USD/JPY set to race higher towards 2017 highs at 118.62 – Credit Suisse
USD/JPY targets 114.55 then 115.60
“USD/JPY remains extremely bid above its accelerated uptrend at 112.05 and will shortly encounter the 114.55 October 2018 high, where we may see some profit-taking.”
“Longer-term we have 115.60, the 61.8% retracement of the move down from 2015 and then the 117.06 the 1998-2021 resistance line.”
“The accelerated uptrend guards 110.80 the mid-August high.”
GBP/JPY is back having a peep at the late-May’s high of 156.07. While the cross has moved higher, the MACD signal on the weekly chart is displaying divergent signals. This suggests we are likely pursuing the finale leg higher, Benjamin Wong, Strategist at DBS Bank, reports.
The tail-end of a bull run
“The monthly chart shows GBP/JPY is nearing the 50% Fibonacci retracement of the 195.88-121.61 range grip that covers the 23.7% drop from 195.88 at 158.74. This is, at the same time, a key resistance offered at the Ichimoku cloud resistance.”
“The weekly chart’s moving average convergence divergence (MACD) signal is showing a bearish divergence despite GBP/JPY’s recent push higher from 148.47. This signal remains under the cosh, unable to validate this ongoing rally. This provides a cue or two that GBP/JPY will correct lower.”
“On our recent bullish endeavours, we have been guided by the 40-week moving average. Should the cross drop under this mark (currently 150.90), GBP/JPY will find additional bearish pressures. A fully stretched move typically tries to hover towards 148.47.”
EUR/USD has slumped to its weakest level since July 2020 at 1.1524. Economists at Danske Bank lower their profile for EUR/USD to 1.10 in 12 months (from 1.13) as a reflection of broader market themes increasingly turning pro-dollar.
‘Stagflation’ is a perfect storm for EUR at current levels
“We lower our EUR/USD forecast, from 1.13 to 1.10 in 12M and similarly over time. This reflects our view that market themes are increasingly pro dollar.”
“The manufacturing cycle is clearly slowing but central banks need to tighten to catch-up with inflation pressures and this is quite negative for EUR/USD, especially at current levels around 1.15-16’s.”
- NZD/USD was seen oscillating in a narrow trading band through the early European session.
- A modest USD pullback extended some support; a cautious market mood capped the upside.
- Investors now eye US CPI report and FOMC meeting minutes for a fresh directional impetus.
The NZD/USD pair lacked any firm directional bias and seesawed between tepid gains/minor losses, below mid-0.6900s through the early European session.
A softer tone around the US Treasury bond yields triggered a modest US dollar corrective pullback from one-year tops touched in the previous day. This, in turn, was seen as a key factor that assisted the NZD/USD pair to find some support near the 0.6920 region on Wednesday. That said, the prevalent cautious mood around the equity markets kept a lid on any meaningful upside for the NZD/USD pair, at least for the time being.
Worries about a faster than expected rise in inflation and signs of a slowdown in the global economic recovery have been fueling concerns about stagflation. This, along with fears of a spillover from China Evergrand's debt crisis, continued weighing on investors' sentiment. Apart from this, prospects for an early policy tightening by the Fed helped limit the USD losses and further collaborated to cap gains for the NZD/USD pair.
Investors seem convinced that the Fed will begin rolling back its massive pandemic-era stimulus as soon as November. The markets have also started pricing in the possibility of an interest rate hike in 2022 amid expectations that the recent widespread rally in commodity prices will stoke inflation. Hence, the market focus will remain on Wednesday's release of the US consumer inflation figures for the month of September.
This will be followed by the FOMC meeting minutes later during the US session. This would assist investors to gauge the Fed's path on normalizing monetary policy, which will influence the near-term USD price dynamics and provide a fresh directional impetus to the NZD/USD pair. In the meantime, the broader market risk sentiment will be looked upon for some short-term trading opportunities.
Technical levels to watch
- Silver is poised for a range breakout, with an upside move likely.
- XAG/USD looks for an ascending triangle breakout on the 4H chart.
- RSI points north above the midline, supporting the bullish view.
Silver price (XAG/USD) is breaking higher from its prison range seen over the past one week, as the bulls are back in the game, looking to recapture the $23 mark.
The sharp pullback in the US dollar across the board amid readjustment of the positions has collaborated with the upside in the USD-denominated white metal.
Looking at silver’s four-hour chart, the price has been trading within an ascending triangle formation since October 3, now aiming for the pattern hurdle at $22.81.
Silver price has managed to find a strong foothold above the powerful resistance at $22.59, where the 21 and 50-Simple Moving Averages (SMA) intersect.
The Relative Strength Index (RSI) edges higher above the central line, backing the upbeat view.
A four-hourly candlestick closing above the horizontal trendline resistance at $22.81 will confirm an upside break of the ascending triangle pattern, calling for attest of the $23 mark.
The next significant upside barrier awaits at the descending 200-SMA at $23.15.
Silver Price Chart: Four-hour chart
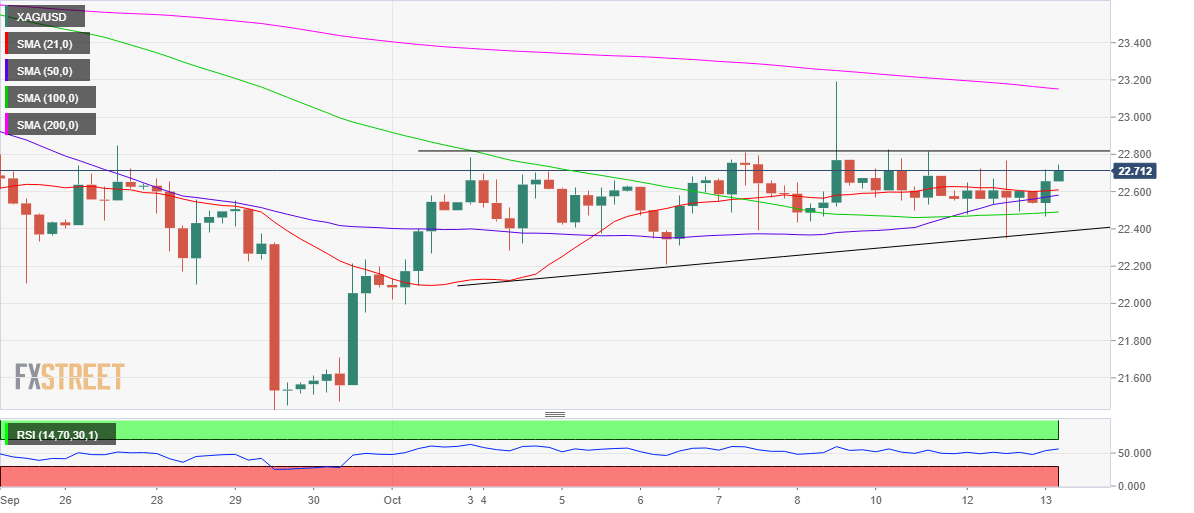
On the flip side, rejection at the trendline hurdle could recall the sellers, downing the rates towards the abovementioned strong resistance-turned-support at $22.59.
The horizontal 100-SMA at $22.49 will be threatened if the downside momentum picks up steam.
Further down, the rising trendline support at $22.37 will be the last line of defense for silver bulls.
Silver Additional levels
Gold managed to close in the positive territory on Tuesday and holds above $1,760 in the early European session on Wednesday. XAU/USD awaits US inflation for the next big move after recapturing the 21-Daily Moving Average (DMA) at $1758.
See – US CPI Preview: Forecasts from nine major banks, a number of factors are pushing inflation higher
Hotter US CPI to further fan the Fed’s tapering and earlier-than-anticipated rate hike expectations
“The annualized US Consumer Price Index (CPI) is seen steady at 5.3% in September while the core figure is also likely to stay unchanged at 4%. Stronger-than-expected reading is expected to cement the Fed’s tapering for November. “
“The September Fed meeting’s minutes will also shed light on the central bank’s next policy move, impacting the dollar and gold valuations.”
“Should Tuesday’s upbeat momentum extend, then gold price could look to retest the downward-sloping 50-DMA at $1776. The next crucial level for gold bulls is seen at the mildly bearish 200-DMA at $1797.”
“On the downside, the 21-DMA resistance turned support now at $1758 will emerge as a fierce cap, below which the $1750 demand area will be back into play. Further south, the falling trendline support at $1741 will be on the sellers’ radars. On a sustained break below the latter, all eyes will be on the multi-week troughs of $1722.”
See – Gold Price Forecast: XAU/USD to sink towards $1565/60 on a break below $1691/77 – Credit Suisse
USD/JPY is now approaching the 114.00 level. Economists at Credit Suisse expect the pair to surge higher and reach the 2017 peak of 118.62.
Reasons to stay long
“We see scope for JPY weakness to run further into and after the 31 Oct election. We are raising our potential Q4 USD/JPY top to the 2017 high at 118.62, where we would expect the move to fade out on a longer-term basis.”
“Barring a major collapse in global risk assets, we also raise our floor for the pair to 111.60 from 108.00 previously.”
“Although we see high odds of hopes for genuine change being disappointed in the final analysis, we prefer not to stand in the way of markets trying to price in a robust monetary divergence theme at this time.”
The US Bureau of Labor Statistics will publish the September Consumer Price Index (CPI) at 12:30 GMT and as we get closer to the release time, here are the forecasts by the economists and researchers of nine major banks regarding the upcoming US inflation data. The CPI is expected to rise 0.3% in September as it did in August while Core CPI is projected to rise 0.1%.
See – Trading US Inflation with EUR/USD: Five scenarios, market bias and levels to watch
ANZ
“Rising energy and food costs should see US headline CPI rise by (0.4% MoM) at a slightly faster pace than the core CPI (0.3% MoM) in September. Supply-demand imbalances continue to keep pressure on underlying inflation.”
Deutsche Bank
“We expect a +0.41% headline (vs. +0.27% previously) and +0.27% core (vs. +0.10%) mom rate. This is a bit above consensus and would take the YoY rate to 5.4% (up a tenth) and 4.1% (unch) respectively.”
NBF
“The economic recovery likely continued to be hampered by COVID-19 during the month, but the negative effects of the virus should have been largely offset by supply chain constraints, allowing core prices to advance 0.3% MoM. As a result, the annual core inflation rate could rise one tick to 4.1%. Headline prices could also have risen 0.3% MoM, helped by an increase in seasonally-adjusted gasoline prices. This gain would leave the annual rate unchanged at 5.3%.”
SocGen
“Much of the latest energy price jump did not fall in the scope of the September CPI. Nonetheless, energy was a contributor. Our headline and core CPI readings are 0.3% MoM gains, but this is a result of a round down on the headline and a round-up on the core CPI readings.”
RBC Economics
“US CPI for September will likely show another elevated YoY gain though the monthly pace of price increases is expected to remain smaller than the April-June surge during the initial reopening of the economy. Most of the increase in producer input costs has yet to flow through to consumer prices. The longer supply chain disruptions last and commodity prices remain elevated, however, the more likely price pressures become more pervasive and pronounced.”
CIBC
“Higher gasoline prices should have boosted total CPI in September, adding to pressures from supply chain bottlenecks in core goods categories, and likely resulting in a 0.3% monthly rise in prices to leave annual inflation unchanged at 5.3%. In core categories, the push and pull between a surge in used car prices amid other supply chain bottlenecks, against a likely drop in Delta-impacted service prices, could have resulted in a 0.2% monthly gain in core CPI. That would leave annual core inflation steady at 4.0% and implies some upside for core PCE inflation, the Fed’s preferred measure. With supply chain issues worsening, it’s possible that inflation could stay elevated for longer ahead even with the downside potential in Delta impacted service prices.”
Citibank
“CPI MoM – Citi: 0.3%, median: 0.3%, prior: 0.3%; CPI YoY – Citi: 5.3%, median: 5.3%, prior: 5.3%; CPI ex Food, Energy MoM – Citi: 0.2%, median: 0.2%, prior: 0.1%; CPI ex Food, Energy YoY – Citi: 4.1%, median: 4.1%, prior: 4.0%. We expect upside risks to services prices as a tight labor market leads to broadening wage pressures. This would be an even clearer sign inflationary pressures are more persistent.”
TDS
“Food and, especially, energy prices probably rose fairly strongly again in September, but the core CPI likely rose modestly, held down by a reversal of some of the recent strength in travel prices, including for used vehicles, lodging and airfares. We expect some strengthening again in Q4, reflecting further gains in energy prices and a bounce in used vehicle prices at the wholesale level, followed by more sustained moderation in 2022. The expected moderation in 2022 depends on significant weakening in travel-related prices following their surge in 2021; we are allowing for some further acceleration in rents.”
Danske Bank
“The MoM change in the core CPI is the relevant number to watch and it has come down to average 0.2% in July and August after readings around 0.7%-0.9% from March to June. Consensus is for a 0.3% gain, which seems fair in our view.”
- EUR/GBP edged higher on Wednesday and recovered a major part of the overnight losses.
- A modest USD weakness benefitted the euro and remained supportive of the intraday uptick.
- Fresh Brexit jitters, disappointing UK macro releases acted as a headwind for the British pound.
- BoE-ECB monetary policy divergence warrants caution before placing aggressive bullish bets.
The EUR/GBP cross traded with a mild positive bias heading into the European session, albeit lacked any follow-through and the upside remained capped near the key 0.8500 psychological mark.
The cross attracted dip-buying in the vicinity of one-month lows touched earlier this week and for now, seems to have stalled the previous session's sharp pullback from multi-day tops. A modest US dollar pullback turned out to be one of the key factors behind the shared currency's relative outperformance on Wednesday.
On the other hand, the UK-EU stand-off over the Northern Ireland (NI) protocol and disappointing UK macro releases acted as a headwind for the British pound. This was seen as another factor that remained supportive of the bid tone surrounding the EUR/GBP cross, though any meaningful recovery move still seems elusive.
The Bank of England (BoE) officials, including Governor Andrew Bailey, signalled an imminent interest rate later this year over the weekend. Conversely, the European Central Bank (ECB) chief economist Philip Lane said that the medium-term inflation dynamic is too slow and that the trigger for monetary policy action is not there.
The diverging BoE-ECB monetary policy stance should hold traders from placing aggressive bullish bets around the euro and keep a lid on any further gains for the EUR/GBP cross. This makes it prudent to wait for a strong follow-through buying before traders start positioning for any further near-term appreciating move.
Technical levels to watch
EUR/USD is posting modest recovery gains around 1.1550 as the pair is losing downside momentum. Karen Jones, Team Head FICC Technical Analysis Research at Commerzbank, expects EUR/USD to test the downtrend at 1.1640.
The daily RSI has again diverged
“EUR/USD remains under pressure but the new low at 1.1522 has again not been confirmed by the daily RSI and we would now exit any remaining shorts because there is a significant loss of downside momentum as we approach the 50% retracement of the move from 2020 and the March 2020 high at 1.1492/95.”
“Key support is the previous downtrend (from 2008) which is now located at 1.1395.”
“Intraday rallies will find an accelerated downtrend at 1.1640, but key nearby resistance is the 1.1767 three-month downtrend.”
The cautious policy stance of the Reserve Bank of Australia (RBA) is set to cap further AUD gains. However, economists at Rabobank have upgraded their three-month AUD/USD forecast to 0.72 based on higher commodity prices.
RBA not to veer from its dovish position
“Although higher prices for exports such as coal and LNG should continue to provide the aussie with support near-term, barring any change in the RBA’s guidance that rates are likely to be on hold until 2024, we expect the AUD to struggle to maintain recent gains vs. the USD.”
“While we expect the dovish tone of the RBA to keep the value of AUD/USD in check into next year and beyond, based on the strength of Australian resource and energy exports we have revised up our three-month AUD/USD forecast from 0.71 to 0.72.”
Here is what you need to know on Wednesday, October 13:
Major currency pairs stayed within familiar ranges on Tuesday as investors remained on the sidelines while waiting for high-impact data releases. The sour market mood made it difficult for risk-sensitive assets to find demand but falling US Treasury bond yields weighed on the dollar. The US Dollar Index was posting modest daily losses around 94.35 at the time of press and the benchmark 10-year US T-bond yield, which lost 3.5% on Tuesday, was down 0.5%.
Macro data: The data from the US showed that the NFIB Business Optimism Index edged lower to 99.1 from 100.1 in August and JOLTS Job Openings declined to 10.3 million in August, missing the market expectation of 10.9 million. The US Bureau of Labor Statistics will publish the September Consumer Price Index (CPI) at 1230 GMT and the Federal Reserve will release the minutes of its September policy meeting at 1800 GMT.
US Consumer Price Index September Preview: Inflation averaging, what inflation averaging?
Wall Street: Pressured by a more-than-1% decline witnessed in the Communication Services Index, the S&P 500 lost 0.24% on Tuesday and the Nasdaq Composite erased 0.15%. Furthermore, the Dow Jones Industrial Average fell 0.35%. Meanwhile, the US House approved the legislation to temporarily raise the debt ceiling until early December but this development doesn't seem to be having a noticeable impact on market sentiment.
FOMC Minutes Preview: Fed to reiterate taper message, sending the dollar up, stocks down.
EUR/USD pair slumped to its weakest level since July 2020 at 1.1524 as dovish commentary from European Central Bank (ECB) policymakers continues to hurt the common currency. Currently, the pair is posting modest recovery gains around 1.1550.
GBP/USD fluctuates around 1.3600 for the third straight day on Wednesday. The data from the UK revealed that the Industrial Production and Manufacturing Production both expanded at a stronger pace than expected in August but market participants showed little to no interest in these data.
USD/JPY lost its bullish momentum on falling US Treasury bond yields but stays within a touching distance of the 34-month high it set at 113.80 on Tuesday.
Crude oil prices stay in a consolidation phase following the impressive upsurge seen earlier in the week. The Barrel of West Texas Intermediate is staying relatively quiet above $80 ahead of the EIA's weekly Crude Oil Stocks Change on Thursday.
Gold managed to close in the positive territory on Tuesday and holds above $1,760 in the early European session on Wednesday. Nevertheless, XAU/USD might need to break out of the $1,750-70 range to attract investors.
Cryptocurrencies: Bitcoin extended its technical correction and lost more than 2% on Tuesday. Currently, BTC is testing $55,500. Meanwhile, Ethereum and Ripple both trade in the negative territory. In its recently published Global Financial Stability Report, the International Monetary Fund advised against developing economies adopting digital currencies
The UK Conservative Party Co-Chairman Oliver Dowden said on Wednesday, the “reports on steps offered by the European Union (EU) regarding Brexit are welcome.”
“We will engage with them,” he added.
developing story ...
- USD/INR edges lower on Wednesday in the early European session.
- INR appreciates on IMF growth outlook.
- US Doller Index retreats from yearly highs near 94.50.
USD/INR came under pressure after testing the high intraday high around 75.50 on Wednesday. After posting yearly highs in the previous session, the pair retreats following the depreciative move in the greenback. At the time of writing, USD/INR is trading at 75.41, down 0.08% for the day.
US Dollar retreats from one -year high
The US Dollar Index, which tracks the greenback performance against its six major rivals, trades at 94.37 with 0.15% losses. The market sentiment is being cautious on the increased bet that Fed will announce tapering to begin as soon as November. Minutes of the FOMC meeting and the US Core Purchasing Inflation (CPI) index due later today is keenly awaited for more clues on the Fed’s action.
Indian Rupee (INR) appreciated the following reports from the International Monetary Fund (IMF), which stated that India’s economy is expected to grow by 9.5% in 2021 and 8.5% in 2022. The projection is way higher than the developed economies.
As for now, the dynamics around the US dollar continue to influence the pair’s performance.
USD/INR additional levels
Britain’s industrial sector recovery gathered momentum in August, the latest UK industrial and manufacturing production data published by Office for National Statistics (ONS) showed on Wednesday.
Manufacturing output arrived at 0.5% MoM in August versus 0% expectations and -0.6% booked in July while total industrial output came in at 0.8% vs. 0.2% expected and 0.3% last.
On an annualized basis, the UK manufacturing production figures came in at 4.1% in August, missing expectations of 6.0%. Total industrial output jumped by 3.7% in the eighth month of the year against a 3.0% reading expected and the previous 4.4% print.
Separately, the UK goods trade balance numbers were published, which arrived at GBP-14.927 billion in August versus GBP-12.0 billion expectations and GBP-12.706 billion last. Total trade balance (non-EU) came in at GBP-8.395 billion in August versus GBP-6.99 billion previous.
Related reads
- GBP/USD defends 1.3600 after UK GDP misses estimates with 0.4% in August
- GBP/USD sticks to the 1.3500-1.3680 range – UOB
FX Strategists at UOB Group noted USD/JPY could extend the current upside momentum to levels past the 114.00 yardstick.
Key Quotes
24-hour view: “We highlighted yesterday that ‘conditions are overbought but the impulsive momentum suggests that USD could strengthen further to 113.80’. While USD rose as expected but it only touched 113.78. Upward momentum is beginning to show tentative signs of slowing. This coupled with still overbought conditions suggests that USD is unlikely to strengthen much further. For today, USD is more likely to trade between 113.15 and 113.80.”
Next 1-3 weeks: “There is not much to add to our update from yesterday (12 Oct, spot at 113.40). As highlighted, the impulsive surge suggests that further USD strength would not be surprising. The next resistance is at 114.20. The USD strength is deemed intact as long as it does not breach 112.65 (‘strong support’ level was at 112.40 yesterday).”
Gold extends its consolidation beneath the July and August highs at $1832/34. In the view of strategists at Credit Suisse, XAU/USD would suffer a significant drop on a break below $1691/77.
XAU/USD needs to surge above $1834/49 to enjoy a substantial recovery
“Although downward pressure is seen increasing, only below $1691/77 would mark a major top for an important change of trend lower, with support then seen at $1620/15 initially, before $1565/60.”
“Only a break above $1834/49 would be seen to complete an inrange base to clear the way for a deeper recovery to $1917.”
- UK GDP arrived at 0.4% MoM in Aug vs. 0.5% expected.
- GBP/USD remains little changed on the downbeat UK GDP.
The UK GDP monthly release showed that the economy expanded less-than-expected in August, arriving at 0.4% vs. 0.5% expectations and 0.1% previous.
Meanwhile, the Index of Services (August) came in at 3.7% 3M/3M vs. 1.2% expected and 5.2% prior.
Key highlights (via ONS)
Accommodation and food service activities, and arts, entertainment and recreation contributed most positively to services growth in August 2021.Medium (h2)
There were falls in health output and retail trade.
Production output increased by 0.8% in August 2021, mainly because of the continued increase in the extraction of crude petroleum and natural gas following the recent temporary closure of oil field production sites.
Construction contracted, with output down by 0.2% in August 2021; the sector is now 1.5% below its pre-pandemic level.
GDP growth for July 2021 has been revised from 0.1% growth to a 0.1% fall; mainly because of downwardly revised data for the manufacture of motor vehicles, oil and gas, and changes to how health output is measured.
GBP/USD reaction
The cable keeps its range around 1.3610 on the UK growth numbers. The spot trades 0.18% higher on the day.
About UK GDP
The Gross Domestic Product released by the National Statistics is a measure of the total value of all goods and services produced by the UK. The GDP is considered as a broad measure of the UK economic activity. Generally speaking, a rising trend has a positive effect on the GBP, while a falling trend is seen as negative (or bearish).
FX option expiries for October 13 NY cut at 10:00 Eastern Time, via DTCC, can be found below.
- EUR/USD: EUR amounts
- 1.1515 445m
- 1.1550-60 674m
- GBP/USD: GBP amounts
- 1.3600 374m
- USD/JPY: USD amounts
- 113.00 555m
- 113.50 360m
- AUD/USD: AUD amounts
- 0.7240 417m
- 0.7350 450m
- NZD/USD: NZD amounts
- 0.6900 668m
- EUR/GBP: EUR amounts
- 0.8700 583m
Open interest in natural gas futures prices dropped for the fifth consecutive session on Tuesday, this time by nearly 5K contracts as per advanced prints from CME Group. On the other hand, volume went up for the second straight session, now by around 82.8K contracts.
Natural Gas: Next support comes around $4.70
Prices of natural gas reversed two daily drops in a row and posted decent gains on Tuesday. The recovery, however, was in tandem with shrinking open interest, which somewhat rules out further gain and allows for the continuation of the leg lower at least in the very near term. That said, decent contention is expected to emerge around the $4.70 region per MMBtu.
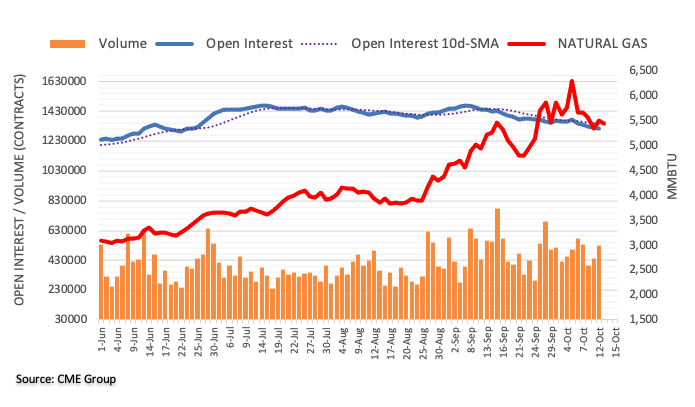
- Asian stocks trade with a cautious tone following subdued Wall Street action.
- Higher energy prices corroborate inflationary pressures, US CPI awaited.
- Gap in US-China trade still persists despite recent talks.
Asian stocks remain edgy on Wednesday on inflationary worries. Investors remain pessimistic on worries about soaring energy prices fuelling inflation weigh and drive expectations that the US Fed would taper its emergency bond-buying program.
MSCI’s broadest index of Asia-pacific shares outside Japan rose 0.1%, after falling over 1% day in the previous session.
China’s Shanghai Composite Index fell 0.5% following China’s finance ministry announcement of issuance of an additional $930.46 million worth of sovereign bonds. Hong Kong’s stock market was closed in the morning because of a storm.
The ASX 200 trades flat after upbeat Chinese trade data. Meanwhile, Chinese media threatened Australia with further trade strikes after Prime Minister Tony Abbott made anti-Beijing statements on his visit to Taiwan.
The Nikkei 225 edges 0.1% higher, following downbeat economic data. Japan’s core machinery orders unexpectedly fell in August.
Gold remains steady above $1,762 with 0.17% gains ahead of US CPI data and the FOMC minutes on Fed’s timeline on tapering.
UOB Group’s FX Strategists noted AUD/USD could extend its move higher in the next weeks, with a solid resistance just above 0.7400.
Key Quotes
24-hour view: “We highlighted yesterday that ‘there is room for the advance to test 0.7380 first before easing’. Our view was correct as AUD rose to 0.7384 before pulling back quickly. Upward pressure has eased and the current movement is viewed as part of a consolidation. In other words, AUD is likely to trade sideways for today, expected to be within a 0.7315/0.7370 range.”
Next 1-3 weeks: “There is not much to add to our update from yesterday (12 Oct, spot at 0.7345). As highlighted, upward momentum has improved and AUD could strengthen further even though the next major resistance at 0.7405 may not come into the picture so soon. On the downside, a break of the ‘strong support’ at 0.7290 (level was at 0.7275 yesterday) would indicate that the current upward pressure has eased.”
CME Group’s preliminary figures for crude oil futures markets noted traders added more than 16K contracts to their open interest positions on Tuesday, reversing at the same time two consecutive daily retracements. Volume, instead, diminished by around 335K contracts, the largest single-day drop since August 5.
WTI: Rally halted around $82.00… for now
Indecision dominated the price action in the WTI on Tuesday. The inconclusive session was amidst rising open interest, which could be supportive of some consolidation in the very near term. However, a corrective decline should not be ruled out as the commodity navigates slightly into the overbought territory. So far, the $82.00 mark per barrel emerges as a short-term top.
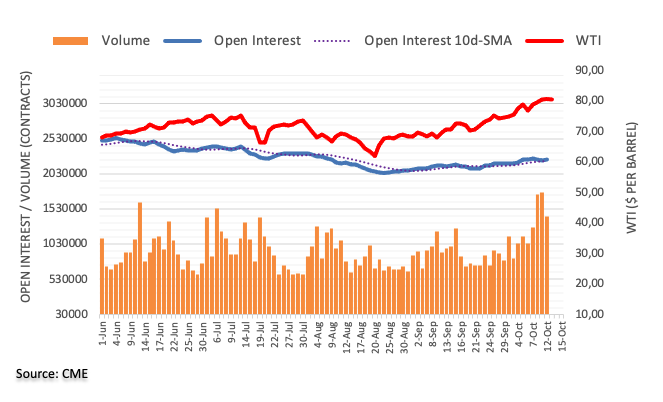
Cable lost upside momentum and now moved into a 1.3500-1.3680 consolidative phase, noted FX Strategists at UOB Group.
Key Quotes
24-hour view: “Our expectations for GBP to ‘weaken to 1.3545’ did not materialize as it traded between 1.3568 and 1.3636 before closing largely unchanged at 1.3589. The underlying tone still appears to be soft and we continue to see room for GBP to weaken to 1.3545. However, the major support at 1.3500 is not expected to come under threat. On the upside, a break of 1.3635 (minor resistance is at 1.3620) would indicate that the current mild downward pressure has eased.”
Next 1-3 weeks: “There is no change in our view from yesterday (12 Oct, spot at 1.3590). As highlighted, the recent build-up in shorter-term upward momentum has fizzled out. The current movement is viewed as part of a consolidation and GBP is likely to trade within a 1.3500/1.3680 range for now.”
Open interest in gold futures markets shrank by just 958 contracts after two consecutive daily pullbacks considering flash data from CME Group. On the other hand, volume extended the erratic activity and rose by around 53.1K contracts.
Gold faces further consolidation near term
Gold traded within a narrow range on Tuesday, keeping the range bound theme well in place for yet another session. The small drop in open interest plays against further upside in the very near term and leaves intact the prospect for further consolidation for the time being.
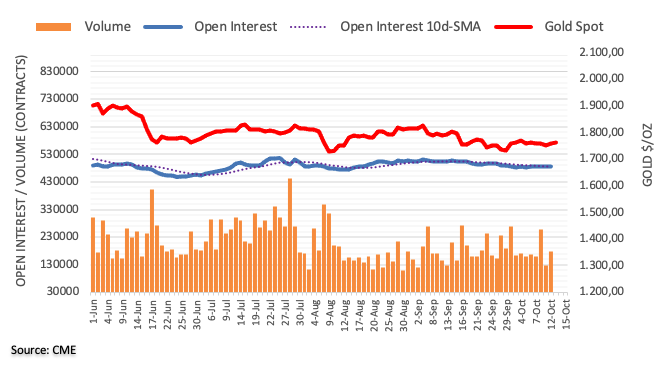
In opinion of FX Strategists at UOB Group, EUR/USD risks a deeper pullback on a breach below the 1.1500 mark.
Key Quotes
24-hour view: “We highlighted yesterday that while EUR ‘could dip below last week’s low at 1.1527; the major support at 1.1500 is not expected to come into the picture’. Our view was not wrong as EUR dipped to 1.1523 before settling 1.1527 (-0.21%). Downward momentum has barely improved and 1.1500 is still not expected to come into the picture. For today, EUR is more likely to trade between 1.1520 and 1.1570.”
Next 1-3 weeks: “We have expected a weaker EUR for about 2 weeks now. After EUR dropped to 1.1527 and rebounded, we highlighted on Monday (11 Oct, spot at 1.1570) that ‘downward momentum is beginning to wane and the odds for EUR to move to 1.1500 have diminished’. While EUR dropped to 1.1523 yesterday, downward momentum has not improved by much. That said, there is scope for EUR to test 1.1500 but EUR has to close below this solid support before further sustained decline can be expected (next support is at 1.1450). On the upside, a break of 1.1585 (‘strong resistance’ level previously at 1.1605) would indicate that the weak phase in EUR has run its course.”
- GBP/JPY edges higher following the previous session’s gain on Wednesday.
- Multiple resistance near 154.45 offers a strong barrier for the bulls.
- Momentum oscillator support bullish momentum.
The GBP/JPY cross trades higher with a cautious tone in the early European trading hour. The pair books the gains for the fifth straight session. At the time of writing, the GBP/JPY cross-currency pair is trading at 154.48, up 0.02% on the day.
GBP/JPY daily chart
-637696953305025526.png)
On the daily chart, the GBP/JPY cross currency pair has been trading in a broad trading range of 149.00 and 154.45 since late June. The current price action suggests difficulty for the GBP/JPY bulls near the strong resistance barrier around 154.50. Having said that, if the price breaks day’s high then it could test the psychological 155.00 as the first upside target.
Furthermore, the Moving Average Convergence Divergence (MACD) indicator holds the overbought zone. Any uptick in the MACD would bring the high of June 15 at 155.48 back into action followed by the 155.90 horizontal resistance level.
Alternatively, on the reverse side, the bears would meet the 153.68 horizontal support level and then moving onto Monday’s low at 152.74. A daily close below the 100-day Simple Moving Average (SMA) at 152.48 could bring the next stoppage to the 151.90 horizontal support zone.
GBP/JPY additional levels
The UK Economic Data Overview
The UK docket has the August month GDP data publication this Wednesday alongside the releases of the Kingdom’s Trade Balance and Industrial Production, all of which will drop parallelly at 0630 GMT.
The United Kingdom GDP is expected to arrive at +0.5% MoM in August vs. July 0.1% reading. The Index of Services (3M/3M) for August is seen sharply lower at 1.2%.
Meanwhile, the manufacturing production, which makes up around 80% of total industrial production, is expected to stand at 0% MoM in August vs. 0% recorded in July. The total industrial production is expected to come in at +0.2% MoM in Aug as compared to the previous reading of +1.2%.
On an annualized basis, the industrial production for Aug is expected to have dropped to 3.0% versus 3.8% previous while the manufacturing output is seen steady at 6% in the reported month.
Separately, the UK goods trade balance will be reported at the same time and is expected to show a deficit of £12.00 billion in Aug vs. the £12.7 billion deficit reported in July.
Deviation impact on GBP/USD
Readers can find FX Street's proprietary deviation impact map of the event below. As observed the reaction is likely to remain confined around 20-pips in deviations up to + or -2, although in some cases, if notable enough, a deviation can fuel movements in excess of 60-70 pips.
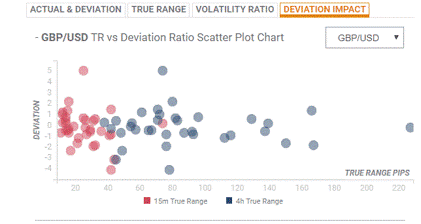
How could affect GBP/USD?
At the press time, the GBP/USD is consolidating its bounce above 1.3600, as the US dollar retreats across the board. The cable remains divided between the hawkish BOE turn and rising Brexit concerns. All eyes remain on the critical UK and US macro releases due later this Wednesday.
Let’s take a look at the key technical levels for trading GBP/USD on the data releases. The pair faces immediate resistance at Tuesday’s high of 1.3638, above which the 1.3650 psychological barrier could be put to test. Further up, the two-week tops of 1.3675 will challenge the bearish commitments.
Alternatively, if the downside resumes, the GBP bears could target the 10-DMA at 1.3586. The next relevant support is seen at the multi-day troughs of 1.3569. The October 6 lows of 1.3543 could be the last line of defense for the cable optimists.
Key Notes
GBP/USD technical bearish trend continuation
US Consumer Price Index September Preview: Inflation averaging, what inflation averaging?
FOMC Minutes Preview: Fed to reiterate taper message, sending the dollar up, stocks down
About the UK Economic Data
The Gross Domestic Product released by the Office for National Statistics (ONS) is a measure of the total value of all goods and services produced by the UK. The GDP is considered as a broad measure of the UK economic activity. Generally speaking, a rising trend has a positive effect on the GBP, while a falling trend is seen as negative (or bearish).
The Manufacturing Production released by the Office for National Statistics (ONS) measures the manufacturing output. Manufacturing Production is significant as a short-term indicator of the strength of UK manufacturing activity that dominates a large part of total GDP. A high reading is seen as positive (or bullish) for the GBP, while a low reading is seen as negative (or bearish).
The trade balance released by the Office for National Statistics (ONS) is a balance between exports and imports of goods. A positive value shows trade surplus, while a negative value shows trade deficit. It is an event that generates some volatility for the GBP.
- A combination of factors assisted gold to gain some traction for the second successive day.
- Hawkish Fed expectations might hold bulls from placing aggressive bets around the metal.
- Investors await the US CPI report/FOMC meeting minutes for a fresh directional impetus.
- Gold Price Forecast: Sellers still willing to add shorts around critical Fibonacci resistance
Gold edged higher for the second consecutive session on Wednesday, albeit lacked follow-through and remained below the overnight swing highs. Currently trading just above the $1,760 level, a modest US dollar weakness was seen as a key factor that extended some support to the dollar-denominated commodity. Apart from this, the prevalent cautious market mood – amid concerns about the return of stagflation – further acted as a tailwind for the safe-haven precious metal. Investors remain worried that the recent widespread rally in commodity prices will stoke inflation and derail the global economic recovery.
Meanwhile, a slight USD pullback lacked any obvious fundamental catalyst and seems cushioned amid expectations that the Fed will begin tapering its bond purchases in November. The markets have also started pricing in the possibility of a Fed rate hike in 2022 to counter the risk of inflation becoming too high. This was evident from elevated US Treasury bond yields, which should help limit any meaningful USD downside and hold traders from placing aggressive bullish bets around the non-yielding gold. Investors now await the release of US consumer inflation figures to gauge the Fed's path on normalizing monetary policy.
This will be followed by the FOMC monetary policy meeting minutes, later during the US session. A stronger CPI print and (or) a more hawkish Fed could bring additional gains for the US currency and provide a fresh directional impetus to gold prices. In the meantime, the broader market risk sentiment, along with the US bond yields will be looked upon for some short-term trading opportunities around the commodity.
Technical levels to watch
From current levels, the overnight swing highs, around the $1,769-70 region, might continue to act as immediate strong resistance. Some follow-through buying has the potential to lift gold back closer to the $1,783-84 horizontal barrier. A sustained strength beyond should allow bulls to aim back to reclaim the $1,800 round-figure mark.
On the flip side, the $1,750 area has emerged as immediate strong support. A convincing break below might prompt aggressive technical selling and accelerate the slide towards September monthly swing lows, around the $1,722-21 region. Gold could eventually drop to test the $1,700 mark en-route August monthly swing lows, around the $1,687 region.
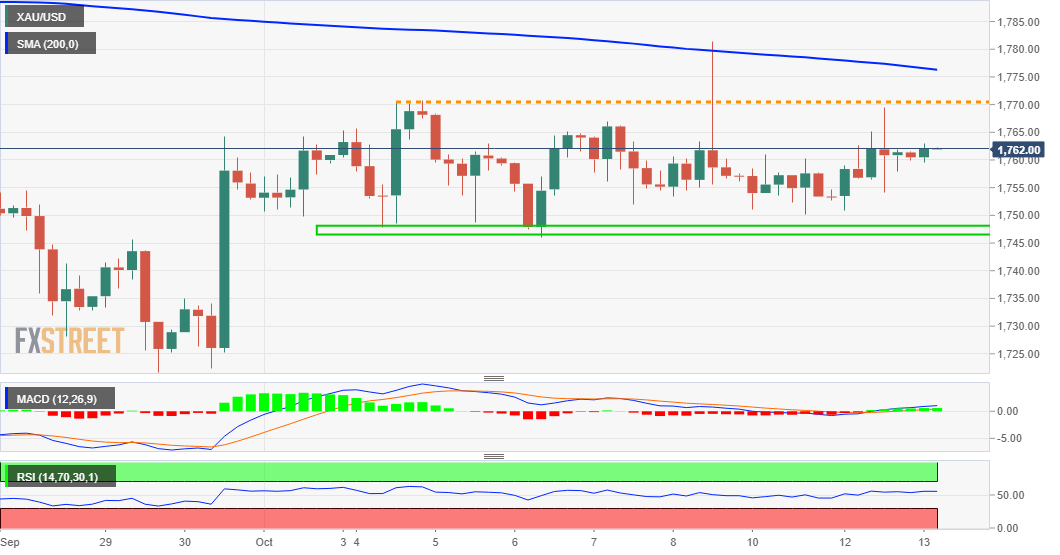
- EUR/USD recovers initial losses on Wednesday in the Asian session.
- The US Dollar Index backtracks from yearly highs despite a rebound in US T-bond yields.
- Divergent monetary policy outlooks between the ECB and Fed weighs on the euro, US inflation eyed.
The EUR/USD holds gains in the Asian session on Wednesday. After testing the fresh 2021 lows around 1.1520 in the overnight session, the pair rebounded and bounced back above 1.1550. At the time of writing, EUR/USD is trading at 1.1552, up 0.22% for the day.
A combination of factors sponsored the movement in the pair. The pullback in the greenback from a one-year high of around 94.50 remains the major catalyst to push EUR/USD on the higher side.
Investors remain cautious ahead of the US Core Inflation Index (CPI) data, as a higher reading could propel the Fed’s to start tapering as early as November. In addition to that, the minutes of the Fed’s latest policy meet will also shed light on the timeline of the Fed’s action.
The Consumer Inflation consensus pointed to a 5.3% rise in the CPI for September on yearly basis, confirming the supply-demand imbalances in the economy. The number of US job openings fell 10.439 million in August, below the market expectations of 10.925 million. Meantime, the US House of Representatives approved the government’s borrowing limit to $28.9 trillion, pushing off the deadline for debt default only until December.
On the other hand, the shared currency holds ground despite the European Central Bank’s (ECB) dovish outlook. ECB Governing Council member Francois Villeroy de Galhau showed his concern over the failure of meeting the 2023 inflation target then exceed it. His comments seem to support the existing accommodative monetary policy. The eurozone investor morale declined to 21.0 in October, well short of the market expectations of 37.0.
As for now, traders are waiting for the German Harmonized Index of Consumer Prices, Eurozone Industrial Production, US CPI data, and the FOMC minutes to gain fresh trading impetus.
EUR/USD additional levels
- WTI crude oil edged lower during the Asian session on Wednesday.
- Profit-taking sets in amid overbought conditions on short-term charts.
- The formation of an ascending channel still favours bullish traders.
WTI crude oil witnessed some selling during the Asian session on Wednesday and slipped below mid-$79.00s, though lacked any strong follow-through.
Looking at the technical picture, the recent strong move to multi-year tops stalled near a resistance marked by the top boundary of a one-month-old ascending channel. Overbought conditions on short-term charts seemed to be the only factor that prompted bullish traders to take some profits off the table.
That said, the commodity, so far, has managed to hold its neck above the overnight swing lows, around the $79.00/barrel mark. This should now act as a key pivotal point for intraday traders, which if broken decisively should pave the way for a deeper corrective pullback for the black gold.
The next relevant support is pegged near the $78.40 horizontal level ahead of the $78.00 round figure and the $77.30 region. Spot prices could eventually break through the $77.00 mark and accelerate the slide towards challenging the trend-channel support, currently near the $76.80-70 region.
On the flip side, the $80.00 psychological mark now seems to act as immediate resistance. A sustained strength beyond has the potential to lift the commodity back to the $81.00 level. The momentum could further get extended towards the trend-channel hurdle, around the $81.80-85 region.
WTI 4-hour chart
-637696920609083232.png)
Technical levels to watch
China's Trade Balance for September, in Yuan terms, came in at CNY433.19 billion versus CNY386.13 billion expected and CNY376.31 billion last.
The exports rose by 19.9% last month vs. 17.1% expected and 15.7% previous.
Imports increased by 10.1% vs. 22.3% expected and 23.1% prior.
In USD terms,
China reported a bigger-than-expected growth in the trade surplus, as both imports and exports bettered expectations
Trade Balance came in at +66.76B versus +47.6B expected and +58.34B previous.
Exports (YoY): +28.1% vs. +21.5% exp. and +25.6% prior.
Imports (YoY): +17.6% vs. +19.2% exp. and +33.1% last.
Additional takeaways
China Sept trade surplus with the US $42 bln vs $37.68 bln surplus in August.
China Jan-Sept trade surplus with the US at $280 bln.
FX implications
AUD/USD ignores upbeat Chinese trade figures, now keeping its rebound intact just below 0.7350. The spot loses 0.08% on the day, currently trading at 0.7341.
In a Bloomberg TV interview on Tuesday, Standard Chartered’s Chief Executive Officer Bill Winters said “Chinese government won't allow the turbulence surrounding stricken property developer China Evergrande Group to turn into a systemic crisis.”
Additional quotes
"This idea that this was something of a Lehman moment for China: I don't think China's frankly that dumb"
“The broader global economy, meanwhile, is facing a bumpy recovery from the Covid-19 pandemic.”
“I’m not desperately concerned about the economy but I think it’s going to be a little bit harder,” he said. The removal of pandemic-era support measures will take away some momentum.”
“I think the inflationary pressures are transitory, but I also see structural wage pressures that are building up on the back of a reasonably strong economy and other dislocations that will not be easily resolved.”
- USD/JPY witnessed some selling on Wednesday and snapped four days of the winning streak.
- A cautious market mood benefitted the safe-haven JPY and exerted some downward pressure.
- Retreating US bond yields kept the USD bulls on the defensive and contributed to the decline.
- Investors look forward to the US CPI report and FOMC minutes for a fresh directional impetus.
The USD/JPY pair edged lower through the Asian session and dropped to fresh daily lows, around the 113.35 region in the last hour.
The pair witnessed some selling during the first half of the trading action on Wednesday and eroded a major part of the overnight gains to the highest level since December 2018. This marked the first day of a negative move in the previous five sessions and was sponsored by a combination of factors.
Fears of a return of stagflation, along with concerns about spillover from China Evergrand's debt crisis continued weighing on investors' sentiment. This, in turn, extended some support to the safe-haven Japanese yen and turned out to be a key factor that exerted pressure on the USD/JPY pair.
Bearish traders further took cues from the overnight pullback in the US Treasury bond yields, which kept the US dollar bulls on the defensive. Apart from this, Wednesday's downtick could further be attributed to profit-taking amid extremely overbought conditions on short-term charts.
That said, the downside is likely to remain cushioned amid expectations for an early policy tightening by the Fed. Despite Friday's disappointing headline NFP print, investors seem convinced that the Fed remains on track to begin rolling back its massive pandemic-era stimulus as soon as November.
The markets also seem to have started pricing in the possibility of an interest rate hike in 2022 amid worries that the recent surge in crude oil/energy prices will stoke inflation. Hence, the focus shifts to the US consumer inflation figures, due later during the early North American session.
This will be followed by the release of the FOMC monetary policy meeting minutes. A stronger CPI print and (or) a hawkish Fed could bring further gains for the US currency. This, along with the US bond yields and the broader market risk sentiment, would provide a fresh impetus to the USD/JPY pair.
Technical levels to watch
| Raw materials | Closed | Change, % |
|---|---|---|
| Brent | 83.37 | -0.38 |
| Silver | 22.544 | -0.07 |
| Gold | 1759.998 | 0.36 |
| Palladium | 2041.48 | -3.17 |
China Customs published the January to September month trade data (yuan terms) in the last hours, with both imports and exports up 22.6% and 22.7% YoY respectively.
After the release, the trade body came out with the following headlines, citing that China's trade still faces relatively many uncertain and unstable factors.
Additional takeaways
“China's measures to stabilize foreign trade are showing results. “
“Foreign trade will soften in the fourth quarter due to last year's high base. “
“Whole year trade expected to maintain relatively fast growth.”
Related reads
- AUD/USD off lows, on the defensive below mid-0.7300s
US Senate Democratic Leader Chuck Schumer's Office informed Congress late Tuesday, the US plans to reopen the US-Canadian border to nonessential vaccinated travellers by early November, per Buffalo News.
Separately, Democratic Senator Gillibrand's Office noted that the country will also open the border with Mexico to fully vaccinated travelers.
Market reaction
The US dollar is little impressed by these headlines, as it extends its corrective pullback against its major peers from yearly tops.
The US dollar index is currently shedding 0.20% on the day to trade at 94.33, having reached fresh 2021 highs at 94.56 on Tuesday.
- AUD/USD witnessed some selling during the Asian session, though lacked follow-through.
- A softer risk tone turned out to be a key factor that undermined the perceived riskier aussie.
- A subdued USD price action helped limit losses ahead of the US CPI report/FOMC minutes.
The AUD/USD pair extended the previous day's late pullback from over one-month tops and continued losing ground through the Asian session on Wednesday. The pair dropped to two-day lows, around the 0.7330 region in the last hour, albeit lacked follow-through selling.
The pullback lacked any obvious fundamental catalyst and could be attributed to some profit-taking amid the prevalent cautious mood, which tends to drive flows away from the perceived riskier aussie. Worried about a faster than expected rise in inflation and signs of a slowdown in the global economic recovery have been fueling concerns about stagflation. Apart from this, fears of a spillover from China Evergrand's debt crisis continued weighing on investors' sentiment.
However, the recent widespread rally in commodity prices continued acting as a tailwind for the resource-linked Australian dollar. This, along with a subdued US dollar price action, extended some support to the AUD/USD pair. The ongoing retracement slide in the US Treasury bond yields turned out to be a key factor that kept the USD bulls on the defensive. That said, hawkish Fed expectations should help limit any meaningful downfall for the greenback, at least for now.
Investors seem convinced that the Fed will begin rolling back its massive pandemic-era stimulus as soon as November. The markets have also started pricing in the possibility of an interest rate hike amid risks that the continued surge in crude oil/energy prices will stoke inflation. Hence, the market focus will be on Wednesday's release of the US consumer inflation figures. This will be followed by the FOMC meeting minutes later during the US trading session.
This would play a key role in influencing the near-term USD price dynamics and provide a fresh directional impetus to the AUD/USD pair. In the meantime, the US bond yields and the broader market risk sentiment will be looked upon for some short-term trading opportunities.
Technical levels to watch
After a negative close on Wall Street overnight, the Asian stocks are off to a rough start on Wednesday, taking cues from a 0.20% drop in the S&P 500 futures.
Investors digest the latest discouraging news that the International Monetary Fund (IMF) cut its global growth forecast to 5.9% from 6% this year. The chips shortage and energy crunch continue to pose downside risks to the economic recovery worldwide.
Markets also remain cautious ahead of the critical US inflation data release, which will be followed by the FOMC minutes. The events are likely to seal in a November Fed’s tapering.
On the other side of the globe, China continues to battle with the indebted property sector crisis while the country’s regulators ramp up the crackdown on private sector industries.
On a bright note, the US debt limit increase bill gets enough support in the House of Representatives to win the final passage. Although the markets pay a little heed to it, as the sentiment remains at the mercy of the Fed's tapering speculations and global growth concerns.
At the time of writing, S&P 500 futures drop 0.19% on the day to trade at 4,342, the Nikkei 225 index erases losses to recapture 28,000 and China stocks remain marginally lower so far.
- USD/INR bulls push deeper into the bear's lair.
- There is a focus on the downside and prior structure.
The price is well into the bear's lair at this juncture and a downside correction would be expected imminently. The Fibonacci retracements are in focus with the 38.2% Fibo inline with prior market structure looking left near 75 the figure.
USD/INR daily chart
-637696866727985348.png)
With all that being said, there could be an exodus from emerging markets if the US dollar continues its northern trajectory, but that may well depend on the next few days of data events that include US Consumer Price Index, Federal Open Market Committee minutes and then Retail Sales data on Friday.
In recent trade today, the People’s Bank of China (PBOC) set the yuan (CNY) at 6.4612 vs the previous fix of 6.4479 and the previous close of 6.4472.
About the fix
China maintains strict control of the yuan’s rate on the mainland.
The onshore yuan (CNY) differs from the offshore one (CNH) in trading restrictions, this last one is not as tightly controlled.
Each morning, the People’s Bank of China (PBOC) sets a so-called daily midpoint fix, based on the yuan’s previous day closing level and quotations taken from the inter-bank dealer.
- US dollar is on the back foot, retreating from fresh daily highs.
- US yields slump after making fresh highs also before critical US events.
As per bullish analysis, dating back to August of this year, US dollar embarking on a highly bullish weekly close, the price has indeed moved higher along the projected bullish path. US yields have led in a similar trajectory, as forecasted in August as well, here: US dollar holds no bars as it hunts down July highs.
The dollar index, which measures the greenback against a basket of other major currencies, touched 94.519 its highest since late September 2020. Yields on the US two-year Treasury note jumped to their highest in more than 18 months on Tuesday, as investors sold US debt.
The fears that that soaring energy prices would fuel inflation and add to pressure on the Fed to take action sooner than anticipated. However, the higher high was short-lived and the yield on the two-year fell into the close in New York. Today, yields are on the back foot which could be helping to explain the sluggish behaviour in the greenback on Wednesday so far.
With that being said, traders are likely taking a respite ahead of critical data from the US, starting with US Consumer Price Index today. Retail Sales data is then expected on Friday to add further clues as to when the Fed might begin winding down its stimulus. Meanwhile, the minutes of the September FOMC meeting will also provide greater clarity on the Committee’s view of the risks.
- USD/CHF edges lower on Wednesday in the Asian session.
- Higher highs and higher lows depict the upside trend in the pair since August 30.
- MACD trades holds onto the overbought zone with receding upside momentum.
USD/CHF trades with losses on Wednesday in the initial Asian trading hours. The pair failed to preserve the previous session’s upside momentum. At the time of writing, USD/CHF is trading at 0.9300 down 0.11% for the day.
USD/CHF daily chart
-637696846948403094.png)
On the daily chart, after testing the five-month high near 0.9368, the USD/CHF pair failed to preserve the momentum and touched the intraday low of 0.9230 in the previous week. Nevertheless, the pair took shelter near the 21-day Simple Moving Average (SMA) at 0.9246 and continued to ride higher.
Having said that, If the price sustains the intraday high, it could immediately test the 0.9320 horizontal resistance level. A daily close above 0.9320 would open the gates for the 0.9340 horizontal level followed by the high of September 30 in the vicinity of 0.9370 area.
Alternatively, the Moving Average Convergence Divergence (MACD) trades in the overbought zone with receding upside momentum. Any downtick in the MACD would encourage the USD/CHF bears to test the 0.9280 horizontal support level. Further, a break of the ascending trendline will amplify the selling pressure toward the previous day's low of 0.9257, keeping eye on the 0.9230 horizontal support level.
USD/CHF additional levels
- USD/CAD trades in a rangebound manner on Wednesday in the Asian session.
- Crude oil retreats from seven-year highs still remain firm near 80.50.
- Lower US Treasury yields undermin the demand for the US dollar.
The USD/CAD pair edges higher in the middle of the week. The pair remains stuck in a narrow trade band of 1.2440 and 1.2500 for the past three-session. At the time of writing, USD/CAD is trading at 1.2470, up 0.04% for the day.
The US dollar retreats from the higher levels ahead of the US Core Inflation Index (CPI) readings. A day earlier, consensus forecasts pointed to a 5.3% in the CPI for September on yearly basis. Fed’s keeps a close watch on inflation readings to go ahead with its tapering decision. The Federal Reserve Bank of Richmond President Thomas Barkin commented pricing pressure is due to supply-chain bottlenecks weighs on the greenback. In addition to that, Atlanta Fed President Raphael Bastic said the current inflation is not doing much to harm the economy to call Fed’s policy stance into question.
Meantime, the US debt limit has passed in the House and will be presented to US President Joe Biden for signing.
On the other hand, the loonie manages to gain traction on robust WTI prices, a major Canadian export.
As for now, traders are waiting for the US Core Inflation Index, and FOMC Minutes to take fresh trading impetus.
USD/CAD additional levels
| Time | Country | Event | Period | Previous value | Forecast |
|---|---|---|---|---|---|
| 03:00 (GMT) | China | Trade Balance, bln | September | 58.34 | 46.8 |
| 06:00 (GMT) | Germany | CPI, m/m | September | 0% | 0% |
| 06:00 (GMT) | Germany | CPI, y/y | September | 3.9% | 4.1% |
| 06:00 (GMT) | United Kingdom | Manufacturing Production (YoY) | August | 6% | 4.1% |
| 06:00 (GMT) | United Kingdom | Manufacturing Production (MoM) | August | 0% | 0% |
| 06:00 (GMT) | United Kingdom | Industrial Production (YoY) | August | 3.8% | 3.1% |
| 06:00 (GMT) | United Kingdom | Industrial Production (MoM) | August | 1.2% | 0.2% |
| 06:00 (GMT) | United Kingdom | GDP m/m | August | 0.1% | 0.5% |
| 06:00 (GMT) | United Kingdom | GDP, y/y | August | 7.5% | 6.7% |
| 06:00 (GMT) | United Kingdom | Total Trade Balance | August | -3.1 | |
| 09:00 (GMT) | Eurozone | Industrial Production (YoY) | August | 7.7% | 4.7% |
| 09:00 (GMT) | Eurozone | Industrial production, (MoM) | August | 1.5% | -1.6% |
| 12:30 (GMT) | U.S. | CPI excluding food and energy, m/m | September | 0.1% | 0.3% |
| 12:30 (GMT) | U.S. | CPI, m/m | September | 0.3% | 0.3% |
| 12:30 (GMT) | U.S. | CPI excluding food and energy, Y/Y | September | 4% | 4% |
| 12:30 (GMT) | U.S. | CPI, Y/Y | September | 5.3% | 5.3% |
| 13:00 (GMT) | United Kingdom | NIESR GDP Estimate | Quarter III | 2.4% | |
| 14:30 (GMT) | United Kingdom | MPC Member Cunliffe Speaks | |||
| 18:00 (GMT) | U.S. | FOMC meeting minutes | |||
| 20:30 (GMT) | U.S. | FOMC Member Brainard Speaks | |||
| 22:00 (GMT) | Australia | RBA Assist Gov Debelle Speaks |
The markets have one less concern with the Democratic-controlled US House of Representatives giving final approval to a Senate-passed bill. This is a temporary measure that will raise the government's borrowing limit to $28.9 trillion, putting off the risk of default at least until early December.
Meanwhile, the Democrats, who narrowly control the House, maintained party discipline to pass the hard-fought, $480 billion debt limit increase by 219-206, Reuters reported.
''The vote was along party lines, with every yes from Democrats and every no from Republicans.''
''President Joe Biden is expected to sign the measure into law this week, before Oct. 18, when the Treasury Department has estimated it would no longer be able to pay the nation's debts without congressional action.''
Market implications
This was a widely expected outcome and the bill would be thought to be treated as a matter of priority in the White House. However, while there has been no direct reflection on markets in the outcome, it is a relief and this should help dampen some of the storms that are coming in thick and fast from elsewhere.
Evergrande contagion has gathered pace in recent days at the same time inflation concerns amount to worries over the prospects of stagflation, a conundrum fro central banks seeking to taper their COVID-19 QE programmes with the onset of bottle neck supply lines and soaring global energy prices.
| Pare | Closed | Change, % |
|---|---|---|
| AUDUSD | 0.73505 | 0.03 |
| EURJPY | 130.943 | 0.04 |
| EURUSD | 1.15295 | -0.19 |
| GBPJPY | 154.307 | 0.18 |
| GBPUSD | 1.35824 | -0.08 |
| NZDUSD | 0.69278 | -0.08 |
| USDCAD | 1.24568 | -0.16 |
| USDCHF | 0.92967 | 0.28 |
| USDJPY | 113.598 | 0.26 |
- GBP/USD edges lower on Wednesday in the early Asian trading hours.
- The pair faces strong resistance near 1.3650 inside the symmetrical triangle.
- Downside needs validation below 1.3580, MACD holds in the oversold zone.
GBP/USD continues to consolidate for the past few sessions with downside risk. The pair confides in a narrow trade band with small losses. At the time of writing, GBP/USD is trading at 1.3583, down 0.04% for the day.
GBP/USD daily chart
-637696804088509059.png)
On the daily chart, after testing the high of 1.3913 on September 14, the GBP/USD pair lost momentum and continued with its existing short-term downside trend. Furthermore, the spot trades below the 21-day Simple Moving Average (SMA) at 1.3629 inside the symmetrical triangle formation, which confirms the pressured movement for the pair at least in the short term. Having said that, if the price breaks the intraday low, it could test the ascending trendline of the mentioned triangle at 1.3565, extending from the low of 1.3411.
The break of the bullish slopping line would further confirm the continuation of the downside momentum for the pair. GBP/USD bears shall lookout for the 1.3500 horizontal support level followed by the October 1 low at 1.3433.
The Moving Average Convergence Divergence (MACD) indicator holds onto the oversold zone. This means that any uptick in the MACD could bring some upside momentum for the Spot. The bulls would approach the psychological 1.3600 level in that case. Next, the pair would be prompted to test the 21-SMA at 1.3629 followed by the 1.3650 horizontal resistance level.
GBP/USD additional levels


© 2000-2026. Sva prava zaštićena.
Sajt je vlasništvo kompanije Teletrade D.J. LLC 2351 LLC 2022 (Euro House, Richmond Hill Road, Kingstown, VC0100, St. Vincent and the Grenadines).
Svi podaci koji se nalaze na sajtu ne predstavljaju osnovu za donošenje investicionih odluka, već su informativnog karaktera.
The company does not serve or provide services to customers who are residents of the US, Canada, Iran, The Democratic People's Republic of Korea, Yemen and FATF blacklisted countries.
Izvršenje trgovinskih operacija sa finansijskim instrumentima upotrebom marginalne trgovine pruža velike mogućnosti i omogućava investitorima ostvarivanje visokih prihoda. Međutim, takav vid trgovine povezan je sa potencijalno visokim nivoom rizika od gubitka sredstava. Проведение торговых операций на финанcовых рынках c маржинальными финанcовыми инcтрументами открывает широкие возможноcти, и позволяет инвеcторам, готовым пойти на риcк, получать выcокую прибыль, но при этом неcет в cебе потенциально выcокий уровень риcка получения убытков. Iz tog razloga je pre započinjanja trgovine potrebno odlučiti o izboru odgovarajuće investicione strategije, uzimajući u obzir raspoložive resurse.
Upotreba informacija: U slučaju potpunog ili delimičnog preuzimanja i daljeg korišćenja materijala koji se nalazi na sajtu, potrebno je navesti link odgovarajuće stranice na sajtu kompanije TeleTrade-a kao izvora informacija. Upotreba materijala na internetu mora biti praćena hiper linkom do web stranice teletrade.org. Automatski uvoz materijala i informacija sa stranice je zabranjen.
Ako imate bilo kakvih pitanja, obratite nam se pr@teletrade.global.
транcфери