- Analiza
- Novosti i instrumenti
- Vesti sa tržišta
Forex-novosti i prognoze od 14-10-2021
- The Aussie climbs on the back of broad US dollar weakness.
- The market sentiment is mixed, as Asian equity futures seesaw between gainers and losers.
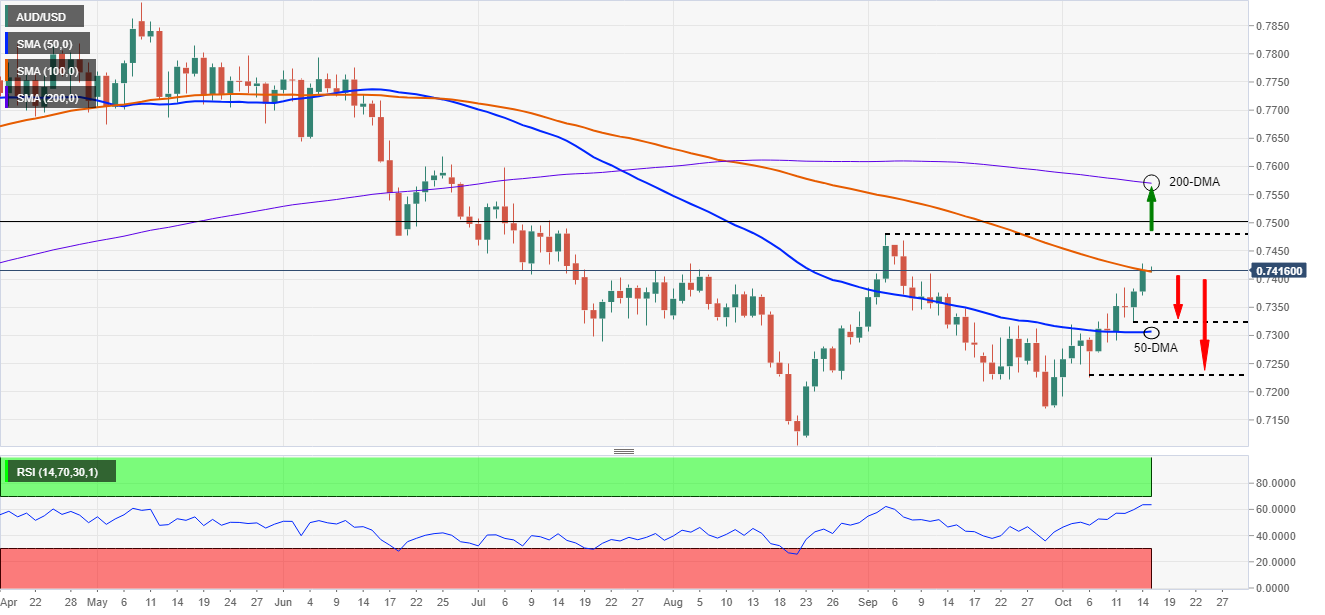
- AUD/USD: Downward pressured, as the 200-DMA remains above the spot price.
The AUD/USD begins the Asian session on the right foot, climbs 0.05%, trading at 0.7419, during the day at the time of writing.
The market sentiment was upbeat on Thursday, as portrayed by European and American stock indexes, finishing in the green. The US Dollar weakened across the board, slid 0.11% to end at 93.97, underpinned by falling US T-bond yields, with the 10-year benchmark note coupon, down three basis points, finished at 1.516%.
As the Asian session starts, the current mood, as witnessed by Asian equity futures, is split between gainers and losers. Meanwhile, the S&P/ASX Australian Stock Exchange and the Nikkei 225 are rising 0.60% and 1.46%, respectively.
AUD/USD Price Forecast: Technical outlook
Daily chart
The AUD/USD is trading below the 200-day moving average (DMA), indicating the pair is in a downtrend. The 50-DMA is well below the price action, whereas the 100-DMA at 0.7410, while underneath, is near the spot price. Momentum indicators like the Relative Strength Index (RSI) at 64 supports the upward trend, but a daily close above the 100-DMA could open the door for further gains.
In that outcome, the first resistance for the AUD/USD pair would be the September 3 high at 0.7477, immediately followed by 0.7500. A breach of that area would expose the 200-DMA at 0.7567.
On the other hand, failure at the 100-DMA would resume the downward trend, pressuring the pair towards the October 13 low at 0.7322. A clear break below the latter would expose key support levels, like the 50-DMA at 0.7304, followed by the October 6 low at 0.7225.
AUD/USD: KEY ADDITIONAL LEVELS TO WATCH
The Governor of the Bank of Canada, Tiff Macklem, said global supply chain bottlenecks are not easing as quickly as expected, meaning inflation in Canada and among IMF members will probably take a little longer to come down.
"These bottlenecks are not easing as quickly as expected. And there was certainly a strong consensus these issues warrant continued attention and they are going to take some time to work through," said Macklem of his talks with IMF central bankers.
"What this all means, in all our countries, is that inflation - measures of inflation - are probably going to take a little longer to come back down," he added.
Macklem also said that while the supply chain hiccups are looking a bit more persistent, they continue to be viewed as transitory.
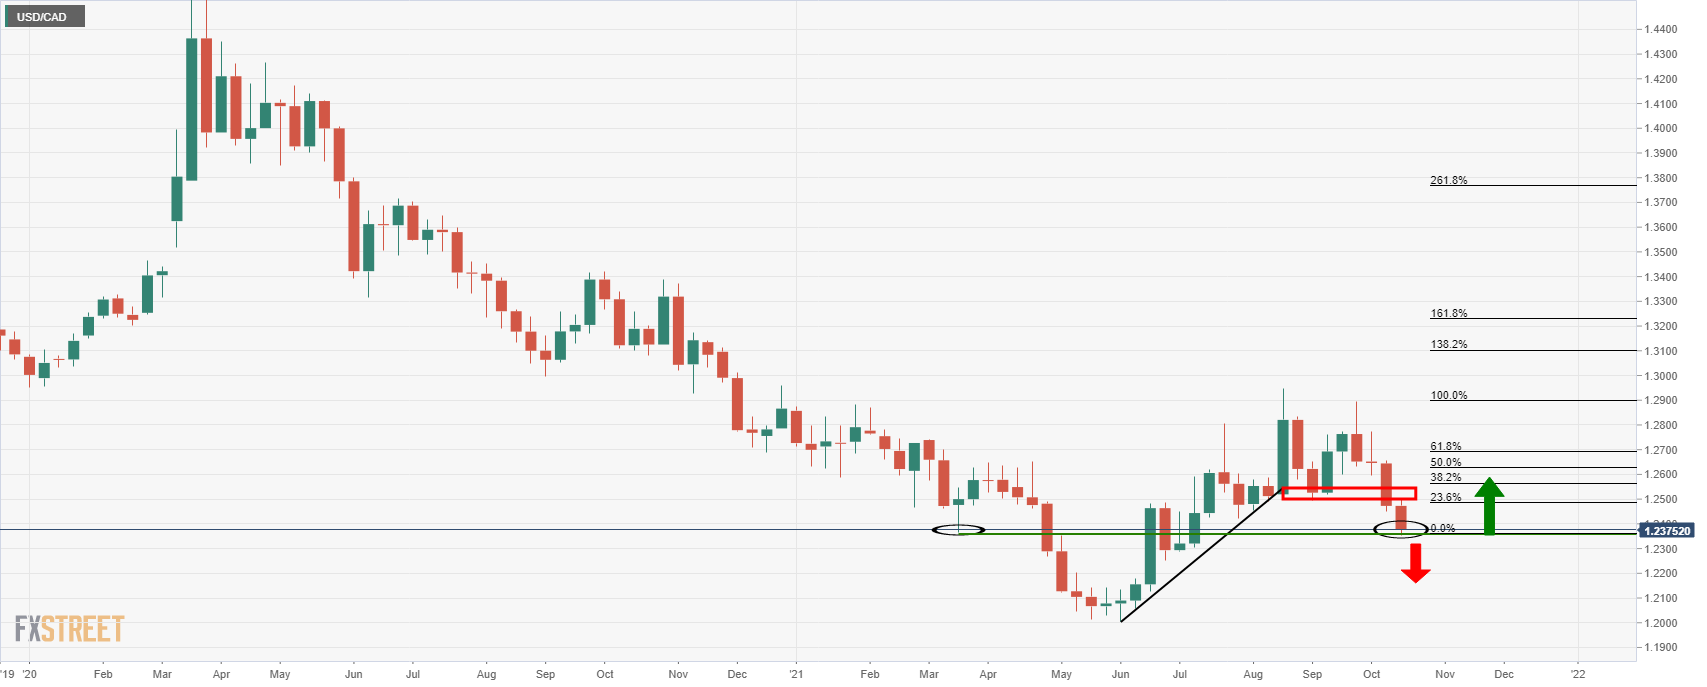
USD/CAD implications
The Canadian dollar has been the strongest of those on the Currency Strength Indicators since 30 Sep when the US dollar started to slide. The commodity complex is hot and CAD is propped up by sky-high oil prices:
-637698519265595451.png)
- USD/CHF edges higher on the last trading day of the week.
- Lower US Treasury yields undermine the demand for the US dollar.
- Fed tapering, inflationary concerns, and job data influence traders decision.
The USD/CHF pair accumulates mild gains on Friday in the early Asian session. After testing the low near 0.9194 after the US PPI data, the pair managed to bounce back near 0.9250. At the time of writing, USD/CHF is trading at 0.9235, up 0.05% for the day.
The US benchmark 10-year Treasury yields trade at 1.51% on softer US Producer Price Index (PPI) readings. The PPI rises 0.5% in September, below the market expectations of 0.6%. Further, the Initial Jobless Claims falls to a new pandemic low at 293,000 much below the market consensus of 318,000. The greenback follows the US bond yields and remains pressured below 94.00. It is worth noting that, S&P 500 Futures is trading at 4,434, up 0.12% for the day.
In addition to that, the President and CEO of the Federal Reserve Bank of Philadelphia said he is not expecting rate hikes until late 2022, or early 2023.
On the other hand, the Swiss franc loses momentum on higher inflation data. Switzerland’s producer and import prices jump 4.5% in September on a YoY basis.
As for now, traders are looking for the US Retails Sales data to take fresh trading insight.
USD/CHF additional levels
- A positive market sentiment hurt safe-haven currencies on Thursday, but the greenback versus the Japanese Yen appreciated.
- The US 10-year Treasury yield dipped three basis points, finished at 1.516%.
- Fed’s Bullard and Bostic, among others, coincide that inflationary pressures are stickier than expected.
The USD/JPY begins on the right foot in the Asian session, advances 0.01% is trading at 113.70 during the day at the time of writing.
On Thursday, financial markets witnessed appetite towards riskier assets, depicted by US equity indexes, finishing in the green, following European stocks footprints. In the Forex Market, the greenback weakened in tandem with safe-haven currencies, while the US 10-year T-bond yield fell three basis points, to end at 1.516%. Despite all those factors, the greenback gained traction against the Japanese Yen, reversing the Wednesday price action when the USD/JPY pair threatened to break under the 113.00 figure.
Also, some Fed speakers crossed the wires. The St. Louis Fed President James Bullard said that there is no strong case that inflationary pressures will dissipate over the next six months. In the same tone, the Atlanta Fed President Raphael Bostic said that inflation appears to last longer attributed to supply chains and labor disruptions.
Furthermore, the US Initial Jobless Claims decreased to 293K better than the 319K foreseen by analysts, increasing the chances of a Fed’s bond taper announcement in the November meeting. Additionally, the US Producer Price Index (PPI) rose by 8.6%, lower than the 8.7% estimated, while the PPI excluding food and energy, the so-called Core, increased by 6.8%, lower than the 7.1%.
On Friday, the Japanese economic docket will feature the Tertiary Industry Index for August on a monthly basis is expected at 0%.
Meanwhile, in the US, Retail Sales and the University of Michigan Consumer Sentiment Index will be unveiled on Friday. Investors expect a decrease of 0.2% in Retail Sales for September, whereas the UoM Consumer Sentiment Index for October estimates around 73.1 better than the September 72.8.
USD/JPY: KEY ADDITIONAL LEVELS TO WATCH
- EUR/USD is stalling just below the daily 20 EMA.
- A period of sideways accumulation could be on the cards for the near term.
EUR/USD has shot higher in the last few sessions but the rally has stalled and left a doji topping candle on the daily chart. The following is an analysis of both the daily and hourly chart that illustrates a downside bias for the meanwhile.
EUR/USD daily chart
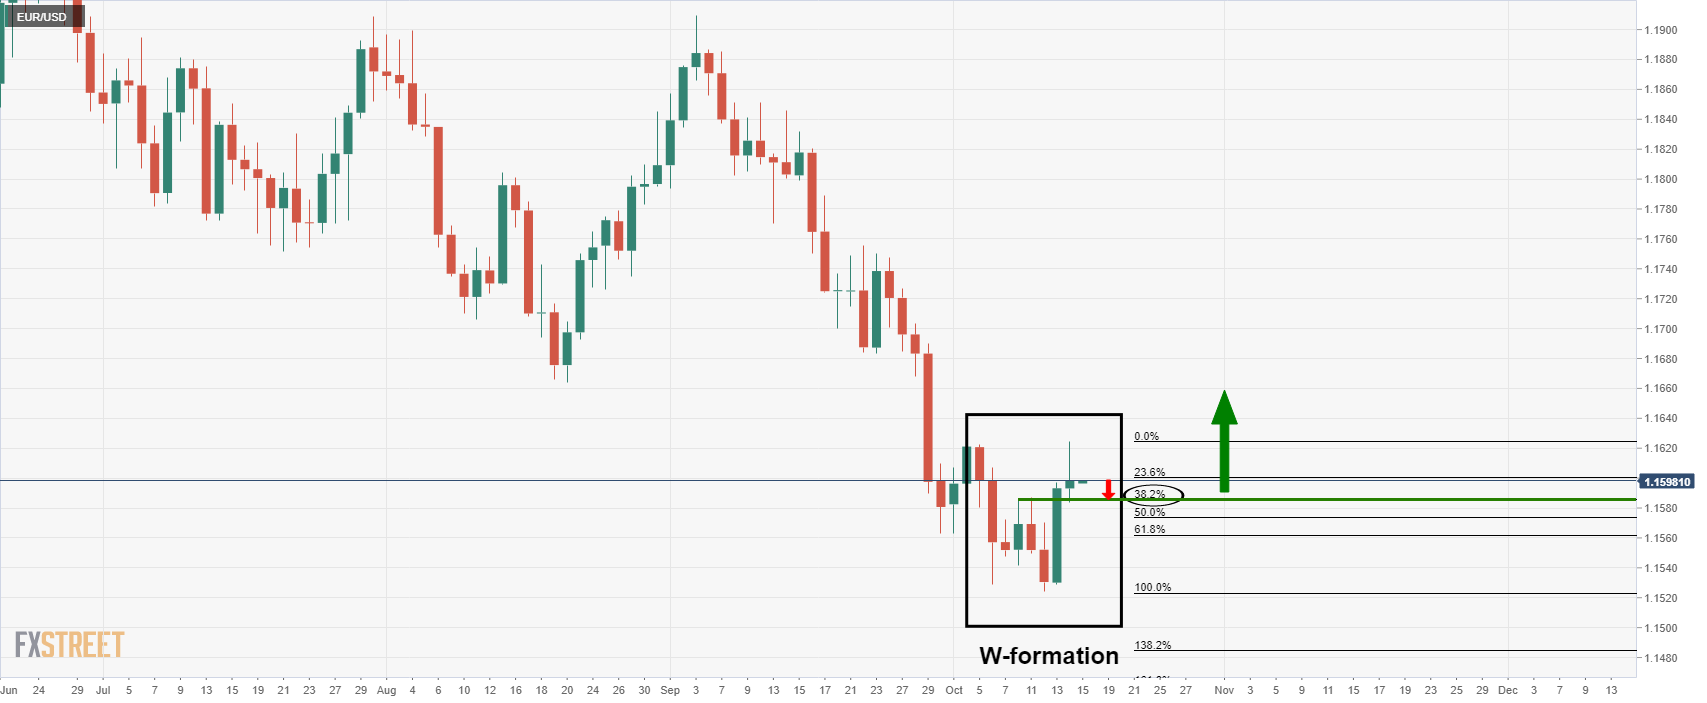
The W0formaiton is a reversion pattern that has a high completion rate. The price would be expected to retest the neckline of the formation from where it might find enough demand in buyers accumulating the euro at a discount. In doing so, that would be expected to lead to a higher high in a fresh daily impulse to the upside.
EUR/USD 1-hour chart
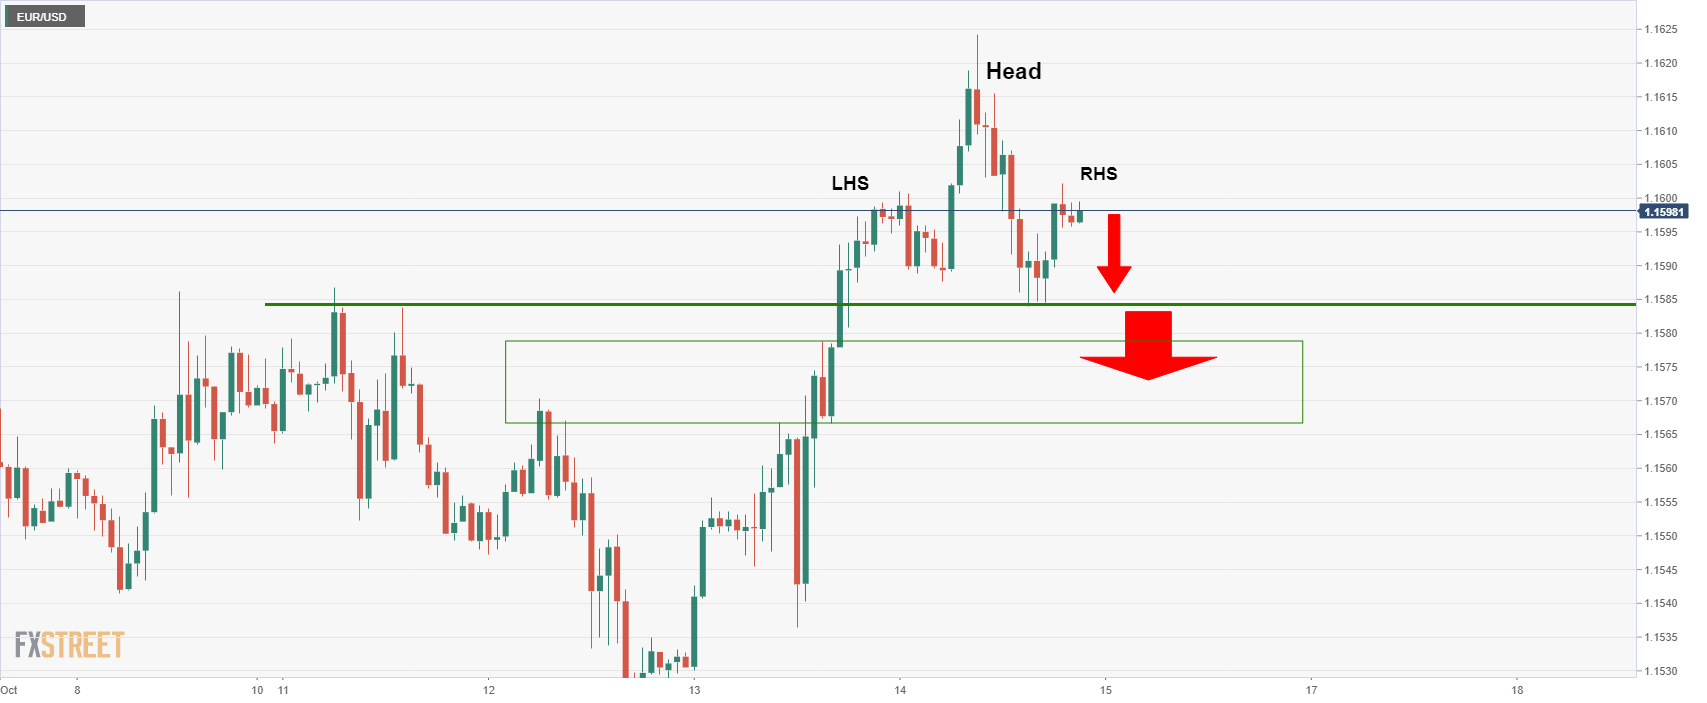
However, from a lower time frame perspective, the hourly chart is forming a bearish head and shoulders, so there are prospects of a downside continuation below the daily 38.2% Fibo target which suggests that the market will remain in a period of sideways accumulation for somewhile longer.
The Financial Times has released an article that will likely make sterling investors nervous as Brussels has been urged to prepare a contingency plan for the UK trade war. The ''EU countries want European Commission to be ready if Britain suspends key part of Brexit deal,'' the Financial Times explained.
''Leading EU member states are pressing Brussels to draw up tough retaliatory measures should the UK carry out its threat to suspend trading arrangements for Northern Ireland enshrined in the Brexit deal.
Representatives of five member states on Monday met European Commission vice-president Maros Sefcovic, the EU Brexit negotiator, to demand he come up with contingency plans for a possible trade war, diplomats have told the Financial Times.''
As bilateral discussions start again in earnest over the Northern Ireland Protocol, there's definite potential for things to get a lot messier which is going to be a headwind for the pound.
UK Brexit Minister Lord Frost’s demand to rewrite the Protocol to at least dilute the role of the European Court of Justice (ECJ) in overseeing the rules. If Lord Frost does not back down on this, an EU official said it will be “a very big gap between the ideas we are putting on the table today and what the UK Government is asking for.''
GBP/USD weekly chart
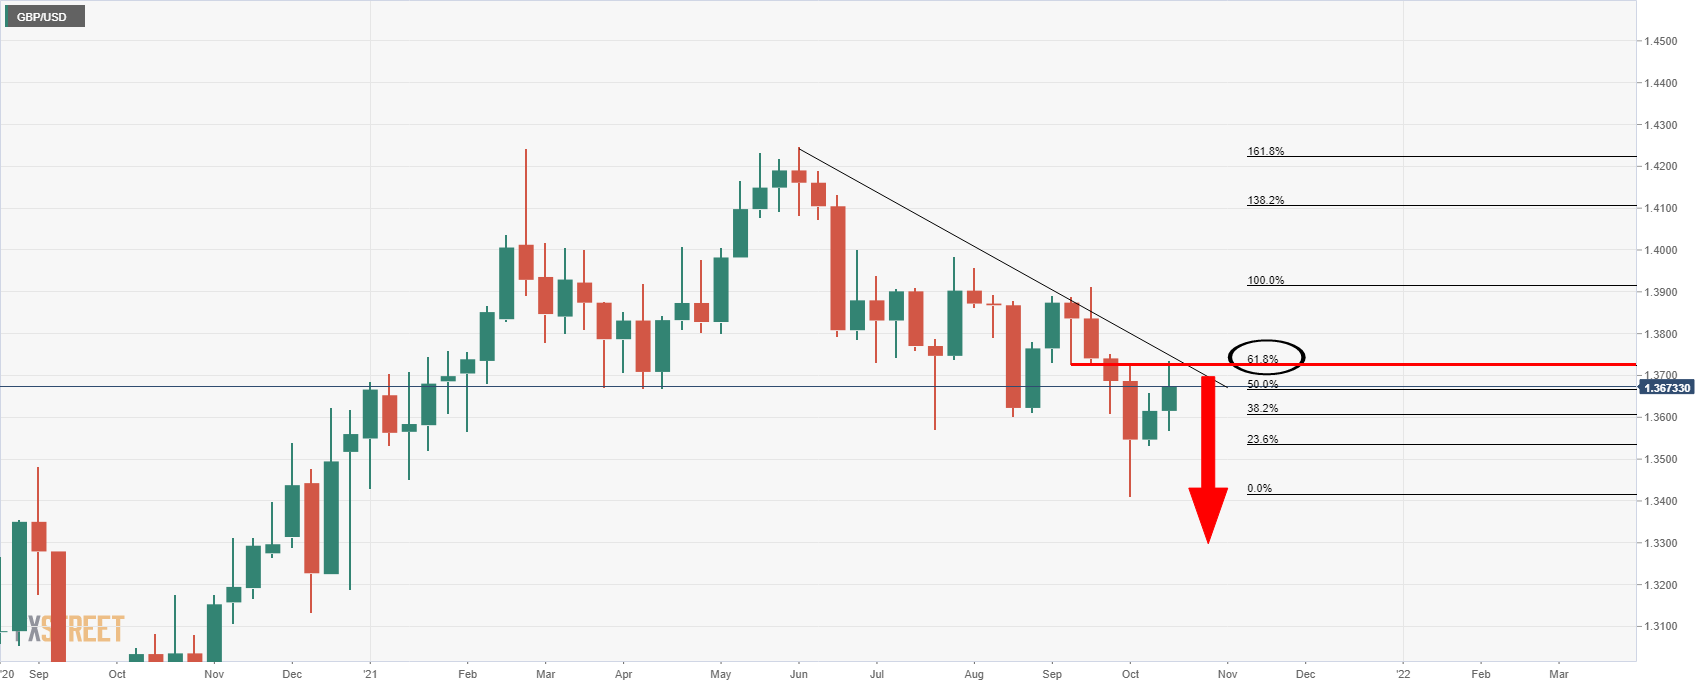
From a weekly perspective, considering the price dropped below all of the support structures which it is now testing again as resistance, the bias remains bearish. A correction to the trendline resistance and a 61.8% Fibonacci is underway, but bears are likely lurking at these levels.
- S&P 500 SPX gained 74.35 points, or 1.70%.
- Nasdaq Composite IXIC gained 248.97 points, or 1.71%.
- The DJI rose 532.21 points, ending up 1.55%.
US stocks charged higher on Thursday on strong earnings from companies including Morgan Stanley and UnitedHealth. Additionally, US data came in contrary to the inflation theme as well, cooling fears of stagflation.
As for the performance of the benchmarks, the S&P 500 added 74.35 points, or 1.70%, to end at 4,438.15 points, while the Nasdaq Composite climbed 248.97 points, or 1.71%, to 14,824.90. The Dow Jones Industrial Average DJI gained 532.21 points, or 1.55%, to 34,910.02. As for industry performaces, the technology sector was the strongest in the S&P with giants Microsoft Corp MSFT and Apple Inc AAPL climbing. Individual shares in the financial bloc, Citigroup C, Bank of America Corp BAC and Morgan Stanley MS were firmer following results that were released that topped quarterly earnings estimates.
US data dials down inflation nerves
Meanwhile, US data showed the number of Americans filing new claims for unemployment benefits last week fell close to a 19-month low, and a separate report showed producer prices eased in September to the lowest level this year as airline passenger service costs plunged. The seasonally adjusted PPI rose 0.5%, compared with a 0.7% gain in August, the Bureau of Labor Statistics said Thursday. The latest print was the lowest since December.
- The GBP/USD pair stalls at the 50-DMA retrace below 1.3700.
- Risk-on market sentiment boosts the GBP undermines the greenback.
- GBP/USD: The Relative Strength Index above 50, aiming higher, indicates that there could be a leg-up near 1.3800.
The GBP/USD retreats from the daily high around 1.3733, advances 0.20% during the New York session, trading at 1.3688 at the time of writing. The British pound could not hold to the 1.3700 level, broke the latter in a counter-trend move, which in 4-hours witnessed a 60 pip drop.
Risk-on market sentiment drives the market, portrayed by US equity indexes, posting gains between 1.47% and 1.82%. Risk-sensitive currencies, like the AUD and the GBP, are greatly favored. Additionally, the British pound had a boost over the weekend when Bank of England’s members expressed their interest in tackling rising inflation by hiking interest rates.
The greenback has been under selling pressure across the board, with the US Dollar Index that measures the buck’s performance against a basket of six currencies, slides 0.11%, clings to 93.97. Nevertheless, despite those factors, the US dollar trimmed some of its losses against the Sterling.
GBP/USD Price Forecast: Technical outlook
Daily chart
Despite the broad US dollar weakness, the Sterling advance stalled at the 50-day moving average, around 1.3716. The subsequent price action exerted downward pressure on the pair. Momentum indicators like the Relative Strenght Index (RSI) at 52 indicate that the GBP/USD pair might print another leg-up before resuming the downward trend, but firstly the pair will need a daily close above the 50-DMA.
In that outcome, the following leg-up could reach the 1.3800 figure, which confluences with the 78.6% Fibo retracements (from the September 14 pivot high to the September 29 pivot low), before resuming to the downside.
On the flip side, failure at 1.3700, could see the pair sliding towards the 1.3600 figure, followed immediately by the lows of the last five days, around 1.3570.
KEY ADDITIONAL LEVELS TO WATCH
What you need to know on Friday, October 15:
As Treasury yields held at the lower end of the weekly range, the dollar remained weak. The yield on the 10-year US Treasury note bottomed at 1.507%, ending the day nearby. As for the greenback, it managed to post a modest intraday advance against the EUR and the CHF.
Wall Street rallied on the back of better than expected earnings reports from big names, including banks such as Morgan Stanley, Bank of America and Citigroup.
Upbeat US data provided additional support to the market’s mood. The September Producer Price Index was up 0.5% MoM and 8.6% YoY, higher than the August readings although below the market’s expectations,while Initial Jobless Claims for the week ended October 8 printed at 293K, much better than the 319K expected.
EUR/USD lost the 1.1600 threshold, ending the day a few pips below the level. GBP/USD settled at 1.3860, while commodity-linked currencies were the best performers. AUD/USD regained the 0.7400 mark, while USD/CAD fell to 1.2354, a fresh multi-week low.
Oil prices were up. The International Energy Agency said that record natural gas prices would boost demand for oil and top oil producer Saudi Arabia dismissed calls for additional OPEC+ supply. WTI settled at $81.40 a barrel. Gold flirted with $1,800 a troy ounce, ending the day just below the level.
Friday will bring US Retail Sales and the Michigan Consumer Sentiment Index.
Ethereum Classic price will tap $280 by early 2022
Like this article? Help us with some feedback by answering this survey:
- Bulls have broken the weekly trendline resistance but face a critical level.
- AUD/USD eyes a run to 0.7480 as the last defence for a full-on bullish breakout.
- Commodity currencies are bid on the inflation theme and rising prices.
AUD/USD is up some 0.5% on the day and the pair have travelled from a low of 0.7372 to a high of 0.7426 as the commodity currencies continue to top the forex leader boards on a daily basis. Commodities are strong with the CRB index moving to fresh cycle highs on the day in what has been a monumental rally since April 2020. AUD, in particular, is enjoying a comeback in iron ore prices with a fresh corrective high made at the start of the week.
Evergrande remains a dark cloud for AUD
However, the Evergrande crisis is a dark cloud hanging over the Australian economy and its reliance on its biggest export, iron ore. Prices sat just over $US120 ($164) per tonne of 62 per cent at the end of last week, well below the prices reached in mid-July this year, when they topped $US200 per tonne. Considering the Chinese property shake-out, the fastest and largest iron ore crash in history would be expected to resume its southerly trajectory. UBS estimates there are 10 developers with potentially risky positions with combined contract sales of 1.86tn yuan – or 2.7 times Evergrande’s size. In other words, Evergrande is only the tip of the iceberg.
Chinese construction is likely to fall over the next year and that would be expected to equate to hundreds of millions of tonnes of less steel that will be needed. This would equate to hundreds of million tonnes of iron ore equivalent also. This puts iron ore on track to fall below $100 a tonne and perhaps to even match its 2015 price crash to somewhere below $50 in the near future and weigh heavily on AUD.
USD profit-taking in play
Meanwhile, the US dollar edged down against major peers on Thursday, touching a 10-day low as rising risk appetite and profit-taking ensued at the same time. Producer price growth slowed in September to the lowest level this year as airline passenger service costs plunged. The seasonally adjusted producer price index rose 0.5%, compared with a 0.7% gain in August, the Bureau of Labor Statistics said Thursday. The latest print was the lowest since December and came in line with the consensus on Econoday.
Nevertheless, there are expectations that the US Federal Reserve is going to tighten monetary policy more quickly than previously expected amid an improving economy and surging inflation that had fuelled a rise in the greenback since early September. The minutes of the Fed's September meeting was more hawkish than expected and have confirmed the tapering of stimulus is likely to start as soon as November. The dollar index is back to being flat at the time of writing at 93.999. However, it had met its lowest since Oct 5 at 93.759. On Tuesday this week, it had reached a one-year high at 94.563.
AUD/USD technical analysis
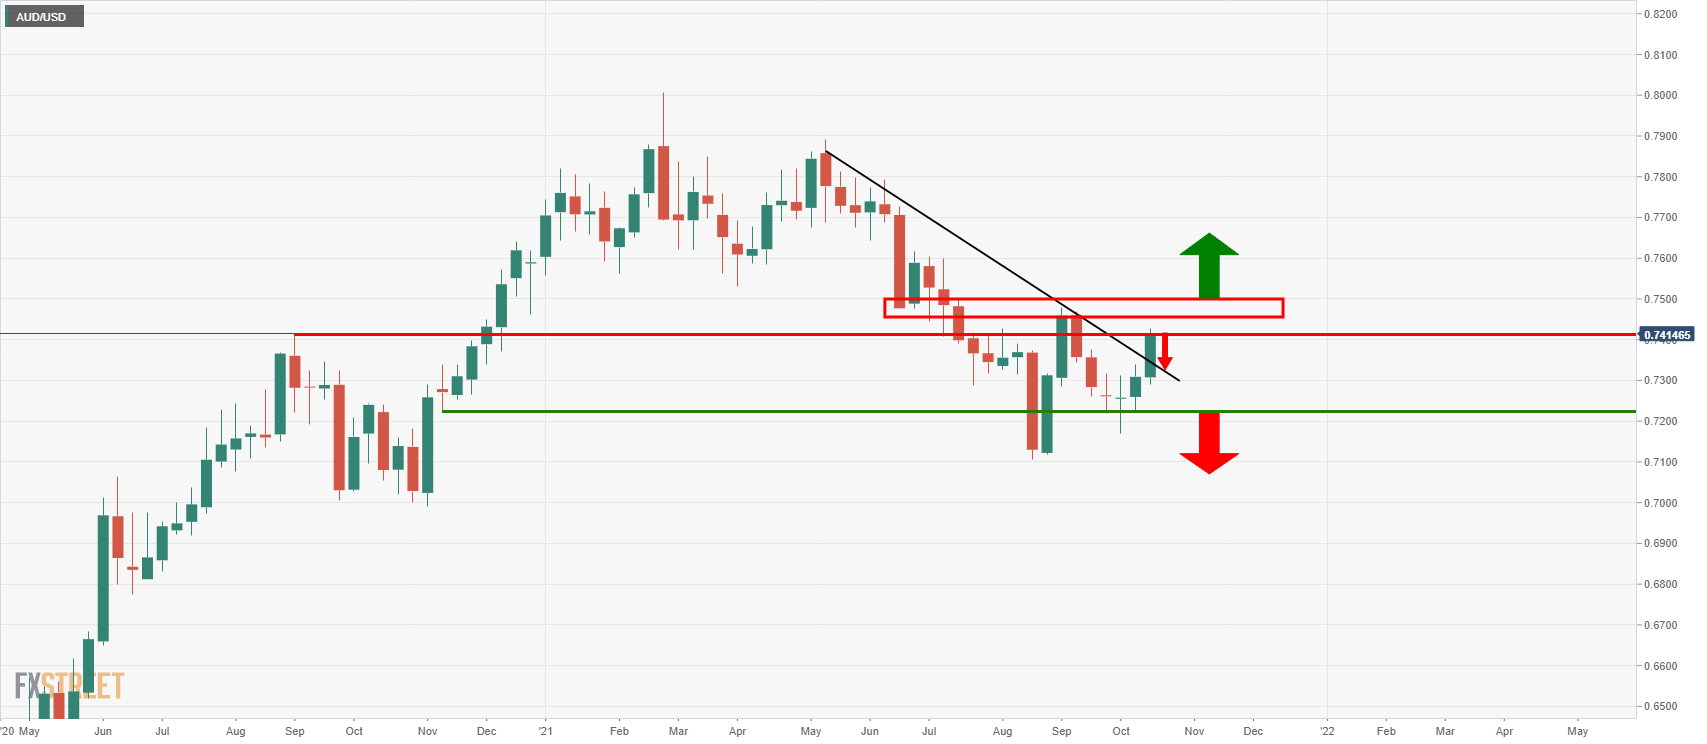
The price is meeting a familiar level on the weekly chart of Sep 2020 which could prove to as resistance and send the pair back to test what is now a counter trendline. A break of the highs, however, will bring in the Sep tweezer top near 0.7480 which guards a full-on breakout to the upside. The market will otherwise be bearish below 0.7220.
- The euro resumes its downtrend to hit 19-month lows at 0.8450.
- The pound remains bid on BoE hike expectations.
- A sustained move below 0.8437 would accelerate the downtrend – Credit Suisse.
The euro has resumed its negative trend against the British pound on Thursday, hitting prices below 0.8470 for the first time since last August, to test 19 month-lows at 0.8450, which so far has resisted the pressure.
The pound remains firm on BoE tightening expectations
The British pound maintains a firm tone, buoyed by market expectations of a BoE rate hike early next year, and probably further tightening to follow to tackle inflationary pressures. Surging energy prices have pushed yearly inflation to levels almost twice the Bank of England’s target for price stability which has prompted some Bank officials to admit the possibility of accelerating the monetary policy normalization plan.
Furthermore, the European Union’s proposal to scrap custom checks for products arriving in Northern Ireland from Britain has eased fears about another stand-off with the Union, which has increased demand for the pound.
EUR/GBP: Breach of 0.8437 would accelerate the downtrend – Credit Suisse
According to the Credit Suisse's FX Analysis team expect the 0.8449/37 support area to hols although, they warn about the possibility of downward acceleration if such level is broken: “Whilst we would again look for a fresh hold at 0.8449/37 and swing higher in the channel, a sustained move below 0.8437 would mark an acceleration in the downtrend, then exposing the key lows of 2019 and 2020 at 0.8281/39.”
Technical levels to watch
- USD/CHF recovers from a 120 pip drop from the European session.
- Lower US T-bond yields capped the recovery of the USD/CHF pair.
- USD/CHF: A daily close above the Wednesday low increases the odds for another leg-up.
The USD/CHF trims Thursday’s losses barely declines 0.09%, trading at 0.9234 during the New York session at the time of writing. The Swiss franc strengthened against the greenback earlier in the European session, sending the pair tumbling towards Thursday’s daily low at 0.9198. However, despite still below the day’s open, the buck is staging a comeback and jumped almost 120 pips from the daily lows.
Meanwhile, the US Dollar Index, which measures the greenback’s performance against a basket of its peers, is slumping 0.05%, at 93.97, underpinned by the US T-bond 10-year yield struggling to hold to the 1.5’% threshold, sits at 1.519%, down three basis points.
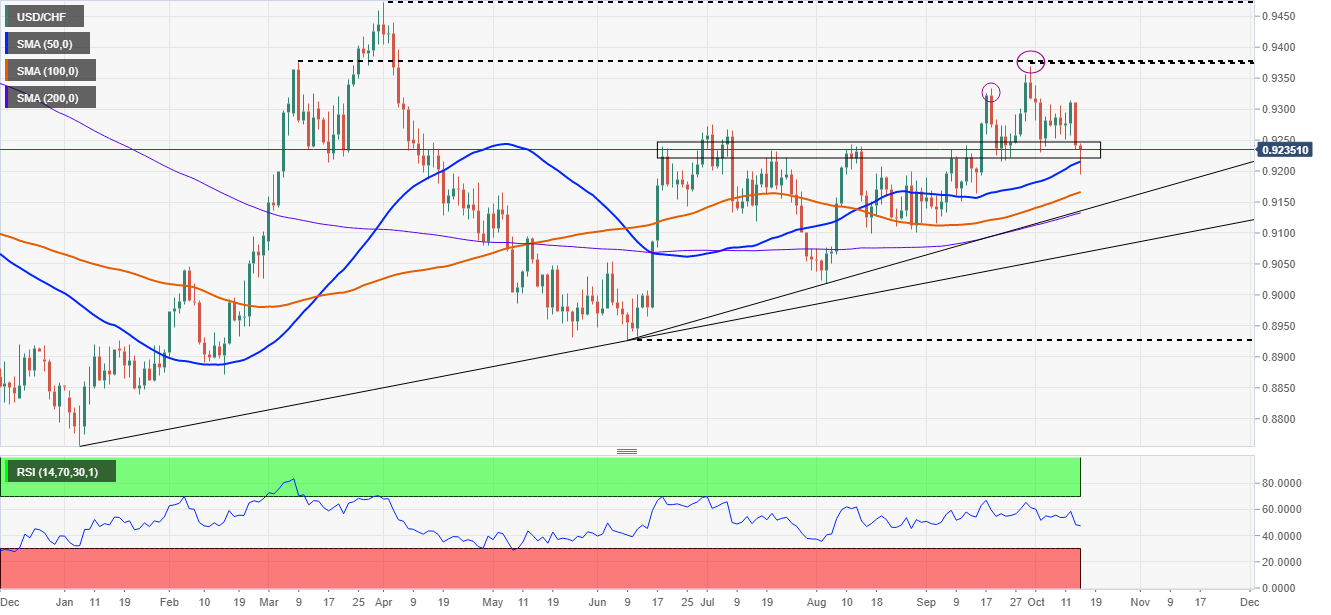
USD/CHF Price Forecast: Technical outlook
Daily chart
The USD/CHF is in an uptrend, depicted by the daily chart, showing the daily moving averages (DMA’s) located below the spot price, acting as dynamic support levels. In fact, Thursday’s price action briefly broke below the 50-DMA, which lies at 0.9215 but bounced off, approaching Wednesday’s low of 0.9235.
For dollar buyers to resume the upward trend, they need a daily close above the Wednesday low. In that outcome, the USD/CHF will find its first resistance at 0.9300. A breach of the latter could push the pair towards the confluence of the March 9 and the September 30 highs around the 0.9375-0.9368 area, which was unsuccessfully tested two times.
On the other hand, failure at the Wednesday low could send the pair tumbling towards the 50-DMA. A sustained break below that level could push the USD/CHF towards the 100 and the 200-DMA, at 0.9166 and 0.9132, respectively.
The Relative Strenght Index (RSI) is at 47, edging slightly low, indicating that USD/CHF could have another leg down.
KEY ADDITIONAL LEVELS TO WATCH
- NZD/USD holds in positive territory as the US dollar slides.
- Inflation risks are supporting the currency complex and the NZ dollar.
- US PPI does not meet the consensus but inflation concerns are rampant.
At the time of writing, NZD/USD is trading at 0.7025 and up almost 1% on the day after rising from a low of 0.6958 to a high of 0.7040. The US dollar continues to underperform despite the strong US Consumer Price Index data and hawkish Federal Reserve minutes which outlined more detail around the central bank's intentions to start to taper, perhaps as soon as November. The greenback was touching a 10-day low as rising risk appetite put a brake on the safe-haven currency's recent rally, while the Aussie and Kiwi dollars gained.
US dollar sinks further on profit-taking
Expectations that the US Federal Reserve would tighten monetary policy more quickly than previously expected amid an improving economy and surging inflation had fuelled a rise in the greenback since early September. Profit-taking has ensued and improved risk sentiment has also dented the greenback.
Additionally, Producer price growth slowed in September to the lowest level this year as airline passenger service costs plunged. The seasonally adjusted producer price index rose 0.5%, compared with a 0.7% gain in August, the Bureau of Labor Statistics said Thursday. The latest print was the lowest since December and came in line with the consensus on Econoday.
In other data, a Labor Department report showed US Consumer Prices rose solidly in September, and they are likely to rise further amid a surge in energy prices, potentially pressuring the Fed to act sooner to normalise policy. The Fed's September meeting minutes yesterday also showed that a growing number of policymakers were worried that high inflation could persist. The dollar index is flat at the time of writing on the day at 93.999 but met its lowest since Oct 5 at 93.759. On Tuesday this week, it had reached a one-year high at 94.563.
Commodity currencies bid on the inflation hedge
The markets are concerned about the nature of the global inflation cycle and its persistence. With these global factors dominating, commodity currencies can benefit from the inflation hedge. In this regard, next week’s NZ CPI data will be a key domestic event.
NZD/USD technical analysis
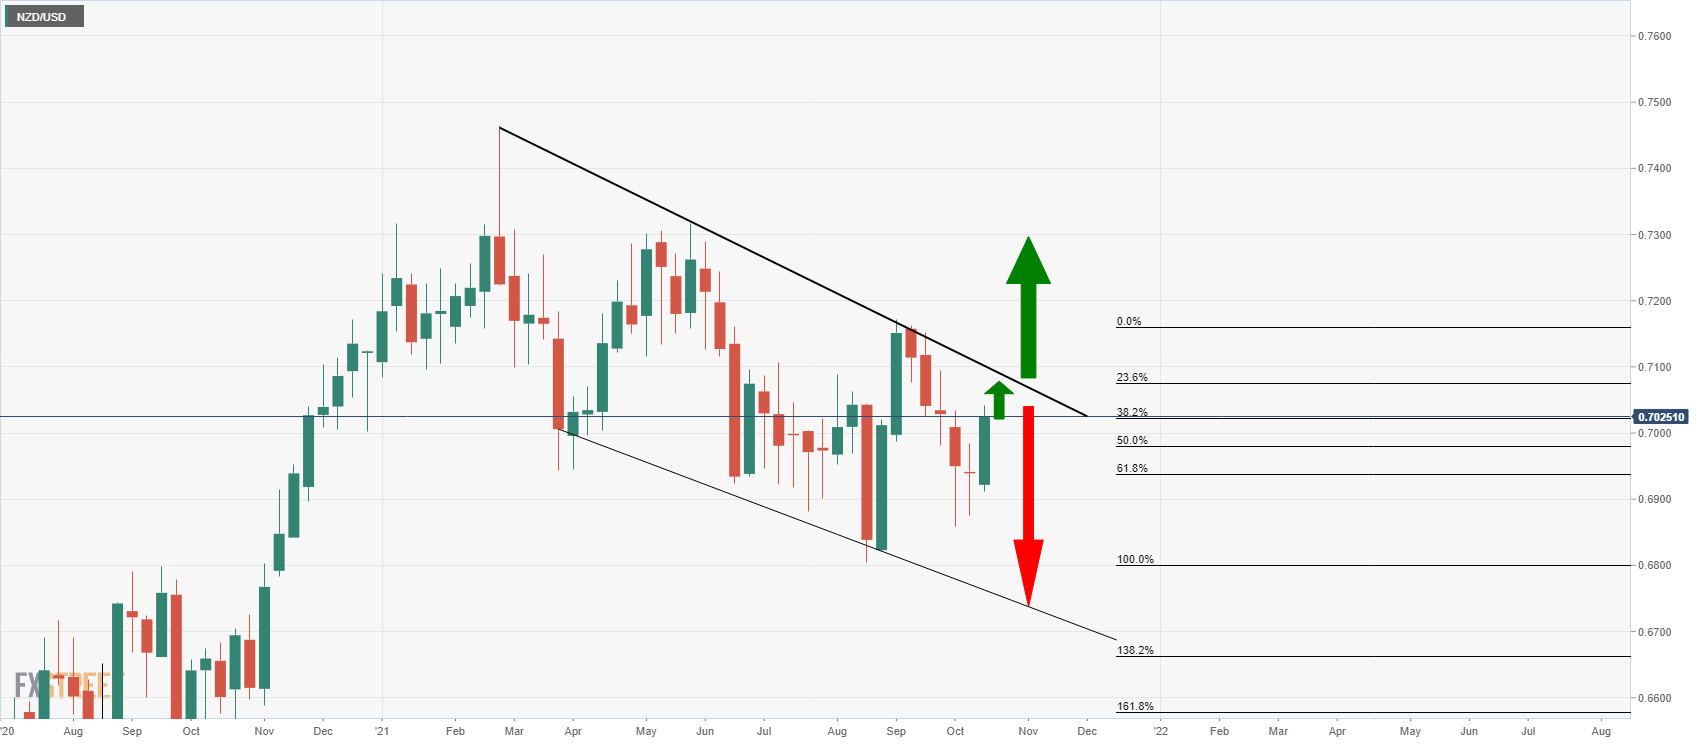
The price on the weekly chart is on the verge of a fresh bullish impulse but the flag's resistance is not far off. A break there could lead to a significant rally while, otherwise, the will be prospects of a lower low to the channel's support.
- Bullion prices reach fresh one-month highs at $1,800.
- US dollar weakness and inflation concerns boost gold's rally.
- XAU/USD: Next targets might be $1,807 and $1,830.
Gold futures’ appreciated for the third consecutive day on Thursday, favored by a somewhat softer dollar, to reach fresh one-month highs at $1,800 before consolidating above $1,790.
Gold rallies further as the USD loses ground
Bullion ticked up about $1 to it $1,800 for the first time since mid-September, on the back of a retreating US dollar, weighed by a flattening US yields curve. Long Term Treasury yields have retreated sharply over the last three days, with the yield of the 10-year note down to 1.52% after peaking above 1.60% earlier this week, while shorter-term yields surge to multi-month lows amid expectations that the Fed will soon announce the end of its QE program.
Furthermore, increasing concerns about the growing inflationary pressures are starting to translate into higher demand for gold, a traditional inflation hedge. Chinese producer prices surged to a 26-year high in September with a 10.7% increase year-on-year, which has reactivated concerns about the risks of stagflation. Earlier this week, US Consumer Prices accelerated to a 13-year high, confirming persistent consumer inflation and increasing pressure on the Federal Reserve to start normalizing its monetary policy.
XAU/USD, aimed to $1,807 on track to $1,830
From a technical perspective, gold prices have regained bullish momentum to attempt an assault to $1,807 (Sept. 15 high) ahead of $1.830 July and September's peak. If that level is surpassed, the next potential target might be June 8 and 11 highs at $1,905.
On the downside, the pair remains supported above previous weeks’ highs at $1,70, with next potential support areas at $1,745 (October 6 low) and below here, a key support area at $1,725 (September 29, 30 low).
Technical levels to watch
- USD/CAD suffers another drop on Thursday as USD sinks to a 10-day low.
- The global energy crisis supports CAD as oil prices rise.
USD/CAD is trading at 1.2370 and down some 0.57% after falling from a high of 1.2445 to a low of 1.2354 on Thursday so far. The Canadian dollar has strengthened to its highest level in more than three months against its US counterpart, as the energy crisis underpins the nation's biggest exporting industry, oil.
Rising energy prices support CAD
The price of oil, one of Canada's major exports, rose after the International Energy Agency said that record natural gas prices would boost demand for oil and top oil producer Saudi Arabia dismissed calls for additional OPEC+ supply. IEA said the OPEC+ group is undersupplying the market by 700,000 barrels per day as it sticks to its schedule of monthly supply increases even as shortages of natural gas, LNG and coal boost oil demand
In its Monthly Oil Market report, the IEA said natural gas and coal shortages in Asia and Europe are raising oil demand by up to half a million barrels per day, while OPEC+ adds just 400,000 barrels per day monthly and US producers refrain from new drilling, pushing oil prices to seven-year highs. West Texas Intermediate crude was last seen up 0.91% to US$81.25 per barrel.
"The surge in prices has swept through the entire global energy chain, fueled by robust economic growth as the world emerges from the pandemic. Record coal and gas prices, as well as rolling black-outs, are prompting the power sector and energy-intensive industries to turn to oil to keep the lights on and operations humming. The higher energy prices are also adding to inflationary pressures that, along with power outages, could lead to lower industrial activity and a slowdown in the economic recovery," the agency noted.
Meanwhile, in what was other welcomed news today, domestic manufacturing data added to evidence that economic activity picked up in the third quarter. Canadian factory sales rose 0.5% in August from July, on higher sales of petroleum and coal, chemicals and primary metals, Statistics Canada said.
US dollar pushed to a 10-day low
As for the US dollar, the DXY index that measures the greenback vs. a number of major rival currencies is down for the second straight day and trading back below 94. US rates are edging lower despite the firm Consumer Price Index print and the FOMC minutes showing imminent tapering. This is priced into the greenback which has suffered at the hands of lower yields and profit-taking as well as rising risk appetite. The DXY was touching a 10-day low on the day while the Aussie, CAD and Kiwi dollars gain in the inflation hedge.
- GBP/JPY's rally extends to fresh five-month highs at 155.70.
- The pound remains bid on BoE hike expectations.
- GBP/JPY could reach 159.80 – Credit Suisse.
The British pound has appreciated for the sixth consecutive day on Thursday, breaching the 155.00 level to approach three-year highs right above 156.00. The remains bid against an ailing Japanese yen on Thursday, after having gained nearly 4% so far in October.
BoE rate hike expectations are supporting the GBP rally
The sterling remains trading on a firm tone, with the investors pricing an interest rate hike by the Bank of England early next year. Surging energy prices have pushed yearly inflation to levels almost twice the BoE’s target for price stability in the UK, and some Bank officials are starting to suggest the possibility of accelerating the monetary policy normalization plan.
Furthermore, a somewhat higher appetite for risk on Thursday has weighed safe assets, like the Japanese yen, favoring riskier currencies such as the GBP. The world’s major stock markets are posting substantial advances, with the US indexes trading well above 1% at the time of writing.
The Dow Jones trades 1.49% up, while the S&P and Dow Jones Indexes advance 1.62% and 1.68% respectively with upbeat quarterly results offsetting concerns about inflationary pressures and supply chain bottlenecks thwarting the economic recovery.
GBP/JPY might extend its rally towards 159.80 – Credit Suisse
From a technical point of view, the pair seems ready to extend its rally to levels near 160.00, according to the FX analysis team at Credit Suisse: “With a major base already seen established in February 2021, we look for a break above 156.62 to further reinforce the positive outlook, with resistance seen next at 159.80.”
Technical levels to watch
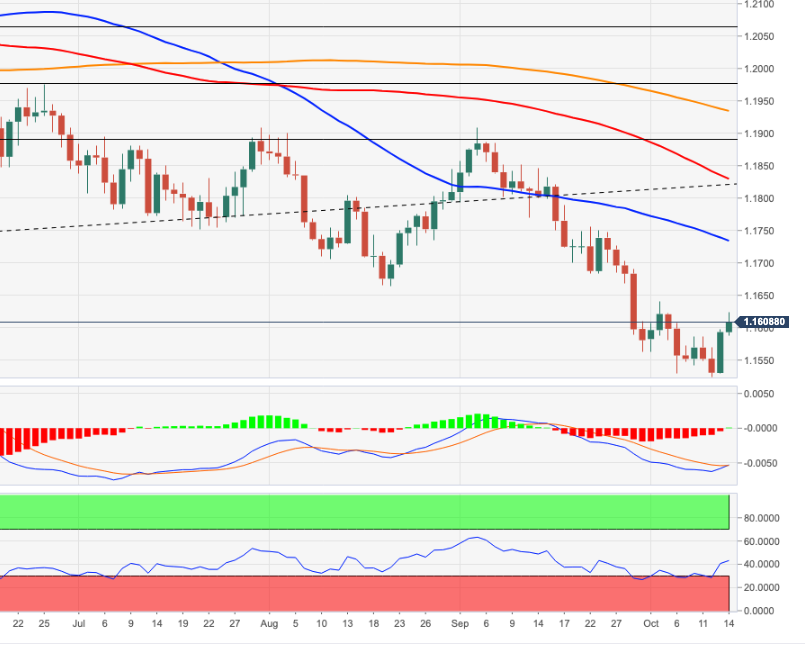
- EUR/USD failure at 1.1600 threatens to push the single currency to new yearly lows.
- Risk-on market sentiment weighs on safe-haven currencies, like the US dollar.
- ECB members coincide with inflation upside pressures as “transitory.”
- Fed’s Bostic: Inflation appears to be the last longer because of supply chains.
- Fed’s Daly: Bottlenecks are the leading cause of rising prices.
The EUR/USD slumps during the New York session, trading at 1.1588, down 0.04% at the time of writing. Earlier in the Asian session, the single currency rose to a fresh weekly high at 1.1624, reclaiming the 1.1600 thresholds. However, as European traders got to their desks, the euro slid aggressively, with sellers pushing the pair beneath the 1.1600 figure.
Risk-on market sentiment has kept safe-haven currencies like the US dollar downward pressured. Riskier currencies like the AUD, the CAD, and the NZD outperform the greenback. Nevertheless, ongoing central bank divergences between the European Central Bank and a Federal Reserve ready to start the bond taper weigh on the shared currency.
During the European session, some ECB members crossed the wires. Klass Knot said that the inflation outlook for the Eurozone is back on track. In the same tone, Christine Lagarde, President of the European Central Bank, said that they continue to view inflation upswing as being largely driver by temporary factors.
That said, most ECB policymakers seem to adhere to the “transitory” narrative, contrarily to what Federal Reserve members have been vocal about recently.
Across the pond, on Thursday, Atlanta’s Federal Reserve President Raphael Bostic said that inflation appears to be the last longing because of supply chain and labor shortages. In the same tone, and at the same time, San Francisco President, Mary Duly, said that bottlenecks are the leading cause of rising prices. She added that inflation would subside as the COVID-19 crisis improved.
US Initial Jobless Claims rose to 293K better than the 319K expected
In the European economic docket, there is nothing to report. Concerning the US, the Initial Jobless Claims rose to 293K better than the 319K foreseen by analysts, delivering positive news regarding the labor market. Further, the US Producer Price Index increased by 8.6% less than the 8.7% estimated, while excluding food and energy, expanded 6.8% lower than the 7.1% expected.
KEY ADDITIONAL LEVELS TO WATCH
WTI futures capped at $81.61, remains steady above $80.00.
OPEC forecasts, US stocks weigh on oil prices.
US Oil prices consolidate between $79.45 and $81.60.
Front-month WTI futures have been rejected at $81.61 session high earlier today, and prices have retreated moderately during Thursday’s US trading session. Oil prices, however, remain fairly steady, consolidating at long-term highs, with downside attempts contained above the psychological $80 level.
OPEC, higher US stocks weigh on oil prices
The rally of the West Texas Intermediate was paused on Wednesday, after climbing above $80. The OPEC+ released a downward revision of its oil demand growth estimations for 2021, which might have eased upside pressure on crude prices.
Furthermore, The US Energy Information Administration (EIA) has reported on Thursday a much higher than expected increment on oil stocks, weighing prices further. Commercial crude oil inventories increased by 6 million barrels in the week of October 8 in the US, according to the EIA, well beyond the 0.7 million build-up anticipated by the market.
WTI prices remain capped below $81.60
Crude prices have remained trading rangebound over the last two days, trapped between $79.40 and $81.60 after peaking above $82.00 last Monday. On the upside, WTI futures need to confirm above the mentioned $81.60 (Oct.12 high) and $82.15 (Oct, 11 high) to set its focus on the $90.00 area (78.6% Fibonacci retracement of the 2014-2016 decline).
On the downside, below the $80.00 (psychological level and $79.45 (Oct. 12, 13 lows) the WTI might lose its upside momentum and extend its reversal towards $78.65 (Oct. 8, 10 lows).
Technical levels to watch
- The dollar fails to break above 113.70, remains trading near three-year highs.
- The Japanese yen weakens in a risk-on session.
- USD/JPY might extend its rally beyond 114.00 – UOB.
US dollar’s bullish attempt seen on the early US trading session has hit resistance again at the 113.70 area, and the pair retreated to the mid-range of 113.00. The USD remains strong against a weaker yen, trading right below three-year highs at 113.80 following a 3.3% rally over the last four weeks.
The yen suffers on higher risk appetite
The Japanese yen is trading lower against its main peers with a positive market sentiment hurting safe-havens in favor of riskier assets. The world’s major stock indexes are posting significant gains on Thursday, as concerns about surging inflation and supply chain bottlenecks have taken a backseat.
On the macroeconomic domain, Japanese industrial output contracted at a 3,2% pace in August, with automotive production plunging on the back of the global chip shortage.
In the US, weekly jobless claims have dropped below the 300,000 new claims for the first time in the last 19 months while, on Wednesday, the Federal Reserve offered new hints suggesting that the official announcement of QE tapering might take place at its November’s meeting. The impact on the USD however, has been limited, with the greenback trading lower against most majors on Thursday.
USD/JPY might be about to move above 114.00 – UOB
In a bigger picture, the pair remains steady near recent highs, and, according to the FX Analysis team at UOB, a further rally should not be discarded: “On Tuesday (12 Oct, spot at 113.40), we highlighted that the impulsive surge suggests that further USD strength would not be surprising and that the next resistance is at 114.20. There is no change in our view for now even though overbought shorter-term conditions could lead to a couple of days of consolidation first. The USD strength is deemed intact as long as it does not breach 112.80 (‘strong support’ level was at 112.65 yesterday).”
Technical levels to watch
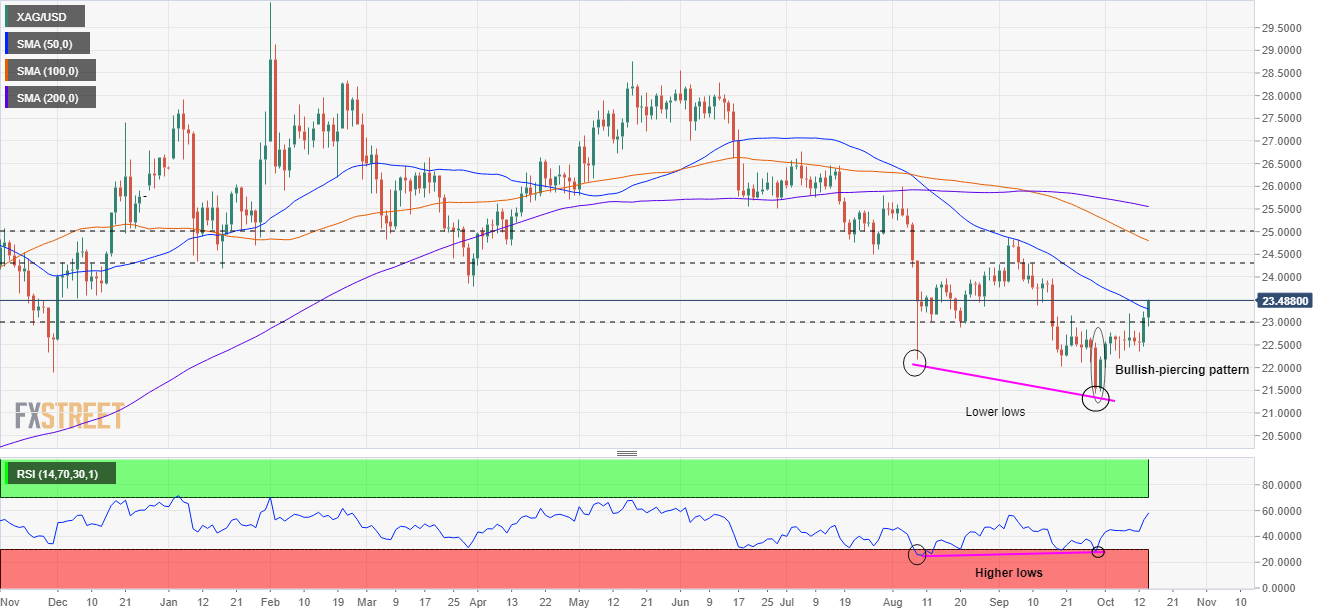
- XAG/USD threatens to trade above the $24.00 threshold.
- Falling US T-bond yields underpin the US Dollar, which is weaker across the board.
- September’s FOMC minutes reinforce the beginning of a bond taper process, which could be announced by the November meeting.
Silver (XAG/USD) is advancing during the New York session, up more than one a half percent, trading at $23.46 at the time of writing. The white metal is trading at fresh monthly highs, courtesy of falling US Treasury Bond Yields, with the 10-year benchmark note rate slumping three and a half basis points, sitting at 1.514%, short of breaking the 1.50% threshold.
At the same time, the US Dollar Index, which follows the buck’s performance versus six peers, is down 0.03%, at 93.99, despite positive US macroeconomic data across the docket.
On Wednesday, September’s Federal Reserve minutes showed that the committee agreed that a gradual tapering process that concluded around the middle of next year would likely be appropriate due to the ongoing economic recovery. Furthermore, most members agreed that the bond taper process could commence by mid-November or mid-December.
XAG/USD Price Forecast: Technical outlook
Daily chart
Silver is trading above the 50-day moving average (DMA), which lies at $23.29, above the September 13 low at $23.37, which was previous support that turned resistance. Furthermore, momentum indicators like the Relative Strenght Index (RSI) at 58, aiming higher, indicate an upside bias.
For silver buyers to resume the upward trend, they will need a daily close above the latter to confirm the range’s break, opening the door for further upside. In that outcome, the first resistance would be $24.00. A breach above that level could send XAG/USD rallying towards the September 3 high at $24.86, immediately followed by $25.00.
KEY ADDITIONAL LEVELS TO WATCH
- Pound's rally hits resistance at 1.3730 and pulls back below 1.3700.
- The sterling remains positive against a weaker US dollar.
- GBP/USD biased higher while above 1.3595.
The British pound is giving away gains on Thursday’s US trading session, with the pair dropping back to levels below 1.3700 after having peaked at a three-week high at 1.3730. On daily charts, however, cable remains positive, above the top of the recent trading range, at 1.3650/70.
The pound remains supported by hawkish BoE
The sterling has been showing strength over the last two weeks, as the market is pricing an interest rate hike by the Bank of England early next year. With inflation accelerating at levels almost twice the Bank’s target for price stability, BoE officials are starting to openly suggest the possibility of accelerating the monetary policy normalization plan.
Beyond that, the recent European Union's proposal to slash custom checks on British Products to Northern Ireland has eased concerns about another UK-EU dispute on the NI border, which has provided a fresh impulse to the sterling.
On the other end, the US dollar is trading softer amid a higher appetite for risk on Thursday. The decline in US weekly jobless claims, which have dropped below the 300,000 new claims for the first time in the last 19 months, has been overlooked by the market as it was the confirmation on Wednesday the Federal Reserve is set to start rolling back its bonds purchasing program over the next month, suggested by the minutes of the last FOMC meeting, released on Wednesday.
GBP/USD biased higher while above 1.3595 – UOB
From a broader perspective, the FX analysis team at UOB remains positive on the pound, as long as the pair remains above 1.3595: “We have expected GBP to trade within a 1.3500/1.3680 range since early this week (see annotations in the chart below).GBP rose strongly yesterday and the advance has gathered momentum. From here, GBP is likely to head higher to 1.3715. A break of 1.3715 would shift the focus to 1.3750. Only a break of the ‘strong support’ (currently at 1.3595) would indicate that GBP is not ready to head higher.”
Technical levels to watch
- AUD/USD breaks above 0.7400 for the first time in a month.
- Risk-on market sentiment turn investors towards riskier assets boosts the AUD.
- US Initial Jobless Claims dropped below the 300K mark.
The Australian dollar climbs 0.58% is trading at 0.7423 during the New York session at the time of writing. The market sentiment is upbeat, portrayed by European and US equity indexes in the green. Positive US macroeconomic data concerning the labor market and prices paid for US producers boost the investors’ risk appetite.
DXY breaks below 94.00, underpinned by falling US T-bond yields
The US Dollar Index that measures the greenback’s performance against a basket of six rivals is sliding 0.03%, at 93.99, while the US T-bond 10-year yield struggles to hold to previous day levels, sits at 1.526%, down almost two and a half basis points.
Data-wise, the Australian economic docket featured the employment report, which showed that the economy droped worse-than-expected 138K jobs in September, while the Unemployment Rate rose to 4.6%.
On the US front, the US Initial Jobless Claims came at 293K better than the 319K foreseen by analysts, delivering positive news regarding the labor market while increasing the chances of the Federal Reserve reduction to the pace of the Quantitative Easing. Further, the US Producer Price Index rose by 8.6% less than the 8.7% estimated, while excluding food and energy, expanded 6.8% lower than the 7.1% expected.
That said, positive news during the day benefited risk-sensitive currencies, like the Aussie, which reclaimed the 0.7400 thresholds. However, seesawing market sentiment due to changing economic conditions could put a lid on the AUD/USD.
AUD/USD Price Forecast: Technical outlook
Daily chart
The AUD/USD is trading above the 100-daily moving average (DMA) at 0.7416, whereas the 200-DMA is above the spot price, indicating the major trend is tilted to the downside. However, momentum indicators with the Relative Strength Index (RSI) at 64, pointing higher, suggests that the near-term trend is tilted to the upside.
For AUD/USD buyers to resume the upward trend, they need a daily close above the 100-DMA. In that outcome, the first resistance would be the September 3 high at 0.7478. A breach of the latter could expose crucial support levels, the July 6 at 0.7599 and then the psychological 0.7700.
Commercial crude oil inventories in the US increased by 6 million barrels in the week ending October 8, the weekly report published by the US Energy Information Administration (EIA) revealed on Thursday. This reading came in much higher than the market expectation for an inventory build of 0.7 million barrels.
Market reaction
The barrel of West Texas Intermediate (WTI( edged lower from daily highs after this report and was last seen trading at $80.90, where it was up 0.4% on the day.
Additional takeaways
"Total motor gasoline inventories decreased by 2.0 million barrels last week and are about 2% below the five year average for this time of year."
"US crude oil imports averaged 6.0 million barrels per day last week, decreased by 1.0 million barrels per day from the previous week."
"Total products supplied over the last four-week period averaged 20.7 million barrels a day, up by 12.5% from the same period last year."
The weekly report published by the US Energy Information Administration (EIA) showed that the working gas in storage was 3,369 billion cubic feet (Bcf) as of Friday, October 8, representing a net increase of 81 Bcf from the previous week.
This reading came in lower than the market expectation of 94 Bcf.
"Stocks were 501 Bcf less than last year at this time and 174 Bcf below the five-year average of 3,543 Bcf," the publication further read.
Market reaction
US Natural Gas (spot) prices rose sharply after this report and were last seen rising nearly 4% on the day 6.015.
Atlanta Federal Reserve President Raphael Bostic said on Thursday that they are not seeing changes in the longer-run inflation expectations but added that they will be monitoring the situation, as reported by Reuters.
Additional takeaways
"There is a commitment across the system to promote diversity in the Fed leadership positions."
"Inflation is appearing to last longer because of supply chain and labour disruptions caused by the pandemic."
"Inflation right now is tied to the episode of the pandemic and those forces will recede."
Market reaction
The US Dollar Index largely ignored these comments and continues to fluctuate below 94.00.
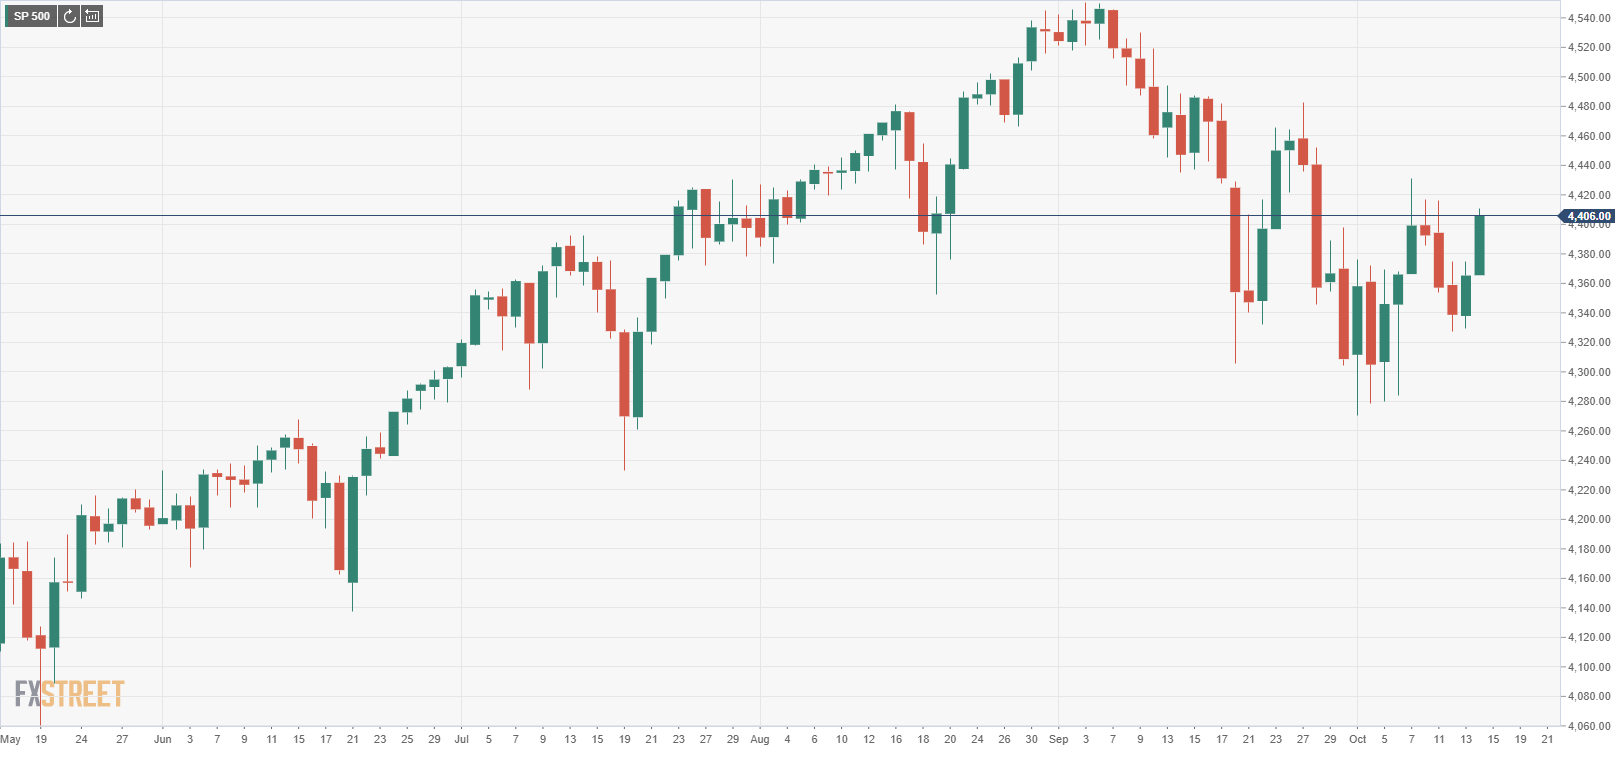
- Wall Street's main indexes are posting strong gains.
- All major sectors of the S&P 500 trade in the positive territory.
After closing in the positive territory on Wednesday, major equity indexes in the US opened decisively higher as risk flows continue to dominate financial markets. Reflecting the upbeat market mood, the CBOE Volatility Index is down 6% at 17.50.
As of writing, the S&P 500 Index was rising 1% at 4,405, the Dow Jones Industrial Average was up 1.05% at 34,726 and the Nasdaq Composite was gaining 1.1% at 14,732.
All major sectors of the S&P 500 push higher after the opening bell with the Healthcare Index leading the rally with a daily gain of 1.65%. On the flip side, the Financials Index is up only 0.4% as US Treasury bond yields remain on the back foot.
S&P 500 chart (daily)
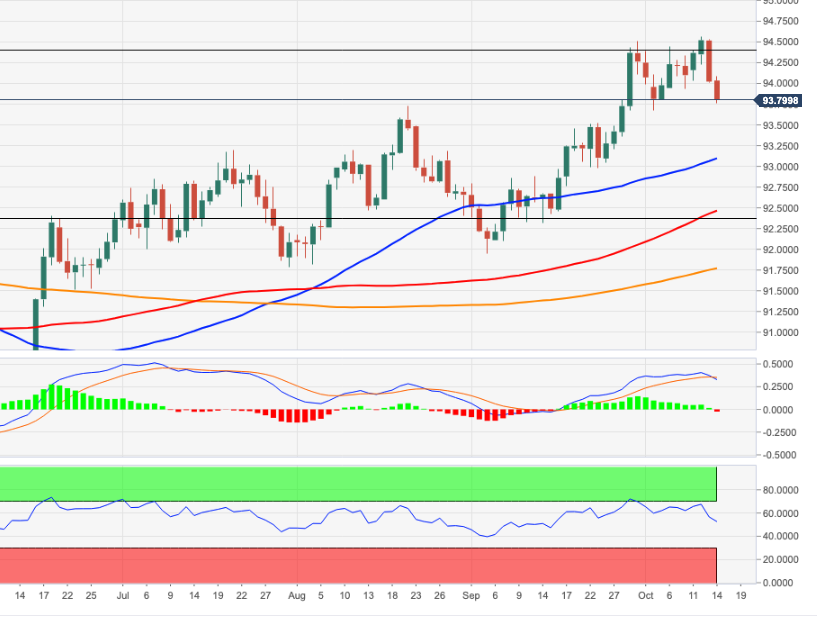
- DXY bounces off lows and approaches the 94.00 barrier.
- US 10-year yields remain depressed around the 1.53% area.
- US weekly Claims rose by 293K, bettering consensus.
After bottoming out around 93.75 during early trade, the greenback has managed to attract some buying interest and now pushes the US Dollar Index (DXY) back to the 94.00 neighbourhood.
US Dollar Index looks supported near 93.70
The index dropped and rebounded from multi-day lows in the 93.80/75 band on Thursday, always trading on the defensive against the backdrop of the improved mood in the risk complex and declining US yields.
Indeed, yields in the belly of the curve retreated to the sub-1.53% region while the longer end managed to bounce to the 2.07% area and reverse part of the recent moderate retracement.
In the docket, weekly Claims rose less than expected by 293K in the week to October 8, while Producer Prices surprised to the downside in September: up 8.6% YoY and 6.8% when it comes to the Core reading.
In addition, St. Louis Fed J.Bullard said he bets 50% on chances of elevated inflation persisting. He also expressed doubts in that inflation will fully disappear over the next 6 months.
US Dollar Index relevant levels
Now, the index is losing 0.05% at 93.95 and a break above 94.56 (2021 high Oct.12) would open the door to 94.74 (monthly high Sep.25 2020) and then 94.76 (200-week SMA). On the flip side, the next down barrier emerges at 93.77 (20-day SMA) followed by 93.67 (monthly low Oct.4) and finally 92.98 (weekly low Sep.23).
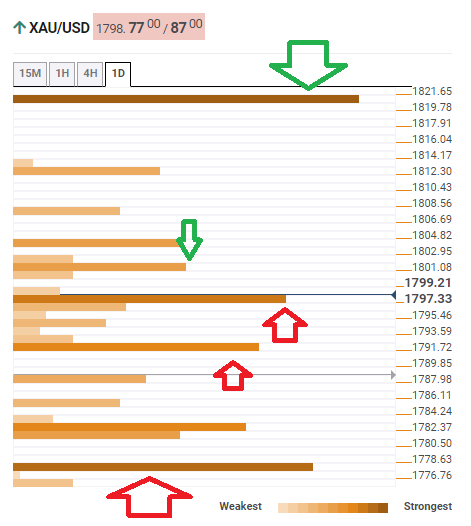
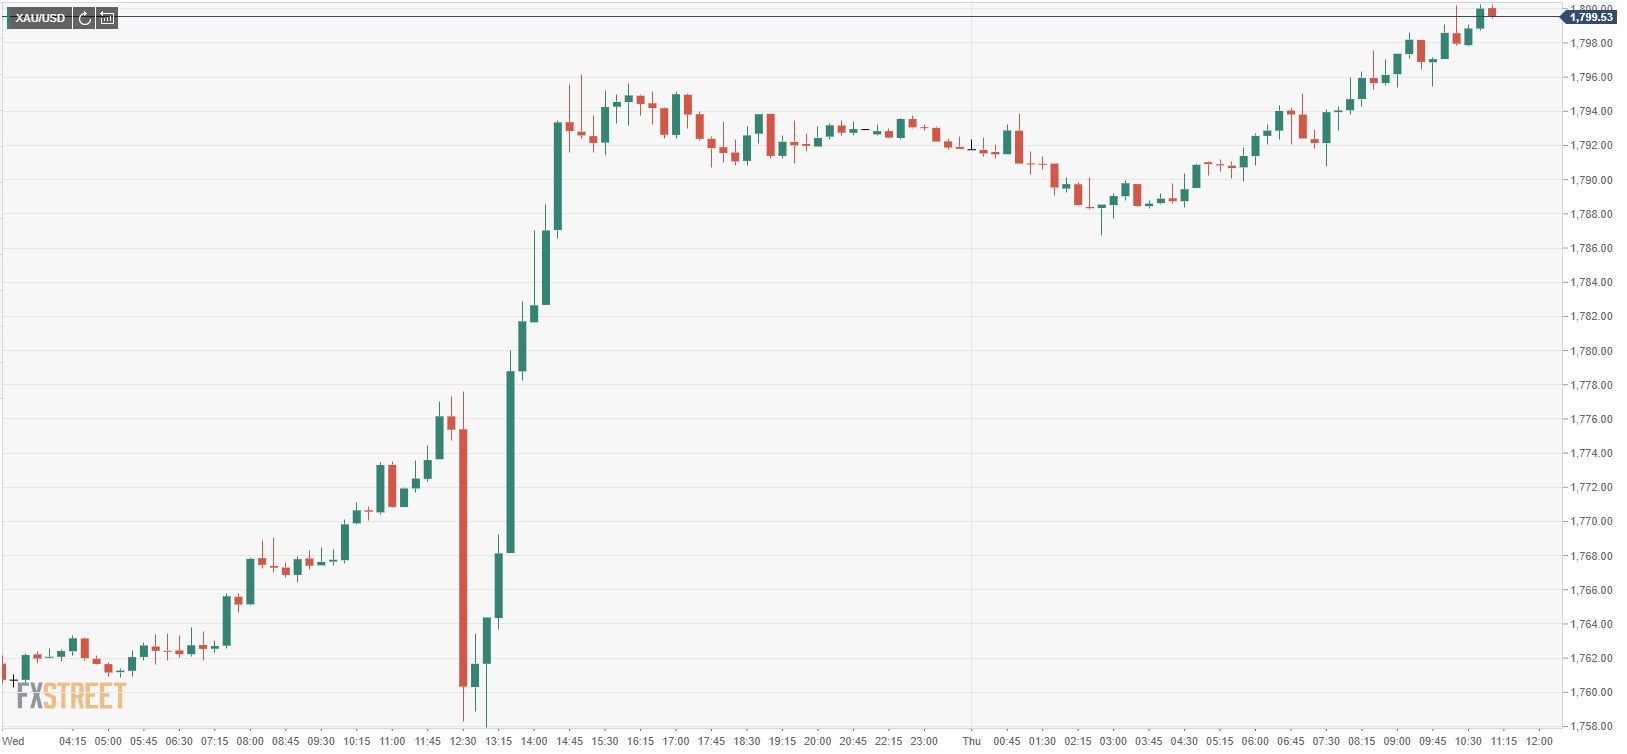
- XAU/USD has hit $1,800, the highest in a month.
- The Confluence Detector is showing is that gold's next big upside target is $1,820.
- Gold is not a dream risk-off hedge, nor is Bitcoin [Video]
Falling yields have always been good for gold – and this time, the precious metal seems to have found its feet regardless of the Treausiries. Tuesday's slide in returns on 10-year bonds sent XAU/USD shooting higher, and it stayed there also after yields crept up once again.
One of the explanations for the recent rise is the hint from the Fed that the pace of bond-buying will be reduced only gradually – 15 billion fewer dollars worth of buys every month rather than $20 billion.
How is XAU/USD technically positioned?
The Technical Confluences Detector is showing that gold faces some resistance at $1,802, which is the convergence of the 100-day Simple Moving Average, the Bollinger Band 15min-Upper, and the previous 4h-high.
The more significant line is $1,820, which is where the Pivot Point one-month Resistance 1 and the PP one-day R2 meet up.
Immediate support awaits at $1,797, which is the confluence of the 200-day SMA and the PP one-week Resistance 2.
The next line to watch is $1,791, which is a juncture of indicators including the Fibonacci 61.8% one-month and the SMA 100-15m.
Lower, strong support awaits at $1,777, which is where the PP one-week, the 50-day SMA, and the SMA 50-1h all converge.
XAU/USD resistance and support levels
Confluence Detector
The Confluence Detector finds exciting opportunities using Technical Confluences. The TC is a tool to locate and point out those price levels where there is a congestion of indicators, moving averages, Fibonacci levels, Pivot Points, etc. Knowing where these congestion points are located is very useful for the trader, and can be used as a basis for different strategies.
Learn more about Technical Confluence
In an interview with CNN on Thursday, San Francisco Federal Reserve Bank President Mary Daly said they are at a point where they feel they can taper bond purchases, as reported by Reuters.
Additional takeaways
"It is premature to start talking about rate increases."
"Price increases will last as long as COVID is with us; as covid subsides, pressures will ease."
"Bottlenecks causing price rises are related to COVID."
"If Fed pulls back on accommodation, I bet won't solve the supply-chain problem."
"Near-term inflation outlook won't be affected by decisions on infrastructure spending."
Market reaction
The greenback remains on the back foot following these comments and the US Dollar Index was last seen posting small daily losses at 93.92.
Citing a draft document, Reuters reported the International Monetary Fund (IMF) will say in its communique that inflation dynamics require close monitoring and policymakers need to be ready to take decisive actions to maintain price stability.
Additional takeaways
"Inflation surge still assessed as driven by temporary factors such as supply chain disruptions, higher commodity prices."
"Inflation now appears less transitory than previously expected, upside risks to inflation increasing."
"Steps need to be taken to make supply chains more resilient in the future, accelerate the adoption of new and green technologies."
"Delicate balancing act needed to underpin recovery, restore macroeconomic stability."
"New resilence and sustainability trust should not depart from existing IMF model, sees less scope for channelling SDR reserve through multilateral development banks."
"Need to build confidence in G20 common framework on debt restructuring among creditors and borrowers."
Market reaction
The market mood remains upbeat following these remarks with US stock index futures rising around 1% minutes ahead of Wall Street's opening bell.
St. Louis Fed President James Bullard said on Thursday that there is not a strong case that inflation will definitely dissipate over the next six months, as reported by Reuters.
Additional takeaways
"My outlook for the US economy is pretty bullish."
"Labor markets are very tight."
"I think by the end of tapering next spring, the unemployment rate will be 3.5% or better."
"Many US workers have retired."
"High level of Core PCE inflation is concerning."
"Would put 50% chance on high levels of inflation persisting."
Market reaction
These comments don't seem to be having a significant impact on the dollar's performance against its rivals. As of writing, the US Dollar Index was down 0.07% on the day at 93.93.
- Manufacturing Sales in Canada rose modestly in August.
- USD/CAD trades in the negative territory below 1.2400.
Manufacturing Sales in Canada increased by 0.5% on a monthly basis in August to C$60.3 billion, the data published by Statistics Canada revealed on Thursday. This reading followed July's decrease of 1.2% and came in line with the market expectation.
"Sales in constant dollars increased 0.6% in August, indicating that the monthly gain resulted entirely from higher sales volume," the publication further read. "The Industrial Product Price Index decreased 0.3% month over month, while the Raw Materials Price Index decreased 2.4%, the first decline since September 2020."
Market reaction
The USD/CAD pair remains on the back foot after this report and was last seen losing 0.45% on a daily basis at 1.2386.
- USD/TRY clinched new all-time peaks near 9.2000.
- President Erdogan dismissed three members of the CBRT.
- The next target of note for the pair comes at the 10.0000 mark.
The Turkish lira depreciated to new all-time lows vs. the dollar and pushed USD/TRY well beyond the 9.000 barrier on Thursday.
USD/TRY now targets… the moon?
USD/TRY quickly climbed to new all-time highs in the 9.1800 area on Thursday after market participants aggressively sold the lira in response to another spark of mistrust in the already complicated relationship (if any at all) between President Erdogan’s administration and the Turkish central bank (CBRT) (still) led by S.Kavcioglu.
Indeed, the lira collapsed to record lows after President Erdogan sacked on Thursday two deputy governors of the CBRT and a committee member, all of them having disagreed with the rate cut by the central bank at its September meeting. It is worth recalling that the CBRT reduced the One-Week Repo Rate by an unexpected 100 bps to 18% last month, catching everybody off guard as the consensus was largely tilted to an “on hold” stance.
Investors’ shift has now gyrated to the upcoming CBRT event on October 21, while the door to another rate cut looks wide open no matter what consensus expects or rationality calls for.
USD/TRY key levels
So far, the pair is gaining 0.85% at 9.1546 and a drop below 8.9510 (10-day SMA) would aim for 8.8585 (20-day SMA) and finally 8.8297 (monthly low Oct.1). On the other hand, the next up barrier lines up at 9.1835 (all-time high Oct.14) followed by 10.0000 (round level) and then… ?
European Central Bank (ECB) policymaker Klaas Knot said on Thursday that the inflation outlook for the euro area is back on track, as reported by Reuters.
Additional takeaways
"Risks for headline inflation are tilted to the upside."
"Upside inflation risks are mainly linked to more persistent supply-side bottlenecks and stronger domestic wage-price dynamics."
"Welcoming rise in market-based inflation expectations."
"Current baseline projections consistent with ending the Pandemic Emergency Purchase Programme (PEPP) in March 2022."
"Confident that the pre-pandemic inflation gap in our macroeconomic projections will close by the end of this year."
"ECB weighing options to ease the transition out of the PEPP."
Market reaction
The EUR/USD pair showed no immediate reaction to these comments and was last seen posting small daily gains at 1.1600.
- Weekly Initial Jobless Claims in US declined by 36,000.
- US Dollar Index stays relatively quiet below 94.00.
There were 293,000 initial claims for unemployment benefits in the US during the week ending October 9, the data published by the US Department of Labor (DOL) revealed on Thursday. This reading followed the previous print of 329,000 (revised from 326,000) and came in better than the market expectation of 319,000.
Market reaction
Investors largely ignored these figures and the US Dollar Index was last seen losing 0.06% on the day at 93.93.
Additional takeaways
"The 4-week moving average was 334,250, a decrease of 10,500 from the previous week's revised average."
"The advance seasonally adjusted insured unemployment rate was 1.9% for the week ending October 2."
"The advance number for seasonally adjusted insured unemployment during the week ending October 2 was 2,593,000, a decrease of 134,000 from the previous week's revised level."
- Annual PPI in US continued to increase in September.
- US Dollar Index stays below 94.00 after the data.
The Producer Price Index (PPI) in the US for final demand rose to 8.6% on a yearly basis in September from 8.3% in August, the US Bureau of Labor Statistics announced on Thursday. This reading came in slightly lower than the market expectation of 8.6%.
On a monthly basis, the PPI edged lower to 0.5% from 0.7%. Further details of the publication revealed that the annual Core PPI ticked up to 6.8%, compared to analysts' estimate of 7.1%.
Market reaction
The US Dollar Index showed no immediate reaction to this report and was last seen posting small daily losses at 93.93.
- USD/CAD is falling for the third straight day on Thursday.
- US Dollar Index remains on the back foot ahead of US data.
- WTI trades in the positive territory above $81.00.
The USD/CAD pair extended its slide during the European trading hours and touched its lowest level since early July at 1.2373. As of writing, the pair was down 0.45% on a daily basis at 1.2384.
WTI reclaims $81 on Thursday
The broad-based dollar weakness allows the pair to push lower while rising crude oil prices provide a boost to the CAD as well on Thursday.
Pressured by the ongoing decline in the US Treasury bond yields, the US Dollar Index (DXY) is losing 0.15% on the day at 93.85. The benchmark 10-year US T-bond yield, which fell nearly 6% in the previous two trading days, is down 0.7% at 1.527%. Later in the session, the US Department of Labor's weekly Initial Jobless Claims data and September Producer Price Index (PPI) figures will be looked upon for fresh impetus.
On the other hand, the barrel of West Texas Intermediate (WTI) is up nearly 1% on the day at $81.40 as investors await the weekly crude oil and gas inventory data published by the US Energy Information Administration (EIA). The upbeat market mood seems to be the primary driver behind crude oil prices.
Meanwhile, August Manufacturing Sales will be featured in the Canadian economic docket but this report is unlikely to have a noticeable impact on the loonie's performance against its rivals.
Technical levels to watch for
- EUR/USD adds to recent gains and surpasses 1.1600.
- Further up is located the monthly high at 1.1640.
EUR/USD advances for the second straight session and leaves behind the key 1.1600 barrier on Thursday.
Further recovery is expected to meet the interim hurdle at the 20-day SMA at 1.1631 ahead of the monthly peak at 1.1640 (October 4). The break above this area should meet the next target at the 55-day SMA, today at 1.1732 followed by the late-September tops in the mid-1.1700s.
In the meantime, the near-term outlook for EUR/USD is seen on the negative side below the key 200-day SMA, today at 1.1932.
EUR/USD daily chart
EUR/CHF is testing below support at 1.0696. If sustained into the close, would mark an important breakdown with next support at 1.0660, the Credit Suisse analyst team reports.
See – EUR/CHF: Sluggish recovery in the eurozone to drag down the pair – Rabobank
Resistance stays seen at 1.0742/53 initially
“If confirmed, the break below 1.0707/1.0696 would suggest further weakness is likely, with support seen next at the 1.0660 low from November 2020, then retracement support at 1.0642, before another prominent price low at 1.0605/00. Ultimately, the magnitude of the potential breakdown suggests we could even move beyond here over the medium-term.”
“Resistance stays seen at 1.0742/53 initially, with a move above the cluster of resistances at 1.0797/0810, which includes the 55-day average, then needed to confirm a floor is in place.”
EUR/GBP has started to pierce trend support from late 2019 at 0.8473/72. Analysts at Credit Suisse expect the pair to retest the YTD low and channel bottom at 0.8449/37.
Resistance at 0.8520/28 to cap for an eventual break lower
“Beneath 0.8472 should clear the way for a move beneath for a move back to the YTD low and lower end of the gentle seven-month downtrend channel at 0.8449/37.
Whilst we would again look for a fresh hold at 0.8449/37 and swing higher in the channel, a sustained move below 0.8437 would mark an acceleration in the downtrend, then exposing the key lows of 2019 and 2020 at 0.8281/39.”
“Resistance moves to 0.8500/02 initially. Above 0.8528 can see a recovery back to 0.8542/47, potentially a retest of the 200-day average at 0.8620/25.”
The medium-term inflation expectations in the eurozone have increased to around 1.9%, which is in line with the European Central Bank’s strategy, ECB Governing Council Member Olli Rehn said on Thursday, per Reuters.
"Due to persistent production bottlenecks, it is possible that an increase in energy prices has a longer-lasting impact on consumer prices," Rehn added. "We analyse this development carefully at the Governing Council and at the Bank of Finland."
Market reaction
The EUR/USD pair showed no immediate reaction to these comments and was last seen posting modest daily gains at 1.1612.
EUR/USD is seen at risk of a near-term rebound. Nonetheless, strength is still viewed as corrective ahead of a move to 1.1495/93 in due course, economists at Credit Suisse report.
Resistance moves to 1.1614, then 1.1663/71
“The strong rebound has seen a minor base complete and with a bullish RSI momentum divergence also in place we see scope for a corrective move higher. Saying this, a close above the 13-day exponential average and price resistance at 1.1602/14 is needed to add weight to this view with resistance then seen at 1.1641 ahead of the 38.2% retracement of the September/October fall and price resistance at 1.1663/71.”
“Our bias would be for a fresh cap at 1.1663/71 and a resumption of the core downtrend. Above 1.1671 can see a deeper recovery to 1.1695, potentially the 55-day average at 1.1733.”
“Failure to clear 1.1614 will leave the recovery in doubt with support seen at 1.1566 initially, with a break below 1.1529/24 curtailing thoughts of a rebound for a fall to our first objective at 1.1495/93 – the key March 2020 ‘point-of-breakout’ high and the 50% retracement of the rally from the 2020 low.”
- DXY recedes further and breaches the 94.00 support.
- There is expected to emerge decent contention in the mid-93.00s.
DXY loses the grip further and drops to new multi-day lows in the vicinity of 93.70 on Thursday.
So far, the continuation of this corrective decline could extend further in the near term. That said, the is a decent contention area near 93.50, where is located the pre-FOMC high (September 22). Further south from here comes the 55-day SMA just above 93.00 the figure.
Looking at the broader picture, the constructive stance on the index is seen unchanged above the 200-day SMA at 91.76.
DXY daily chart
EUR/CHF this week fell to its lowest level since Nov 2020, extending a downtrend that has been in place since late September. Concerns about slowing growth in the eurozone have led economists at Rabobank to downgrade their EUR/CHF one and three-month forecast to 1.07.
Fears that the eurozone economy is losing momentum provide more scope for flows back to the safe haven CHF
“In view of the slowdown in eurozone growth we have revised down our one-month and three-month EUR/CHF forecasts to 1.07.”
“On the assumption that the eurozone recovery remains in place, we expect a move back to 1.10 on a six-month view.”
“The November 2020 low around EUR/CHF 1.0660 will likely provide some support for the currency pair.”
Following Wednesday's impressive upsurge, gold preserved its bullish momentum in the first half of the day Thursday and touched $1,800 for the first time since mid-September.
At the time of press, the XAU/USD pair was up 0.4% on the day at $1,800.15.
Falling US Treasury bond yields seem to be fueling gold's rally in the second half of the week. After bond markets returned to action on Tuesday, the benchmark 10-year US Treasury bond yield lost nearly 6% and was last seen falling 0.9% on the day at 1.525%.
Moreover, the poor performance of US Treasury yields continues to weigh on the greenback with the US Dollar Index dropping to fresh 10-day lows near 93.80.
Later in the session, the weekly Initial Jobless Claims and September Producer Price Index data will be featured in the US economic docket.
Gold Price Forecast: XAU/USD to see further gains on a daily close above 200-DMA.
Gold 15-min chart
Technical levels to watch for
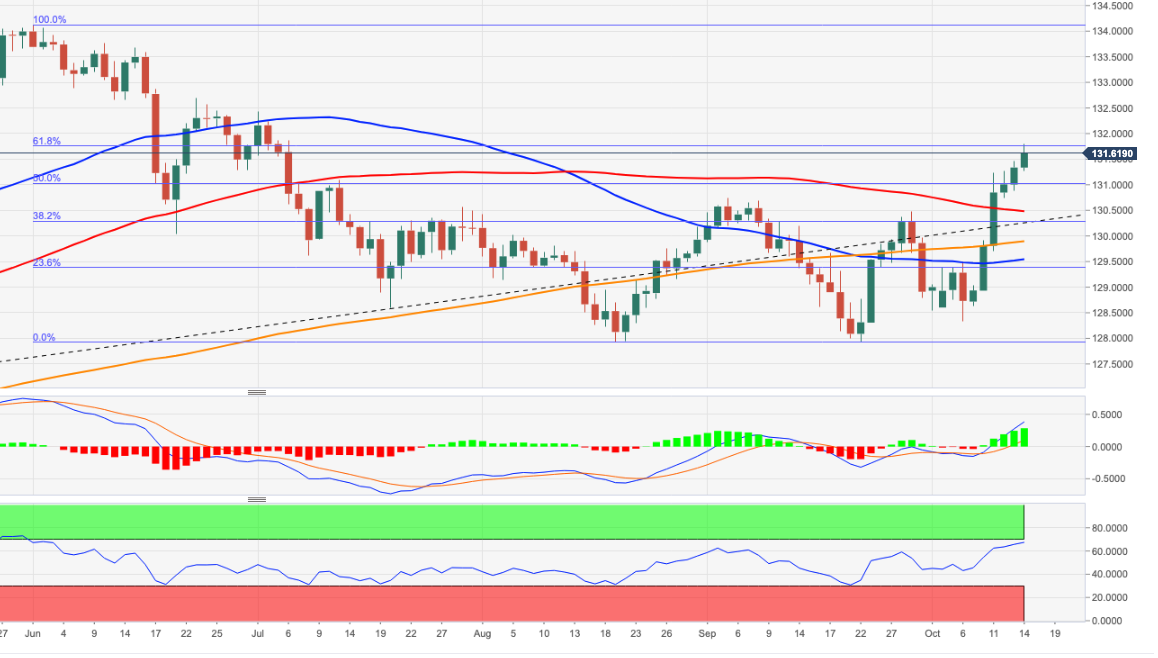
- EUR/JPY advances well past the 131.00 mark on Thursday.
- Extra gains now seen testing 132.00 and beyond.
EUR/JPY extends the sharp recovery for yet another session and this time further north of the 131.00 hurdle.
The intense move higher in the cross has been exacerbated following the recent breakout of the key 200-day SMA and now targets the round level at 132.00 ahead of minor obstacles at the July 1 high at 132.43 and the June 23 high at 132.69, all prior to another Fibo level at 132.79.
In the broader scenario, while above the 200-day SMA at 129.85, the outlook for the cross is expected to remain constructive.
EUR/JPY daily chart
Christine Lagarde, President of the Europen Central Bank (ECB), said on Thursday that they continue to view the inflation upswing as being largely driven by temporary factors, as reported by Reuters.
Additional takeaways
"The rebound phase of the euro area economy is increasingly advanced."
"We see the risks surrounding the euro area growth outlook as being broadly balanced."
"Price pressures could become more persistent if supply bottlenecks last longer or wages rise more than is currently anticipated."
"There is no evidence of significant second-round effects through wages."
"The governing council regularly recalibrates the net purchases under the Pandemic Emergency Purchase Programme (PEPP) based on a joint assessment of financing conditions and the inflation outlook."
Market reaction
The EUR/USD pair edged slightly lower from session tops after these comments and was last seen gaining 0.14% on the day at 1.1608.
- USD/JPY struggled to capitalize on its modest intraday uptick amid renewed USD selling bias.
- The risk-on impulse undermined the safe-haven JPY and might help limit any further losses.
- Slight overbought RSI could trigger some long-unwinding trade and deeper corrective slide.
The USD/JPY pair erased a major part of its intraday gains to the 113.60 region and was last seen hovering just a few pips above daily lows, around the 113.30-35 region.
The US dollar came under some renewed selling pressure during the early part of the European session and extended the previous day's retracement slide from 13-month tops. This, in turn, was seen as a key factor that acted as a headwind for the USD/JPY pair, though the risk-on impulse undermined the safe-haven Japanese yen and helped limit any deeper losses.
Looking at the technical picture, the recent strong positive momentum from the vicinity of the 109.00 level stalled near a resistance marked by the top boundary of an upward sloping channel. RSI on the daily chart is still holding in the overbought territory, which might trigger some long-unwinding trade and set the stage for a deeper pullback for the USD/JPY pair.
That said, the lack of any meaningful slide warrants some caution before confirming that the USD/JPY pair has topped out in the near term and positioning for any further depreciating move. From current levels, the 113.00 round-figure mark seems to act as immediate strong support, which if broken decisively should prompt aggressive technical selling.
The USD/JPY pair might then accelerate the downfall towards testing the next relevant support near the 112.25-20 horizontal zone. Any subsequent decline might still be seen as a buying opportunity and remain limited near the 112.00 round figure.
On the flip side, the 113.55-60 region now seems to have emerged as an immediate strong resistance, above which the USD/JPY pair could challenge the trend-channel barrier just ahead of the 114.00 mark. Some follow-through buying will be seen as a fresh trigger for bullish traders and pave the way for an extension of a multi-week-old bullish trend.
USD/JPY 4-hour chart
-637698032797640912.png)
Technical levels to watch
Japanese Prime Minister Fumio Kishida said on Thursday that new spending to aid domestic development and production of vaccines, drugs to treat COVID-19 patients will be included in the stimulus, as reported by Reuters.
Additional takeaways
"Will take steps to fix supply-demand balance to address sharp fall in domestic prices."
"Will extend to march special add-on subsidies to support jobs."
"Will start preparations to resume government travel discount programme in a re-modelled fashion."
"Will make bold hike in tax exemptions to firms that raise wages."
Market reaction
The USD/JPY pair showed no immediate reaction to these comments and was last seen posting small daily gains at 113.32.
- EUR/GBP prolonged its recent bearish trajectory and dropped to over two-month lows.
- Hawkish BoE signals, easing fears of a fresh Brexit-related spat underpinned the sterling.
- Weaker USD benefitted the shared currency and could extend some support to the cross.
The EUR/GBP cross extended its steady intraday descent and dropped to over two-month lows, around the 0.8460 region during the first half of the European session.
The cross struggled to capitalize on its modest intraday uptick, instead met with some fresh supply ahead of the key 0.8500 psychological mark and now seems vulnerable to slide further. The British pound's relative outperformance comes amid a positive development surrounding the Northern Ireland protocol of the Brexit agreement.
A team of EU negotiators on Wednesday delivered a plan that offered to reduce customs checks and paperwork on British products intended for Northern Ireland to avert a new post-Brexit spat. The UK said it would look at the proposals seriously and constructively and called on both sides to engage in intensive talks rapidly.
Apart from this, hawkish signals from the Bank of England (BoE) officials, including Governor Andrew Bailey, further acted as a tailwind for the sterling. In fact, the money market now seems to have fully priced in a 25bps BoE rate hike in December, which was seen as another factor that exerted pressure on the EUR/GBP cross.
On the other hand, the shared currency benefitted from the ongoing US dollar retracement slide from 13-year tops. This, however, did little to impress bullish traders, albeit might help limit any further losses for the EUR/GBP cross. Nevertheless, the fundamental backdrop favours bearish traders and supports prospects for further losses.
Technical levels to watch
Fed officials do not appear swayed from their QE tapering plans by the slowdown in jobs growth, keeping the US dollar on a solid footing. The US Dollar Index (DXY) is looking a little shaky into 94.5, but should retain the bulk of its recent gains, according to economists at Westpac.
Gas supply bottlenecks in Europe and power shortages in China to cast doubt on rebound prospects in the rest of the world
“US Q3 GDP projections continue to slip, the latest median estimate falling to 4.7% annualised. But it hasn’t dented the USD and further material growth downgrades seem unlikely in any case.”
“Power shortages in China and gas constraints in Europe likely extend well into the northern hemisphere winter, casting an ongoing cloud over global rebound prospects well into 2022.”
“Fed officials continue to signal a strong preference for moving ahead with a relatively brisk 6 to 9 month tapering of asset purchases, likely announced at their next meeting 4th November and starting before the year is out.”
“DXY looking a little shaky into 94.50 but should retain the bulk of its recent gains amid further signs the global rebound is losing steam and Fed QE tapering.”
“Raising interest rates to counter higher semi-conductor or energy prices would be 'self-defeating', if one-off,” said Bank of England (BOE) policymaker Silvana Tenreyro in an interview with Business Live on Thursday.
Additional comments
“There is a question about whether price changes are a one off.”
“We are also seeing temporary supply disruption from post-covid imbalances worldwide.”
“Inflation should be temporary.”
In its latest report, the German Economy Ministry said that it expected a significant GDP increase in the third quarter of this year, courtesy of the growth in the services sector.
Additional takeaways
“Economic development could proceed sideways in Q4.”
“Bottlenecks in raw material delivery may keep hurting the industry in coming months.”
Separately, the German economic institutes cut the 2021 growth forecast to 2.4% from the 3.7% previous estimate.
Meanwhile, the country’s highly influential institutes raised the 2022 GDP growth forecast from 3.9% to 4.8%.
Market reaction
EUR/USD is extending its recovery above 1.1600, as the US dollar accelerates its corrective pullback amid a negative turn in the Treasury yields across the curve.
The spot remains unfazed by the above headlines, as it trades at 1.1619, up 0.24% on the day, at the press time.
“Energy crisis has prompted a switch to oil that could boost demand by 500,000 barrels per day (bpd),” the International Energy Agency (IEA) said in its latest monthly oil market report released on Thursday.
Key takeaways
Natural gas, LNG and coal shortage could keep oil market in deficit to end of year at least.
Oil supply has resumed uptrend as OPEC+ unwinds production cuts, US recovers from hurricane Ida and maintenance winds down.
High energy prices could add to inflation that, along with power outages, lowers industrial activity and slows growth.
OECD commercial oil stocks fell by 23 mln barrels in September and are at their lowest since march 2015.
OPEC+ effective spare capacity could fall below 4 mln bpd by q2 2022 from 9 mln bpd in q1 2021.
Shrinking global spare capacity underscores need for increased investment to meet future demand.
Oil demand will exceed pre-pandemic levels in 2022, rising 3.3 mln bpd to 99.6 mln bpd.
Revises 2021 and 2022 oil demand forecast upwards by 170,000 bpd and 210,000 bpd respectively.
OPEC+ on track to pump 700,000 bpd below estimated demand for its crude in q4 2021.
Implied third-quarter refined product balances show the largest draw in eight years.
Market reaction
WTI is reacting positively to the IEA report, as it flirts with daily highs near $80.85. The US oil is higher by 1% on the day.
- USD/CHF witnessed heavy selling for the second straight session on Thursday.
- The ongoing USD corrective slide was seen as a key factor exerting pressure.
- The risk-on mood did little to undermine the safe-haven CHF or lend support.
The emergence of fresh selling around the USD dragged the USD/CHF pair to four-week lows, sub-0.9200 levels during the early part of the European session.
Despite a slightly stronger US CPI report, investors seem unconvinced about a sustained period of inflation. This was evident from a further decline in the longer-term US Treasury bond yields, which triggered a sharp US dollar corrective slide from 13-month tops. The pullback extended through the first half of the trading action on Thursday, which, in turn, dragged the USD/CHF pair lower for the second successive day.
Meanwhile, the minutes of the September FOMC monetary policy meeting revealed that the Fed remains on track to begin tapering its bond purchases in 2021. Moreover, a growing number of policymakers were worried about the continuous rise in inflationary pressure, forcing investors to bring forward the likely timing of a potential rate hike. This, however, did little to impress the USD bulls or lend any support to the USD/CHF pair.
Even the risk-on impulse in the equity markets, which tends to undermine demand for the traditional safe-haven Swiss franc, failed to ease the intraday bearish pressure around the USD/CHF pair. With the latest leg down, the pair has now reversed over 100 pips from levels just above the 0.9300 round-figure mark. A sustained break below the 0.9225-20 region might have already set the stage for an extension of the ongoing depreciating move.
Market participants now look forward to the US economic docket, featuring the release of the Producer Price Index (PPI) and the usual Weekly Initial Jobless Claims. This, along with the US bond yields and scheduled speeches by influential FOMC members, will influence the USD and provide a fresh impetus to the USD/CHF pair.
Technical levels to watch
A stronger USD plus local pandemic risks persisting have capped the kiwi recently, but NZ CPI is set to print at a 10-year high next week. Economists at Westpac are watching for a break of 0.6980, which would open up the 0.74 level by year-end.
NZ inflation will be highest since 2011
“NZD/USD has been rangebound inside 0.6860-0.6980, with few near-term directional clues. One possibility is that the downward correction since early September is complete, and a base is forming to launch a retest of 0.7200 multi week, and 0.7400 by year-end”.
“One argument for the NZD/USD to grind higher is the major commodity boom underway. Another argument is that RBNZ tightening will proceed as projected, despite adverse Covid developments recently.”
“Our economists expect Q3 CPI to rise by 1.5% QoQ, 4.2% YoY. That would be an increase from Q2’s 3.3% YoY, and the highest since 2011’s GST-related spike. Our forecast is slightly higher than the RBNZ’s.”
With no blockbuster in terms of the US CPI and FOMC minutes, the market likely took the opportunity to take some profit on USD longs. Economists at OCBC Bank expect the USD/CAD pair to extend its slump towards the 1.2370750 region.
USD directionality may turn soggy
“The US CPI entering slightly firmer than expected gave the USD a brief boost, but it came under selling pressure soon after. The FOMC minutes did not reveal new insights beyond the statement and Powell press-con. The market was reminded of a year-end start to tapering, and at a pace that will conclude in mid-2022.”
“ The CAD’s gain against the USD was relatively muted, but it kept the USD/CAD on a downside bias towards 1.2350/70 as the next target. Short term implied valuations also point to more downside.”
“The USD/CAD is our preferred expression of near-term cyclicals strength against the USD.”
The EUR/CHF hovers near the 1.0701/1.0696 recent low. Karen Jones, Team Head FICC Technical Analysis Research at Commerzbank, expects the pair to slump towards the 1.0623/43 region.
Downtrend at 1.0754 is the first resistance to near-term rallies
“EUR/CHF continues to sit on the 1.0701/1.0696 recent low, which looks exposed.”
“Near-term rallies will find initial resistance at the accelerated downtrend at 1.0754 and the 55-day ma at 1.0796 ahead of the 1.0865 24th September high.”
“We look for losses to the 1.0623/43 November 2020 low, the 2016 low and 78.6% retracement at 1.0643. We look for the market to hold in this vicinity.”
Soaring commodity prices while specs sit net short A$ suggests ongoing gains. Next target for the AUD/USD pair is the 100-day moving average (DMA) at 0.7416 and at a stretch, the 3 September high at 0.7478, economists at Westpac report.
The aussie is finding plenty of support from renewed commodity price squeeze
“This is probably not the scenario traders were counting on in September when China’s stressed property market was in close focus and on CME, leveraged funds and asset managers built a net short A$ position larger than in March 2020.”
“The overhang of short positions seems to be helping the aussie grind higher against a solid US dollar, with the next targets the 100-DMA at 0.7416 and at a stretch, the 3 Sep high at 0.7478.”
“Domestically, NSW and VIC vaccination rates are rising quickly, with Australia firmly on track for one of the world’s highest vaccination rates.”
“The RBA will remain dovish for now but AUD should remain bid on most crosses in the week ahead given commodity price support.”
Economist at UOB Group Ho Woei Chen, CFA, suggests the BoK could hike the policy rate by 25 bps at its November meeting.
Key Takeaways
“As expected, the Bank of Korea (BoK) kept its benchmark base rate unchanged at 0.75% today and reinforced our conviction for the second rate hike to take place in November, the last rate meeting for this year.”
“Two members (out of seven) had voted for a hike today while Governor Lee Ju-yeol said that it would be “good to consider an additional hike” next month if “the situation doesn’t deviate too much from the one the board is looking at” while highlighting worsening financial imbalances as the real interest rate is “far below” the neutral rate. We think the economic recovery in South Korea will be sustained as it moves to gradually ease COVID-19 restrictions. This will allow further interest rate normalisation into 2022. Around 55% of the population and more than 60% of adults were fully vaccinated. The country targets to vaccinate 80% of all adults by the end of October.”
“Improvements in economic outlook will provide the room for BoK to raise interest rate by another 25 bps in November. Thereafter, we expect a further 25 bps increase in 1Q22 which would have undone the total 75 bps rate cut due to the COVID-19 pandemic. Governor Lee’s term will end on 31 March 2022 and we see the likelihood for him to restore the base rate to pre-COVID level of 1.25% by then.”
- EUR/USD extends the advance above the 1.1600 mark.
- The corrective downside in the dollar fuels the move higher in spot.
- ECB-speak, US Initial Claims next of relevance in the docket.
The single currency extends the optimism seen in the first half of the week and now pushes EUR/USD back above 1.1600 the figure on Thursday.
EUR/USD in multi-day highs
Short covering helps the EUR/USD advance for the second session in a row and manages to reclaim the area above 1.1600 the figure on Thursday.
In fact, lower yields in the US 10-year reference note weigh on the buck and drags the US Dollar Index (DXY) further south after hitting new 2021 highs past 94.50 earlier in the week.
No news from the publication of the FOMC Minutes on Wednesday also removed strength from the greenback after the Committee’s general view continues to support the idea that the Federal Reserve could start trimming its bond-purchase programme in November/December, falling in line with the current narrative among Fed-speakers.
No data releases on Thursday should leave the attention to speeches by ECB’s A.Enria and F.Elderson.
Across the pond, the usual weekly Claims are due along with Producer Prices. In addition, FOMC’s Bostic, Barkin and Williams are due to speak.
What to look for around EUR
EUR/USD woke up and regained the 1.1600 mark on the back of the corrective downside in the dollar following recent YTD highs. In the meantime, dollar dynamics are expected to keep dictating the price action around the pair for the time being. The firmer tone in the buck along with higher US yields and bouts of risk aversion – particularly in response to inflation jitters and the energy crunch - continue to undermine the performance of the risk universe, while the growth outlook appears under pressure on rising speculations that the inflation could take longer to reverse the ongoing elevated levels. In addition, the likely loss of momentum in the economic recovery, as per some weakness seen in key fundamentals, also caps the upside potential in the pair.
Key events in the euro area this week European Council Meeting (Thursday) - European Council Meeting, EMU Balance of Trade (Friday).
Eminent issues on the back boiler: Asymmetric economic recovery in the region. Sustainability of the pick-up in inflation figures. Progress of the Delta variant of the coronavirus and pace of the vaccination campaign. Probable political effervescence around the EU Recovery Fund. Investors’ shift to European equities in the wake of the pandemic could lend extra oxygen to the single currency. ECB tapering speculations.
EUR/USD levels to watch
So far, spot is gaining 0.18% at 1.1611 and faces the next up barrier at 1.1631 (20-day SMA) followed by 1.1640 (weekly high Oct.4) and finally 1.1732 (55-day SMA). On the other hand, a break below 1.1524 (2021 low Oct.12) could target 1.1500 (round level) en route to 1.1495 (high Mar.9 2020).
- GBP/USD gained strong positive traction for the second straight day amid weaker USD.
- Hawkish BoE signals, easing fears of a fresh Brexit-related spat underpinned the sterling.
- Rising bets for an early Fed rate hike failed to impress the USD bulls or hinder the move.
The GBP/USD pair shot to over two-week tops during the early European session, with bulls now looking to build on the momentum beyond the 1.3700 mark.
The US dollar struggled to preserve its modest intraday gains, instead met with some fresh supply on Thursday and extended the previous day's retracement slide from 13-month tops. A softer tone around the longer-dated US Treasury bond yields undermined the greenback, which was further pressured by the risk-on impulse in the markets. This, in turn, was seen as a key factor that pushed the GBP/USD pair higher for the second successive day.
The US CPI report released on Wednesday showed a continuous rise in inflationary pressures. Investors, however, still seem unconvinced about a sustained period of inflation, which was reinforced by a decline in the US bond yields. This, to a larger extent, overshadowed hawkish FOMC meeting minutes, which indicated that the US central bank remains on track to begin tapering its bond purchases in 2021 and continued undermining the greenback.
Moreover, a growing number of policymakers were worried that inflation could persist, forcing investors to bring forward the likely timing of a potential Fed rate hike move. The markets now seem to be betting on the possibility of the so-called lift-off in September 2022 as against December 2022 already priced in. The developments, however, did little to impress the USD bulls or stall the GBP/USD pair's ongoing positive momentum.
On the other hand, the British pound drew some support from easing worries about the UK-EU stand-off over the Northern Ireland Protocol. The EU on Wednesday offered to reduce customs checks and paperwork on British products intended for NI. This comes after the Bank of England officials signalled an imminent rate hike and acted as a tailwind for the sterling.
With the latest leg up, the GBP/USD pair has now rallied over 130 pips from weekly lows touched on Tuesday and remains on track to appreciate further. Market participants now look forward to the US economic docket, featuring the release of the Producer Price Index (PPI) and the usual Weekly Initial Jobless Claims. This, along with the US bond yields and scheduled speeches by influential FOMC members, will influence the USD and provide a fresh impetus.
Technical levels to watch
UOB Group’s FX Strategists see extra losses in USD/CNH picking up pace if 6.4240 is cleared.
Key Quotes
24-hour view: “We did not expect the sharp sell-off that sent USD plunging to 6.4250. While already oversold, the weakness in USD has not stabilized. From here, USD could retest the 6.4240 level before stabilization can be expected. For today, a sustained decline below 6.4240 appears unlikely. Resistance is at 6.4420 followed by 6.4480.”
Next 1-3 weeks: “We have held the same view since last Wednesday (06 Oct, spot at 6.4500) where USD is likely to trade between 6.4240 and 6.4800 for a period of time. After trading in a choppy manner for several days, USD plummeted to 6.4250 yesterday (13 Oct). Downward momentum is beginning to build but USD has to close below 6.4240 before a sustained decline can be expected (next support is at 6.4100). The chance for USD to close below 6.4240 is quite high as long as it does not move above the ‘strong resistance’ level (currently at 6.4540) within these few days.”
The European Central Bank (ECB) top supervisor Andrea Enria warned Thursday, even though the economic outlook has improved, caution remains of the essence.
Additional quotes
“Keeping a very close eye on the build-up of risks on bank balance sheets.”
“Seeing a build-up of residential real estate vulnerabilities in some countries.”
Market reaction
EUR/USD is back above the 1.1600 mark, benefiting from the extension of the losses in the US dollar across the board. The risk-on mood is further aiding the pair’s recovery from multi-month troughs of 1.1524.
The spot was last seen trading at 1.1605, gaining 0.13% so far.
China’s Premier Li Keqiang acknowledged on Thursday; the economic growth has slowed in the third quarter of 2021.
Although he said, “we are fully confident to achieve overall development goals.”
Li added that he is strongly resolved to push reform and opening up of the economy.
more to come ...
- Silver attracted some dip-buying on Thursday and turned positive for the second straight day.
- The set-up seems tilted in favour of bullish traders and supports prospects for additional gains.
- A sustained break below the $22.25-20 support is needed to negate the constructive outlook.
Silver reversed an intraday dip to the $22.90 area and inched back closer to near one-month tops touched in the previous day. The white metal was last seen trading near the $23.20 region, up around 0.40% for the day.
The mentioned are marks a confluence hurdle comprising of 200-period SMA on the 4-hour chart and the 50% Fibonacci level of the $24.87-$21.42 downfall. A sustained move beyond will be seen as a fresh trigger for bullish traders and set the stage for a further near-term appreciating move.
Meanwhile, technical indicators on hourly charts maintained their bullish bias and have just started gaining positive traction on the daily chart. The set-up seems tilted firmly in favour of bullish traders and supports prospects for an eventual break through the mentioned confluence barrier.
The XAG/USD might then accelerate the momentum towards the 61.8% Fibo. level, around the $23.55-60 area, before aiming to reclaim the $24.00 mark. Some follow-through buying beyond the $24.25-30 region would expose September monthly swing highs resistance near the $24.75-80 zone.
On the flip side, any meaningful slide below the $23.00 round figure might be seen as a buying opportunity and remain limited near the 38.2% Fibo. level, around the $22.75 region. That said, sustained weakness below might accelerate the slide back towards the $22.25-20 static support.
The latter coincides with the 23.6% Fibo. level, which if broken decisively will shift the bias back in favour of bearish traders. The XAG/USD might then turn vulnerable to break below the $22.00 mark and slide further towards challenging YTD lows, around the $21.45-40 region.
Silver 4-hour chart
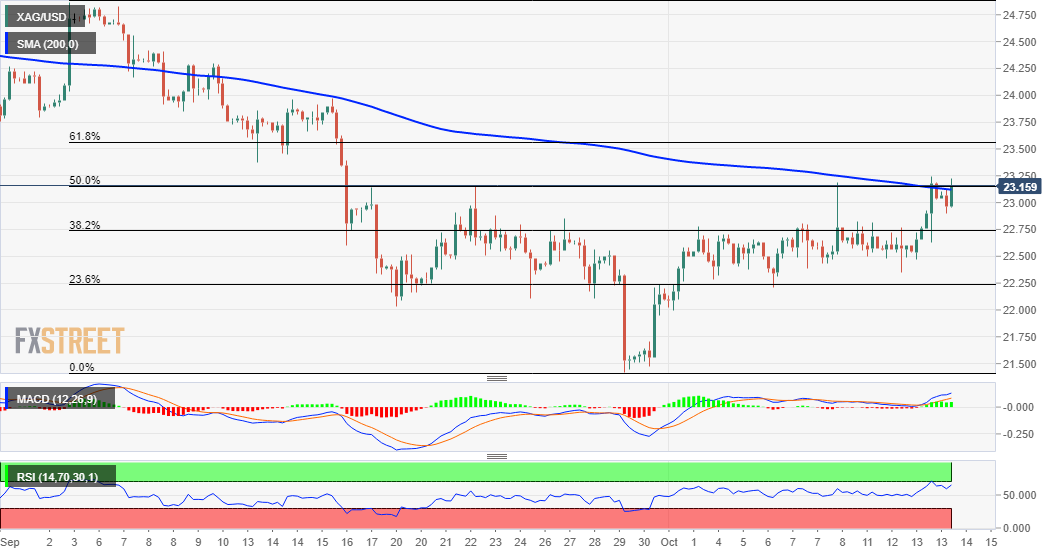
Technical levels to watch
- AUD/USD approaches 0.7400 after symmetrical triangle breakout on the 1D chart.
- 100-DMA resistance at 0.7416 is the level to beat for the aussie bulls.
- Daily RSI points north well above the midline, suggesting more gains.
AUD/USD is building onto Wednesday’s rally, as the buying interest around the aussie remains unabated, despite the mixed Australian jobs and Chinese inflation figures.
The major has recaptured the 0.7400 mark, adding 0.33% on the day, quickly approaching the critical descending 100-Daily Moving Average (DMA) at 0.7416.
AUD/USD’s uptrend found additional legs after the bulls yielded a month-long symmetrical triangle breakout on the daily chart on Wednesday.
The 14-day Relative Strength Index (RSI) is edging higher above the midline, allowing room for more upside.
Therefore, acceptance above the 100-DMA barrier will open doors towards the 0.7450 psychological resistance.
Further up, the September highs of 0.7478 could challenge the bearish commitments.
AUD/USD: Daily chart
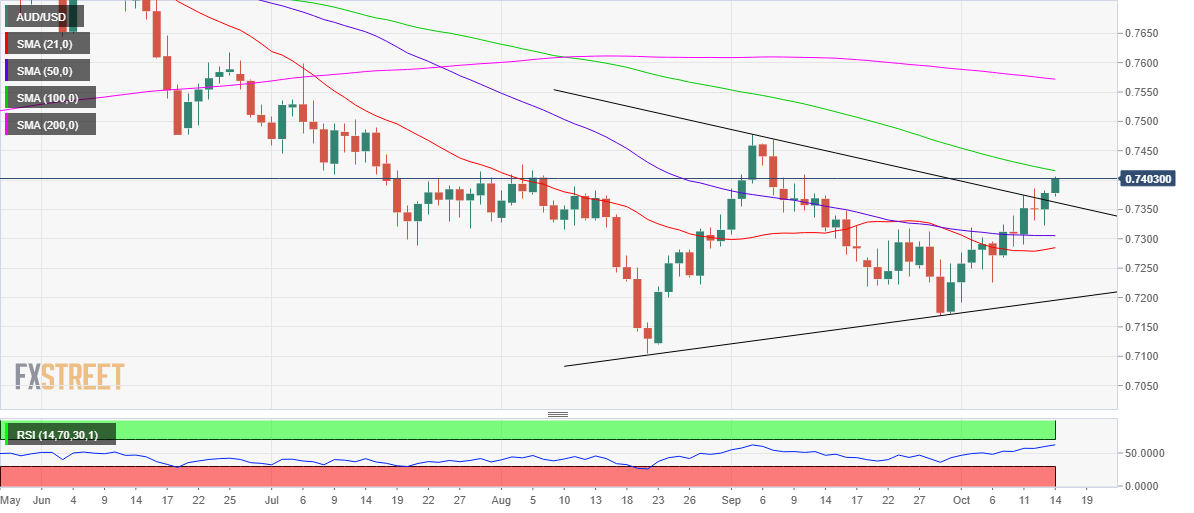
Alternatively, the triangle resistance-turned-support at 0.7362 will guard the immediate downside.
The next significant goal for the AUD bears will be the horizontal 50-DMA at 0.7305. More weakness will prompt the sellers to test the mildly bullish 21-DMA at 0.7285.
AUD/USD: Additional levels to consider
Most analysts (14 out of 15 analysts in Bloomberg's survey) expected no change in policy settings. However, the MAS surprised the market by raising the slope of the SGD NEER policy band. The SGD rallied on today's MAS action and economists at TD Securities see further upside given that MAS is likely to continue tightening policy again in April 2022.
Room for more SGD upside
“MAS slightly raised the slope of the SGD NEER band, surprising us and the market. We expect the slope to be raised to +0.5% from 0% previously. There was no change to the midpoint and width of the SGD NEER band.”
“Despite Q3 GDP coming in below consensus and covid concerns remaining unresolved, the buildup in external and domestic cost pressures outweighed immediate growth concerns. The next step could be a re-centering of the midpoint at the April 2022 meeting.”
“Given the risk of a more aggressive tightening at the April 2022 meeting, we see more room for SGD upside and remain constructive on SGD.”
“The path of least resistance favours a lower USD/SGD, and we expect USD/SGD to trade to 1.34 (around the 23.6% Fib level and 200-DMA) by year-end.”
The European Central Bank (ECB) sees inflation pressures as transitory and have indicated that the next “live” meeting is in December. Rising inflationary data may pressure EUR/USD to breach 1.15, economists at Westpac report.
Supply costs and labour constraints are hampering activity
“Core members of ECB have recently underscored their desire to avoid any premature withdrawal of accommodation and have also stressed that current upside inflationary pressures are mostly transitory. By stressing this, they have effectively pushed back on any potential for early ‘recalibration’ of either the PEPP (due to end in late Q1) and APP at least until the staff projections are updated in December.”
“A distinct waning in survey data of late while inflation reads have remained high has highlighted that supply costs and labour constraints are hampering activity. This should increase attention on flash Oct PMIs.”
“The cautious stance of ECB puts it at the dovish end of the shifts in global CBs towards tapering or hiking and is likely to cap any EUR/USD rebounds and sustain pressure on 1.15 support.”
EUR/GBP continues to hold this year's lows at 0.8471/49. Karen Jones, Team Head FICC Technical Analysis Research at Commerzbank, expects the pair to challenge the 0.8659/73 highs on a break above the 55-day moving average (DMA) at 0.8542.
EUR/GBP is well supported down to 0.8471/49
“EUR/GBP continues to hold at key support at 0.8471/49, which are the recent low and lows since 2019. We again look for these to continue to hold the downside.”
“Rallies will find initial resistance at the 55-DMA at 0.8542 and will need to regain this to challenge the 0.8659/73 highs since May.”
“Below 0.8449 would target the 0.8239 2019 low.”
USD/TRY is on course to close higher for the fifth consecutive day. Economists at MUFG Bank expect the lira to accelerate its depreciation Turkish President sacks three Central Bank’s policymakers in a sudden move.
Lira set to weaken further
“There is now an increased risk that lira weakness will accelerate in the near-term following the announcement that President Erdogan has fired three members of the CBRT’s rate setting committee.”
“The latest developments provide further evidence of President Erdogan’s strong influence over the setting of monetary policy in Turkey and the CBRT’s lack of independence. It will further cast doubt amongst investors over Turkey’s desire/ability to dampen upside inflation risks which will continue to erode the value of the lira.”
“The odds of another rate cut at the next meeting on 21st October have now increased even as lira weakness accelerates. In light of these developments the lira will continue to weaken more quickly and by more than we had been anticipating.”
The EUR/USD pair has moved higher, but fell short of overcoming the 1.1600 handle. In the view of economists at OCBC, underlying negative momentum is not exhausted while below the 1.1640 mark.
Bounce? Not so fast
“The EUR/USD bounced higher amid a bout of USD profit taking. The move was however capped below 1.1600, suggesting that the broader downtrend is perhaps not exhausted.”
“Expect this move to be short-lived, and continue to expect a top-heavy posture for the pair so long as it is below the Oct high at 1.1640.”
- A combination of factors weighed on USD/CAD for the third consecutive session on Thursday.
- Bullish oil prices underpinned the loonie and exerted pressure amid a subdued USD demand.
- Rising bets for an early Fed rate hike acted as a tailwind for the USD and should lend support.
The USD/CAD pair dropped to over three-month lows during the early European session, with bears now eyeing a break below the 1.2400 round-figure mark.
Crude oil prices held steady near multi-year tops and continued underpinning the commodity-linked loonie. This, in turn, was seen as a key factor that dragged the USD/CAD pair lower for the third consecutive session on Thursday amid a subdued US dollar price action. The longer-dated US Treasury bond yields declined further following a slightly higher than estimated US CPI print, suggesting that the market is still not convinced about a sustained period of inflation. This was seen as a key factor that kept the USD bulls on the defensive.
That said, prospects for an early policy tightening by the Fed helped limit any deeper USD losses, though did little to impress bulls or lend any support to the USD/CAD pair. The minutes of the FOMC monetary policy meeting held on September 21-22 revealed that the US central bank remains on track to begin tapering its bond purchases in 2021. Moreover, a growing number of policymakers were worried about the continuous rise in inflationary pressures, forcing investors to bring forward the likely timing of a potential interest rate hike.
The markets now seem to have started betting on the possibility of the so-called lift-off in September 2022 as against December 2022 already priced in. This was reinforced by an uptick in the US bond yields, which should help revive the USD demand and act as a tailwind for the USD/CAD pair. Even from a technical perspective, the pair has managed to defend support marked by the lower end of a four-week-old descending trend channel. This makes it prudent to wait for a sustained weakness below the mentioned support before placing fresh bearish bets.
Market participants now look forward to the US economic docket, featuring the release of the Producer Price Index (PPI) and the usual Weekly Initial Jobless Claims. This, along with the US bond yields and scheduled speeches by influential FOMC members, will drive the USD demand. Apart from this, traders might further take cues from the official US crude inventories data, which will influence oil price dynamics and provide a fresh impetus to the USD/CAD pair.
Technical levels to watch
Here is what you need to know on Thursday, October 14:
Fluctuations in the US Treasury bond yields continue to drive the dollar’s valuation and the overall market mood stays cautiously optimistic on Thursday. The greenback is consolidating Wednesday’s losses as focus shifts to mid-tier data releases from the US - weekly Initial Jobless Claims and September Producer Price Index (PPI).
The US Dollar Index suffered its largest one-day loss since May on Wednesday, declining 0.54% as the benchmark 10-year US T-bond yield fell nearly 3% for the second straight day. However, the 10-year yield seems to have found its footing above the critical 1.5% level, supporting the dollar in the early European session on Thursday.
Macro data: The US Bureau of Labor Statistics reported on Wednesday that the Consumer Price Index (CPI) edged higher to 5.4% on a yearly basis in September from 5.3% in August. In the euro area, Industrial Production contracted by 1.6% as expected and the annual CPI in Germany remained steady at 4.1%.
The Unemployment Rate in Australia ticked higher to 4.6% in September but this reading came in better than the market expectation of 4.8%. Chinese CPI surged to 10.7% in September from 9.5% in August.
Wall Street: The S&P 500 Index gained 0.3% and the Dow Jones Industrial Average closed near its opening levels as investors shift their focus to key earnings reports. Citigroup and Wells Fargo are among the big names that will release third-quarter earnings before the opening bell on Thursday. US stock index futures are edging higher in the first half of the day.
Gold: XAU/USD capitalized on falling US yields and advanced to its highest level in nearly a month at $1,796 before going into a consolidation phase on Thursday.
EUR/USD rose decisively and erased all of October's losses to turn positive for the month. Currently, the pair is moving sideways near 1.1600. However, it's worth noting that EUR/USD was supported by the broad-based USD weakness rather than the euro's strength.
GBP/USD continues to push higher toward 1.3700 as the UK evaluates the EU's proposal on Brexit Northern Ireland Protocol.
USD/JPY managed to hold near the multi-year highs it set earlier in the week despite falling US T-bond yields and fluctuates in a tight channel around 113.50.
Cryptocurrencies: Following a short-lasting correction phase, Bitcoin regained its traction and climbed above $58,000 for the first time since early May. Ethereum is clinging to small daily gains around $3,600 while Ripple is struggling to find direction.
EUR/JPY is viewed in a positive light. Karen Jones, Team Head FICC Technical Analysis Research at Commerzbank, expects the pair to continue enjoying positive momentum.
Dips to find initial support at 130.46
“EUR/JPY is viewed in a positive light following the recent break above key nearby resistance at the 130.55/74 July and September highs, and the 50% retracement and mid-July high at 131.03/08.”
“We look for gains to 132.69/80, the 23rd June high and 78.6% retracement. This is regarded as the last defence for the 134.12 June peak.”
“Dips should find initial support at 130.46, the 29th September high and 129.57, the 20 day ma ahead of 128.57, the 6th October low and the 127.94/50, August and September lows and the February 2019 high.”
The USD/JPY dip was relatively shallower and held above the 113.20 mark. Economists at OCBC Bank maintain a USD-positive stance against the yen and expect the pair to enter the 114.50-115.00 area.
Buy on dips
“Topside at 113.80 was rejected yesterday amid the USD dip, but note that the decline bottomed out at 113.20 and is progressively shallower. This suggests that 113.00 would be a firm support and the underlying positive momentum is not exhausted just yet.”
“Technicals suggest that the next resistance zone would enter around 114.50 to 115.00 levels.”
“Prefer to buy dips towards 113.20.”
AUD/USD has eroded its five-month downtrend at 0.7350. Karen Jones, Team Head FICC Technical Analysis Research at Commerzbank, expects the aussie to climb towards the 55-week moving average at 0.7509.
Break of the five-month downtrend point to further strength to the 55-week ma
“AUD/USD has closed above its five-month downtrend and the outlook is neutral to positive. The close above here introduces scope for the 4th August peak at 0.7427 and the September peak at 0.7477 and the 55-week ma at 0.7509.”
“Dips should find interim support at 0.7284 and this guards the 29th September low at 0.7171.”
The United Arab Emirates (UAE) Energy Minister Suhail al-Mazrouei said that it is “important to keep balance on the market” when asked if the OPEC and its allies should ramp up oil production more than what is planned.
This comes after Russian Energy Minister Alexander Novak met with his UAE’s counterpart earlier this week to discuss bilateral cooperation and the future of hydrogen.
Market reaction
WTI remains unfazed by the above comments, keeping its range around $80.50, higher by 0.56% on the day.
- DXY trades within a tight range near the 94.00 mark.
- US yields regain some traction and reverse recent losses.
- Initial Claims, producer Prices, Fedspeak next on tap.
The greenback, in terms of the US Dollar Index (DXY), attempts some consolidation in the lower end of the weekly range around the 94.00 neighbourhood.
US Dollar Index focused on data
The index looks to recover some ground following Wednesday’s strong pullback, always hanging on near the 94.00 zone.
In the meantime, yields in the belly of the curve and in the back end manage to reverse part of the recent weakness, while the short end still navigates the upper end of the range near 18-month highs, particularly following the latest release of US inflation figures (+5.4% YoY in September).
No surprises from the release of the FOMC Minutes on Wednesday, with members in general favouring the start of the tapering process in November and to be finished at some point in mid-2022. In addition, members mostly coincided that the threshold for further substantial progress had been reached.
In the docket, the usual weekly Claims are due seconded by Producer Prices and speeches by Atlanta Fed R.Bostic (voter, centrist), Richmond Fed T.Barkin (voter, centrist) and NY Fed J.Williams (permanent voter, centrist).
What to look for around USD
The index corrected sharply lower to the 94.00 mark after hitting new 2021 highs past 94.50 earlier on the week along with the move lower in US yields. Positive news from the debt-ceiling and inflation jitters sponsored the selloff in the bonds market seen in past sessions and propelled yields to fresh tops, lending extra legs to the buck at the same time. Looking beyond the immediate term, the dollar remains underpinned by markets’ adjustment to prospects for a “soon” start of the tapering process, probable rate hikes at some point during next year and the rising view that elevated inflation could last more than initially expected.
Key events in the US this week: Initial Claims (Thursday) – Retail Sales, flash Consumer Sentiment (Friday).
Eminent issues on the back boiler: Biden’s multi-billion Build Back Better plan. US-China trade conflict under the Biden’s administration. Tapering speculation vs. economic recovery. Debt ceiling debate. Geopolitical risks stemming from Afghanistan.
US Dollar Index relevant levels
Now, the index is losing 0.01% at 93.99 and a break above 94.56 (2021 high Oct.12) would open the door to 94.74 (monthly high Sep.25 2020) and then 94.76 (200-week SMA). On the flip side, the next down barrier emerges at 93.82 (20-day SMA) followed by 93.67 (monthly low Oct.4) and finally 92.98 (weekly low Sep.23).
A tight concentrate market and rising disruptions in the refined end amid low inventories are the major fundamental drivers behind the strong zinc market. In the view of strategists at ING, zinc prices could keep elevated.
Rising supply disruptions to refined zinc supply from Europe and China
“In case the power shortage issue lasts for longer, this raises the risks of further supply losses from both China, the world largest zinc producer, and Europe.”
“As mines in northern China start to head into winter hibernations, smelters stockpiling before winter only increase demand for concentrate in the short term. This also highlights the sticky tightness in the concentrate market.”
“Prices could stay elevated at least before the current power crisis dissipates.”
EUR/USD is correcting higher near-term. Karen Jones, Team Head FICC Technical Analysis Research at Commerzbank, expects the world’s most popular currency pair to test the downtrend at 1.1630.
RSI has diverged
“EUR/USD’s new low at 1.1522 was not confirmed by the daily RSI and the market is correcting higher very near-term.”
“Intraday rallies will find an accelerated downtrend at 1.1630, but key nearby resistance is the 1.1762 four-month downtrend.”
“Below 1.1522 lies the 50% retracement of the move from 2020 and the March 2020 high at 1.1492/95.”
“Key support is the previous downtrend (from 2008) which is now located at 1.1395.”
In light of the recent price action, USD/JPY could now attempt an advance to the area above 114.00 the figure in the next weeks.
Key Quotes
24-hour view: “We highlighted yesterday that ‘upward momentum is beginning to show tentative signs of slowing’. We added, ‘this coupled with still overbought conditions suggests that USD is unlikely to strengthen much further’ and we expected USD to ‘trade between 113.15 and 113.80’. Our view was not wrong even though USD traded within a slightly narrower range than expected (113.21/113.80). The price actions are viewed as part of an on-going consolidation. In other words, we continue to expect USD to trade sideways, albeit at a lower range of 113.10/113.75.”
Next 1-3 weeks: “On Tuesday (12 Oct, spot at 113.40), we highlighted that the impulsive surge suggests that further USD strength would not be surprising and that the next resistance is at 114.20. There is no change in our view for now even though overbought shorter-term conditions could lead to a couple of days of consolidation first. The USD strength is deemed intact as long as it does not breach 112.80 (‘strong support’ level was at 112.65 yesterday).”
- WTI prints gain following two days of consolidation on Thursday.
- Bulls require to break decisively above $80.50 to hold more gains.
- The momentum oscillator holds onto the overbought zone, with stretched buying conditions.
WTI prices continue to consolidate gains on Thursday in the European session. The supply-chain bottlenecks underpin the demand for crude oil. At the time of writing, WTI is trading at $80.51, up 0.60% for the day.
WTI daily chart
-637697886608676516.png)
On the daily chart, WTI has been in the continuous uptrend after crossing the 21-day Simple Moving Average (SMA) at $67.62 since August 27.
After testing the seven-year high at around $80.00, WTI looks exhaustive near these levels. To continue the upside, the price has to give a daily close above 80.50 to test Monday’s high of 81.28. WTI bulls will then keep their eyes on October 2014 high at $92.96.
Alternatively, if the prices move lower, they would look out for the $79.10 and the $76.60 horizontal support levels respectively, and then march 21-day SMA at $75.70.
WTI additional levels
According to advanced readings from CME Group for natural gas futures markets, open interest rose by around 15.5K contracts after five consecutive daily builds on Wednesday. Volume, instead, reversed two daily pullbacks in a row and dropped by around 6.8K contracts.
Natural Gas now targets $6.00
Prices of the MMBtu of natural gas extended the rebound on Wednesday amidst rising open interest, which is supportive of the continuation of the rebound at least in the very near term. That said, the commodity now targets the key barrier at the $6.00 mark per MMBtu ahead of a potential move to YTD highs near $6.50 (October 6).
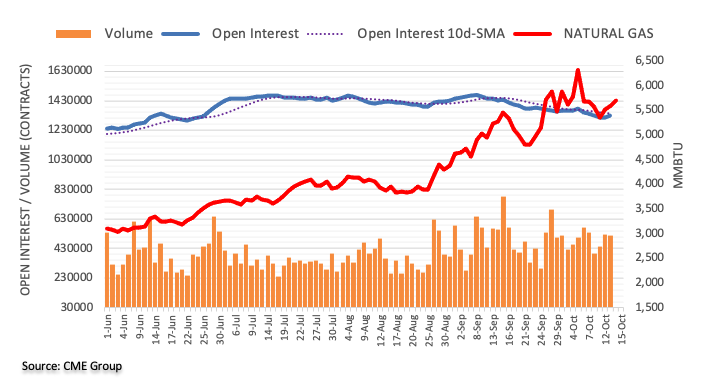
Gold price eases from monthly tops amid bets of earlier Fed rate hike. According to FXStreet’s Dhwani Mehta, XAU/USD’s additional upside hinges on a daily close above the 200-Daily Moving Average (DMA) at $1797.
Gold faces rejection at 200-DMA, will it manage to recapture it?
“Gold bulls now remain wary amid increasing calls for an earlier Fed rate hike. Traders look forward to a fresh batch of the US economic releases and Fedspeak for fresh trading opportunities in gold price while the Fed sentiment will continue to lead the way.”
“Going forward, any retracements will meet initial demand at the $1777 50-DMA resistance-turned-support, below which the 21-DMA at $1760 will come into play.”
“Daily closing above the critical resistance around $1796-$1799 is needed to unleash additional upside in gold price. That price zone is the confluence of the bearish 100 and 200-DMAs. The next relevant bullish target is envisioned near $1807-$1809, mid-September highs. If the latter gives way, then a fresh upswing towards the September highs of $1834 will be inevitable.”
Further upside is likely in NZD/USD on a breakout of the 0.7000 yardstick, noted FX Strategists at UOB Group.
Key Quotes
24-hour view: “Our expectation for NZD to consolidate yesterday was incorrect as it soared to 0.6968 before closing on a firm note at 0.6966 (+0.45%). Upward momentum has improved, albeit not by all that much. NZD could strengthen from here but any advance is unlikely to break the major resistance at 0.7000. Support is at 0.6955 followed by 0.6940.”
Next 1-3 weeks: “We have expected NZD to trade sideways within a 0.6875/0.7000 since Monday (11 Oct, spot at 0.6935). After the relatively strong rise yesterday (13 Oct), upward momentum is beginning to build but NZD has to close above 0.7000 before a sustained advance can be expected. The chance for NZD to close above 0.7000 is quite high and would continue to increase as long as NZD does not move below 0.6920 within these few days. Looking ahead, the next resistance above 0.7000 is at 0.7035.”
CME Group’s flash data for crude oil futures markets noted traders added around 18.2K contracts to their open interest positions no Wednesday, the second session in a row. On the other hand, volume shrank for the second straight session, this time by around 321.4K contracts.
WTI still looks to YTD highs above $82.00
Crude oil prices charted a doji-style session on Wednesday amidst rising open interest. While the commodity could enter into some consolidation phase in the very near term, further bouts of strength remain in the pipeline with WTI targeting the recent 2021 high at $82.15 (October 11).
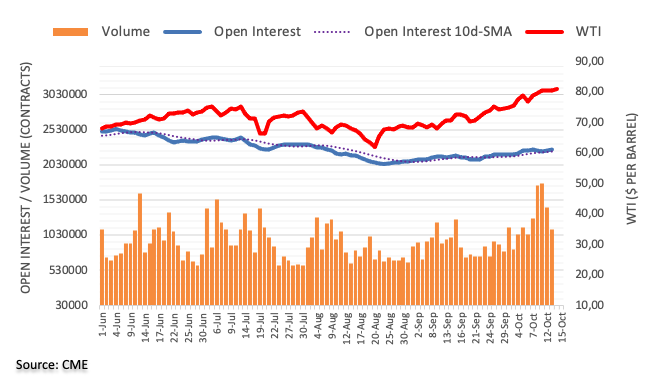
- GBP/USD pauses the upside momentum in the early European trading hours.
- Higher US T-yields undermine the demand for the US dollar.
- Sterling holds ground amid mixed economic data, Brexit optimism, and hawkish BOE.
The GBP/USD pair remains muted on Thursday. The pair consolidates gains, after testing the intraday’s high near 1.3672. At the time of writing, GBP/USD is trading at 1.3664, up 0.03% for the day.
The spot recorded nearly 90-pips movement in the previous session on the broad-based USD selling. The greenback retreated from its yearly highs around 94.50 post-US Consumer Price Index (CPI) readings, which came higher at 5.4% in September as widely anticipated. Furthermore, investors geared up for the Fed’s tapering as soon as November according to the minutes of the September FOMC meetings.
The US benchmark 10-year Treasury bond yields rebound near 1.55%, helping the greenback to hold 94.00 amid risk-off mood. It is worth noting that, S&P 500 Futures is trading at 4,370, up 0.34% for the day.
On the other hand, the British pound gains were limited after the data showed that the UK’s economy grew 0.4% in August amid expectations the Bank of England (BOE) will be hiking interest rates as soon as December. In addition to that, the UK’s Brexit Minister David Frost kept a softer stance at the European Union’s (EU) proposal to fix post-Brexit disruption in Northern Ireland, as the two sides prepared for fresh negotiations.
As for now, traders keep their focus on the Bank of England (BOE) Credit Condition Survey, US Initial Jobless Claims to gauge market sentiment.
GBP/USD additional levels
Cable’s upside could reach 1.3715 ahead of 1.3750 in the next weeks, suggested FX Strategists at UOB Group.
Key Quotes
24-hour view: “Our expectations for GBP to ‘weaken’ yesterday were wrong as it traded in a choppy manner before closing on a firm note at 1.3664 (+0.55%). While upward momentum has not improved by all that much, there is room for GBP to advance to 1.3695, possibly 1.3715. Any advance in GBP is unlikely to challenge the major resistance at 1.3750. Support is at 1.3640 followed by 1.3615.”
Next 1-3 weeks: “We have expected GBP to trade within a 1.3500/1.3680 range since early this week (see annotations in the chart below).GBP rose strongly yesterday and the advance has gathered momentum. From here, GBP is likely to head higher to 1.3715. A break of 1.3715 would shift the focus to 1.3750. Only a break of the ‘strong support’ (currently at 1.3595) would indicate that GBP is not ready to head higher.”
Open interest in gold futures markets reversed the previous drop and increased by around 16.7K contracts on Wednesday, the largest single-day build since May 10 considering flash data from CME Group. Volume, in the same line, went up for the second session in a row, now by around 134.7K contracts.
Gold targets $1,800 and above
Gold prices rose sharply on Wednesday and traded at shouting distance from the key $1,800 mark per ounce troy. The strong advance was on the back of rising open interest and volume and leaves the door open to the continuation of the recovery at least in the very near term, always with the target at $1,800 and beyond.
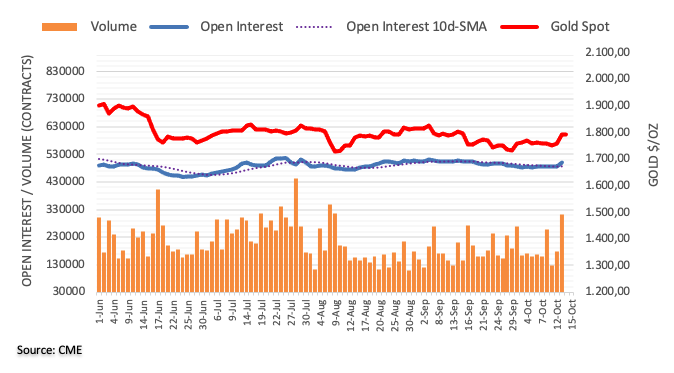
FX Strategists at UOB Group now believe EUR/USD could be headed towards the 1.1640 level in the near term.
Key Quotes
24-hour view: “The strong surge in EUR to a high of 1.1597 came as a surprise (we were expecting sideway-trading). Further gains are not ruled out but the major resistance at 1.1640 is unlikely to come into the picture (1.1620 is already quite a strong level). Support is at 1.1575 followed by 1.1560.”
Next 1-3 weeks: “Yesterday, EUR soared and took out our ‘strong resistance’ level at 1.1585 before closing higher by +0.56% (NY close of 1.1592), its biggest 1-day gain in 5 months. The break of the ‘strong resistance’ indicates that the weak phase that started 2 weeks ago (see annotations in the chart below) has ended. The rapid rise has gathered momentum quickly and EUR is likely trade with an upward bias towards 1.1640. Further advance is not ruled out but 1.1640 may not be easy to crack. The upward bias is deemed intact as long as EUR does not move below 1.1540 within these few days.”
The Bank of Japan (BOJ) monetary policy board member Asahi Noguchi is back on the wires now, via Reuters, commenting on the central bank’s policy outlook.
Key takeaways
BOJ must maintain pandemic-relief lending programmes as long as there is a risk of another wave of covid infections.
When withdrawing pandemic-relief support, must ensure the move does not hamper the BOJ effort to hit the 2% price goal.
BOJ may have little choice but to extend pandemic-relief support unless it becomes clear Japan’s economy can return to a pre-pandemic state.
developing story ...
- GBP/JPY continues its weekly gains on Thursday in the early European session.
- A daily break above 155.30 exposes June’s high at 155.96.
- Momentum oscillator support bullish momentum.
The GBP/JPY cross pushes higher on Thursday morning. The pair books the gains for the sixth straight session. At the time of writing, the GBP/JPY cross-currency pair is trading at 155.17, up 0.31% on the day.
GBP/JPY daily chart
-637697833671740046.png)
On the daily chart, the GBP/JPY cross currency pair has risen sharply after breaking the strong long-time resistance barrier near the 152.90-153.00 zone. Now, the descending trendline from May’s high at 156.07 exerts some downward pressure on the pair. If the price sustains the intraday high, it could easily move toward 156.07.
Furthermore, the Moving Average Convergence Divergence (MACD) indicator holds the overbought zone. Any uptick in the MACD would bring 2018 highs near 156.61 on the bull’s radar.
Alternatively, on the reverse side, the spot would meet the 154.40 horizontal support level and then Tuesday’s low at 153.68. The GBP/JPY bears would then approach toward the 153.00 psychological mark.
GBP/JPY daily chart
- Gold struggled to capitalize on the previous day’s strong rally to near one-month tops.
- Hawkish Fed expectations turned out to be a key factor that capped gains for the metal.
- Bulls now wait for a sustained move beyond the 100/200-day SMA confluence hurdle.
Gold witnessed some selling during the Asian session on Thursday and eroded a part of the previous day's strong rally to the highest level in about a month. The XAU/USD, which is seen as a hedge against inflation, benefitted after the US CPI report showed a continuous rise in inflationary pressures. Against the backdrop of last Friday's disappointing NFP print, the data aggravated fears about the return of stagflation. This, along with a broad-based US dollar weakness, provided a strong boost to the dollar-denominated commodity.
The greenback witnessed a typical 'buy the rumour, sell the fact' kind of a reaction and reversed its weekly gains to 13-month tops following the report. A further decline in the longer-dated US Treasury bond yields was seen as another factor that weighed heavily on the buck. That said, expectations for an early policy tightening by the helped limit any further losses for the USD. The minutes of the FOMC monetary policy meeting held on September 21-22 reaffirmed that the US central bank remains on track to begin tapering its bond purchases in 2021.
Moreover, a growing number of policymakers were worried that inflation could persist, forcing investors to bring forward the likely timing of a potential Fed rate hike move. The markets now seem to have started pricing in the possibility of the so-called lift-off in September 2022 and kept a lid on any further gains for the non-yielding yellow metal. The overnight momentum faltered near the very important 200-day SMA, just ahead of the $1,800 mark, which should now act as a key pivotal point and help determine the near-term trajectory for gold.
Market participants now look forward to the US economic docket, featuring the release of Producer Price Index (PPI) and Weekly Initial Jobless Claims later during the early North American session. This, along with the US bond yields and speeches by influential FOMC members, will influence the USD price dynamics. Apart from this, the broader market risk sentiment might also provide some impetus and allow traders to grab short-term opportunities around gold.
Technical levels to watch
Bulls might now wait for a sustained move beyond the $1,796-99 confluence region, comprising of 100-day and 200-day SMAs before placing fresh bets. Some follow-through buying beyond the $1,806 area will reaffirm the positive outlook and lift the XAU/USD back towards the $1,818-20 intermediate hurdle en-route the $1,832-34 heavy supply zone.
On the flip side, any further decline is likely to find decent support near the $1,775 horizontal zone. Sustained weakness below might prompt some technical selling and turn gold vulnerable to accelerate the fall towards the $1,763-62 support zone. The next relevant support is pegged near the $1,750 region, which if broken decisively will shift the near-term bias back in favour of bearish traders.
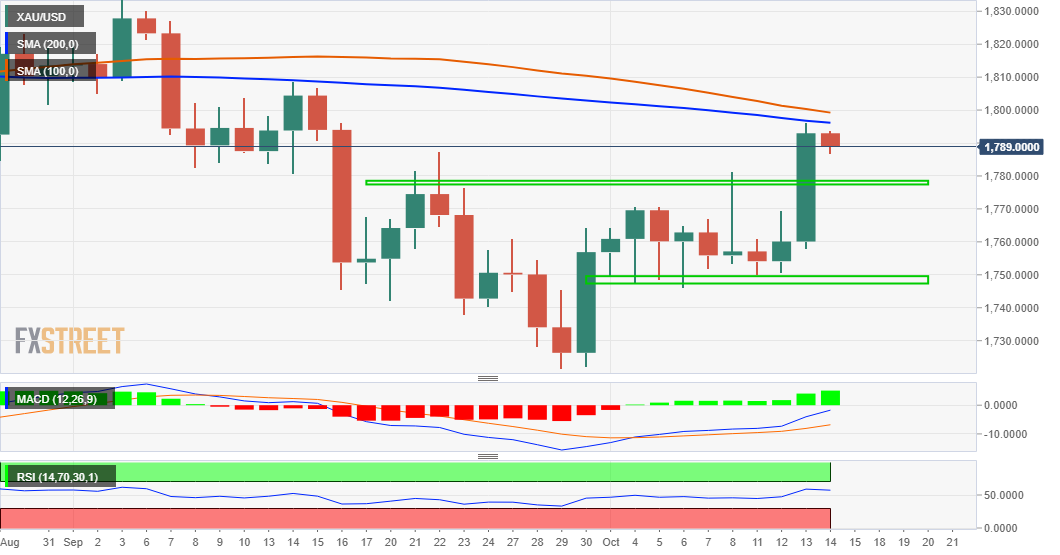
The People’s Bank of China (PBOC) Governor Yi Gang reiterated on Thursday, the central bank will make prudent monetary policy flexible, targeted, reasonable and appropriate.
China's inflation is moderate overall, Yi added.
His comments come after the country’s factory-gate inflation climbed to 10.7% YoY, the highest level in 25 years. China’s Consumer Price Index rose just 0.7% YoY, missing expectations.
Market reaction
Amid these comments and the PBOC’s strong yuan fix, USD/CNY remains unperturbed.
The spot currently trades at 6.4394, adding 0.21% on a daily basis.
- USD/TRY continues to march higher near 9.200, new records highs.
- Turkish President sacks three Central Bank’s policymakers in a sudden way.
- US Dollar Index holds near 94.00, licking post-CPI wounds.
USD/TRY posts gains for the fifth straight session on Thursday. The cross-currency pair peaked at all times at 9.188 following the previous session’s upside momentum. At the time of writing, USD/TRY is trading at 9.151, up 0.70% for the day.
The Turkish lira fell to its lowest level against the greenback following President Recep Tayyip Erdogan recent action. Erdogan abruptly removed deputy Central Bank Governors Semih Tumen, Ugur Namik Kucuk, and Central Bank’s Monetary Policy (MPC) member Abdullah Yavas in the early hours. The members were replaced by Taha Cakmak as a deputy Central Bank Governor and Yusuf Tuna as an MPC member. The currency has weakened about 19% so far in 2021 amid concerns about the central bank credibility. With inflation, more than 19%, the Turkish Central bank slashed its key interest rates by 100 basis points to 18% following President Tayyip Erdogan’s calls for lower rates.
On the other hand, the greenback retreats from its yearly highs above 94.50 as investors discounts higher US CPI readings and the FOMC insights on Fed’s tapering timeline.
As for now, traders are bracing for the US Initial Jobless Claims to gain fresh trading impetus.
- EUR/USD consolidates the upside before the next leg higher, US data eyed.
- The US dollar licks hotter US inflation-inflicted wounds amid an upbeat market mood.
- FOMC minutes point to November taper, US CPI brings forward rate hike expectations.
EUR/USD is trading close to 1.1600, gathering strength for the next push higher. The US dollar licks hotter US inflation-inflicted wounds amid an upbeat market mood.
The main currency pair holds the recent advance, currently trading 0.05% higher at 1.1595, as the bulls catch a breather after Wednesday’s 70-pips surge. The rebound in the US Treasury yields across the curve helps cushion the downside in the greenback, capping EUR/USD’s upside for now.
Further, the gains could remain limited, as investors will continue to weigh in the divergent monetary policy outlooks between the Fed and ECB.
Hotter US CPI downs the dollar
On Wednesday, the major staged an impressive comeback from near 15-month lows of 1.1524 and briefly tapped the 1.1600 level.
The pair surged after the hotter-than-expected US Consumer Price Index (CPI) brought forward the Fed’s rate hike expectations and triggered a sharp sell-off in the longer-dated Treasury yields alongside a dollar squeeze. The US annualized CPI rose to 5.4% YoY in September vs. 5.3% expected while the Core CPI steadied at 4% YoY.
The spot extended the break higher on the FOMC minutes release, as markets resorted to ‘sell the fact’ trading in the dollar after the September meeting’s minutes revealed that the Fed officials are prepared for a gradual taper, which is expected to “in either mid-November or mid-December.
Looking ahead, the pair will await the US Producers Price Index (PPI), the weekly Jobless Claims and Fedspeak for fresh trading impetus. In the meantime, the Fed sentiment and dynamics in the yields and the buck will be closely followed.
EUR/USD: Technical levels to consider
- NZD/USD gained traction for the second straight day and climbed back closer to monthly tops.
- The risk-on mood acted as a tailwind for the perceived riskier kiwi amid a subdued USD demand.
- Hawkish Fed expectations should help limit the USD losses and keep a lid on any further gains.
The NZD/USD pair maintained its bid tone through the Asian session and was last seen hovering near monthly tops, around the 0.6975-80 region.
A combination of supporting factors assisted the NZD/USD pair to build on the previous day's post-US CPI bounce from the 0.6910 support and gain traction for the second consecutive session on Thursday. The prevalent risk-on mood – as depicted by a generally positive tone around the equity markets – benefitted the perceived riskier kiwi amid a subdued US dollar price action.
The greenback witnessed a typical 'buy the rumour, sell the fact' kind of a reaction on Wednesday and reversed its weekly gains to 13-month tops following the release of US consumer inflation figures. The headline US CPI for September rose 0.4%, pushing the yearly rate to 5.4%. The readings were slightly higher than market expectations, though did little to impress the USD bulls.
Investors still seem aligned with the Fed's transitory inflation narrative, which was evident from a further decline in the longer-dated US Treasury bond yields. This, in turn, was seen as another factor that weighed on the buck. That said, expectations for an imminent Fed taper announcement and prospects for an earlier than anticipated interest rate hike helped limit the USD losses.
The minutes of the FOMC monetary policy meeting held in September showed that the Fed remains on track to begin tapering its bond purchases later this year. Moreover, a growing number of policymakers were worried that inflation could persist, forcing investors to bring forward the likely timing of a potential rate hike to September 2022 from December 2022 already priced in.
This makes it prudent to wait for a strong follow-through buying before placing aggressive bullish bets around the NZD/USD pair and confirming a near-term bullish breakout. Market participants now look forward to the US economic docket, featuring the release of Producer Price Index (PPI) and the usual Weekly Initial Jobless Claims data later during the early North American session.
This, along with the US bond yields, will influence the USD price dynamics. Apart from this, traders might further take cues from the broader market risk sentiment for some short-term opportunities around the NZD/USD pair.
Technical levels to watch
“A weak yen is beneficial for the economy, as it boosts competitiveness,” Kozo Yamamoto, a senior member of new Prime Minister Fumio Kishida's government party, said on Thursday.
Additional quotes
“Govt must compile stimulus package worth at least 32 to 33 trillion yen and funded mostly by long-term JGBs.”
“Capital gains tax must eventually be raised, debate on details to take at least until fiscal 2023.”
“BOJ should aggressively buy JGBs to help fund big fiscal spending.”
“Must move swiftly towards issuing central bank digital currency to protect sovereignty over yen.”
“Issuing CBDC requires BOJ law revision, an opportunity to add job growth to BOJ mandate.”
“Weak yen is beneficial for the economy, boosts Japan’s global competitiveness.”
Market reaction
USD/JPY is hitting fresh highs on these comments, adding 0.25% on the day at 113.54, as of writing.
Further comments are flowing in from the Bank of Japan (BOJ) monetary policy board member Asahi Noguchi, as he now touches upon the economic outlook.
Key takeaways
See no change in price trend.
Japan's economic recovery will become clearer at the end of the year and onwards as COVID-19 pain eases.
Japan's economy is picking up, led by overseas economies.
more to come ...
- A combination of factors assisted USD/JPY to regain positive traction on Thursday.
- Hawkish Fed expectations helped the USD to stall the post-US CPI corrective decline.
- The risk-on impulse undermined the safe-haven JPY and exerted additional support.
The USD/JPY pair climbed back above mid-113.00s during the Asian session and reversed a major part of the previous day's profit-taking slide from multi-year tops.
The US dollar witnessed aggressive selling on Wednesday and erased its weekly gains to 13-month tops amid the post-US CPI slide in the longer-dated US Treasury bond yields. The headline US CPI for September rose 0.4% in September as against 0.3% anticipated and lifted the yearly rate to 5.4%, again beating expectations for a reading of 5.3%. Investors, however, seem aligned with the Fed's transitory inflation narrative, which, in turn, dragged the US bond yields lower.
Nevertheless, the US CPI report reaffirmed market expectations for a potential interest rate hike in 2022. Moreover, the minutes of the latest FOMC monetary policy meeting held in September showed that the US central bank remains on track to begin tapering its bond purchases later this year. Apart from this, a modest rebound in the US bond yields acted as a tailwind for the greenback and assisted the USD/JPY pair to regain some positive traction on Thursday.
On the other hand, a generally positive tone around the equity markets undermined the safe-haven Japanese yen and was seen as another factor that exerted additional support to the USD/JPY pair. The fundamental backdrop seems tilted firmly in favour of bullish trades and the emergence of fresh buying reaffirms the positive outlook. That said, overbought RSI on short-term charts warrants some caution before positioning for any further appreciating move, at least for now.
Market participants now look forward to the US economic docket, featuring the release of the Producer Price Index (PPI) and the usual Weekly Initial Jobless Claims data. This, along with the US bond yields, will influence the USD price dynamics. Traders might further take cues from the broader market risk sentiment for some short-term opportunities around the USD/JPY pair.
Technical levels to watch
| Raw materials | Closed | Change, % |
|---|---|---|
| Brent | 83.4 | 0.23 |
| Silver | 23.05 | 2.19 |
| Gold | 1792.588 | 1.82 |
| Palladium | 2101.36 | 2.88 |
The US remains optimistic about a resolution of its trade dispute with the European Union (EU) over tariffs on steel and aluminum before the end of October, Reuters reported on Wednesday, citing a source familiar with the discussions.
The source said, “we’re hopeful we can reach an agreement by the end of the month.”
This comes after US Trade Representative Katherine Tai met on Tuesday with EU trade chief Valdis Dombrovskis.
Market reaction
EUR/USD is trading virtually unchanged on the day, just below 1.1600, consolidating the previous surge triggered by the broad sell-off in the US dollar.
Analysts at Goldman Sachs are out with their expectations on the Fed’s tapering, which is likely to begin in the middle of the next month.
Key quotes
“Expecting a formal announcement of taper at the November FOMC.”
“Tapering to begin in the middle of November at a US$15 billion monthly pace.”
“Taper to conclude in the middle of 2022.”
Related reads
- FOMC Minutes: ''A gradual tapering process would likely be appropriate''
- US September CPI: Inflation supports a November taper
Reserve Bank of New Zealand (RBNZ) Deputy Governor Bascand made some comments on the housing sector and economic recovery, in his latest speech early Thursday.
Key quotes
“Heightened uncertainties remain, COVID-19 still poses risks.”
“To take action as needed to ensure regulated financial institutions' balance sheets are resilient to future stresses in the economy and financial system.”
“We remain in a state of heightened uncertainty; covid still poses risks to the economic recovery and we assess that house prices are at an unsustainable level.”
“Institutions should avoid being over-exposed to vulnerabilities that could arise from excessive debt in the household or business sectors.”
Market reaction
The downbeat remarks fail to have any impact on the kiwi dollar, as it continues to benefit from the US dollar’s weakness amid the risk-on market mood.
NZD/USD is trading at 0.6971, up 0.14% on the day.
- AUD/USD struggled to capitalize on its modest intraday uptick to over one-month tops.
- The mixed Australian jobs report, softer Chinese CPI acted as a headwind for the pair.
- A slight USD rebound also exerted some pressure; the risk-on mood helped limit losses.
The AUD/USD pair surrendered modest Asian session gains to over one-month tops and was last seen trading in the neutral territory, around the 0.7375 region.
The pair built on the previous day's post-US CPI positive move and gained some follow-through traction during the early part of the trading action on Thursday. The momentum pushed the AUD/USD pair to the highest level since September 10, albeit lacked any follow-through and faltered just ahead of the 0.7400 mark.
The Australian dollar was undermined by mixed domestic employment details, showing that the number of employed people decreased by 138K in September. This comes on the back of the previous month's decline of 146.3K and was accompanied by a modest uptick in the unemployment rate to 4.6% from 4.5% recorded in August.
Adding to this, softer Chinese CPI print, coming in at 0.7% YoY rate for September, further acted as a headwind for the China-proxy aussie amid a modest US dollar uptick. That said, a generally positive tone around the equity markets extended some support to perceived riskier currencies and helped limit the downside.
Hence, it will be prudent to wait for a strong follow-through selling before confirming that the recent move up witnessed over the past two weeks or so has run out of steam. Market participants now look forward to the US economic docket, featuring the release of Weekly Jobless Claims and PPI figures, for a fresh impetus.
Technical levels to watch
On Wednesday, there was news that the EU released its plan for a reduction of post-Brexit checks on goods which is news that has been received well by sterling markets.
GBP/USD is under demand from both a Brexit and a central bank input with rates expected to be raised imminently by the Bank of England. and medicines arriving into Northern Ireland from the rest of the UK.
The BBC reported that Northern Ireland has a special Brexit deal that keeps it in the EU's single market for goods and allows free-flowing trade with the EU.
''But it means goods arriving from Britain face checks and controls.
The UK government said it is studying the detail of the EU's proposals.
The new plan, which seeks to calm a long-running dispute over a key part of the Brexit agreement, would remove about 80% of spot checks, the EU said.
The EU said customs paperwork would also be cut by 50%.''
However, one key sticking point remains – UK Brexit Minister Lord Frost’s demand to rewrite the Protocol to at least dilute the role of the European Court of Justice (ECJ) in overseeing the rules. If Lord Frost does not back down on this, an EU official said it will be “a very big gap between the ideas we are putting on the table today and what the UK Government is asking for.''
GBP/USD weekly chart
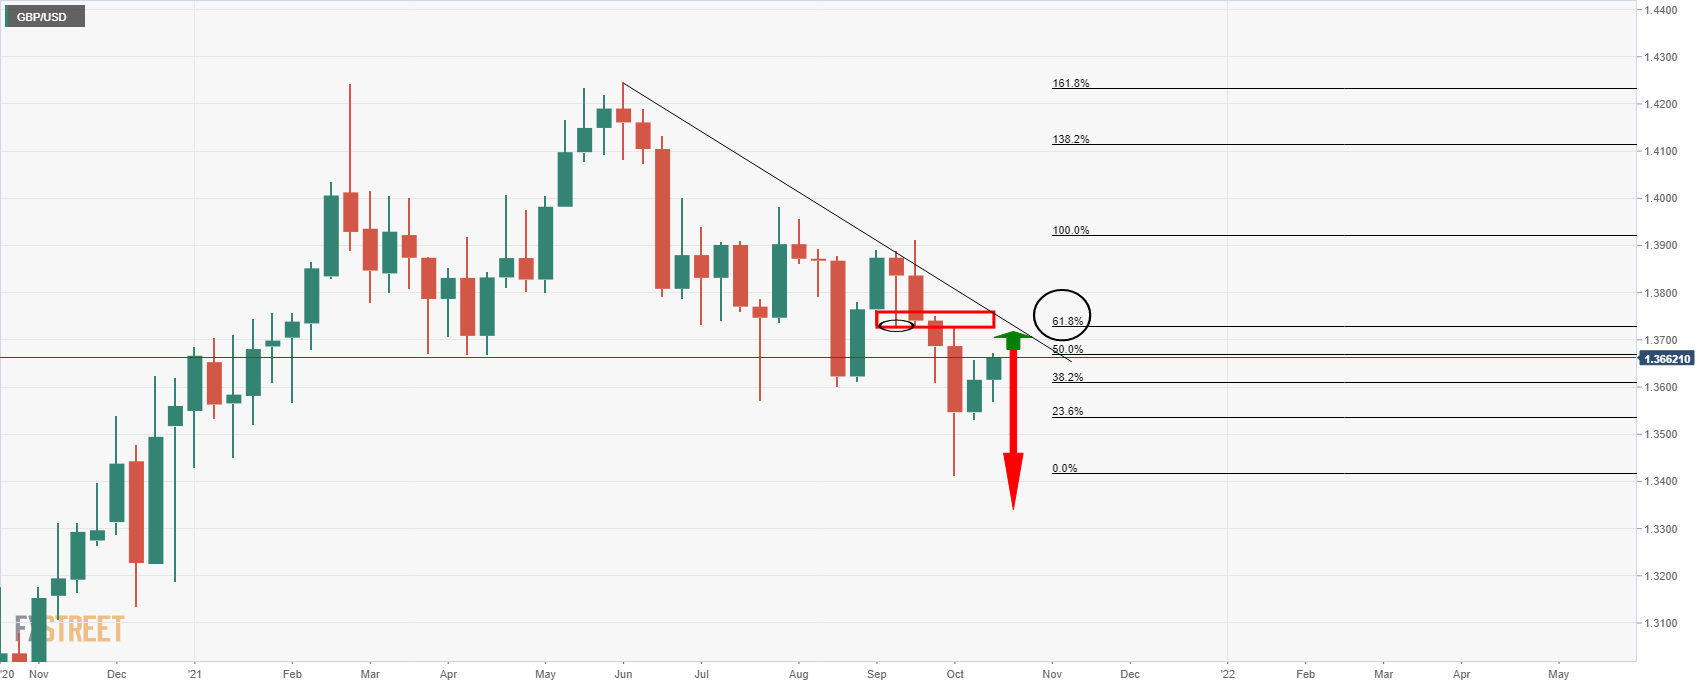
From a weekly perspective, considering the price dropped below all of the support structures which it is now testing again as resistance, the bias remains bearish. A correction to the trendline resistance and a 61.8% Fibonacci is underway, but bears are likely preparing to feed at a discount.
“A reduction in monetary easing as seen in other central banks won't be an option for Japan,” the Bank of Japan (BOJ) monetary policy board member Asahi Noguchi said in a statement on Thursday.
Additional headlines
2% inflation target has been a high hurdle to achieve as it takes longer to meet than expected.
Still thinks it's possible to achieve 2% inflation target.
Policy mix of fiscal and monetary policies has achieved a certain success.
Expect to take a long time to achieve 2% inflation target, what's most important is to patiently continue current monetary easing.
USD/JPY flirts with 113.50
USD/JPY is holding the higher ground, flirting with 113.50, up 0.23% on the day.
- USD/CHF grinds lower on Thursday in the Asian session.
- Lower US Treasury yields pull US dollar near 94.00.
- Swiss franc gains limited on risk-on sentiment.
The USD/CHF pair edges lower on Thursday in the Asian session. The pair fell from the high above 0.9300 in the US session in more than 70-pip movement. At the time of writing, USD/CHF is trading at 0.9235, down 0.05% for the day.
The move was sponsored by the sell-off in the greenback. Investors digested higher US Consumer Price Index (CPI) and insights of the FOMC minutes. The US CPI edged up 5.4% in September, beating market expectations of 5.3%. In addition to that, the minutes from the September FOMC meeting suggested that the policymakers on the course of the gradual tapering process from mid-November that should be concluded around the middle of 2022.
Meanwhile, US Federal Reserve Governor Michelle Bowman also supported the beginning of the withdrawal of some of the US central bank’s crisis-era support for the economy as soon as November. The greenback remained unfazed by the comments.
As for now, traders are looking for Swiss Producer and Import Prices, US Producer Price Index (PPI), and US Initial Jobless Claims to take fresh trading insight.
USD/CHF additional levels
National Bureau of Statistics of China has released China's Consumer Price Index and Producer Price Index that rose the fastest pace since 1995.
Chinese CPI (Y/Y) Sep: 0.7% (exp 0.8%; prev 0.8%).
Chinese PPI (Y/Y) Sep: 10.7% (exp 10.5%; prev 9.5%).
AUD/USD is currently under pressure following a mixed set of data, both domestically and in China. At the time of writing, AUD/USD is flat on the day at 0.7380.
About the CPI data
The Consumer Price Index is released by the National Bureau of Statistics of China. It is a measure of retail price variations within a representative basket of goods and services. The result is a comprehensive summary of the results extracted from the urban consumer price index and rural consumer price index. The purchase power of the CNY is dragged down by inflation.
The CPI is a key indicator to measure inflation and changes in purchasing trends. A substantial consumer price index increase would indicate that inflation has become a destabilizing factor in the economy, potentially prompting The People’s Bank of China to tighten monetary policy and fiscal policy risk. Generally speaking, a high reading is seen as positive (or bullish) for the CNY, while a low reading is seen as negative (or Bearish) for the CNY.
In recent trade today, the People’s Bank of China (PBOC) set the yuan (CNY) at 6.4414, the strongest since Sep 16, vs. the previous fix of 6.4612 and the prior close of 6.4285.
About the fix
China maintains strict control of the yuan’s rate on the mainland.
The onshore yuan (CNY) differs from the offshore one (CNH) in trading restrictions, this last one is not as tightly controlled.
Each morning, the People’s Bank of China (PBOC) sets a so-called daily midpoint fix, based on the yuan’s previous day closing level and quotations taken from the inter-bank dealer.
- USD/INR has pulled back from daily resistance and bears are in control.
- The price is en-route for the 75 figure and the 38.2% Fibo just ahead of it.
As per the prior day's analysis, USD/INR Price News: Rupee edges lower into critical resistance, whereby the price was projected to correct, the Rupee has indeed firmed and the bears are hunting down a test to 75 the figure.
USD/INR prior analysis
-637696866727985348.png)
USD/INR live market update
-637697705812492045.png)
As illustrated, the price is moving below the daily highs and away from resistance. This leaves prospects of a run towards the 75 figure and first, a test of the 38.2% Fibonacci retracement level for the coming days.
- AUD/USD prints fresh daily gains on Thursday in the initial Asian session.
- The US Dollar Index breaks 94.00 amid risk-on sentiment.
- Mixed employment data, China’s inflation data, and risk-on mood aid the Aussie gains.
AUD/USD continues with the previous session’s gains amid USD's across the board sell-off. The pair recorded a rally of nearly 60-pips in the US session. At the time of writing, AUD/USD is trading at 0.7391, up 0.18% for the day.
The US Dollar Index (DXY), which tracks the performance of the greenback against its six major rivals fell briefly below 94.00 for the first time since October 6. Investors digested a combination of factors in higher US CPI, the FOMC minutes and upbeat China’s trade data. It is worth noting that S&P 500 Futures are trading at 4,355.25, up 0.33% for the day.
On the other hand, the Aussie pauses the upside momentum following the mixed economic data. The Unemployment Rate in Australia increased 4.60% in September from 4.50 in the previous month whereas Employment in Australia decreased by 138000 in September. The Full-Time Employment came higher at 26700.
Meanwhile, the rating agency Fitch revised its outlook on Australia’s “AAA” rating to stable from negative on October 13.
As for now, traders await China’s Inflation data, US Producer Price Index, and Initial Jobless Claims to gauge the market sentiment.
AUD/USD additional levels
Australia’s labour force survey for September has been released as follows:
- Australia Sept Employment -138.0k s/adj (Reuters poll: -137.5k).
- Australia Sept Unemployment rate +4.6 pct, s/adj (Reuters poll: +4.8).
- Australia Sept Full Time Employment +26.7k s/adj.
- Australia Sept Participation Rate +64.5 pct, s/adj (Reuters poll: +64.7 pct).
AUD/USD implications
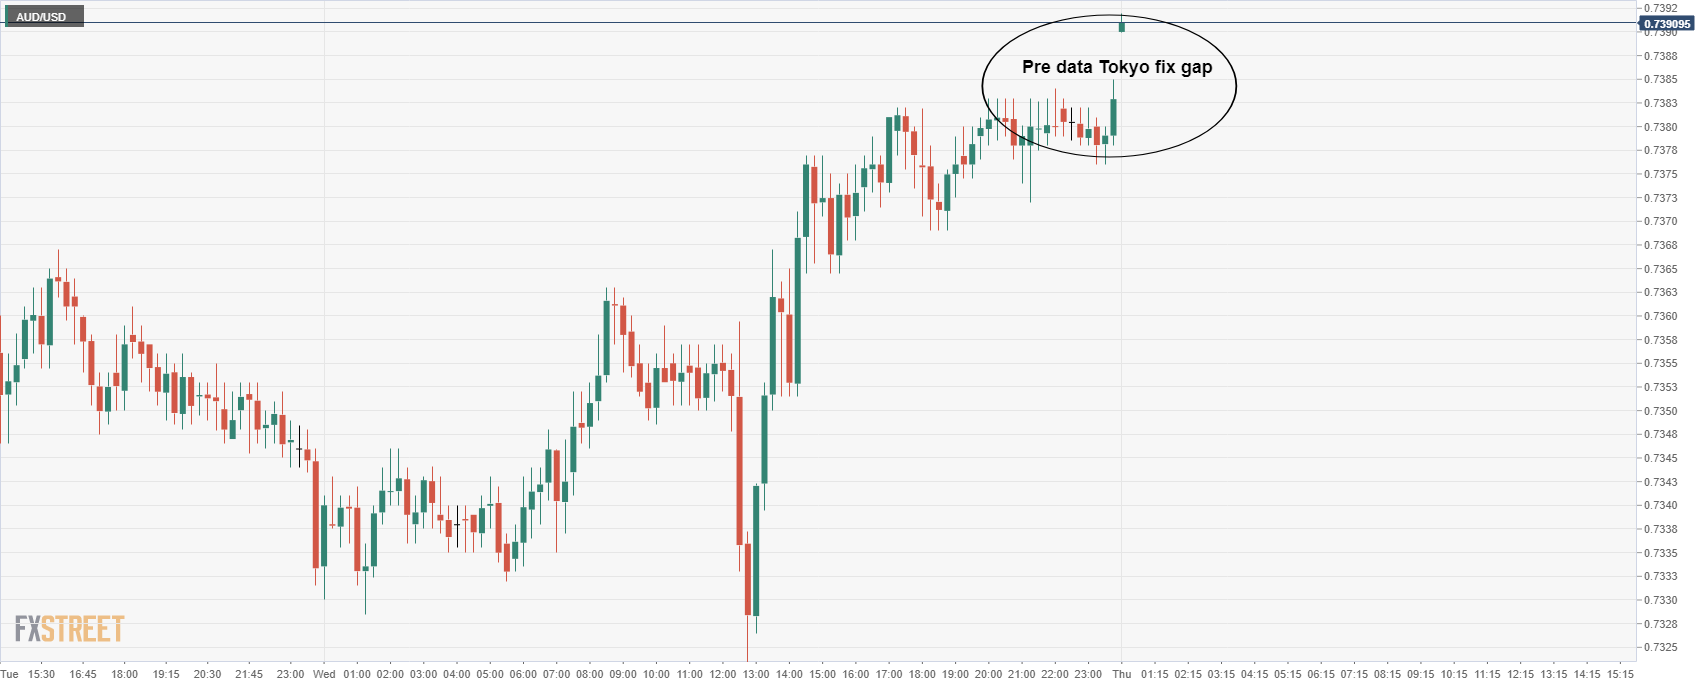
On an hourly basis, the price was meeting a meanwhile resistance and the bullish impulse had been decelerating. However, a pre-data spike in the price dissolved the prospects of an imminent retracement although the downside could come back into play following the miss in the headline and the Unemployment Rate worse than the prior report. With that being said, the Participation Rate is likely to blame on that front. For now, the price is consolidated.
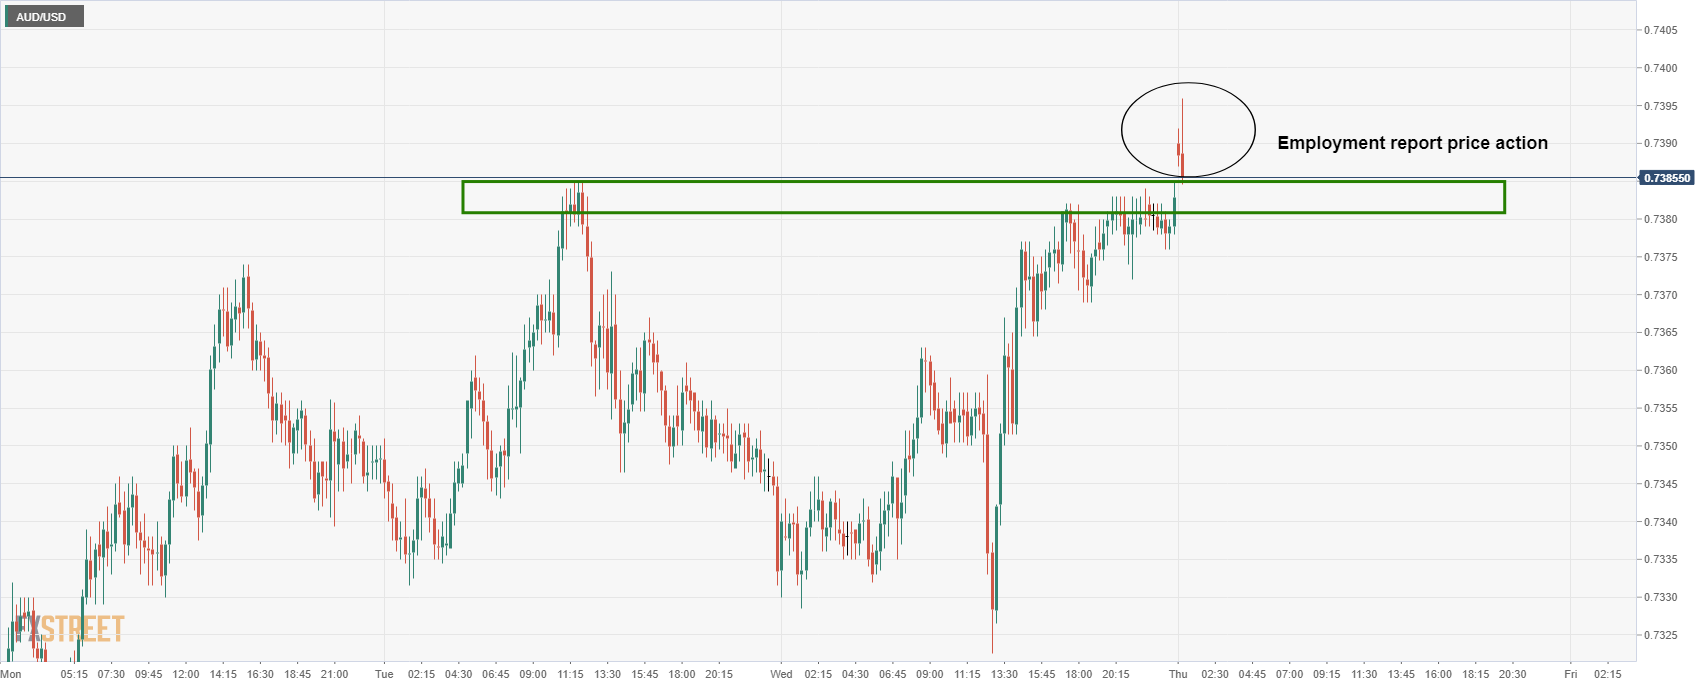
Looking deeper into the data, what is notable is that the number of people at work has recovered almost back to pre-pandemic levels which is encouraging.
However, from a more in-depth technical analysis, should the 0.74 handle cap, the price could flip back in a 50% mean reversion towards 0.7310 and the neckline of the current harmonic W-formation on the daily chart as follows:
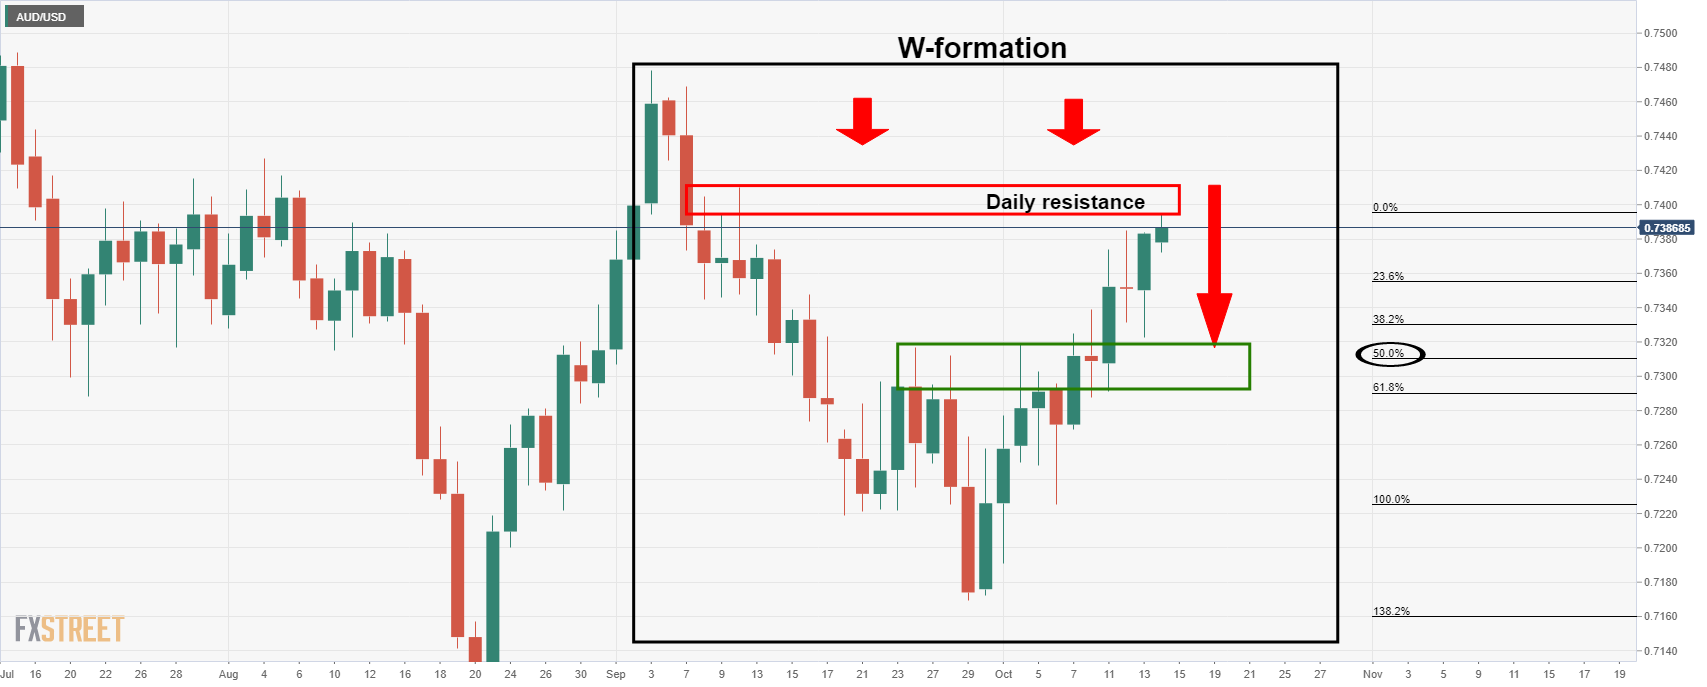
There is more detail on the risks relating to Evergrande and China and the implications for Australia's economy in the following article: AUD/USD retains second place on the leader board ahead of key jobs data
Key Notes
- Australian Employment Preview: Significant fall in jobs already priced-in? AUD has room to rise
- Forex Today: Falling yields spur a dollar sell-off
- AUD/USD retains second place on the leader board ahead of key jobs data
About the Employment Change
The Employment Change released by the Australian Bureau of Statistics is a measure of the change in the number of employed people in Australia. Generally speaking, a rise in this indicator has positive implications for consumer spending which stimulates economic growth. Therefore, a high reading is seen as positive (or bullish) for the AUD, while a low reading is seen as negative (or bearish).
About the Unemployment Rate
The Unemployment Rate released by the Australian Bureau of Statistics is the number of unemployed workers divided by the total civilian labour force. If the rate hikes indicate a lack of expansion within the Australian labour market. As a result, a rise leads to weaken the Australian economy. A decrease of the figure is seen as positive (or bullish) for the AUD, while an increase is seen as negative (or bearish).
| Time | Country | Event | Period | Previous value | Forecast |
|---|---|---|---|---|---|
| 00:00 (GMT) | Australia | Consumer Inflation Expectation | October | 4.4% | |
| 00:00 (GMT) | U.S. | FOMC Member Bowman Speaks | |||
| 00:30 (GMT) | Australia | Changing the number of employed | September | -146.3 | -137.5 |
| 00:30 (GMT) | Australia | Unemployment rate | September | 4.5% | 4.8% |
| 01:30 (GMT) | China | PPI y/y | September | 9.5% | 10.5% |
| 01:30 (GMT) | China | CPI y/y | September | 0.8% | 0.9% |
| 04:30 (GMT) | Japan | Industrial Production (YoY) | August | 11.6% | |
| 04:30 (GMT) | Japan | Industrial Production (MoM) | August | -1.5% | |
| 06:30 (GMT) | Switzerland | Producer & Import Prices, y/y | September | 4.4% | |
| 08:00 (GMT) | France | IEA Oil Market Report | |||
| 10:10 (GMT) | United Kingdom | MPC Member Tenreyro Speaks | |||
| 12:30 (GMT) | Canada | Manufacturing Shipments (MoM) | August | -1.5% | 0.5% |
| 12:30 (GMT) | U.S. | Continuing Jobless Claims | October | 2714 | 2675 |
| 12:30 (GMT) | U.S. | Initial Jobless Claims | October | 326 | 319 |
| 12:30 (GMT) | U.S. | PPI excluding food and energy, m/m | September | 0.6% | 0.5% |
| 12:30 (GMT) | U.S. | PPI excluding food and energy, Y/Y | September | 6.7% | 7.1% |
| 12:30 (GMT) | U.S. | PPI, y/y | September | 8.3% | 8.7% |
| 12:30 (GMT) | U.S. | PPI, m/m | September | 0.7% | 0.6% |
| 14:00 (GMT) | U.S. | FOMC Member Bostic Speaks | |||
| 15:00 (GMT) | U.S. | Crude Oil Inventories | October | 2.346 | 0.14 |
| 17:00 (GMT) | U.S. | Fed Barkin Speech | |||
| 17:00 (GMT) | U.S. | FOMC Member Williams Speaks | |||
| 18:00 (GMT) | U.S. | Federal budget | September | -171 | |
| 21:30 (GMT) | New Zealand | Business NZ PMI | September | 40.1 |
| Pare | Closed | Change, % |
|---|---|---|
| AUDUSD | 0.73787 | 0.38 |
| EURJPY | 131.335 | 0.3 |
| EURUSD | 1.15971 | 0.59 |
| GBPJPY | 154.655 | 0.23 |
| GBPUSD | 1.36557 | 0.55 |
| NZDUSD | 0.69632 | 0.51 |
| USDCAD | 1.24366 | -0.19 |
| USDCHF | 0.92348 | -0.68 |
| USDJPY | 113.24 | -0.31 |
- EUR/USD remains muted in the early Asian session on Thursday.
- The pair consolidates after posting a 70-pips upside movement in the previous day.
- Price trades below 1.1600 since October 6, MACD trades in the oversold zone.
EUR/USD edges higher in a quiet session on Thursday. The pair rose near 1.1600 in the US session following a broad-based USD selling. At the time of writing, EUR/USD is trading at 1.1595, up 0.02% for the day.
EUR/USD daily chart
-637697667957806224.png)
On the daily chart, the EUR/USD pair has started the October series on a lower note while testing the yearly lows around 1.1524 this Tuesday. The spot already trades below the 21-day Simple Moving Average (SMA) at 1.1638, indicating a downside risk. Nevertheless, the previous session’s single-day gain defies the four-session downward journey of the pair.
Having said that, if the price sustains intraday high, it could continue to register more gains. In doing so, the first upside target would be the 1.1630 horizontal resistance level followed by the high of September 29 at 1.1690. The Moving Average Convergence Divergence (MACD) indicator trades in the oversold zone, any uptick could mean the 1.1750 for the EUR/USD bulls.
Alternatively, if the price reverses direction, the EUR/USD bears would once again dominate the trend with their eyes on October, 1 low at 1.1530. Next, the market participants would test the 1.1550 horizontal support level. A break below the mentioned level will open the door below the yearly lows of 1.1524.
EUR/USD additional levels
Reuters reported that the Federal Reserve Governor Michelle Bowman on Wednesday said she would be "very comfortable" with beginning to withdraw some of the US central bank's crisis-era support for the economy as soon as next month, citing her worries about inflation and asset bubbles.
"I am mindful that the remaining benefits to the economy from our asset purchases are now likely outweighed by the potential costs," Bowman said in remarks prepared for delivery to South Dakota State University.
Key comments
Very comfortable with starting to taper bond buys this year, preferably in November.
Particularly concerned that asset purchases are pushing up valuations, or continued easy Fed policy poses risks to inflation expectations.
The benefits of Fed's asset purchases are now likely outweighed by costs.
If the expansion continues as expected, will support a pace of tapering that would end purchases by the middle of 2022.
Expects steady progress toward fed's inflation, employment goals in coming months.
Fed's tools not well suited to addressing labour supply issues.
She does not expect employment to fully return to pre-pandemic levels any time soon, for reasons unrelated to monetary policy.
Inflation readings will step down as supply bottlenecks are resolved.
Material risk that supply-related pricing pressures could last longer than expected.
Wage increases, other investments in employees potentially add to inflationary pressures.
Some bankers citing concerns about possible house price bubble, risks to financial stability.
If elevated inflation readings continue, may see an imprint on longer-run inflation expectations.
Anchoring inflation expectations are an important condition for meeting monetary policy goals.
Market implications
The greenback was recovering in the US sessions from the lows of the day on the release of the Fed minutes. Prior to those, the US dollar had eased back from a one-year high as longer-dated Treasury yields fell after US inflation data, despite it showing that prices rose solidly in September, advancing expectations for Federal Reserve tightening.
However, the US dollar has been ripe for correction considering how far it has come in just a couple of weeks, rising some 1.7% and running into a wall of resistance as per the Sep 2020 highs. The taper is already well priced in, so the greenback needs a fresh catalyst to keep the bullish trend alive.
US dollar monthly chart
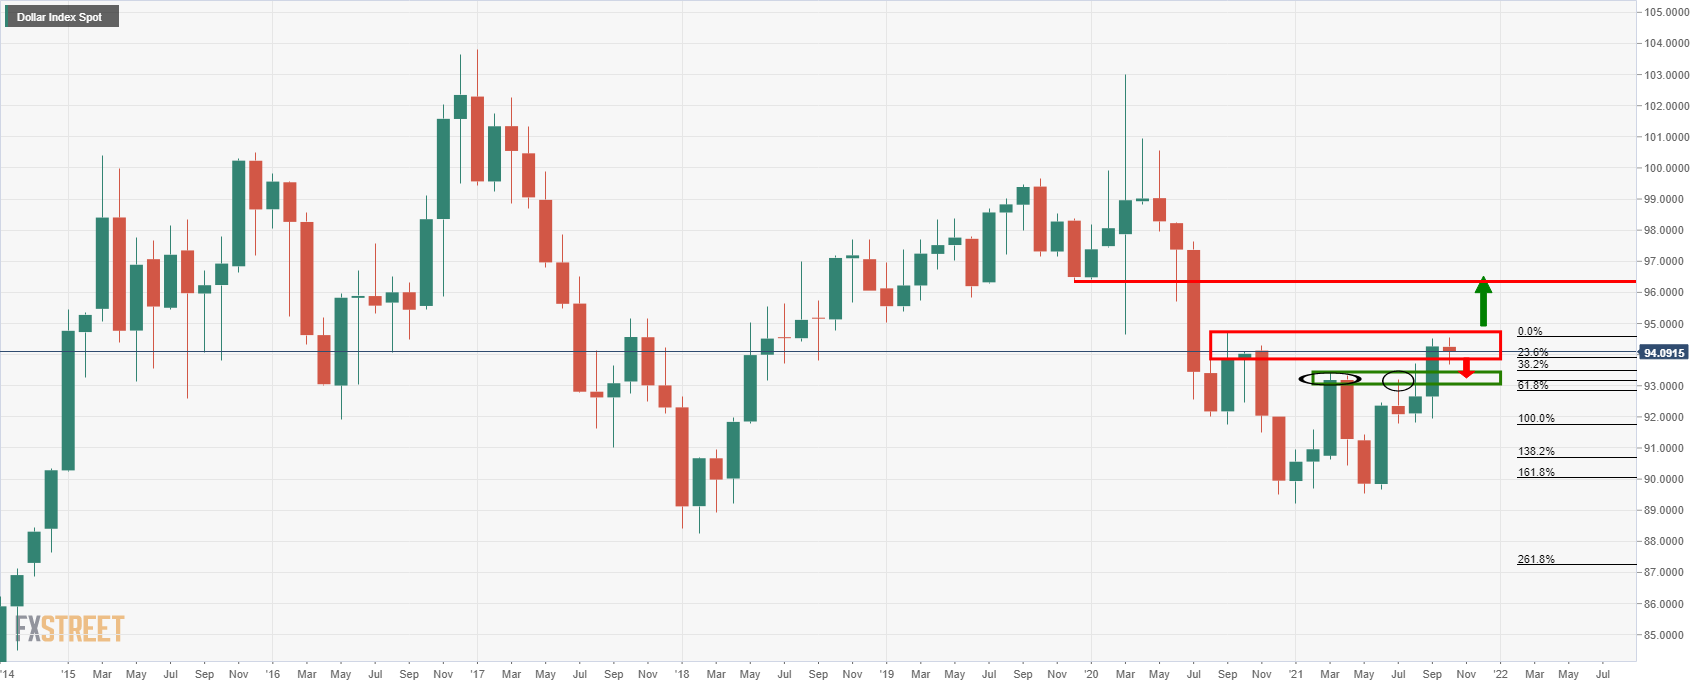
Meanwhile, the Fed funds futures indicate > 95% chance for Dec 22, ~70% chance for a Nov 22 rate hike. That's a big increase vs. last week.
Australia’s labour force survey for September is coming up at the top of the hour. It is expected to report the loss of 200k jobs in the month, but this decline will only lead to a small rise in the Unemployment Rate to 4.7% as many of those out of work leave the workforce temporarily owing to lockdown restrictions, analysts at Westpac argued.
''Westpac is more gloomy than consensus on jobs, with the median forecast -110k total employment, 4.8% unemployment rate (versus August -146k and 4.5%).''
''We expect employment will have fallen -120k in August, which is slightly below consensus. But we expect the unemployment rate will only rise to 4.7%,'' analysts at ANZ Bank said.
How could the data affect AUD/USD?
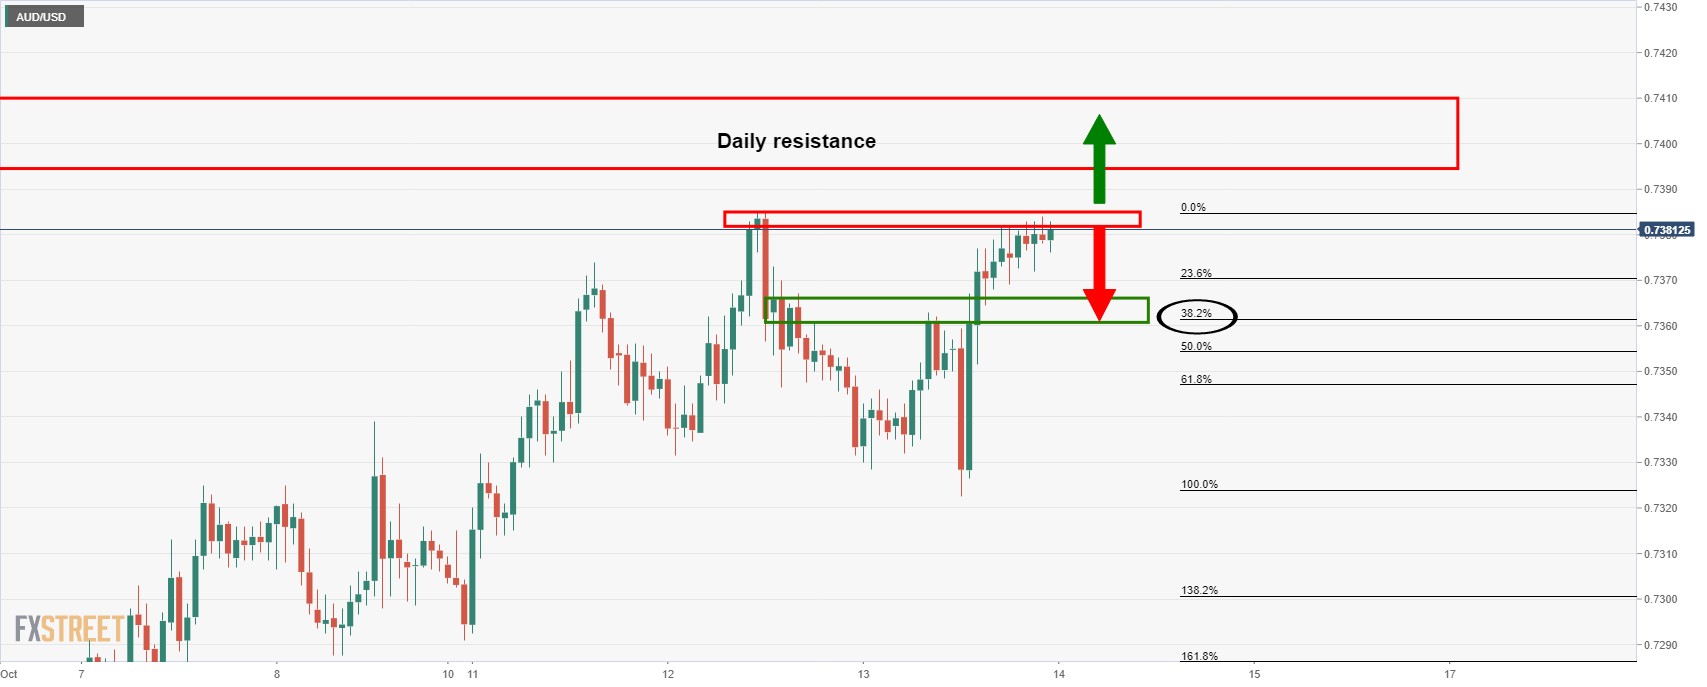
On an hourly basis, the price is meeting a meanwhile resistance and following the rally, a correction would be expected. The impulse is already decelerating and a negative outcome in the data would be expected to trigger the downside towards a 38.2% Fibonacci retracement near 0.7360. On the other hand, should the price rally on the data, then the daily resistance and 0.74 the figure will be eyed:
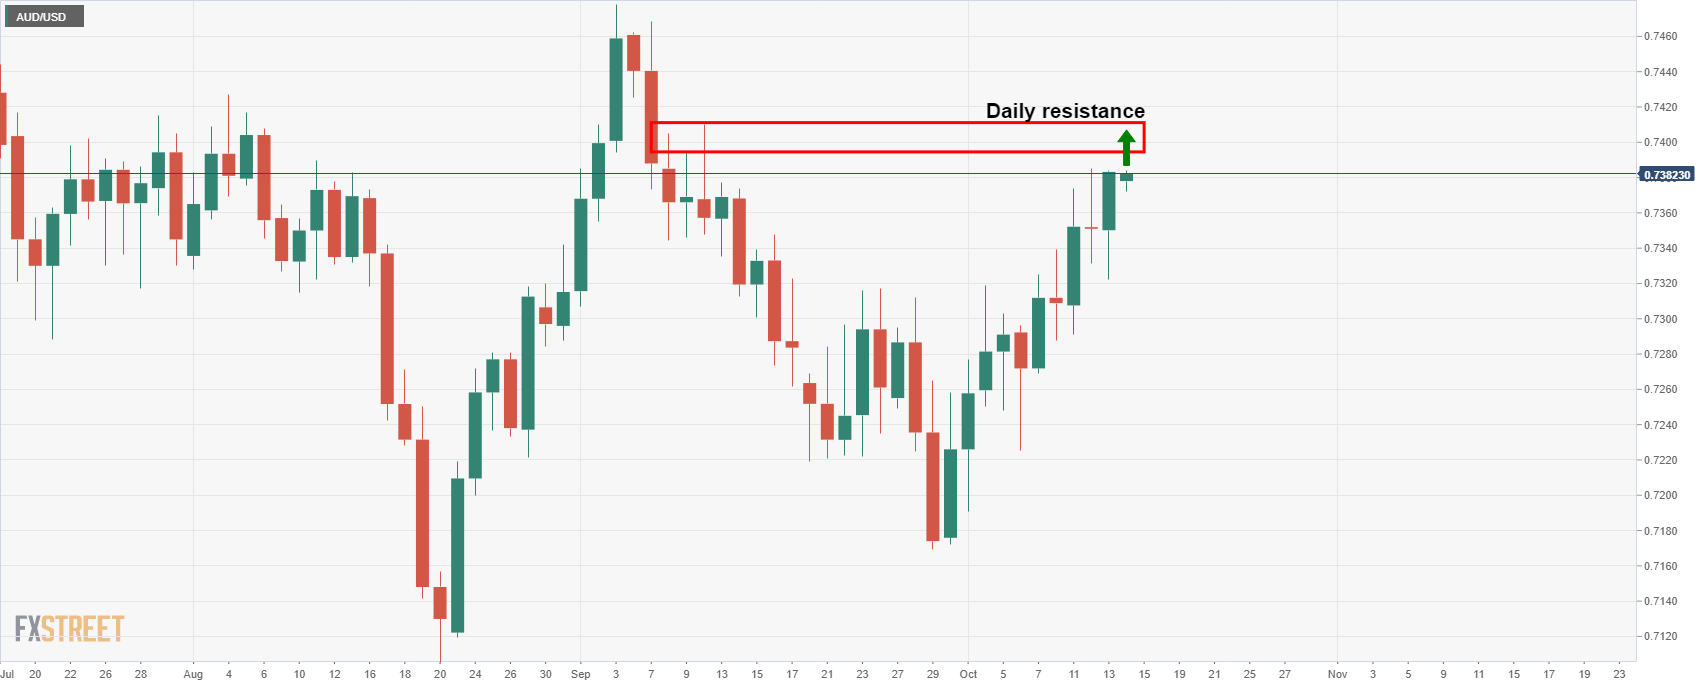
Key Notes
- Australian Employment Preview: Significant fall in jobs already priced-in? AUD has room to rise
- Forex Today: Falling yields spur a dollar sell-off
- AUD/USD retains second place on the leader board ahead of key jobs data
About the Employment Change
The Employment Change released by the Australian Bureau of Statistics is a measure of the change in the number of employed people in Australia. Generally speaking, a rise in this indicator has positive implications for consumer spending which stimulates economic growth. Therefore, a high reading is seen as positive (or bullish) for the AUD, while a low reading is seen as negative (or bearish).
About the Unemployment Rate
The Unemployment Rate released by the Australian Bureau of Statistics is the number of unemployed workers divided by the total civilian labor force. If the rate hikes, indicates a lack of expansion within the Australian labor market. As a result, a rise leads to weaken the Australian economy. A decrease of the figure is seen as positive (or bullish) for the AUD, while an increase is seen as negative (or bearish).


© 2000-2026. Sva prava zaštićena.
Sajt je vlasništvo kompanije Teletrade D.J. LLC 2351 LLC 2022 (Euro House, Richmond Hill Road, Kingstown, VC0100, St. Vincent and the Grenadines).
Svi podaci koji se nalaze na sajtu ne predstavljaju osnovu za donošenje investicionih odluka, već su informativnog karaktera.
The company does not serve or provide services to customers who are residents of the US, Canada, Iran, The Democratic People's Republic of Korea, Yemen and FATF blacklisted countries.
Izvršenje trgovinskih operacija sa finansijskim instrumentima upotrebom marginalne trgovine pruža velike mogućnosti i omogućava investitorima ostvarivanje visokih prihoda. Međutim, takav vid trgovine povezan je sa potencijalno visokim nivoom rizika od gubitka sredstava. Проведение торговых операций на финанcовых рынках c маржинальными финанcовыми инcтрументами открывает широкие возможноcти, и позволяет инвеcторам, готовым пойти на риcк, получать выcокую прибыль, но при этом неcет в cебе потенциально выcокий уровень риcка получения убытков. Iz tog razloga je pre započinjanja trgovine potrebno odlučiti o izboru odgovarajuće investicione strategije, uzimajući u obzir raspoložive resurse.
Upotreba informacija: U slučaju potpunog ili delimičnog preuzimanja i daljeg korišćenja materijala koji se nalazi na sajtu, potrebno je navesti link odgovarajuće stranice na sajtu kompanije TeleTrade-a kao izvora informacija. Upotreba materijala na internetu mora biti praćena hiper linkom do web stranice teletrade.org. Automatski uvoz materijala i informacija sa stranice je zabranjen.
Ako imate bilo kakvih pitanja, obratite nam se pr@teletrade.global.
транcфери