- Analiza
- Novosti i instrumenti
- Vesti sa tržišta
Forex-novosti i prognoze od 14-01-2022
- The shared currency edges lower during the New York session by 0.14%.
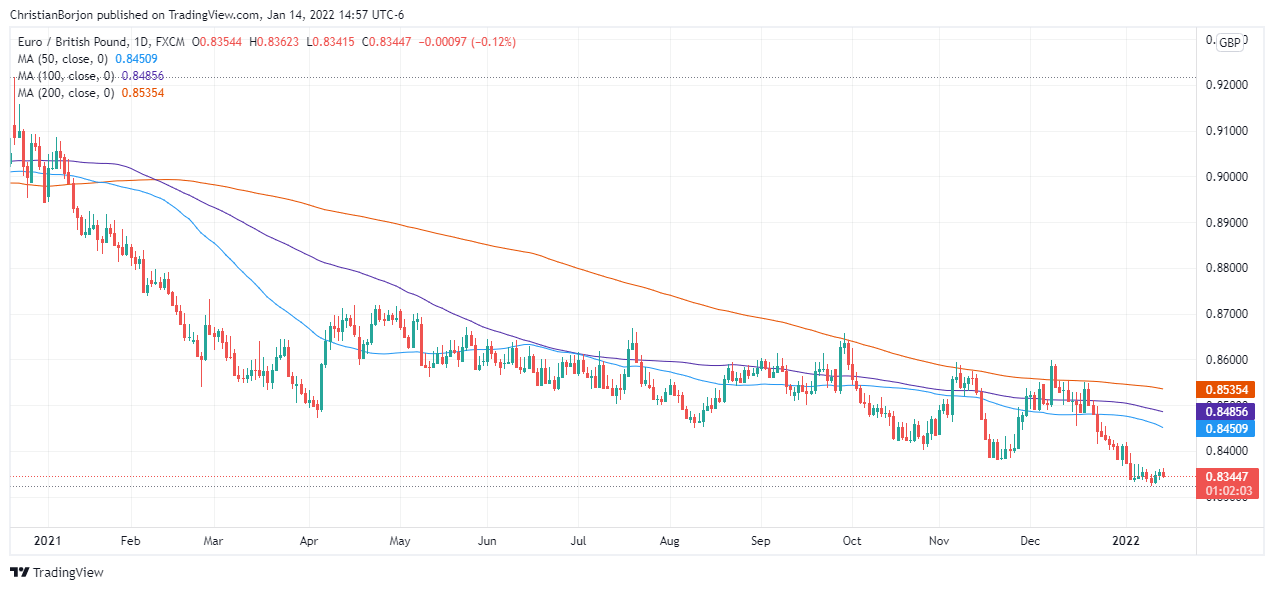
- EUR/GBP Technical Outlook: Downward biased, but a break under the 0.8300 figure, would push the pair towards lower prices.
The EUR/GBP slide for the second time of the week, though, remains trapped in the 0.8320-65 range for the sixth consecutive day. The EUR/GBP is trading at 0.8347 as the New York session winds down. at the time of writing
The market mood is downbeat, as shown by global equity indices posting losses on Friday. In the US, except for the Nasdaq 100 gaining half percent, the rest print losses between 0.08% and 0.75%.
EUR/GBP Price Forecast: Technical outlook
The EUR/GBP daily chart shows the cross-currency is making a strong base in the 0.8320-65 area. From a technical perspective, the EUR/GBP is downward biased but, the 0.8300 barriers kept GBP bulls uncommitted of opening fresh bets vs. the euro.
On the downside, the EUR/GBP first support level would be the YTD low at 0.8324. A breach of the latter would expose the figure at 0.8300, followed by November 2019, with monthly lows around 0.8276.
Contrarily, to the upside, the first resistance would be 0.8372. A clear break of that level would expose January 3 daily high at 0.8419, which, once broken, might open the door for further gains for the shared currency. The next supply zone would be the 50-day moving average (DMA) at 0.8455, followed by the confluence of the 100-DMA and the psychological 0,8500 level.
- Friday was a mixed, choppy day for US equity markets, with tech and growth stocks doing better while value did worse.
- That meant the Nasdaq 100 outperformed, gaining 0.5%, whilst the Dow underperformed, shedding 0.7%.
It was a choppy and mixed session in US equity markets, marked more by rotations from growth into value and then back again than by any more definitive risk-on risk-off broad equity market moves. In early US trade, the Nasdaq 100 index was down as much as 0.6% and probing the 15,400 level, but the index has since recovered to trade about 0.5% higher nearer to 15,600. Conversely, the Dow was at one point in early trade just 0.4% lower but has since fallen back to trade more than 0.7% lower as tech/growth names recovered. The net result for the broader S&P 500 index has been that it has spent most of the session chopping in negative territory and was at one point more than 1.0% lower, but has since recovered back to nearly trade flat in the 4650s.
Dow underperformance can be explained in part by downside in the financial sector (the S&P 500 financial index dropped 1.4%) after disappointing earnings from big US banks, which kicked off the start of the Q4 2021 earnings season on a sour note. JP Morgan was down more than 6.0% after its trading division posted below-par results and after the company warned that inflation and the rapid spread of Omicron would challenge the outlook for the banking sector in the coming months. Analysts said that worse-than-expected bank results combined with poor the December Retail Sales report are a red flag for the US economic outlook in Q1 and 2022.
Headline Retail Sales was shown to have dropped 1.9% MoM in December, leading to various banks and analysts issuing downwards revisions for the Q4 2021 US GDP growth forecasts. But given that the data comes on the heels of hot Consumer and Producer Price Inflation figures out earlier in the week, it is unlikely to deter the Fed from pressing ahead with multiple rate hikes this year. Indeed, Fed members including John Williams and Mary Daly were both on the wires during Friday’s US session and both stuck to the Fed’s now well-established script that given elevated inflation, monetary tightening this year is warranted.
- Gold slides for the second straight day as worse than expected US economic data crossed newswires.
- US retail sales dropped the most in 10-months.
- The US 10-year T-bond yield hits 1.771%, weighing on the non-yielding metal.
The yellow metal slips for the second-consecutive day amid dismal US economic data revealed on Friday. Gold spot (XAU/USD) is trading at $1,816 at the time of writing.
During the North American session, XAU/USD failed to capitalize on worse than expected US Retail Sales, Industrial Production, and UoM Consumer Sentiment. In the meantime, the US 10-year benchmark yield advances firmly five basis points, sitting at 1.771%, regaining some ground, after hitting 1.808% at the beginning of this week.
Dismal US macroeconomic data mainly ignored by investors, per the market reaction
On Friday, the US Department of Commerce revealed December’s Retail Sales report, which portrayed a contraction of 1.9%, worse than the -0.1% estimated by economists. Excluding gasoline and autos, slumped, even more, 2.5%, lower than November’s 0.1% drop. In the meantime, US Industrial Production shrank 0.1%, when analysts forecasted a 0.3% growth.
Adding fuel to worse than expected US economic data releases, the UoM Consumer Sentiment fell to 68.8, versus 70.0 estimated.
Fed speakers crossing the wires
Earlier in the day, the New York Fed President John Williams crossed the wires. He said that “the economy is near maximum employment” and emphasized that the Fed needs to tackle inflation. Williams further noted that some “factors driving inflation are still related to pandemic effects.”
John Williams expects inflation would drop to 2.5% by the end of the year, and it would reach the US Fed’s 2% target in 2023.
In the meantime, San Francisco Fed’s President Mary Daily said that the main reason for inflation is Covid-19. She said that the central bank needs to adjust its policy and that “slowing the economy a little bit with rate hikes will help bring demand down into better line with supply.”
XAU/USD Price Forecast: Technical outlook
From a technical analysis perspective, gold’s daily chart is neutral-bullish biased. Whilst the daily moving averages (DMAs) reside below the spot price; the 200-DMA is trapped between the 50 on top and the 100-DMA on the bottom.
That said, the XAU/USD first resistance level would be September 3, 2021, cycle high at $1,834. A breach of the latter would expose the $1,900 psychological level, immediately followed by June’s 1, 2021, daily high at $1,916.
- GBP/JPY looks set to end the day lower around 156.00, but has recovered well from earlier sub-155.50 lows.
- Next week is s busy one for the pair, with the BoJ setting policy and plenty of tier one UK data releases.
A combination of hawkish BoJ rate hike chatter and safe-haven demand amid choppy/mixed trading conditions in US equity markets helped to propel the yen to the top of the G10 performance table on Friday. Though strong UK GDP and Industrial Production figures helped GBP hold its ground fairly well, it wasn’t enough to overcome the yen’s advances, with GBP/JPY on course to end the day about 0.3% lower at just above the 156.00 level.
That puts the pair on course to lose about 0.5% on the week, but GBP/JPY’s recovery from earlier sub-155.50 session lows is notable. For technicians, however, the key test will be whether the pair can close above the 156.00 level, which has acted as an important level of both resistance and support in recent weeks. A close to the north of this level could put GBP/JPY on a better footing heading into next week, a week full of important fundamental drivers for both the yen and sterling.
Starting with the former, the BoJ will decide on monetary policy on Monday. Sources a few weeks ago suggested that the bank will upgrade its inflation forecasts amid higher-than-expected wholesale and energy price pressures lifting inflation expectations in the country. But those same sources added that this lift to the inflation forecasts wouldn’t be nearly enough to spur policy action from the bank. However, separate sources speaking with Reuters this Friday said that policymakers were now debating how soon they can start telegraphing an eventual interest rate hike, which could come even before the bank actually hits its 2.0% inflation target.
This suggests some hawkish risk going into Monday’s meeting which could further underpin the yen. Japanese December Consumer Price Inflation data will then be released later in the week (on Thursday). GBP/JPY traders will also be keeping a keen eye on next week’s UK labour market, December Consumer Price Inflation and December Retail Sales figures, which are likely to influence the BoE’s upcoming monetary policy decision on 3 February. Market participants are split over whether the bank will hike interest rates, thus automatically kickstarting balance sheet runoff, or not.
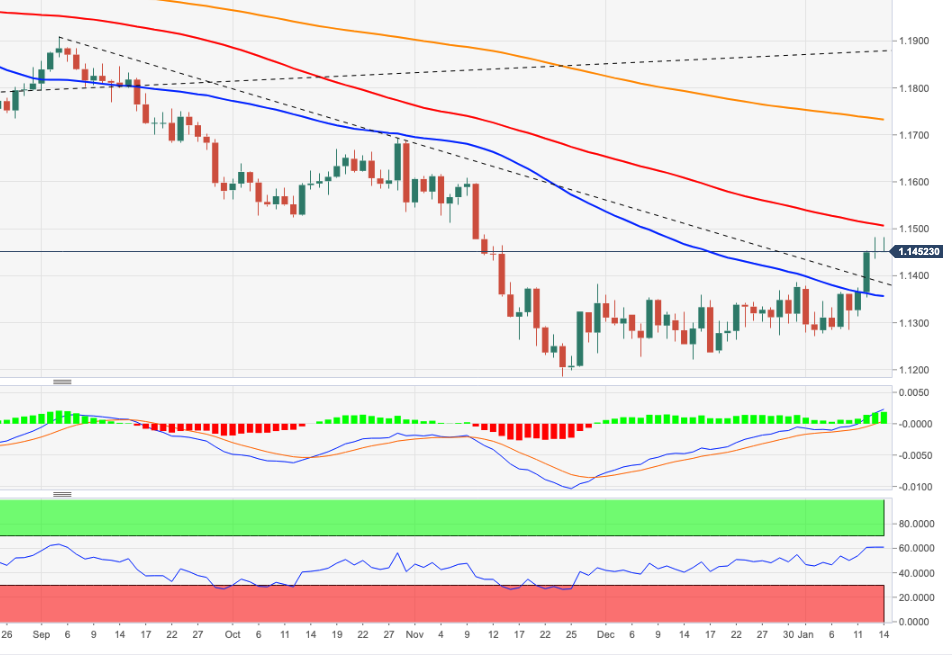
- EUR/USD has stabilised just above 1.1400, having dropped back from earlier session highs in the 1.1480s.
- Technicians will be eyeing a key level of support in the 1.1380 area.
EUR/USD selling has continued into the US trading session, though the bearish intra-day momentum has for the moment eased with the pair finding support above the psychologically important 1.1400 figure. At current levels around the 1.1410 mark, the pair is trading lower by about 0.4% and is over 0.6% lower versus its Asia Pacific session highs in the 1.1480s. Technicians will be eyeing support in the 1.1380 area in the form of the late-November/December highs. Some EUR/USD bulls will be hoping that, after this week’s bullish breakout from the late-November/December ascending triangle, a retest of this key area of support might prove an excellent entry point to reload on longs and to target a move towards 1.1500.
Given the low volumes, thin liquidity conditions typical of late-Friday trade, such a move would likely have to wait until next week. Some might argue that Friday’s fundamental developments (weaker than expected US December Retail Sales and January Consumer Sentiment figures) suggest a higher EUR/USD making sense. There isn't much by way of tier one US data next week, but if the NY and Philly Fed surveys for January are also sufficiently week, that could back up this argument. But near-term weakness, which will in part be a reflection of surging Omicron infections in the US, will not worry the Fed, which is much more focused on elevated inflation and the tight labour market.
While there will be no more Fedspeak next week given the central bank will have entered blackout ahead of the January meeting, recent hawkishness from FOMC members is likely to remain a key talking point amongst market participants and presents upside USD risk. Dollar bulls betting that Fed/ECB policy divergence will this year weigh on EUR/USD may see current levels to the north of 1.1400 as attractive to add shorts and target a move towards November/December lows in the 1.1200 area.
- The USD/CHF fall ended after three consecutive days amid a risk-off market mood.
- The rise of the 10-year US Treasury yield underpins the greenback.
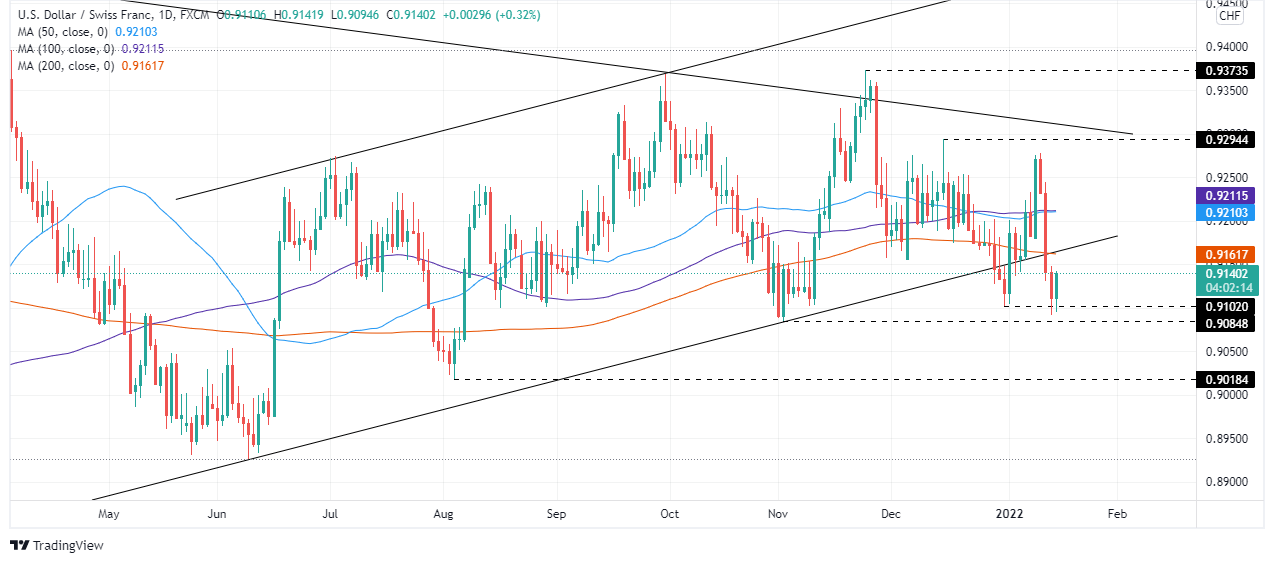
- USD/CHF is neutral biased, but a bullish-engulfing candle pattern may open the door for an upside move; otherwise, it could challenge August 2021 monthly lows.
The USD/CHF snaps three straight days of losses, edges higher during the New York session, trading at 0.9139 at press time. A risk-off market mood, increased demand for safe-haven assets, usually benefits the CHF and the JPY, but not on Friday, with the USD recovering from earlier week losses.
The USD Dollar Index, a gauge of the greenback’s performance against six other currencies, advances som 0.29%, up to 95.96, underpinned by the 10-year benchmark note, which is rising 3.4 basis points, sitting at 1.754%.
USD/CHF Price Forecast: Technical outlook
The USD/CHF daily chart depicts the consolidation of the pair inside an ascending channel; even though it was “pierced” on the bottom trendline, USD bears have not achieved a daily close under 0.9080.
If USD/CHF Friday’s daily close engulf Thursday’s candlestick price action, an upward move may be on the cards. In that outcome, the first resistance would be the 200-day moving average (DMA) previously broke at 0.9167. An aforementioned break would expose the confluence of th3 50 and the 100-DMA in the 0.9210-12 range, which once gave way to USD bulls, would send the pair rallying towards December 15, 2021 daily high at 0.9294.
Contrarily, failure of the abovementioned scenario would keep the USD/CHF neutral-downward biased. The USD/CHF first line of defense would be 0.9100. A breach of the latter would exert further downside pressure on the pair, exposing crucial support levels. The next one would be November 2, 2021, daily low at 0..9084, followed by August 4, 2021, cycle low at 0.9018.
- The British pound falls for the first time in the week, retreats from weekly highs.
- Worse than expected, US economic data failed to boost the GBP.
- Robust UK’s economic data failed to underpin the GBP.
- GBP/USD Technical Outlook: Failure at the 200-DMA opens the door for a fall towards the 100-DMA.
On Friday, a pack of solid UK macroeconomic data failed to underpin the British pound, which struggled to cling to the 1.3700 figure, falling during the New York session. At press time, the GBP/USD is trading at 1.3670. It is worth noting that in the last hour, the US Dollar Index reclaimed the 95.00 level, up some 0.25%, sitting at 95.05, underpinned by the rise of the US 10-year T-bond yield, up to 1.75%, a three basis points gain.
The market sentiment is downbeat, as shown by the majority of the European equity indices trade in the red, while the US stock indices record losses between 0.05% and 0.73%. In the FX market, safe-haven peers, like the USD, the JPY, and the CHF, appreciate.
US Retail Sales and Industrial Production disappoint
On Friday, the US Department of Commerce unveiled December’s Retail Sales report, which showed a contraction of 1.9%, worse than the -0.1% estimated by economists. Excluding gasoline and autos, slid, even more, 2.5%, lower than November’s 0.1% drop. In the meantime, US Industrial Production shrank 0.1%, when analysts forecasted a 0.3% growth.
Adding fuel to worse than expected US economic data releases, the UoM Consumer Sentiment fell to 68.8, versus 70.0 estimated.
In the overnight session for North American traders, the UK economic docket featured the Gross Domestic Product for the UK in November rose 0.9%, the first time compared to pre-pandemic levels from February 202. Meanwhile, Industrial Production increased 1% in November, compared to the October reading.
Concerning the UK’s Covid-19 cases, the UK reported 99,652 new Covid-19 cases and 270 deaths, lower than the 335 reported on Thursday.
GBP/USD Price Forecast: technical
The GBP/USD daily chart depicts a formation of an evening star candle pattern, right at the confluence of the 200-DMA that could propel the GBP/USD towards the 100-DMA.
On the way down, the first support would be January 12 daily low at 1.3621. A breach of the latter would expose the confluence of the January 11 daily low and the abovementioned 100-DMA at 1.3551. If that level gives way, the GBP/USD could be tumbling towards 1.3500.
- WTI is probing its best levels since early November in the $73.00 as geopolitical tensions rise.
- Analysts/banks have been calling this week for WTI to hit/surpass $100 per barrel in 2022.
Oil markets have recovered from Thursday’s very mild stumble and are back on the front foot on Friday. Front-month WTI futures have in recent trade been probing highs of the week and its best levels since early November above $83.00 per barrel as crude oil bulls eye a breakout towards 2021 highs in the $85.50s. Geopolitical tensions are bubbling, with the market’s perceived likelihood of a Russian military intervention into Ukraine increasing (Russian and Ukrainian dollar bonds have been getting hammered). The impact of an outright Russian invasion on global oil supply isn't clear, but Russia is one of the world’s biggest producers, pumping more than 11M barrels per day (over 10% of daily global supply).
The highly tense geopolitical backdrop isn't the only factor supporting oil prices on Friday. Indeed, there appears to be a great deal of optimism amongst banks/analysts that WTI could be headed as high as $100 per barrel in 2022. Banks and analysts have generally been citing expectations for an increasingly tight market. JP Morgan said earlier in the week that oil prices could gain $30 from here after the US Energy Information Administration and Bloomberg earlier in the week lowered their OPEC output capacity estimates for 2022 by 0.8M and 1.2M barrels per day respectively.
Meanwhile, an analyst at OANDA this week said that “assuming China doesn't suffer a sharp slowdown, that Omicron actually becomes Omi-gone, and with OPEC+’s ability to raise production clearly limited, I see no reason why Brent crude cannot move towards $100 in Q1, possibly sooner”. Analysts at PVM agree, saying “when you consider that OPEC+ is still nowhere near pumping to its overall quota, this narrowing cushion could turn out to be the most bullish factor for oil prices over the coming months.”
Industrial Production in the US dropped unexpectedly 0.1% in December. Analysts at Wells Fargo explain the decline took place despite indications that wait times are shortening and other signs of initial improvement with the supply chain problem.
Key Quotes:
“Total industrial production edged slightly lower in December with a 0.1% decline in the last month of the year. Upward revisions to prior month's data may take some of the sting out of today's unexpected decline, but the main message is that despite some improvement, manufacturing output is being held down by tangled supply lines like the many ropes of the Lilliputions that held down Gulliver.”
“Manufacturing, which comprises more than three quarters of all output, saw a 0.3% decline, with motor vehicle and parts production down 1.3% in the month. Aside from October, when motor vehicle output had a spurt of growth, this category generally has been a persistent headwind to overall manufacturing.”
“A silver lining in the report was a 0.3% gain in production in high-tech industries like computers, communications equipment, semiconductors and electronics. Not only have some of these categories seen the brunt of strapped supply and output perhaps signals some easing in bottlenecks, but they're also indicative of broader business investments that can improve productivity.”
“Overall capacity utilization slipped to 76.5% from a downwardly revised 76.6% in November. But capacity varies widely across industries. Capacity utilization of high-technology industries remains lower than the broader economy-wide measure at 75.9% in December.”
Analysts at MUFG Bank point out that assuming US dollar sentiment improves more broadly, some USD/JPY recovery is feasible but they consider the current correction could be a sign of the beginning of the end of the trend higher that began at the start of last year.
Key Quotes:
“Yields do continue to grind higher in Japan with today the 5-year JGB yield hitting - 0.015%, the highest level since the BoJ implemented its negative policy in January 2016. But the move is likely more a reflection of front-end rates in the US grinding higher than any fundamental shift in view in Japan. It will though along with the Reuters article create greater focus on the BoJ meeting next week.”
“The failure to test the 117.00 level is a clear bearish signal for USD/JPY. We had assumed dollar positive momentum would get us there before JPY recovery took hold. That failure and the fact that the market was short JPY means the prospect of a quick rebound is diminishing. We have long argued the case for a correction and it seems that has unfolded a little sooner than expected.”
Federal Reserve Bank of San Francisco President Mary Daly said on Friday that the latest Omicron wave will extend the time period that inflation will remain high.
Additional Remarks:
"Covid is the main reason for high inflation."
"We need to unwind the Covid-induced inflation boom to get supply and demand into better balance."
"We have to adjust policy to ensure we achieve price stability."
"Slowing the economy a little bit with rate hikes will help bring demand down into better line with supply."
"We want to bridle the economy a little bit."
"It is appropriate for the Fed to bring inflation down."
Federal Reserve Bank of New York President John Williams said on Friday that he expects the Omicron wave to temporarily prolong and intensify labour supply challenges and supply-chain bottlenecks. He also expects the wave to slow growth in the next few months as people once again pull back from contact-intensive activities.
Additional Remarks:
"The economy should return to a solid growth trajectory and supply constraints should ebb after Omicron subsides."
"Expects real GDP to increase around 3.5% this year."
"Expects the unemployment rate will continue to come down further to 3.5% this year."
"Expects inflation to drop to around 2.5% this year, much closer to the FOMC’s 2% longer-run goal."
"Expects inflation to get close to 2% in 2023."
"The next step in reducing monetary accommodation will be to gradually bring the target range for Fed funds rate back to more normal levels."
"The timing of such decisions will be based on a wide range of data and information, with a clear eye on Fed's maximum employment and price stability goals."
"Inflation is too high and the Fed would not want to see it persist at high levels."
"The economy is very close or near to maximum employment."
"The Fed needs to bring inflation down."
"A lot of the factors driving inflation are still related to pandemic effects."
"High shipping costs are due to imbalances and those will be resolved."
"There is a lot of uncertainty about the inflation outlook."
"The Fed is committed to achieving 2% inflation over time."
"The Fed is data dependant and driven by analysis."
"Some supply chain issues are more persistent than he initially thought."
"The drivers of inflation have been more persistent."
"That's why some people expect inflation to be higher this year than previously thought."
"As the data changed and drivers of inflation changed the fed had to move policy consistent with that."
"He doesn't know exactly what the path of the fed funds rate will be this year because it will be driven by data."
"The Fed forecast seeing rate increases this year is completely sensible."
"It makes sense to continue this process of removing accommodation."
"The Fed can control short-term interest rates through various tools."
"He is confident that when it is time to adjust monetary policy the Fed has the tools."
"The Fed has the ability to manage the balance sheet smoothly."
"The primary tool of monetary policy is the Fed funds rate."
Data released on Friday surprised to the downside with a 1.9% slide in December Retail Sales. Analysts at Wells Fargo point out the decline was broad-based. They see cratering in retail sales more as a reflection of early shopping and pulled-forward demand than an Omicron impact or a seminal change in consumer activity.
Key Quotes:
“Retail sales dropped 1.9% in December, the largest monthly decline since February; stripping away spending on autos and gas only makes it worse with a 2.5% decline. Those looking for confirmation of an Omicron-related slowdown will seize upon today's drop in retail sales as evidence, but this is a decline we have been anticipating since our first holiday sales forecast in September. We warned then about a year-end air-pocket and compared the struggle for retailers to holding an early lead in a football game. It is clear that most shoppers heeded the advice to get holiday shopping done early and that, combined with a massive surge in goods spending earlier in the year, conspired to pull sales sharply lower to end the year.”
“Even with the plunge in sales in December, holiday sales still posted a record annual increase. Sales in November and December came in 12.9% ahead of last year's level and ahead of our forecast which called for an 11% gain in sales.”
“We still believe consumers continue to become desensitized to rising case counts with each passing wave of the virus. This is particularly true today with the growing evidence that this variant is causing less severe illness. Inflation thus appears to be the larger concern for consumers who are seeing income gains struggling to keep up with rising prices. Weak income growth in January due to dwindling stimulus may also weigh on consumer psyche during the month.”
“While December's sales print makes tough comparisons for the start of the year, we remain confident consumers will see above-trend growth this year.”
- Japanese yen benefits amid weak US data and risk aversion.
- DXY erases losses and turns positive during the American session.
- USD/JPY has the biggest weekly loss in a year.
The USD/JPY extended weekly losses and tumbled to 113.47, reaching the lowest level since December 20. It then rebounded, rising toward 113.80. The dollar is having the worst weekly performance versus the yen in a years.
Another day, another loss
On Friday, USD/JPY is falling for the third consecutive day and for the sixth time out of the last seven trading days. The last intraday leg lower came in after the US Retail Sales report that showed an unexpected decline of 1.9% in December. A different report showed Industrial Production dropped 0.1% in December against expectations of a 0.4% increase. Also, Consumer Confidence data came in worst-than-expected.
The figures contributed to the deterioration in market sentiment that is helping the yen. The Dow Jones is falling 0.70% and the Nasdaq 0.15%. In Europe, mains stock indices closed in red.
USD/JPY week ahead
The loss of 115.00 on Wednesday and 114.00 on Friday places the remainder of the USD/JPY gains since early December in question and opens the region to 112.00 and 111.00, warns Joseph Trevisani, Senior Analyst at FXStreet. “There is reasonable technical support down to 113.00, but the area beneath to 112.00 was traversed in just two trading sessions in early October and is quite vulnerable.”
Trevisani points out that the Bank of Japan meeting on Tuesday will produce no policy changes in the week ahead, and if the bank reveals a new economic support package, it will have little market impact. “National CPI for December will not alter the BOJ’s view of inflation.”
US economic data includes housing market numbers with Existing Home Sales, Building Permits and Housing Starts for December, “interesting statistics but not market movers.”
Technical levels
- NZD/USD has slipped back from the 0.6850 area to the 0.6820s and is down about 0.5% on the day.
- Weak US data was largely ignored, with the dollar staging a tentative rebound, whilst choppy equity markets hurt NZD.
NZD/USD’s positive mid-week momentum has faded on Friday, with the pair falling back below the key 0.6850 support zone into the 0.6820s, where it trades lower on the day by about 0.5%. Though the Dollar Index has not been able to recover back to the north of the 95.00 level on Friday, it has managed to muster a modest recovery from the two-month lows it printed earlier in the session. This improvement in US dollar demand, combined with choppy, mixed conditions in global equities, has weighed on the kiwi and is a principal driver of Friday’s downside in NZD/USD.
Whether Friday’s modest US dollar recovery following heavy selling pressure this week translates into a broader dollar upturn is another question. Certainly, this week’s fundamental developments (hawkish Fed speak, hot consumer and producer inflation) suggests that there is substantial USD upside risk. Friday’s weak US December Retail Sales report and worse than expected January Consumer Sentiment survey have both been ignored by FX markets as not particularly relevant to either the growth outlook or Fed policy. That because 1) US Retail Sales remain historically elevated, even if spending did weaken a little more than expected in December and 2) weak Consumer Sentiment is mostly a function of high inflation.
Upside US dollar risk of course suggests downside NZD/USD risk and the bears will be eyeing a retest of the key 0.6800 area and 21-day moving average just below it at 0.6785. But with the Fed now entering blackout ahead of the January meeting and a lack of tier one US data releases, the US dollar may struggle to find impetus next week. That suggests NZD/USD may have an opportunity to remain rangebound in the 0.6800-0.6900 area, provided that the recent downside in US (and global) equities doesn’t extend.
- The Loonie loses ground vs. the greenback amid a worst-than-expected US economic data releases.
- US Retail Sales contracted the most in 10 months.
- USD/CAD Technical Outlook: Upward biased, although the spot is above the 200-DMA, is nearby, so caution is warranted.
The USD/CAD climbs during the New York session after the reléase of December’s retail sales showed a contraction deeper than expected. At the time of writing, the USD/CAD is trading at 1.2528, up some 0.06% during the New York session.
In the meantime, the US Dollar Index, a gauge of the greenback’s value against a basket of six peers, recovers some 0.15%, close to the 95.00 level. At the same time, Western Texas Intermediate (WTI’s), which price influences the oil-linked Canadian dollar, edges up 1.56%, trading at $83.16 per barrel, though failed to underpin the CAD.
Retail Sales in the US shrank in December
Before Wall Street opened, the US Department of Commerce released the Retail Sales for December, which contracted by the most in 10 months, 1.9%, lower than the -0.1% foreseen by analysts. Further noting, sales excluding autos and gasoline, for the same month, slumped 2.5%, while in the previous month, contracted 0.1%.
Some minutes after retail sales were unveiled, US Industrial Production in December shrank 0.1%, lower than the 0.3 increase estimated by economists polled by Reuters.
That would leave USD/CAD traders waiting for January’s University of Michigan Consumer Sentiment on its preliminary reading, expected at 70.0.
USD/CAD Price Forecast: Technical outlook
Per the USD/CAD daily chart, the pair is “still” upward biased. However, on Thursday, the USD/CAD dopped beneath the 200-daily moving average (DMA), which sits at 1.2501, reaching a daily low at 1.2453. Nevertheless, USD/CAD buyers entered the market, capped the fall, and reclaimed the 200-DMA, leaving the trend intact.
The USD/CAD first ceiling level would be the January 12 daily high at 1.2580. A breach of the latter would expose the 1.2600 figure, followed by the 100-DMA at 1.2523.
Contrary, on the downside, the pair’s first support would be the 200-DMA. A daily close under it could send the pair tumbling to November 10, 2021, cycle low at 1.2386, but it would need to sort a few hurdles on the way down. The second support would be the January 13 daily low at 1.2453, followed by 1.2400 and the previously mentioned November’s pivot low.
- The preliminary UoM Consumer Sentiment Index fell more than expected to 68.8 in January.
- There was no meaningful FX market reaction to the latest report.
According to the University of Michigan's (UoM) preliminary January US Consumer Sentiment survey, the Consumer Sentiment Index fell to 68.8 in January from 70.6 in December, below expectations for a 70.0 reading. Meanwhile, UoM's Current Conditions Index fell to 73.2 from 74.2 in December, a tad below expectations for a drop to 73.3. The Consumer Expectations Index fell to 65.9 from 68.3 last month, also below expectations for 66.5. Finally, one-year inflation expectations according to the survey rose to 4.9%, this highest since 2008, and five-year inflation expectations rose to 3.1%, the highest since the early 90s.
Market Reaction
There was no meaningful FX market reaction to the latest UoM survey data.
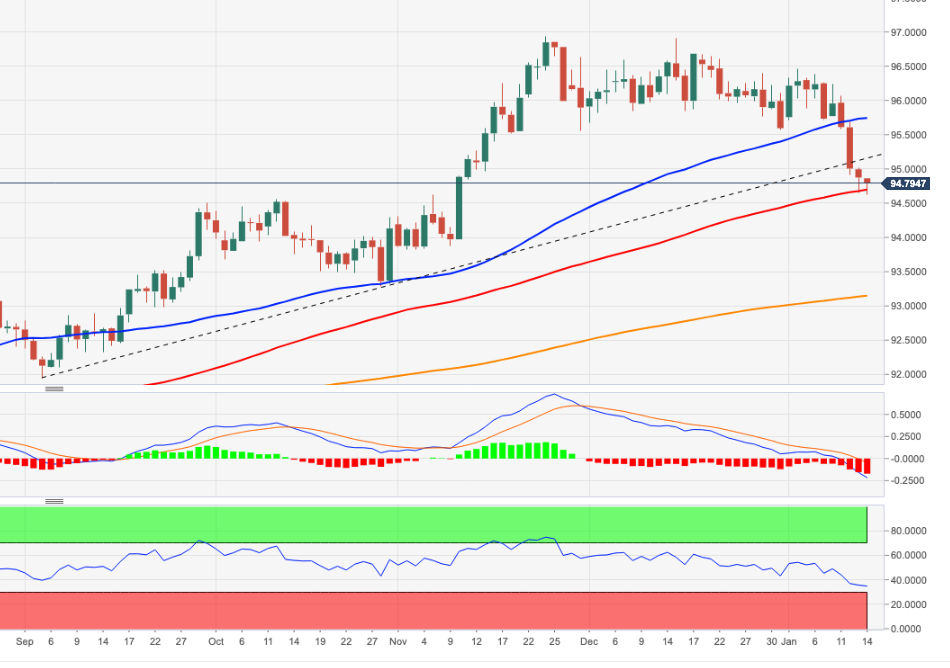
- DXY reverses the earlier drop to 2-month lows near 94.60.
- US Retail Sales surprised to the downside in December.
- The US Consumer Sentiment comes next in the docket.
Tracked by the US Dollar Index (DXY), the greenback, stages a moderate comeback after bottoming out in multi-week lows near 94.60 at the end of the week.
US Dollar Index trades close to oversold levels
Following an initial drop to the 94.65/60 band, the index regains some composure and looks to return to the positive territory on Friday.
Collaborating with the bounce in the buck, US yields also manage to reverse the recent weakness and edge higher along the curve, with the 2y note approaching the 0.94% level, the belly flirting with 1.75% and the long end eyeing the 2.10% zone.
In the domestic calendar, December’s Retail Sales came short of expectations after contracting 1.9% MoM and 2.3% MoM when it comes to the core reading. Additional results for the month of December saw a 0.1% monthly drop in Industrial Production, while Manufacturing Production contracted 0.3% inter-month and Capacity Utilization deflated a tad to 76.5%.
Closing the docket, the flash U-Mich Index is due seconded by November’s Business Inventories.
US Dollar Index relevant levels
Now, the index is gaining 0.05% at 94.90 and a break above 95.71 (55-day SMA) would open the door to 96.46 (2022 high Jan.4) and finally 96.93 (2021 high Nov.24). On the flip side, the next down barrier emerges at 94.62 (2022 low Jan.14) seconded by 93.27 (monthly low Oct.28 2021) and then 93.12 (200-day SMA).
- AUD/USD dipped under 0.7250 in recent trade as downside in equities/Australia Omicron concerns hurts the Aussie.
- Short-term economic pain as a result of Omicron may be enough to discourage the RBA from axing QE in February.
A broadly risk-off market tone that has seen global equity markets turn lower for a second day on Thursday seems to be taking its toll on the Aussie, as well as potentially some domestic Australian pandemic woes. The underperforming AUD has now dropped more than 0.6% on the day versus the US dollar, with AUD/USD recently dipped below 0.7250, as traders mull the economic impact of surging Omicron infections and whether it will have any bearing on upcoming RBA policy decisions.
This week’s Australia November Retail Sales report showed a much stronger than expected rebound as the Australian economy continued to open up from its Q3 lockdowns, solidifying expectations that, prior to the rapid spread of Omicron, Australia’s economy had been growing strongly. However, after reaching record-high levels in December, Westpac said on Friday that card spending in the country had fallen sharply in the first two weeks of January. The RBA views Omicron as unlikely to derail Australia’s economic recovery, but recent weakness might encourage them not to abruptly axe their QE buying in February and rather instead opt to taper and continue purchases to May.
The above expectations that the current economic weakness may translate into a more dovish RBA outcome may well be one of the factors weighing on AUD on Friday alongside the generally more risk-off tone. In terms of the dollar side of the AUD/USD equation, the pair saw very little reaction to the latest (weaker than expected) US Retail Sales report and (weaker than expected) Industrial Production numbers. Broadly speaking, the US dollar remains on a fragile footing despite this week's hawkishness from FOMC members and hot consumer and producer inflation metrics. That suggests upcoming University of Michigan Consumer Sentiment survey data (the preliminary January release) is unlikely to generate much by way of FX market volatility, but will be worth watching nonetheless.
- EUR/USD fades the initial spike to fresh highs near 1.1480.
- Chairwoman Lagarde suggested inflation pressured should ease in 2022.
- US Retail Sales surprised to the downside in December.
After climbing as high as the 1.1480 region, or new 2-month highs, EUR/USD deflated and returned to the mid-1.1400s, where it is now looking to stabilize.
EUR/USD faltered ahead of 1.1500
EUR/USD sees its weekly upside momentum curtailed on the back of the so far tepid recovery in the greenback, which encouraged the US Dollar Index (DXY) to bounce off multi-week lows near 94.60, an area coincident with the 100-day SMA.
Higher US yields also appear to have been tempering the sour sentiment around the buck and sponsoring at the same time the daily rebound.
No reaction in the European currency after ECB’s Lagarde reiterated once again that inflation is predicted to ease later in the year, adding that the central bank stands ready to take any measures in order to achieve the 2% target over the medium term. She also defended the ongoing accommodative stance of the monetary policy needed to drive inflation around the bank’s goal over the midterm. More blah blah blah here.
In what was the salient event of the week, US headline Retail Sales unexpectedly shrank 1.9% MoM in December. Same path followed Core sales after contracting 2.3% MoM.
Later in the session, Industrial/Manufacturing Production, Capacity Utilization, Business Inventories and the flash print of the Consumer Sentiment for the month of January area all due followed by the speech by NY Fed J.Williams (permanent voter, centrist).
EUR/USD levels to watch
So far, spot is losing 0.11% at 1.1442 and faces the next up barrier at 1.1505 (100-day SMA) followed by 1.1516 (200-week SMA) and finally 1.1692 (monthly high Oct.18 2021). On the other hand, a break below 1.1355 (55-day SMA) would target 1.1272 (2022 low Jan.4) en route to 1.1221 (monthly low Dec.15 2021).
- XAU/USD is moving sideways in the $1820s, having been unreactive to the latest US Retail Sales report.
- Gold is taking its cue from subdued FX and bond markets ahead of further US data later in the session.
Given recent stabilisation in the US dollar and US bonds yields, it is no wonder that spot gold (XAU/USD) prices have continued to go sideways in the $1820s. At current levels around $1825, XAU/USD is trading with slightly in the green on the day, as traders now look ahead to further Fed speak and US data in the form of December Industrial Production and the January University of Michigan Sentiment survey. The latest December Retail Sales report, despite coming in significantly weaker than forecast, did not move FX, bond or gold markets much.
Gold traders will be looking to FX and bond markets for direction next week, as the debate rages on as to whether recent USD weakness will prove transitory and whether the run higher in US bond yields witnessed last week has further legs in the weeks ahead. If not, and if the dollar continues to ebb lower whilst long-term US bond yields ebb back into 2021 ranges, gold bulls will be looking for a break above recent highs in the $1830s area. Such a break could open the door to a run towards Q4 2021 highs in the $1870-80 area.
Conversely, should recent Fed hawkish plus the recent string of strong tier one US data releases translate into dollar dip-buying and a reinforced belief that the Fed will deliver on its pledge to eventually get rates back into the 2.5% area, sending long-term yields higher, gold’s fortunes could be much worse. The precious metal might in this case be looking at a swift dip back under $1800 and a test of recent lows in the $1780s.
- Headline Retail Sales dropped 1.9% MoM, larger than the expected 0.1% decline.
- There wasn't any notable reaction in FX markets.
US Retail Sales fell by 1.9% MoM in December, according to data published by the US Census Bureau revealed on Friday. That was well below market expectations for a MoM decline of -0.1% and marked a sharp deceleration from November's growth rate of 0.2% (downwardly revised from 0.3%). That meant that the YoY growth rate in retail sales eased to just under 17.0% from 18.24% in November.
Core Retail Sales posted an even larger MoM miss on expectations, dropping 2.3% in December versus forecasts for a 0.2% rise, versus November's 0.1% MoM rise (which was revised lower from 0.3%). The Retail Control, which is more closely correlated to the retail consumption component in US GDP, fell 3.1% MoM versus expectations for a 0.1% gain in December.
Market Reaction
The DXY was a tad choppy but has not seemed to see much of a reaction to the latest Retail Sales report. Despite the poor figures, Retail Sales remain historically elevated on the YoY metrics, having been boosted in Q1 2021 by massive fiscal stimulus.
- USD/TRY remains directionless in the 13.6000 region on Friday.
- Cautiousness among investors is seen rising ahead of CBRT event.
- Turkey’s End Year CPI Forecast came at 29.75% in January.
USD/TRY alternates gains with losses around the 13.60/50 region at the end of the week.
USD/TRY cautious, looks to CBRT
USD/TRY remains broadly side-lined within the 13.00-14.00 range so far this year, with any bullish attempt likely to face strong resistance from intervention in the FX markets by the Turkish central bank.
On Thursday, President Erdogan defended the recently adopted scheme to protect lira deposits in an attempt to minimize the dollarization of its economy at the time when he stressed that “the swelling inflation is not in line with the realities of our country” at his testimony before the Turkish parliament.
In the docket, the End Year CPI Forecast came at 29.75% in January, up from the previous 23.85%.
What to look for around TRY
The pair moves within a 13.00-14.00 range so far this year. The higher-than-expected inflation figures released at the beginning of the year put the lira under extra pressure in combination with some cracks in the confidence among Turks regarding the government’s recently announced plan to promote the de-dollarization of the economy. In the meantime, the reluctance of the CBRT to change the (collision?) course and the omnipresent political pressure to favour lower interest rates in the current context of rampant inflation and (very) negative real interest rates are forecast to keep the domestic currency under intense pressure for the time being.
Eminent issues on the back boiler: Progress (or lack of it) of the government’s new scheme oriented to support the lira. Constant government pressure on the CBRT vs. bank’s credibility/independence. Bouts of geopolitical concerns. Much-needed structural reforms. Growth outlook vs. progress of the coronavirus pandemic. Potential assistance from the IMF in case another currency crisis re-emerges. Earlier Presidential/Parliamentary elections?
USD/TRY key levels
So far, the pair is down 0.07% at 13.5551 and a drop below 12.7523 (2022 low Jan.3) would pave the way for a test of 12.3367 (55-day SMA) and finally 10.2027 (monthly low Dec.23). On the other hand, the next up barrier lines up at 13.9319 (2022 high Jan.10) followed by 18.2582 (all-time high Dec.20) and then 19.0000 (round level).
European Central Bank President Christine Lagarde reiterated on Friday that the bank's commitment to price stability remains unwavering and that the drivers of inflation are expected to ease over the course of the year. Lagarde said that the ECB will take any measures necessary to ensure that we deliver on our inflation target of 2.0% over the medium-term, and that monetary accommodation is still needed for inflation to settle at the 2.0% target over the medium-term. Lagarde added that higher prices have been cutting into household incomes and denting confidence, while supply bottlenecks are leading to shortages in the manufacturing sector.
Market Reaction
Lagarde's remarks were nothing new and thus triggered no market reaction.
- GBP/USD has failed to push above its 200DMA on Friday despite solid UK GDP and Industrial Production data.
- The now quite overbought pair has since dropped back to the 1.3710 area, where it consolidates ahead of US data.
A much stronger than expected UK GDP growth rate in November and a promising rebound in manufacturing activity in the same month has not been enough to propel GBP/USD above its 200-day moving average at 1.3737. Indeed, having failed to break above the key level, the pair has since fallen back into the 1.3710s, though is still trading with very modest on-the-day gains of about 0.1%. Perhaps it is the fact that the UK GDP growth is expected to go into reverse in December and January amid the disruptive impact of the rapid spread of Omicron that has prevented sterling from benefitting from Friday’s strong data. Perhaps it is the fact that, with the pair trading higher by about 1.0% on the week and on course for a fourth consecutive week of gains, during which time it has rallied more than 4.0% from under 1.3200, GBP/USD looks overbought that is holding it back from further gains.
Indeed, the pair’s 14-day Relative Strength Index has been above the 70.00 level that signifies overbought conditions now for the past three sessions. This may be encouraging sterling bulls to book profit rather than chasing GBP/USD higher, even if markets are reasonably confident that, amid optimism, the impact from Omicron will be shortlived and following recent strong jobs, hot inflation and better than expected GDP data, the BoE will hike rates again in February. Whilst expectations for further BoE tightening in the coming weeks may not be enough to push cable to even loftier than current levels, it may be enough to keep the pair supported upon any retracement back to say the 1.3600 level.
Of course, much will depend on the trajectory of the dollar. Analysts are undecided about the causes of the recent sharp deterioration in USD sentiment that has sent the DXY to two-month lows under 95.00. Some have argued that, with the hawkishness of the Fed now very much priced in, focus has turned to whether this will ultimately be a policy mistake that slows down the economy, thus halting the Fed’s plans to continue tightening in 2023 and beyond. The fact that money markets are pricing a terminal rate that is well below the Fed’s guided 2.5% suggests markets are not as bullish on the US economy’s long-term prospects as the Fed and traders are saying that this has been weighing on the dollar.
Others have argued that recent weakness is purely positioning based, noting that, for example, speculator positioning in recent weeks has been as heavily long USDs at any point over the last two years. Once the “weak hands” are flushed out, the longer-term dollar bulls may be able to regain control and send the DXY higher over the course of 2022. But first things first, traders have a spate of US data to get through on Friday including the December Retail Sales report, the December Industrial Production report and the January preliminary University of Michigan Consumer Sentiment survey, as well as remarks from influential Fed’s John Williams.
- EUR/USD clocked fresh tops beyond 1.1480 at the end of the week.
- Next on the upside comes the 100-day SMA just past 1.1500.
EUR/USD managed to clinch fresh tops in the 1.1480/85 band during early trade, although it gave away those gains afterwards on Friday.
Further upside now looks likely considering the recent price action, with the next target at the 100-day SMA at 1.1505 ahead of the more relevant hurdle at the 200-week SMA at 1.1516. If the buying interest picks up extra impulse from here, then a move to October’s high at 1.1692 should start shaping up sooner rather than later.
The longer term negative outlook for EUR/USD is seen unchanged while below the key 200-day SMA at 1.1731.
EUR/USD daily chart
- DXY flirts with the 100-day SMA in the 94.60 region on Friday.
- The next contention of note comes at the 93.80 area.
The selloff in the greenback remains unabated and drags DXY to fresh 2-month lows in the vicinity of 94.60 at the end of the week.
If the downside pressure accelerates, then the next contention should emerge around 93.80, when the Federal Reserve announced at its meeting the start of QE tapering. If this level is cleared, the next support is seen at October’s low at 93.27 (October 28 2021) before the critical 200-day SMA, today at 93.12.
Looking at the broader picture, the longer-term positive stance remains unchanged above the 200-day SMA.
DXY daily chart
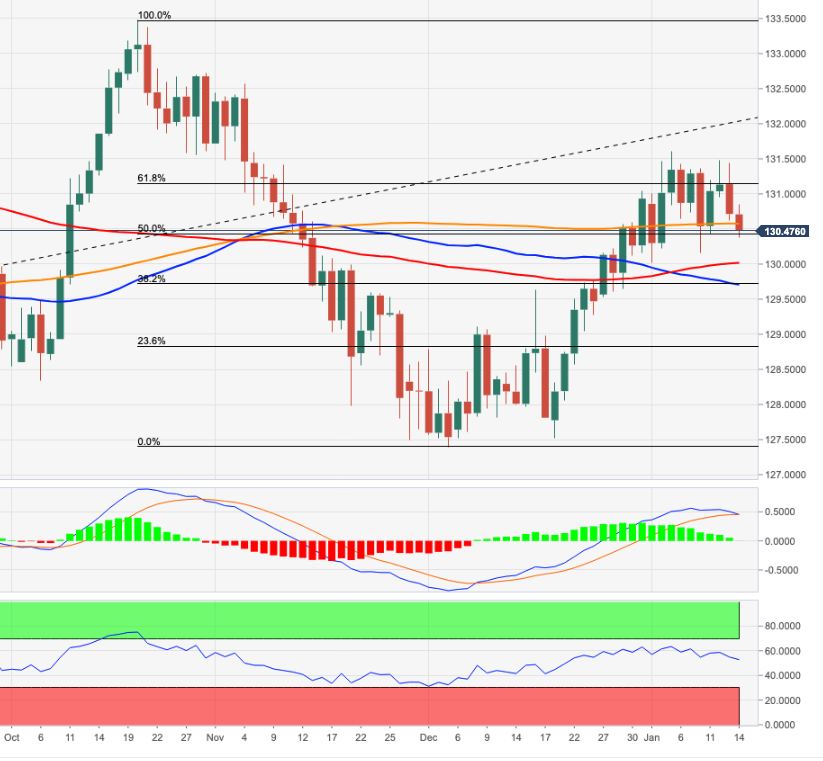
- EUR/JPY fades the recent strength and returns to 130.50.
- Price action suggests further consolidation remains on the cards.
EUR/JPY adds to the recent corrective downside and extends the break below the 131.00 mark on Friday.
As long as the cross remains capped by the YTD high at 131.60 (January 5), further side-lined trading should not be ruled out. In the meantime, occasional bearish attempts appear well contained by the 130.00 neighbourhood for the time being.
While above the 200-day SMA, today at 130.53, the outlook for EUR/JPY should remain constructive.
EUR/JPY daily chart
- WTI recaptures $82, as the broad US dollar weakness underpins.
- Concerns over China’s covid surge, falling oil imports and SPR sales threaten the rebound.
- US Retail Sales and China news eyed for fresh trading impetus.
WTI (NYMEX futures) is inching closer towards two-month highs of $82.47 reached earlier this week, staging an impressive comeback from a drop to just under $81 area.
The ongoing downbeat momentum in the US dollar is seemingly boding well for the black gold. Although it could turn out to be a ‘sell the rally’ trading in the US oil amid looming risks from the world’s second-largest oil consumer.
Markets are bracing for an imminent release of crude reserves from China. Reuters reported earlier on, China plans to release its strategic petroleum reserves (SPR) around the Lunar New Year holiday as part of a plan coordinated by the US with other major consumers to stem the price rise.
The latest Customs data showing that China posted its first annual drop in crude oil shipments in two decades in 2021 could likely weigh on the sentiment around WTI.
Additionally, the Chinese authorities have asked people not to travel during the Lunar New Year holiday break, in an effort to contain the Omicron covid variant contagion. Investors believe the Chinese restrictions could dent the demand for fuel, which could render oil-negative.
The focus now shifts towards the US weekly rigs count and Retail Sales data due to be released later this Friday for fresh trading opportunities in WTI.
WTI: Technical levels to consider
Senior Economist at UOB Group Alvin Liew comments on the latest US inflation figures.
Key Takeaways
“The latest US CPI data showed consumer price inflation surged further by 0.5% m/m, 7.0% y/y in Dec (from 0.8% m/m, 6.8% y/y in Nov), at a new record y/y pace since Jun 1982 (7.2% y/y). Core CPI (which excludes food and energy) also rose by 0.6% m/m, 5.5% y/y, from 0.5% m/m, 4.9% y/y in Nov, the highest y/y print since Jun 1991 (4.96%) The inflation outcome again did not surprise the markets as it was quite close to expectations.”
“The headline and core CPI inflation were not only higher in Dec but were also seen as spreading price pressures further among the main categories within the CPI basket.”
“Further US inflationary pressures could persist in 1H 2022 due to the confluence of a range of factors driving up prices that will take time to resolve (such as logistics bottlenecks and supply disruptions, amidst recovering demand) before turning lower in 2H. While we keep our 2022 CPI inflation at 3% and the core CPI inflation forecast at 2.5% for now, we recognise the need to upgrade the numbers if the Omicron variant of COVID-19 does materially disrupt supply chains, worsen logjams and labor shortages, all of which will inevitably add further price pressures to the US and the broader global economy.”
Germany's Federal Statistics Office, Destatis, in its latest report, showed that the economy expanded by 2.7% YoY in 2021.
Key takeaways
German economy recovering despite continuing pandemic and delivery bottlenecks.
Measured as a percentage of nominal GDP, there was a 4.3% deficit ratio of general government for 2021.
Q4 GDP likely shrank between 0.5 and 1.0 percentage points QoQ.
Dr. Georg Thiel, President of the Federal Statistical Office, “Despite the continuing pandemic situation, more delivery bottlenecks and material shortages, the German economy managed to recover from the sharp fall last year although the economic performance has not yet reached its pre-crisis level again.”
Related reads
- German Economy Ministry: Inflation upwards trend to weaken noticeably from January
- EUR/USD Forecast: 1.1530 aligns as next key resistance
Germany’s Economy Ministry said in a statement on Friday, the Inflation upwards trend to weaken noticeably from January but will still remain at the pre-crisis level.
Additional headlines
Ongoing supply bottlenecks likely to persist for a while.
Germany 2021 GDP also preliminarily confirmed at 2.7%.
German GDP grew by 2.7% in 2021.
Q4 growth to be subdued due to production difficulties, COVID-19 restrictions.
EUR/USD reaction
EUR/USD was last seen trading at 1.1465, higher by 0.10% on the day.
- Gold price hits weekly highs amid weaker US dollar despite hawkish Fed.
- Focus shifts to the US Retail Sales and Consumer Sentiment releases.
- Gold bulls strive hard to find acceptance above monthly highs of $1,832.
Gold price is easing from fresh one-week highs of $1,829, as sellers continue to lurk around the $1,830 area.
The pullback in gold price is mainly sponsored by a brief bounce in the US dollar across its main competitors, as bears take a breather ahead of the US Retail Sales release. The US dollar index is currently trading at 94.70, slightly off the two-month troughs of 94.60.
The rout in the US currency comes on the heels of a 40-year higher inflation rate, which triggered a ‘sell the fact’ reaction in the buck. Investors also believed that real returns in the Emerging Markets (EM) could be higher amid soaring inflation in America, reducing the dollar’s attractiveness.
The tech sell-off on Wall Street also added to the greenback’s misery, as gold price keeps its bullish momentum intact. However, the bright metal witnessed a sharp corrective downside on Thursday, despite the persistent weakness in the Treasury yields and the dollar, as the March Fed rate hike seems a done deal.
All eyes remain on the US Retail Sales, Michigan Consumer Sentiment and Fed official Williams’ speech before the Fed enters into a blackout period ahead of this month’s FOMC decision due on January 26.
The US Retail Sales is expected to see no growth in December vs. +0.3% booked previously. Meanwhile, the Preliminary Consumer Sentiment is seen dipping to 70.0 in January vs. 70.6 prior.
Gold Price Chart - Technical outlook
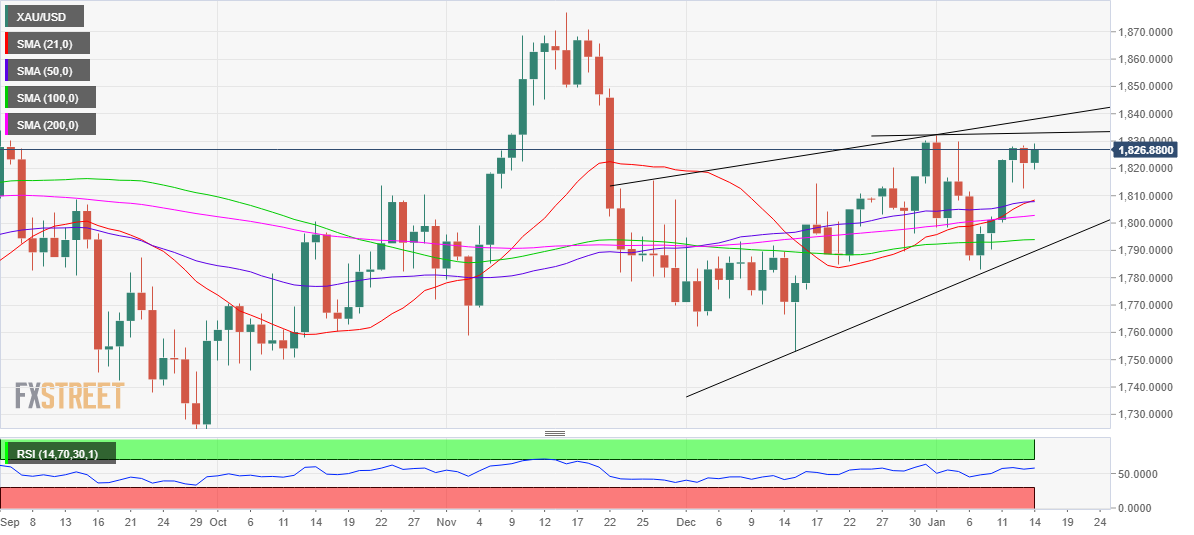
Gold: Daily chart
Gold price is consolidating near-weekly so far this Friday, gathering pace to yield a big break above the $1,831-32 supply zone. At that level, the previous week’s high and monthly highs coincide.
The next stop for gold bulls is envisioned at the rising trendline (wedge) resistance, now at $1,838.
It’s worth noting that the higher highs and higher lows formation on the said time frame since end-November has taken the shape of a rising wedge.
Daily closing above the latter will validate the wedge, calling for a fresh rally towards the $1,850 mark.
The 14-Relative Strength Index (RSI) holds well above the midline while the 21-Daily Moving Average (DMA) has crossed the 50-DMA for the upside, bolstering the bullish potential.
On the other hand, if the corrective downside picks up pace, then a retest of Thursday’s low of $1,812 will be imminent.
The further downside will challenge the 21 and 50-DMAs confluence at $1,808, below which the mildly bullish 200-DMA at $1,803 will come to the rescue of XAU bulls.
Gold: Additional technical levels to consider
UOB Group’s FX Strategists noted USD/CNH could grind lower and retest the 6.3500 level in the short-term horizon.
Key Quotes
24-hour view: “Yesterday, we highlighted that ‘the swift and sharp drop appears to be running ahead of itself but there is room for USD to dip to 6.3560’. Our expectations did not materialize as USD dipped briefly to 6.3575 before rebounding. Downward pressure has eased somewhat and USD is likely to consolidate for today, expected be between 6.3590 and 6.3700.”
Next 1-3 weeks: “Our update from yesterday (13 Jan, spot at 6.3625) still stands. As highlighted, downward momentum is beginning to build and USD is expected to trade with a downward bias towards 6.3500. A breach of 6.3780 (‘strong resistance’ level was at 6.3760 yesterday) would indicate that our view is wrong.”
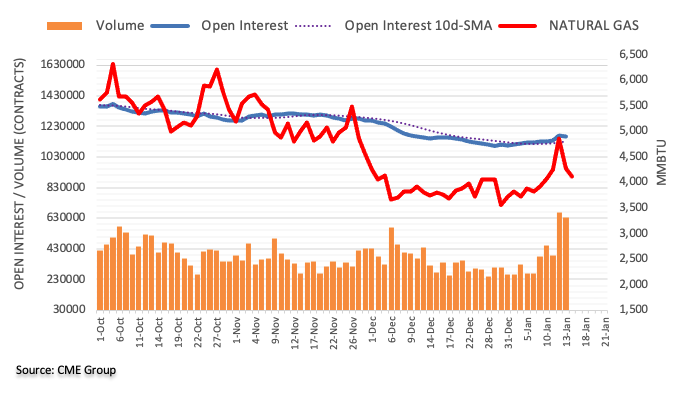
Considering flash data from CME Group for natural gas futures markets, open interest shrank by around 10.2K contracts after fourth daily builds in a row on Thursday. In the same line, volume dropped by around 36.8K contracts, partially offsetting the previous build.
Natural Gas looks propped up by the 200-day SMA
Natural gas dropped markedly and almost fully faded Wednesday’s sharp advance on Thursday. The move, however, was against the backdrop of diminishing open interest and volume, leaving the prospect for further weakness somewhat curtailed. That said, the 200-day SMA around the $4.05 level per MMBtu continues to offer decent contention for the time being.
Extra decline in USD/JPY is seen facing a tough barrier around 113.60 in the next weeks, suggested FX Strategists at UOB Group.
Key Quotes
24-hour view: “We expected USD to ‘test 114.30’ yesterday and we were of the view that ‘the next support 114.00 is not unlikely to come into the picture’. The subsequent weakness exceeded our expectations as USD dropped to 113.98 before settling on a soft note at 114.17 (-0.40%). While deeply oversold, the weakness in USD has yet to stabilize. That said, any further decline is unlikely to break the major support at 113.60 (there is another support at 113.80). Resistance is at 114.30 but only a breach of 114.50 would indicate that the current weakness has stabilized.”
Next 1-3 weeks: “We highlighted yesterday (13 Jan, spot at 114.60) that downward momentum is beginning to improve but USD has to close below 114.30 before a sustained decline can be expected. USD subsequently dropped to 113.98 before closing at 114.17 (-0.40%). While there is room for USD to weaken further, shorter-term conditions are deeply oversold and any decline is expected to encounter solid support at 113.60. Resistance is at 114.50 but only a breach of 114.75 would indicate that the current downside risk has dissipated.”
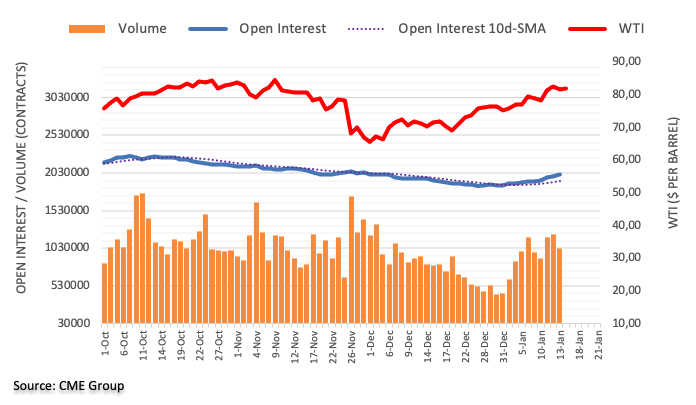
CME Group’s advanced figures for crude oil futures markets noted traders added around 27.2K contracts to their open interest positions on Thursday, extending the uptrend for yet another session. On the other hand, volume reversed two daily builds and dropped by around 192.1K contracts.
WTI still targets the $85.00 level
Thursday’s negative price action in the WTI was in tandem with rising open interest, which opens the door to further retracements in the very near term at least. In the meantime, the current constructive outlook for the commodity continues to target November’s top just below the $85.00 mark per barrel.
AUD/USD could advance further and visit the 0.7335 level in the next weeks, commented FX Strategists at UOB Group.
Key Quotes
24-hour view: “We highlighted yesterday that ‘the overbought rally in AUD has scope extend to 0.7315 before easing’. AUD subsequently rose to 0.7314 before pulling back. Conditions remain overbought and this coupled with easing momentum indicates that AUD is likely to consolidate for today, expected to be between 0.7255 and 0.7310.”
Next 1-3 weeks: “Our update from yesterday (13 Jan, spot at 0.7285) still stands. As highlighted, the solid and rapid build-up in momentum from the previous day is likely to lead to AUD advancing to 0.7335. Only a breach of 0.7215 (no change in ‘strong support’ level) would invalidate our view.”
Britain’s industrial sector witnessed a solid recovery in November, the latest UK industrial and manufacturing production data published by Office for National Statistics (ONS) showed on Friday.
Manufacturing output arrived at 1.1% MoM in November versus 0.2% expectations and 0.1% booked in October while total industrial output came in at 0.7% vs. 0.2% expected and -0.5% last.
On an annualized basis, the UK manufacturing production figures came in at 0.4% in November, beating expectations of -0.3%. Total industrial output rose by 0.1% in the eleventh month of the year against a 0.5% reading expected and the previous 0.2% print.
Separately, the UK goods trade balance numbers were published, which arrived at GBP-11.337 billion in November versus GBP-14.20 billion expectations and GBP-13.93 billion last. Total trade balance (non-EU) came in at GBP-5.665 billion in November versus GBP-8.618 billion previous.
Related reads
- GBP/USD stays unfazed above 1.37 after UK GDP beats estimates with 0.9% in November
- Forex Today: Dollar stays under pressure ahead of key US data
- UK GDP arrived at 0.9% MoM in Nov vs. 0.4% expected.
- GBP/USD is little changed around 1.3730 on upbeat UK GDP.
The UK GDP monthly release showed that the economy expanded more than expected in November, arriving at 0.9% vs. 0.4% expectations and 0.1% previous.
more to come ....
About UK GDP
The Gross Domestic Product released by the National Statistics is a measure of the total value of all goods and services produced by the UK. The GDP is considered as a broad measure of the UK economic activity. Generally speaking, a rising trend has a positive effect on the GBP, while a falling trend is seen as negative (or bearish).
- DXY tumbles to multi-week lows near the 94.60 area.
- US yields regain some traction at the end of the week.
- US Retail Sales take centre stage later in the NA session.
The greenback, in terms of the US Dollar Index (DXY), sheds further ground and drops to levels last seen in early November around 94.60, an area coincident with the 100-day SMA.
US Dollar Index looks weaker, focuses on data
The index trade on the defensive since Tuesday. Indeed, the dollar has intensified the decline after US inflation rose to levels last seen in 1982 at 7% YoY in December, while further downside pressure came following the breakdown of the 200-week SMA (95.07) and the 4m support line around 95.15.
The mild rebound in US yields does nothing to reverse the downtrend in the buck so far on Friday, with remains at the mercy of the strong improvement in the appetite for the riskier assets.
Interesting session in the US calendar, with Retail Sales emerging as the salient release seconded by Industrial/Manufacturing Production, Capacity Utilization, Business Inventories and the flash print of the Consumer Sentiment for the month of January. In addition, NY Fed J.Williams (permanent voter, centrist) is due to speak.
What to look for around USD
The index loses the grip further and sinks to fresh 2-month lows in the vicinity of 94.60, always amidst the strong performance in the risk complex and despite higher yields. On the supportive side for the greenback, Fed-speakers still point to a sooner-than-anticipated lift-off (likely in March), the persistent elevated inflation, higher yields and the solid performance of the US economy.
Key events in the US this week: Retail Sales, Industrial Production, Flash Consumer Sentiment, Business Inventories (Friday).
Eminent issues on the back boiler: Start of the Fed’s tightening cycle. US-China trade conflict under the Biden’s administration. Debt ceiling issue. Potential geopolitical effervescence vs. Russia and China.
US Dollar Index relevant levels
Now, the index is losing 0.20% at 94.67 and a break above 95.71 (55-day SMA) would open the door to 96.46 (2022 high Jan.4) and finally 96.93 (2021 high Nov.24). On the flip side, the next down barrier emerges at 94.62 (2022 low Jan.14) seconded by 93.27 (monthly low Oct.28 2021) and then 93.12 (200-day SMA).
Here is what you need to know on Friday, January 14:
The US Dollar Index closed the third straight day in the negative territory on Thursday and extended its slide to a fresh two month low near 94.60 early Friday. The slight decline witnessed in the annual Producer Price Index (PPI) on Thursday made it difficult for the dollar to find demand and the benchmark 10-year US Treasury bond yield fell nearly 2%, putting additional weight on the currency. December Retail Sales, Industrial Production data and the University of Michigan's advance Consumer Sentiment Index for January will be featured in the US economic docket.
US December Retail Sales Preview: Can dollar capitalize on upbeat data?
While testifying before the US Senate for her confirmation hearing, Fed Governor Lael Brainard noted that they will be in a position to start lifting rates as soon as the bond purchase program ends. Meanwhile, Fed Governor Christopher Waller said three rate hikes in 2022 was a good baseline and added that the Fed could start shrinking the balance sheet by summer. Although these remarks failed to lift US T-bond yields, the 10-year reference is up more than 1% at 1.72% in the Europen morning, suggesting that the dollar could show some resilience against its rivals ahead of the data releases.
EUR/USD extended its rally on Thursday and continues to push higher toward 1.1500 on Friday. Eurostat will release the November Trade Balance data later in the session but the dollar's market valuation is likely to remain the primary driver of the pair's action.
GBP/USD closed flat near 1.3700 on Thursday but clings to small gains around 1.3730 early Friday. The UK's Office for National Statistics will publish the November GDP, Trade Balance and Industrial Production during the European trading hours.
Gold staged a deep correction and slumped toward $1,810 on Thursday before regaining its traction on falling US T-bond yields later in the day. XAU/USD seems to have started the last day of the week on a firm footing and was last seen posting modest daily gains a little below $1,830.
USD/JPY broke below 114.00 for the first time in three weeks on Thursday and continued to edge lower during the Asian session. On a weekly basis, the pair is down nearly 200 pips.
Bitcoin lost its bullish momentum after testing $44,000 and lost 3% on Thursday before going into a consolidation phase around $43,000. On Thursday, Ethereum erased all the gains it posted on Wednesday but it seems to have found support near $3,200.
Analysts at TD Securities (TDS) are geared up for a positive surprise in the November GDP data from the UK amid an improvement in the services sector.
Key quotes
“We are looking for a significant upside surprise to November GDP growth, with the UK economy expanding 0.8% m/m (mkt: 0.4%) on the back of strong growth in both the services and manufacturing sectors.”
“The boost to services from the pull forward in consumer demand has yet to materialize in prior months' data, but we believe it will show up in November's numbers and result in a significant upside surprise to the IoS print, as we forecast 0.8% m/m growth while consensus looks for 0.5%.”
“We expect manufacturing to surprise to the upside as well, as we look for 0.8% m/m growth in November manufacturing output (mkt: 0.2%) with growth in motor vehicle production being a significant driver. This would altogether leave GDP on track for 1.1% q/q growth in Q4 2021—slightly above the BoE's forecast of 1.0%.”
In opinion of FX Strategists at UOB Group, further upside in Cable looks likely in the next weeks.
Key Quotes
24-hour view: “We highlighted yesterday that ‘while GBP could strengthen’, we noted ‘overbought conditions suggest a slower pace of advance and a sustained rise above 1.3740 appears unlikely’. Our view was correct as GBP rose to 1.3749 before easing off. Upward momentum is beginning to ease and this coupled with still overbought conditions suggest that GBP is likely to consolidate for today, expected to be within a range of 1.3680/1.3740.”
Next 1-3 weeks: “Yesterday (13 Jan, spot at 1.3705), we highlighted that further GBP strength would not be surprising, albeit likely at a slower pace. We noted the next resistance level is at 1.3740 followed by 1.3800. GBP subsequently rose to 1.3749 before easing off. While there is still room for GBP to advance further, the next resistance at 1.3800 may not come into the picture so soon. On the downside, a breach of 1.3640 (‘strong support’ level was at 1.3620 yesterday) would indicate that the GBP strength that started late last week has run its course.”
Open interest in gold futures markets reversed three daily builds in a row and shrank by around 11.7K contracts on Thursday according to preliminary readings from CME Group. Volume, instead, increased for the third consecutive session, this time by around 64.8K contracts.
Gold keeps targeting $1,830
Thursday’s downtick in prices of the yellow metal came in tandem with shrinking open interest, which hints at the idea that a deeper correction is not favoured for the time being. That said, gold is expected to resume the upside always targeting recent peaks in the $1,830 region per ounce troy.
- AUD/USD retreats from two-month highs before initiating fresh upside.
- The US dollar keeps its downbeat momentum intact ahead of key US data.
- Daily technical setup favors bulls, as the aussie ignores mixed China’s trade figures.
AUD/USD is looking to extend the rebound to test 0.7300 after basing out near 0.7265 in the Asian trades.
Mixed Chinese trade figures for December failed to hinder the aussie’s renewed upside, mainly driven by the broad weakness in the US dollar in the face of the 40-year high inflation levels.
The aussie also ignores the risk-off trading in the global equities, with the recovery gaining ground ahead of the US Retail Sales and Consumer Sentiment data.
AUD/USD: Technical outlook
AUD/USD: Daily chart
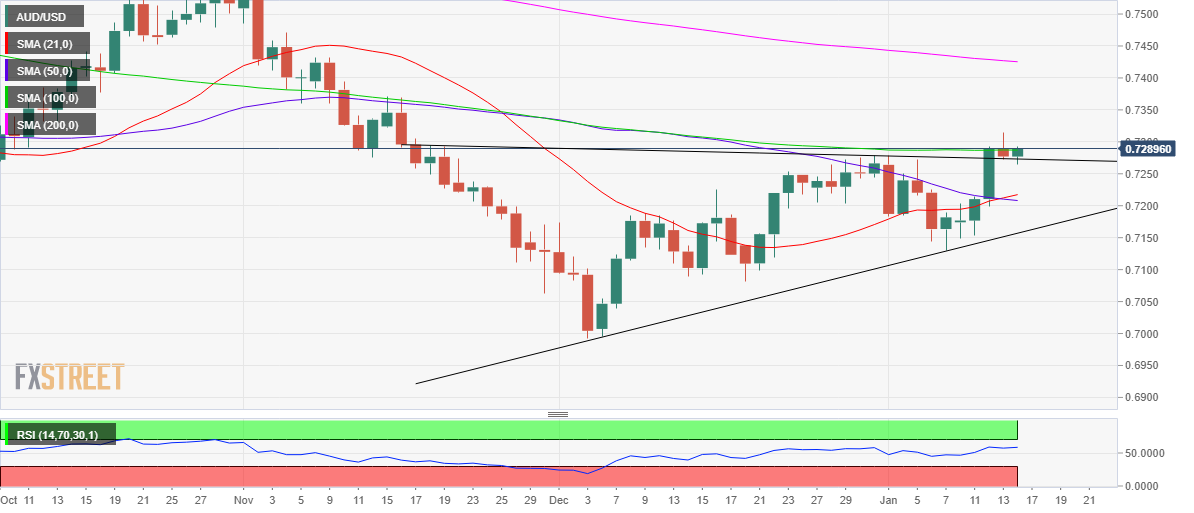
Technically, the pair is gathering pace to extend the upside breakout from an ascending triangle confirmed on Wednesday.
The 21 and 50-Daily Moving Averages (DMA) bullish crossover also remains in favor of AUD bulls.
Strong resistance is seen at 0.7300, followed by two-month highs of 0.7315. Further up, the bulls may challenge the 0.7350 psychological barrier.
The 14-day Relative Strength Index (RSI) is gradually inching higher above the midline, justifying the bounce in the spot.
Although buyers need to find acceptance above the 100-DMA at 0.7288 to push northwards.
Alternatively, the corrective pullback will likely remain capped near-daily lows, below which the 0.7200 level could be eyed.
AUD/USD: Additional levels to consider
FX Strategists at UOB Group now sees EUR/USD facing some near-term consolidation ahead of a potential move beyond 1.1500 the figure.
Key Quotes
24-hour view: “We highlighted yesterday ‘solid upward momentum suggests that EUR could strengthen further to 1.1470’. We added, ‘the next resistance at 1.1515 is however, likely out of reach’. Our view was not wrong as EUR rose to 1.1481 before easing off. Upward momentum has waned somewhat and this coupled with overbought conditions suggests that EUR is unlikely to strengthen much further. For today, EUR is more likely to consolidate and trade between 1.1435 and 1.1485.”
Next 1-3 weeks: “Yesterday (13 Jan, spot at 1.1440), we highlighted that EUR ‘is likely to continue to march higher’. We indicated that ‘the next resistance is at 1.1470 followed by 1.1515’. EUR subsequently rose to 1.1481 before easing off. We continue to expect EUR to move higher towards 1.1515 even though overbought shorter-term conditions could lead to a couple of days of consolidation first. Overall, only a breach of 1.1390 (‘strong support’ level was at 1.1370 yesterday) would indicate that the current upward pressure has eased.”
- EUR/USD moves to fresh 2-month highs around 1.1480.
- The dollar remains under heavy pressure drops to multi-week lows.
- Germany GDP ECB’s Lagarde next of note in the docket.
The upbeat note around the single currency remains well and sound on Friday and lifts EUR/USD to new 2-month peaks in the 1.1480 region.
EUR/USD looks to data, Lagarde
EUR/USD advances for the fourth session in a row and gradually approaches the key barrier in the 1.1500 neighbourhood at the end of the week.
Indeed, the firm improvement in the risk complex remains underpinned by the acute selloff in the greenback, which has dragged the US Dollar Index (DXY) to levels last seen in early November 2021 in the 94.60 zone.
It is worth recalling that the dollar accelerated the downside in the wake of the release of December’s inflation figures (Wednesday), while US yields seem to be regaining some traction ahead of the opening bell in the old continent.
In the docket, Chairwoman C.Lagarde will speak later in the European afternoon. Data wise, Germany’s Annual GDP figures are due seconded by Trade Balance figures in the broader euro area. Across the pond, Retail Sales will grab all the attention followed by Industrial Production, the flash reading of the Consumer Sentiment and the speech by NY Fed J.Wiliiams.
What to look for around EUR
EUR/USD pops higher and already flirts with the key 1.1500 neighbourhood, or 2-month tops. The acute pullback in the US dollar follows the somewhat “disappointing” US inflation figures during December, although they did not change the view that the Federal Reserve could likely start its tightening cycle as soon as at the March meeting, exacerbating the policy divergence between the ECB vs. the Fed. On another front, the unabated advance of the coronavirus pandemic remains as the exclusive factor to look at when it comes to economic growth prospects and investors’ morale.
Key events in the euro area this week: Germany Full Year GDP Growth 2021, ECB C.Lagarde (Friday).
Eminent issues on the back boiler: Asymmetric economic recovery post-pandemic in the euro area. ECB stance/potential reaction to the persistent elevated inflation in the region. ECB tapering speculation/rate path. Italy elects President of the Republic in late January. Presidential elections in France in April.
EUR/USD levels to watch
So far, spot is gaining 0.21% at 1.1479 and faces the next up barrier at 1.1505 (100-day SMA) followed by 1.1516 (200-week SMA) and finally 1.1692 (monthly high Oct.18 2021). On the other hand, a break below 1.1356 (55-day SMA) would target 1.1272 (2022 low Jan.4) en route to 1.1221 (monthly low Dec.15 2021).
Research analysts at ING bank offer their afterthoughts on the Bank of Korea’s (BOK) second consecutive rate hike at its monetary policy meeting on Friday.
Key quotes
“If the January rate hike by the Bank of Korea (BoK) from 1.0% to 1.25% was consensus, the subsequent press briefing was anything but.”
“The Bank of Korea (BoK) has a reputation for being hawkish, and they have lived up to that today.”
“Even today's decision was controversial. Korea has been weathering a new Covid wave and this and the resulting movement restrictions on the population led to a spike in the December unemployment rate that could easily have been used as an excuse to pause at this meeting, and resume hiking later.”
- USD/CAD stalls rebound from two-month lows of 1.2453 amid DXY weakness.
- The retreat in WTI prices fails to deter CAD bulls ahead of key US Retail Sales.
- The pair clings onto the 200-DMA, bears await acceptance below that support.
USD/CAD is battling 1.2500, unable to sustain the recovery rally from nine-week lows of 1.2453 reached on Thursday.
The persistent weakness in the US dollar, despite the uptick in the Treasury yields, recalls sellers, as investors remain wary ahead of the critical US Retail Sales and prelim UoM Consumer Sentiment releases.
The currency pair shrugs off the pullback in WTI price from a two-month top of $82.45, as CAD bulls remain undeterred. Oil prices ease from higher levels amid dwindling energy demand from China and concerns that the US may soon act to cool off prices. China's annual crude oil imports slid 5.4% in 2021, dropping for the first time since 2001.
Technically, USD/CAD is testing the bullish commitments at the critical 200-Daily Moving Average (DMA) at 1.2501, having managed to recapture the latter on Thursday after a sharp sell-off under the key support level.
A sustained move below the latter will call for a retest of the two-month lows near 1.2450, below which the further downside will open up towards 1.2400.
The 14-day Relative Strength Index (RSI) is holding well below the midline, suggesting that the rebound was short-lived.
USD/CAD: Daily chart
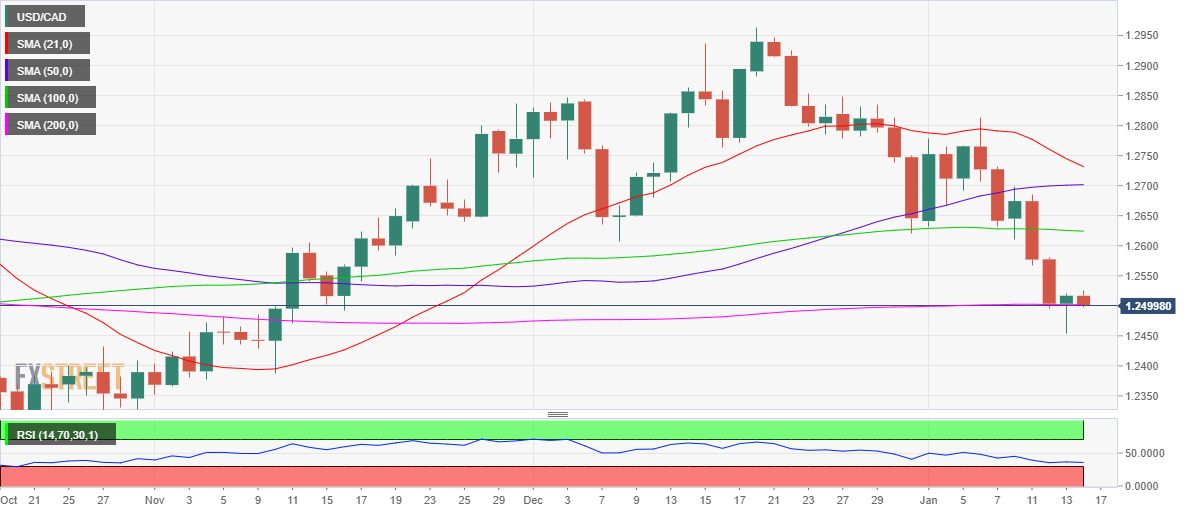
On the other hand, if the recovery momentum revives, then bulls could once again move towards the 1.2550 psychological barrier.
The next relevant bullish target is then seen at Wednesday’s high of 1.2579, paving way for a fresh advance towards 1.2600 – the round level.
USD/CAD: Additional levels to consider
Analysts at Australia and New Zealand (ANZ) banking group believe that the Reserve Bank of Australia (RBA) will bring an end to its quantitative easing (QE) program next month, despite the emergence of Omicron impact.
Key quotes
“We think the improvement in the RBA’s medium-term economic outlook and the more hawkish stance of the US Fed will lead it to end QE in February. “
“The fact that the RBA sees weekly bond purchases as additional support is critical to this decision.”
“Reflecting the risks to the outlook posed by Omicron, we think the RBA will defer for a few months the decision on whether to start quantitative tightening, ie whether to reinvest the proceeds of maturing bonds.”
- USD/INR rebounds for the second straight day on Friday, despite DXY’s weakness.
- Despite the bounce, the pair is in a bearish consolidation phase.
- Has the spot found a near-term bottom near the 73.75 area?
USD/INR is looking to build onto its previous rebound from near four-month troughs of 73.73, as bulls yearn for acceptance above the 74.00 mark.
The ongoing weakness in the US dollar fails to have any impact on the pair’s recovery, as the sentiment around the Indian rupee deteriorated amid the surging coronavirus case in the world’s second-largest populous country.
India reports a 264,202 daily rise in coronavirus infections this Friday, the highest since May 20, against 247,147 reported on Thursday.
Meanwhile, the minor correction in oil prices is also ignored by INR bulls, as the road to recovery extends ahead of the US Retail Sales release.
At the time of writing, the spot is trading close to the daily lows of 74.00, eyeing a sustained move above the latter.
Bulls will then see a fresh upswing towards the horizontal 200-Daily Moving Average (DMA) at 74.28, above which the 100-DMA at 74.53 will get tested.
Further up, the January high of 74.69 will be on buyers’ radars.
USD/INR: Daily chart
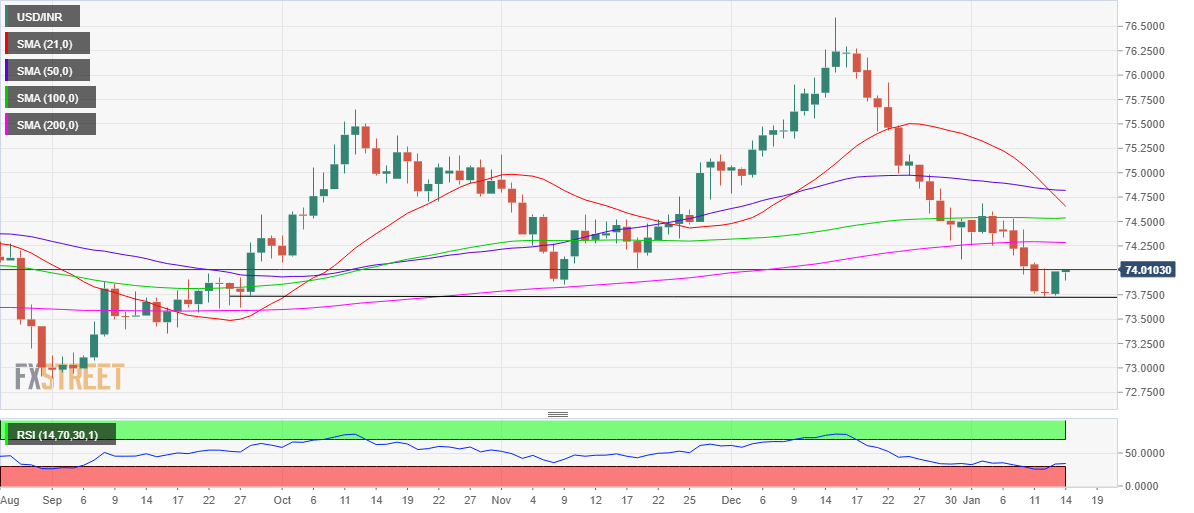
The 14-day Relative Strength Index (RSI), however, remains below the midline while recovering from the oversold territory, suggesting that the bearish bias remains intact in the near term.
The immediate cushion is seen at the November 9 lows of 73.85. The four-month lows will be back in the spotlight if the latter caves into the bearish pressures.
USD/INR: Additional levels
- GBP/USD has been creeping steadily higher in the face of a softer US dollar.
- Some hawkish tones have been dialled down at the Fed by recent comments from officials.
At 1.3729, GBP/USD is higher on the day so far, trading up 0.16% after climbing from a low of 1.3705. The price is stalling here but the US dollar has been on the backfoot and the pound is lapping it up. The Bank of England has been one of the more hawkish of the central banks.
''One of the factors that could trigger further corrective activity in the USD relates to expectations about other G10 central banks,'' analysts at Rabobank said. ''The GBP has found some support on the back of the BoE’s 15 bps rate rise last month and on market expectations of further tightening this year (which we consider to be overdone).''
Meanwhile, the US dollar has been pressured due to some of the less hawkish comments of late, including both the Federal Reserve chair, Jerome Powell, and Philly Fed President Patrick Harker.
On Thursday, Harker said he sees the Fed starting to shrink its balance sheet “in late 2022 or early 2023” after the central bank has raised its target rate sufficiently, to around 1 per cent from near zero. The comments echoed that of Powell who said the Fed could start to shrink its balance sheet later this year.
''We're going to end our asset purchases in March, meaning we'll be raising rates over the course of the year," Powell said on Tuesday at his confirmation hearing before the Senate Banking Committee.
"At some point, perhaps later this year, we will start to allow the balance sheet to run off, and that's just the road to normalising policy," he said, adding the US economy "no longer needs or wants" the Fed's very highly accommodative policies.
Looking ahead, ears will be to the ground for Fed's New York president, John Williams. Then, the Fed will move into its blackout period until the next interest rate decision later this month. This leaves US data in focus. In this regard, Retail Sales will be of interest today.
Analysts at TD Securities explained that Retail Sales probably fell in December, even with higher prices boosting nominal values. ''Spending was likely held down by the fading of fiscal stimulus, payback for earlier-than-usual holiday shopping, and Omicron. We look for a notable 1.4% MoM decline in total sales (consensus: -0.1%) and a larger 2.0% retreat for the control group (consensus: flat). Real as well as nominal spending was likely still up solidly on QoQ basis and strongly on a YoY basis.''
During a post-monetary policy meeting press conference on Friday, the Bank of Korea (BOK) Governor Lee Ju-yeol said that he “Still see a need to further adjust policy rates.”
Additional quotes
Friday's rate decision was not unanimous.
Board member Joo sang-yong dissented to Friday’s rate decision
Current policy rate still accommodative.
Reaching policy rate of 1.5% still can't be viewed as 'tightened'.
Will actively deploy policies to stabilize markets if needed.
Market reaction
USD/KRW was last seen trading at 1,187.70, up 0.08% so far.
- AUD/USD bears remain in charge and target 0.72 the figure.
- Fed expectations continue to favour a strong US dollar.
AUD/USD has been stabilising in recent trade following a sell-off overnight into the lows of the Asian session near 0.7264. At the time of writing, AUD/USD is down some 0.12% around 0.7270 after sliding from 0.7283 on the session so far.
There has been little in the way of a catalyst out there on the economic calendar but China reported its trade balance in recent trade. A surplus of US$94.46bn was reported with exports +20.9% YoY and imports +19.5% YoY.
Meanwhile, the data failed to move the needle and instead, the US dollar is has been attempting to correct which has weighed on the Aussie. A slightly risk-off environment has also played its role with US equity markets softening overnight and reversing the recent upward trend.
The hawks continue to circle over the Federal Reserve and Lael Brainard said the Fed could raise rates as soon as asset purchases are terminated, which is due to occur in March.
We now look ahead to the Fed interest rate decision later this month, with New York Fed president, John Williams, the only speaker slated before the blackout period officials start this weekend. There could be some price action in the greenback centred around his comments that would potentially see the stock markets and the Aussie reacting in kind. US Retail Sales is also on the cards as a potential market mover.
AUD/USD technical analysis
Meanwhile, from a technical outlook, the price action since the prior analysis has moved in on the old resistance and a break there opens risk to the 38.2% Fibonacci and the neckline of the W-formation near 0.7250:
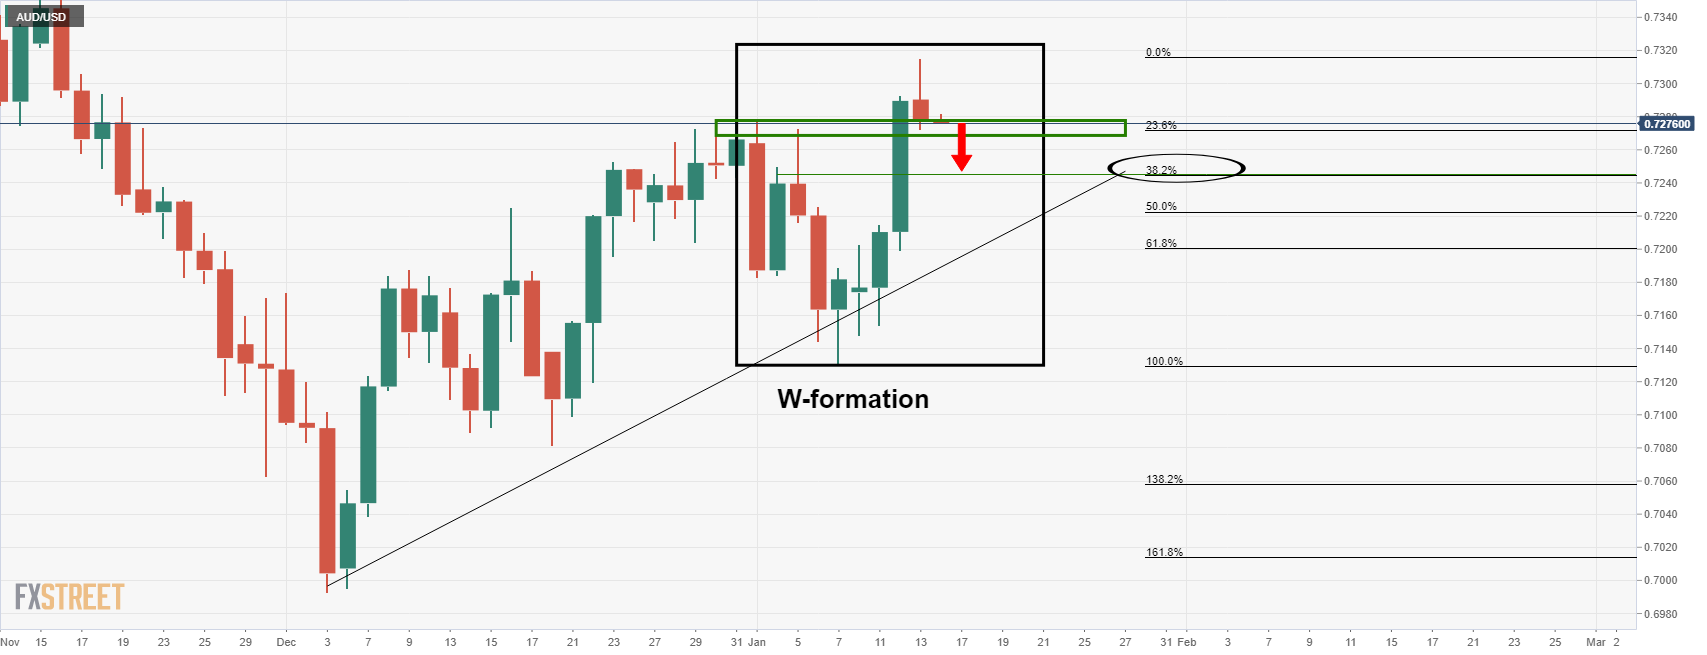
Below there, it can be argued that there is another W-formation, depending on the broker and close of the candle. However, it is a compelling level nonetheless as it meets the 0.72 figure and a confluence of the 61.8% Fibonacci level as follows:
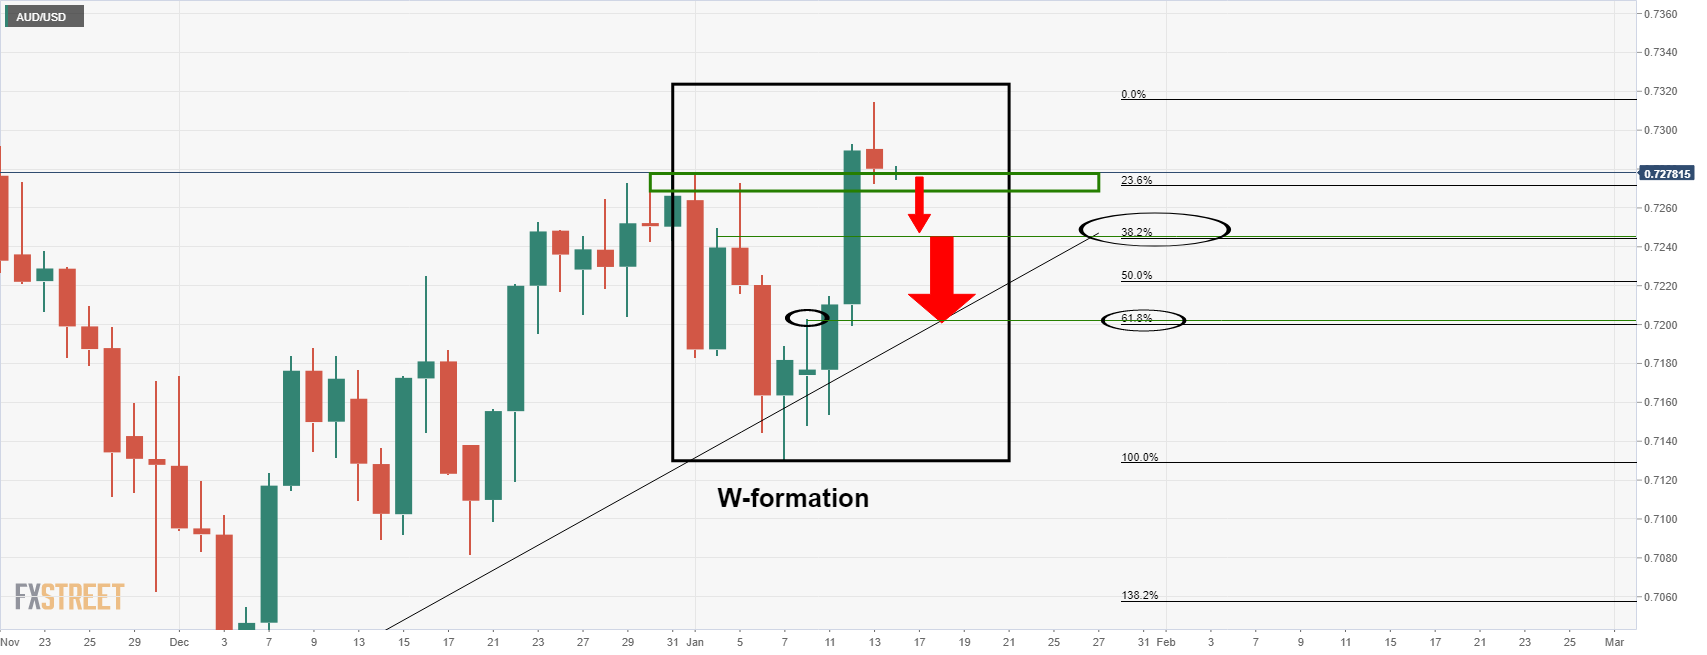
In USD terms,
China reported a bigger-than-expected growth in the trade surplus, as imports dropped while exports outpaced expectations.
Trade Balance came in at 94.46B versus +74.50B expected and +71.72B previous.
Exports (YoY): +20.9% vs. +20% exp. and +22% prior.
Imports (YoY): +19.5% vs. +26.3% exp. and +31.4% last.
Additional takeaways
China Dec trade surplus with the US $39.23B.
China 2021 trade surplus with US $396.58B.
China 2021 yuan-denominated exports +21.2%.
China 2021 yuan-denominated imports +21.5%.
China 2021 dollar-denominated imports +30.1%.
China 2021 dollar-denominated exports +29.9%.
Bank of Japan (BOJ) policymakers are debating how soon they can start telegraphing an eventual interest rate hike, which could come even before inflation hits the bank's 2% target, emboldened by broadening price rises and a more hawkish Federal Reserve, Reuters reports, citing sources,
“While an actual rate hike is hardly imminent and the BOJ is on course to maintain ultra-loose policy at least for the rest of this year, financial markets may be underestimating its readiness to gradually phase out its once-radical stimulus program,” the sources added.
Market reaction
USD/JPY has lost further ground on these above headlines, currently hitting three-week lows of 113.75. The spot is down 0.33% on the day.
USD/JPY: 15-minutes chart
-637777252697367583.png)
| Raw materials | Closed | Change, % |
|---|---|---|
| Brent | 83.97 | -1.1 |
| Silver | 23.087 | -0.33 |
| Gold | 1822.682 | -0.18 |
| Palladium | 1884.92 | -1.24 |
- USD/TRY bulls are coming up for air into resistance.
- USD/TRY bulls need to break the neckline of the M-formation.
Technically, USD/TRY is stuck in a sideways range between the 13.00 and 14.00 areas. From a political front, the lira could find further stability as we approach planned elections scheduled for no later than mid-2023.
The economic turmoil has already started to hit President Erdogan's opinion poll ratings as Erdogan's scheme to curb the lira's weakness has been seen to fail.
However, as the technical outlook stands, there is a case for both the bulls and bears while the price continues to consolidate in familiar territory as follows:
USD/TRY daily chart
-637777229225918666.png)
The price is on the verge of either a breakout to the upside or downside according to the daily chart's structure and price action. Zooming in, we can identify a resistance according to the M-formation's neckline as follows:
-637777231591529895.png)
The M-formation is a reversion pattern that has a high completion rate of the rice moving back in to test the neckline of the formation. In this case, there was very little in the way of downside before the correction. Therefore, at his juncture, the price could well keep going higher to break the structure:
-637777233832635652.png)
DXY daily chart
The US dollar, meanwhile, is meeting daily support and would be expected to correct at this juncture, which would lean bullish for USD/TRY:
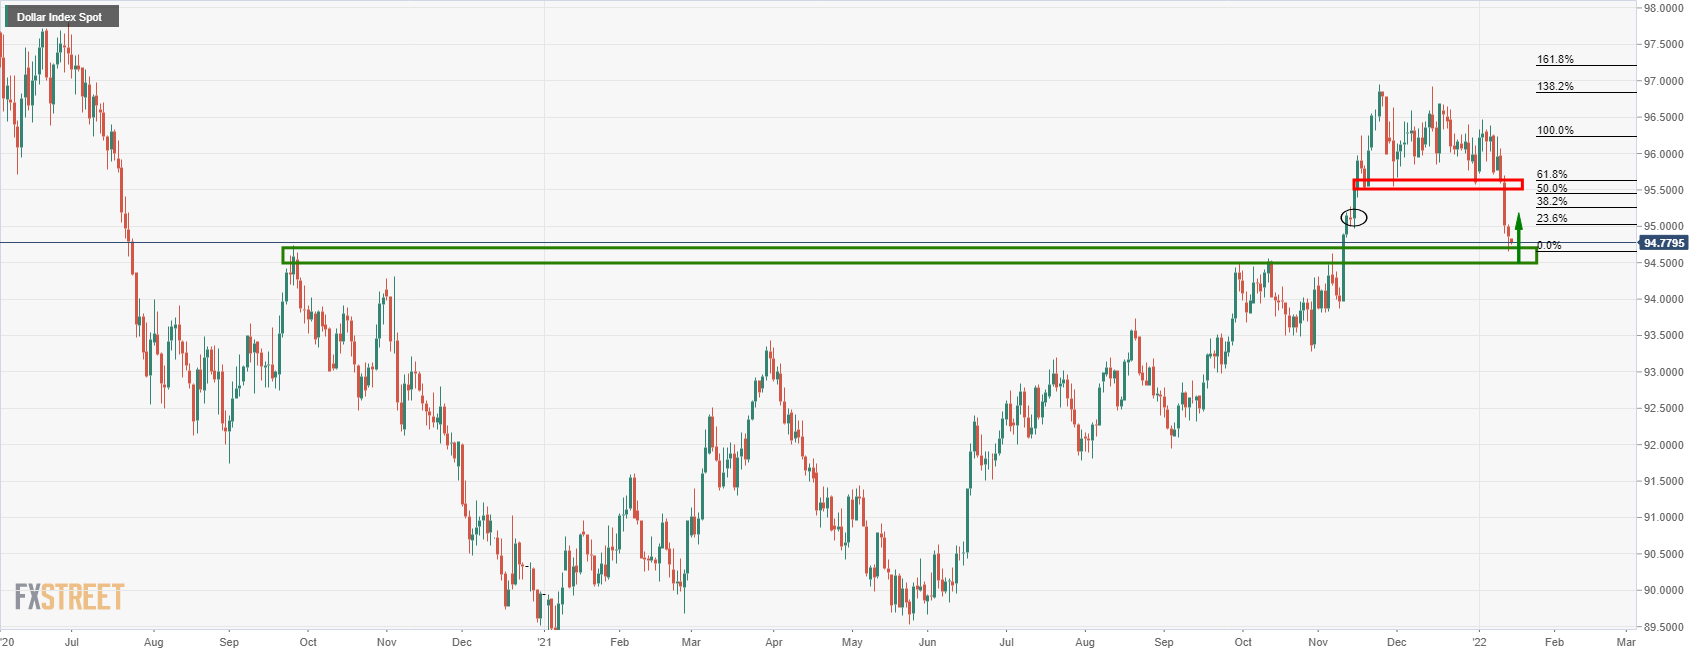
- EUR/USD meets critical resistance and could be on the verge of a correction.
- The bears will be looking for a restest of the 1.1400 area.
- Bulls have their eyes on longer-term 1.17 area as a monthly objective.
The price of EUR/USD is leaving a monthly M-formation which is seen with ease on the line chart for which is a reversion pattern. The price would be expected to revisit the neckline of the formation, in which case in the above illustration is identified near 1.1730.
EUR/USD monthly chart
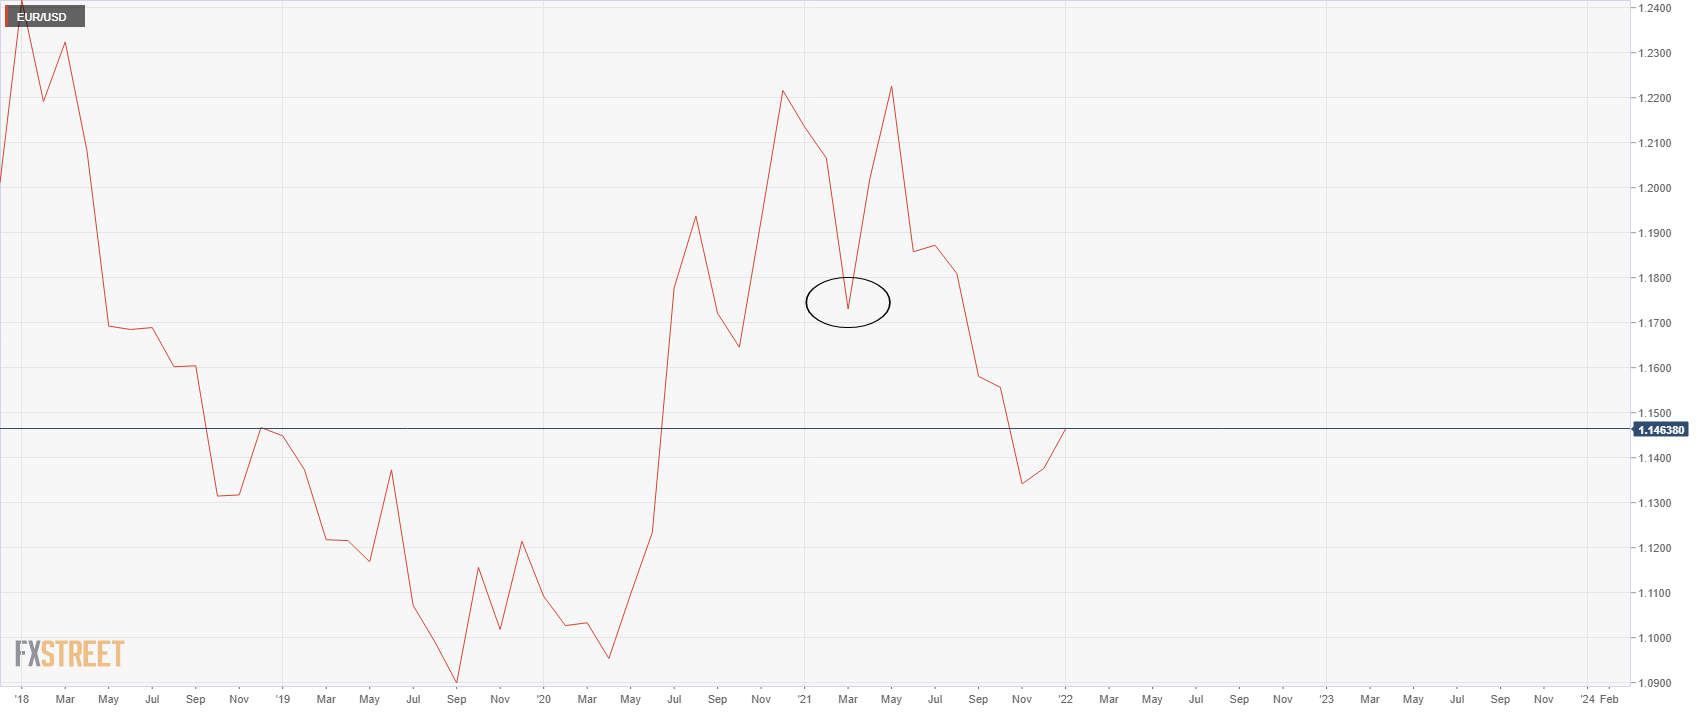
However, there is plenty of resistance structure on the way there and ground to cover. The first notable area of resistance will be within the 1.15 area as seen on the daily chart as follows:
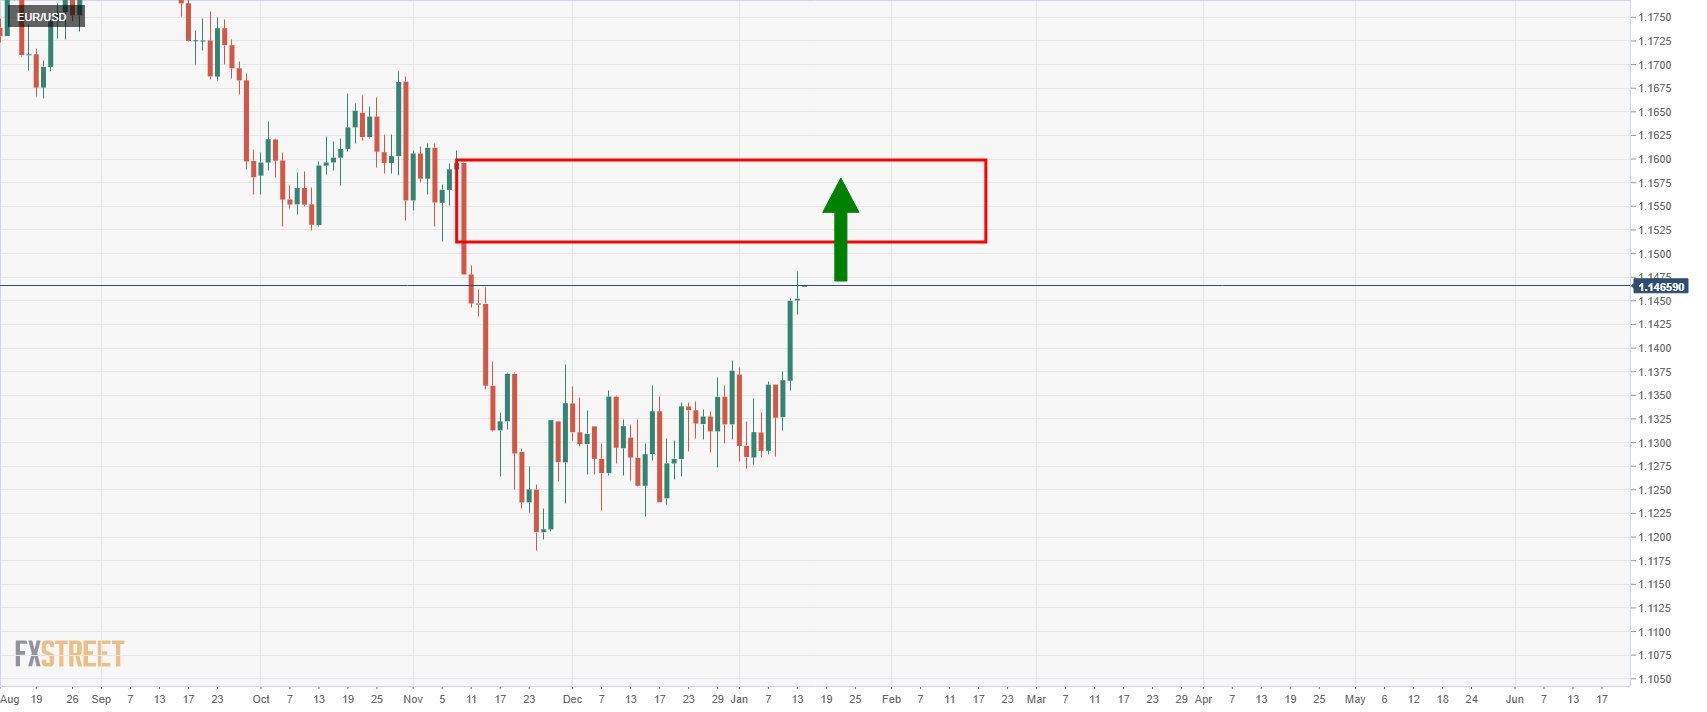
the, on a lower time frame basis, we can identify some Wycoff methodology characteristics as follows:
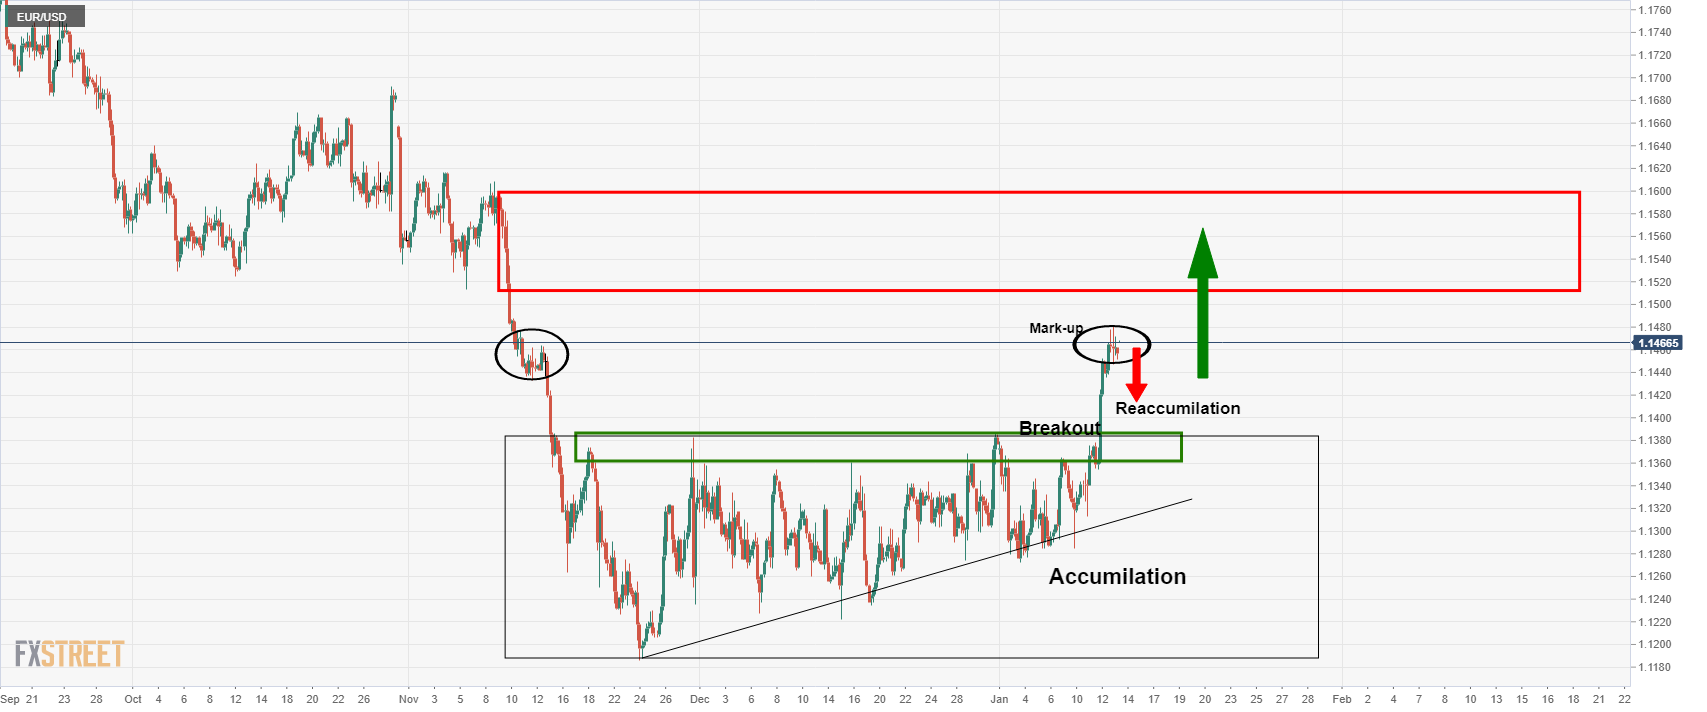
The 4-hour chart shows a period of accumulation that has recently seen a breakout, termed as the ''mark-up''. There is only so far that the price can rally before it meets sellers and should the buyers move in at a discount, then the price would be expected to ''accumulate'' and move higher to mitigate the next imbalance of price towards the monthly M-formation's neckline.
This process would be expected to take days, if not weeks to play out, however:
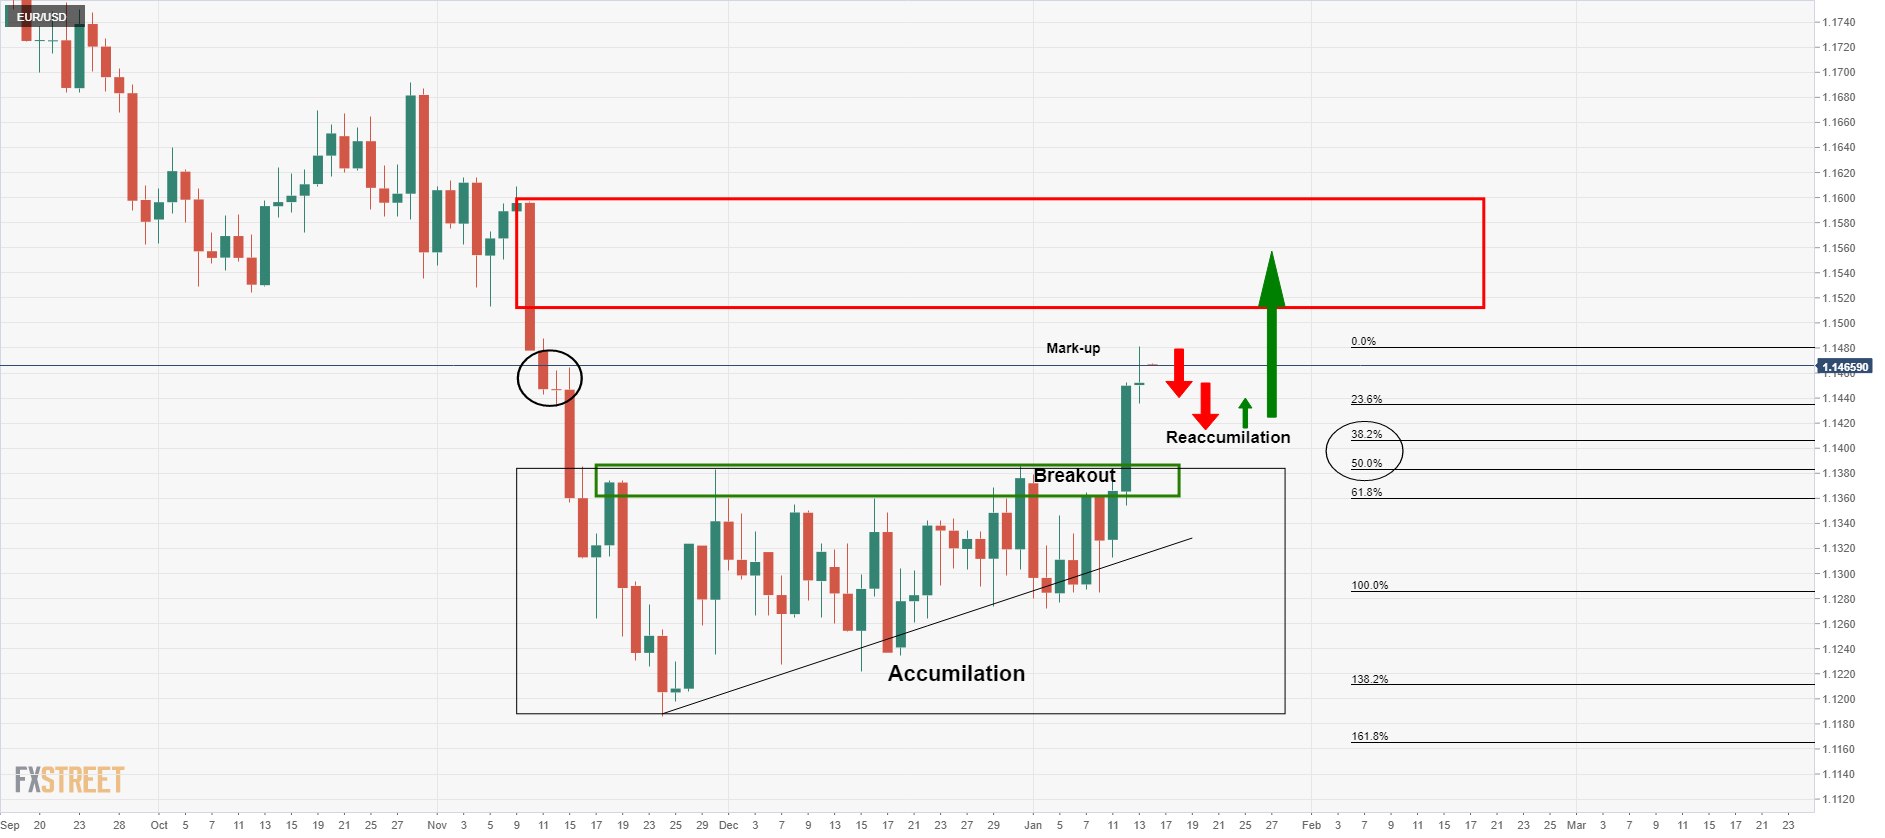
From a daily perspective, the bears will have their eye son at least a 38.2% Fibo retracement towards 1.14 the figure of not a full 50% mean reversion to the breakout point near 1.1380.
In the meantime, a sideways period of consolidation would be expected as per the following hourly chart:
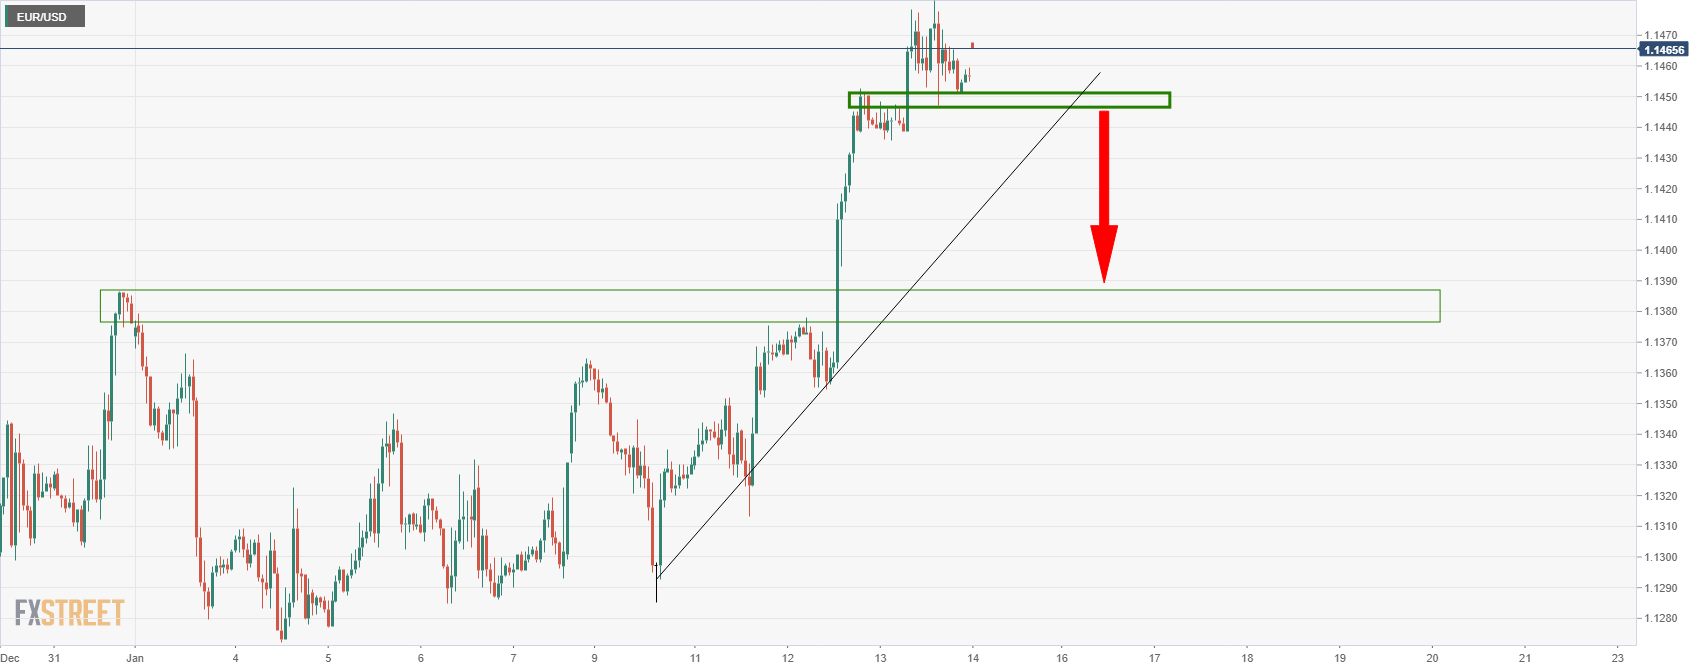
The People’s Bank of China (PBOC) set the USD/CNY reference rate at 6.3677 on Friday when compared to the previous fix and the previous close at 6.3542 and 6.3602 respectively.
| Time | Country | Event | Period | Previous value | Forecast |
|---|---|---|---|---|---|
| 03:00 (GMT) | China | Trade Balance, bln | December | 71.72 | 74.5 |
| 07:00 (GMT) | United Kingdom | Manufacturing Production (MoM) | November | 0% | 0.2% |
| 07:00 (GMT) | United Kingdom | Industrial Production (YoY) | November | 1.4% | 0.5% |
| 07:00 (GMT) | United Kingdom | Manufacturing Production (YoY) | November | 1.3% | -0.3% |
| 07:00 (GMT) | United Kingdom | Industrial Production (MoM) | November | -0.6% | 0.2% |
| 07:00 (GMT) | United Kingdom | GDP, y/y | November | 4.6% | 7.5% |
| 07:00 (GMT) | United Kingdom | Total Trade Balance | November | -2.027 | |
| 07:00 (GMT) | United Kingdom | GDP m/m | November | 0.1% | 0.4% |
| 07:45 (GMT) | France | CPI, y/y | December | 2.8% | 2.8% |
| 07:45 (GMT) | France | CPI, m/m | December | 0.4% | 0.2% |
| 10:00 (GMT) | Eurozone | Trade balance unadjusted | November | 3.6 | |
| 13:00 (GMT) | United Kingdom | NIESR GDP Estimate | December | 0.9% | |
| 13:15 (GMT) | Eurozone | ECB President Lagarde Speaks | |||
| 13:30 (GMT) | U.S. | Import Price Index | December | 0.7% | 0.3% |
| 13:30 (GMT) | U.S. | Retail Sales YoY | December | 18.2% | |
| 13:30 (GMT) | U.S. | Retail sales excluding auto | December | 0.3% | 0.2% |
| 13:30 (GMT) | U.S. | Retail sales | December | 0.3% | 0% |
| 14:15 (GMT) | U.S. | Capacity Utilization | December | 76.8% | 77% |
| 14:15 (GMT) | U.S. | Industrial Production YoY | December | 5.3% | |
| 14:15 (GMT) | U.S. | Industrial Production (MoM) | December | 0.5% | 0.3% |
| 15:00 (GMT) | U.S. | Business inventories | November | 1.2% | 1.3% |
| 15:00 (GMT) | U.S. | Reuters/Michigan Consumer Sentiment Index | January | 70.6 | 70 |
| 16:00 (GMT) | U.S. | FOMC Member Williams Speaks | |||
| 18:00 (GMT) | U.S. | Baker Hughes Oil Rig Count | January | 481 |
Analysts at TD Securities (TDS) offer a sneak peek at what they expect from Friday’s Chinese trade data release.
Key quotes
“China's exports and imports have held up remarkably well over recent months, with trade proving to be resilient even as other parts of the economy slow.”
“Indications from weak PMI exports and imports components have not come to fruition and we expect this to continue, with trade likely to remain firm.”
“For December we forecast a 22.6% y/y (cons. 19%) increase in exports and 31.2% y/y (cons. 27.6%) increase in imports, both in USD terms. As indicated by solid South Korean imports demand from China over the month (27.1% y/y), exports are likely to perform well.”
“We expect stay at home goods and medical equipment to continue to lead exports demand, especially given the rapid spread of Omicron. Support measures and some easing in import restrictions are likely to also help buoy Chinese imports demand.”
The Bank of Korea (BOK) hiked the benchmark interest rates for the second straight meeting in January 2022.
The first meeting of this year saw the central bank raising the base rate by 25bps to 1.25%, bringing it to the pre-pandemic level.
Key takeaways from the Summary
S. Korea economic growth path in line with BOK’s earlier projection.
Exports growth to sustain favorable momentum.
Private consumption improvement to strengthen.
To monitor monetary policy changes abroad.
Consumer price inflation to exceed path expected earlier for some time.
To monitor build-up of financial imbalances.
To monitor covid-19 developments.
To monitor pace of growth, inflation.
Consumer price inflation to run above mid-2%.
Household debt growth slowed somewhat.
Core inflation to increase considerably above 2%.
Rise in housing prices has eased.
Consumer inflation to stay in the 3%-range for a while.
Market reaction
USD/KRW spikes to daily highs of 1,189.53 on the expected BOK rate hike, extending the previous recovery.
The spot was last seen trading at 1,189, up 0.20% on a daily basis.
- USD/JPY eyes deeper losses below 114.00 on DXY weakness.
- US Treasury yields attempt a bounce ahead of Retail Sales.
- Bearish wedge confirmation and daily close below 50-DMA cheer bears.
USD/JPY is flirting with three-week lows, losing the 114.00 level amid persistent weakness in the US dollar against its main peers and a technical breakdown on the daily sticks.
The slump in the greenback that ensued after the 40-year US high inflation numbers triggered “sell the news” in the dollar. The US currency continues to bear the brunt of the view that the real return is higher in Emerging Markets (EM).
Despite the renewed uptick in the US Treasury yields, USD/JPY bears remain unimpressed, at the time of writing, as traders refrain from creating any fresh positions in the major ahead of the key US Retail Sales release.
Additionally, the risk-off trading in the global indices offers support to the safe-haven yen, collaborating with the downside in the pair. Aggressive Fed’s tightening expectations spurred by hawkish Fedspeak weigh on the risk-sensitive equity markets worldwide.
USD/JPY: Technical outlook
USD/JPY’s daily chart shows that the price has confirmed a rising wedge breakdown after closing Thursday below the ascending trendline support at 114.23. At that level, the mildly bullish 50-Daily Moving Average (DMA) also coincided.
The bearish wedge opens floors for additional losses towards the upward-sloping 100-DMA at 113.01. Ahead of that, the December 20 low of 113.32.
The 14-day Relative Strength Index (RSI) is pointing south below 50.00, allowing room for more declines.
USD/JPY: Daily chart
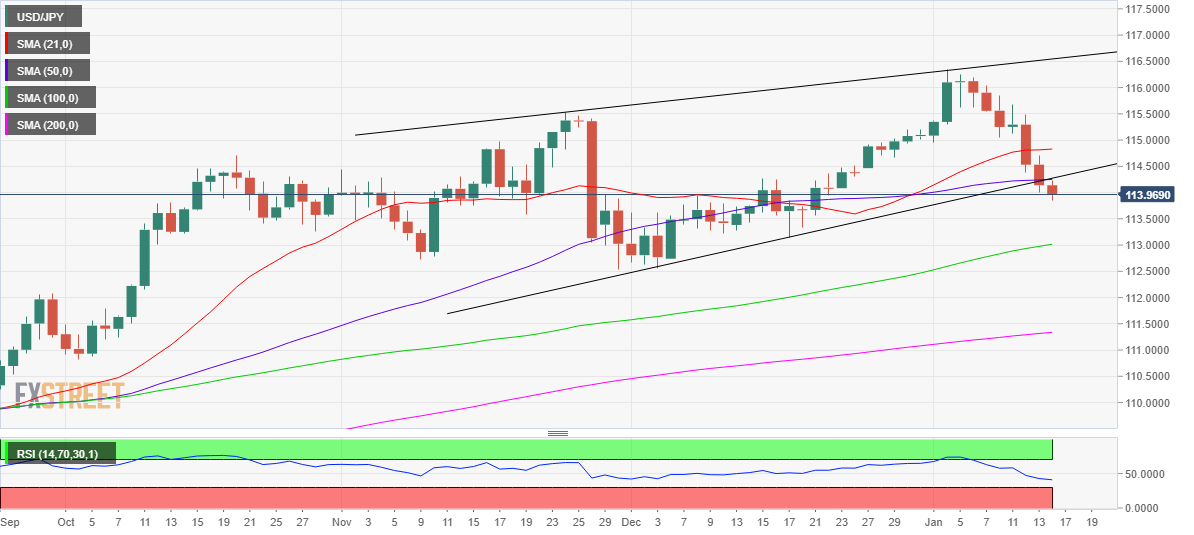
Any retracement will need acceptance above the aforesaid critical support now resistance at 114.23.
The next bullish target is seen at the 21-DMA of 114.82 on the road to recovery should 114.50 get cleared on a sustained basis.
USD/JPY: Additional levels to consider
- Gold is under pressure as the greenback attempts to correct ahead of Retail Sales.
- XAU/USD bears eye a run to $1,800 if $1,810 breaks.
The price of gold in Asia is under pressure as the US dollar stabilises following a series of down days for the greenback. XAU/USD is trading around $1,820 and down some 0.1% while the DXY index attempts to correct from the depths of the late December to YTD sell-off.
The US dollar, as measured by the DXY index, sold off from 96.90 to a recent low of 94.66. In as many weeks, XAU/USD has climbed over 4%. However, in what could be more of a technical move, the yellow metal had failed to capitalise on the fall of US yields and the greenback on Thursday.
DXY dropped 0.4% and the US 10-year yield was down 2.5bps at 1.718%. ''Sustained weakness in the US dollar failed to push gold prices higher, as investors look concerned about Fed’s hawkish move to contain inflation,'' analysts at ANZ Bank argued.
However, this would not explain why the greenback and yields keep falling. Instead, the bond market appears to be repricing the pace of the Fed's balance sheet run-off following less hawkish rhetoric from Fed members, Jerome Powell, the chairman, and Philly Fed President Patrick Harker.
On Thursday, Harker said he sees the Fed starting to shrink its balance sheet “in late 2022 or early 2023” after the central bank has raised its target rate sufficiently, to around 1 per cent from near zero. The comments echoed that of Powell who said the Fed could start to shrink its balance sheet later this year at his confirmation hearing before the Senate Banking Committee.
"At some point, perhaps later this year, we will start to allow the balance sheet to run off, and that's just the road to normalising policy," he said, adding the US economy "no longer needs or wants" the Fed's very highly accommodative policies.
These comments come in contrast to that of other more hawkish officials, such as the Atlanta Fed President Raphael Bostic. "There is a risk inflation is likely to be elevated for an extended period of time and we need to respond directly, clearly and aggressively," Bostic told Reuters in an interview on Monday.
Bostic explained that the central bank should be aggressive with regards to the balance sheet as well, allowing its holdings to decline by at least $100 billion a month, and with plans to quickly pull at least $1.5 trillion out of financial markets that he considers pure "excess liquidity."
The day ahead
For the day ahead, we will hear from Fed's New York president, John Williams. Then, the Fed will move into its blackout period until the next interest rate decision later this month. This leaves US data in focus. In this regard, Retail Sales will be of interest today.
Analysts at TD Securities explained that Retail Sales probably fell in December, even with higher prices boosting nominal values. ''Spending was likely held down by the fading of fiscal stimulus, payback for earlier-than-usual holiday shopping, and Omicron. We look for a notable 1.4% MoM decline in total sales (consensus: -0.1%) and a larger 2.0% retreat for the control group (consensus: flat). Real as well as nominal spending was likely still up solidly on QoQ basis and strongly on a YoY basis.''
Gold technical analysis
If the US dollar rebounds from here, gold would be expected to be pressured towards critical support as follows:
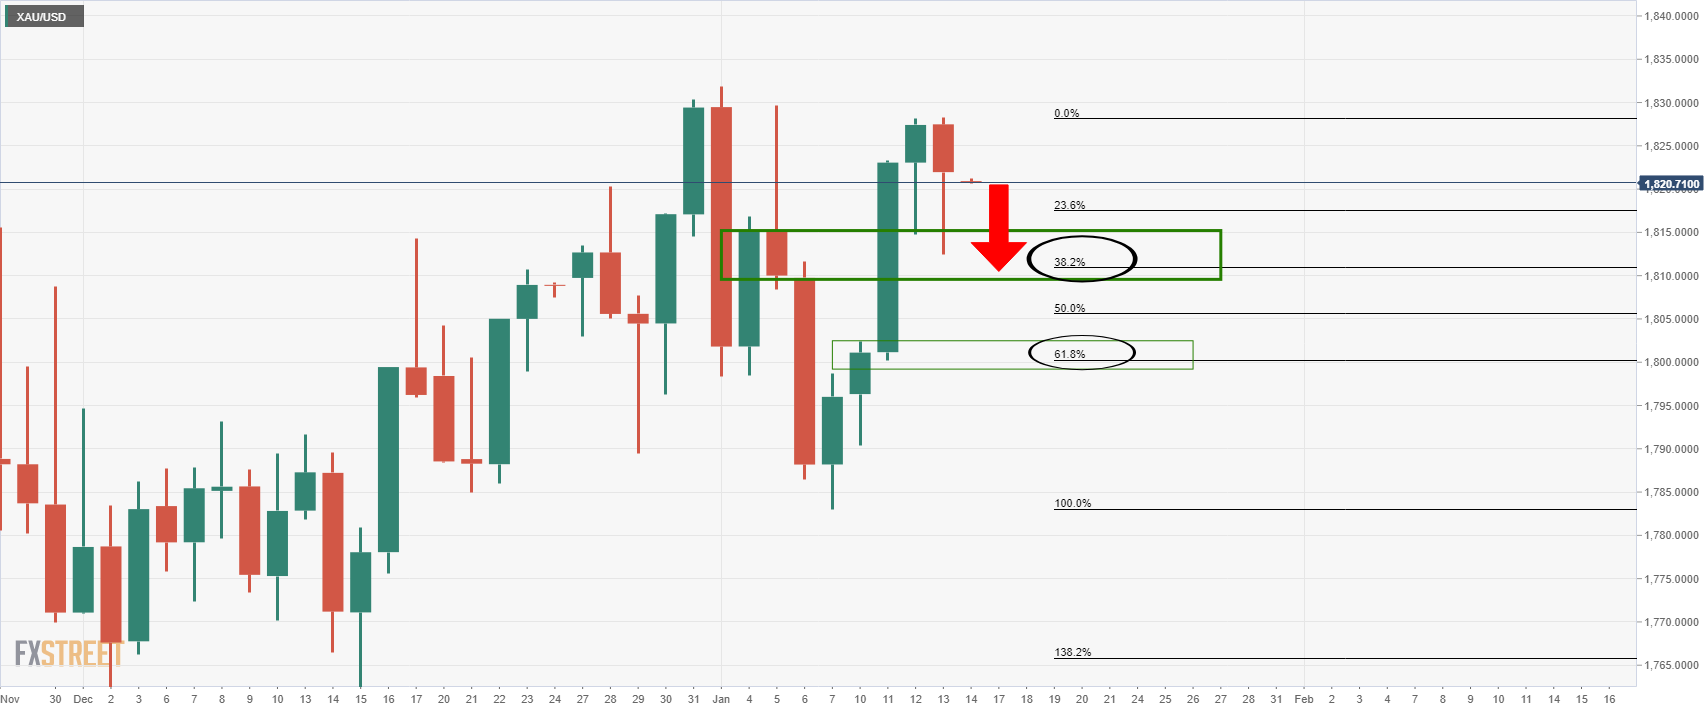
The 38.2% Fibo near $1,810 guards $1,800 and the 61.8% Fibo.
| Pare | Closed | Change, % |
|---|---|---|
| AUDUSD | 0.72798 | -0.05 |
| EURJPY | 130.769 | -0.28 |
| EURUSD | 1.14545 | 0.12 |
| GBPJPY | 156.495 | -0.36 |
| GBPUSD | 1.37083 | 0.06 |
| NZDUSD | 0.68635 | 0.3 |
| USDCAD | 1.25176 | 0.16 |
| USDCHF | 0.91125 | -0.33 |
| USDJPY | 114.163 | -0.4 |


© 2000-2026. Sva prava zaštićena.
Sajt je vlasništvo kompanije Teletrade D.J. LLC 2351 LLC 2022 (Euro House, Richmond Hill Road, Kingstown, VC0100, St. Vincent and the Grenadines).
Svi podaci koji se nalaze na sajtu ne predstavljaju osnovu za donošenje investicionih odluka, već su informativnog karaktera.
The company does not serve or provide services to customers who are residents of the US, Canada, Iran, The Democratic People's Republic of Korea, Yemen and FATF blacklisted countries.
Izvršenje trgovinskih operacija sa finansijskim instrumentima upotrebom marginalne trgovine pruža velike mogućnosti i omogućava investitorima ostvarivanje visokih prihoda. Međutim, takav vid trgovine povezan je sa potencijalno visokim nivoom rizika od gubitka sredstava. Проведение торговых операций на финанcовых рынках c маржинальными финанcовыми инcтрументами открывает широкие возможноcти, и позволяет инвеcторам, готовым пойти на риcк, получать выcокую прибыль, но при этом неcет в cебе потенциально выcокий уровень риcка получения убытков. Iz tog razloga je pre započinjanja trgovine potrebno odlučiti o izboru odgovarajuće investicione strategije, uzimajući u obzir raspoložive resurse.
Upotreba informacija: U slučaju potpunog ili delimičnog preuzimanja i daljeg korišćenja materijala koji se nalazi na sajtu, potrebno je navesti link odgovarajuće stranice na sajtu kompanije TeleTrade-a kao izvora informacija. Upotreba materijala na internetu mora biti praćena hiper linkom do web stranice teletrade.org. Automatski uvoz materijala i informacija sa stranice je zabranjen.
Ako imate bilo kakvih pitanja, obratite nam se pr@teletrade.global.
транcфери