- Analiza
- Novosti i instrumenti
- Vesti sa tržišta
Forex-novosti i prognoze od 12-01-2022
- NZD/USD seesaws around two-week high as 50-DMA, multi-day-old horizontal hurdle challenge bulls.
- Market sentiment dwindles after surprising reaction to US inflation.
- New Zealand Building Permits improved to +0.6% in November, monthly Filled Jobs rose too.
- Fed policymakers support faster rate hikes starting from March during the final days before blackout period.
Having jumped the most in more than three months, NZD/USD battles a strong resistance of around 0.6860 during Thursday’s Asian session.
The kiwi pair seesaws around the fortnight high, flashed the previous day, as market players recheck bullish bias following the recently hawkish Fedspeak.
It’s worth noting that the quote’s rally on Wednesday ignored a 40-year high US inflation as markets turned risk-on following the US Consumer Price Index (CPI) release. US CPI jumped to the highest levels since 1982 while matching 7.0% YoY forecasts, up from 6.8% previous readouts. The monthly figures rose to 0.5% versus 0.4% expected but softened below 0.8% prior.
At home, New Zealand’s Building Permits for November rose to +0.6% versus -2.0% revised prior. On Wednesday, the country reported upbeat second-tier jobs data and favored the NZD/USD during early hours despite downbeat China inflation figures for December.
Following the NZ jobs data, the ANZ report said, “Monthly filled jobs data released by Stats NZ yesterday showed jobs growth accelerated to 0.4% m/m (4.3% y/y) in November (0.2% m/m previously). Kiwi firms have now posted 10 months in a row of jobs gains, despite spending the last four of those months (August to November) battling the latest Delta outbreak.”
It should be observed that the recent Fedspeak has been too hawkish, suggesting rate hikes and raising concerns over the higher inflation, which in turn probes the NZD/USD buyers. On the same line are the covid woes as Australia becomes vulnerable with a fresh record high of daily COVID-19 infections and virus cases at home also keep running higher.
Amid these plays, US Treasury yields remain sluggish, mainly the 10-year bond, while the S&P 500 Futures fail to track the Wall Street gains.
Moving on, a snap national cabinet meeting in Australia to battle the virus can affect NZD/USD prices due to New Zealand’s trade links with Canberra. However, major attention will be given to the Fedspeak and US jobless claims as Fed policymakers will sneak into the blackout period for speeches by the end of this week.
To sum up, virus woes and inflation fears join the hawkish Fed to challenge the NZD/USD buyers. However, markets seem to wait for strong catalysts as most of the recent news march the previous forecasts and have already been priced.
Technical analysis
A clear upside break of the two-month-old descending trend line, around 0.6800 by the press time, joins bullish MACD and firmer RSI to favor NZD/USD to battle a horizontal area comprising multiple levels marked since late September and 50-DMA around 0.6860.
While the 0.6900 threshold and 100-DMA level surrounding 0.6960 lures NZD/USD bulls, pullback moves remain less important until staying beyond the resistance-turned-support from November, near 0.6800.
- Gold prices seesaw around one-week high after four-day uptrend.
- US Treasury yields, DXY remains pressured despite 40-year high US inflation, hawkish Fedspeak, virus fears also test gold buyers.
- Fed policymakers’ speeches before the blackout period will be crucial for fresh impulse.
- Gold Price Forecast: Bulls maintain the pressure despite a better market mood
Gold (XAU/USD) buyers take a breather around the weekly top near $1,825-26 during the initial Asian session on Thursday. The yellow metal refreshed multi-day high on Wednesday after the US Treasury yields and the greenback marked a surprise fall despite a four-decade high inflation data, as well as hawkish Fedspeak.
That said, US CPI jumped to the highest levels since 1982 while matching 7.0% YoY forecasts, up from 6.8% previous readouts. The monthly figures rose to 0.5% versus 0.4% expected but softened below 0.8% prior.
After the US inflation data release, Federal Reserve Bank of St. Louis President James Bullard said, per Wall Street Journal (WSJ), “Four rate hikes in 2022 now appear to be on the table and, in the face of high inflation, a rate hike in March seems likely.” On the same line were comments from, Fed Board of Governors’ member and incoming Vice Chairman of the FOMC Lael Brainard who said, “Inflation control is Fed's most important task. Furthermore, White House Economic Adviser Brian Deese mentioned that supply chain issues are worse than expected, suggesting further inflation pressure.
Elsewhere, Japan witnesses the four-month high daily covid infections and is ready to push Tokyo towards the second highest COVID-19 alert level while Australian policymakers called for a snap Cabinet meeting to tackle the steady jump in the daily infections. Furthermore, the US and Europe aren’t behind the curve while China and India have also started reporting multi-day high daily covid numbers.
That said, the US Dollar Index (DXY) slumped to the lowest levels since November 11, also marking the biggest daily loss in nearly seven weeks. The US Treasury bond yields also marked a surprising extension of the previous weakness, which in turn propelled the Wall Street benchmark before the day-end pullback.
To sum up, the gold prices are likely consolidating November’s losses amid the softer yields and the US dollar. However, the fundamentals are against the bulls and hence incoming catalysts should be given higher attention while expecting a pullback. Among them, weekly prints of US jobless claims and Fedspeak can direct intraday moves while Friday’s US Retail Sales will be important too.
Read: Riding out inflation in style
Technical analysis
Gold refreshed one-week top post-US inflation data, extending the previous run-up beyond 100 and 50 SMAs. However, a descending resistance line from December 03, around $1,826, restricts the metal’s immediate upside.
Given the key SMA breakout, as well as bullish MACD signals and firmer RSI, gold buyers are likely to overcome the $1,826 immediate hurdle.
Following that, the 61.8% Fibonacci retracement (Fibo.) of November-December downside, near $1,830 and tops marked during July and September around $1,834 will be crucial to watch for gold’s further upside momentum.
Alternatively, pullback moves could eye 50 and 100-SMA region surrounding $1,805-08, a break of which will need validation from the $1,800 threshold to convince gold sellers.
During the quote’s downturn past $1,800, the 23.6% Fibo. level near $1,782, $1,770 and $1,762 will test the gold bears before directing them to December 2021 trough surrounding $1,753.
Gold: Four-hour chart
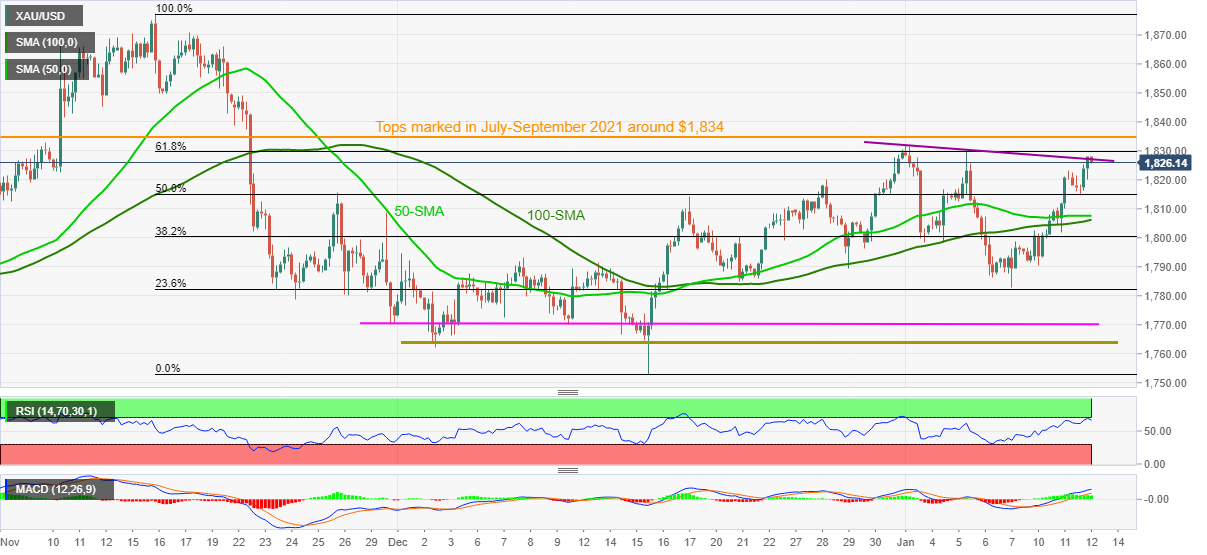
Trend: Further upside expected
The President and CEO of the Federal Reserve Bank of San Francisco Mary Daly has stated that the Fed does not want to get too far ahead on calling a number of rate increases.
She explained that they definitely see rate increases as early as March because inflation is uncomfortably high.
She explained that it is time to start removing some accommodation and that she sees prices moderating as supply imbalances ease.
Market implications
Fed speakers will enter blackout on communications this weekend and the markets are already expecting a rate increase as soon as the end of this quarter. The Fed has guided that rates can start to go up as soon as March.
''We agree with that assessment and expect that the Fed will hike 25bps in March (once they’ve halted further asset purchases), delivering a total of five hikes over 2022. Capping inflation is the Fed’s key priority for 2022,'' analysts at ANZ Bank explained.
Meanwhile, the US dollar, as measured by the DXY index, has moved in on a critical level of daily support and would now be expected to correct higher as follows:
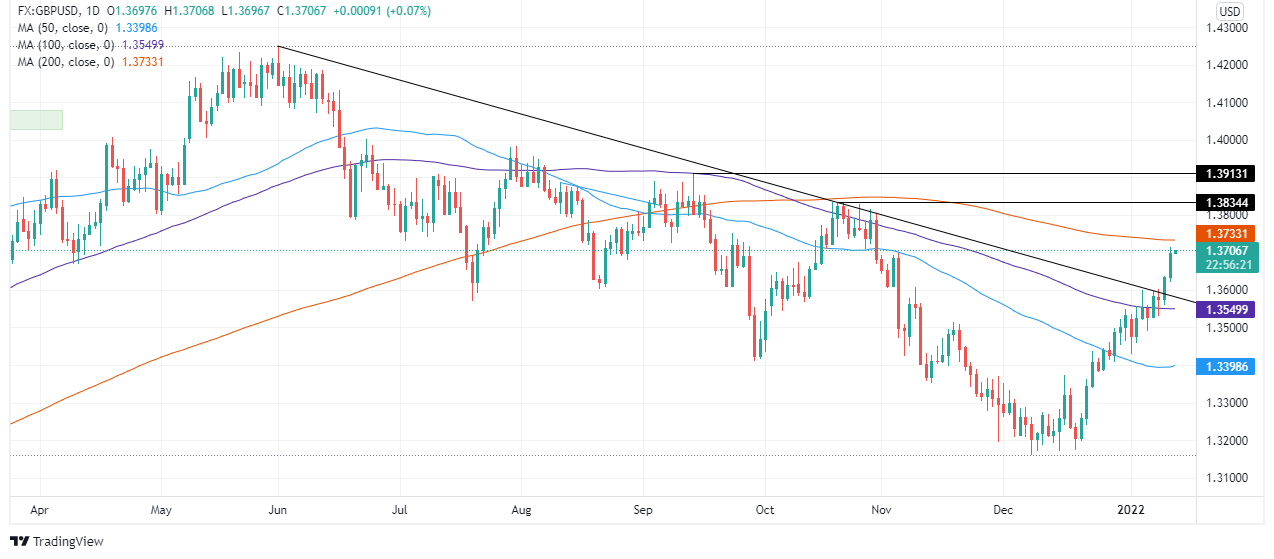
- The GBP/USD rallies amid broad US dollar weakness across the FX board for the fourth consecutive trading day.
- GBP/USD Technical Outlook: Neutral-bullish biased though GBP bull’s need to reclaim the 200-DMA so that they could aim towards 1.3900.
The British pound extends its rally in the week, advancing for the fourth day in a row as the Asian Pacific session kicks in. The GBP/USD edges up some 0.02% at press time, trading at 1.3705.
GBP/USD Price Forecast: Technical outlook
On Wednesday, the GBP/USD rallied 100-pips fundamentally driven by US inflation hitting the 7.00% threshold the most since 1982, as commented by Joel Frank, an analyst at FX Street, on his article GBP/USD surges towards 1.3700 as dollar dives post-CPI, but now looking overbought.
Putting fundamentals aside, the GBP/USD upward move stalled around the 1.3700 figure, 31 pips short of the 200-day moving average (DMA), which lies at 1.3733, leaving the British pound exposed to downward pressure, unless GBP bulls reclaim the DMA mentioned above.
At the time of writing, the GBP/USD first resistance is the 200-DMA. A breach of the latter would expose October’s 20 of 2021, daily high at 1.3834, followed by September 14 of 2021, daily high at 1.3913.
Conversely, on the downside, the GBP/USD first demand area would be 1.3700. A clear break under the figure could send the pair tumbling towards 1.3600, followed by the 100-DMA at 1.3549 and then the 1.3500 thresholds.
Japan’s worsening coronavirus conditions push policymakers towards the reintroduction of harsh activity controls. The Asian major reported the highest daily COVID-19 cases in four months on Wednesday, per Kyodo news, which in turn hints at the return of the second-higher coronavirus alert level in Tokyo.
“The nationwide tally stood at 13,244, with Tokyo accounting for 2,198 of the cases and marking the first time in over four months that the count has surpassed 2,000,” said Kyodo News.
Following that, NHK came out with the update saying, “Tokyo to raise covid-19 alert to second-highest level.”
It’s worth noting that Okinawa, Hiroshima and Yamaguchi prefectures have already entered a quasi-state of emergency from Sunday.
FX implications
Given the faster pace of the virus spread, coupled with the hawkish Fedspeak and multi-month high US inflation, the US Treasury yields should regain the upside momentum and weigh on the risk barometers like AUD/USD while also likely to fuel USD/JPY prices. However, the immediate reaction to the news seems moderate.
Read: AUD/USD battles 100-DMA on the way to 0.7300 amid broad USD weakness
Early Thursday morning in Asia, White House (WH) Economic Advisor Brian Deese said, “Forecasters see prices moderating during the course of 2022 which is consistent with our perspective.”
“The delay in fed appointments has had no effect on inflation response,” adds WH Eco. Advisor Deese.
The diplomat also mentioned, “We are watching impact of China's covid-19 lockdowns on supply chains.”
Read: Fed’s Brainard: Inflation control is Fed's most important task
FX reaction
Although the news should have helped Antipodeans to extend the previous rally, prices of AUD/USD paused around a two-month high after release.
Read: AUD/USD battles 100-DMA on the way to 0.7300 amid broad USD weakness
Fed Board of Governors’ member and incoming Vice Chairman of the FOMC Lael Brainard recently crossed wires, via Reuters, while saying, “Returning inflation to the 2% target is the ‘most important task’ facing the US central bank.” The FOMC member said in remarks prepared for delivery on Thursday to a Senate panel considering her for promotion to the vice-chair position, per Reuters.
Key quotes
Our monetary policy is focused on getting inflation back down while sustaining recovery that includes everyone.
Economy is making 'welcome progress,' pandemic continues to pose challenges.
Our priority is to protect gains we've made, support full recovery.
Committed to pursuing fed's two goals of price stability, maximum employment.
Committed to independent, nonpartisan status of Fed.
Will support policies that are in the interests of the American people.
FX reaction
Following the news, AUD/USD prices pause near the two-month high around 0.7290 after rising the most since late November 2021.
Read: AUD/USD battles 100-DMA on the way to 0.7300 amid broad USD weakness
- AUD/USD bulls take a breather around two-month high, after rising the most since August.
- US Dollar slumped despite 40-year high inflation, US Treasury yields remain pressured, equities rallied before closing with mild gains.
- Fed’s Brainard said inflation is too high, WH Advisor Deese feared supply chain issues.
- No major data at home, Fedspeak will be in focus.
After portraying a roller coaster ride on Wednesday, AUD/USD seesaws around 0.7285-90, the two-month high during the early hours of Thursday’s Asian session. In doing so, the risk barometer pair reveals the buyer’s indecision over the previous day’s heavy run-up, the most since late August, amid a quiet start to the day’s trading.
Although softer yields and Fed Chair Powell’s Testimony helped AUD/USD bulls during early Wednesday’s trading, the real push to the north came after the US Consumer Price Index (CPI) release. It’s worth noting that the Aussie pair not only ignored multi-year high price pressure, which should have favored bears but also ignored downbeat China inflation data and virus woes.
That said, US CPI jumped to the highest levels since 1982 while matching 7.0% YoY forecasts, up from 6.8% previous readouts. The monthly figures rose to 0.5% versus 0.4% expected but softened below 0.8% prior. On the other hand, China's CPI eased to 1.5% YoY compared to 1.8% forecast and 2.3% prior while the MoM readings also dropped to -0.3% versus +0.2% expected and +0.4% previous readouts. Additionally, the factory-gate inflation, namely the Producer Price Index (PPI) also dropped to 10.3% YoY for December, below 11.1% expected and 12.9% prior.
Following that US inflation data, Federal Reserve Bank of St. Louis President James Bullard said, per Wall Street Journal (WSJ), “Four rate hikes in 2022 now appear to be on the table and, in the face of high inflation, a rate hike in March seems likely.” On the same line were comments from, Fed Board of Governors’ member and incoming Vice Chairman of the FOMC Lael Brainard who said, “Inflation control is Fed's most important task.
Despite the heavy inflation data, the US Dollar Index (DXY) slumped to the lowest levels since November 11, also marking the biggest daily loss in nearly seven weeks. Further, the US Treasury bond yields also marked a surprising extension of the previous weakness despite the strong inflation data and hawkish Fedspeak, which in turn propelled the Wall Street benchmark before the day-end pullback.
Recently, White House Economic Adviser Deese mentioned that supply chain issues are worse than expected, suggesting further inflation pressure.
In addition to the inflation fears and Fed’s readiness to act, worsening coronavirus conditions at home and aboard also should test the AUD/USD bulls. Australia reported the weekly high of covid cases, near 95,000, the previous day while shortages of the virus testing kits were revealed. Elsewhere, Tokyo is ready to raise the covid alert to the second-highest level, per NHK.
To sum up, the market’s reaction to the US inflation data and recently hawkish Fedspeak doesn’t fit the fundamentals and hence signal pullback moves. However, an absence of major data/events, except for the Fedspeak and weekly US jobless claims, can keep the buyers on board amid downbeat USD.
Technical analysis
A clear upside break of 50-DMA and a downward sloping resistance line from mid-November joins firmer RSI and bullish MACD signals to keep AUD/USD buyers hopeful. However, the 100-DMA surrounding 0.7290 challenges the Aussie pair’s further advances targeting the 61.8% Fibonacci retracement (Fibo.) of October-December downside near 0.7340.
Should the quote take a U-turn, a 50-DMA level of 0.7210 joins 38.2% Fibo. to put a floor under the prices. Though, a pullback towards the previous resistance line near 0.7260 can’t be ruled out.
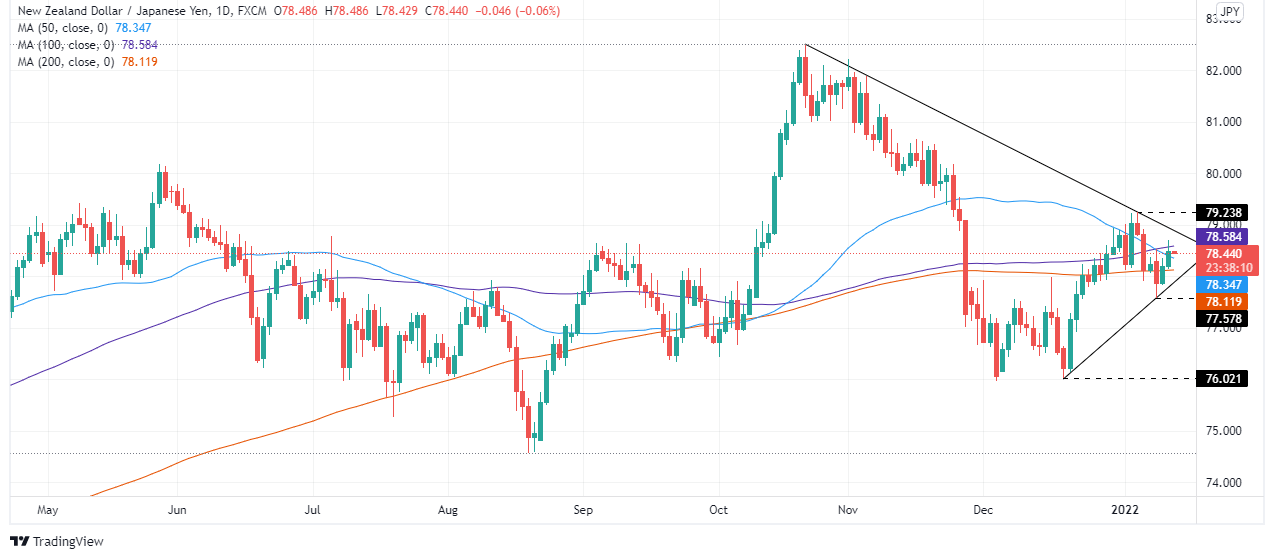
- The NZD/JPY edges higher for the second day in a row, up some 0.37%.
- NZD/JPY Technical Outlook: The pair is upward biased, but downside risks remain as the 200-DMA is near the current spot price.
The NZD/JPY surges higher for the second day consecutive day, as investors assess the last US inflation report that said the US economy reached the 7% threshold for the first time since 1982. That said, US stocks rallied as risk appetite improved. In the meantime, in the FX market, risk-sensitive currencies like the antipodeans advanced. At the time of writing, the NZD/JPY is trading at 78.50 as the Asian session begins.
NZD/JPY Price Forecast: Technical outlook
On Wednesday, the cross-currency pair was sideways within the 78.14-40 area, with no clear direction. Nevertheless, macroeconomic news improved the market sentiment, so the upward move was fundamentally driven but stalled due to technical reasons.
Once the US CPI headline crossed the wires, the NZD/JPY breached 78.40, edging higher though the rally stalled around 78.70, 25-pips above the 100-day moving average (DMA) around 78.44.
On Tuesday, in my previous article (read here), notes mentioned that “the NZD/JPY daily chart depicts an upward bias, as Tuesday’s price action broke above the 200-day moving average (DMA).” Nevertheless, the attempt towards 79.00 was rejected at around 78.70, leaving a candle with a long upper wick, indicating that buyers were rejecting higher prices.
To the upside, the first resistance would be the January 12 daily high at 78.70. A decisive break of the first ceiling level would expose a three-month-old downslope trendline around the 78.75-90 area, immediately followed by the previous-mentioned 79.00 figure.
Conversely, the first demand zone for NZD/JPY bulls is the 50-DMA at 78.39. A breach of the latter would open the door for lower prices. The next floor would be the 200-DMA at 78.16, followed by the 78.00 figure, and then the January 10 cycle low at 77.58.
- AUD/JPY recovered back to the 83.50 area on Wednesday as the Aussie benefitted disproportionately amid USD weakness.
- A surge in base and industrial metal, as well as energy prices, disproportionately benefitted the currency of export-dependent Australia.
AUD/JPY rallied 0.4% to close to the 83.50 mark on Wednesday as a sharp deterioration in the US dollar fortunes triggered outperformance in risk-sensitive currencies across the board. Though the yen also gained a solid 0.6% on the day versus the battered buck, it could not keep pace with the Aussie, which soured over 1.0% on the session versus the dollar, hence the move higher in AUD/JPY. The pair has now reversed more than 1.3% higher versus Monday’s sub-82.50 lows and has thus pared slightly more than half of the pullback from last week’s 84.30ish highs to Monday’s lows.
The dollar’s sharp post-US Consumer Price Inflation data decline, which occurred despite the report revealing headline inflation hitting its highest levels since 1982 at 7.0% YoY and prompted hawkish Fed member James Bullard to overtly call for four hikes in 2022 (the first Fed member to do so), spurred a rally in industrial metals. Copper was last up nearly 3.0% on the session, whilst the Bloomberg Industrial Metals Subindex, which tracks prices in copper, nickel, aluminium and zinc, was up closer to 1.5%. This, coupled with sharp upside in crude oil and US natural gas prices, benefitted the currencies of commodity and energy export-dependent countries like Australia.
Note that commodities (particularly the base metals) are also getting a boost after the latest inflation data out of China came in cooler than expected, which gives the PBoC and Chinese authorities to support growth this year. If dollar weakness and commodity price strength can continue like this for a few more sessions, AUD/JPY is in with a decent shout of recovering back to last week’s highs above the 84.00 mark. The big risk to this call would be if something happens that hurt risk appetite once again, just as happened last week when risk assets tumbled amid Fed tightening fears.
- USD/CAD broke the neckline of the H&S pattern and subsequently fell towards the 1.25 figure.
- Bulls looking to step in as bears exit before the close of the New York session.
Following the prior session's analysis, where it was stated that the ''bears can look near to 1.25 the figure and 1.2480 as the next area of expected support:
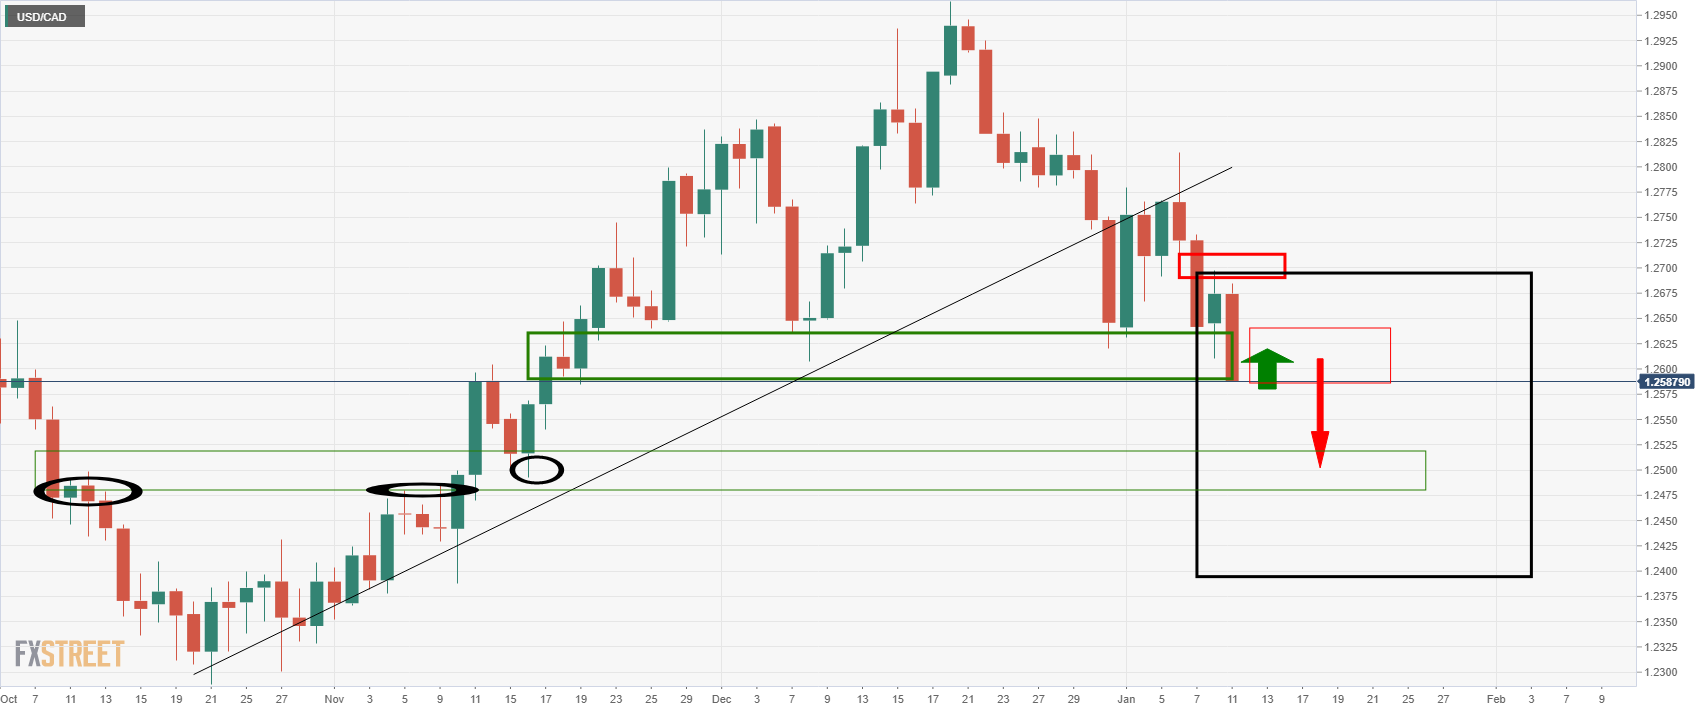
... the price has fallen sharply to test below 1.25 the figure.
The less committed bears will be seeking to take profits at this juncture which gives rise to prospects of a bullish correction.
The following illustrates the potential for at least a 50% mean reversion of the prior two sessions:
USD/CAD daily chart
As its stands, the New York session is coming to a close and traders will be keen to square positions ahead of the rollover and start of the Asian day. 1.26 is a figure that will be eyed for the forthcoming days if bears cannot keep control below 1.25 the figure.
DXY techncial analysis
-
US dollar dives despite sentiment of a March Fed hike
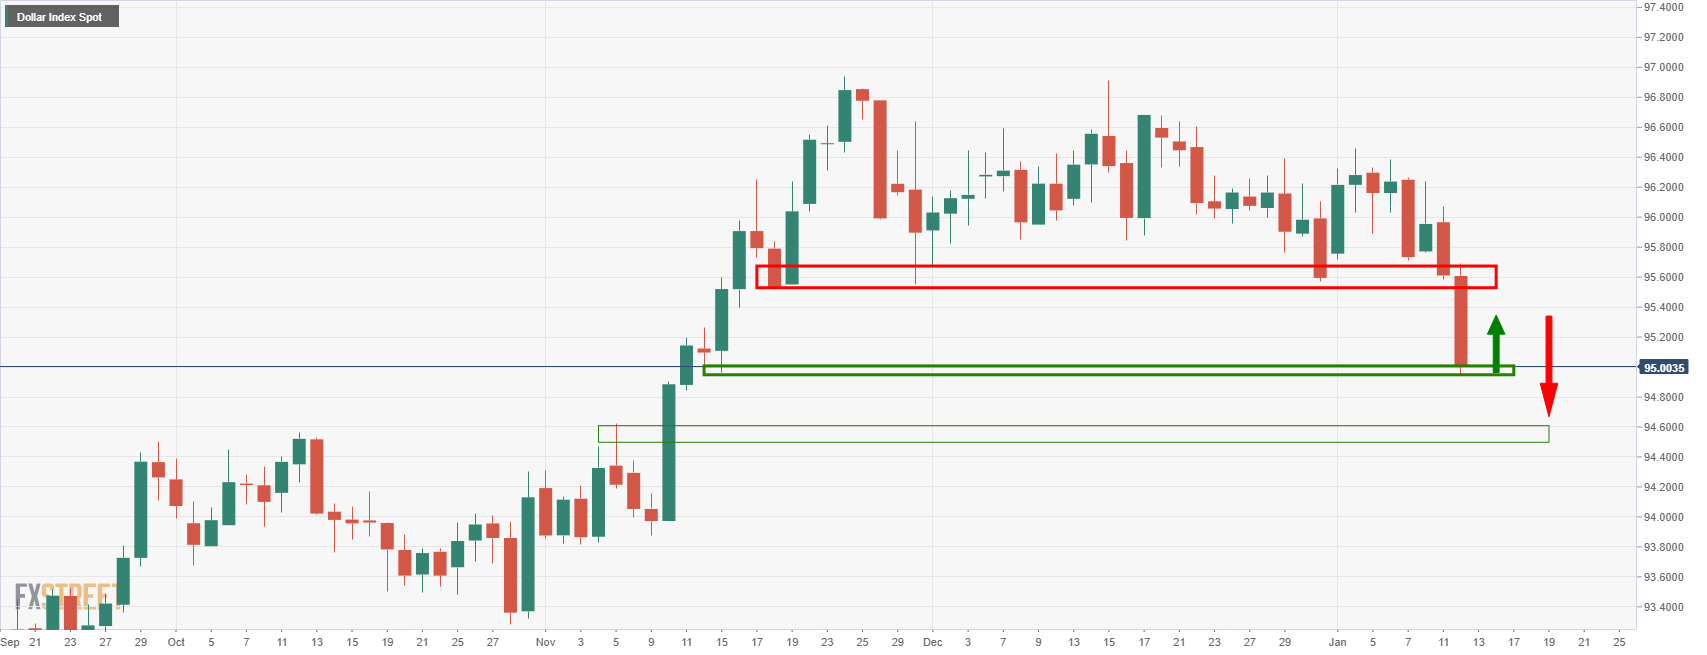
A break of this critical area of support could open the way to the midpoint of the 94 area. However, a bullish correction back into the midpoint of the 95 handle prior to any further downside might be on the cards first.
- GBP/JPY has eased back under the 157.00 level on Wednesday after rejecting an attempted push above 157.50.
- As the dollar dives post-US CPI data, overbought sterling has been struggling to benefit as much as its G10 peers.
GBP/JPY ran out of steam when it attempted to rally above the 157.50 level and test last week’s 157.77 high on Wednesday and has since subsided back below the 157.00 level. At current levels in the 156.80s, the pair is trading lower by a very modest 0.2% on the day and is back to trading flat on the week. Wednesday’s pullback from earlier session highs marks a failure of the pair to break out of its recent 156.00-157.80ish range that it has been locked within over the last week.
The main focus in FX markets on Wednesday has been on the dollar’s large post-in line with expectations US Consumer Price Inflation report decline, with less focus than usual on the yen crosses. Despite gaining more than 0.5% on the day versus the buck, sterling is one of the worst G10 performers. The yen is sat closer to the middle of the G10 performance table, up 0.75% on the day versus the buck. The more risk-sensitive AUD, NZD, NOK and SEK are all up more than 1.0% on the day against the dollar. GBP’s relatively poor on-the-day performance may be explained by the fact that, before today and over the last few weeks, GBP has been one of the best performing G10 currencies and may have entered overbought territory, incentivizing profit-taking.
Since bottoming out in December underneath 149.00, GBP/JPY has rallied over 5.0%. Compare that to EUR/JPY, which is up under 3.0% since its December lows, USD/JPY, which is now up under 2.0% and CAD/JPY which is up closer to 4.5%. Of the major G10 currencies, GBP’s performance has been particularly impressive as of late as fears about Omicron and its economic impact have subsided, thus allowing GBP to finally benefit from BoE hawkishness (the bank started lifting rates in December). Midway through last week, GBP/JPY’s 14-day Relative Strength Index rose above 70 (signaling overbought conditions) and though it has since dropped back under, the pair may still be suffering from the effects.
- The Australian dollar advances some 1.11% as the Wall Street end approaches.
- The AUD/USD rallied 80-pips after the release of the US CPI.
- AUD/USD Technical Outlook: A daily close above the 100-DMA would open the door for a challenge at 0.7300.
After the reléase of important US macroeconomic data, the Australian dollar rallies 1.11%. At the time of writing, the AUD/USD exchanges hands at 0.7286 during the New York session.
AUD/USD Price Forecast: Technical outlook
On Wednesday, the AUD/USD remained subdued in the Asian/European session, as investors awaited the release of the US inflation report. When the headline crossed the wires, the AUD/USD rally started.
The AUD/USD rallied almost 80-pips, from 0.7209 up to 0.7281, three hours following the release of the US CPI. The rally stalled around the 100-day moving average (DMA), which lies at 0.7286, short of the 0.7300 figure.
A daily close above December’s 31 daily high at 0.7277 could spur an upward move towards November’s 15, 2021, daily high at 0.7371, but it would find some hurdles on the way north. The first resistance would be 0.7300. A breach of the latter would expose 0.7350, mid-point between the 0.7300-0.7400 range, followed by the previous-mentioned 0.7371.
Contrarily, the AUD/USD first support would be the 100-DMA at 0.7286. A decisive break of it would expose the 50-DMA at 0.7212, immediately followed by the psychological 0.7200.
What you need to know on Thursday, January 13:
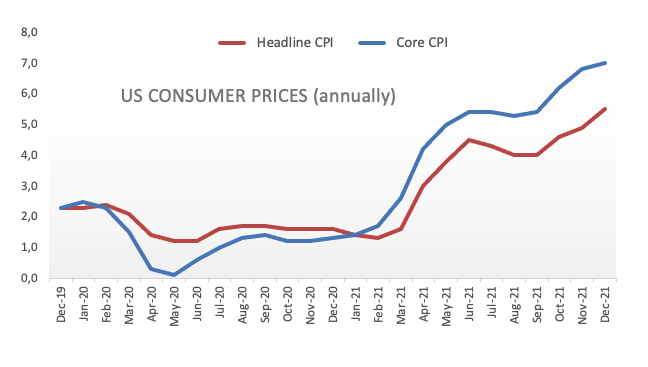
The greenback plummeted following the release of US inflation figures. The December Consumer Price Index was confirmed at 7% YoY, as expected, while the core reading beat expectations, up to 5.5%. The news, which usually spurs risk aversion, had the opposite effect this time.
Stocks rallied, although indexes gave up gains unevenly ahead of the close, while government bond yields ticked lower, sending the American dollar in a selling spiral, exacerbated by the breakout of technical levels.
The EUR/USD pair trades at its highest in two months at around 1.1450, while GBP/USD jumped to 1.3710, its highest since October. Commodity-linked currencies were also on the run, with AUD/USD trading in the 0.7280 region as USD/CAD flirting with 1.2500.
The dollar lost ground vs safe-haven assets also, as the USD/JPY pair plunged to 114.37, holding nearby heading into the Asian opening.
Gold advanced modestly, as investors looked for high-yielding assets. The bright metal trades around $1,827 a troy ounce. Crude oil prices were also up, with WTI trading at $82.60 a barrel.
Ethereum price gears up for explosive rally as buying activity accelerates
According to Federal Reserve Bank of St. Louis President James Bullard, four rate hikes in 2022 now appear to be on the table and, in the face of high inflation, a rate hike in March seems likely. The labour market is as tight as anyone has ever seen it, Bullard added in a interview with the WSJ, adding that the unemployment rate may fall below 3.0% this year.
Additional Takeaways:
"Rate hikes should be accompanied by balance sheet reductions."
"High inflation necessitates policy tightening sooner rather than later."
"The majority of what is driving inflation right now is demand."
"I expect inflation to ebb to 3.0% annualised by the end of 2022."
"Liquidity in 2021 may be eliminated with minimal disruption."
"An earlier start to rate hikes could help the Fed avoid a more hawkish rate path."
"Fed's asset purchases in 2021 were more than the economy required."
"The Fed's pandemic aid is a driver of the present level of inflation."
"The monetary and fiscal assistance provided in response to the pandemic may have been excessive."
"Fed should have stopped purchasing assets sooner than it is right now".
Market Reaction
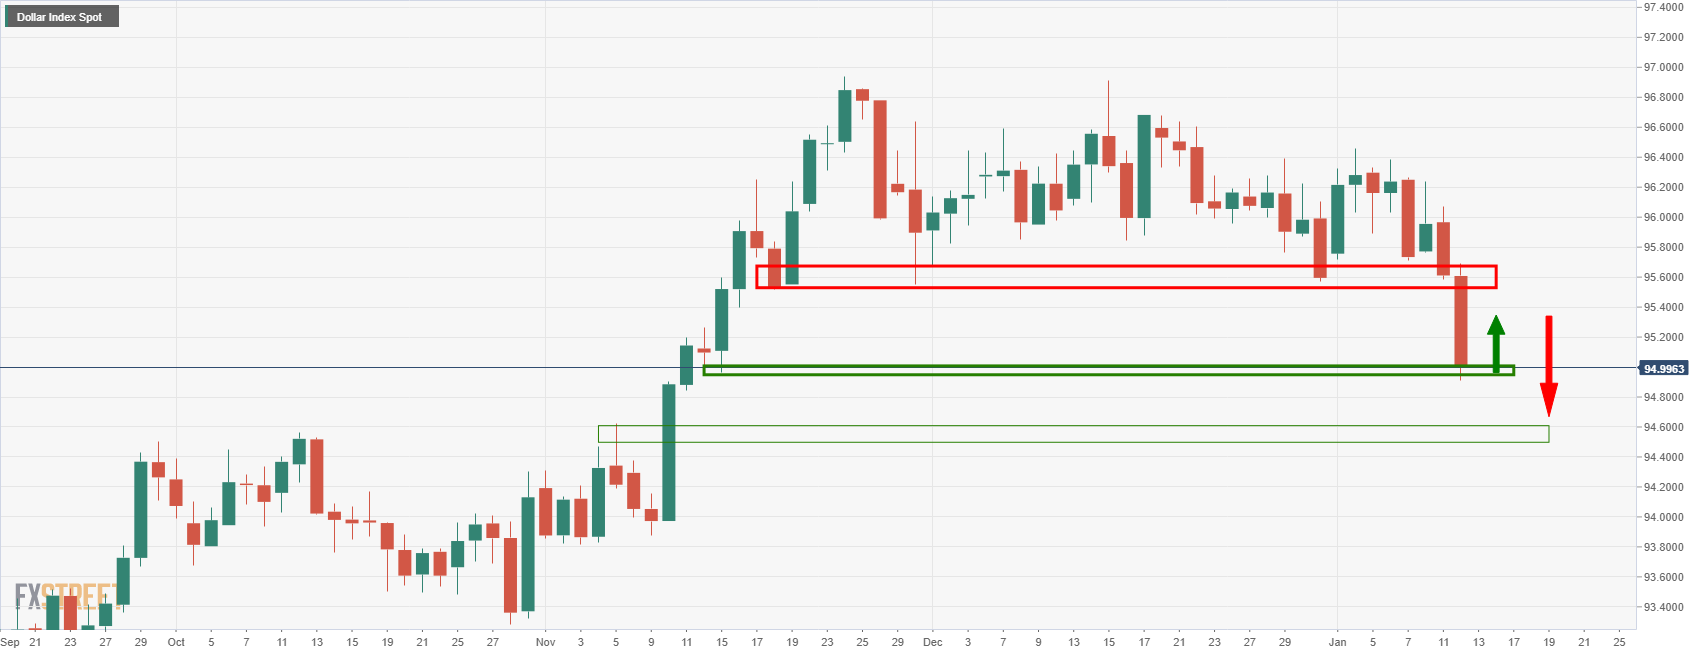
Hawkish commentary from Bullar have done little to stem what has been a severe tide of dollar selling on Wednesday, with the DXY still trading underneath the 95.00 level and eyeing a test of support in the 94.50s.
- EUR/USD has been an impressive performer on the bid on Wednesday.
- Bulls have reached a critical level, bears will be looking for a test of 1.1410 NY open.
EUR/USD rallied on Wednesday from a low of 1.1354 towards 1.1450. The high at the time of writing has been 1.14492 so far. The following illustrates the scalping day trading structures and prospects of a downside correction for the sessions ahead.
EUR/USD H1 chart
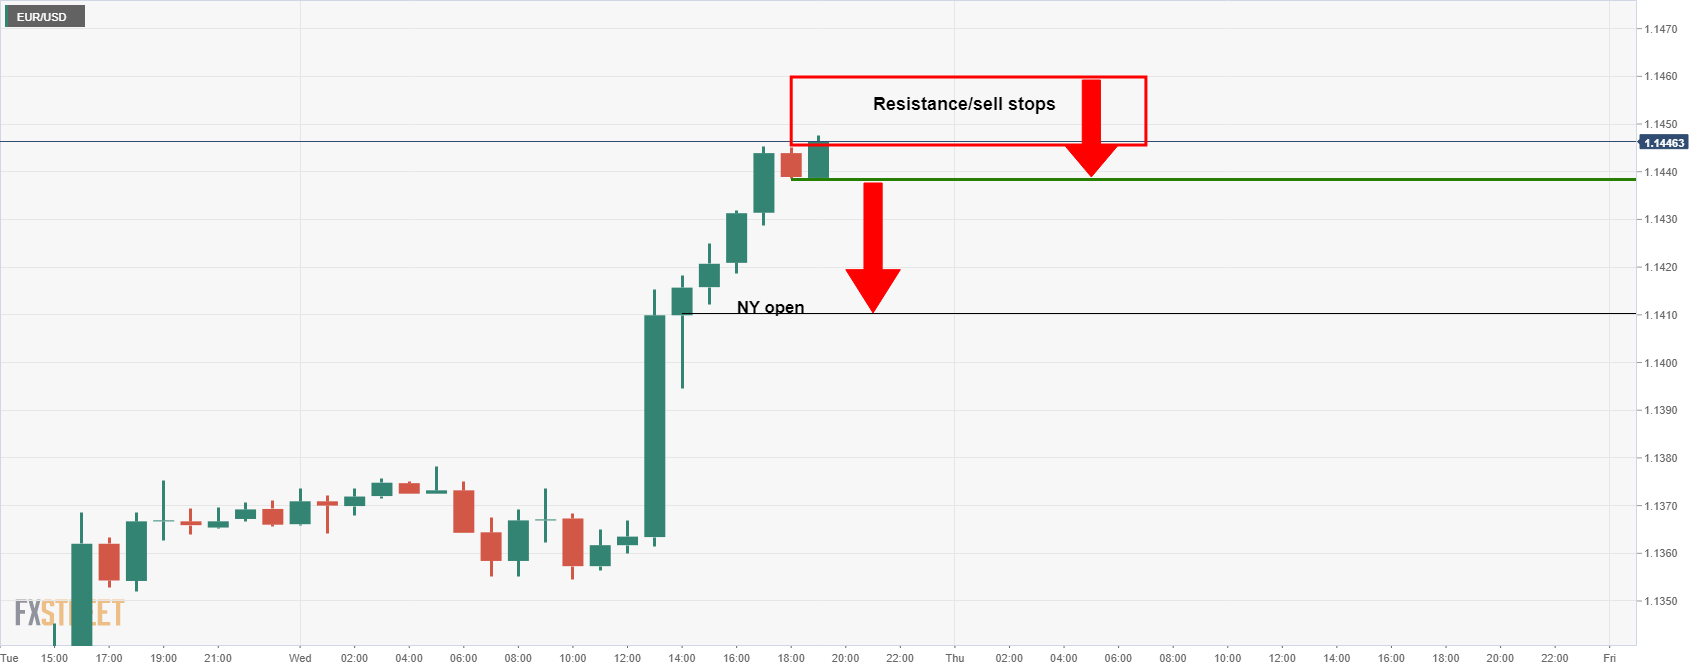
The bulls have rallied into a key 1.1450 area on the chart and following a test of the area, profit targets will be met and subsequent selling could come into force. The bears looking to engage at a high probability area could look for a break below the recent lows near 1.1438.
EUR/USD H4 chart
Meanwhile, the 4-hour chart shows where the liquidity is located as per the structure looking left. A run through to trigger stop losses would be a common occurrence, so wicks on the lower time frames would be expected to test as high as 1.1460/65. Either way, the countertrend traders will be looking for an optimal entry to target a correction as profit-taking unfolds into the New York close and ahead of the rollovers and widening of spreads.
EUR/USD M15 chart
On the 15-min time frame, the support that the bears will want to see is located just below 1.1440. A run to 1.1422 and then the New York open near 1.1410 would be in focus.
According to the Fed's Beige Book, a report on current economic conditions in each of the 12 Federal districts, most districts noted a sudden pullback in leisure and travel spending, as well as hotel occupancy and patronage at restaurants as the number of Covid-19 Omicron infections rose.
Additional Takeaways:
Growth...
"Contacts from many districts indicated growth continued to be constrained by ongoing supply chain disruptions and labor shortages."
"Economic activity across the United States expanded at a modest pace in the final weeks of 2021."
"The manufacturing sector continued to expand nationally, with some regional differences in the pace of growth."
"Although optimism remained high generally, several districts cited reports from businesses that expectations for growth over the next several months cooled somewhat during the last few weeks."
Labour market...
"Despite the modest pace of growth, demand for materials and inputs, and demand for workers, remained elevated among businesses."
"Employment grew modestly in recent weeks, but contacts from most districts reported that demand for additional workers remains strong."
"Job openings were up but overall payroll growth was constrained by persistent labor shortages."
"Ongoing labor shortages and associated wage growth also added cost pressures to businesses."
"Tightness in labor markets drove robust wage growth nationwide, with some districts highlighting additional growth in labor costs associated with non-wage benefits."
"Many contacts noted that wage gains among low-skill workers were particularly strong."
"Compensation growth remained well above historical averages across industries, across worker demographics, and across geographies."
Consumer health...
"Consumer spending continued to grow at a steady pace ahead of the rapid spread of the Omicron Covid-19 variant."
Inflation, supply chains...
"Contacts from most federal reserve districts reported solid growth in prices charged to customers, but some also noted that price increases had decelerated a bit from the robust pace experienced in recent months."
"Wholesale and materials prices contributed to pricing pressures across a wide range of industries, spanning service providers and goods producers."
"Many contacts attributed the high cost of inputs to ongoing supply chain disruptions."
"Some districts reported that transportation bottlenecks had stabilized in recent weeks, though procurement costs remained elevated."
- The USD/JPY drops 100-pips in the North American session.
- The market was positioned for a higher US inflation reading, per the reaction weakening the greenback.
- USD/JPY Technical Outlook: Bullish despite Wednesday’s pullback towards a four-month-old upslope trendline.
On Wednesday, after the Bureau of Labor Statistics (BLS) revealed that US inflation reached a level not seen since 1982, the USD/JPY plunges, exchanging hands at 114.60 at the time of writing.
Hot US CPI reading fail to boost the greenback as US T-bond yields slide
Broad US dollar weakness is due to the market participants’ expectations of the US CPI inflation figures. The Consumer Price Index (CPI) for December rose by 7.0%, higher than the 6.8% estimations, but it did not come as higher than market positioning. That is witnessed by the market reaction, sending the US 10-year Treasury yield down almost two-basis points, sitting at 1.727%, while the US Dollar Index just breached under the 95.00 handle for the first time since November 15, 2021.
In the meantime, the so-called Core CPI number for the same period, which excludes volatile items like food and energy, rose by 5.5%, a tenth up from the 5.4% foreseen by analysts.
Putting US consumer inflation figures aside, the USD/JPY trader’s focus turns to Thursday. The Japanese economic docket will feature the Machine Tool Orders (YoY). Across the pond, the US economic docket will feature the Producer Price Index for December, Initial Jobless Claims (IJC), and Fed speaking, led by the Vice-Chairwoman nomination of Lael Brainard. She will appear at the US Senate Banking Committee.
USD/JPY Price Forecast: Technical outlook
With US consumer inflation data on the rearview mirror, the USD/JPY dipped near a four-month-old bullish trendline, drawn from September 2021 cycle lows, which passes above the 50-day moving average (DMA), which lies at 114.24.
Fundamentally and technically driven, the USD/JPY is upward biased. The daily moving averages (DMAs) reside well below the spot price, in a bullish order, meaning the shorter-time frame is above the longer-time ones.
That said, USD/JPY’s pullbacks could be viewed opportunities for USD bulls if that is the case. The following support lies at the above-mentioned trendline, around the 114.35-45 area at press time. A breach of the latter would expose the 50-DMA at 114.24, followed by 114.00
To the upside, the pair’s first resistance would be 115.00. A break above the psychological double-zero level would expose November’s 24 of 2021, daily high at 115.52, followed by a challenge of the YTD high at 116.35.
- Bears move in to take the US dollar to fresh breakout lows in the DXY.
- US CPI continues to run hot, but investors are cautious to price Fed too hawkish.
The US dollar has buckled under pressure from the bears that sent the greenback over a cliff on Wednesday. As measured by the DXY index, the US dollar is down some 0.6% at the time of writing. The index is trading at 95 the figure but off from the lows of that day that were made in the last hour of trade at 94.953.
US government bond yields retreated from a two-year high after the annualized inflation rate for December hit the highest level in four decades. The 10-year US Treasury yield fell 3.3 basis points to 1.71% despite the Bureau of Labor Statistics saying that the seasonally adjusted consumer price index rose 0.5% in December, ahead of expectations for a 0.4% increase. However, this was below the 0.8% increase in November. The year-over-year rate advanced to 7% from 6.8% in the previous month and the overall rate is the highest since 1982.
''There is no evidence whatsoever that inflation pressures are abating,'' analysts at ANZ Bank argued. ''Energy prices declined slightly in December, but pressures have broadened significantly beyond this, with core goods and services prices all surging.''
Moreover, the analysts explained that inflation pressures are likely to intensify as the labour market tightens further and wage pressures grow. ''The peak in US inflation is not in yet, and the Fed will be grappling with inflation in a 7.0-8.0% YoY range for quite a few months to come.''
However, stocks on Wall Street remained in the green, buoyed by the fact that Fed Chair Powell did not mention the prospect of a March rate rise in his Senate confirmation hearing. Markets are of the mind that the US dollar is a crowded trade and that there are risks that the market is pricing the Fed too hawkish.
Meanwhile, Fed speakers enter blackout on communications this weekend, but they have already given the nod to a rate hike as soon as March.
''We agree with that assessment, and expect that the Fed will hike 25bps in March (once they’ve halted further asset purchases), delivering a total of five hikes over 2022,'' the analysts at ANZ Bank said. ''Capping inflation is the Fed’s key priority for 2022.''
DXY daily chart

The price is moving in on the next level of the critical support structure on the daily chart. A break here would open the way to the midpoint of the 94 area. What we could see, in the meantime, is a bullish correction back into the midpoint of the 95 handle prior to any further downside.
- USD/TRY bears move in as bulls take profits on weaker US dollar.
- Bears eye 12.00/20 territories on a break of the critical support structure.
A combination of Turkish politics and a weaker US dollar is sending USD/TRY lower as bulls begin to take profits in what has been a strong correction in a 50% mean reversion of the prior bearish impulse as follows:
USD/TRY weekly chart
-637776066746182412.png)
As illustrated, the price fell heavily and corrected in volatile price action owing to the unprecedented course of action by Turkish officials combatting the highest levels of inflation since 2002, (Turkey's consumer price inflation jumped to 36.08 per cent year-on-year in December 2021, up from 21.31 per cent in the previous month).
USD/TRY daily chart
-637776066992128223.png)
The daily chart shows that the price has attempted to base near 12.90 from where it moved in on the 50% reversion level. However, renewed US dollar weakness has enabled the bears to take back control this week.
USD/TRY H4 chart
-637776067274315009.png)
From a 4-hour perspective, the price is moving in on the 200-EMA. This would be expected to hold initial tests and the current resistance, old support, near the 21 EMA could see the bears moving in at a discount. This would force the price lower and potentially lead to a significant break of support and the 200 EMA.
USD/TRY H1 chart
-637776067526525011.png)
There is still room for the price to move lower according to the hourly chart. Nevertheless, the support is eyed and a meanwhile correction could evolve to test the various significant Fibonacci retracement levels along the way.
Turkish politics and a weaker US dollar
From a political front, the lira could find further stability as we approach planned elections scheduled for no later than mid-2023. The economic turmoil has already started to hit President Erdogan's opinion poll ratings as Erdogan's scheme to curb the lira's weakness has been seen to fail.
The US dollar is a major driving force of emerging market currency performances. As it stands, the greenback is an overcrowded trade that is starting to unwind given the Federal Reserve's hawkish sentiment is a fact that is now being sold off:
DXY daily chart

- The yellow-metal rallies for the fourth day out of the last five despite that US inflation cements Fed hikes.
- US: The Consumer Price Index (CPI) for December increased the most since 1982.
- XAU/USD Technical Outlook: It is neutral-bullish, but gold bulls beware of the fundamental outlook and the US economy developments.
Gold (XAU/USD) extends its rally during the week, buoyed for the fourth consecutive day as the Bureau of Labor Statistics (BLS) revealed that US inflation reached the highest level since 1982. At the time of writing, XAU/USD is trading at $1,826 during the New York session.
The market’s reaction to the US CPI headline figure was adverse, despite further cementing that the Fed would need to hike rates faster than estimated. The US 10-year Treasury yield is down almost two basis points, sitting at 1.722%, weighing on the greenback, as shown by the US Dollar Index, plunging 0.60%, sitting at 95.06.
Meanwhile, the US 10 year Treasury Inflation Protected Securities (TIPS), used as a proxy for real yields, which means nominal yields minus inflation, recovers some ground after falling to -0.842%, up to -0.810%.
Inflation in the US overshoots the 7% threshold
Earlier in the North American session, the US economic docket revealed that the Consumer Price Index (CPI), an inflation gauge of the US economy, in December of 2021 in a year-over-year reading, increased 7%, higher than the 6.8% estimated. Furthermore, the Core CPI (YoY) that excludes volatile items like food and energy prices rose by 5.5%, two-tenths more than expected.
XAU/USD Price Forecast: Technical outlook
Gold’s daily chart depicts the yellow-metal as neutral-bullish biased, but downside risks remain. Fundamentally driven, the non-yielding metal is subject to rising nominal and real yields, which could be negative news for gold bulls. However, the softer tone of the USD keeps the yellow-metal bulls hopeful of higher prices ahead of the first-rate hike, which per money market futures, could happen in the FOMC March 2022 meeting.
To the upside, XAU/USD’s first resistance level would be September 3, 2021, a daily high at $1,834. Once that level is breached, the next stop would be November 16, 2021, cycle high at $1,877,18, followed by $1,900.
On the other hand, gold’s first support is $1,800. The breach of the latter would expose the 100-day moving average (DMA) at $1,793, followed by January 7 daily low at $1,782.60.
- US equities are up broadly higher with markets relieved that the latest US CPI report was in line with expectations.
- The S&P 500 is about 0.3% in the 4730 area whilst the Nasdaq 100 is probing 16,000.
- The S&P 500 is 3.0% up from Monday’s lows and the Nasdaq 100 5.0%.
US equities are trading broadly in the green, with the S&P 500 up 0.3%, the Nasdaq 100 up 0.5% and the Dow up 0.1%, as equity investors digest the implications of the latest US inflation report for Fed policy this year. Broadly speaking, and despite headline Consumer Price Inflation (CPI) reaching its highest level since June 1982 at 7.0% in December, the report was not seen as boosting already very hawkish Fed policy expectations for 2022 any further. Indeed, equity investors seem to have reacted to the fact that the CPI report came in broadly as expected with relief. Even though the report strongly endorses the Fed’s stance that multiple rate hikes and a reduction in the size of the balance sheet is likely warranted this year, the lack of fresh hawkish surprises has weighed heavily on the dollar. This seems to be offering some support to the equity space.
Wednesday’s gains come on the back of upside seen in wake of Tuesday’s Fed Chair Jerome Powell Senate testimony. Just as seen in the market’s reaction to Wednesday’s inflation data, the lack of hawkish surprises from Powell, who largely stuck to the main points/takeaways from the December meeting and its minutes, saw US stocks rally at the time. The S&P 500 index, which is right now trading around the 4730 level, is now more than 3.0% up versus its earlier weekly lows. The growth stock/tech-heavy Nasdaq 100 index, which is currently probing the 16,000 level, it up roughly 5.0% from earlier weekly lows.
A key driver of the rebound, particularly in duration-sensitive big tech names, has been a pullback from recent highs in US yields. For example, the US 10-year is down 3bps on Wednesday and back to trading just above 1.70% having been above 1.80% on Monday. Equity investors will be keeping a key eye on bond markets going forward, as a further rapid push higher (like seen last week) could easily trigger another equity market tumble (like seen last week). For the rest of the week, Fedspeak and US data will remain important to monitor, especially Vice Chair nominee Lael Brainard’s Senate hearing on Thursday and the release of the US December Retail Sales report on Friday.
But arguably the most important US equity market driver for the rest of the week will be the unofficial start of earnings season on Friday when big US banks including JP Morgan, Citigroup and Morgan Stanley will report Q4 results. “Earnings may exceed expectations and that is what is keeping investors active despite knowing that the Fed is going to start tightening in the next several months” one analyst was quoted by newswires as saying. “You'll also see less commentary on earnings calls referencing supply chain constraints this season” he added. If true, earnings season could be a welcome bullish distraction from the theme of Fed tightening and higher interest rates for a few weeks ahead of the Fed’s January 26 meeting.
- GBP/USD has surged in recent trade and is now testing the 1.3700 level and a key downtrend.
- USD is weakening after the latest CPI report and Powell’s remarks on Tuesday failed to spur fresh hawkish Fed bets.
- But GBP/USD now looks quite overbought/overstretched on a few metrics, which could hamper further gains.
GBP/USD upside has accelerated in recent trade as the US dollar suffers substantial post Consumer Price Inflation (CPI) data weakness, with the pair eyeing a bullish break above a key long-term downtrend and the key 1.3700 level. At current levels just below the big figure, cable is trading at its highest since early November, up just under 0.5% on the day and now looking at gains of about 0.8% on the week. If the pair can close out the week at current levels and in the green, that would mark a fourth consecutive week of gains during which time GBP/USD would have rallied a stunning 3.5%. The pair is over 4.0% up from its mid-December lows in the mid-1.3100s.
The rally over the last few weeks was initially driven by factors including a drastic improvement in risk appetite as it become clear the Omicron variant would be much less severe, thus enabling the UK economy to avoid lockdowns. That then in turn boosted the market's confidence that the BoE will follow up on its 15bps December rate hike with multiple further 25bps rate hikes in 2022. But the most recent leg higher has more to do with the US dollar, which failed to garner any meaningful impetus last week amid a sharp hawkish shift in the market’s expectations for Fed policy. Indeed, the dollar has been sharply declining on Tuesday and Wednesday across the board after Fed Chair Jerome Powell’s testimony and the latest US inflation report failed to spur fresh hawkish Fed bets.
Though the fundamentals (tight labour market, hot inflation, hawkish Fed) are arguably still very much supportive of a stronger dollar in 2022, FX markets seem to be in the process of flushing out overly one-way dollar positioning. Indeed, the most recent CFTC positioning data showed Dollar Index long positioning at a 52 week high in the week ending on January 4. A break above the downtrend linking the July, September and late October highs and the 1.3700 level in GBP/USD could open the door to an extension of upside to test October highs above 1.3800.
But cable bulls will be growing increasingly wary of the pair entering short-term overbought conditions. GBP/USD’s 14-day Relative Strength Index (RSI) recently entered overbought territory (i.e. above 70) for the first time since February 2021. Back then, after surpassing 70 in the RSI, cable had a few more good days before then abruptly turning lower. Meanwhile, GBP/USD’s Z-score to its 50-day moving average has now risen above 2.0 (implying it it more than two standard deviations from its 50DMA). In the last 18 or so months, a Z-score above 2.0 has suggested consolidation or a slower pace of gains ahead. Indeed, when looking at the past ten years, GBP/USD five, 21 and 65 day returns after a day when its Z-score to 50DMA was above 2.0 is on average negative by 0.2-0.4%.
Analysts at Credit Suisse expect the EUR/USD pair to trade in the range 1.1050 – 1.1600 during the first quarter. They have a target of 1.1150 for the end of the quarter.
Key Quotes:
“Our expected EURUSD range for Q1 is 1.1050 – 1.1600, and we continue to target 1.1150 for end-Q1. Levels above 1.1450 represent acceptable entry levels for fresh shorts from a risk-return perspective.”
“Despite the insistence of key ECB representatives that policy rate hikes are a long way off, euro area rates markets are pricing in a 25bp rate hike over the next 12 months and at least one more thereafter. This is more remarkable for the fact that the ECB has committed to ending balance sheet expansion before a rate hike is possible.”
“Markets appear to feel high current euro area inflation and the spillover effect of the Fed’s dynamic will force the ECB to act. This is providing EUR with some degree of support by limiting the extent of US - euro area rates divergence.”
- The white-metal advances as demand for USD softened after hot US inflation figures.
- The US 10-year Treasury Inflation Protected Securities (TIPS) extend its fall to -0.838%, boosting silver.
- XAG/USD Technical Outlook: Despite the uptick in silver remains downward, as portrayed by the DMAs located above the spot price.
Silver (XAG/USD) rallies during the New York session, at press time trading at $23.03, up some 1.10%. The white-metal climb is courtesy of a hot US inflation reading, with the Consumer Price Index (CPI) increasing by 7.0% aligned with estimations, spurring a fall of US T-bond yields.
The 10-year benchmark note is down one and a half basis points, sitting at 1.728%, a headwind for the greenback. In the meantime, the US Dollar Index, a measure of the buck’s value against a basket of six rivals, slides 0.43%, currently at 95.21.
Alongside the fall in nominal yields, the US 10 year TIPS, used as a proxy for real yields, which means nominal yields minus inflation, in the last five days dropped from -0.765% reached on January 7 to -0.838%.
US inflation in December increased above 7%
Before Wall Street opened, the US Bureau of Labor Statistics (BLS) featured the Consumer Price Index (CPI) for December, which came at 7.0%, as foreseen by analysts on its annual number. Additionally, the Core CPI figure, which excludes volatile items like food and energy prices, increased annually by 5.5%, higher than the 5.4% estimated by market participants.
XAG/USD Price Forecast: Technical outlook
In the overnight session, the white-metal seesawed around the 200-hour simple moving average (SMA), in fact, dipped below it to print a daily low at $22.65. Nevertheless, when the US CPI figures crossed the wires, silver rallied above $23.00 for the first time in five days.
However, the XAG/USD daily chart portrays the white metal as downward biased. The daily moving averages (DMAs) reside above the spot price. Worth noting, the upward move spurred by US economic data was capped 20-pips below the confluence of the 50 and the 100-DMAs around the $23.20-30 area, which would be the first resistance level on its way up. A breach of the latter would expose the $24.00 psychological level, that once broke, could send silver towards a nine-month-old bearish trendline, drawn from May 2021 cycle highs that pass near the $24.35 area.
Contrarily, silver bull’s first line of defense would be the psychological $23.00. A decisive break would exert downward pressure on the non-yielding metal, exposing the January 11 daily low at $22.44, followed by $22.00.
The US dollar will likely continue to trade versus the Indian rupee in the 74/76 trading range during the first quarter, according to economists at Credit Suisse. They are optimistic about the outlook for the Indian economy.
Key Quotes:
“In Q4 we expected higher USDINR as India’s strong re-opening momentum was likely to boost imports and further widen the trade deficit. As such we did not anticipate the late December rally in INR (from 76 per dollar to 74). However we still think the 74-76 trading range will persist in Q1.”
“Although the rupee has weakened against the dollar by 30% since 2011, the cumulative impact of years of high inflation has eroded any competitiveness gained from a weaker rupee. INR REER (Real Efective Exchange Rate) has traded in a steady range since 2017, when RBI began accumulating FX reserves more aggressively."
“We think the RBI is managing the currency for REER stability. Although the RBI intervenes to enforce a narrow USDINR trading range (which we currently think is 74-76), over time this range gradually shifts higher as the RBI aims for steady inflation-adjusted currency competitiveness.”
“We remain optimistic on the outlook for Indian GDP, but that optimism (and associated high investment and consumption) amid re-opening is actually negative for the trade balance and INR.”
Federal Reserve Bank of Cleveland President Loretta Mester said in an interview with the WSJ that, depending on what happens with the economy, some of the rate increase further out may need to be moved forward.
Additional Remarks:
"There are many things pushing up inflation now, including supply chain issues and wages."
"We've moved from pandemic driven inflation to something broader."
"If we can get beyond the pandemic we'll see inflation measures come back down."
"That is incumbent on the fed doing what it needs to do to move off extraordinary accommodation."
"Depending on what happens with the economy some of the rate increases further out may need to be moved forward."
"The case is very compelling that we remove accommodation."
"The Fed is also considering what it can do to balance sheet to bring the level of assets down."
"If things look like they do today in march she would support lifting rates from zero at that point."
"Because of demographics, labor force participation trend is downward and we are back to that trend."
"The pace of interest rate increases will depend on how the economy plays out."
"The Fed will have to take policy actions to make sure inflation expectations remain consistent with its 2% goal."
"The Fed had to put in a lot of accommodation early in the pandemic but now the economy is basically back to full employment and above its inflation target."
Analysts at Rabobank point out that there is potential for the AUD/USD pair to be whipsawed by US dollar related volatility in the early months of this year on the back of Federal Reserve policy signals. That said, they expect AUD/USD to push higher to 0.74 during the second half of the current year.
Key Quotes:
“Nobody would argue with the expectation that the Federal Reserve is positioning itself to hike rates well ahead of the RBA. The relevant questions for the outlook for AUD/USD relate to what degree this forecast is already priced in and the risk that expectations regarding the pace of tightening by either central bank could change in the coming months.”
“Exactly one year ago, the market consensus was forecasting that AUD/USD would end 2021 at 0.78. In February last year AUD/USD hit a high around 0.8007 which underpinned enthusiasm among AUD bulls. This level, however, proved to be the peak and in early December AUD/USD dipped below 0.70 as Fed hawkishness increased. Aside from the pick-up in the broad-based value of the USD in H2 last year, one of the major drivers behind the relative softness of the AUD/USD last year was, in our view, the continued dovish position of the RBA. Headed into 2022 there is scope for this to change.”
“It can be assumed that further evidence of strength in the labour market will trigger expectations regarding scope for a potential positive shift in RBA rhetoric which will underpin the outlook for the AUD.”
“There is potential for AUD/USD to be whipsawed by USD related volatility in the early months of this year on the back of Fed policy signals. That said, we expect AUD/USD to push higher to 0.74 in H2 2022.”
- WTI has surged into the mid-$82.00s and is trading at more than two-month highs as the dollar falls post-CPI.
- Oil prices saw a positive reaction to the latest weekly US EIA inventory report which showed an eighth successive draw.
Oil prices hit more than two-month highs on Wednesday, buoyed as the US dollar weakened in wake of a broadly in line with expectations US inflation report. Front-month WTI futures recently hit the $82.50 mark, their highest level since 10 November and well above their levels prior to the initial news of the Omicron Covid-19 variant (in the $78.00 area). WTI has bounced more than $4.50 since its earlier weekly lows under $78.00 a rally of roughly 6.0%, with prices up a further $1.20 or 1.5% on Wednesday as the dollar crumbles. Oil bulls will now surely be eyeing a test of 2021 highs in the $85.00s area.
Despite showing inflationary pressures hitting their highest in the US since 1982 with the headline Consumer Price Index up 7.0% YoY in December, traders have taken the data, which was broadly in line with expectations, as a green light to take profit on dollar long positions. The DXY now trades down nearly 0.5% on the day having cratered from above 95.50 towards the 95.00 level. A weaker dollar makes USD-denominated crude oil cheaper for purchase by international buyers, hence boosting its demand.
The weakening of the US dollar has been one of the primary drivers of higher oil prices this week, with the DXY now down more than a percent from earlier weekly highs, though crude oil-specific factors are also being cited. Market participants remain bullish on the demand outlook for 2022 with the economic impact of Omicron seen as likely to be short-lived, which spurred the US EIA to upgrade its oil demand outlook for the year. The agency said on Tuesday that it now sees US demand rising 840K barrels per day (BDP) in 2022 versus its forecast last month of demand rising 700K.
Meanwhile, OPEC+ output remains a supportive theme, with smaller producers (Libya and Nigeria) still struggling to keep up with recent output quota increases and talks between Western powers and Iran on a return to the JCPOA not making any progress. That suggests no return of large amounts of Iranian crude oil exports to global markets anytime soon. Some a fretting about the risks to demand in China/Asia as China maintains its zero Covid-19 stance even in the face of the much more transmissible Omicron variant, but lockdowns there, for now, remain localised.
Finally, WTI saw a modest boost from the recently released weekly US EIA crude oil inventory report. The report showed a draw in crude oil stocks of roughly 4.5M barrels, much larger than the expected 1.9M barrels, despite Tuesday’s private inventory report pointing to a smaller than expected draw of roughly 1M barrels. However, Distillate stocks rose by roughly 2.5M barrels, more than the 1.75M barrels expected, and gasoline stocks saw a massive near 8M barrel rise, well above expectations for a 2.4M build. Nonetheless, the bullish headline number stole the focus, with headline crude oil stocks having now drawn for eight successive weeks.
Taking into accont the minutes from the last Banxico meeting and recent events, analysts at Standard Chartered expected the Bank of Mexico to raise the policy rate 50bps (instead of 25bps) at each of the next two meetings.
Key Quotes:
“Banxico increased the policy rate 50bps, bringing it to 5.50%, at December’s policy meeting. Four board members who voted for the 50bps hike expressed concerns over wide-spread inflationary shocks, rising inflation expectations, and the ongoing tightening of global financial conditions, arguing that rate hikes need to be more aggressive and decisive to maintain Banxico’s credibility.”
“We now expect Banxico to deliver two more 50bps hikes at the next two meetings (instead of 25bps), bringing the policy rate to 6.5% by end-Q1-2022 (6.0%).”
“We see a possible surge in COVID cases, sluggish economic growth and labour market recovery as major downside risks to our policy rate forecast. Economic growth slowed by 0.21% m/m in October amid a contraction in agricultural and services activities, and the unemployment rate is still well above the pre-pandemic level, especially in urban areas. Limited monetary and fiscal stimulus provided during the pandemic could also justify slower rate hikes. However, given the concerns over inflation expectations and possible Fed tightening in March, we expect Banxico to frontload and increase rate hikes in Q1-2022.”
- Kiwi benefits from risk appetite and lower US yields.
- DXY tumbles despite inflation hitting the highest in decades in the US.
- NZD/USD having the best day in weeks.
The NZD/USD is having the best day in weeks on Wednesday, supported by a broad-based slide of the US dollar. The pair trades at 0.6840, the highest since January 3 as the DXY tumbles 0.47%, to the lowest in more than a month.
US yields down, despite inflation reading
The US CPI reached in December 7%, in line with expectations. It was the highest reading since 1982. Despite the numbers, US yields moved to the downside and together with higher equity prices on Wall Street, pushed the dollar to the downside.
“If CPI inflation is still around 7% heading into the March FOMC meeting, as we expect it to be, it will be hard for the Fed to stand by idly”, warned analysts at Wells Fargo. The next FOMC meeting is on January 24/25.
The DXY is falling for the third time out of the last four trading days, breaking the 95.50 support area. Now it appears to be heading toward 95.00. At the same time, NZD/USD, broke above 0.6800 and is now looking at the December peak at 0.6856.
A daily close above 0.6860 should clear the way to more gains, with the next critical level seen at the 55-day simple moving average at 0.6890. If NZD/USD reverses from current levels, the support emerges at 0.6795 (20-day moving average).
Technical levels
Data released on Wednesday showed that US inflation reached 7% the highest level since 1982. Analysts at Wells Fargo point out that if CPI inflation is still around 7% heading into the March FOMC meeting, as they expect it to be, it will be hard for the Federal Reserva to stand by idly.
Key Quotes:
“December's 0.5% increase in the Consumer Price Index marks a slowdown from November's gain, but the relative size should not detract from the absolute size which shows prices continue to rise at a menacing pace. The ongoing strength of inflation was underscored by the year-over-year change rising to 7%, which is the largest increase in nearly 40 years.”
“Although the exceptional pace of goods inflation and momentum in shelter costs are still firmly rooted in the pandemic, the increasingly tight labor market and ensuing wage pressures will make it difficult for inflation to fall back on its own. The FOMC has been discussing a more aggressive response to inflation in recent weeks, and with the core CPI still likely to be around 4% by the end of the year, we do not believe it will end up being just talk. If CPI inflation is still around 7% heading into the March meeting, as we expect it to be, it will be hard for the Fed to stand by idly.”
- A general slide of the dollar boosts AUD/USD to the upside.
- Pair faces next resistance around 0.7275.
- US inflation rises to 7%, largest increase in nearly 40 years.
The US dollar is falling sharply amid higher equity prices and following the US CPI December report. The AUD/USD jumped to 0.7266 during the American session, reaching the highest level in a week. It remains around the top, with the bullish momentum intact.
The decline of the dollar and a rally in commodity prices are boosting AUD/USD. The DXY is falling by 0.40%, at 95.20, the lowest since November 15. The annual inflation rate in the US reached at 7% the highest since 1982. The number did not boost US yields the printed fresh lows and weighed on the dollar.
AUD/USD likely to test recent tops
The pair is approaching the 0.7275/80 zone that capped the upside late in December and early January. A break higher would strengthen the positive outlook for the aussie. The next level to watch is the 100-day simple moving average at 0.7285.
If AUD/USD fails to break the mentioned resistance, a retreat toward the 20-day moving average at 0.7200 seems likely.
Technical levels
- USD/CHF dipped below the 0.9200 level in recent trade, weighed amid a broad flushing out of USD long positions.
- The move lower in USD comes despite near-four decade-high CPI, which seemingly failed to spur fresh hawkish Fed bets.
Amid what appears to be a large flushing out of dollar long positions after the latest US inflation report failed to spur fresh hawkish Fed bets, USD/CHF has slumped from the mid-0.9200s to underneath 0.9200 in recent trade. On its way lower, the pair has broken below a key uptrend that had been supporting the price action so far in 2022, its 50-day moving average at 0.9215 and its 21-day moving average at 0.9196. That means the door is open for a retest of the last weekly lows at 0.9180 and a test of the 200-day moving average in the 0.9160s. At current levels in the 0.9180s, USD/CHF is trading lower by about 0.5% on the day, having now reversed a full percent lower from Tuesday’s near-0.9280 peaks.
The dollar’s loss of bullish momentum which had seen it rally from near-0.9100 at the start of 2022 to this week’s highs near-0.9280 began after Fed Chair Jerome Powell failed to spur fresh hawkish Fed bets in wake of his testimony on Tuesday. Though the Fed Chair, who was speaking at his renomination hearing before Congress, endorsed the idea of multiple hikes in 2022 and a start to quantitative tightening, his tone didn’t deviate much from the December Fed meeting or its minutes. Traders seemingly took this as a green light to take profit on long-held USD bullish positions and, despite headline CPI on Wednesday showing inflationary pressures reached their highest level since June 1982 at 7.0% in December, the latest inflation report seems to have been interpreted the same way.
Looking at the DXY from a technical perspective, with the index having now broken below key support in the 95.50 area, the current pullback has some room to run. The next area of significant support is in the 94.50 zone. A drop back to these sorts of levels suggests that USD/CHF could be headed back for a test of Q4 2021 lows in the 0.9100s. This would be a very attractive level for longer-term USD bulls betting that the hawkish Fed will ultimately push US yields and the US dollar higher to reload on longs.
Whilst not the case on Wednesday, in the long-run high US inflation is likely to benefit the buck. And as ING put it, “the risks are likely skewed towards higher for longer inflation with the Federal Reserve ending up responding more aggressively to keep it in check.” “After all,” continues the bank, “labour costs are accelerating, companies have pricing power, Asia lockdowns in response to a zero-Covid policy risk prolonging supply chain strains while inventory rebuilding could keep demand outstripping supply for a good while yet.”
- USD/JPY trades on the defensive near the 115.00 mark.
- US yields show a mixed performance on Wednesday.
- US headline CPI rose 7% YoY in December, in line with estimates.
The greenback accelerates its losses and drags USD/JPY to the area of weekly lows near the 115.00 figure on Wednesday.
USD/JPY looks to yields, weaker on data
USD/JPY resumes its monthly decline and quickly fades Tuesday’s uptick, refocusing once again on the lower end of the range in the 115.00 neighbourhood.
Mixed performance in the US cash markets show modest gains in yields in the short end of the curve, while the belly and the long end add to the recent decline and revisit the 1.70% area and the 2.05% zone, respectively.
In the docket, the selloff in the buck – and the downside in spot - gathered extra pace after US inflation figures measured by the headline CPI rose 7.0% in the year to December, matching forecasts and thus removing the surprise factor, which seems to have hurt the sentiment of many. The Core reading came above consensus after prices gained 5.4% vs. the same month in 2021.
USD/JPY levels to consider
As of writing the pair is losing 0.20% at 115.07 and faces the next support at 114.94 (2022 low Jan.3) seconded by 114.19 (55-day SMA) and then 113.14 (low Dec.17). On the upside, a surpass of 116.35 (2022 high Jan.4) would aim to 115.00 (round level) and finally 115.62 (high Jan.19 2017).
- In the New York session, the euro is gaining 0.44%.
- Fed’s Chief Jerome Powell said that the US central bank would use its tools to tackle inflation.
- US inflation figures aligned with expectations but boosted the EUR instead of the USD.
On Wednesday, as the North American session begins, the euro surges against the greenback, on the back of US inflation figures, which came in line with expectations, though weighed on the US dollar. Per the market’s reaction, it appears a “buy the rumor, sell the fact” event, as the EUR/USD exchanges hands at 1.1416 at the time of writing.
On Tuesday, Fed’s Chief Jerome Powell, who has been renominated for the job by US President Joe Biden, appeared at the US Senate. Over there, he said that the US economy does not need to be accommodative, and when asked about inflation, Powell emphasized that “if we have to raise interest rates more over time, we will.” It is worth noting that the Fed’s Chief stated that the Federal Reserve should focus more on elevated prices than on achieving the maximum employment goal, though the importance of the US CPI reading, on the day.
US Consumer Price Index (CPI) came within forecasts
In the meantime, the US Bureau of Labor Statistics (BLS) revealed that the Consumer Price Index (CPI) for December rose by 7.0%, as foreseen by analysts on its annual reading. Excluding volatile items like food and energy prices, the so-called Core CPI increased annually by 5.5%, a tenth up from the estimated 5.4%, close to expectations.
In the overnight session for North American traders, the Eurozone economic docket revealed the Industrial Production for the Euro area. Industrial Production rose 2.3% on its monthly reading but fell 1.5% on an annual reading, per Reuters reported.
EUR/USD Price Forecast: Technical outlook
In the EUR/USD daily chart, the euro finally trades above the 1.1386 strong resistance level for the first time since November 15, 2021. The breach of the trading range maintains EUR bulls hopeful of launching an attack towards an eight-month-old downslope trendline, drawn from May 2021, cycle highs, that the EUR/USD would face around the 1.1440-60 area. Once that level is broken, the next ceiling level would be the confluence of the 100-day moving average (DMA) and the 1.1500 psychological level.
Contrarily on the downside, the EUR/USD first support would be the January 11 daily high, previous resistance-turned-support, at 1.1375, followed by the 50-DMA at 1.1338 and then the 1.1313.
- Gold continues to trade broadly flat on the day in the $1820 area post-hotter than expected US CPI.
- In an unintuitive reaction, the dollar has been weakening in recent trade, but technical resistance is stopping gold from benefitting.
In wake of a broadly hotter than expected US Consumer Price Inflation (CPI) report, spot gold (XAU/USD) prices continue to trade sideways in the $1820 area where it trades broadly flat on the day. In a somewhat unintuitive reaction to headline CPI rising in line with expectations to 7.0% YoY, its highest levels since June 1982, and Core CPI rising above expectations to 5.5%, the US dollar has come under pressure. The data, which comes on the heels of last Friday’s jobs report which showed the unemployment rate falling under 4.0%, strongly supports the case for Fed tightening this year, even if much of the recent pressures come from used car prices.
But market participants appear to be taking the view that positioning in the US dollar has in recent weeks become too bullish, hence the downside in both. For reference, the DXY recently fell under the 95.50 mark to hit its lowest level since mid-November. The dollar’s case isn't being helped by the fact that, in wake of the data, 10-year TIPS yields are going sideways in the -0.85% area, having dropped back about 10bps since Fed Chair Jerome Powell’s not as hawkish as feared comments on Tuesday. The combination of a weakening dollar plus subdued real yields would typically be a positive for spot gold prices.
However, resistance in the form of a downtrend from the 2 and 5 January highs appears to have blocked XAU/USD from pushing higher. Perhaps if the dollar continues to crater and real yields build on Tuesday’s pullback from recent highs then spot gold can see a bullish breakout a test last week’s highs in the $1830 area. It is worth bearing in mind that many rate and FX strategists think that in the medium to long-term as the Fed tightens monetary policy, the trajectory for the dollar and US real yields will ultimately be higher. That suggests traders should guard against the building of medium-term bullish positions in gold and should instead be nimble if they are going to trade on the long side.
- EUR/JPY adds to Tuesday’s gains and surpasses the 131.00 mark.
- The dollar's soft stance is sustaining upside for the cross.
- US headline CPI failed to surprise markets in December.
The selling bias in the greenback is sustaining a better mood in the risk complex and pushing EUR/JPY to new multi-day highs near 131.50 midweek.
EUR/JPY poised for further upside
EUR/JPY is advancing for the second session in a row on Wednesday, and at the same time extending the recent breakout of the always relevant 200-day SMA, today at 130.53.
Further gains continue to be sustained by an improvement in the sentiment surrounding risk-associated assets, always at the back of the US dollar's persistent selloff.
US yields are trading on a mixed note with the belly of the curve drifting lower vs. the move up in the short and long ends of the curve.
The dollar's weakness came after US inflation figures failed to surprise markets, with the headline CPI rising 7.0% YoY in December and the Core CPI up 5.5% YoY, almost in line with investors’ expectations.
EUR/JPY relevant levels
So far, the cross has gained 0.26% and is at 131.41, whilst a surpassing of 131.60 (2022 high Jan.5) would expose 132.17 (Fibo level) and then 132.56 (high Nov.4 2021). On the downside, the next support comes in at 130.53 (200-day SMA) followed by 130.15 (weekly low Jan.10) and finally 130.02 (2022 low Jan.3).
- GBP/USD shot to over a two-month high during the early North American session.
- The latest US inflation figures did little to revive the USD demand or stall the move.
- Sustained strength beyond a descending trend-line will set the stage for further gains.
The GBP/USD pair caught fresh bids during the early North American session and jumped to the highest level since November, around the 1.3680-85 area post-US consumer inflation figures.
The headline US CPI rose 0.5% MoM in December as against consensus estimates pointing to a fall to 0.4% from 0.8% in the previous month. This was enough to push the yearly rate to a fresh multi-decade high level of 7% from 6.8% in November. Moreover, core inflation, which excludes food and energy prices, surpassed market expectations and accelerate to 5.5% from a year ago as compared to 4.9% in November.
Given that an eventual Fed lift-off in March 2022 is fully priced in the markets, the data did little to impress the US dollar bulls. Conversely, a positive risk tone and softer US Treasury bond yields continued denting the greenback's relative safe-haven status. Apart from this, hopes that the Omicron outbreak won't derail the UK economy acted as a tailwind for the British pound and provided a fresh lift to the GBP/USD pair.
With the latest leg up, spot prices climbed to a resistance marked by a downward sloping trend-line resistance extending from the July 2021 swing high. Some follow-through buying will be seen as a fresh trigger for bullish traders and set the stage for an extension of the GBP/USD pair's recent strong move up witnessed since December 20.
Technical levels to watch
- Headline CPI rose 7.0% YoY as expected in December.
- But the MoM pace of headline price growth, as well as Core CPI measures were above expected.
Inflation in the US, as measured by the Consumer Price Index (CPI), rose to 7.0% on a yearly basis in December from 6.8% in November, the US Bureau of Labor Statistics reported on Wednesday. That was the highest reading since June 1982 and was in line with the median economist forecast for a reading of 7.0%. The MoM pace of price increases as per the CPI came in at 0.5%, slightly above expectations for a MoM gain of 0.4%, though still marking a deceleration from November's 0.8% MoM reading.
Core CPI rose at a pace of 5.5% YoY, above market expectations for a 5.4% reading and a significant jump from November's 4.9%. The pace of Core price growth was also faster than expected MoM, coming in at 0.6% versus forecasts for it to remain unchanged at 0.5%.
Many economists argue that consumer price inflation in the US peaking in December, or will do so by the end of Q1 2022 given early indications that supply chain disruptions that have driven up costs are easing. But the rapid spread of the Omicron variant, which has been highly disruptive for businesses, threatens this thesis and may delay supply chain normalization.
Market Reaction
Despite core CPI measures coming in hotter than expected, the Dollar Index has seen some downside in the initial market reaction to the latest CPI report. The DXY has in recent trade dipped below the 95.50 level breaking below its late-November lows and hitting its lowest since November 15.
- USD/CAD recently dipped below 1.2550 as FX market focus shifts to upcoming US CPI data.
- The loonie has been supported in recent sessions as oil prices have surged.
- A potential hawkish shift from the BoC in the coming weeks might further add to recent CAD tailwinds.
USD/CAD has continued recent bearish momentum on Wednesday even though other asset classes and major currency pairs have been trading more tentatively ahead of the release of key US Consumer Price Inflation data at 1330GMT. The pair recently dipped under 1.2550, taking its losses on the week to more than 100 pips or about 0.8%, as the loonie continues to outperform in the FX space alongside other commodity-sensitive currencies as it tracks upside in oil.
WTI is currently trading in the mid-$81.00s having recently tested $82.00 earlier in the session, which put it at near two-month highs and well above pre-Omicron levels. Continued expectations for strong demand growth in 2022, as emphasized by the US EIA on Tuesday upping their 2022 demand growth forecasts, coupled with ongoing OPEC+ producer struggles to lift output and no sign of any nuclear deal with Iran has been lifting prices. Should this trend continue and should the dollar fail to reap any post-US data strength, then USD/CAD could soon be looking at a test of its 200-day moving average in the 1.2500 area and the important balance zone in the 1.2480s just below it.
A successful break below the 200DMA would send a medium-term bearish signal and could open the door to a test of Q4 2021 lows in the 1.2300 area. Following recent strong economic data, the BoC is expected to soon pivot hawkishly (perhaps at the 26 January meeting) by bringing forward its guidance for when rate hikes could commence to the end of Q1 from no earlier than Q2. That would open the door to a very likely March rate hike and could offer the loonie support in the coming months, strengthening the USD/CAD bearish thesis.
- GBP/JPY edged higher for the second successive day and climbed to a one-week high on Wednesday.
- Receding Omicron fears, rising BoE rate hike bets continued acting as a tailwind for the British pound.
- The upbeat market mood undermined the safe-haven JPY and provided an additional lift to the cross.
The GBP/JPY cross maintained its bid tone through the mid-European session and was last seen hovering near a one-week-high, just below mid-157.00s.
The cross gained traction for the second successive day on Wednesday and now seems all set to build on this week's solid rebound from sub-156.00 levels. The British pound continued with its relative outperformance amid hopes that the Omicron outbreak won't derail the UK economy.
This, along with rising bets for additional rate hikes by the Bank of England, acted as a tailwind for the sterling. Apart from this, a generally positive tone around the equity markets undermined the safe-haven Japanese yen and extended additional support to the GBP/JPY cross.
Despite the supporting factors, traders seemed reluctant and preferred to wait on the sidelines ahead of the critical US consumer inflation figures. This makes it prudent to wait for a strong follow-through buying before positioning for any further appreciating move for the GBP/JPY cross.
Nevertheless, the fundamental backdrop seems tilted firmly in favour of bullish traders and supports prospects for an extension of the recent strong move up witnessed since December 20. Hence, a move beyond the 158.00 mark, towards testing 2021 high, remains a distinct possibility.
Technical levels to watch
- NZD/USD is consolidating in the 0.6775 area having failed to test 0.6800 earlier as US CPI data looms.
- The pair has been contained within a bearish trend channel so far in 2022.
Ahead of the release of this week’s most important economic data at 1330GMT, the December US Consumer Price Inflation report, FX markets are subdued and in in wait-and-see, with NZD/USD trading in contained fashion just below 0.6800. In earlier Wednesday trade, the pair briefly moved above its 21-day moving average in the 0.6780s and came within a whisker of a test of the psychologically important round 0.6800 figure but has since dropped back to the 0.6775 area. At current levels, the pair trades just under 0.2% lower on the day, with recent price action confirming that NZD/USD is, for now, trading within a short-term bearish trend channel that has been capping the price action since the start of the year.
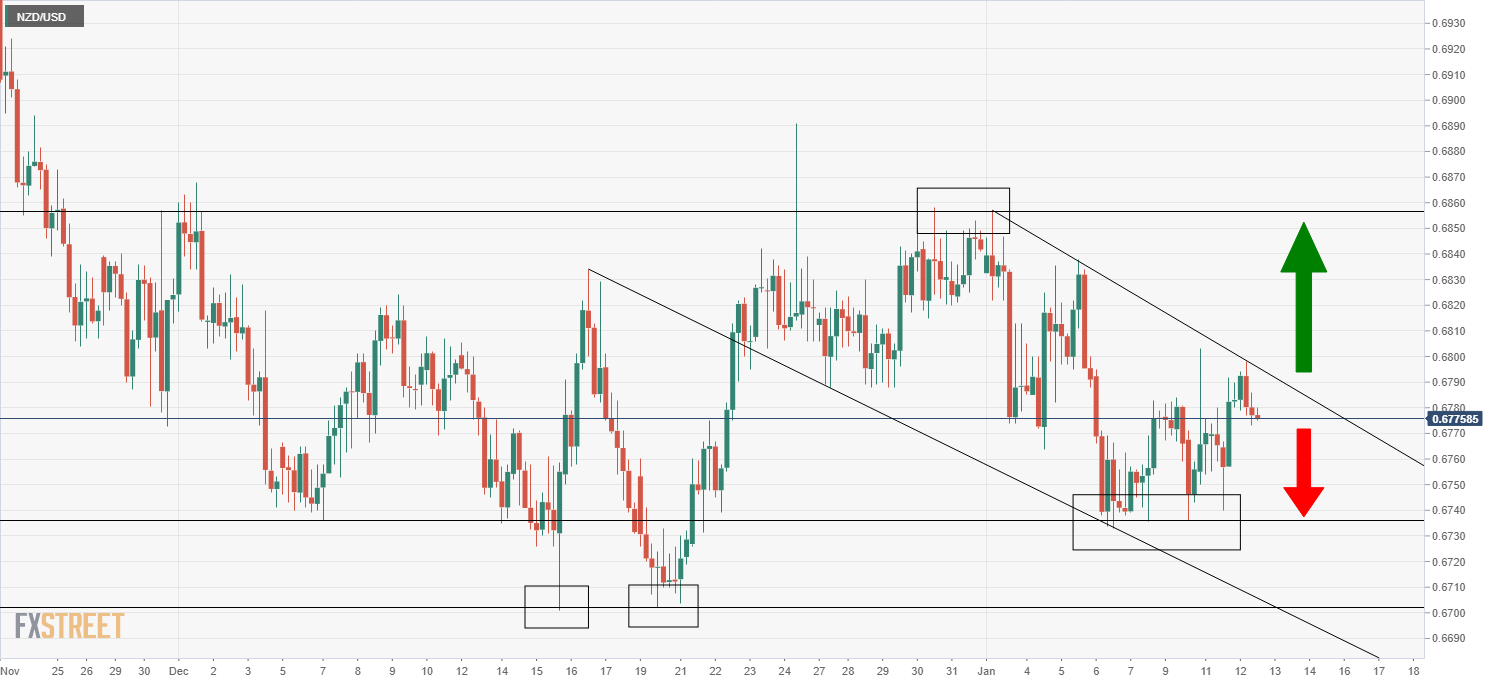
With the US dollar having last week failed to rally despite an aggressive hawkish repricing of the market's expectations for Fed policy in 2022 and a subsequent sharp rise in US yields and having fallen to six-week lows (in the DXY) in wake of Fed Chair Jerome Powell’s not as hawkish as feared Congressional testimony on Tuesday, analysts are split over how they expect the dollar to react to Wednesday’s US inflation figures. According to Giles Coghlan, chief currency analyst at HYCM, “if we see core inflation below 5%, we'll see the dollar sell-off in a flash”. Meanwhile, ING currency strategist Francesco Pesole noted that with markets expecting an above 7.0% headline reading, any immediate market reaction should be contained.
Danske Bank takes the view that “a lower month-on-month number should not change much on the pricing of the Federal Reserve as they need more than one number to change their view on quantitative tightening and rate hikes.” The bank adds that “underlying price increases have been higher than estimated for many months now so risks seem skewed to the upside... High inflation and a tight labour market with no significant rebound in labour force participation put the Fed under pressure to hike (rates) more.” For these same reasons, ING argues that markets will keep buying the dips in the dollar for the time being”.
For NZD/USD, that suggests that if the pair was to break above its recent bearish trend channel on a softer CPI print, rally above 0.6800 and head back towards recent highs in the 0.6850s area, sellers may be attracted back. Resistance in the 0.6850-70 area which includes the December highs and 50-day moving average may prove formidable. To the downside, it's worth watching support in the 0.6730s.
- EUR/USD meets initial resistance in the 1.1375/80 band.
- Further upside looks likely if this area is surpassed.
Following Tuesday’s strong uptick, EUR/USD’s upside momentum has run out vigour in the vicinity of 1.1390 on Wednesday.
If the pair manages to regain strength it should face the initial target in the 1.1390 region, where recent tops and the 4m resistance line converge. Above this area, the selling pressure should subside and sponsor extra gains to 1.1400 and beyond in the not-so-distant future.
The broader negative outlook for EUR/USD is seen unchanged while below the key 200-day SMA at 1.1735.
EUR/USD daily chart
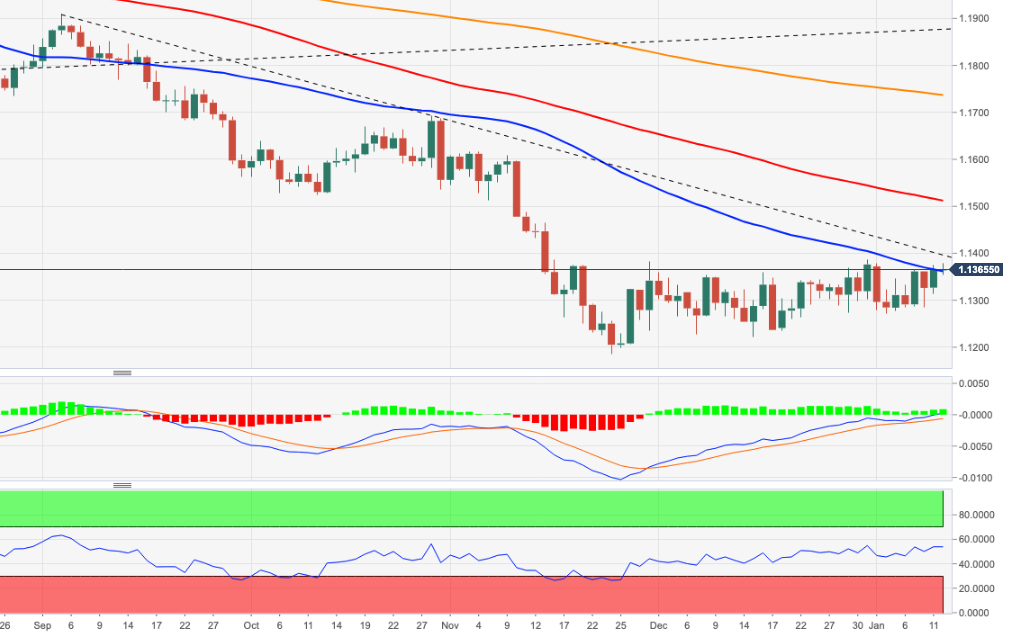
US CPI Overview
Wednesday's US economic docket highlights the release of the critical US consumer inflation figures for December, scheduled later during the early North American session at 13:30 GMT. The headline CPI is anticipated to come in at 0.4% during the reported month, down from the 0.0% reported in November. Conversely, the yearly rate is projected to rise from 6.8% previous to a fresh multi-decade high level of 7% in December. Meanwhile, core inflation, which excludes food and energy prices, is anticipated to accelerate to 5.4% from a year ago as against 4.9% in November.
As Joseph Trevisani, Senior Analyst at FXStreet, explains: “The US economy is set to deliver another year of soaring prices in 2022 as it closes out a 40-year record in December. Manufacturing production is bedeviled by component and raw material shortages, the global supply chain is creaking under labor and pandemic restrictions and workers are demanding higher wages as firms compete for scarce employees.”
How Could it Affect EUR/USD?
A stronger than expected print will reinforce market bets for an eventual Fed lift-off in March 2022 and should provide a modest lift to the US dollar. Conversely, a softer reading – though seems unlikely – might do little to calm market fears about a faster policy tightening by the Fed. This, in turn, suggests that the path of least resistance for the USD is to the upside and down for the EUR/USD pair.
Meanwhile, Eren Sengezer, Editor at FXStreet, provided important technical levels to trade the major: “On the downside, 1.1340 (previous resistance, 20-period SMA) aligns as first support and sellers could come back into play if a four-hour candle closes below that level. 1.1320 (100-period SMA) and 1.1300 (200-period SMA, psychological level) could be seen as the next support levels.”
“In case the pair manages to climb above 1.1380 (static level) and starts using it as support, 1.1400 (psychological level) could be targeted before 1.1440 (static level),” Eren added further.
Key Notes
• US Consumer Price Index December Preview: The Fed’s die is cast
• US Inflation Preview: Dizzying heights of 7% would cement a March hike, supercharge the dollar
• EUR/USD Forecast: Euro needs to clear 1.1380 to extend rally
About the US CPI
The Consumer Price Index released by the US Bureau of Labor Statistics is a measure of price movements by the comparison between the retail prices of a representative shopping basket of goods and services. The purchasing power of USD is dragged down by inflation. The CPI is a key indicator to measure inflation and changes in purchasing trends. Generally speaking, a high reading is seen as positive (or bullish) for the USD, while a low reading is seen as negative (or Bearish).
- DXY struggles for direction in recent lows near 95.50.
- The loss of the mid-95.00s should open the door to extra losses.
DXY seems to have met some decent support in the area of YTD lows around 95.50 on Wednesday.
If sellers break below this level, they can push the index further south in the short-term horizon. Against that, the next support of note emerges at the weekly low at 94.94 recorded on November 15.
In the meantime, while above the 4-month support line (off September’s low) near 95.10, further gains in DXY are likely. Looking at the broader picture, the longer-term positive stance remains unchanged above the 200-day SMA at 93.10.
DXY daily chart
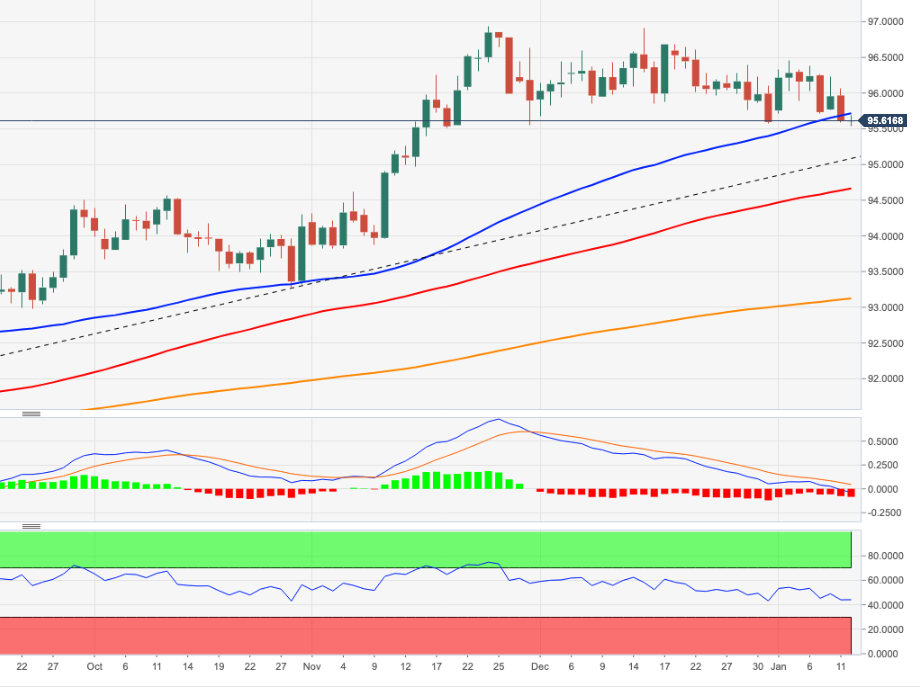
- EUR/JPY adds to Tuesday’s uptick beyond the 131.00 yardstick.
- Next on the upside comes the YTD highs near 131.60.
EUR/JPY extends Tuesday’s optimism and manages to reclaim the 131.00 mark and above midweek.
The near-term persistence of the buying impulse could motivate the cross to attempt a move to the 131.50/60 band, where the so far 2022 high sits (January 5). Further up comes the minor hurdle at the Fibo level (of the October-December drop) at 132.17.
While above the 200-day SMA, today at 130.53, the outlook for EUR/JPY should remain constructive.
EUR/JPY daily chart
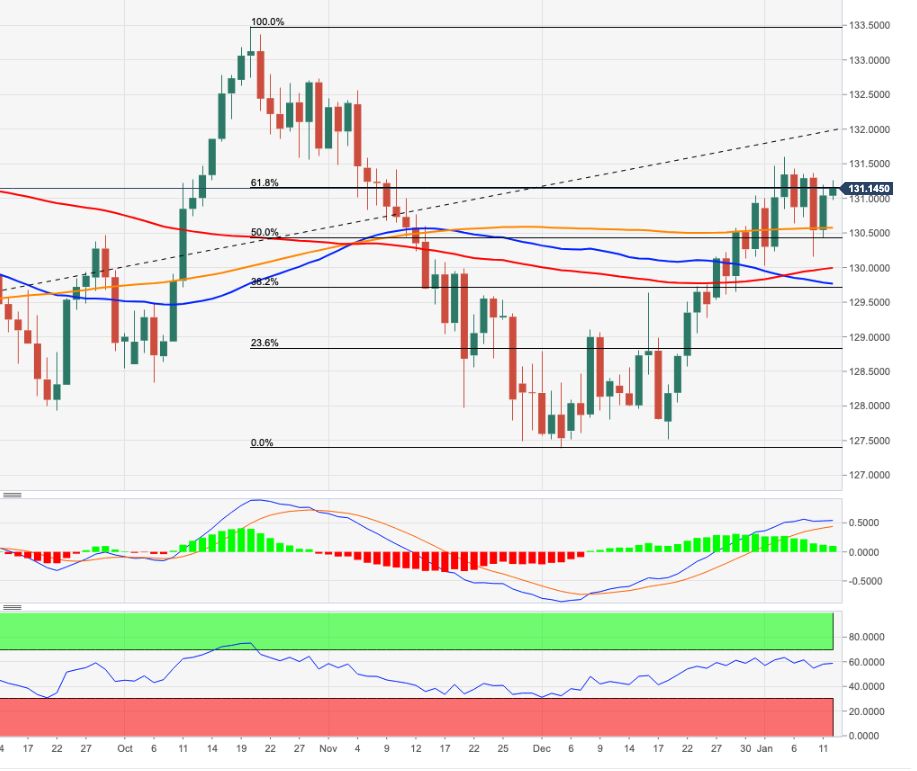
- AUD/USD oscillated in a narrow trading band through the first half of the European session.
- A positive risk tone, subdued USD demand acted as a tailwind for the perceived riskier aussie.
- Investors seemed reluctant to place aggressive bets ahead of the critical US consumer inflation.
The AUD/USD pair seesawed between tepid gains/minor losses through the first half of the European session and held steady near the weekly high, just above the 0.7200 mark.
The pair, so far, has struggled to gain any meaningful traction, or capitalize on the previous day's positive move and oscillated in a narrow trading band on Wednesday. Softer than expected Chinese inflation figures turned out to be a key factor that acted as a headwind for the Australian dollar. That said, a generally positive tone around the equity markets extended some support to the perceived riskier aussie.
On the other hand, the US dollar was weighed down by Fed Chair Jerome Powell's less hawkish comments on Tuesday and the recent pullback in the US Treasury bond yields. During his renomination hearing before the Senate, Powell said that it could take several months to decide on running down the central bank's balance sheet. This, in turn, kept the USD bulls on the defensive and helped limit the downside for the AUD/USD pair.
Investors, however, seemed reluctant and preferred to wait on the sidelines ahead of the US consumer inflation figures, due later during the early North American session. The data will play a key role in influencing the USD price dynamics and provide a fresh impetus to the AUD/USD pair. This makes it prudent to wait for a sustained move in either direction before positioning for any meaningful intraday movement.
Technical levels to watch
- Industrial Production in the euro area expanded at a stronger pace than expected in November.
- EUR/USD continues to trade in a tight range above 1.1350.
Industrial Production in the euro area and the EU expanded by 2.3% and 2.5%, respectively, on a monthly basis in November, the data published by Eurostat revealed on Wednesday. The market expectation was for an increase of 0.5% in the euro area.
On a yearly basis, Industrial Production in the euro area contracted by 1.5%, compared to analysts' estimate for an expansion of 0.6%, and remained unchanged in the EU.
Market reaction
Investors showed little to no reaction to these figures and the EUR/USD pair was last seen trading virtually unchanged on the day at 1.1365.
- GBP/USD witnessed modest pullback from an over two-month high touched this Wednesday.
- The technical set-up still favours bullish traders and supports prospects for additional gains.
- A dip towards the 1.3600 mark could still be seen as buying opportunity and remain limited.
The GBP/USD pair retreated a bit from over two-month high touched earlier this Wednesday and was last seen trading near the daily low, around the 1.3625-20 region. The downtick lacked any fundamental catalyst and could be attributed to some repositioning trade ahead of the critical US consumer inflation figures.
From a technical perspective, the overnight sustained strength beyond the 61.8% Fibonacci level of the 1.3834-1.3161 downfall and the 1.3600 mark favours bullish traders. The constructive outlook is reinforced by bullish technical indicators on the daily chart, which are still far from being in the overbought zone.
Hence, some follow-through strength towards testing a downward-sloping trend-line hurdle, currently around the 1.3675-80 region, remains a distinct possibility. The mentioned barrier extends from July 2021 swing high, which if cleared would be seen as a fresh trigger for bulls and pave the way for additional gains.
The GBP/USD pair might then climb beyond the 1.3700 mark, towards testing the next relevant resistance near the 1.3735 region. The momentum could further get extended and allow the pair to aim back to reclaim the 1.3800 round-figure mark for the first time since October.
On the flip side, any further decline towards the 1.3600 mark could still be seen as a buying opportunity and remain limited near the 61.8% Fibo. resistance breakpoint, around the 1.3575 region. This is closely followed by the 100-day SMA, around mid-1.3500s, which should now act as a pivotal point for traders.
A convincing break below might prompt some technical selling and drag the pair further towards the 50% Fibo. level, around the 1.3500 psychological mark. Some follow-through selling could pave the way for a slide towards the 1.3460-55 region en-route the 1.3430 area and the 38.2% Fibo. level/50-day SMA confluence near the 1.3400 mark.
GBP/USD daily chart
-637775783339544726.png)
Technical levels to watch
Economist Enrico Tanuwidjaja at UOB Group comments on the Consumer Confidence figures in Indonesia.
Key Takeaways
“Indonesia’s Consumer Confidence decreased slightly in December 2021 to 118.3, declining by 0.2 point from November’s 2021 highest record at 118.5. The slight decline in Indonesia’s Consumer Confidence is due to the emergence of COVID-19 Omicron cases that affected the current economic condition.”
“The Current Economic Condition Index that reached its highest to 99.9 in December 2021 as compared to 91.8 in October 2021. The increase is supported by the recovery in the economy and people’s income in line with the acceleration of COVID-19 vaccination program and the continuation of the implementation of mobility restriction in several areas in Indonesia.”
“The Economic Condition Expectation Index is expected to increase in the future despite the emergence of Omicron cases in line with the recovery in several economic sectors. Our view is that we are optimistic that the Consumer Confidence Index will continue to strengthen supported by the current economic condition such as the acceleration of Covid-19 vaccination program as well as the continuation of mobility restriction (PPKM) imposed by the government and the implementation of health procedures in public places to curb the spread of the COVID-19 virus.”
- USD/INR stages an impressive bounce from end-September troughs.
- Renewed US dollar demand and pre-inflation profit-booking help the pair.
- USD/INR needs a sustained move above 74.00 to firm up the recovery.
USD/INR is making an impressive recovery so far this Wednesday, looking to snap a five-day downtrend, with all eyes on the US inflation figures.
The oversold conditions on the chart combined with a broad US dollar rebound have offered some relief to bulls, although the US inflation data is eagerly awaited, as it will likely set the tone for markets in the coming weeks.
Meanwhile, the persistent surge in oil price seems to finally affect the mood around the rupee traders, collaborating with the upturn in the spot. WTI jumped nearly 4% to recapture $81 mark on Tuesday, as investors remained upbeat on the economic outlook, despite the Omicron covid variant-led impact.
At the time of writing, the spot is trading close to 74.00, having refreshed four-month lows at 73.73 earlier this morning.
USD/INR: Technical outlook
The recent declines through critical daily support levels bolstered the bearish sentiment around USD/INR.
Bulls, however, managed to defend the demand area near the September 28 lows of 73.74, triggering a decent recovery over the last hours.
For the recovery to extend, the price needs to sustain above the 74.00 level on a daily closing basis.
The next relevant resistance appears at 74.13, which was the previous rising trendline support.
Further up, 200-Daily Moving Average (DMA) at 74.29 will challenge the bullish commitments.
The 14-day Relative Strength Index (RSI) has bounced off the oversold region, backing the rebound in the price.
On the other hand, selling resurgence could see a retest of the crucial support around 73.73, below which the 73.50 psychological level will be put at risk.
USD/INR: Daily chart
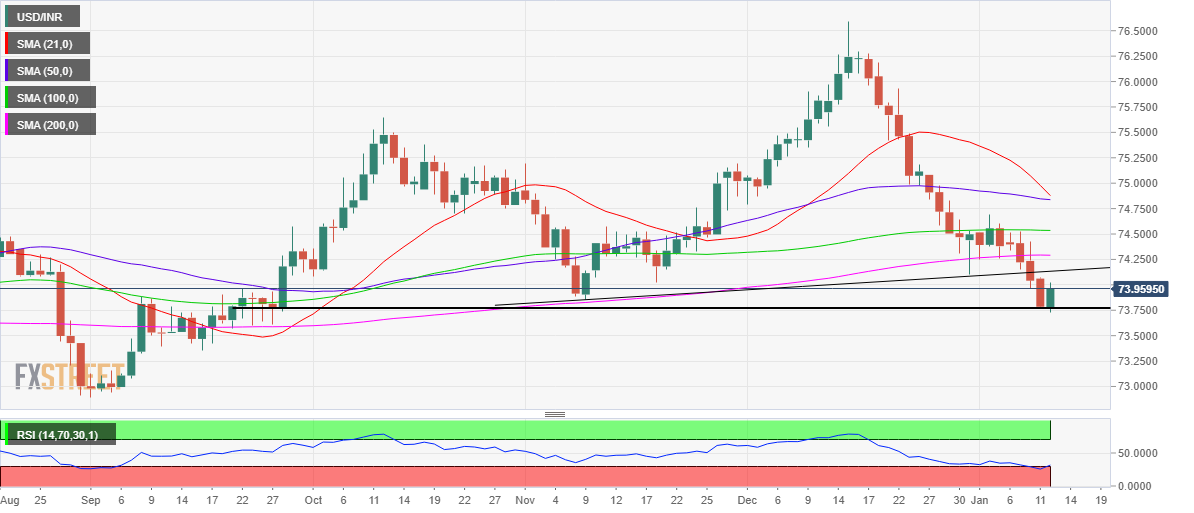
USD/INR: Additional levels
- EUR/USD adds to Tuesday’s advance near 1.1380.
- The greenback remains depressed near recent lows.
- Markets’ attention will be on the US inflation figures.
The optimism around the European currency remains well and sound and now lifts EUR/USD to fresh weekly highs in the boundaries of 1.1380 on Wednesday.
EUR/USD targets the YTD highs near 1.1390
EUR/USD advances for the second session in a row on Wednesday, always on the back of the subdued sentiment surrounding the greenback, which has been particularly exacerbated following Chairman Powell’s testimony before the Senate on Tuesday.
The sharp retracement in the buck lent much-needed oxygen to the risk complex during the past session, sponsoring the move higher in spot to shouting distance from the so far YTD peaks near 1.1390 (January 3).
In the meantime, yields of the key US 10y benchmark note appear side-lined below recent tops around 1.80%, while the German counterpart also looks range bound around -0.035%.
Later in the domestic calendar, Industrial Production in Euroland will be the sole release, while the inflation figures for the month of December will grab all the attention across the Atlantic later in the session.
What to look for around EUR
EUR/USD flirts with 2022 highs around 1.1380 amidst the renewed downside pressure hurting the US dollar. In the meantime, the pair’s price action continues to track the performance of the greenback as well as the policy divergence between the ECB vs. the Federal Reserve and the response to the persistent elevated inflation on both sides of the ocean. On another front, the unabated progress of the coronavirus pandemic remains as the exclusive factor to look at when it comes to the economic growth prospects and investors’ morale.
Key events in the euro area this week: EMU Industrial Production (Wednesday) - Germany Full Year GDP Growth 2021, ECB C.Lagarde (Friday).
Eminent issues on the back boiler: Asymmetric economic recovery post-pandemic in the euro area. ECB stance/potential reaction to the persistent elevated inflation in the region. ECB tapering speculation/rate path. Italy elects President of the Republic in late January. Presidential elections in France in April.
EUR/USD levels to watch
So far, spot is gaining 0.01% at 1.1367 and faces the next up barrier at 1.1378 (weekly high Jan.12) seconded by 1.1386 (monthly high November 30) and finally 1.1464 (weekly high Nov.15). On the other hand, a break below 1.1272 (weekly low Jan.4) would target 1.1221 (weekly low Dec.15) en route to 1.1186 (2021 low Nov.24).
- USD/TRY squeezes its range, as sellers continue to lurk just below 14.00.
- The lira remains supported by Turkey’s measures while the USD rebounds ahead of US inflation.
- Upside breakout from the current range appears likely amid bullish daily RSI.
USD/TRY is trading listlessly for the fourth straight day on Wednesday in the lead-up to the US inflation showdown.
Not surprising, markets are trading choppy, with a relatively better mood that is capping the US dollar’s rebound from Fed Chair Jerome Powell-led blow. Powel sounded more cautious and less hawkish than anticipated at its confirmation hearing on Tuesday, as he put off the balance sheet reduction plans only to ‘later this year’.
The pair is slightly benefiting from the renewed uptick in the greenback but traders continue to show reluctance in placing any directional bets amid ongoing efforts by Turkey’s government to protect the lira and contain inflationary pressures.
The Official Gazette announced Tuesday that they would include corporate foreign currency and gold deposit accounts converted to lira in a scheme that protects local currency savings against exchange rate volatility, per Reuters.
USD/TRY: Technical outlook
Looking at USD/TRY’s technical chart, the pair is witnessing absolutely bare minimum volatility, as the price range gets squeezed just under the 14.00 level.
Against this backdrop, with the fourth Doji candlestick in the making on the daily chart, it appears to be an uphill battle for the bulls to yield a decisive breakthrough.
The 14-day Relative Strength Index (RSI), however, holding comfortably above the midline, offers support to the optimists.
A big upside breakout could be in the offing on a sustained move above the 14.00 threshold, putting the December 21 high of 14.14 in the spotlight once again.
On the downside, the previous resistance now support of the 21-Daily Moving Average (DMA) at 13.30 remains a strong barrier for the bears.
A sharp sell-off towards the January 3 low of 12.75 cannot be ruled if the latter is breached.
USD/TRY: Daily chart
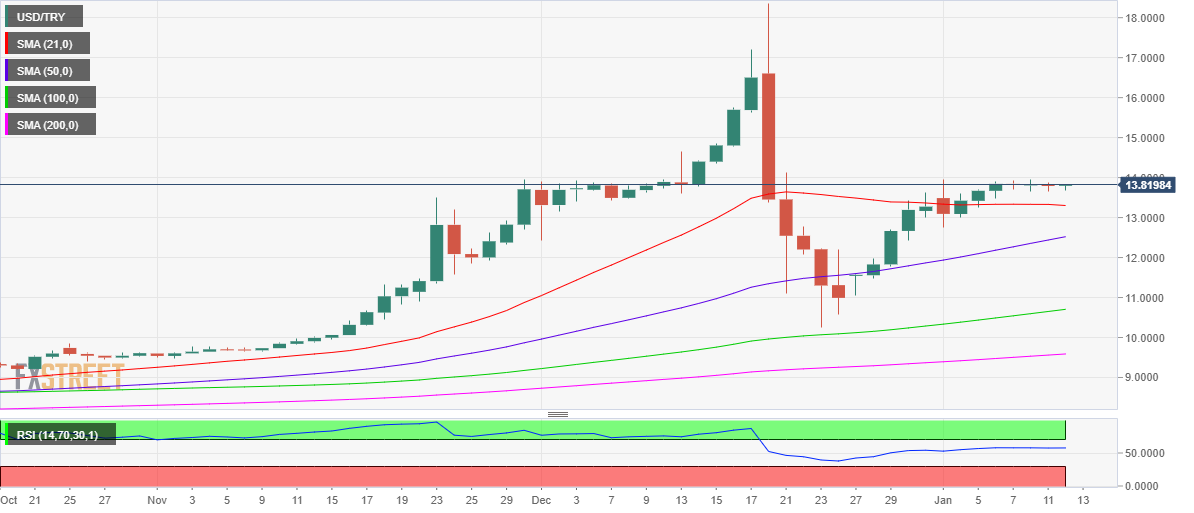
- Gold witnessed some selling on Wednesday and eroded a part of the overnight gains.
- An uptick in the US bond yields revived the USD demand and weighed on the metal.
- The downside seems limited as investors await the latest US consumer inflation print.
Gold edged lower on Wednesday and snapped three successive days of the winning streak, eroding a part of the previous day's strong gains to a four-day high. The XAU/USD remained on the defensive through the early part of the European session and was last seen hovering near the daily low, around the $1,815 region. The upbeat market mood – as depicted by a generally positive tone around the equity markets – was seen as a key factor that acted as a tailwind for the safe-haven precious metal. Apart from this, the emergence of some US dollar buying exerted some pressure on the dollar-denominated commodity.
As investors looked past Fed Chair Jerome Powell's less hawkish comments on Tuesday, the prospects for an eventual Fed lift-off in March extended some support to the greenback. Apart from this, an uptick in the US Treasury bond yields further underpinned the buck and weighed on the non-yielding gold. It is worth recalling that Powell, during his renomination hearing before the Senate, said that it could take several months to decide on running down the central bank's balance sheet. This eased fears about a sudden withdrawal of monetary support, which dragged the USD to its weakest level since November.
The downside, however, remains cushioned as investors seemed reluctant to place aggressive bets ahead of Wednesday's release of the latest US consumer inflation figures. Gold, which is considered a hedge against higher inflation, could benefit from hotter-than-expected US CPI print. Conversely, a softer reading would be enough to keep the USD bulls on the defensive and provide a goodish lift to the commodity. The fundamental backdrop supports prospects for a further near-term appreciating move for the XAU/USD, though bulls preferred to wait on the sidelines ahead of the key data risk.
Technical outlook
From a technical perspective, the overnight convincing break through the $1,810-12 horizontal zone adds credence to the positive outlook. Hence, any further pullback is more likely to attract fresh buying and remain limited near the $1,800 mark. Failure to defend the mentioned handle might prompt some technical selling and accelerate the fall towards the $1,790 region. This is closely followed by support marked by an upward sloping trend-line extending from August 2021 swing low, which if broken decisively would be seen as a fresh trigger for bearish traders.
On the upside, bulls are likely to aim back to test a static resistance near the $1,830-32 region. A sustained strength beyond would set the stage for a further near-term appreciating move and push gold prices towards the next relevant hurdle near the $1,848-50 region. The momentum could further get extended towards the $1,869-70 area en-route the $1,877 zone, or a multi-month high touched in mid-November.
Gold daily chart
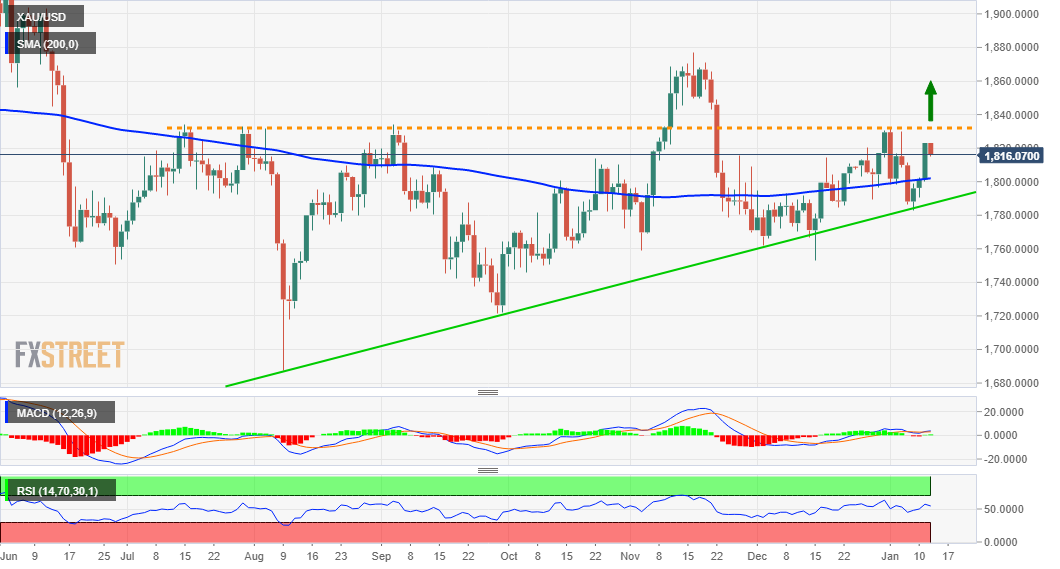
Levels to watch
UOB Group’s FX Strategists now expect USD/CNH to move into the 6.3600-6.3900 range in the next weeks.
Key Quotes
24-hour view: “Yesterday, we expected USD to ‘continue to trade sideways within a range of 6.3750/6.3880’. Our view for sideway-trading was not wrong even though USD traded within a narrower range than expected (6.3763/6.3842). The underlying tone appears to have weakened and USD is likely to edge lower from here. That said, any weakness is expected to encounter strong support at 6.3680 (there is another support at 6.3730). Resistance is at 6.3830 followed by 6.3860.”
Next 1-3 weeks: “We highlighted last Friday (07 Jan, spot at 6.3900) that ‘upward momentum has improved slightly’ and we see room for USD to ‘edge higher to 6.4100’. However, USD has not been able to make any headway on the upside. Upward momentum has fizzled out and USD is likely to trade between 6.3600 and 6.3900 for now.”
- DXY looks depressed around the mid-95.00s midweek.
- US 10y yields remain capped by the 1.80% area.
- Inflation figures tracked by the CPI next of note in the docket.
The greenback, in terms of the US Dollar Index (DXY), struggles for direction in the lower end of the current range near 95.50.
US Dollar Index now looks to CPI
Following the Powell-led sharp selloff on Tuesday, the index now attempts to regain some composure and put some distance from the area of recent lows.
Indeed, it is worth recalling that the buck intensified the downside on Tuesday after Chief J.Powell ruled out any immediate action to reduce the balance sheet at his testimony before the Senate Banking Committee, adding that the Fed might take between two and four meetings to make such a decision. Powell also suggested the existence of risks that inflation could get entrenched and stressed that supply chain disruptions are behind the inflation pressures.
While the dollar accelerated the losses in the wake of Powell’s testimony, US yields kept the steady performance near recent highs, showing some lack of conviction to extend the move further north for the time being.
The publication of December inflation figures gauged by the CPI will be the salient event later in the NA session. Previously, MBA will release weekly figures of Mortgage Applications and Minneapolis Fed N.Kashkari (2023 voter, dovish) is due to speak.
What to look for around USD
The index dropped and recorded new 2022 lows near 95.50 following Powell’s testimony on Tuesday, where it is now looking to consolidate ahead of the release of the December CPI. In the meantime, the dollar seems somewhat decoupled from the recent strong rebound in US yields in contrast with the steady price action in the dollar in past sessions. In the meantime, the constructive outlook for the buck is seen underpinned by the Fed’s intentions to start the hiking cycle earlier than anticipated amidst persevering elevated inflation, supportive Fedspeak, higher yields and the solid performance of the US economy.
Key events in the US this week: December CPI (Wednesday) - Initial Claims, FOMC L.Brainard Testimony, Producer Prices (Thursday) - Retail Sales, Industrial Production, Flash Consumer Sentiment, Business Inventories (Friday).
Eminent issues on the back boiler: Start of the Fed’s tightening cycle. US-China trade conflict under the Biden’s administration. Debt ceiling issue. Potential geopolitical effervescence vs. Russia and China.
US Dollar Index relevant levels
Now, the index is gaining 0.05% at 95.63 and a break above 96.46 (weekly top Jan.4) would open the door to 96.90 (weekly high Dec.15) and finally 96.93 (2021 high Nov.24). On the flip side, the next down barrier emerges at 95.53 (2022 low Jan.12) seconded by 95.51 (weekly low Nov.30 2021) and then 94.96 (low Nov.15 2021).
FX option expiries for January 12 NY cut at 10:00 Eastern Time, via DTCC, can be found below.
- EUR/USD: EUR amounts
- 1.1300 2.2b
- 1.1400 929m
- 1.1425 836m
- GBP/USD: GBP amounts
- 1.3595-00 950m
- USD/JPY: USD amounts
- 113.50 1.1b
- 115.50 583m
- 116.00 830m
- AUD/USD: AUD amounts
- 0.7180 414m
- USD/CAD: USD amounts
- 1.2690 1.1b
- 1.2760 980m
- 1.2790 1.8b
- 1.2840 860m
- NZD/USD: NZD amounts
- 0.7020 627m
- 0.7050 674m
- EUR/GBP: EUR amounts
- 0.8495 900m
- A combination of factors dragged USD/CAD to a two-month low on Wednesday.
- An uptick in the US bond yields revived the USD demand and acted as a tailwind.
- Bullish oil prices underpinned the loonie and capped gains ahead of the US CPI.
The USD/CAD pair remained on the defensive through the early European session and was last seen hovering near a two-month low, just above mid-1.2500s.
The US dollar attracted some buying amid an uptick in the US Treasury bond yields, which, in turn, was seen as a key factor that assisted the USD/CAD pair to find some support near the 1.25454 area. That said, a generally positive tone around the equity markets acted as a headwind for the safe-haven greenback and kept a lid on any meaningful recovery for the major.
Apart from this, Fed Chair Jerome Powell's less hawkish comments on Tuesday held back the USD bulls from placing aggressive bets. During his renomination hearing before the Senate, Powell said that it could take several months to decide on running down the central bank's balance sheet. This ease fears about a sudden withdrawal of monetary support and boosted investors' confidence.
On the other hand, bullish crude oil prices continued underpinning the commodity-linked loonie and further contributed to cap the upside for the USD/CAD pair. Investors also seemed reluctant and preferred to wait on the sidelines ahead of Wednesday's release of the latest US consumer inflation figures, due later during the early North American session.
Technical levels to watch
“We are very near to the peak in inflation,” European Central Bank (ECB) policymaker Francois Villeroy de Galhau said in an interview with LCI TV on Wednesday.
Additional quotes
“ECB will do what is necessary to achieve 2% inflation.”
“French economy is overall resilient despite Omicron.”
Market reaction
EUJR/USD is trading near-daily lows of 1.1355, knocked down by the resurgent US dollar demand.
- NZD/USD was seen oscillating in a narrow trading band near the weekly high on Wednesday.
- A positive risk tone extended support to the perceived riskier kiwi amid subdued USD demand.
- Investors now look forward to the US consumer inflation figures for a fresh directional impetus.
The NZD/USD pair lacked any firm directional bias and remained confined in a narrow trading band near the weekly high, just below the 0.6800 mark through the early European session.
The pair, so far, has struggled to capitalize on the previous day's positive move of over 50 pips from 0.6740-35 support zone, though a combination of factors continued acting as a tailwind. As investors looked past softer Chinese inflation figures, a generally positive tone around the equity markets extended some support to the perceived riskier kiwi. Apart from this, modest US dollar weakness also contributed to limiting the downside for the NZD/USD pair.
In fact, the USD Index languished near a two-month low amid a further decline slide in the US Treasury bond yields, aggravated by Fed Chair Jerome Powell's less hawkish comments on Tuesday. During his renomination hearing before the Senate, Powell said that it could take several months to decide on running down the central bank's balance sheet. This, in turn, helped ease fears about a sudden withdrawal of monetary support and boosted investors' confidence.
That said, the prospects for an eventual Fed lift-off in March 2022 held back traders from placing aggressive bearish bets around the greenback and capped gains for the NZD/USD pair. Investors also seemed reluctant and preferred to move on the sidelines ahead of Wednesday's release of the latest US consumer inflation figures. The data, due for release later during the early North American session, will influence the USD and provide a fresh impetus to the NZD/USD pair.
Even from a technical perspective, the recent two-way price moves witnessed over the past one week or so constitutes the formation of a rectangle on short-term charts. This points to indecision over the NZD/USD pair's near-term trajectory and further warrants some caution. Hence, it will be prudent to wait for a strong follow-through buying before confirming that the pair has bottomed out and positioning for any meaningful recovery move in the near term.
Technical levels to watch
USD/JPY is forecast to trade between 114.55 and 115.90 in the next weeks, suggested FX Strategists at UOB Group.
Key Quotes
24-hour view: “Our expectations for USD to ‘dip below 115.00’ yesterday did not materialize as it traded between 115.11 and 115.67 before closing largely unchanged at 115.28 (+0.07%). The underlying tone still appears to be on the soft side and we continue to see chance for USD to dip below 115.00. That said, a sustained decline below this level is unlikely. Resistance is at 115.45 followed by 115.65.”
Next 1-3 weeks: “There is no change in our view from yesterday (11 Jan, spot at 115.20). As highlighted, the recent positive phase in USD has come to an end. From here, USD is likely to trade between 114.55 and 115.90.”
Considering flash data from CME Group, open interest in natural gas futures prices rose for the third session in a row on Tuesday, this time by around 6.1K contracts. Volume, instead, reversed two consecutive daily builds and went down by around 64.3K contracts.
Natural Gas looks supported by the 200-day SMA
Tuesday’s third advance in a row in prices of natural gas was accompanied by an uptick in open interest, indicative that prices could edge higher in the very near term. While above the key 200-day SMA, today at $4.037, the outlook for the commodity appears constructive.
In opinion of FX Strategists at UOB Group, AUD/USD is now expected to navigate within the 0.7150-0.7275 range in the next weeks.
Key Quotes
24-hour view: “We expected AUD to ‘trade between 0.7150 and 0.7205’ yesterday. While AUD subsequently traded close to our expected range (0.7155/0.7213), it settled on a firm footing at 0.7211 (+0.51%). Upward momentum is beginning to build even though any further advance in AUD is expected to face strong resistance at 0.7235 (next resistance at 0.7275 is not expected to come under threat). On the downside, a breach of 0.7170 (minor support is at 0.7190) would indicate that the build-up in momentum has fizzled out.”
Next 1-3 weeks: “Last Friday, (07 Jan, spot at 0.7165) we highlighted that risk is tilted to the downside but any weakness in AUD is expected to encounter solid support at 0.7110. Since then, AUD has not been able to make any headway on the downside. While our ‘strong resistance’ level at 0.7235 is not breached, the firm daily closing of 0.7211 (+0.51%) suggests that the downside risk has more or less dissipated and AUD could trade between 0.7150 and 0.7275 for now.”
CME Group’s advanced readings for crude oil futures markets noted traders added nearly 37K contracts to their open interest positions on Tuesday, the largest build so far this year. Volume followed suit and rose by around 276.8K contracts after two daily drops in a row.
WTI now targets the $85.00 mark
Prices of the barrel of the WTI rose sharply on Tuesday after two straight daily retracements. The moderate recovery came in tandem with increasing open interest and volume, which allows for the continuation of the upside in the very near term. That said, the next target comes at the November’s high at $84.95 (November 10).
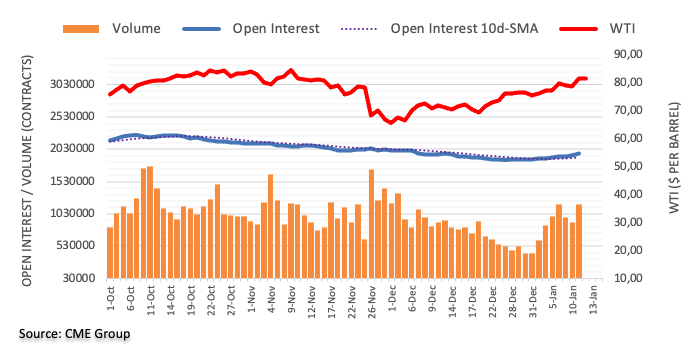
Analysts at Danske Bank note that softer US inflation data is unlikely to alter the US Federal Reserve’s (Fed) outlook on rate hikes and quantitative tightening (QT).
Key quotes
“The main event today is the US inflation data for December, where the headline inflation is expected to reach 7% y/y and core-inflation 5.4% y/y.”
“However, the core-inflation is expected to decline from 0.8% m/m to 0.4% m/m.”
“Still, a lower m/m number should not change much on the pricing of the Federal Reserve as they need more than one number to change their view on QT and rate hikes.”
- WTI consolidates the biggest daily gains in five weeks around November tops.
- Clear break of 11-week-old trend line keep buyers on the table.
- 100-DMA adds to the downside filters, bulls eye 2021 peak.
WTI crude oil prices retreat from a multi-day high, down 0.25% intraday to $80.70 heading into Wednesday’s European session. In doing so, the black gold pares the biggest daily jump since early December.
However, the pullback moves remain elusive as the quote keeps the previous day’s upside break of a descending resistance line from October 25, now support around $78.60.
Even if the quote declines below $78.60, the 100-SMA level of $75.25 and 23.6% Fibonacci retracement of November 2020 to October 2021 upside, near $72.80 will challenge the WTI bears before directing them to the 10-month-long support line near $66.25.
Meanwhile, the year 2021 top $85.00 surrounding is likely on the WTI bulls radar, a break of which will direct the latest run-up towards the $90.00 psychological magnet.
In a case where WTI buyers remain dominant past $90.00, lows marked during January 2014 around $91.30 may test the advances.
WTI: Daily chart
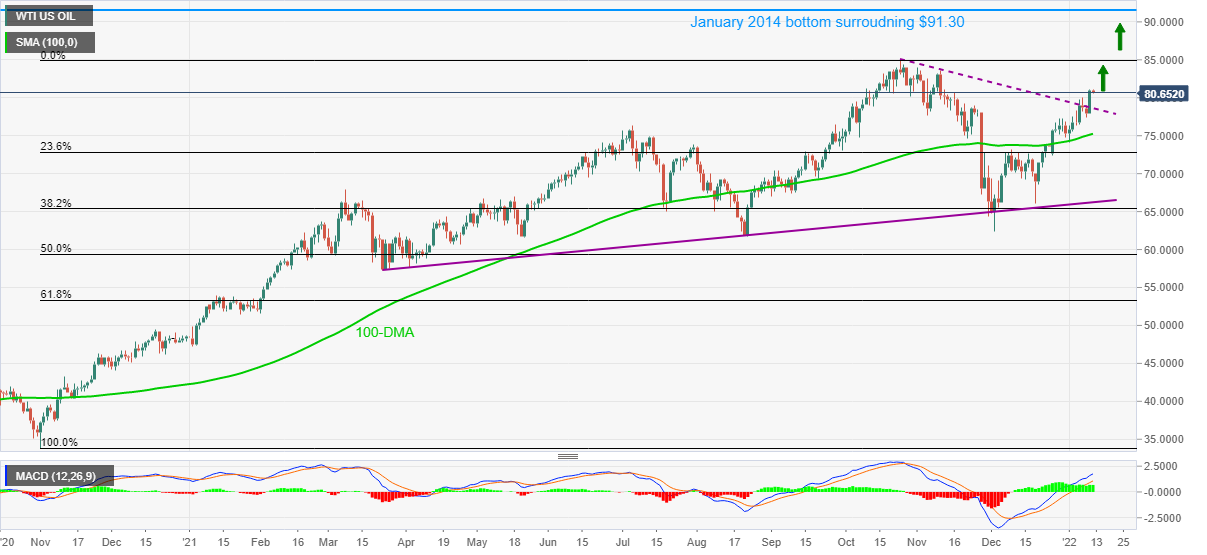
Trend: Further upside expected
In light of the recent price action, Cable could revisit the 1.3660 level ahead of 1.3700 in the short-term horizon.
Key Quotes
24-hour view: “The strong rise to 1.3637 yesterday came as a surprise (we were expecting GBP to trade between 1.3540 and 1.3600). Solid upward momentum suggests GBP could continue to rise towards 1.3660. The next resistance at 1.3700 is likely out of reach for today. Support is at 1.3620 followed by 1.3590.”
Next 1-3 weeks: “We have expected a stronger GBP since late last week. In our latest narrative from yesterday (11 Jan, spot at 1.3580), we highlighted that while upward momentum has been dented somewhat, there is still chance for GBP to advance to 1.3630. Our view was not wrong as GBP soared to 1.3637 before closing on a firm note in NY (1.3634, +0.41%). The price actions suggest further GBP strength is likely. The next resistance is at 1.3660 followed by 1.3700. The upward pressure is intact as long as GBP does not move below 1.3560 (‘strong support’ level was at 1.3525 yesterday).”
- USD/JPY was seen oscillating in a range through the early part of trading on Wednesday.
- A positive risk tone undermined the safe-haven JPY and extended some support to the pair.
- Powell’s less hawkish comments weighed on the USD and capped gains ahead of the US CPI.
The USD/JPY pair seesawed between tepid gains/minor losses and remained confined in a narrow trading band below mid-115.00s heading into the European session.
A combination of diverging forces failed to provide any meaningful impetus to the USD/JPY pair and led to subdued/range-bound price action through the early part of the trading on Wednesday. A generally positive tone around the equity markets undermined the safe-haven Japanese yen and extended some support to the major. That said, the prevalent US dollar selling bias held back traders from placing fresh bullish bets.
Fed Chair Jerome Powell sounded less hawkish during his renomination hearing before the Senate on Tuesday and dragged the US Treasury bond yields lower. In fact, Powell said that it could take several months to decide on running down the central bank's balance sheet and eased fears about a sudden withdrawal of monetary support. This, in turn, was seen as a key factor that weighed on the buck and acted as a headwind for the USD/JPY pair.
Meanwhile, Powell didn't push back against market expectations for an eventual Fed lift-off in March 2022, which helped limit any deeper USD losses. Investors also seemed reluctant and preferred to wait on the sidelines ahead of Wednesday's release of the US consumer inflation figures, due later during the early North American session. This further warrants some caution before confirming the intraday direction for the USD/JPY pair.
Technical levels to watch
Open interest in gold futures markets rose by around 23.6K contracts on Tuesday, the largest single-day build since November 8, according to preliminary prints from CME Group. In the same line, volume went up by around 15.6K contracts, reversing the previous day’s drop.
Gold now targets the $1,830 region
Gold charted the third consecutive daily advance on Tuesday amidst a sharp increase in open interest and the resumption of the uptrend in volume. That said, there is scope for prices of the precious metal to advance to the $1,830 region in the near term.
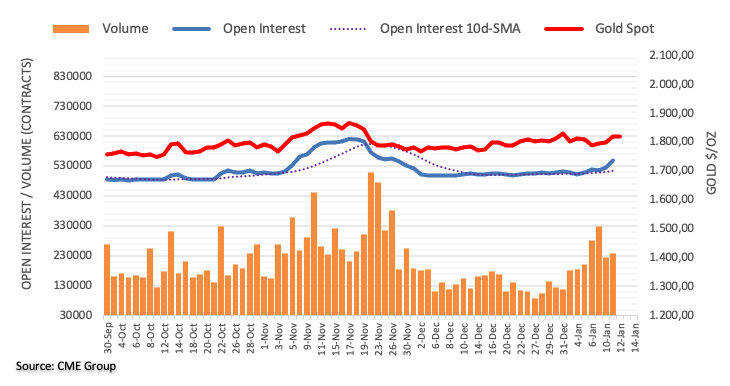
Here is what you need to know on Wednesday, January 12:
The greenback faced renewed selling pressure in the second half of the day on Tuesday as FOMC Chairman Jerome Powell adopted a cautious tone with regards to policy outlook. Following a 0.4% decline, the US Dollar Index seems to have steadied around mid-95s as investors await December Consumer Price Index (CPI) data from the US. November Industrial Production data will be featured in the European economic docket as well.
US Inflation Preview: Dizzying heights of 7% would cement a March hike, supercharge the dollar.
During his confirmation hearing before the Senate, Powell said that they need to focus more on the inflation goal than the maximum employment goal and reiterated that they expect price pressures to last well into 2022. On policy outlook, Powell said that the economy doesn't need a highly accommodative policy but he noted that they would need several meetings to come up with a plan on how they will reduce the balance sheet. “At some point perhaps later this year we will start to allow the balance sheet to run off, and that’s just the road to normalizing policy," Powell explained.
Powell's less-hawkish-than-expected comments triggered a rally in US stock markets and the S&P 500 gained nearly 1%. The benchmark 10-year US Treasury bond yield, which reached its highest level above 1.8% earlier in the week, closed in the negative territory on Tuesday and was last seen posting small daily losses at 1.73%. Nevertheless, the CME Group FedWatch Tool shows that there is only a 25% chance of the Fed leaving its policy rate unchanged in March. In the meantime, US stocks futures indexes are up 0.15% and 0.25%, suggesting that the market mood could remain upbeat in the American session.
EUR/USD climbed toward the upper limit of its six-week-old range near 1.1380 and stays relatively quiet around that level early Wednesday.
GBP/USD extended its rally and reached its strongest level in more than two months above 1.3640 in the early European session on Wednesday.
USD/JPY managed to shake off the bearish pressure despite falling US Treasury bond yields on Wednesday as the improving risk sentiment made it difficult for the JPY to find demand. The pair was last seen posting small daily gains near 115.30.
Gold capitalized on declining US T-bond yields and gained more than 1% on a daily basis on Wednesday. XAU/USD seems to have gone into a consolidation phase around $1,820 and the pair is likely to remain sensitive to fluctuations in yields.
The risk-positive market environment helped cryptocurrencies find demand and Bitcoin gained more than 2% before turning quiet around $43,000 on Wednesday. Similarly, Ethereum rose nearly 5% and holds its ground above $3,200 so far.
“If omicron infections increase, that could hit consumption in the region, may hit output via supply constraints in Asia,” Bank of Japan’s (BOJ) Osaka Branch Manager said after the central bank raised the economic view for all of Japan’s nine regions.
Additional comments
“More firms in region embarking on price hikes as rising raw material costs squeeze profits.”
“Domestic consumer inflation remains subdued so rising raw materials costs have not inflicted severe damage on consumption yet.”
“Wage hikes may broaden among firms that saw profits rise, though many in region prefer to compensate workers with bonuses rather than rise in regular pay.”
Related reads
- BOJ raises assessment for all of Japan’s nine regions
- USD/JPY consolidates in a range below mid-115.00s, focus remains on US CPI
- Asian equities track Wall Street gains but covid fears challenge bulls in Australia, Tokyo.
- China’s CPI, PPI both eased in December, Australia Job Vacancies rallied during three months to November.
- World Bank cuts global growth forecasts amid worsening virus conditions.
- Fed’s Powell underpinned risk-on mood with economic optimism, balance sheet comments.
Asia shares stay mostly higher amid the market’s optimism that the Fed will take time before starting to adjust record balance sheet debt, as favored by Chairman Jerome Powell in his testimony the previous day.
Also positive for the markets were downbeat inflation data from China and firmer second-tier employment figures from Australia. It should be noted, however, that anxiety ahead of the US Consumer Price Index (CPI) for December joins coronavirus-linked updates to challenge the investors.
That said, MSCI’s index of Asia-Pacific shares ex-Japan rise 1.43% intraday but Japan’s Nikkei 225 drops by around 1.0% heading into Wednesday’s European session.
Worsening covid conditions in Australia and Japan could be linked to the losses of ASX 200 and Nikkei 225 respectively. In doing so, traders in Tokyo ignore the Bank of Japan’s (BOJ) upward revision to the economic assessment to nine regions as well as an upward revision to Japan’s 2022 GDP growth by the World Bank, up by 0.3% to 2.9%.
Elsewhere, China’s headline Consumer Price Index (CPI) eased below 1.8% forecast and 2.3% prior to 1.5% YoY while the MoM readings also dropped to -0.3% compared to +0.2% expected and +0.4% previous readouts. Additionally, the factory-gate inflation, namely the Producer Price Index (PPI) also dropped below 11.1% expected and 12.9% prior, to 10.3% YoY for December.
Furthermore, Australia's Job Vacancies for three months to November jumped past -9.8% prior to 18.5% QoQ during early Asia.
That said, markets in China, Hong Kong, Indonesia and South Korea portray a risk-on mood amid downbeat US Treasury yields. On the same line are India’s BSE Sensex and New Zealand’s NZX 50, up 0.80% and 0.20% in that order by the press time.
On Tuesday, Wall Street cheered Fed Chair Jerome Powell’s measured Testimony that showed readiness to hike interest rates but remained cautious over balance sheet normalization. Fed’s Powell also expected that the supply crunch will ease somewhat and the economic impact of the Omicron variant will be short-lived.
Moving on, global markets are likely to remain sidelined ahead of the key US inflation figures for December, expected 7.0% YoY versus 6.8% prior, to determine near-term moves.
Read: US T-bond yields, S&P 500 Futures portray pre-Inflation anxiety
FX Strategists at UOB Group now see EUR/USD attempting to retest the vicinity of the 1.1400 region in the next weeks.
Key Quotes
24-hour view: “We highlighted yesterday that the outlook is mixed and we expected EUR to ‘trade in a choppy manner between 1.1295 and 1.1365’. EUR subsequently dropped to 1.1311 but the decline was short-lived as it soared quickly to a high of 1.1374 during NY session. The rapid advance has gathered momentum but while EUR could move above 1.1395, it is left to be seen if it can maintain a foothold above this major resistance level (next resistance is at 1.1415). The current upward pressure is intact as long as EUR does not move below 1.1335 (minor support is at 1.1350).”
Next 1-3 weeks: “We have held the same view since last Tuesday (04 Jan, spot at 1.1305) where the outlook is unclear and we expected EUR to trade within a range of 1.1240/1.1395. After trading mostly sideways for more than a week, shorter-term upward momentum is beginning to build and EUR appears poised to move above the top of the expected range at 1.1395. A clear break of this level could lead to an advance towards 1.1440. The prospect for EUR advance further would continue to rise as long as it does not move below 1.1315 (‘strong support’ level) within these couple of days.”
Economists at Standard Chartered predict an encouraging growth trajectory for Indonesia, as the economic indicators are seen improving in 2022.
Key quotes
“We expect GDP growth to accelerate to 4.8% in 2022 on a stronger domestic demand recovery.”
“We expect investment to rebound on resumption of corporate capex cycle, smelters, and infrastructure projects.”
“We expect inflation to peak at around 3.5% in Q3, before easing towards year-end.”
“We forecast the first BI rate hike in Q3, with a risk of an earlier hike should pressure on IDR increases.”
Analysts at the Australia and New Zealand Banking Group (ANZ) cite further challenges for the Aussie labour market despite witnessing a strong Australia Job Vacancies for three months to November, published during Wednesday’s Asian session.
Key quotes
Caution about being in public places and staff shortages are stifling household spending. ANZ-observed data show spending in early January resembled lockdown conditions, particularly in Sydney and Melbourne.
Currently, we expect the economic effects from Omicron will be temporary. Resilient consumer confidence in financial conditions points to a rapid recovery in spending once health risks ease.
Assuming this is correct, once cases fall to much lower numbers, we still expect labour underutilisation to fall in 2022, putting upward pressure on wage growth.
Data revisions suggest closed international borders have had a smaller effect on Australia’s labour supply than previously thought, adding to the argument that demand has been the key driver of the recovery.
But the record high job vacancy rate means that more Australian and overseas workers are needed in productive jobs to realise potential employment and economic growth.
There are some positive signs for wage growth, including more workers expecting to change jobs and higher inflation expectations, but Omicron could delay the acceleration.
While reported difficulty finding labour remains elevated, there is still significant room to reduce spare capacity in the form of underemployment across several industries.
Also read: AUD/USD: Bulls pause around previous support of 0.7220 on downbeat China inflation, US CPI eyed
- AUD/USD grinds higher around weekly top during four-day uptrend.
- Bullish MACD, sustained break of the key SMAs favor buyers, previous support from early December tests immediate upside.
- Weekly ascending trend line adds to the downside filters.
AUD/USD seesaws around 0.7215-20 after refreshing weekly top during the early Asian session on Wednesday. Even so, the Aussie pair stays on the bull’s radar as traders await US inflation data heading into the European session.
Successful trading beyond 50-SMA and 100-SMA joins bullish MACD signals to keep buyers hopeful.
However, the support-turned-resistance line from December, near 0.7220, challenges the quote’s immediate upside.
Should the AUD/USD prices cross the nearby resistance line, a weekly descending trend line near 0.7260 and the monthly high of 0.7278 can probe the further advances.
Meanwhile, pullback moves remain less worrisome until staying beyond the 50-SMA level surrounding 0.7220.
Following that, a pullback towards an upward sloping trend line from Friday, near 0.7160, will be in focus.
If at all the AUD/USD prices drop below 0.7160, the odds of witnessing the 0.7100 round figure on the chart can’t be ruled out.
AUD/USD: Four-hour chart
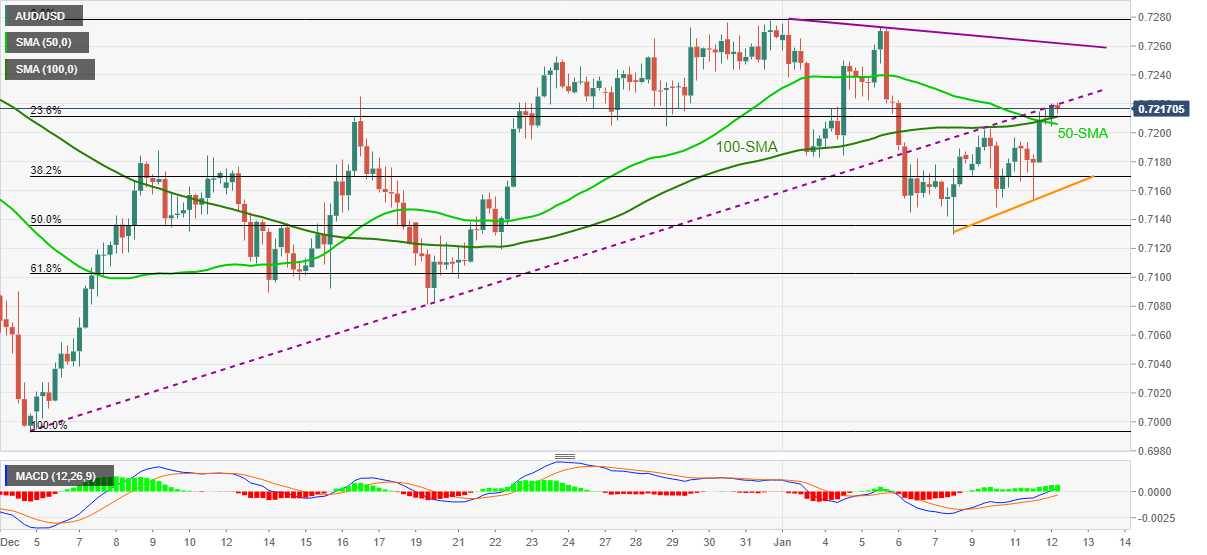
Trend: Further upside expected
- Gold price continues to remain at the mercy of the Treasury yields’ price action.
- Powell likely hesitates on balance sheet run-off ahead of key US inflation.
- Gold Price Forecast: Will US inflation boost XAU/USD further to $1,835?
Gold price holding higher ground, as Fed Chair Powell vowed to tame inflation and put off-balance sheet runoff to "perhaps later in the year". Nevertheless, the price action in the US dollar and the Treasury yields continue to influence gold’s valuations, with Wednesday’s US Consumer Price Index (CPI) eagerly waited for a decisive direction.
“Economists expect inflation to have hit 7% YoY in the final report for 2021. Political pressure around inflation makes headline prices more important than Core CPI at this point,” FXStreet’s Senior Analyst Yohay Elam explains.
Read: Gold 2022 Outlook: Correlation with US T-bond yields to drive yellow metal
Gold Price: Key levels to watch
The Technical Confluences Detector shows that the gold price is re-approaching the previous day’s high of $1,823, where the pivot point one-week R1 hangs around.
If that hurdle is scaled, then gold bulls will march higher towards the strong cap around $1,831, the convergence of the previous month’s and previous week’s highs.
The next significant barrier is seen at the pivot point one-day R2 at $1,839.
On the flip side, the immediate downside could be checked by the intersection of the Fibonacci 23.6% one-day and the previous low four-hour at $1,817.
A dense cluster of healthy support levels is stacked up around $1,814, making it a tough nut to crack for gold bears.
That demand area is the confluence of the Fibonacci 23.6% one-month, Fibonacci 61.8% one-week and Fibonacci 38.2% one-day.
Should the downside pressure intensify, robust cushion at $1,809 could come into play. At that point, the SMA10 one-day and Fibonacci 61.8% one-day converge.
The last line of defense for gold buyers is envisioned at the SMA5 one-day at $1,805.
Here is how it looks on the tool
About Technical Confluences Detector
The TCD (Technical Confluences Detector) is a tool to locate and point out those price levels where there is a congestion of indicators, moving averages, Fibonacci levels, Pivot Points, etc. If you are a short-term trader, you will find entry points for counter-trend strategies and hunt a few points at a time. If you are a medium-to-long-term trader, this tool will allow you to know in advance the price levels where a medium-to-long-term trend may stop and rest, where to unwind positions, or where to increase your position size.
- GBP/USD refreshes 10-week top during the two-day uptrend.
- Fears that UK Brexit Minister Truss has “personal” reasons to trigger Article 16 keep negotiators on toes before Thursday’s meeting.
- UK PM Johnson is under pressure amid holding booze party during early pandemic days.
- Fed’s Powell defends the bulls but US CPI may challenge the upside potential.
GBP/USD picks up bids to 1.3645, up 0.10% intraday while heading into Wednesday’s London open.
In doing so, the cable pair renews the two-month top amid broad US dollar weakness, as well as the market’s cautious optimism ahead of the key US Consumer Price Index (CPI) data for December.
The quote’s upside momentum largely takes clues from Fed Chair Jerome Powell’s testimony in front of the US Senate Banking Committee. Fed’s Powell showed readiness to inflate the benchmark rate but comments stating that the balance sheet runoff could happen "perhaps later in the year," seemed to have underpinned the US Dollar Index’s (DXY) 0.35% daily fall the previous day. On the same line was Powell’s expectations that the supply crunch will ease somewhat and the economic impact of the Omicron variant will be short-lived. That said, the DXY refreshed a two-month low earlier during today’s Asian session.
Powell’s comments not only weakened the DXY but also drowned US Treasury yields, which in turn favored the GBP/USD buyers afterward despite the recent negatives from Brexit and the coronavirus fronts.
The UK Express quotes leading British Commentator Henry Hill to mention that British Trade Minister, also the newly appointed Brexit Chief, has the "personal motivation" to force Boris Johnson's hand on Article 16 "whether he wants it or not." The reason cited is that Truss is a contender for the Conservative leadership.
Also on the negative side was the recently high UK covid cases and fears of a wild spread ahead. Furthermore, Tory dislike for UK PM Johnson’s garden party during the peak covid wave in 2021 also should have challenged the GBP/USD buyers, but it didn’t.
It’s worth noting that the firmer US inflation expectations, per the 10-year breakeven inflation rate per the St. Louis Federal Reserve (FRED) data, which jumped the most in two months the previous day, also adds to the upside filters for the Cable pair.
Against all odds, GBP/USD buyers keep the reins and wait for the US CPI data, expected 7.0% YoY versus 6.8% prior, for fresh impulse.
Read: US Inflation Preview: Dizzying heights of 7% would cement a March hike, supercharge the dollar
Technical analysis
Although nearly overbought RSI challenges GBP/USD buyers, a clear upside break of the seven-month-old resistance line, now support around 1.3595, hints at the pair’s further advances towards the 50% Fibonacci retracement (Fibo.) of June-December downside, near 1.3700.
In its quarterly survey on regional economies, the Bank of Japan (BOJ) raised the economic assessment for nine of Japan’s nine regions.
Key takeaways
It’s a sign of “confidence that a recent resurgence in coronavirus infections would not derail the country's fragile recovery.”
"All of the regions said their economies were picking up or showing signs of a pick-up as the hit to service consumption from the pandemic eases somewhat."
Market reaction
USD/JPY is stuck in a narrow range of around 115.35, up 0.06% on the day.
- USD/CAD takes offered to renew multi-day bottom, drops for the second consecutive day.
- Clear downside break of 100-DMA, bearish MACD signals favor sellers to aim for 200-DMA.
- 38.2% Fibonacci retracement guards immediate upside, ascending trend line from June adds to the downside filters.
USD/CAD stands on slippery grounds near 1.2553, down 0.20% intraday, heading into Wednesday’s European session.
In doing so, the loonie pair extends the previous day’s 100-DMA breakdown to drop to the fresh low since November 17.
Other than the clear downside break of the 100-DMA, bearish MACD signals also favor USD/CAD bears to aim for the 200-DMA support level of 1.2500.
However, 50% Fibonacci retracement (Fibo.) of June-December 2021 upside, around 1.2485, will precede an upward sloping support line from June, close to 1.2450, to challenge the Loonie pair’s further downside.
Alternatively, 38.2% Fibo. restricts the quote’s nearby advances close to the 1.2600 threshold, a break of which will redirect the USD/CAD prices towards the 100-DMA level of 1.2627.
It’s worth noting that the 23.6% Fibonacci retracement and a descending resistance line from December 20, respectively around 1.2740 and 1.2770, will challenge the USD/CAD bulls past the 100-DMA.
USD/CAD: Daily chart
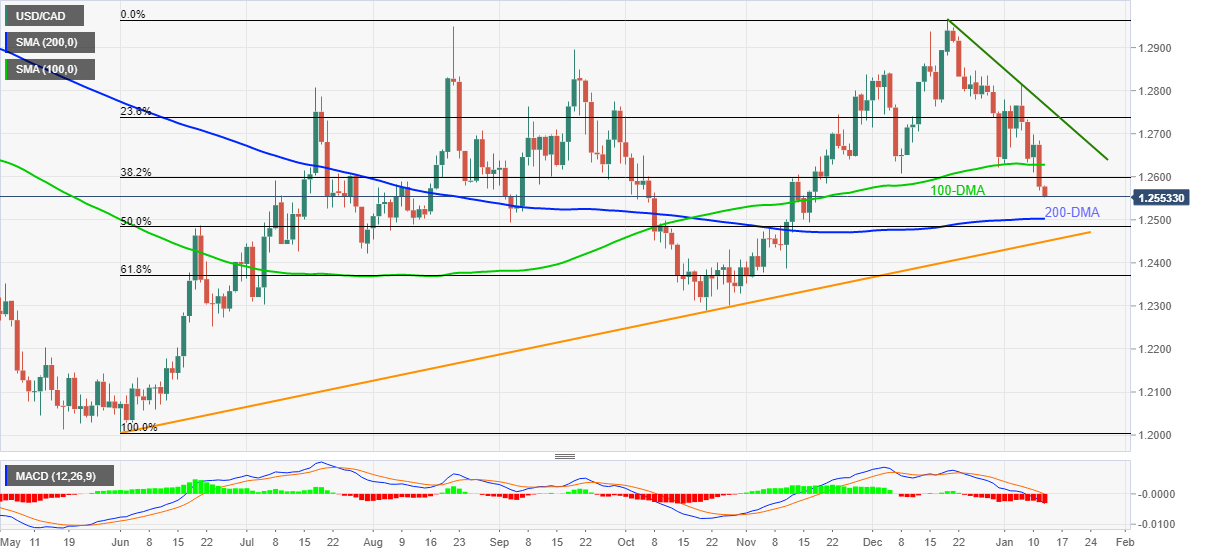
Trend: Further downside expected
- EUR/USD dribbles around weekly top, stays mildly bid.
- Fed’s Powell, ECB policymakers helped buyers the previous day.
- Virus woes, World Bank forecasts test immediate upside ahead of US CPI.
- Eurozone Industrial Production also decorates economic calendar.
EUR/USD grinds higher as traders brace for the key US inflation data during early Wednesday morning in Europe. That said, the major currency pair seesaws around the weekly top of 1.1375, up 0.08% on a day during the second consecutive positive day.
It’s worth observing that cautious sentiment ahead of the all-important US Consumer Price Index (CPI) probes EUR/USD bulls. Even so, downbeat US Treasury yields and the US dollar performance, backed by mixed comments from Fed Chair Jerome Powell and ECB policymakers, keep the pair buyers hopeful.
In addition to the market’s anxiety ahead of crucial data, fears of the coronavirus and its economic impacts also challenge the EUR/USD pair’s upside momentum during the sluggish day.
Fed’s Powell showed readiness to inflate the benchmark rate but comments stating that the balance sheet runoff could happen "perhaps later in the year," seemed to have underpinned the US Dollar Index’s (DXY) 0.35% daily fall the previous day. On the same line was Powell’s expectations that the supply crunch will ease somewhat and the economic impact of the Omicron variant will be short-lived. It’s worth noting that the DXY refreshed a two-month low earlier during today’s Asian session.
On the other hand, ECB President Christine Lagarde and a new member of the European Central Bank's (ECB) Governing Council and Bundesbank President Joachim Nagel favored the Euro bulls the previous day. While Lagarde tried convincing markets for the ability to take hawkish steps if needed, Nagel argued that the inflation surge in the euro area was not entirely due to temporary factors. However, ECB’s Chief Economist Phillip Lane said in an interview that inflation will fall this year, which in turn restricts EUR/USD upside.
Elsewhere, the World Bank (WB) cited coronavirus woes to cut the global GDP expectations for 2022 to 4.1% from 4.3% previous estimations. Also challenging EUR/USD bulls could be the firmer US inflation expectations, per the 10-year breakeven inflation rate per the St. Louis Federal Reserve (FRED) data, which jumped the most in two months the previous day.
Against this backdrop, the US Treasury yields remain sluggish after recent declines but the equities fail to extend Wall Street gains by the press time.
Although the US CPI for December, expected 7.0% YoY versus 6.8% prior, is expected to dominate EUR/USD moves, Eurozone Industrial Production for November, forecast +0.6% YoY versus 3.3% prior, can offer immediate direction to the pair.
Read: US Inflation Preview: Dizzying heights of 7% would cement a March hike, supercharge the dollar
Technical analysis
EUR/USD pair’s ability to stay beyond 50-DMA, not to forget bouncing off 21-DMA, gains support from the higher lows of the prices and RSI to keep buyers hopeful. However, double tops marked since mid-November around 1.1385 guard the quote’s immediate upside, a break of which will direct EUR/USD buyers towards a multi-day-old descending trend line resistance near 1.1400.
Meanwhile, pullback moves may initially be challenged by the 21-DMA and 50-DMA, close to 1.1335 and 1.1320 in that order, ahead of an ascending support line from December 15, near 1.1290.
- USD/INR stays pressured around multi-day bottom after five-day downtrend.
- India’s active covid cases jump to seven-month high, rising the most since late April.
- Washington announced public health emergency, Fed’s Powell drowned USD with concerns over balance sheet normalization.
- World Bank defends 2022 India GDP, revised up 2023 growth forecasts.
USD/INR remains depressed around the lowest level since September 27 during the early Indian trading session on Wednesday. That said, the quote dribbles around 73.75 by the press time, after renewing the multi-day low to 73.72.
The Indian rupee (INR) pair refreshed multi-day low early in Asia amid broad risk-on mood, as well as the US dollar weakness. However, cautious sentiment ahead of the all-important US Consumer Price Index (CPI) joins virus woes and mixed forecasts from the World Bank (WB) to test the pair bears.
India reports the biggest daily jump in active covid cases since April 23 to, unfortunately, poke the highest coronavirus case levels since June 14, at 955,319 the latest per the official figures. It’s worth observing that the daily infections eased with 407 fresh cases versus 428 noted the previous day.
Elsewhere, the WB cited coronavirus woes to cut the global GDP expectations for 2022 to 4.1% from 4.3% previous estimations. However, the Washington-based institute revised up Indian GDP forecast for the Financial Year (FY) 2023 to 8.7% versus 7.5% previous expectations while keeping the FY 2021-22 unchanged at 8.3%, same as expected in October.
It’s worth noting that Fed Chair Jerome Powell’s readiness to rate hike, per Testimony in front of the Senate Banking Committee, could please the USD bulls. The reason could be linked to the comments stating that the balance sheet runoff could happen "perhaps later in the year," as well as his expectations that the supply crunch will ease somewhat and the economic impact of the Omicron variant will be short-lived.
That said, the US Treasury yields remain sluggish after recent declines but the equities fail to extend Wall Street gains by the press time, which in turn probe USD/INR bears ahead of the key US data.
Moving on, Fed hawks will gain additional support from today’s US CPI if the figures match the 7.1% YoY forecast versus 6.8% prior. It should be observed that the US inflation expectations, as measured by the 10-year breakeven inflation rate per the St. Louis Federal Reserve (FRED) data, jumped the most in two months the previous day.
Read: US Inflation Preview: Dizzying heights of 7% would cement a March hike, supercharge the dollar
Technical analysis
A clear downside break of the 61.8% Fibonacci retracement of March-December 2021 downside, around 73.85, directs USD/INR towards an upward sloping trend line from May, near 73.68, a break of which will direct bears to mid-September 2021 low near 73.35.
Even if the quote rises past 73.85, the 200-SMA level of 74.30 acts as a tough nut to crack before recalling the USD/INR buyers.
- Silver consolidates early Asian session losses, pauses three-day uptrend of late.
- Looming bear cross probes buyers targeting $23.00 resistance confluence.
- Weekly support line joins 200-SMA to restrict immediate downside.
Silver (XAG/USD) picks up bids to reverse the early Asian losses around $22.75, down 0.12% intraday during Wednesday morning. In doing so, the bright metal prints the first daily loss in four days.
Even so, sustained trading beyond the 50, 100 and 200 SMAs join bullish MACD signals to keep buyers hopeful.
That said, a convergence of the seven-day-old descending trend line joins the 23.6% Fibonacci retracement of December 15-28 upside, near $23.00, to challenge the metal’s short-term upside.
Following that, a run-up to December’s peak of $23.45 can’t be ruled out. However, November 29 top surrounding $23.50 offers an additional upside filter to challenge the XAG/USD bulls.
It’s worth noting that the 50-SMA teases a bear cross with the 100-SMA and may drag the prices if confirmed.
In that case, a one-week-old support line and 200-SMA, around $22.60, will be an important support to watch.
Should silver sellers conquer the $22.60 support, the commodity’s downside to 61.8% Fibonacci retracement level of $22.20 and then to the monthly low of $21.952 can’t be ruled out.
Silver: Four-hour chart
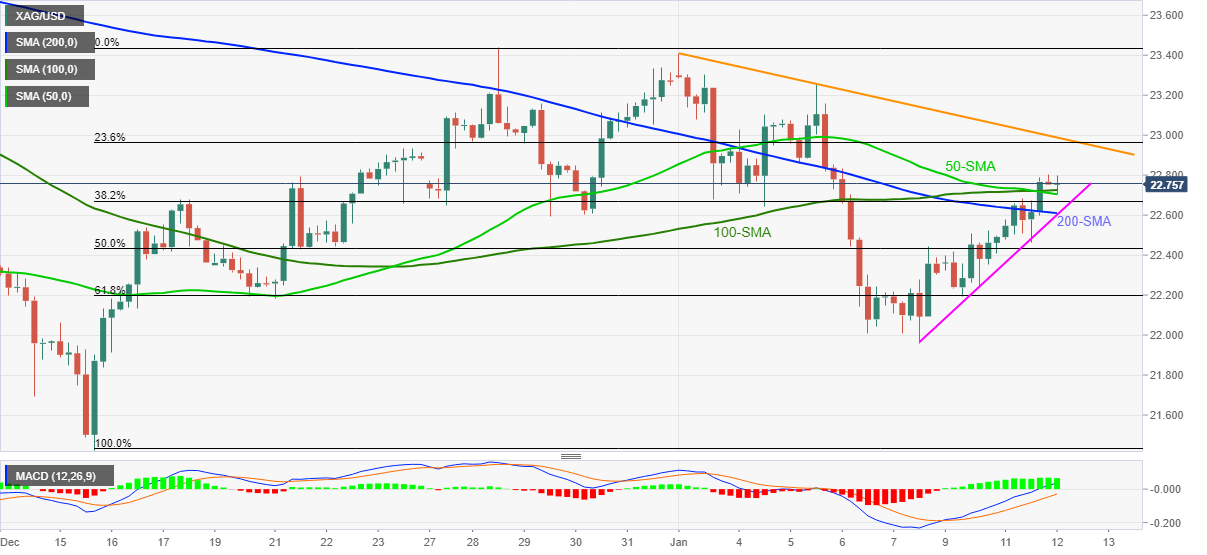
Trend: Further upside expected
“During Powell’s confirmation hearing before the Senate Banking Committee today, inflation was on top of the agenda and it was clear that Powell abandoned the transitory narrative just in time,” Rabobank’s Research Analysts said.
Additional quotes
“Powell wants to prevent higher inflation from becoming entrenched, which means that the Fed is in a hurry to start raising rates and to start reducing the balance sheet.”
“However, questions remain how ‘hawkish’ the Fed will remain if inflation – in line with the Fed’s projections – comes down later this year.”
Read: US Inflation Preview: Dizzying heights of 7% would cement a March hike, supercharge the dollar
With China facing an uphill battle to contain the rapid spread of the highly-contagious Omicron covid variant, Goldman Sachs economists, including Chief China economist Hui Shan, lowered their 2022 GDP growth projection for the dragon nation.
Key highlights (via Bloomberg)
“Goldman Sachs Group Inc. cut its forecast for China’s economic growth this year to 4.3%.”
“The downgrade from the bank’s previous projection of 4.8% incorporates a 0.9 percentage point drag from Covid-related restrictions, which will be partly offset by monetary and fiscal easing.”
“The negative impact from infections and restrictions as China pursues a policy of virus elimination will mostly be felt in the first quarter of 2022.”
“See a rebound in the following three months, assuming that outbreaks can be controlled more easily after the winter months and as booster vaccinations are more widely deployed.”
“Goldman maintained its call for a 50-basis-point cut in the reserve requirement ratio in the first quarter. “
- GBP/JPY takes the bids to refresh weekly, up for the second consecutive day.
- Overbought RSI, looming bear cross may again challenge buyers.
- Upside break of needs validation from monthly high, 2021 peak.
GBP/JPY refreshes weekly top to 157.41 while stretching the previous day’s rebound from 10-DMA to early Wednesday. In doing so, the cross-currency pair eyes a downward sloping resistance line from October 20.
Although bullish MACD signals hint at the pair’s further advances, overbought RSI and previous failures to cross the key hurdle around 157.70 teases bears. Furthermore, a looming bearish cross between the 50-DMA and 100-DMA also challenges the quote’s further advances.
Even if the quote rises past 157.70, it needs to cross the monthly high of 157.76 and 2021 top surrounding 158.22 to convince the GBP/JPY bulls.
Following that, the 160.00 threshold and May 2016 peak of 163.90 should lure the pair buyers.
Alternatively, pullback moves remain elusive beyond the 10-DMA level of 156.57, a break of which will direct GBP/JPY sellers towards the weekly bottom of 155.95.
However, any further downside will be challenged by the mid-November’s high near 154.75 and a confluence of the 100-DMA and 50-DMA close to 153.05.
GBP/JPY: Daily chart
Trend: Pullback expected
| Raw materials | Closed | Change, % |
|---|---|---|
| Brent | 83.62 | 3.15 |
| Silver | 22.776 | 1.4 |
| Gold | 1821.282 | 1.16 |
| Palladium | 1915.48 | 0.87 |
- US 10-year bond yields pause two-day pullback from yearly top, 2-year ease for the second consecutive day.
- S&P 500 Futures fail to track Wall Street gains.
- Powell’s Testimony triggered risk-on moves the previous day.
- China inflation, virus woes and World Bank GDP forecasts test market players ahead of US CPI.
Global markets witness a sluggish start to Wednesday as cautious sentiment ahead of the key US inflation probes the previous optimism fuelled by US Federal Reserve Chairman Jerome Powell.
Also challenging the risk appetite are the fears of the coronavirus strain linked to South Africa, namely Omicron, as well as downbeat China CPI/PPI data, not to forget the World Bank economic forecasts for 2022.
While portraying the mood, the US 10-year Treasury yields remain pressured around 1.741% while the 2-year bond coupon drops for the second consecutive day, down 1.2 basis points (bps) near 0.887 at the latest. Further, S&P 500 Futures struggle to track the Wall Street gains, unchanged around 4,705 by the press time.
Both the key measures on China’s inflation eased December and challenged the already sluggish markets of late. That said, the headline Consumer Price Index (CPI) eased below 1.8% forecast and 2.3% prior to 1.5% YoY while the MoM readings also dropped to -0.3% compared to +0.2% expected and +0.4% previous readouts. Additionally, the factory-gate inflation, namely the Producer Price Index (PPI) also dropped below 11.1% expected and 12.9% prior, to 10.3% YoY for December.
On the other hand, a fresh record of daily covid infections in Australia and the announcement of public health emergency in Washington DC also probe the risk-takers. Additionally, a jump in China’s virus cases, recently by 166 versus 110 a day earlier, adds to the trading filters.
Elsewhere, downbeat economic forecasts from the World Bank (WB) also challenge the previous market optimism. The WB cited coronavirus woes to cut the global GDP expectations for 2022 to 4.1% from 4.3% previous estimations. The World Bank also trimmed the US and Chinese economic forecasts, by 0.5% to 3.7% and by 0.3% to 5.1% in that order, for 2022.
It should be noted that Fed Chair Jerome Powell’s testimony before the Senate Banking Committee could be cited as the major positive factor for the market’s upbeat performance on Tuesday. That said, Fed’s Powell showed readiness to hike interest rates but remained cautious over balance sheet normalization. However, the Fed Boss also expected that the supply crunch will ease somewhat and the economic impact of the Omicron variant will be short-lived.
As a result, today’s US CPI for December, to 7.0% YoY versus 6.8% prior, will be a crucial number to watch as higher inflation can renew the risk-off mood.
Read: Forex Today: Fed Powell put the dollar in sell-off mode ahead of US inflation data
The Chinese yuan is expected to strengthen further above 6.30 against the US dollar in 2022 if China's exports continue to remain robust, the 21st Century Business Herald reported, citing traders with the knowledge of the matter.
more to come ...
“US CPI will be a key focus. Our forecast is in line with the market consensus,” analysts at TD Securities (TDS) noted in their latest report. The US is set to release the December month Consumer Price Index (CPI) on Wednesday at 1330 GMT.
Key quotes
“That said, we think the market's reaction function is asymmetric. That is, with a hawkish Fed well-priced, a softer CPI read could do more to tactically undermine the USD and support risk.”
“Tactically, we see higher beta currencies like CAD benefiting in that scenario, but we think the funders still face an uphill battle early this year. We are keenly watching EURUSD downtrend resistance near 1.14.”
“The market will pay close attention to the CPI report and ongoing Fed speak, but Chair Powell's testimony has continued to suggest that the Fed will remain more aggressive on the timing and pace of hikes as well as runoff.”
“While Powell said the Fed will remain "humble and nimble", we now expect the first Fed rate hike in March and look for balance sheet runoff to begin in September.”
Commenting on the inflation outlook, Bank of Japan (BOJ) Governor Haruhiko Kuroda said on Wednesday, Consumer Price Index (CPI) is likely to gradually increase as a trend
Additional quotes
Japan’s economy picking up as a trend although the situation remains severe due to coronavirus.
Japan's economy is expected to recover ahead as coronavirus impact eases.
Japan's financial system stable as a whole.
Japan's consumer inflation is likely to gradually accelerate reflecting rising energy prices.
Japan's consumer inflation likely to gradually accelerate as a trend.
Closely watching coronavirus impact, won't hesitate to ease policy further if necessary.
-
USD/JPY Price Analysis: Bulls looking for an opportunity for 116 targets
- NZD/USD drops from the convergence of the key SMA and 23.6% Fibonacci retracement of November-December fall.
- China CPI, PPI dropped below market consensus and forecasts in December.
- Pullback remains elusive beyond five-week-old horizontal support.
NZD/USD struggles to extend the previous day’s run-up, easing to 0.6780 amid Wednesday’s Asian session.
The kiwi pair’s latest pullback could be linked to the downbeat inflation data from New Zealand’s key customer China. That said, the headline Consumer Price Index (CPI) eased below 1.8% forecast and 2.3% prior to 1.5% YoY while the MoM readings also dropped to -0.3% compared to +0.2% expected and +0.4% previous readouts. Additionally, the factory-gate inflation, namely the Producer Price Index (PPI) also retreated below 11.1% expected and 12.9% prior, to 10.3% YoY for December.
Read: China CPI misses the mark, AUD unchanged on the outcome, so far
In addition to the downside China data, a confluence of 23.6% Fibonacci retracement, 100-SMA and 200-SMA, around 0.6790-95, also challenged the NZD/USD bulls.
While softer data and a failure to cross the key hurdle signals the pair’s further weakness, a horizontal area established from December 07, near 0.6735-30, becomes the key hurdle for NZD/USD bears.
Following that, the 2021 bottom near 0.6700 and the 61.8% Fibonacci Expansion (FE) of the pair’s moves between November 15 and December 24, around 0.6650, will lure the NZD/USD sellers.
Alternatively, a horizontal area comprising multiple levels marked since September, around 0.6855-60 becomes an additional important resistance to watch for the pair buyers even if they manage to overcome the 0.6795 hurdle.
NZD/USD: Four-hour chart
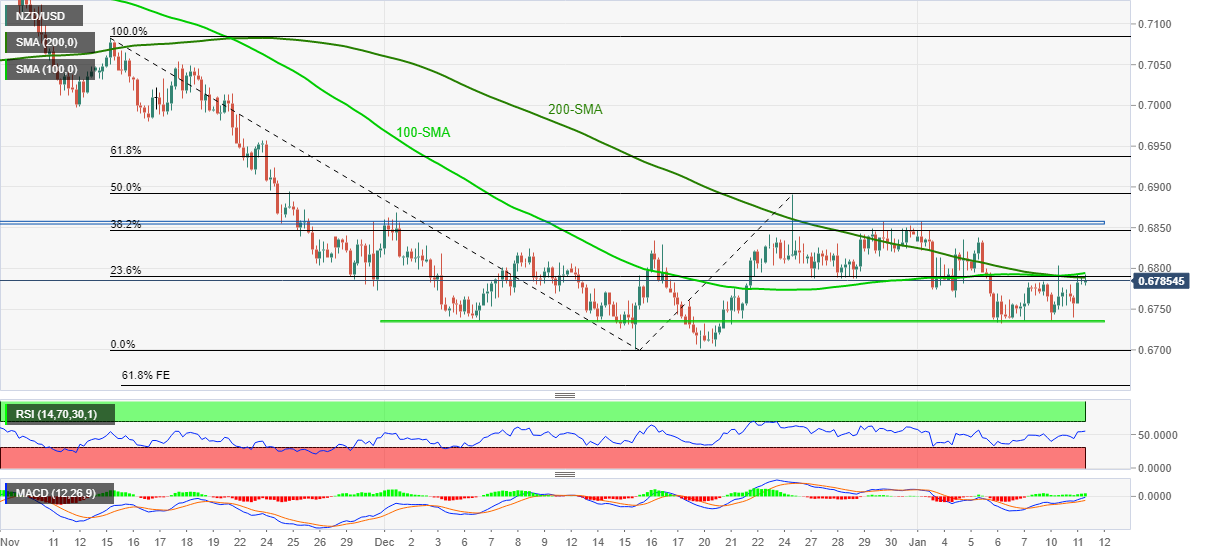
Trend: Pullback expected
- AUD/USD struggles to extend the previous day’s upside momentum.
- China’s CPI, PPI both dropped below market consensus and prior in December.
- Inflation anxiety, covid fears weigh on market sentiment.
- US CPI will be crucial after Powell’s testimony failed to impress Fed hawks.
AUD/USD remains sidelined around 0.7210, fading the previous day’s upside momentum during early Wednesday. The pair’s recent inaction could be linked to the market’s cautious sentiment ahead of the US inflation data, as well as downbeat China CPI and PPI figures. Also challenging the pair buyers are the virus woes at home and abroad.
China’s headline Consumer Price Index (CPI) eased below 1.8% forecast and 2.3% prior to 1.5% YoY while the MoM readings also dropped to -0.3% compared to +0.2% expected and +0.4% previous readouts. Additionally, the factory-gate inflation, namely the Producer Price Index (PPI) also dropped below 11.1% expected and 12.9% prior, to 10.3% YoY for December.
Read: China CPI misses the mark, AUD unchanged on the outcome, so far
It’s worth noting that Australia's Job Vacancies for three months to November jumped past -9.8% prior to 18.5% QoQ during early Asia and favored the pair's upside momentum.
Prior to that, the risk barometer pair cheered Fed Chair Jerome Powell’s measured Testimony that showed readiness to hike interest rates but remained cautious over balance sheet normalization. Fed’s Powell also expected that the supply crunch will ease somewhat and the economic impact of the Omicron variant will be short-lived, which in turn offered additional help to the AUD/USD buyers the previous day.
However, downbeat economic forecasts from the World Bank (WB) and mixed US data from Australia, as well as the US, tamed the AUD/USD bulls on Tuesday. The cited coronavirus woes to cut the global GDP expectations for 2022 to 4.1% from 4.3% previous estimations. The World Bank also trimmed the US and Chinese economic forecasts, by 0.5% to 3.7% and by 0.3% to 5.1% in that order, for 2022.
It’s worth noting that a mixed scenario portrayed by Australia Retail Sales, Trade Balance and sentiment data from the US also challenged the AUD/USD bulls. That said, Australia's Retail sales jumped past 4.9% prior and 3.9% forecast to 7.3% in November while the Trade Balance eased to 9423M versus 10600M expected and 10781M prior. Elsewhere, US NFIB Business Optimism Index rose past 98.4 to 98.9 for December while IBD/TIPP Economic Optimism for January eased to 44.7 versus 48.4 previous readouts.
Additionally, a fresh record high of the daily covid infections in Australia, with the latest 98,538 figures, joins the announcement of public health emergency in Washington DC to probe the AUD/USD buyers.
Amid these plays, US 10-year Treasury yields remain pressured around 1.741% whereas S&P 500 Futures struggle to track the Wall Street gains, unchanged around 4,705 by the press time.
Having witnessed a disappointment from China, AUD/USD traders will keep their eyes on the US inflation report as a stronger price pressure should mark a double-attack on the pair’s upside momentum considering the recently hawkish expectations from the Fed. On the same line were firmer US inflation expectations, as measured by the 10-year breakeven inflation rate per the St. Louis Federal Reserve (FRED) data, which jumped the most in two months the previous day.
Read: US Consumer Price Index December Preview: The Fed’s die is cast
Technical analysis
AUD/USD seesaws around 100-SMA level of 0.7210 while stepping back from the previous support line from December 03, near 0.7220 by the press time.
However, the higher lows of prices and RSI join the sustained bounce off 200-SMA level surrounding 0.7165 to keep the Aussie pair buyers hopeful to overcome the immediate resistance near 0.7220. As a result, tops marked in a fortnight around 0.7275-80 will be crucial on the clear break of 0.7220.
The Consumer Price Index that is released by the National Bureau of Statistics of China has arrived as follows:
China December CPI +1.5% YoY (Reuters poll +1.8% ) vs prior 2.3%
China December CPI -0.3% MoM (Reuters poll +0.2%) vs 0.4% prior.
Additionally, the Producer Pirce Index was released as follows:
+10.3 pct YoY (Reuters poll +11.1 pct)
China December PPI -1.2 pct from the previous month.
AUD/USD impact
The price of AUD/USD is unchanged on the data.
AUD/USD Price Analysis: Bulls run-up to a wall of H4 resistance
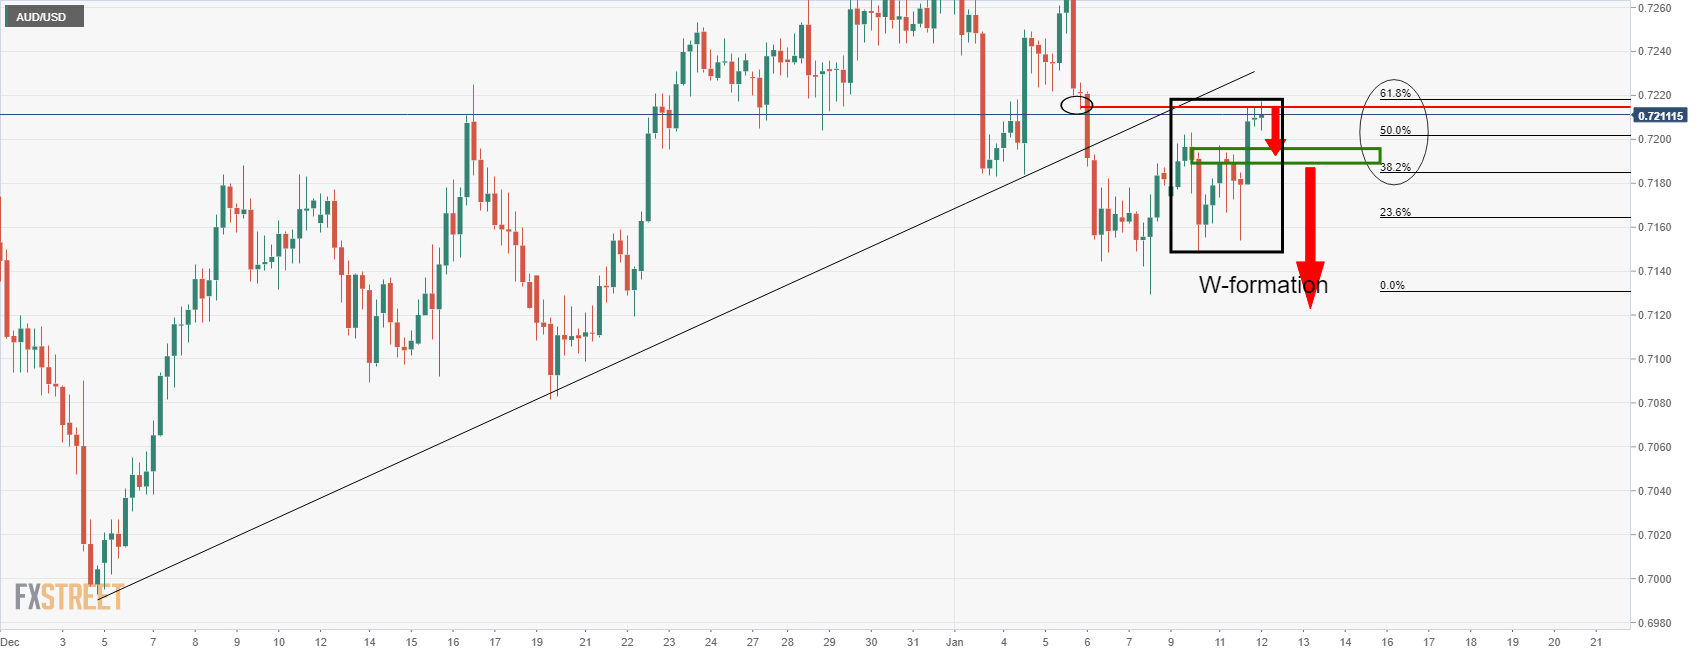
The price is on the verge of a move to the support of the W-formaiton's neckline.
About the Consumer Price Index
The Consumer Price Index is released by the National Bureau of Statistics of China. It is a measure of retail price variations within a representative basket of goods and services. The result is a comprehensive summary of the results extracted from the urban consumer price index and rural consumer price index. The purchase power of the CNY is dragged down by inflation.
The CPI is a key indicator to measure inflation and changes in purchasing trends. A substantial consumer price index increase would indicate that inflation has become a destabilizing factor in the economy, potentially prompting The People’s Bank of China to tighten monetary policy and fiscal policy risk. Generally speaking, a high reading is seen as positive (or bullish) for the CNY, while a low reading is seen as negative (or Bearish) for the CNY.
| Time | Country | Event | Period | Previous value | Forecast |
|---|---|---|---|---|---|
| 01:30 (GMT) | China | PPI y/y | December | 12.9% | 11.1% |
| 01:30 (GMT) | China | CPI y/y | December | 2.3% | 1.8% |
| 05:00 (GMT) | Japan | Eco Watchers Survey: Current | December | 56.3 | |
| 05:00 (GMT) | Japan | Eco Watchers Survey: Outlook | December | 53.4 | |
| 10:00 (GMT) | Eurozone | Industrial production, (MoM) | November | 1.1% | 0.5% |
| 10:00 (GMT) | Eurozone | Industrial Production (YoY) | November | 3.3% | 0.6% |
| 13:30 (GMT) | U.S. | CPI, m/m | December | 0.8% | 0.4% |
| 13:30 (GMT) | U.S. | CPI excluding food and energy, m/m | December | 0.5% | 0.5% |
| 13:30 (GMT) | U.S. | CPI, Y/Y | December | 6.8% | 7% |
| 13:30 (GMT) | U.S. | CPI excluding food and energy, Y/Y | December | 4.9% | 5.4% |
| 15:30 (GMT) | U.S. | Crude Oil Inventories | January | -2.144 | -1.904 |
| 18:00 (GMT) | U.S. | FOMC Member Kashkari Speaks | |||
| 19:00 (GMT) | U.S. | Federal budget | December | -191 | -25 |
| 19:00 (GMT) | U.S. | Fed's Beige Book | |||
| 21:45 (GMT) | New Zealand | Building Permits, m/m | November | -2% |
- USD/JPY bulls could be stepping in soon for 116 area taregts.
- Bears have eye on weekly support area.
USD/JPY bulls have lost ground to the bears, but the decline has been steady and the price is stalling at an old resistance structure.
The following illustrates an upside bias from this juncture and the prospects of a run towards 116.50.
USD/JPY daily chart
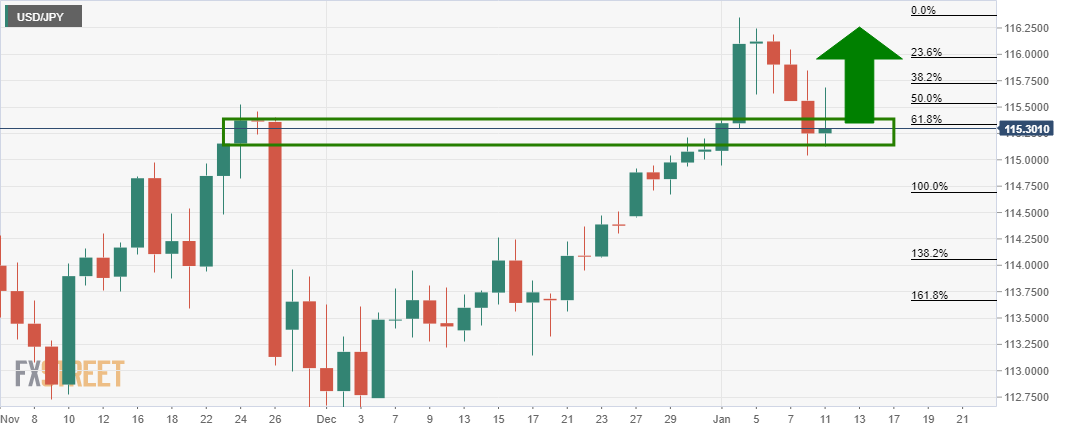
USD/JPY H4 chart
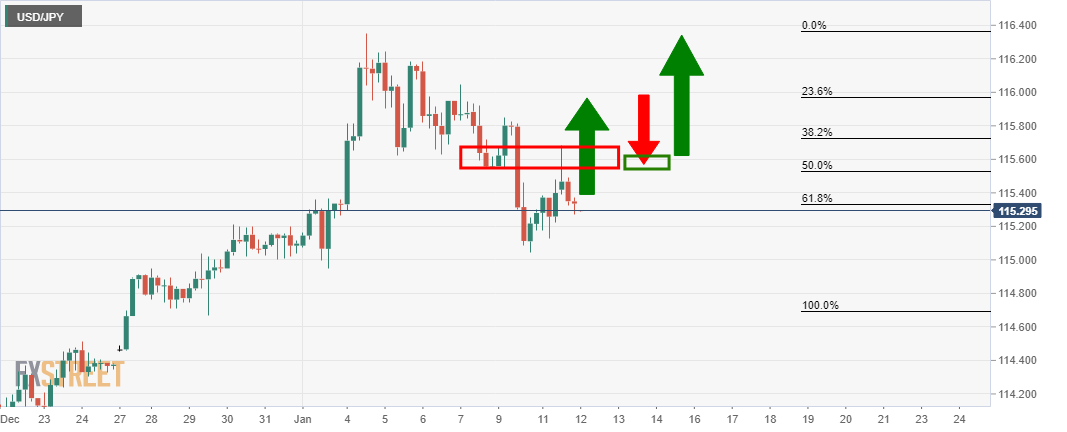
On the 4-hour time frame, the bulls may want to see the overhead resistance broken prior to fully engaging. The resistance is located near 115.90. this would serve as an entry point for the prospects of a significant run higher over the course of the comings days.
With that being said, the weekly chart is potentially due for a correction:
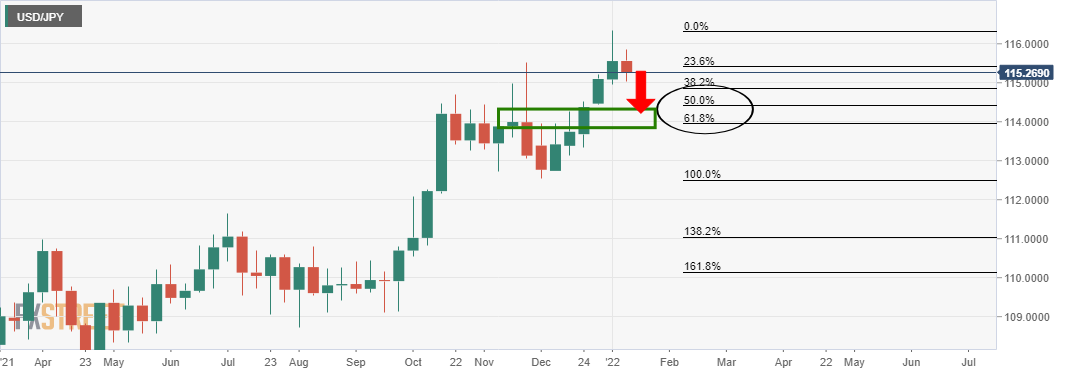
In recent trade today, the People’s Bank of China (PBOC) set the yuan (CNY) at 6.3658 vs the previous fix 6.3684 and the prior close of 6.3733.
About the fix
China maintains strict control of the yuan’s rate on the mainland.
The onshore yuan (CNY) differs from the offshore one (CNH) in trading restrictions, this last one is not as tightly controlled.
Each morning, the People’s Bank of China (PBOC) sets a so-called daily midpoint fix, based on the yuan’s previous day closing level and quotations taken from the inter-bank dealer.
- USD/TRY drops below 21-SMA for the first time in a week.
- RSI pullback favors sellers targeting 200-SMA, $13.94-95 adds to the upside filter.
USD/TRY finally breaks 21-SMA, down 0.26% intraday around $13.77 during early Wednesday. In doing so, the Turkish lira (TRY) breaks the inactivity portrayed so far in the last week.
As RSI conditions also favor the latest pullback, USD/TRY prices are likely declining towards the 200-SMA level of $13.50.
Following that, the $13.00 threshold and the monthly low of $12.75 may act as buffers before directing the pair towards December’s bottom surrounding $10.24.
During the fall past $12.75, the 23.6% Fibonacci retracement of December 20-23 downside, around $12.15, will offer an additional level to rest for the USD/TRY bears.
Meanwhile, 21-SMA guards the quote’s immediate upside around $13.80, a break of which will direct the USD/TRY prices towards the double tops marked near $13.94-95.
Even if the quote rises past $13.95, it needs validation from the $14.00 round figure before convincing the bulls.
USD/TRY: Four-hour chart
Trend: Further weakness expected
US inflation expectations, as measured by the 10-year breakeven inflation rate per the St. Louis Federal Reserve (FRED) data, refreshed weekly high to 2.54% by the end of Tuesday’s North American session, per the FRED website.
In doing so, the inflation gauge rose the most since November 10, also extending the bounce off monthly low.
The firmer inflation expectations keep fears of the Fed’s early rate hike on the table, which recently gained support from Fed Chair Powell as he showed readiness to hike interest rates to stop inflation from being entrenched.
However, today’s US Consumer Price Index (CPI) will be crucial to watch for near-term market direction as Powell also signaled that the “supply crunch will ease somewhat” while suggesting the balance sheet runoff could happen "perhaps later in the year."
Read: US Inflation Preview: Dizzying heights of 7% would cement a March hike, supercharge the dollar
- DXY remains pressured around monthly low, battles two-month-old horizontal support.
- Clear break of 50-DMA, downbeat oscillators favor sellers.
- Ascending trend line from September acts as additional support, bulls need to cross seven-week-long resistance to retake controls.
US Dollar Index (DXY) stays depressed near 95.60, the lowest level since December 31, during Wednesday’s Asian session.
The greenback gauge provided a clear downside break of the 50-DMA to refresh the monthly low the previous day. The bearish bias also takes clues from MACD and RSI indicators.
However, a two-month-old horizontal support zone near 95.60-50 becomes a crucial challenge for the DXY pessimists.
Should the quote drop below 95.50, the odds of its plunge to a 3.5-month-old support line near the 95.00 threshold can’t be ruled out. Following that, October’s high near 94.55 will be in focus.
Meanwhile, the 50-DMA level of 95.90 and the 96.00 round figure restricts the short-term US Dollar Index upside ahead of a descending resistance line from November 24, around 96.40.
In a case where DXY rises past 96.40, the bulls can quickly cross November’s peak of 96.94 to poke the 97.00 psychological magnet.
DXY: Daily chart
Trend: Further weakness expected
- AUD/USD grinds higher around weekly top as market sentiment dwindles on the key day.
- Pair buyers rethink Powell-led advances ahead of the key CPI figures.
- World Bank’s economic forecasts join virus woes to magnify pre-data anxiety, mixed data adds to trading filters.
- December inflation data from China, US will be important amid talks of monetary policy actions.
AUD/USD seesaws around 0.7210-15 during a quiet Asian session on Wednesday as traders await the key inflation figures from China and the US. Adding to the trading filters are recently negative headlines concerning the coronavirus from the US and Australia.
It’s worth noting that Fed Chair Jerome Powell’s hawkish testimony before the Senate Banking Committee couldn’t defend US dollar bulls the previous day as market players smelled uncertainty over balance sheet normalization and hopes of overcoming the Omicron wave.
The Fed Boss showed readiness to hike interest rates to stop inflation from being entrenched but also expected that the supply crunch will ease somewhat and the economic impact of the Omicron variant will be short-lived.
On the other hand, WB’s latest economic forecasts cited coronavirus woes to cut the global GDP expectations for 2022 to 4.1% from 4.3% previous estimations. The World Bank also trimmed economic forecasts for the US and China, by 0.5% to 3.7% and by 0.3% to 5.1% in that order.
Recently, Washington Mayor Muriel Bowser declared a limited public health emergency until January 26 to ease the strain on health services. At home, Australia reports a shortage of antigen test kits as the Pacific major reports the second day of increase in total cases so far on Wednesday, around 76,470 at the latest.
It’s worth noting that Merck’s update, suggesting its covid treatment pill’s ability to tame coronavirus and all variants, placates the virus fears but the pre-data anxiety probes AUD/USD bulls.
Talking about data, Australia's Job Vacancies for three months to November jumped past -9.8% prior to 18.5% QoQ and favored the pair's upside. On the other hand, US NFIB Business Optimism Index rose past 98.4 to 98.9 for December while IBD/TIPP Economic Optimism for January eased to 44.7 versus 48.4 previous readouts.
Amid these plays, S&P 500 Futures and the US Treasury yields remain sluggish after Wall Street cheered the second consecutive daily fall in the US 10-year Treasury yields.
Moving on, China Consumer Price Index (CPI) for December, as well as the Producer Price Index (PPI), will direct immediate upside moves of the AUD/USD ahead of the US inflation figures. Forecasts suggest China’s headline CPI ease from 2.3% to 1.8% YoY while the PPI may witness ease from 12.9% to 11.1% for the said month, which in turn may add to the upside filters for the pair buyers. However, the softer China inflation may push the People’s Bank of China (PBOC) towards more easing and can restrict the quote’s south-run. However, the hawkish expectations from US CPI, likely rising to 7.0% YoY versus 6.8% prior, could reverse the latest gains.
Read: US Consumer Price Index December Preview: The Fed’s die is cast
Technical analysis
AUD/USD seesaws around 100-SMA level of 0.7210 while poking the previous support line from December 03, near 0.7220.
Given the higher lows of prices and RSI joining the sustained bounce off 200-SMA level surrounding 0.7165, the Aussie pair is likely to overcome the immediate resistance near 0.7220, which in turn will propel the quote towards 0.7275-80 region, comprising tops marked in a fortnight.
| Pare | Closed | Change, % |
|---|---|---|
| AUDUSD | 0.721 | 0.56 |
| EURJPY | 131.07 | 0.54 |
| EURUSD | 1.1369 | 0.41 |
| GBPJPY | 157.189 | 0.59 |
| GBPUSD | 1.36345 | 0.5 |
| NZDUSD | 0.67844 | 0.4 |
| USDCAD | 1.2572 | -0.73 |
| USDCHF | 0.92346 | -0.42 |
| USDJPY | 115.287 | 0.12 |
- USD/CAD closed below 1.2580 on Tuesday amidst USD weakness.
- This could open the door to more downside for the foreseeable future.
USD/CAD was making a fresh cycle low on Tuesday as oil continued to recover and print higher and as the US dollar melted. This was so despite sentiment for a faster run down of quantitative easing and a faster pace of interest rate hikes from the Federal Reserve. At the time of writing, USD/CAD is trading at 1.2570 and consolidates above the overnight night low of 1.2567.
Fed will tackle inflation
Investors were reassured that the Fed will tackle inflation which led to stocks rebounding overnight and reversing the recent downward trend. Fed Chair Jerome Powell reassured explained in a testimony that the Fed is prepared to tighten monetary policy to maintain price stability.
Powell commented, “if we see inflation persisting at higher rates than expected then we will raise interest rates… we will use our tools to get inflation back.”
Analysts at ANZ Bank explained that the chair ''expects supply-side pressures to ease somewhat but said if that doesn’t happen then there is a risk that inflation becomes more entrenched and therefore the Fed would then need to respond. He also said he expects the economic impact of the Omicron variant to be short-lived.''
This is a common theme between banks which is starting to outstrip demand for the greenback. Investors are inclined to move into riskier assets and the onset of inflation is a plus for the commodity sector as well. Commodities tend to perform well in the face of inflation for which the loonie trades as a proxy. Oil, for instance, is heading higher for all the reasons noted here.
National Bank of Canada said in a note today, ''the Bank of Canada's commodity price index for 26 commodities produced in our country and sold on world markets stands at a new record high early in Q1 2022 when expressed in Canadian dollars. That’s good for the trade balance, profits, job creation, and the Canadian dollar.''
All in all, ''rising commodity prices, a current account surplus, a strong labour market and positive interest rate differentials argue for an appreciation of the Canadian dollar,'' analysts at the bank added.
The fundamentals tie in with the following technical outlook:
USD/CAD technical analysis
- USD/CAD Price Analysis: Bears to target 1.2480 on a breakout below daily H&S neckline
The price closed below the neckline of the head and shoulders formation. A restest of the old support between here and 1.2650 (61.8% Fibonacci retracement area) would be anticipated to hold and lead to a downside continuation for the days ahead which puts 1.2490 on the map.
- EUR/USD grinds higher following the strong rebound from 21-DMA that crossed 50-DMA hurdle.
- 10-week-old horizontal resistance challenges immediate upside ahead of descending trend line from early September.
- Higher lows of prices, RSI keep buyers hopeful.
- Sellers need to conquer monthly support line to retake controls.
EUR/USD retreats from weekly top to 1.1365 during Wednesday’s Asian session. Even so, the major currency pair remains on the buyer’s radar as they brace for the key US inflation data.
Read: US Consumer Price Index December Preview: The Fed’s die is cast
The quote not only bounced off 21-DMA but also crossed the 50-DMA to post a considerable upside bias the previous day. Additionally, the pair’s recently higher lows of prices join the same pattern on RSI to also portray a bullish scenario.
However, double tops marked since mid-November around 1.1385 guard the quote’s immediate upside, a break of which will direct EUR/USD buyers towards a multi-day-old descending trend line resistance near 1.1400.
It should be noted, though, that a clear run-up beyond the 1.1400 threshold will be enough to propel the quote towards the 100-DMA level of 1.1512 and then to October’s low near 1.1525.
Meanwhile, pullback moves may initially be challenged by the 21-DMA and 50-DMA, close to 1.1335 and 1.1320 in that order.
Following that, an ascending support line from December 15, near 1.1290, becomes crucial to watch as a break of which will recall the EUR/USD sellers targeting 2021 low of 1.1186.
EUR/USD: Daily chart
Trend: Further upside expected


© 2000-2026. Sva prava zaštićena.
Sajt je vlasništvo kompanije Teletrade D.J. LLC 2351 LLC 2022 (Euro House, Richmond Hill Road, Kingstown, VC0100, St. Vincent and the Grenadines).
Svi podaci koji se nalaze na sajtu ne predstavljaju osnovu za donošenje investicionih odluka, već su informativnog karaktera.
The company does not serve or provide services to customers who are residents of the US, Canada, Iran, The Democratic People's Republic of Korea, Yemen and FATF blacklisted countries.
Izvršenje trgovinskih operacija sa finansijskim instrumentima upotrebom marginalne trgovine pruža velike mogućnosti i omogućava investitorima ostvarivanje visokih prihoda. Međutim, takav vid trgovine povezan je sa potencijalno visokim nivoom rizika od gubitka sredstava. Проведение торговых операций на финанcовых рынках c маржинальными финанcовыми инcтрументами открывает широкие возможноcти, и позволяет инвеcторам, готовым пойти на риcк, получать выcокую прибыль, но при этом неcет в cебе потенциально выcокий уровень риcка получения убытков. Iz tog razloga je pre započinjanja trgovine potrebno odlučiti o izboru odgovarajuće investicione strategije, uzimajući u obzir raspoložive resurse.
Upotreba informacija: U slučaju potpunog ili delimičnog preuzimanja i daljeg korišćenja materijala koji se nalazi na sajtu, potrebno je navesti link odgovarajuće stranice na sajtu kompanije TeleTrade-a kao izvora informacija. Upotreba materijala na internetu mora biti praćena hiper linkom do web stranice teletrade.org. Automatski uvoz materijala i informacija sa stranice je zabranjen.
Ako imate bilo kakvih pitanja, obratite nam se pr@teletrade.global.
транcфери