- Analiza
- Novosti i instrumenti
- Vesti sa tržišta
Forex-novosti i prognoze od 10-01-2022
- WTI holds steady in the Asian session as supply risks start to abate.
- Investors keeping an eye on Russia risks and Omricon.
West Texas Intermediate (WTI) crude oil settled lower on Monday as supply disruptions in Libya and Kazakhstan eased. Some supplies were restored in Kazakhstan, while Libyan oil production rose to 900,000b/d after maintenance work. However, rising Omicron cases didn’t help either.
At the time of writing, WTI is trading at $78.50 and is flat on the day so far while investors watch closely China’s Omicron spread, as policy could trigger more travel restrictions.
China is battling to stamp out its first outbreak of the Omicron variant, only weeks before the Chinese new year and the Beijing Winter Olympics, with cases recorded in at least two distant provinces. On Monday, health authorities reported 97 new locally transmitted cases for the preceding 24 hours, across several cities.
At least 30 cases were in Henan province, while at least 31 new cases were reported in Tianjin, including 15 children aged five to 15. Omicron, the latest variant of Covid-19 is tearing through other countries around the world also. Sweden became the latest country to introduce new restrictions to halt the spread of the omicron variant.
Elsewhere, oil could still find support on tighter supplies and supply risk from Russia. There is much focus on security discussions this week between Russia and the West in order to address tension in eastern Ukraine.
Talks took place with the US today (Geneva) and will now move to Brussels for discussions with NATO on Wednesday and subsequently with the OSCE. However, the bar for a 'break-through' is high which is potential support for the price of oil.
- Gold extends two-day rebound from a monthly low, recently picking up bids.
- Market sentiment dwindles amid inflation, Fed rate hike chatters.
- Fed’s Powell cites upbeat economic momentum, robust labor market to back the pledge against inflation.
- Gold Price Forecast: Quick pullback from 1,800 area hints at further slides
Gold (XAU/USD) picks up bids to $1,802 during a quiet Asian session on Tuesday, keeping the previous two-day advances.
The bullion rose during the last two days as markets braces for this week’s US inflation data and the US Treasury yields have been on the defensive despite the refreshing multi-day high of late.
The gold’s latest upside takes clues from mildly bid S&P 500 Futures and softer US 10-year Treasury yields. That said, the US stock futures rise 0.12% while the benchmark bond yields drop one basis point (bp) to 1.77% after easing from the yearly peak the previous day.
Behind the recent market optimism are the hawkish comments from Fed Chair Jerome Powell, per the prepared remarks for today’s Testimony. The Fed Boss said, “The economy is growing at its fastest rate in years, and the labor market is robust,” to back his pledge to stop higher inflation from getting entrenched.
Additionally, comments from Merck’s official saying, “Expect Molnupiravir mechanism to work against omicron, any covid variant,” could also be cited as positive for the risk appetite.
Previously, steady US inflation expectations, as per 10-Year Breakeven Inflation Rate numbers from the Federal Reserve Bank of St. Louis (FRED), joined higher inflation components of the December NY Fed’s survey of consumer expectations to portray inflation fears. The same propelled US bond coupons to refresh multi-day peaks and drown the equities before providing a mixed daily closing.
Looking forward, gold traders will keep their eyes on Powell’s testimony for intraday moves even as the prepared remarks are out. However, major attention will be given to Wednesday’s US Consumer Price Index (CPI) data for fresh impulse.
Read: Inflation and rising yields to guide investors
Technical analysis
Having confirmed a bearish bias by breaking a short-term ascending trend channel and 100-SMA support, gold prices bounced off 23.6% Fibonacci retracement (Fibo.) of November-December declines. However, the metal remains below a convergence of the stated support-turned-resistance, around $1,805, amid sluggish MACD and RSI lines to keep sellers hopeful.
That said, the 23.6% Fibo. retest, near $1,782, acts as immediate support during the quote’s fresh declines, before directing gold bears towards the $1,770 and $1,760 levels.
In a case where gold prices remain weak past $1,760, December’s low of $1,753 and September’s bottom surrounding $1,721 will be in focus.
Alternatively, recovery moves remain elusive below $1,805 resistance confluence, previous support. Also challenging gold buyers is the 50-SMA near $1,808 and 50% Fibonacci retracement level of $1,815.
Given the gold buyer’s dominance past $1,815, 61.8% Fibonacci retracement level around $1,830 may act as an immediate resistance before the tops marked in July and September of 2021, close to $1,834. Also acting as an upside filter is the upper line of the ascending trend channel, close to $1,843.
Overall, gold’s failure to keep Friday’s corrective pullback hints at the commodity’s further weakness.
Gold: Four-hour chart
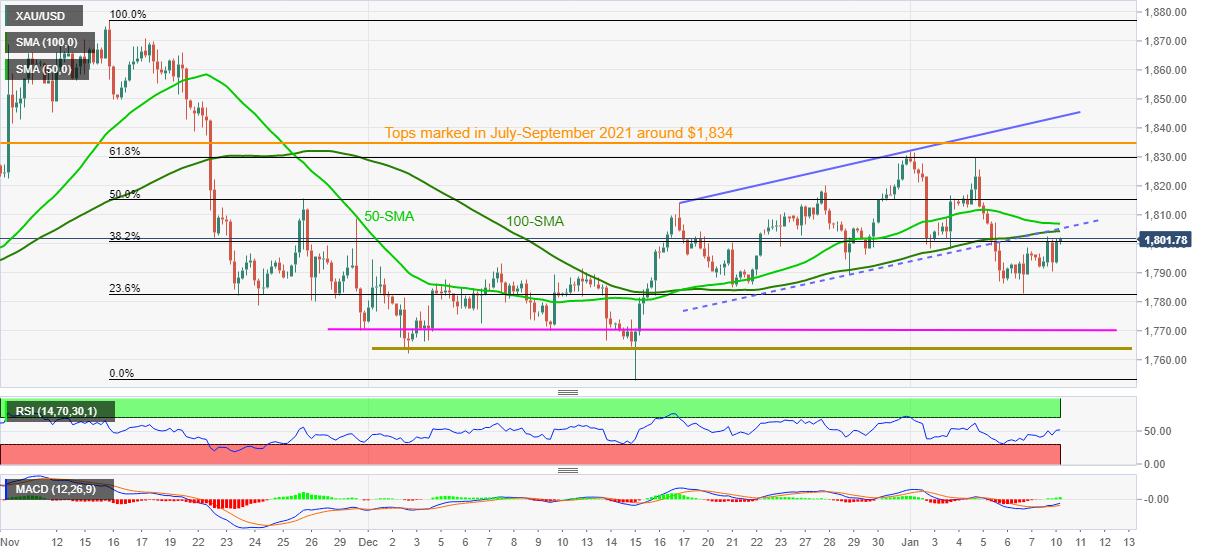
Trend: Further weakness expected
- EUR/USD pares the week-start losses, picks up bids of late.
- Successful bounce off seven-week-old support line, 200- SMA keep buyers hopeful.
- Steady oscillators also favor rebond towards weekly resistance line.
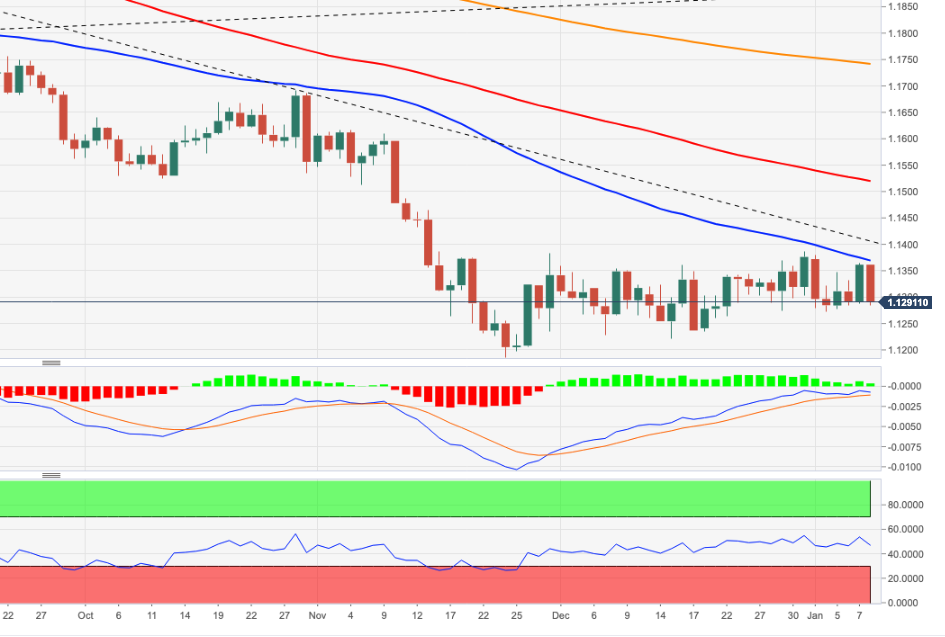
EUR/USD consolidates Monday’s losses above 1.1300, around 1.1330 during Tuesday’s Asian session.
In doing so, the major currency pair keeps the corrective pullback from an upward sloping support line from November 24 and the 200-SMA.
Given the steady RSI and firmer Momentum lines, the latest rebound is likely extending towards a one-week-old resistance line near 1.1360.
However, any further downside will be challenged by the December-end peak near 1.1385 and the 1.1400 threshold.
Alternatively, the stated 200-SMA and short-term support line, respectively around 1.1300 and 1.1280, restricts the quote’s immediate downside.
Also acting as the key support is the 61.8% Fibonacci retracement level of late November to December advances, close to 1.1260.
It’s worth noting that the repeated failures on the way to 1.1400 keep EUR/USD bears hopeful despite the latest corrective bounce.
EUR/USD: Four-hour chart
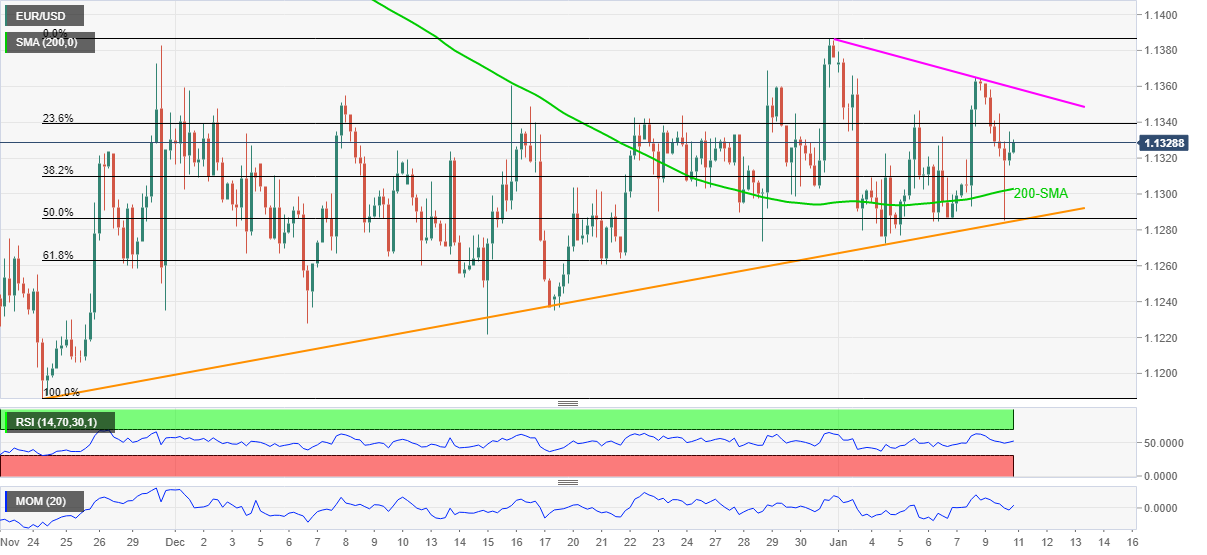
Trend: Further recovery expected
- AUD/USD consolidates Monday’s losses but stays pressured of late.
- Growing fears of inflation, Fed’s rate hike join covid and geopolitical jitters to favor bears.
- Aussie TD Securities Inflation eased YoY in December, Building Permits shrank in November.
- Aussie Retail Sales, Trade Balance may exert additional downside pressure amid bearish hopes.
AUD/USD picks up bids to 0.7175, licking the previous day’s wounds amid the early Asian session on Tuesday.
The risk barometer pair began the week with mild losses as traders brace for Wednesday’s US inflation data amid hawkish hopes from the Fed. Adding to the quote’s weakness were downbeat data at home and challenges emanating from geopolitics, as well as covid, frontiers.
Increasing chatters over inflation weighed down the market’s risk appetite and propelled the yields, as well as the US dollar. Recently, the prepared remarks for today’s Testimony by Fed Chair Jerome Powell also mentioned the Fed Boss as saying, “Will stop higher inflation from getting entrenched.”
It should be noted that the steady US inflation expectations, as per 10-Year Breakeven Inflation Rate numbers from the Federal Reserve Bank of St. Louis (FRED), joins higher inflation components of the December NY Fed’s survey of consumer expectations to magnify the key concerns and weigh on AUD/USD.
Elsewhere, Australia’s easing in covid cases during the weekend fades with the latest figures above 63,000 daily infections, with major threats from New South Wales. The Pacific major is also known to have witnessed a dearth of Ambulance services and vaccines for a short period recently.
Additionally, the US-China tussles continue, recently over trade and the human rights issues, and the Russia-Ukraine matter gains major attention ahead of this week’s Washington-Moscow meeting, weighing on the commodities and Antipodeans amid cautious mood.
Against this backdrop, the US 10-year Treasury yields crossed 1.80% before closing with 1.4 basis points (bps) of a downside to 1.75%. Further, Wall Street also dropped more in the initial hours ahead of the daily mixed close.
Moving on, Australia’s Retail Sales and Trade Balance for November will be the immediate catalysts for the AUD/USD pair. Forecasts suggest downbeat figures of Retail Sales to 3.9% from 4.9%, as well as a reduction in the trade surplus from 11220M to 10600M.
Technical analysis
AUD/USD portrays a Break-Pullback-Continuation (BPC) chart pattern on the four-hour play while observing Thursday’s rising wedge confirmation, followed by a corrective pullback from 50% Fibonacci retracement of December’s advances.
Given the recent U-turn from the previous resistance, the Aussie pair eyes further losses below the 0.7200 round figure, backed by receding bullish bias of the MACD signals.
It’s worth noting, however, that buyers will gain confidence on a clear upside break of the 0.7200 mark, comprising the 100-SMA and bearish wedge’s support line, now resistance.
- The New Zealand dollar edges lower some 0.07%.
- A downbeat market sentiment triggered a sell-off of risk-sensitive currencies, boosted safe-haven peers.
- NZD/JPY is neutral-bearish after a break below the 200-DMA lying at 78.15.
As the Asian Pacific session begins amid a risk-off market mood, the NZD/JPY failed to break above the confluence of the 50 and the 100-day moving averages (DMAs), is trading at 77.85 at the time of writing.
As previously mentioned, US equity markets finished in the red, a trend that began on Friday, January 7. A mixed US Nonfarm Payrolls report, alongside “hawkish” Federal Reserve minutes, triggered a jump in global bond yields, particularly US Treasuries, to the detriment of risk-sensitive currencies, like the New Zealand dollar.
NZD/JPY Price Forecast: Technical outlook
On Monday, the NZD/JPY plunged some 95-pips in the session, from 78.53 to 77.54, and even broke below the 200-day moving average (DMA) at 78.15. However, since the middle of the North American session, the NZD gained some ground against the Japanese yen but failed to reclaim the 200-DMA alongside the neckline of the double-bottom formation.
That said, the NZD/JPY is neutral-bearish, and the first support on the way down would be the January 10 daily low at 77.58. A clear break of that level would expose December 22, 2021, a daily low at 76.91, followed by December 20, 2021, a cycle low at 76.02.
To the upside, the pair’s first resistance is December 16, 2021, daily high at 77.98. A breach of the latter exposes the 200-DMA at 78.15, followed by the confluence of the 50 and 100-DMA around 78.48-60.
-637774516673649295.png)
- NZD/USD struggles to keep the bounce off monthly horizontal support.
- Market sentiment dwindles amid inflation fears, virus woes.
- Powell’s prepared remarks for Testimony showed readiness to fight inflation.
- No major data at home but Fedspeak, inflation chatters and covid updates are the key for fresh impulse.
NZD/USD dribbles around 0.6750-60 during early Tuesday morning in Asia, following a negative start to the key week.
The kiwi pair struggles around short-term horizontal support, despite an absence of major data, as traders remain cautious ahead of Wednesday’s US inflation fears. Adding to the bearish bias for the quote are the coronavirus fears and geopolitical tussles among the leading global economies.
“Market chatter points the finger of blame for the rout on the usual suspects – inflation, tighter policy and COVID, and in that environment, given how much positivity is priced in locally, New Zealand seemingly does have more to lose than other countries,” said analysts at the Australia and New Zealand Banking Group (ANZ).
The fears of a faster rate hike by the US Federal Reserve (Fed) recently got support from prepared remarks of Fed Chair Jerome Powell, for Tuesday’s Testimony. The Fed Boss said, “Will stop higher inflation from getting entrenched.”
Earlier in the day, December NY Fed’s survey of consumer expectations remained unchanged for three-year and one-year basis at 4.0% and 6.0%. The figures are much higher than the Fed’s inflation forecasts and hence push the US central bank towards speedy rate lifts.
On the same line, recently steady US inflation expectations, as per 10-Year Breakeven Inflation Rate numbers from the Federal Reserve Bank of St. Louis (FRED), also hint at the tighter monetary policy by the Fed and reduction in the carry trade opportunities, which in turn weigh on the NZD/USD prices.
Elsewhere, worsening virus conditions in Auckland also challenges the Kiwi policymakers and challenges NZD/USD pair’s corrective rebound. Additionally, the US-China tussles continue, recently over trade and the human rights issues, and the Russia-Ukraine matter gains major attention ahead of this week’s Washington-Moscow meeting, weighing on the commodities and Antipodeans amid cautious mood.
Amid these plays, US 10-year Treasury yields crossed 1.80% before closing with 1.4 basis points (bps) of a downside to 1.75%. Further, Wall Street also dropped more in the initial hours ahead of the daily mixed close.
Moving on, Australia’s Retail Sales and Testimony by Fed Chair Powell will decorate today’s calendar and will be important for NZD/USD traders to watch. However, major attention will be given to inflation and covid chatters for clear direction.
Technical analysis
NZD/USD fails to keep the bounce off five-week-old horizontal support around 0.6740, suggesting further downside towards 2021 low near 0.6700 amid downbeat MACD and RSI line.
Meanwhile, a convergence of the 100 and 200 SMAs, as well as 23.6% Fibonacci retracement (Fibo.) level of mid-November to December downside, around 0.6790 acts as a wall of resistance for the Kiwi pair.
Federal Reserve Jerome Powell is set to appear before the Senate for his confirmation hearing on Tuesday.
In prepared remarks he will state that the economy is expanding at its fastest pace in many years, labor market is strong - prepared remarks for a reappointment confirmation hearing.
He will say that the economy has rapidly gained strength despite the ongoing pandemic, giving rise to elevated inflation
He will explain that the Fed is strongly committed to achieving maximum employment, price stability and that the central bank will use its tools to support the economy, strong labour market, prevent inflation from becoming entrenched.
He will state that the US economy will be a different following pandemic, fed must adapt to those changes and that he is committed to making decisions with objectivity, integrity, impartiality.
The Fed will aim to stop higher inflation from getting entrenched.
There has been no market reaction to these prepared remarks with investors already priced for a faster pare of tapering and rate hikes.
- USD/CAD is carving out a bearish structure on the daily chart.
- Some consolidation would be expected prior to the next downside move with 1.2600 eyed.
As per the start of the week's analysis, The Chart of the Week: USD/CAD has complied with the medium-term bearish bias, the price is adhering to the market's structure and the following illustrates sth bearish perspective:
USD/CAD daily chart, prior analysis
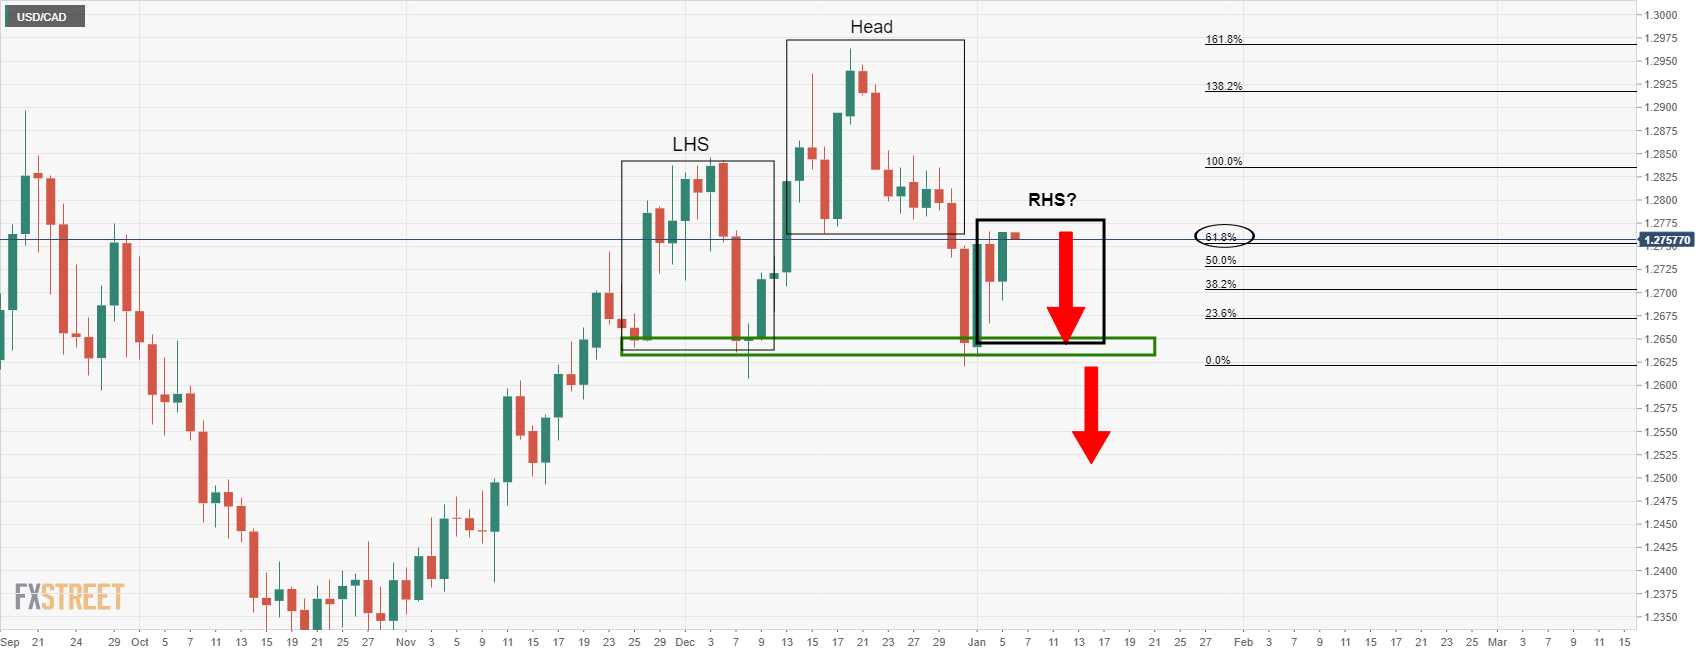
As illustrated above, the head and shoulders were in the making...
USD/CAD daily chart analysis
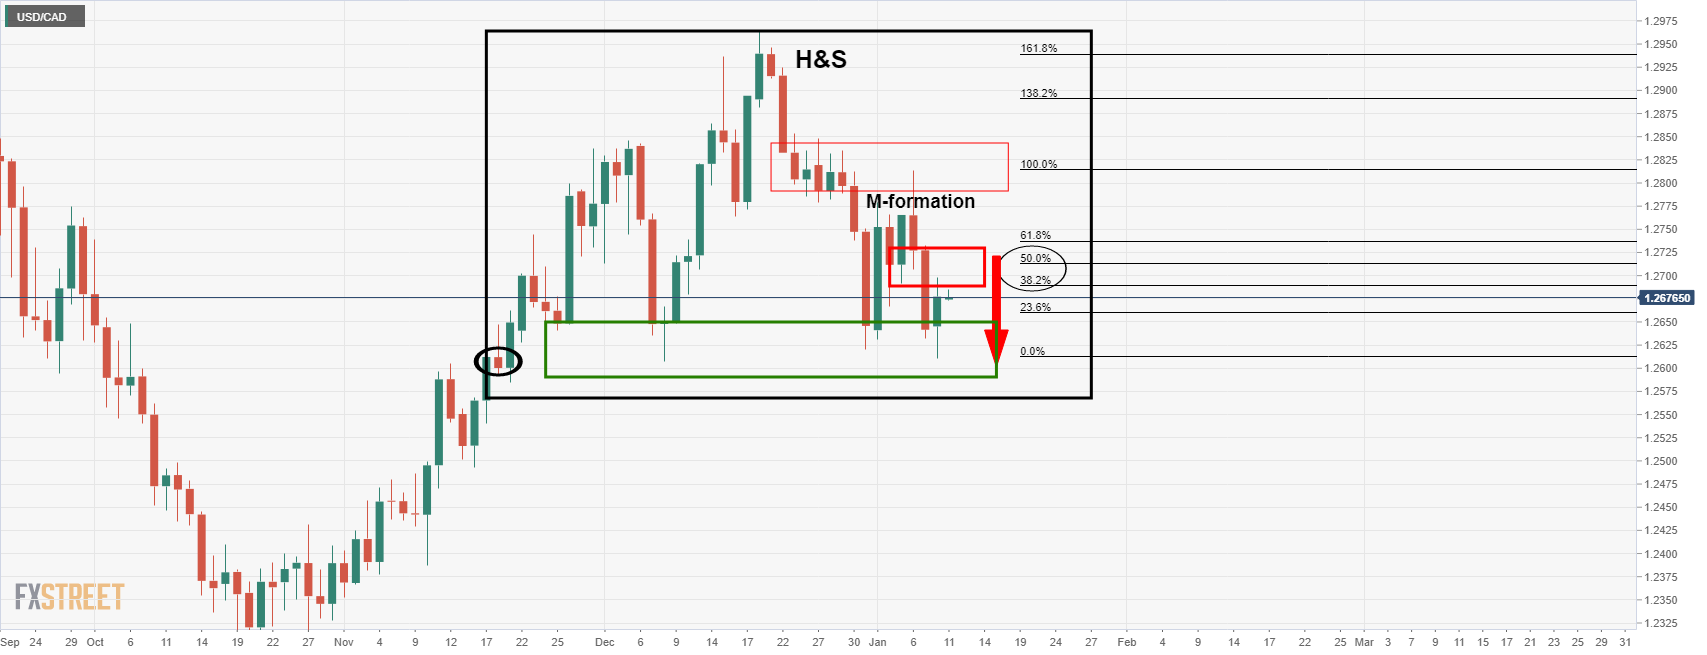
The price is now leaving an M-formation on the chart as illustrated above and is drawing the bulls into the neckline.
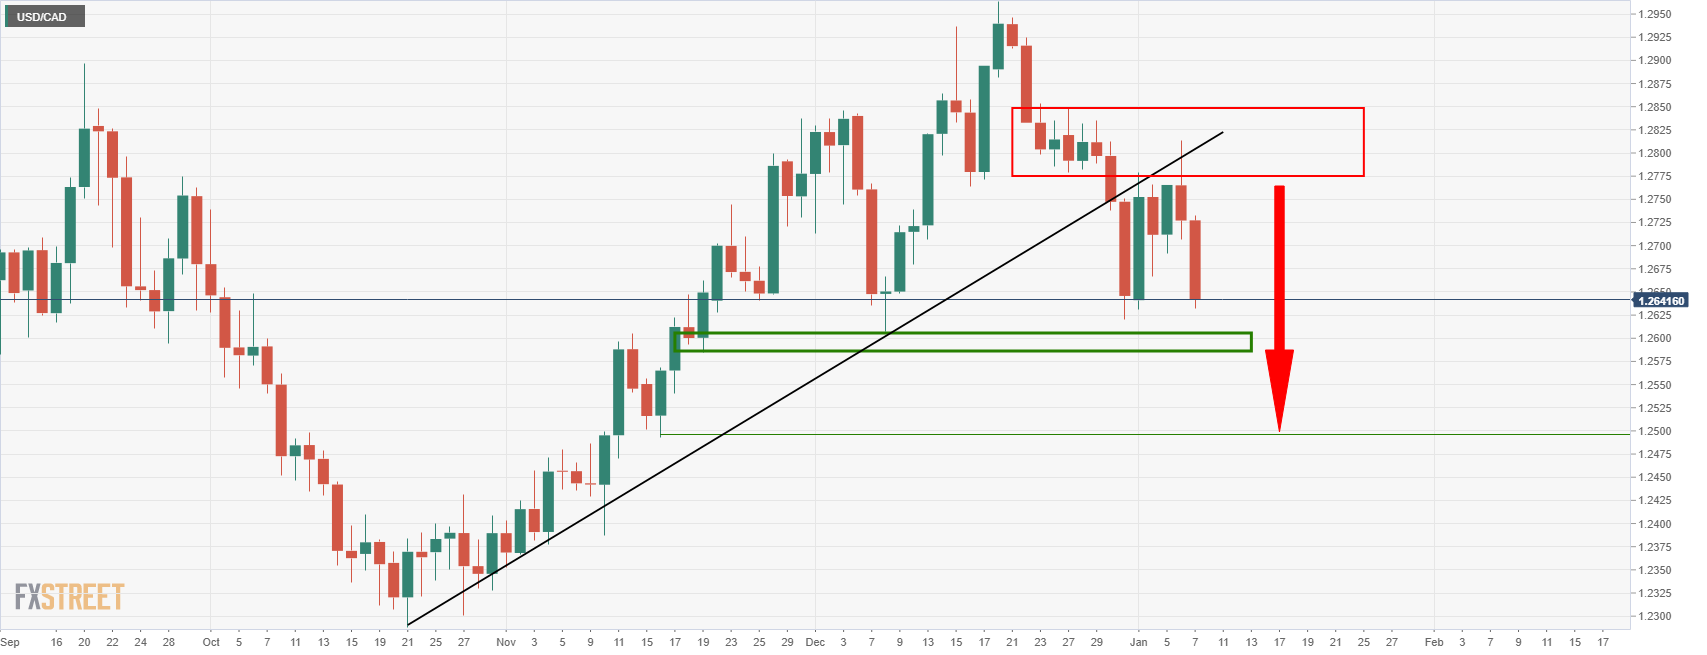
This can be seen on the 4-hour time frame as in the following prior analysis:
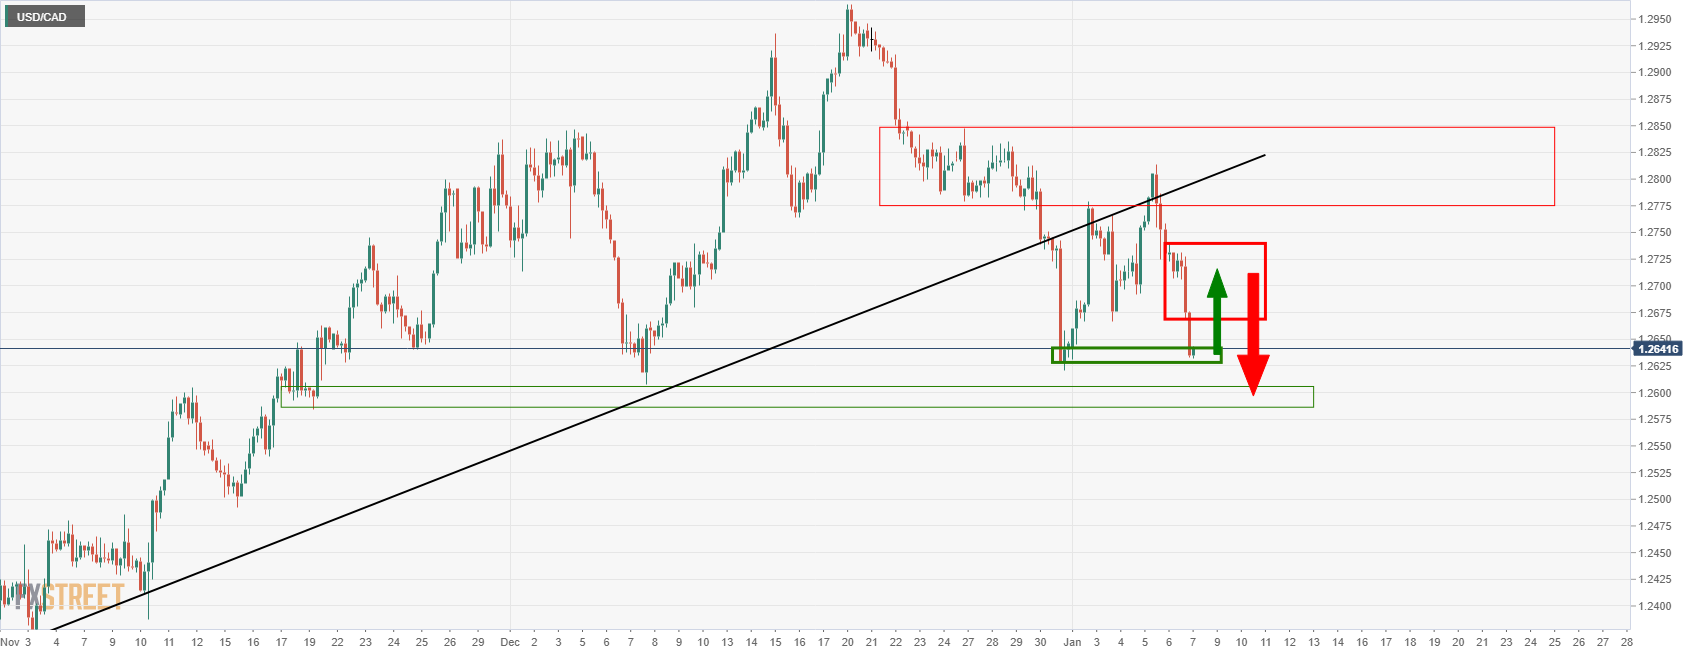
As see, the prior analysis at the start of the week forecasted a move into the 1.27 area and it has played out as follows:
USD/CAD H4 chart
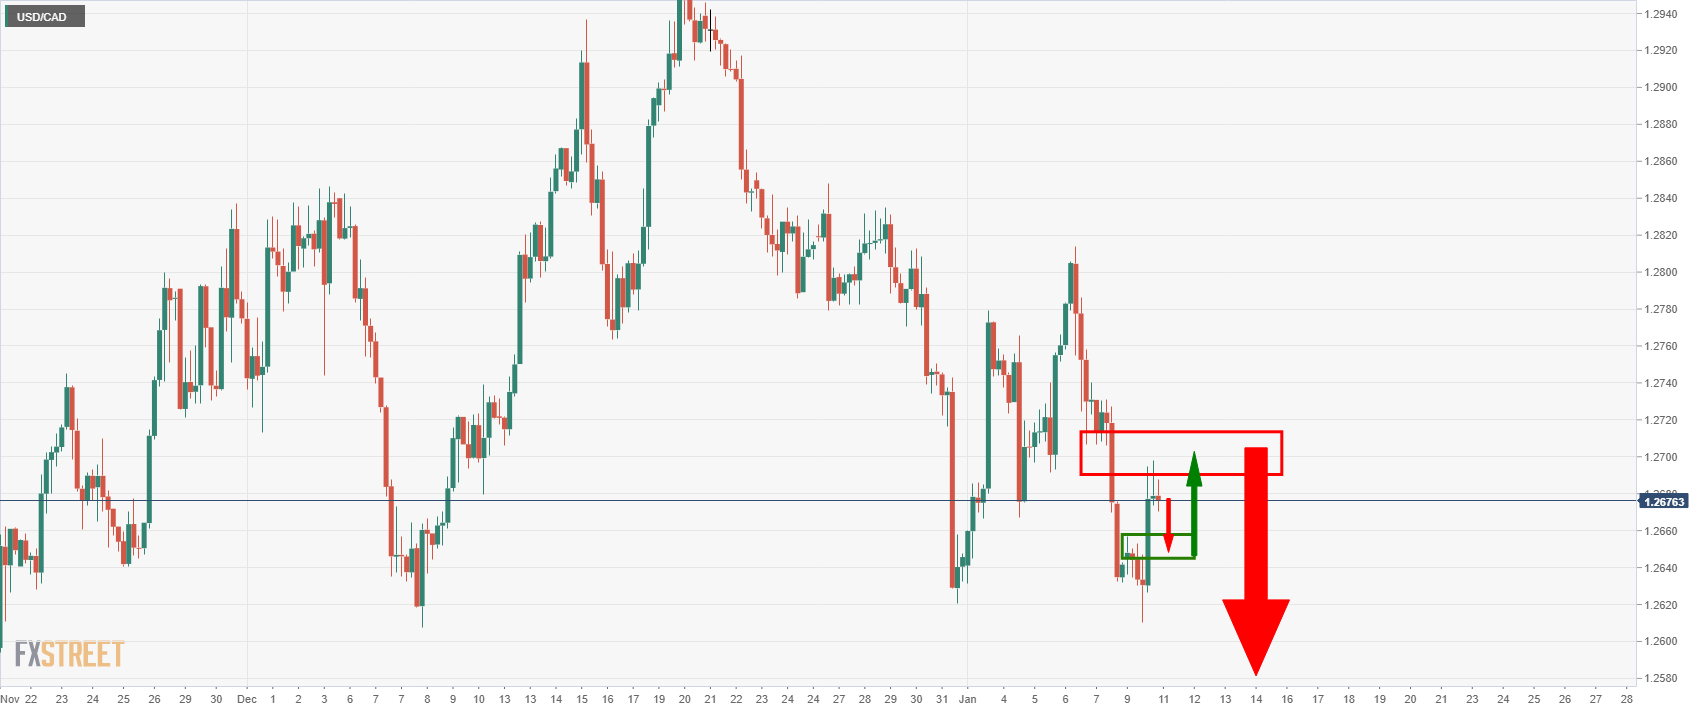
We can now expect the price to mitigate the imbalance to a restest of what would be expected to act as support on first attempts near 1.2650. This could lead to a deeper bullish correction into the daily M-formation's neckline near 1.2700/10 again prior to a full-on downside break to test 1.26 the figure.
- The British pound barely losses some 0.12% as the New York session ends.
- A risk-off market mood and higher US T-bond yields boosted the greenback, weighed on the pound.
- GBP/USD is neutral, though a break above 1.3600 would expose a challenge of the 200-DMA.
On Monday, US central bank’s rising rates expectations and omicron woes dampened the market sentiment, boosting the safe-haven peers like the greenback and the Japanese yen, the strongest currencies of the G8. That said, the British pound retreats from daily highs and turns into negative territory, down some 0.12% in the North American session, trading at 1.3579 at the time of writing.
Higher US Treasury yields boost the buck
In the meantime, the US 10-year Treasury yield advance one basis point sits at 1.778%, a tailwind for the US Dollar Index, which tracks the greenback’s performance against a basket of its rivals, advances some 0.26%, currently at 95.97, weighing on the GBP/USD pair.
During the New York session, a report from Goldman Sachs (GS), revealed that the bank estimates four rate hikes in 2022. The same report noted that the Fed could begin to reduce its balance sheet by mid-2022.
In the same tone, JP Morgan brought forward the first hike to the Federal Funds Rate (FFR), from June to March.
GBP/USD traders attention turns to US inflation figures and the testimony of Federal Reserve policymakers Jerome Powell and Lael Brainard against the US Senate Banking Committee.
GBP/USD Price Forecast: Technical outlook
The GBP/USD pair has a neutral bias, though it has been seesawing around the 100-day moving average (DMA) at 1.3554 for the last five days. Worth noting that GBP bulls showed around the abovementioned and broke a nine-month-old downslope trendline on January 7, exposing the 1.3600 figure.
The GBP/USD’s faced strong resistance at 1.3600. A breach of the latter would expose November 4 daily high at 1.3698, followed by the 200-DMA at 1.3737.
On the flip side, a break below the 100-DMA would expose the trendline mentioned above around the 1.3525-50 region, which once cleared would reveal the 1.3500 figure, followed by the January 3 daily low at 1.3431.
- AUD/USD bears are lurking in various resistance areas as the price corrects.
- 0.7220 is eyed near the counter-trendline but 0.7180 could be a critical resistance.
AUD/USD could be on the verge of a downside continuation and break of dynamic daily support. The following illustrates this from a daily and 4-hour perspective taking into account the Fibonacci levels.
AUD/USD daily chart
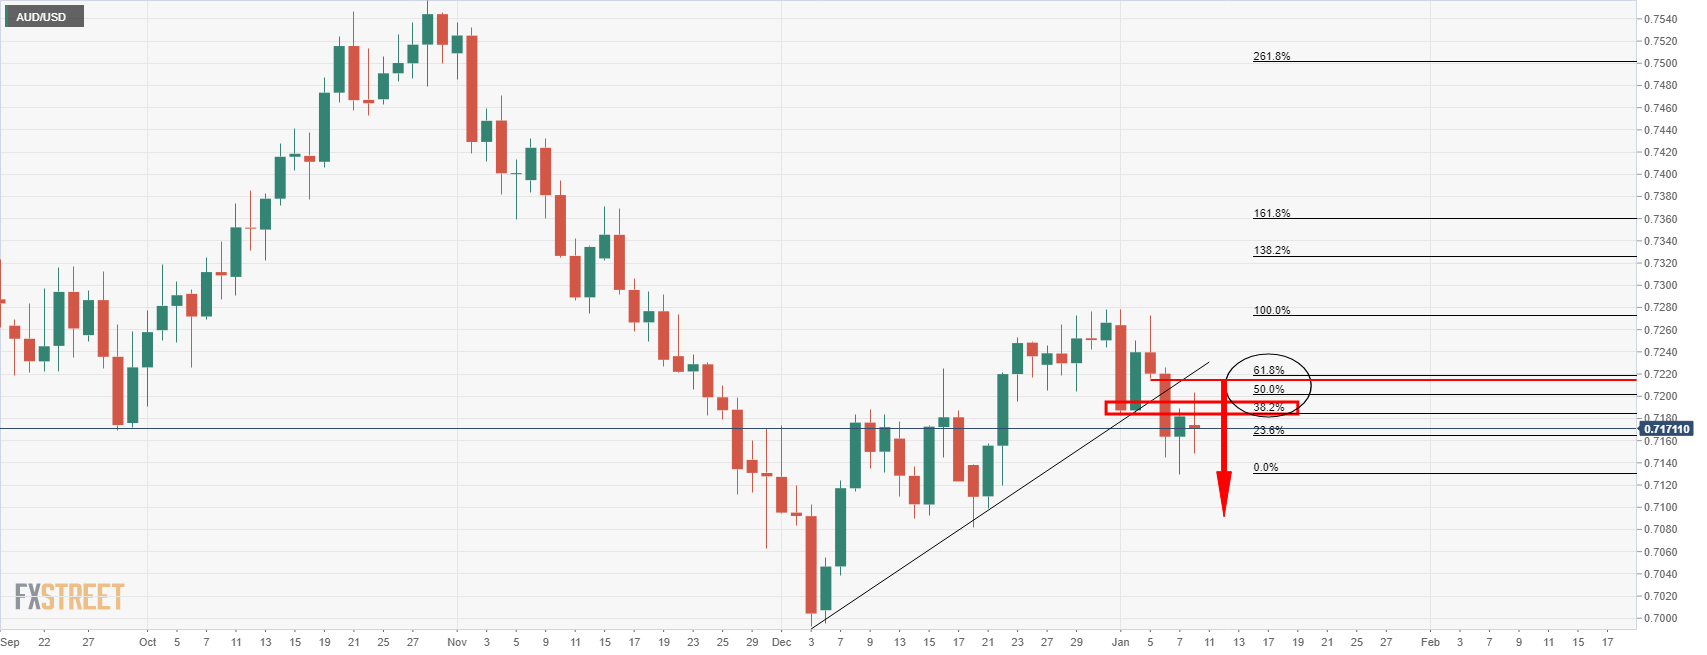
As illustrated, the bulls are moving in for a restest of higher liquidity in a correction of the recent bearish impulse. 0.7180 is currently coming under pressure which could hold initial tests.
AUD/USD H4 chart
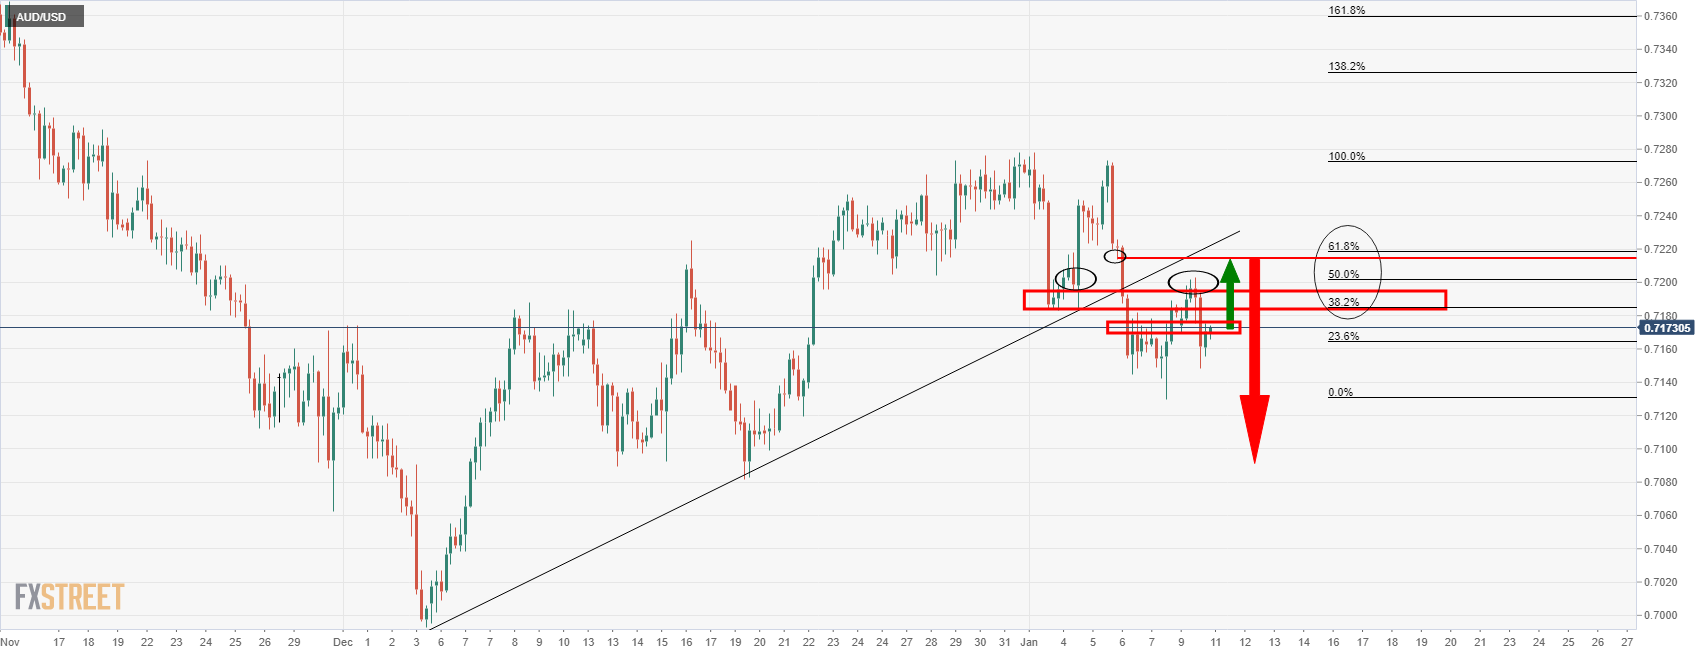
Meanwhile, the 4-hour chart shows that the price is moving in on resistance also and a number of liquidity areas of interest are highlighted. A break of 0.7180 and then 0.72 the figure open risk to the counter-trendline and the 61.8% Fibonacci retracement level near 0.7220. This would be expected to be the last area of defence.
- EUR/JPY is trading close to the 130.50 mark following a volatile session dominated by risk-off flows.
- Though the pair did recover from earlier lows in tandem with US stocks, the scope for further downside is high.
EUR/JPY broke to the south of a bullish trend channel on Monday and the following acceleration of technical selling pressure eventually pushed it to lows in the 130.10s from Asia Pacific levels in the 131.20s. But the pair has recovered some posture in recent trade and is back above 130.50, though further gains are for now being stopped by the presence of the 200-day moving average at 130.56. The recovery from earlier session lows in EUR/JPY coincides with a recovery in US equity markets. Though still down on the day by about 0.5%, the Nasdaq 100 was at one point over 2.5% lower.
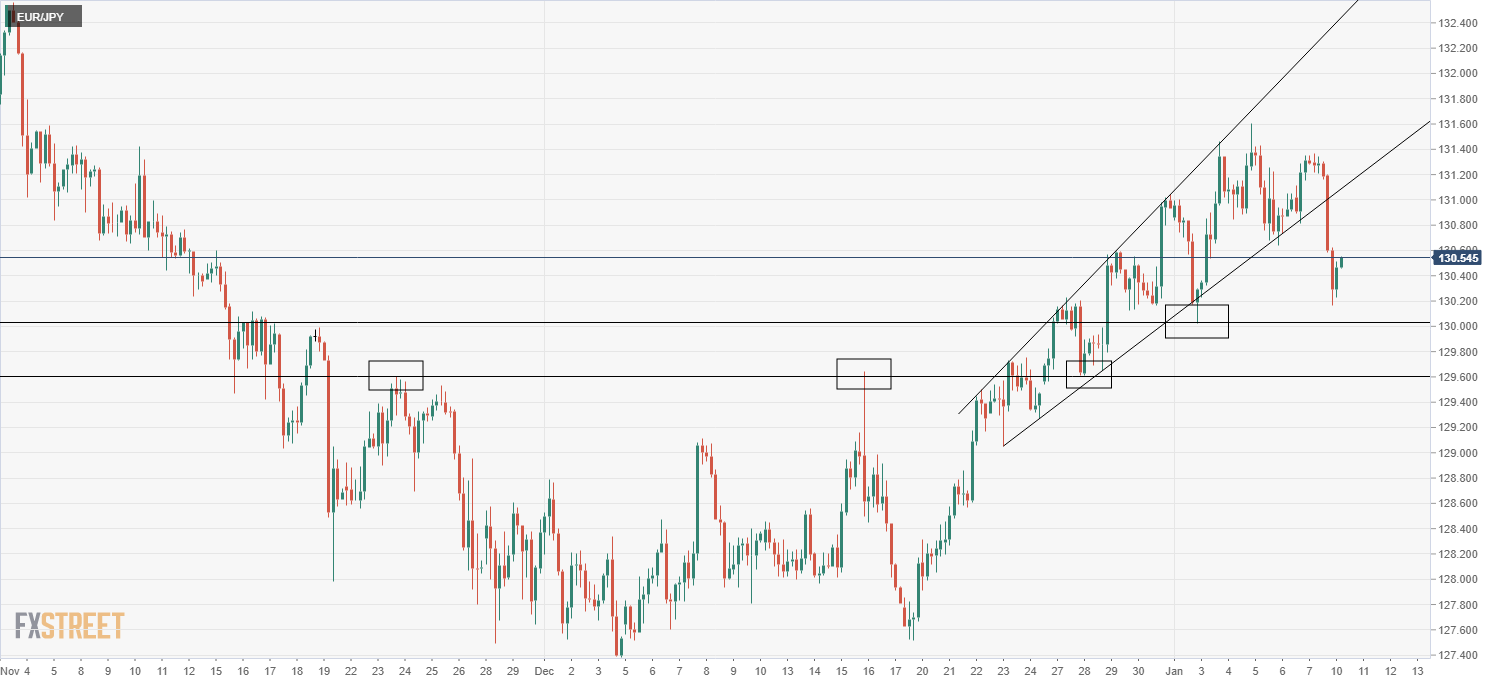
Spurring the downturn in risk appetite that has seen the safe-haven yen outperform in the G10 space, though USD has also done well, has been concerns about more abrupt Fed tightening. Monday’s rebound from lows, for stocks or for EUR/JPY, should not be taken as an indication that these worries are over. Indeed, investors nervously await US December Consumer Price Inflation data on Wednesday, which is expected to show a further build-up of inflationary pressures and further turn up the heat on the Fed to act this year. There will also be plenty of Fed speak this week, including from Fed Chair Jerome Powell and Fed Vice Chair Lael Brainard, both of whom testify at their respectively nomination confirmation hearings before the Senate.
In other words, there are plenty of potential catalysts to rekindle Fed tightening fears this week, meaning plenty of opportunity for further EUR/JPY downside. Key levels to watch include the psychologcially important 130.00 mark, which also coincides with last week’s lows and an important balance area at 129.60, which also coincides with the 21 and 50-day moving averages. EUR/JPY has so far ignored hawkish comments from influential ECB governing council member Isabel Schnabel over the weekend who talked about how if inflation continues to come in higher than expected, the ECB may have to adjust policy to combat it. Further hawkish ECB speak after last week’s hot inflation numbers could well spur some euro appreciation versus the yen, with no changes expected to BoJ policy for the foreseeable future.
What you need to know on Tuesday, January 11:
The greenback seesawed between gains and losses, unable to find a clear direction and led by US Treasury yields once again. Market players await news about US inflation, as the country will release the final reading of the December Consumer Price Index next Wednesday, and it is expected to have been upwardly revised to 7% YoY.
Meanwhile, US Fed’s head Jerome Powell is due to testify on Tuesday on the renomination to chair the Federal Reserve Board of Governors before Senate Banking Committee. His remarks will likely be released before the event and will be closely watched for any hint on the future of monetary policy.
The EUR/USD pair trades around 1.1330, while GBP/USD hovers in the 1.3570 level, posting modest intraday losses. AUD/USD is unchanged on a daily basis, although USDCAD advanced, with the Canadian Dollar weakening alongside oil. The black gold spent the day under pressure, with WTI settling at $78.10 a barrel.
Gold, on the other hand, managed to recover some ground and trades just above the 1,800 threshold heading into the Asian opening. Nevertheless, its bullish potential remains limited.
The Japanese yen appreciated vs the dollar, with the pair currently trading at around 115.20. The sour tone of global indexes weighed on the pair as European and American indexes closed in the red.
US Treasury yields were up amid inflation-related concerns. The yield on the 10-year note touched 1.80% but currently stands at 1.77%.
Australia will publish November Retail Sales and the Trade Balance for the same month, likely to spur some action in the Asian session.
Like this article? Help us with some feedback by answering this survey:
- USD/CHF surged 0.9% on Monday from under 0.9200 to current levels around 0.9270 and is eyeing December highs near 0.9300.
- The dollar was strong on Monday as market participants revise their Fed calls towards more aggressive hikes in 2022.
- But CHF also weakened substantially in wake of a jump in Swiss sight deposits that could indicate SNB intervention.
USD/CHF hit its highest levels in nearly four weeks on Monday after breaking convincingly above the 0.9250 level for the first time since mid-December. It’s been a broadly decent day for the buck as various banks/analysts revise their Fed forecasts in wake of last week’s hawkish Fed minutes and US December jobs report to expect as many as four rate hikes in 2022. But that doesn’t explain the full extent of the upside on Monday, which has seen USD/CHF surge from opening levels to the south of 0.9200 to current levels around 0.9270, an on-the-day gain of around 0.9%.
That surge has seen USD/CHF break to the north of a bullish trend channel that had been constraining the price action over the past week or so. It also marks a clean break back above the pair’s 21, 50 and 200DMAs, all of which reside between the 0.9160-0.9210 area. Technically speaking, a test of the December high at just under 0.9300 now seems highly likely and if that level is broken, eyes will turn to the next area of resistance around 0.9375, a double top of the September/November highs.
The Swiss franc’s near 1.0% depreciation on the day versus the US dollar means it is by far and away the worst performing G10 currency. Some traders attributed the weakness to weekly Swiss sight deposit data released early during Monday’s European session. Total sight deposits jumped to CHF 724.631B from CHF 722.771B a week earlier, a sign that the SNB may have stepped up its forex interventions to weaken CHF last week.
As noted by analysts at Reuters, “the SNB… has long used foreign currency purchases and negative interest rates as the foundation of its expansive monetary policy… (and) increases to sight deposits - cash which commercial banks store with the central bank overnight - are normally seen as a proxy for foreign currency purchases”. But economists cautioned not to read too much into the data, as it is usual to see lower deposits towards the end of the year before jump in January.
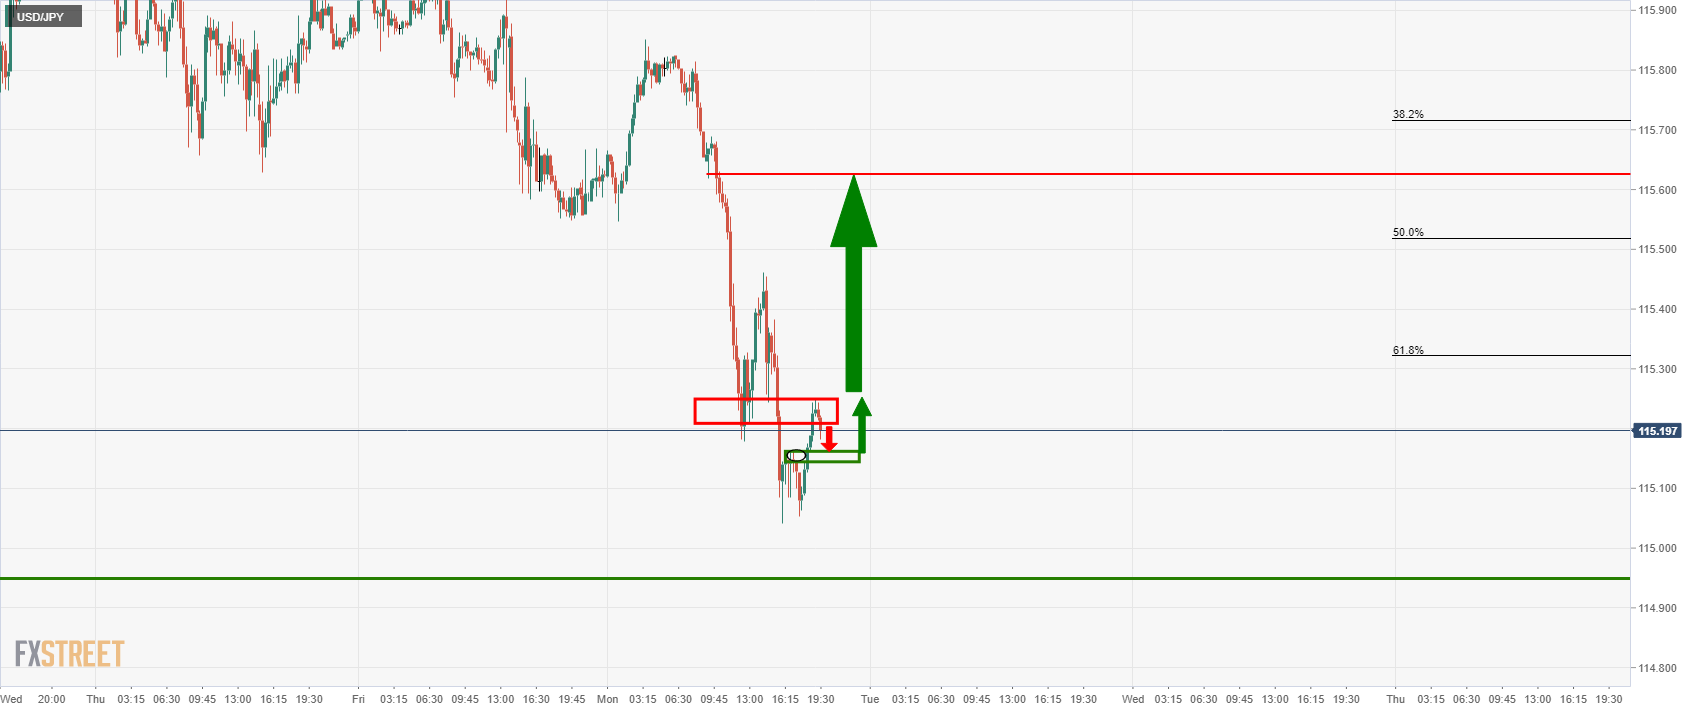
- USD/JPY is under pressure and below daily support.
- Bears eye a test below 115 the figure for the coming session.
The price has been melting in a risk-off environment supporting the yen in the day. The following illustrates the market structure and the prospects of a downside continuation for the session ahead.
USD/JPY daily chart
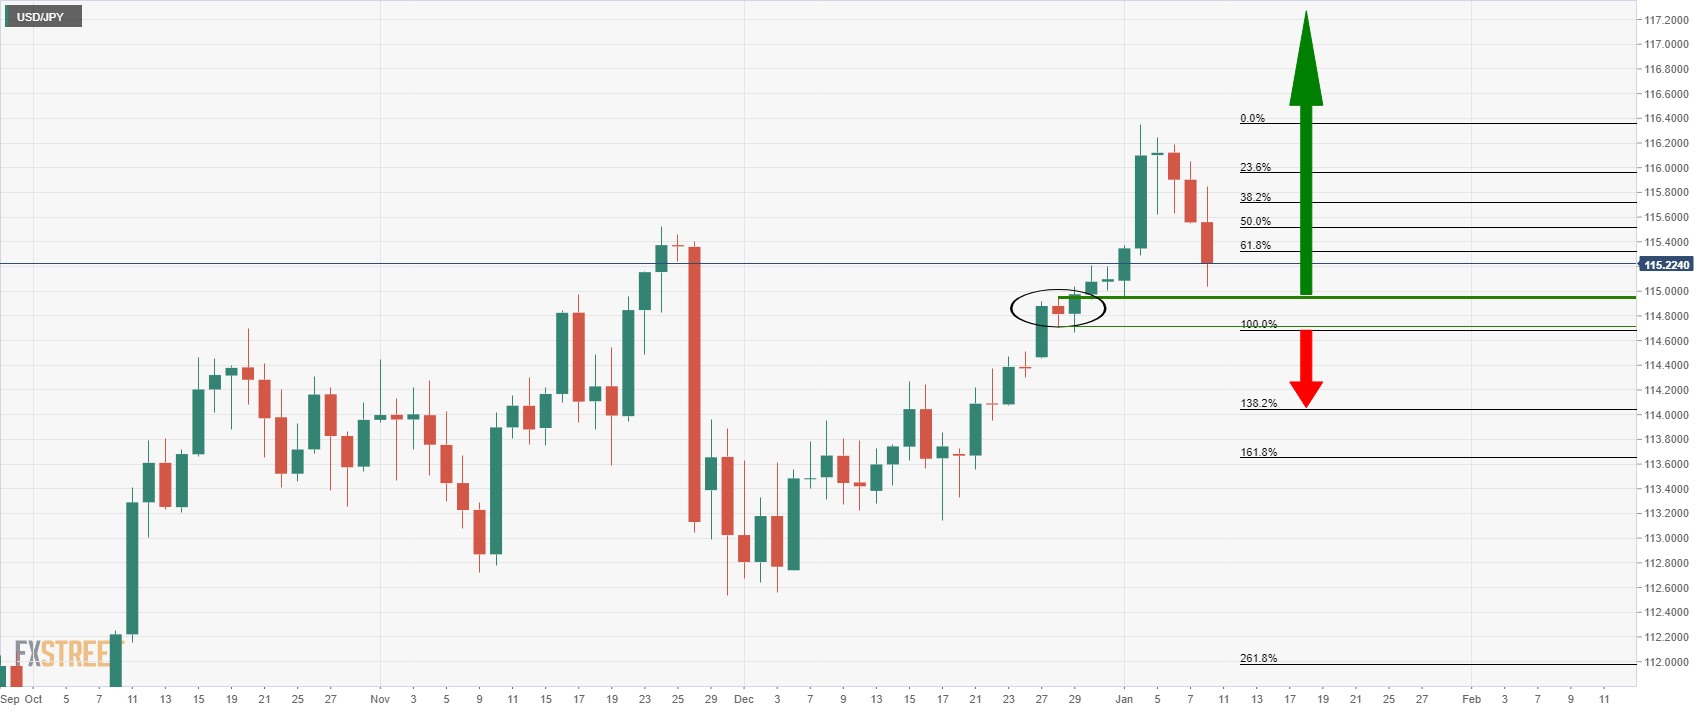
The daily chart is showing that the price is under pressure with room towards 114.95 given that it has pierced the prior highs and old resistance near 115.50
USD/JPY H1 chart
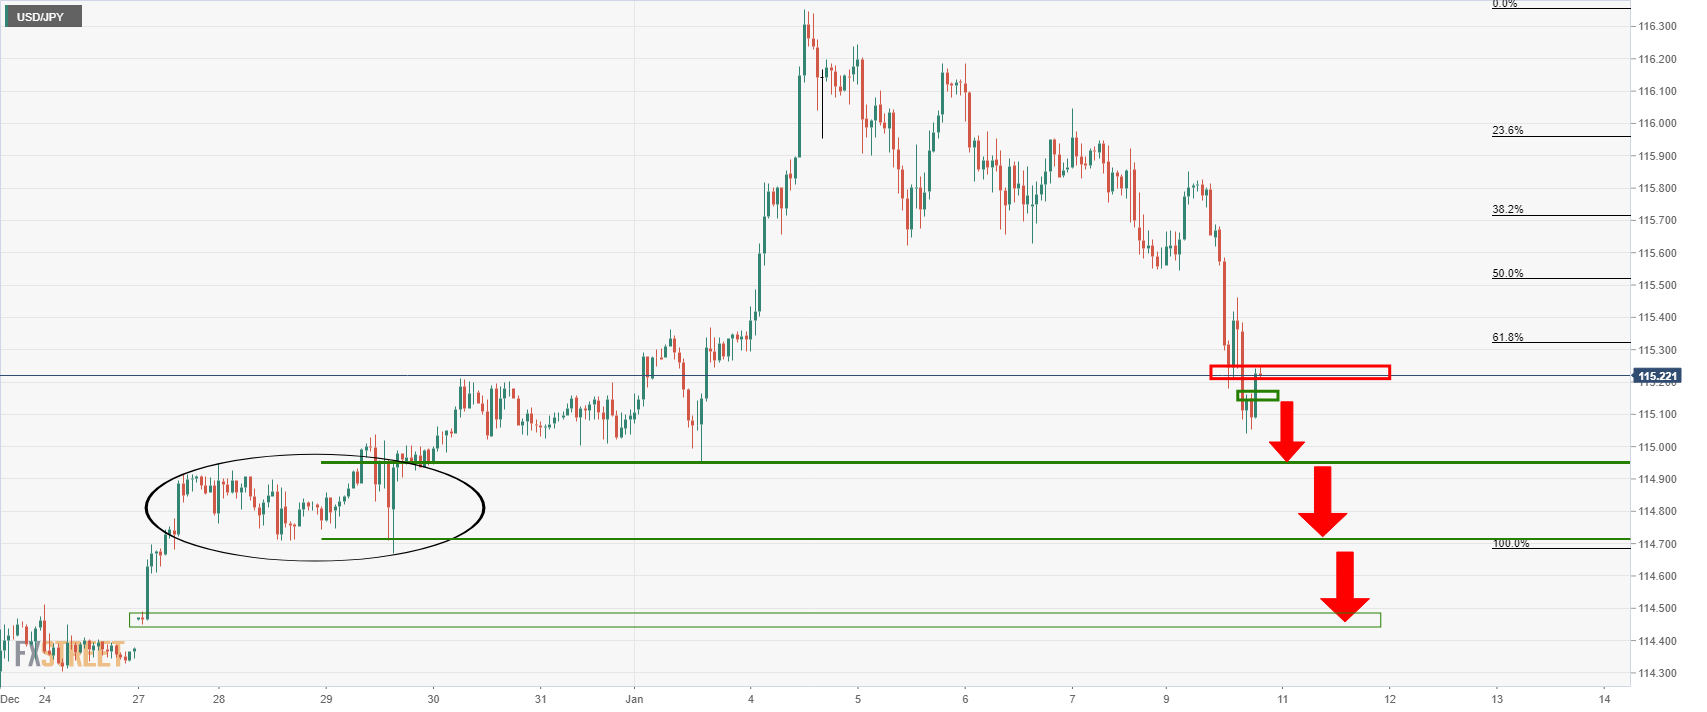
A break of the current support opens risk into the 114.40s for the near term as per the structure highlighted on the hourly chart above and the 15-min chart below:
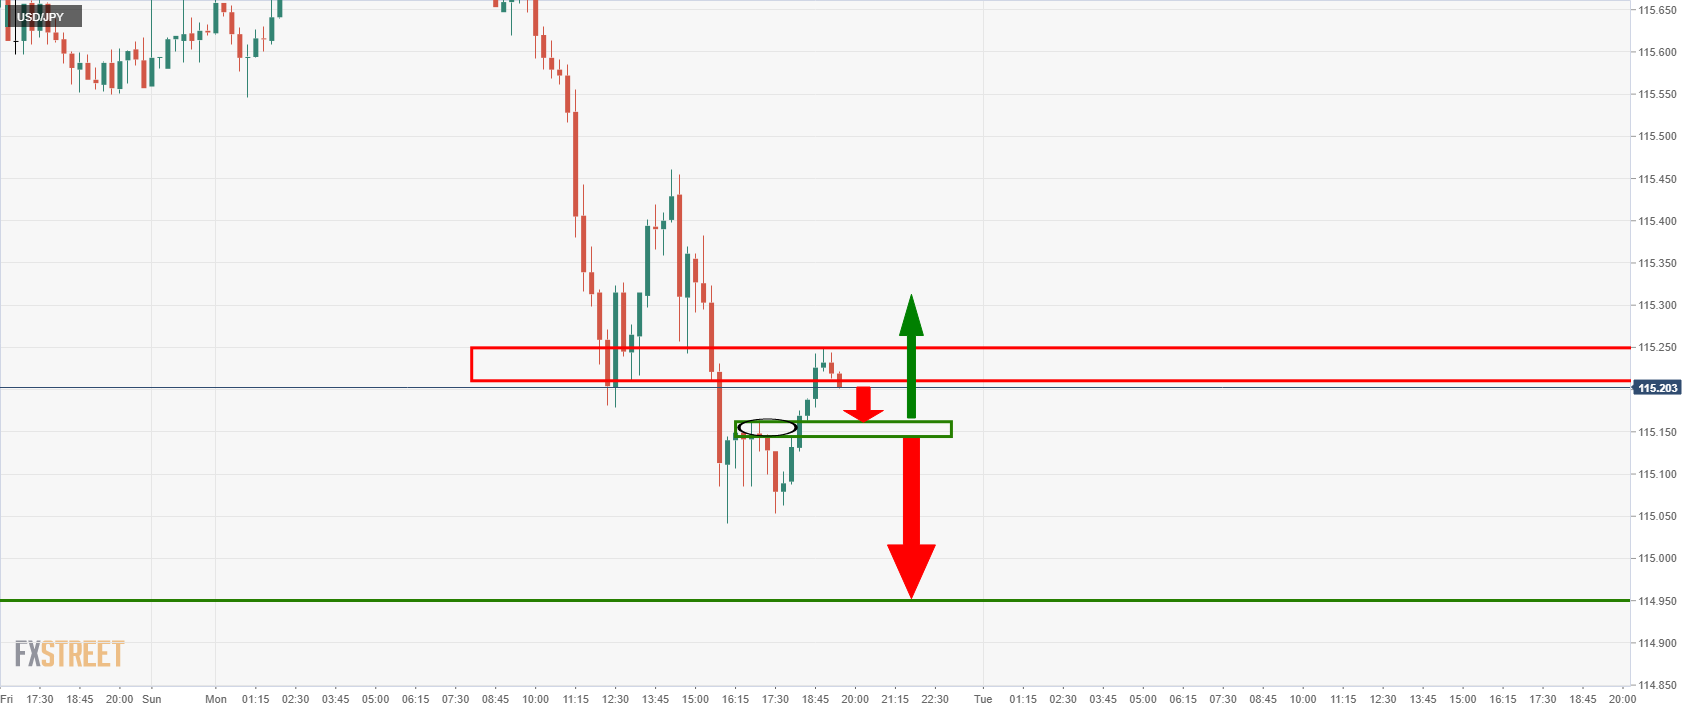
The price could be on the verge of a test of the neckline of the 15-min chart's W-formations as illustrated above. If this were to give, then the price would be expected to melt to test and break 115 the figure in the coming session. If on the other hand, the area holds, ten a re-run into 115.25 would be back on the cards. If the bulls engage, then 115.60 will be eyed:
- The euro keeps afloat above the 1.1300 figure, after reaching a daily low at 1.1284.
- High US Treasury yields, and omicron variant woes, spurred demand for safe-haven peers but the euro.
- The EUR/USD formed an ascending wedge that targets the 1.1090-1.1100 region.
The shared currency slides on Monday, trimming Friday’s gains down due to high US Treasury yields a headwind for the EUR/USD, while some companies are warning about the impact of the omicron coronavirus variant. At the time of writing, the EUR/USD is trading at 1.1325.
EUR/USD Price Forecast: Technical outlook
In the overnight session, the pair faced strong resistance at the 50-day moving average around 1.1346, though it was trading above it, slumped from 1.1360s to 1.1284 as the market sentiment worsened. The EUR/USD broke crucial support levels on its way south, like the daily pivot at 1.1338 and the S1 daily pivot at 1.1311.
From the EUR/USD daily chart perspective, the EUR/USD formed an ascending wedge, which has bearish implications, that in the event of breaking downwards, would target 1.1090, though it would face some hurdles on the way down.
The EUR/USD’s first support level is the January 4 daily low at 1.1272. A breach of the latter would expose December 15, 2021, pivot low at 1.1222, followed by the 2021 yearly low at 1.1186, and then the ascending wedge target around the 1.1090-1.1100 area.
On the flip side, to negate the EUR/USD’s downward bias, a clear break above December’s 31, 2021, cycle high at 1.1387 would open the door towards 1.1400, followed by a re-test of a nine-month-old downslope trendline around the 1.1425-50 area.
-637774393608554708.png)
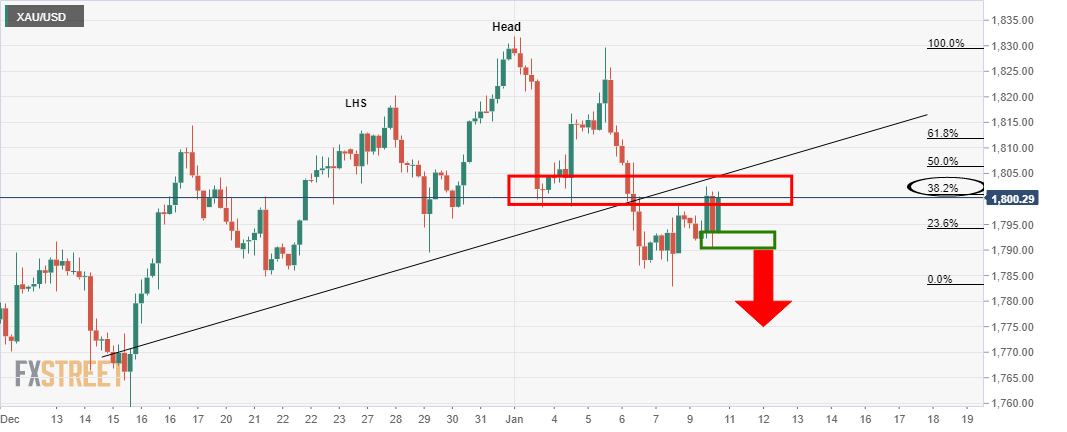
- Gold is a mix of geopolitics, the Fed and Omricon risks.
- Bears are looking for a break of $1,790 for a run to $1,770.
At $1,796, gold is flat for the day despite geopolitical risks back into the limelight, the US yields touching a two-year high and stocks looking into the abyss.
Gold remains in familiar ranges between $1,790.43 and $1,802.37. Traders are balancing an accelerated tapering at the Federal Reserve, which should also give officials the option of raising rates as soon as March, and the acceleration of omicron infections around the world.
Barely a month after its detection in southern Africa, the new Omricon COVID-19 variant was already dominant in countries around the world, with more cases than ever before, potentially making it the fastest spreading studied virus in history.
“It is the most explosive and the fastest-spreading virus in history,” a historian and physician, Anton Erkoreka, who is the director of the Basque Museum of the History of Medicine, said.
However, uncertainty remains over whether it is less serious for unvaccinated people and the immunocompromised. Nevertheless, even with fewer people getting really sick, hospitals are still strained.
Dr. Anthony Fauci, the US top infectious disease expert, recently told ABC News that the country is seeing "almost a vertical increase" in cases and that even a relatively lower rate of hospitalizations could strain already overwhelmed hospitals.
"We have got to be careful about that, because, even if you have a less of a percentage of severity, when you have multi-multi-multi-fold more people getting infected, the net amount is you're still going to get a lot of people that are going to be needing hospitalization," Fauci explained. "And that's the reason why we're concerned about stressing and straining the hospital system."
The same can be said for other market-relevant nations around the world that is likely a weight for global equities and a positive for gold as a safe haven for the foreseeing future.
Meanwhile, as analysts at TD securities explained, Investors had a mixed response to recent hawkish statements from the Federal Reserve and the acceleration of omicron infections around the world.
''On the one hand,'' the analysts said, ''the ever-louder hawkish tone from the Fed has prompted money managers to aggressively reduce long gold exposure, while on the other hand, concerns that a global slowdown due to covid in early-2022 may reduce pressure on central banks to introduce more restrictive policy.''
The latest data from the US, however, suggest that the Fed could be too hawkish in their forecasts. The Nonfarm Payrolls data showed that job growth in the US continues to slow and is now at an 11-month low. The Us dollar responded in kind by sliding in the aftermath of the report. However, it is attempting to recover.
''The fall in the unemployment rate and rise in earnings show inflationary pressures are building rapidly in the labour market,'' analysts at ANZ Bank said at the start of the week, nothing that this is consistent with the Fed tightening "relatively soon". Moreover, the analysts noted that ''Nonfarm Payrolls are still 3.6m shy of the pre-pandemic high, but due to a lack of supply, rather than demand, and that’s only adding to underlying inflation pressures.
Nevertheless, gold has moved slightly higher following the December payrolls report, even as wage inflation was higher-than-expected, which analysts at TD Securities suggest there may be more short-covering to come.
''The ever-louder hawkish tone from the Fed has prompted money managers to aggressively reduce long gold exposure, while on the other hand, concerns that a global slowdown due to covid in early-2022 may reduce pressure on central banks to introduce more restrictive policy and the likely hedging of risk drove specs to cover shorts in a robust way,'' the analysts said in reference to the latest CFTC positioning data.
The analysts argued in a note today that ''central banks will continue to buy gold, while investors are looking to diversify given a higher perceived risk of equity market volatility, suggesting that gold speculators' relative short positioning may still drive the yellow metal into the $1,850s/oz in the early months of 2022.''
In the same vein, US stocks have slumped at the start of this week, extending declines from last. The velocity of a recent surge in government bond yields unnerved investors.
The Nasdaq Composite has been leading the way and has sank to a low of 15,165.53 today. The index is currently down 1.6% but of its lows. The S&P 500 was down 1.2% and the Dow Jones Industrial Average is 1% lower at the time of writing, with both index also recovering from their lows of the day. All sectors were in the red on an intraday basis. Meanwhile, The 10-year US Treasury yield rose to 1.808% intraday, touching its highest intraday level since January 2020. The 10-year yield, which ended last year at 1.52%, surged to about 1.76% by the end of last week, a 24 basis-point jump in just five days.
Gold could be supported on geopolitical risks
Meanwhile, Kazakhstan is a risk for the commodity complex. The central Asian country is the world's biggest uranium exporter and is among the top oil and coal producers. The resource-rich state has seen some of the biggest public protests in years, unnerving energy amongst other commodity markets.
Days of unrest — set-off initially by a rise in fuel prices and eventually turning into an uprising against corruption and nepotism — prompted President Kassym-Jomart Tokayev to declare a state of emergency.
The demonstrations and the subsequent crackdown in the world's top uranium exporter and a major oil and gas producer have left investors anxious which could help support gold as a safe haven.
Gold technical analysis
There is a downside bias on the daily chart as per the head and shoulders taking shape.
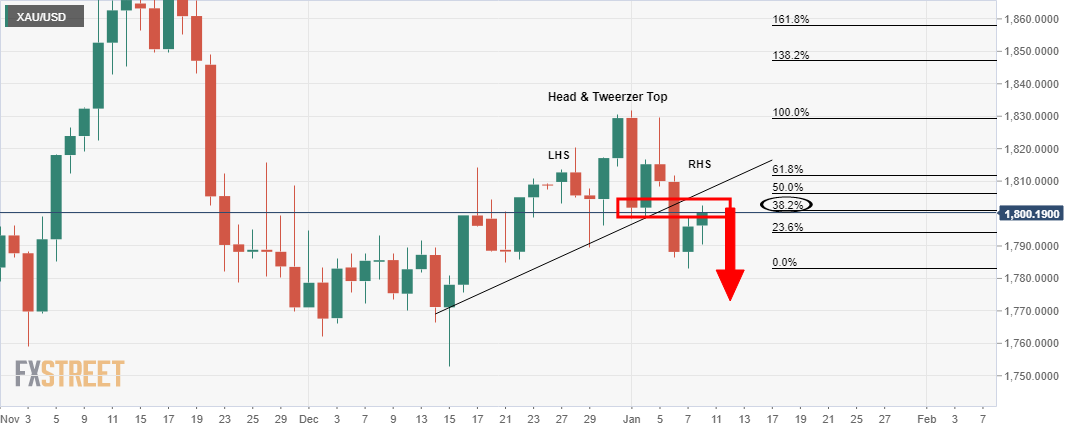
A break and retest of $1,790 4-hour support structure would be expected to lead to a downside continuation putting $1,770 on the map:
- Silver edges higher for the second consecutive day, up some 0.72%.
- Goldman Sachs and Deutsche Bank estimate four rate hikes in 2022, while JP Morgan brought forward its first hike to March.
- XAG/USD is downward biased as the 50-DMA crossed under the 100-DMA, spurring a $1.00 drop.
Silver (XAG/USD) advances during the New York session, despite the greenback rising firmly in the session, trading at $22.47 at the time of writing. Risk-appetite conditions remained dampened since the European session, spurred by expectations of higher rates as investors assess the last US employment report. Additionally, Goldman Sachs revealed that they expect four Federal Reserve rate hikes.
Some commercial banks expect four Fed hikes in the year
In the European session, a report emerged that Goldman Sachs, the North American investment bank, expects four hikes to the Federal Funds Rate. Also, the bank noted that the US central bank would begin reducing its balance sheet by July of 2022, if not earlier.
On Friday, JP Morgan brought forward the first rate hike from June to the March 2022 meeting. In the meantime, Deutsche Bank said it expects four increases to the Federal Funds rate (FFR) after the Nonfarm Payrolls report.
In the last week, FOMC’s December meeting minutes revealed that the Federal Reserve is ready to raise rates and discussed the possibility of reducing its $8 Trillion balance sheet that could begin as soon as the US central bank began raising rates.
In the meantime, in the bond market, the US 10-year benchmark note rises almost two basis points, up at 1.789%, a tailwind for the US Dollar Index, which advances some 0.40%, sitting at 96.15 at press time.
Market participants’ attention turns to US inflation data and the testimony of Federal Reserve policymakers Jerome Powell and Lael Brainard against the US Senate Banking Commission this week for more clues regarding the speed of monetary policy normalization.
XAG/USD Price Forecast: Technical outlook
Spot silver has a neutral-downward bias. The 50-day moving average (DMA) crossed under the 100-DMA on January 5, a bearish signal that propelled the white metal from $23.25 down to $22.00, a $1.00 fall.
On the downside, XAG/USD’s first support would be the January 7 daily low at $21.96. A breach of the latter exposes October 20, 2021, a daily low at $21.83, followed by December 15, 2021, a cycle low at $21.43.
- EUR/GBP has rebounded back above 0.8350 in recent trade and is flat on the day after hitting multi-year lows earlier.
- Many FX strategists continue to favour a lower EUR/GBP with the BoE/ECB policy divergence expected to widen further.
After hitting its lowest level since February 2020 earlier in the session at 0.8332 and, in doing so, marginally eclipsing the multi-year low it set last week at 0.8333, EUR/GBP has since rebounded back to the north of the 0.8350 level. As things stand, the pair is now back to trading flat on the day in the 0.8350s, with the bears likely to eye any retest of last week’s highs in the 0.8370 area as an opportunity to reload on short positions.
Indeed, shorting EUR/GBP has been a profitable strategy in recent weeks. Since 20 December, the pair has reversed more than 2.0% lower from around the 0.8550 mark, mainly as a result of fears surrounding the impact of the Omicron variant on the European and global economy subsiding. That’s evidence really started to compound in the week starting on 20 December that the new variant is far milder than anything seen before, resulting in the UK and other governments opting against lockdowns.
But sterling’s recent strength against the euro also likely reflects growing expectations of central bank divergence between the ECB and BoE. The UK government’s decision not to lockdown has kept the prospect of a second post-pandemic BoE rate hike in February alive. By contrast, the main debate at the ECB is currently about the appropriateness of its inflation forecast. Most recently, influential governing council member Isabel Schnabel said the ECB would need to act to curb inflation if it continued to surprise on the upside, joining a throng of others to espouse a similar view.
That implies that if the ECB is forced to upgrade its 2023 inflation forecast to substantially above 2.0% from its current 1.8%, then perhaps the central bank may axe its QE buying in 2022 and start tentatively hiking in 2023. Compare that to the BoE, which is seen implementing multiple rate hikes over the same timeframe to likely get the bank rate above 1.0%. The wide and growing divergence is one key reason why many FX strategists remain bearish on EUR/GBP and target an eventual retest of the late 2019/early 2020 lows under 0.8300.
- AUD/JPY fell below last week’s lows and its 200DMA in the 82.60s and is now under 82.50.
- The pair has been moving lower to reflect the continued downturn in US equity markets driven by Fed tightening fears.
- AUD traders will be watching November Australian Retail Sales data and how the Aussie Omicron outbreak develops this week.
As US equity markets continue where they left off with things last week by tumbling at the start of this week, risk-sensitive currencies have also been taking a hit. As a result, AUD/JPY, a particularly risk-sensitive currency pair given the AUD’s high beta to risk appetite versus the yen’s appeal as a safe-haven asset, has dipped below a key area of support in the 82.60s on Monday. The pair has now even dipped below the 82.50 mark, though the losses are for now being contained as the 21 and 50-day moving averages in the 82.43-82.48 area offer support.
But AUD/JPY’s tumble back from earlier session highs in the 83.30s saw it fall beneath its 200-day moving average at 82.65, which coincided with last week’s lows, a far more significant area of support to break. Should the 82.50 area, which has been an important zone of market balance in recent weeks, break, then AUD/JPY may well continue lower. Given a lack of notable areas of support to the immediate downside, short-term bearish speculators may bet on a drop all the way to test mid-December lows in the 80.50 area.
The main fundamental catalyst for Monday’s downturn in the pair, and more broadly in the market’s appetite for risk, are fears about Fed tightening and the impact on the US equity space. These fears may well be exaccerbated with a number of key Fed speaks on deck this week (including the Fed Chairman and Vice Chairwoman), as well as if Wednesday’s release of the December Consumer Price Inflation report comes in as hot as expected. That suggests downside risks for AUD/JPY.
Aussie fundamentals will also be a driver. Australian November Retail Sales figures are out on Tuesday and should show a continued decent pace of recovery from the recent lockdown induced contraction earlier in the year. But the latest numbers pertain to a time before Australia experiences its first (Omicron driver) serious Covid-19 outbreak, which has been accelerating since December. Wells Fargo note “the latest increase in cases has not seen any imposition of widespread restrictions so far, and we believe Australia remains on course for respectable economic growth this year”, while Credit Agricole notes that “if Australia’s omicron wave were to follow the South African pattern of cresting and coming off quickly, this would be a positive for the currency (AUD)”. Either way, it's an important theme for AUD traders to keep an eye on.
- The British pound falls in tandem with risk-sensitive currencies as market mood conditions dampen.
- The Japanese yen is the strongest currency of the day.
- GBP/JPY has an upward bias; despite falling 100-pips on the day, GBP bulls showed around the 156.00 figure.
On Monday, the British pound plunges against the safe-haven Japanese yen, on a risk-off market mood, spurred by expectations of higher rates in the US and worldwide inflationary pressures. Equity indices record losses between 1.39% and 2.44% in the US, while the Japanese yen gain against most G8 currencies. At the time of writing, the GBP/JPY is trading at 156.13.
In the overnight session for North American traders, the GBP/JPY pair was subdued in the 157.00-40 range. However, a break of an upslope trendline amid dampened market conditions spurred a 100-pip drop from 157.00 to 156.00, which fulfilled the Average Daily Range (ADR) of the cross-currency for the last ten days, of 98 pips.
GBP/JPY Price Forecast: Technical outlook
The GBP/JPY pair is upward biased. The daily moving averages (DMAs) reside below the spot price, but the high reached on January 5 at 157.76, short of October 20, 2021, daily high at 158.22, exposed the pair to downward pressure, leaving it at the mercy of the market mood.
To the upside, the first resistance level would be the 200-hour simple moving average (SMA) at 156.20. A decisive break above that level would expose the S2 daily pivot at 156.47, followed by the S1 daily pivot at 156.76.
On the downside, the first support would be the psychological 156.00 figure which almost intersects with the S3 daily pivot at 155.97. A breach of the latter would expose the January 4 daily low at 155.34. and then the January 3 daily low at 154.90.
-637774292448187618.png)
Uncertainties around Brexit remain but the influence on the exchange rate will diminish further according to analysts at MUFG Bank They forecast GBP/USD at 1.3170 by the end of the first quarter and at 1.3730 by the third. Regarding the EUR/GBP they forecast at 0.8350 by the end of Q1 and at 0.8300 by Q3.
Key Quotes:
“The pound was the second best performing G10 currency in 2021 which we believe in part reflects some catch-up after being the third worst performing G10 currency in 2020. The global lead in covid vaccinations played an important role in GBP performance over the whole year.”
“Like with a number of other G10 countries, the OIS market pricing for rate hikes this year looks excessive to us. At the time of writing, the 1-year forward OIS implies close to 100bps of monetary tightening. After the annual CPI jump in November to 5.1%, the BoE acknowledged in its December statement when it raised rates that inflation would hit 5.0% through the winter months and peak at about 6.0% in April, reflecting the jump in utility bills. But under this scenario, the MPC guidance in December was that further “modest tightening” of monetary policy would be required. We do not view what is priced in the OIS market over the next 12mths as modest and we suspect at some stage in the coming months, the markets will pare back monetary tightening expectations.”
“This paring back of rate hike expectations will see GBP underperform versus the US dollar before gains materialise in the second half of the year. By then we assume the uncertainty over the Northern Ireland protocol will have been resolved. There is of course a risk that this issue escalates again and undermines GBP performance but we suspect each passing year will see less and less impact in FX from Brexit uncertainties. Problems related to the rising cost of living at a time of rising taxation will dominate the political landscape this year.”
“We are maintaining our profile of GBP underperformance initially versus the US dollar before recovery takes hold later in the year. The BoE signalling greater caution perhaps following a Feb rate hike will curtail GBP strength over the near-term.”
- NZD/USD recently slipped back to the 0.6750 level as the dollar picks up amid safe-haven flows.
- The kiwi and other risk-sensitive currencies are performing poorly as equities tumble amid Fed tightening fears.
NZD/USD has dipped back to the 0.6750 level in recent trade and has recently been probing last week’s lows in the 0.6740 area. At present, the pair trades with losses of about 0.5%, worse than that of its antipodean counterpart, but roughly in line with that being seen in other USD majors. Having failed in its early European session attempts to test its 21-day moving average in the 0.6780s, NZD/USD has come under selling pressure as markets adopt a more risk-off posture during US trade. Further risk-off induced USD strength may see the pair break lower towards a test of December lows in the 0.6700 area.
The yen and US dollar are the best performing G10 currencies amid a safe-haven bid as Wall Street continues to crater. Notably, the Nasdaq 100 index recently fell more than 10% back from its recent record highs, classing the latest downturn for the big-tech heavy index as a “correction”. This is undermining the appeal of risk-sensitive currencies such as the kiwi. The main driver of risk-off at the start of the new week appears to be fears regarding a faster pace of Fed monetary policy normalisation this year.
Risk appetite has been ropey since last week’s hawkish Fed minutes that showed strong support on the FOMC for the Fed to get going with rate hikes and balance sheet reduction in 2022. Last Friday’s strong US labour market report, strong in the sense that wage inflation picked up and measures of slack (such as the unemployment rate) improved more than expected, at least, is being viewed as endorsing the Fed’s newer, more hawkish mantra. US Consumer Price Inflation (CPI) data on Wednesday is expected to do the same, as it is likely to show headline inflation surpassing 7.0% YoY.
Fed Chair Jerome Powell will be speaking on Tuesday and Vice Chairwoman Lael Brainard on Thursday at their respective nomination confirmation hearings. These remarks will be the highlights as far as Fed rhetoric is concerned this week, though other FOMC members will also be orating. There is also the (not so) small matter of the US December Retail Sales report on Friday and the preliminary January University of Michigan Consumer Sentiment survey, with the latter a timely gauge on the economic impact of the spread of Omicron. Risk appetite and USD flows will be the dominant force for NZD/USD this week, with New Zealand Building Consents data on Thursday unlikely to receive much market attention.
Analysts at MUFG Bank, forecast the USD/INR pair at 74.00 by the end of the first quarter, at 73.50 by the third quarter and at 74.00 by the end of the year.
Key Quotes:
“The Indian rupee’s 1.7% drop against the US dollar in 2021 was one of the least amongst Asia ex-Japan currencies. This is despite the US dollar heft and swing in the current account to an estimated deficit at 0.8% of GDP in 2021 from 2020’s surplus at 1.3% of GDP. The rupee’s resilience underscores the impact from substantial capital flows mainly driven by a record amount of funds raised via IPOs in 2021. This is a key factor that would continue to keep the rupee supported even in the midst of US dollar strength in Q1 as a few blockbuster IPOs are in the pipeline. This is in addition to the potential inclusion of Indian government bonds into a few global bond indices for the first time, with the announcement expected in Q1.”
“Passive inflows into Indian government bonds due to the inclusion are estimated to be at least USD40bn, concentrated in 1H22. This will lend further support to the rupee. But when those inflows start to taper and IPO activity moderates, we expect the rupee to be back on a structural depreciation trend in 2H22 driven in part by the deterioration of India’s current account deeper into negative territory. This is in view of the widening of trade deficits as imports increase amid ongoing recovery in private consumption.”
Analysts at the National Bank of Canada point out that despite the uncertainty created by the latest COVID variant, they remain comfortable with their current forecast of USD/CAD pair at 1.20 in 2022.
Key Quotes:
“We still expect the loonie to appreciate further in the coming months. For one, global manufacturing production continues to expand at a relatively brisk pace.”
“Rising commodity prices, a current account surplus, a strong labour market and positive interest rate differentials argue for an appreciation of the Canadian dollar. According to our model, the CAD remains significantly undervalued against the greenback
“Despite the uncertainty created by the latest COVID variant, we remain comfortable with our current forecast of a C$1.20 rate for the US dollar in 2022.”
The Euro is set to grind lower for now, according to analysts at MUFG Bank. They point out the European Central Bank view inflation riks different to elsewhere. Their forecast is for EUR/USD to drop to 1.10 by the end for the first quarter and to recovery to 1.14 by the third quarter.
Key Quotes:
“Omicron looks set to be more disruptive in Europe than in the US and hence the ECB monetary stance will continue to be viewed as well behind that of the Fed. EUR/USD did bounce in December but we view this as reflective of positioning liquidation and a seasonal bias that favours EUR in December. Q1, and January in particular, tends to be the worst seasonal period for EUR and we expect EUR/USD to fall and possibly breach the 1.1000 level through the course of Q1 and into Q2.”
“While the ECB policy stance is set to weigh on EUR, the macro backdrop should limit the downside. At the end of December Italy passed a EUR 32bn spending plan that includes tax cuts while the EU Recovery Fund impact should be seen more widely across the EU this year. Furthermore, while there is likely to be some uncertainty related to the French presidential election in April, the polling data suggests a reduce risk of any surprise defeat for President Macron. While EUR/USD could hit 1.1000 or below over the coming months, more positive factors and ECB liquidity withdrawal should see EUR/USD rebound in H2 to our year-end target of 1.1600.”
- The S&P 500 has dipped under 4600 and is down another more than 1.5% as the equity downturn continues.
- Concerns about Fed tightening and higher US bond yields continue to be the main driver of the selling.
The equity bears have picked up where they left off with things last week, with US equity markets back under severe selling pressure on Monday shortly after the US open. The S&P 500 index, the futures of which were trading about 0.5% lower in pre-market trade, has accelerated to the downside in recent trade. The index recently dipped below the 4600 level. Bears will be looking for a test of the late-December lows in the 4530s and below that a test of the early December lows at 4500.
There hasn’t been much by way of fresh fundamentals to drive the downside, which instead seems driven by a continuation of some of the bearish themes that were at play last week. Chief among them is concern about an accelerated pace of Fed monetary tightening in 2020 that was initially triggered in wake of last week’s Fed minutes – recall that the minutes showed that FOMC participants agreed that rate hikes would soon be warranted to combat inflation so long as the labour market continues to tighten and progress.
Last Friday’s December US jobs report showed that it did both of those things, with a further 200K jobs added and the unemployment rate dropping under 4.0% for the first time since onset of the pandemic. Thus, the report has been widely interpreted as endorsing a potential Fed rate hike as soon as March and a prompt start to quantitative tightening soon thereafter and a chorus of institutions/analysts have been publically revising their Fed policy calls in a more hawkish direction. Long-term bond yields continue to march higher, with the US 10-year above the key 1.80% level, which once cleared should open the door to a run at 2.0%.
Higher long-term yields are having their usual impact on different equity sectors, with growth/big-tech stocks underperforming amid their greater sensitivity to higher opportunity cost that higher yields represent. The tech-heavy Nasdaq 100 is down over 2.0% and has now cratered below December lows in the 15.5K area to trade in the 15.2K area. Value/cyclical stocks that have a tighter correlation to the economy’s underlying performance and tend to perform better in an environment of rising rates are holding up better. The Dow, which has a higher weighting towards these sectors, is by comparison down under 1.5% and trade close to 35.75K after it lost the 36.0K level shortly after the open.
The Fed tightening story will receive further inputs this week with a heavy slate of Fedspeak on the calendar, including nomination hearings for Fed Chair Jerome Powell and Vice-Chair Lael Brainard. Meanwhile, what analysts expect to be a very hot December US Consumer Price Inflation report on Wednesday is likely to increase the inflation discomfort being felt at the Fed ahead of its 26 January meeting. If the net result of all this is a further increase in hawkish Fed bets coupled with further upside in US bond yields, that would likely mean that Monday’s equity market downside is just the beginning of what could be a very rough week. Dip buying has been a profitable strategy in the post-pandemic world, but its future reliability is in serious doubt as the Fed removes the monetary coolaid so supportive of equities in recent years.
- Risk-sensitive currencies edge lower in the North American session.
- Goldman Sachs expects four Fed hikes in 2022, per Reuters.
- AUD/USD is downward biased, retreated from an upslope support-trendline turned resistance.
The Australian dollar slides as the North American session begins, in a risk-off-dominated session, as portrayed by US equity futures indices, point towards a lower open. In the meantime, the AUD/USD is trading at 0.7154 at the time of writing.
Some market participants and a US Bank expects four Fed hikes in 2022
In the mid-European session, a report said that Goldman Sachs, the North American investment bank, expects four hikes to the Federal Funds Rate. Also, the bank noted that the US central bank would begin reducing its balance sheet by July of 2022, if not earlier.
That comes as the last Federal Reserve minutes said that the central bank is ready to hike rates and would also begin the Quantitative Tightening (QT), as it scrambles to drag inflation lower from close to 7%. According to the minutes, the balance-sheet reduction would probably kick-in in tandem with the Fed first-rate hike.
Meanwhile, the market mood environment benefits the safe-haven peers, like the US dollar. The US Dollar Index, which tracks the greenback’s value against its peers, advances firmly 0.45%, sitting at 96.15.
In the bond market, the US !0-year Treasury yield, one of the barometer’s for inflation, sits at 1.806%, a tailwind for the greenback, to the detriment of the risk-sensitive Australian dollar.
At press time, the US economic docket featured Wholesale Inventories for November on a monthly basis, up some 1.4%, higher than the 1.2% estimated but short of October’s reading at 2.5%.
AUD/USD Price Forecast: Technical outlook
The AUD/USD is downward biased. The daily moving averages (DMAs) reside above the spot price, with the 50-DMA with a bearish slope. Also, the AUD/USD broke below an upslope trendline drawn in December 2021 lows in the last two trading days.
In the overnight session, the AUD/USD daily high was around 0.7200s, testing the previous-mentioned trendline to retreat towards the 0.7150s price level amid dampening market conditions.
On the downside, the AUD/USD first support would be the January 7 daily low at 0.7130. A breach of the latter would expose the December 20, 2021, pivot low at 0.7082, followed by the December 3, 2021, cycle low at 0.6993.
- US dollar gains momentum as market sentiment deteriorates.
- DXY up 0.40%, US 10-year yields back at 1.80%.
- GBP/USD is still bullish but facing strong resistance at 1.3600.
The GBP/USD dropped further from above 1.3600 and printed a fresh daily low at 1.3531. It remains near the lows, under pressure amid a stronger US dollar across the board.
The greenback benefit from deterioration in market sentiment and higher US yields. The Dow Jones is falling 1.40% and the Nasdaq tumbles 2.23%. Treasury bonds are not being helped from the risk aversion tone. With US yields holding near recent highs, DXY rose further. The index gains 0.40% and trades at 96.10.
Technical outlook
“GBP/USD is trading in an uptrend, benefiting from upside momentum on the daily chart and surpassing the 50 and 100-day SMAs on its way up. For the scenario of a fall in the next month to materialize, it would need to break below this uptrend support line. Horizontally, 1.3480, 1.3430, and critically 1.3380 provide support. Further below, 1.3280 and 1.32 are eyed, before the December trough of 1.3175”, said Yohay Elam, Analyst at FXStreet.
On the upside, GBP/USD could face immediate resistance at 1.3565. Above the critical level continues to be the 1.3600 area. A consolidation above is needed to open the doors to more gains.
Technical levels
- USD/TRY posts modest gains and eyes a test of 14.0000.
- The pair looks side-lined between 13.00 and 14.00 so far.
- Turkey’s Unemployment Rate remained at 11.2% in November.
The Turkish lira depreciates further and pushes USD/TRY back to the proximity of the 14.00 hurdle at the beginning of the trading week.
USD/TRY stays capped by 14.00… for now
USD/TRY resumes the upside albeit at a slow pace on Monday, managing at the same time to leave behind Friday’s inconclusive price action.
Despite starting the new year on a positive footing, the lira quickly returned to the normality and depreciated to the vicinity of the 14.00 mark vs. the US dollar in the subsequent sessions, in the usual context of heightened fragility and uncertainty surrounding the next steps of the Turkish central bank, at a time when politics could intensify its pressure on the monetary policy.
Indeed, investors’ attention could shift to the political scenario, where speculation of earlier presidential and parliamentary elections (originally due in late June 2023) seems to have picked up pace against the backdrop of latest poll results showing support to President Erdogan diminished somewhat.
In the domestic calendar, Turkey’s jobless rate stayed unchanged at 11.2% in November, while the employment rate improved a bit to 46.6% in the same period.
What to look for around TRY
The ongoing recovery in the pair seems to have met an initial tough resistance in the 14.00 area so far. The higher-than-expected inflation figures released at the beginning of the year put the lira under extra pressure in combination with some cracks in the confidence among Turks regarding the government’s recently announced plan to promote the de-dollarization of the economy. In the meantime, the reluctance of the CBRT to change the (collision?) course and the omnipresent political pressure to favour lower interest rates in the current context of rampant inflation and (very) negative real interest rates are forecast to keep the domestic currency under intense pressure for the time being.
Key events in Turkey this week: Unemployment Rate (Monday) - Current Account (Tuesday) - Industrial Production (Thursday).
Eminent issues on the back boiler: Progress (or lack of it) of the government’s new scheme oriented to support the lira. Constant government pressure on the CBRT vs. bank’s credibility/independence. Bouts of geopolitical concerns. Much-needed structural reforms. Growth outlook vs. progress of the coronavirus pandemic. Potential assistance from the IMF in case another currency crisis re-emerges. Earlier Presidential/Parliamentary elections?
USD/TRY key levels
So far, the pair is gaining 0.33% at 13.8620 and a drop below 12.7523 (weekly low Jan.3) would pave the way for a test of 12.0478 (55-day SMA) and finally 10.2027 (monthly low Dec.23). On the other hand, the next up barrier lines up at 13.9319 (YTD high Jan.10) followed by 18.2582 (all-time high Dec.20) and then 19.0000 (round level).
- EUR/USD has dipped back under 1.1300 and is now below its pre-US jobs data levels from last Friday.
- Hawkish remarks from ECB’s Schnabel in wake of last Friday’s hot Eurozone inflation have been ignored.
- FX markets remain primarily focussed on incoming US data and the Fed right now.
EUR/USD has on Monday returned back to or even slightly below its pre-US labour market data levels where it traded last Friday and has in recent trade dipped under the 1.1300 handle. To recap, the latest US labour market report revealed a weaker than expected headline payroll gain in December but stronger than expected measures of economic slack and wage growth in December. In the wake of the report – and despite the near-unanimous interpretation by analysts that it endorses the emergent Fed stance that accelerated monetary tightening in 2022 is warranted – EUR/USD broke to the north of a short-term pennant structure and went as high as 1.1360 (from previously just above 1.1300).
Whilst technical buying and dollar-profit taking were attributed as behind the pair’s post-jobs data bounce, analysts at the time warned that the move went against recent fundamental developments. Indeed, last week’s sharp surge in US government bond yields as markets price in a more aggressive Fed tightening cycle (that includes quantitative tightening to commence this year) points to a stronger, not weaker dollar. EUR/USD trade on Monday now seems to be corroborating that view. Strategists are warning that the USD’s recovery against the euro may be set to continue this week amid an incoming chorus of Fedspeak which will likely back up the hawkishness of last week’s minutes, as well as December Consumer Price Inflation.
Ahead of the release of the CPI report on Wednesday – which is expected to show inflationary pressures continued to heat up at the end of 2022, pushing headline CPI above 7.0% YoY – a chorus of analysts have been bringing forward Fed tightening bets. The December labour market report “was consistent with the Fed's evolving view that the labour market is getting close to or is already at maximum employment with wage pressures building” analysts at NatWest Markets remarked. “This should add to speculation about a March hike, and we have pulled our expectation for the Fed's lift-off to occur in March instead of June,” analysts at the bank added, whilst Goldman Sachs announced that they now expect four 25bps rate hikes in 2022 versus their previous forecast for three. “The Fed is likely to feel the pressure from this early additional price pressure and feel compelled to start the hiking cycle even as soon as the March meeting,” said an analyst at RBC Capital Markets.
With the focus primarily on US data and the Fed this week, FX markets seem to be ignoring developments that increasingly point to an increasingly hawkish ECB. In the wake of last Friday’s hotter than expected Eurozone HICP inflation numbers, influential ECB governor Isabel Schnabel was on the wires over the weekend echoing some of the rhetoric that up until only very recently was only espoused by the central bank’s hawks. Schnabel said that rising energy prices may force the ECB to stop “looking through” elevated inflation and instead act to temper it, particularly if the green transition proves more inflationary than expected. Elsewhere, the EU Sentix Index for January was out on Monday and showed a surprise improvement, indicative of expectations amongst Eurozone investors that Omicron will not inflict lasting economic damage.
- EUR/USD starts the week deep into the red territory.
- Further downside opens the door to a retest of 1.1270.
EUR/USD fades Friday’s strong advance and returns to the sub-1.1300 area at the beginning of the week.
The lack of a firm direction in either way should prompt the pair to maintain the current consolidative move, at least in the very near term. The initial up barrier is located past the 1.1380 level (January 3), while sellers should meet contention near 1.1270 (January 4).
The broader negative outlook for EUR/USD is seen unchanged while below the key 200-day SMA at 1.1740.
EUR/USD daily chart
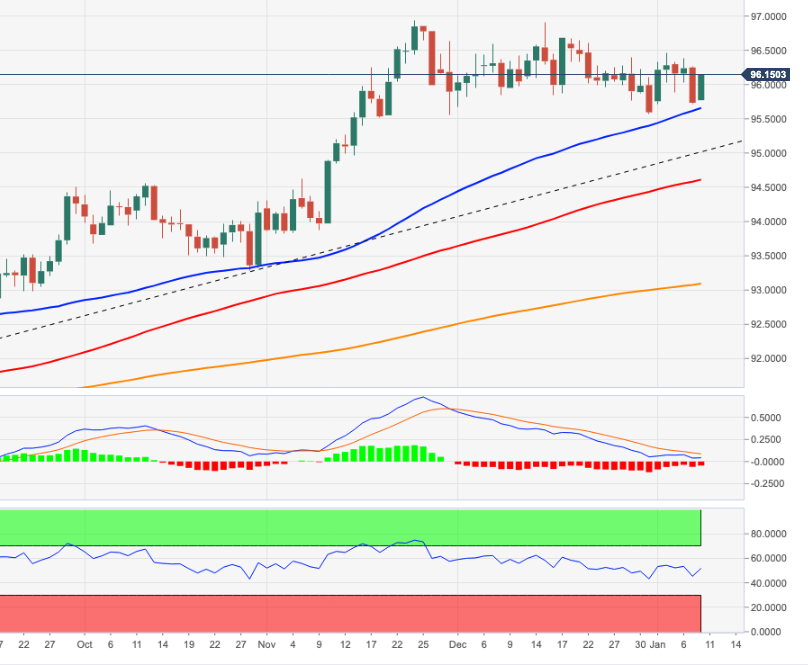
- DXY regains composure and advances above 96.00.
- The next target of note is seen at the 96.50 region.
DXY manages to regain the smile and reclaim the 96.00 barrier and above at the beginning of the week.
In case the buying pressure regains conviction, then the next hurdle of relevance should come at the so far YTD high at 96.46 (January 4) ahead of December’s high at 96.90 (December 15).
In the meantime, while above the 4-month support line (off September’s low) around 95.00, further gains in DXY are likely. Looking at the broader picture, the longer-term positive stance remains unchanged above the 200-day SMA at 93.07.
DXY daily chart
- Resurgent USD demand pushed USD/CHF to a near three-week high on Monday.
- Hawkish Fed expectations, elevated US bond yields extended support to the USD.
- The cautious mood could underpin the safe-haven CHF and cap gains for the pair.
The USD/CHF pair added to its strong intraday gains and shot to a nearly three-week high, around mid-0.9200s during the early North American session.
Following Friday's post-NFP retracement slide, the USD/CHF pair caught fresh bids on the first day of a new week and was supported by a strong pickup in the US dollar demand. As investors looked past the mixed US monthly jobs report, the greenback made a solid comeback amid elevated US Treasury bond yields.
In fact, the yield on the benchmark 10-year US government bond shot to the 1.80% threshold amid the prospects for a faster policy tightening by the Fed. The money markets have fully priced in the possibility of an eventual Fed lift-off in March and are anticipating four interest rate hikes by the end of 2022.
The strong intraday move up could further be attributed to some technical buying above the 0.9230 resistance zone. A subsequent strength beyond a strong horizontal zone, around the 0.9250 supply zone, will be seen as a fresh trigger for bullish traders and set the stage for a further near-term appreciating move.
Meanwhile, an extended selloff in the US bond markets tempered investors' appetite for perceived riskier assets, which was evident from the cautious mood around the equity markets. This could undermine the safe-haven Swiss franc and cap the USD/CHF pair amid absent relevant economic releases from the US.
Investors might also prefer to wait on the sidelines ahead of this week's key event/data risks, starting with Fed Chair Jerome Powell's testimony on Tuesday. Apart from this, traders will also take cues from the release of the latest US consumer inflation figures on Wednesday and the US monthly Retail Sales data on Friday.
Technical levels to watch
Economist at UOB Group Enrico Tanuwidjaja reviews the latest FX reserves figures in Indonesia.
Key Takeaways
“Indonesia’s foreign exchange reserves decreased to USD144.9bn in December 2021; down by USD1.0bn from the previous month.”
“The decrease of reserve assets in December was attributable to the repayment of the government’s external debt.”
“Bank Indonesia views that the official reserve assets will remain adequate with several responsive policies to support long-term economic recovery.”
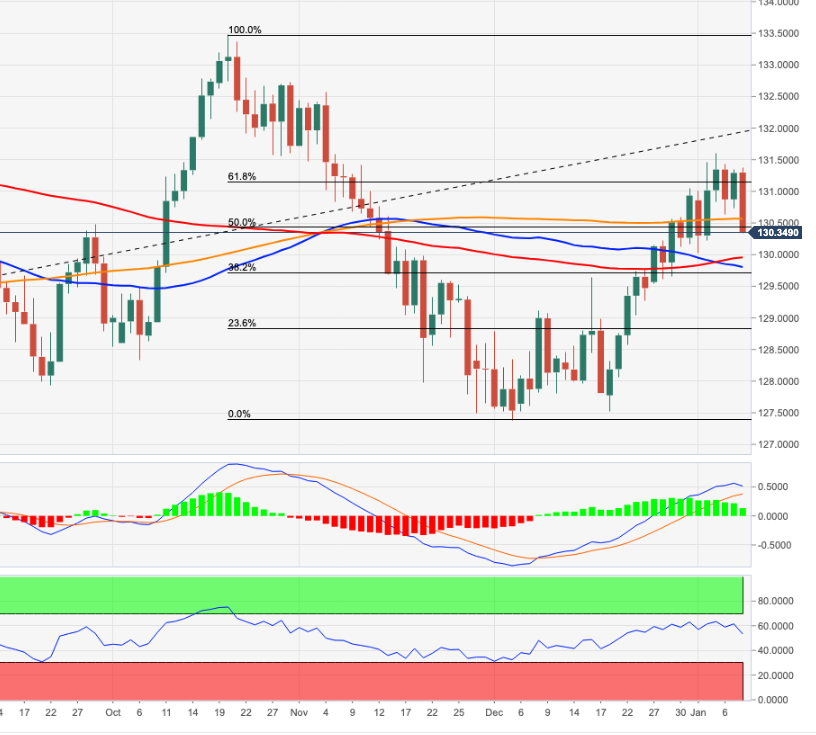
- EUR/JPY resumes the downside and breaches 131.00.
- Further decline exposes a test of the 130.00 zone.
EUR/JPY posts moderate losses and return to the sub-131.00 area at the beginning of the week.
Sellers seem to have regained the upper hand and now push the cross below the key 200-day SMA, today at 130.52. Extra losses now seem likely, with the initial target at the monthly low at 130.04 (January 3) ahead of the temporary contention at the 100-day SMA at 129.92.
While below the 200-day SMA the near-term outlook for EUR/JPY should remain negative.
EUR/JPY daily chart
- Gold is subdued just under the $1795 mark, having failed to rally above the 21 and 50DMA and $1800 level.
- XAU/USD is at risk of incurring further losses this week if US data and Fedspeak ignite further hawkish Fed bets.
The fact that spot gold (XAU/USD) has thus far this Monday failed to sustain attempts at breaking to the north of its 21 and 200-day moving averages, both of which sit between the $1798 and $1800 levels, may prove a bearish signal. The precious metal was battered last week as US real and nominal yields surged in the lead up to and aftermath of a resoundingly hawkish Fed minutes release, with spot prices cratering from highs at $1830 to under the big figure. For now, the precious metal is content to trade in the mid to low $1790s and at current levels just under $1795 it only trades lower by about 0.1% on the day. Lackluster trading conditions in the spot gold market reflect subdued trading conditions in US bond markets and the fact that though the US dollar is firmer on the day, it continues to trade well within recent ranges and well below recent highs.
But market strategists have been warning of the very real risk that hawkish Fed vibes return as the dominant market driver again this week, meaning upside risks to US real yields and the US dollar (and downside risks for gold). Wednesday sees the release of the December US Consumer Price Inflation report which will probably see headline inflation go above 7.0% YoY and Core inflation move above 5.0% YoY. That, coupled with last Friday’s December labour market report which showed further declines in the unemployment rate, further hotting up of wage growth and improvement in other measures of slack, out to strengthen the Fed’s conviction that prompt monetary tightening in 2022 is appropriate.
Fed members including Fed Chair Jerome Powell and Vice-Chair Lael Brainard will have the opportunity to orate this week and react to the latest labour market report. Powell and Brainard will be speaking at their nomination confirmation hearings on Tuesday and Thursday respectively. Other US data worth watching include the December Retail Sales report and the University of Michigan’s preliminary January Consumer Sentiment survey, both out on Friday. Ultimately, if the dollar can regain some composure and rally above 2021 highs (which are around 97.00 for the DXY) and if US real yields can continue their recent push back towards zero, this signals further losses for gold. Key levels of near-term support to watch are the December $1750 low and the September lows just above $1720.
- A combination of supporting factors assisted USD/CAD to reverse an early dip to a one-month low.
- Retreating oil prices undermined the loonie and remained supportive amid resurgent USD demand.
The USD/CAD pair rallied over 50 pips from over one-month low touched during the mid-European session and jumped to the 1.2665 region, or a fresh daily high in the last hour.
Having shown some resilience below the 100-day SMA, the USD/CAD pair staged a goodish intraday bounce from the 1.2610 region on Monday and was supported by a combination of factors. Crude oil prices edged lower for the second successive day and moved further away from a near two-month high touched on Friday. This, in turn, undermined the commodity-linked loonie and acted as a tailwind for the major amid a strong pickup in the US dollar demand.
The greenback made a solid comeback on the first day of a new week amid elevated US Treasury bond yields, bolstered by the prospects for a faster policy tightening by the Fed. In fact, the money markets have fully priced in the possibility of an eventual lift-off in March and anticipate four interest rate hikes by the end of 2022. This, in turn, continued pushing the US Treasury bond yields higher and extended some support to the greenback.
Meanwhile, a prolonged sell-off in the US bond markets tempered investors' appetite for perceived riskier assets, which was evident from the prevalent cautious mood around the equity markets. This was seen as another factor that benefitted the greenback's relative safe-haven status and provided an additional boost to the USD/CAD pair. It, however, remains to be seen if bulls are able to capitalize on the move amid absent relevant fundamental catalyst.
Moreover, investors might also refrain from placing aggressive bets and wait on the sidelines ahead of this week's important event/data risks, starting with Fed Chair Jerome Powell's testimony on Tuesday. This will be followed by the US consumer inflation figures on Wednesday and the US monthly Retail Sales data on Friday. Apart from this, the US bond yields will influence the USD, which along with oil price dynamics would provide a fresh impetus to the USD/CAD pair.
Technical levels to watch
- USD/JPY turned lower for the fourth successive day and dropped to a one-week low on Monday.
- The prevalent cautious mood benefitted the safe-haven JPY and exerted some downward pressure.
- A strong pickup in the USD demand did little to impress bulls or stall the ongoing corrective slide.
The USD/JPY pair dropped to a one-week low during the mid-European session, with bears now eyeing a move to challenge the key 115.00 psychological mark.
The pair struggled to capitalize on its intraday move up, instead met with a fresh supply near the 115.85 region and turned lower for the fourth successive day on Monday. The downfall dragged the USD/JPY pair further away from a five-year high touched last week and was sponsored by reviving demand for the safe-haven Japanese yen.
The US Treasury bond yields prolonged their recent strong move up amid growing acceptance for an eventual Fed lift-off in March 2022. The market bets were reaffirmed by Friday's release of the US jobs report, which highlighted a tight labour market and pushed the yield on the benchmark 10-year US government bond to a two-year high.
An extended sell-off in the US bond markets weighed on investors' sentiment, which was evident from a cautious mood around the equity markets. This, in turn, forced investors to take refuge in traditional safe-haven currencies, including the JPY, which was seen as a key factor that exerted some downward pressure on the USD/JPY pair.
Meanwhile, the downtick seemed rather unaffected by a strong pickup in the US dollar demand, bolstered by elevated US bond yields. It, however, remains to be seen if the ongoing corrective pullback marks the end of a one-month-old up-trend or attract fresh buying at lower levels amid absent relevant market-moving macro data from the US.
Market participants now look forward to Fed Chair Jerome Powell's testimony on Tuesday. This will be followed by the latest US consumer inflation figures on Wednesday, which along with Friday's release of the US Retail Sales data will influence the USD price dynamics and provide some meaningful impetus to the USD/JPY pair.
Technical levels to watch
- WTI has started the week in subdued fashion, currently trading about 50 cents lower just under $78.50.
- Oil markets are weighing up themes this week including US inflation, supply disruptions and Omicron outbreaks in China.
Oil is in the red at the start of the week, with front-month WTI futures currently down about 50 cents on the session and probing the low-$78.00s, as the gradual pullback from last week’s highs above $80.00 continues. The price action thus far this Monday has been fairly uninspired, with WTI so far contained within a low-$78.00 to mid-$79.00 range. Newsflow has been fairly light, allowing market participants time to mull some of the ongoing macro themes.
On which note, macro focus will be on this week’s US Consumer Price Inflation data out on Wednesday which could impact market expectations as to whether the Fed is going to hike interest rates in March or not. The theme of Fed tightening has been the major talking point and driver of equity, bond and FX markets in recent days, but crude oil has also been focused on supply-side dynamics. Oil prices were supported last week by news of a significant near-term setback to production in Libya and as protests in Kazakhstan disrupted output there. While there is not yet any signs of production recovery in the former, the President of Kazakhstan said that the situation there is now back under control, easing fears that the country’s 1.6M barrels per day in output would face disruption.
Market commentators have also noted that China lockdowns are likely to be an important theme in crude oil markets looking ahead. Various Chinese cities are reporting instances of local transmission of the Omicron variant, the spread of which in China is seen as a key test of the country’s zero Covid-19 approach. After uncovering Omicron infections, the northern city of Tianjin has tightened exit controls, while the centrally located Henan province has also reported cases. Analysts at OCBC Bank said that authorities are likely to maintain their zero-Covid strategy ahead of the Beijing Winter Olympics this February and that the economy is likely to suffer “more short-term disruptions from more frequent lockdowns”.
USD/IDR seen navigating the 14,240-14,380 range for the time being, noted Quek Ser Leang at UOB Group’s Global Economics and Markets Research.
Key Quotes
“While we indicated last Monday that ‘downward pressure has eased’, we expected USD/IDR to ‘trade between 14,200 and 14,330’. However, USD/IDR soared to a high of 14,398 before pulling back sharply. The sharp pullback amid overbought shorter-term conditions suggests that USD/IDR is unlikely to strengthen further.”
“For this week, USD/IDR is more likely to consolidate and trade between 14,240 and 14,380. Looking ahead, the bias is tilted to the upside as long as the rising trend-line support (currently at 14,210) is not breached.”
Extra gains in USD/MYR could retest the 4.2200 level, suggested Quek Ser Leang at UOB Group’s Global Economics and Markets Research.
Key Quotes
“Our expectations for USD/MYR to test 4.1520 (rising trend-line support) last week were incorrect as it staged a surprising strong rise (high has been 4.2150 last Friday). Daily MACD has turned positive and there is room for USD/MYR to test 4.2200.”
“For this week, the next resistance at 4.2280 is unlikely to come under threat. Support is at 4.1760 followed by 4.1660.”
- GBP/USD was seen consolidating its recent gains to a near two-month high.
- The set-up supports prospects for a further near-term appreciating move.
- Any meaningful dip might still be seen as an opportunity for bullish traders.
The GBP/USD pair extended its sideways consolidative price action and remained confined in a narrow trading band, just below the 1.3600 mark through the mid-European session.
From a technical perspective, acceptance above the 100-day SMA supports prospects for an extension of the recent appreciating move further beyond the 61.8% Fibonacci level of the 1.3834-1.3161 fall. Some follow-through buying beyond the 1.3600 mark will reaffirm the positive outlook.
The GBP/USD pair might then accelerate the momentum towards testing a descending trend-line hurdle, around the 1.3675 region. The mentioned barrier extends from July 2021 swing high and should act as a key pivotal point, which if cleared will be seen as a fresh trigger for bullish traders.
On the flip side, the 100-day SMA, currently around mid-1.3500s, now seems to protect the immediate downside. Any subsequent decline might still be seen as a buying opportunity and remain limited near the key 1.3500 psychological mark, which coincides with the 50% Fibo. level.
A convincing break below the mentioned support levels could prompt some technical selling and drag the GBP/USD pair to the 1.3460-55 region en-route the 1.3430 area. This is followed by the 38.2% Fibo. level/50-day SMA confluence resistance breakpoint, near the 1.3400 round figure.
GBP/USD daily chart
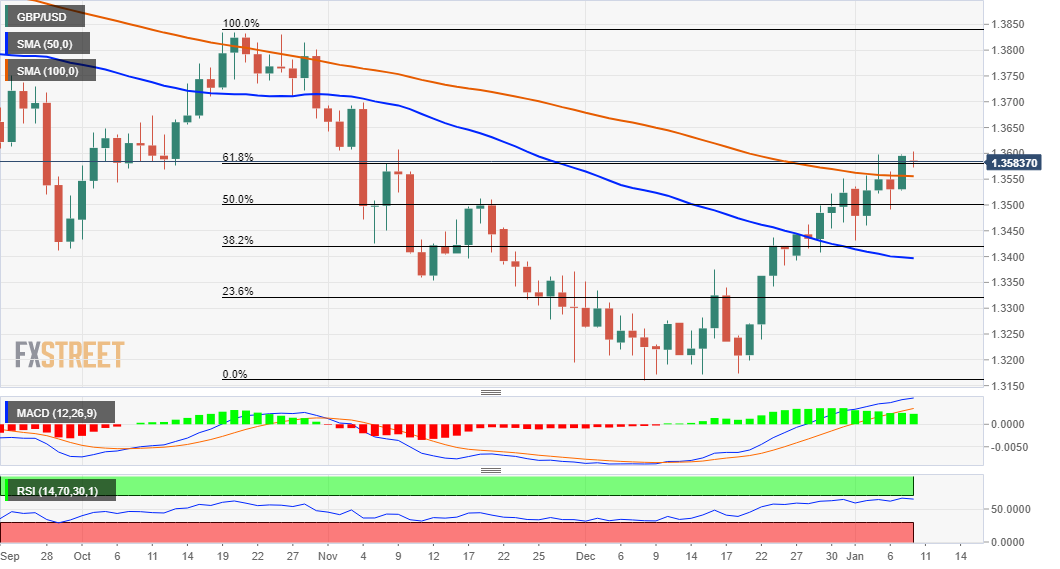
Technical levels to watch
British Prime Minister Boris Johnson said on Monday that they are looking at the possibility of reducing the quarantine period to five days from seven, as reported by Reuters.
Johnson further added that they are making great progress in seeing off Omicron but noted that the number of cases in the hospital was still increasing. "Around 30% of cases were contracted in hospital, this is not acceptable," he further said.
Market reaction
These comments don't seem to be having a noticeable impact on the British pound's performance against its rivals. The GBP/USD pair was last seen trading at 1.3585, where it was unchanged on a daily basis.
In an interview with the Wall Street Journal, Richmond Federal Reserve Bank President Thomas Barkin said a rate hike in March would be conceivable, as reported by Reuters.
Barkin further noted that he expects inflation pressures to ease later this year and reiterated that he supports the hawkish outlook for the monetary policy.
Market reaction
The US Dollar Index edged slightly higher following these comments and the US Dollar Index was last seen rising 0.2% on a daily basis at 95.94. Meanwhile, the 10-year US Treasury bond yield is clinging to modest daily gains at 1.774%.
Quek Ser Leang at UOB Group’s Global Economics and Markets Research noted that a sustainable move above 33.84 in USD/THB looks out of favour for the time being.
Key Quotes
“The strong rise in USD/THB to a high of 33.74 last Friday came as a surprise (we were of the view that USD/THB could test the support at 33.10 last week). Daily MACD has turned positive and this bodes well for further USD/THB strength.”
“However, shorter-term conditions are overbought and while USD/THB could edge above 33.84 this week, it may not be able to maintain a foothold above this level (last month’s high at 34.00 is not expected to come into the picture). On the downside, a breach of 33.35 would indicate that the current upward pressure has eased.”
- EUR/USD loses some upside momentum and recedes to 1.1320.
- The greenback looks bid following poor Payrolls results in December.
- The Sentix Index in the euro area improved to 14.9 in January.
Sellers appear to have returned to the single currency and now drag EUR/USD back to the 1.1320 region, or daily lows, on Monday.
EUR/USD weaker on dollar’s rebound, yields
EUR/USD fades part of Friday’s strong advance in response to the renewed buying interest in the greenback, which so far manages to lift the US Dollar Index (DXY) back to the 96.00 neighbourhood following last week’s lows around 95.70.
The rebound in the dollar and the consequent knee-jerk in spot came against the backdrop of the relentless uptick in US yields, with the 10y reference note edging higher to the 1.80% region for the first time in nearly two years. In the same direction, yields of the German 10y Bund move to the vicinity of -0.02%, area last visited in May 2019.
In the domestic calendar, the Investor Confidence tracked by the Sentix Index improved to 14.9 for the current month, while the Unemployment Rate in the euro bloc ticked a tad lower to 7.2% (from 7.3%) in November.
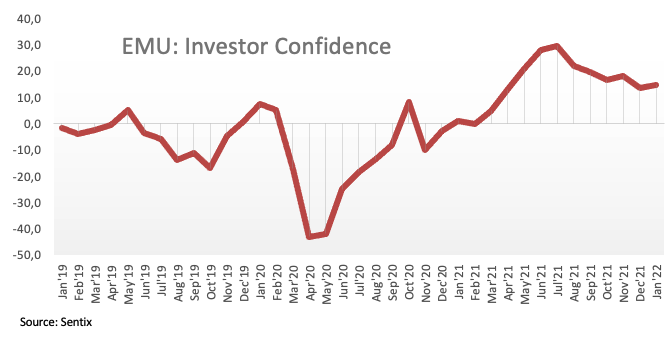
Across the pond, the only data release scheduled for Monday will be the Wholesale Inventories during November.
What to look for around EUR
EUR/USD remains in a consolidation mode since late November, with gains capped by the proximity of the 1.1400 mark and the lower end offering contention around 1.1220. In the meantime, the pair’s price action continues to track the performance of the greenback as well as the policy divergence between the ECB vs. the Federal Reserve and the response to the persistent elevated inflation on both sides of the Atlantic. On another front, the unabated progress of the coronavirus pandemic remains as the exclusive factor to look at when it comes to the economic growth prospects and investors’ morale.
Key events in the euro area this week: EMU Unemployment Rate, Sentix Index (Monday) - ECB C.Lagarde (Tuesday) - EMU Industrial Production (Wednesday) - Germany Full Year GDP Growth 2021, ECB C.Lagarde (Friday).
Eminent issues on the back boiler: Asymmetric economic recovery post-pandemic in the euro area. ECB stance/potential reaction to the persistent elevated inflation in the region. ECB tapering speculation/rate path. Presidential elections in France.
EUR/USD levels to watch
So far, spot is losing 0.26% at 1.1331 and faces the next up barrier at 11369 (55-day SMA) seconded by 1.1386 (monthly high November 30) and finally 1.1464 (weekly high Nov.15). On the other hand, a break below 1.1272 (weekly low Jan.4) would target 1.1221 (weekly low Dec.15) en route to 1.1186 (2021 low Nov.24).
- EUR/GBP met with a fresh supply on Monday and dropped back closer to a near two-year low.
- Receding Omicron fears, rising BoE rate hike bets underpinned the sterling and exerted pressure.
- Upbeat Eurozone Sentix Investor Confidence Index extended support to the euro and the cross.
The EUR/GBP cross extended its steady intraday descent through the first half of the European session and dropped back closer to a near two-year low, around the 0.8335 region in the last hour.
The British pound continued with its relative outperformance against its European counterpart amid hopes that the Omicron outbreak won't derail the UK economy. Apart from this, the divergent Bank of England (BoE) and the European Central Bank (ECB) monetary policy outlooks prompted fresh selling around the EUR/GBP cross on Monday.
In fact, the BoE delivered a surprise rate hike in December and the markets expect another three to four rate increases in 2022. Conversely, ECB President Christine Lagarde said last month that inflation will settle below the 2% target in 2022 and a rate hike wouldn’t be the correct response to the current bout of price growth.
On the economic data front, the Eurozone Sentix Investor Confidence Index unexpectedly improved during the first month of 2022 and jumped to 14.9 from 13.5 in December. Apart from this, a strong pickup in the US dollar demand acted as a headwind for both the euro and the sterling. This might help limit any deeper losses for the EUR/GBP cross.
Even from a technical perspective, the RSI (14) on the daily chart has moved on the verge of breaking into the oversold territory, further warranting some caution before positioning for any further slide. This, in turn, suggests that the EUR/GBP cross is more likely to prolong its range-bound price action witnessed over the past four trading sessions.
Technical levels to watch
Analysts at the Australia and New Zealand (ANZ) banking group that this week’s Bank of Korea’s (BOK) monetary policy decision is likely to be nail-biting, with policymakers contemplating another rate hike.
Key quotes
“The Bank of Korea’s (BoK) upcoming policy decision is likely to be a close call, but we think the central bank will opt against a back-to-back hike in January.”
“Although recent comments from BoK Governor Lee Ju-yeol signal increasing concerns about persistent price pressures, he also flagged high uncertainties about the economy. “
“Accordingly, we think the central bank will continue on its gradual monetary normalization path, with the next hike likely in February, when there is more clarity on growth.”
Eurozone’s investor sentiment unexpectedly improved in the first month of 2022, the latest data published by the Sentix research group showed on Monday.
The gauge jumped to 14.9 in January from 13.5 in December vs. a drop to 12.0 expected. The index rebounded sharply from the lowest levels since April 2020.
A current conditions index rose to 16.3 in January from 13.3, recording the first increase since September.
However, an expectations index eased slightly to 13.5 from 13.8.
Sentix Managing Director Patrick Hussy said: "Expectations were stabilizing at around the previous month's level due to the continued effects of supply bottlenecks and high inflation figures.”
EUR/USD reaction
The shared currency shrugs off an upside surprise delivered by the Eurozone Sentix data, as EUR/USD keeps its range around 1.1330 amid a broad rebound in the US dollar and rally in the Treasury yields. The spot is down 0.23% so far.
About Eurozone Sentix Investor Confidence
Among 1600 financial analysts and institutional investors, the Sentix Investor Confidence is a monthly survey that shows the market opinion about the current economic situation and the expectations for the next semester. The index, released by Sentix GmbH, is composed by 36 different indicators. Usually, a higher reading is seen as positive for the Eurozone, which means positive, or bullish, for the Euro, while a lower number is seen as negative or bearish for the unique currency.
- USD/CAD witnessed some selling for the third successive day on Monday.
- An uptick in oil prices underpinned the loonie and exerted some pressure.
- A strong pickup in the USD demand failed to lend any support to the pair.
The USD/CAD pair remained on the defensive through the first half of the European session and was last seen flirting with the 100-day SMA, around the 1.2625 region.
The pair witnessed some selling for the third successive day on Monday and extended last week's retracement slide from levels beyond the 1.2800 round-figure mark. Against the backdrop of Friday's upbeat Canadian employment details, an uptick in crude oil prices underpinned the commodity-linked loonie and exerted some pressure on the USD/CAD pair. The downside, however, seems cushioned amid a strong pickup in the US dollar demand.
The USD made a strong comeback on the first day of a new week amid elevated US Treasury bond yields, bolstered by the prospects for a faster policy tightening by the Fed. The disappointment from the headline NFP print, showing that the economy added 199K jobs in December, was offset by a fall in the unemployment rate to 3.9%. Adding to this, wages reported another month of strong growth and reinforced market bets for an eventual Fed lift-off in March.
In fact, the yield on the benchmark 10-year US government bond climbed above the 1.80% threshold for the first time since January 2020. Adding to this, the US 2-year notes, which are highly sensitive to rate hike expectations along with the 5-year note, held steady near a two-year high and acted as a tailwind for the greenback. That said, a generally positive tone around the equity markets kept a lid on any meaningful gains for the safe-haven buck.
Nevertheless, the USD/CAD pair now seems vulnerable to prolonging its recent corrective pullback from a one-year high touched in December. Some follow-through selling below the 1.2620 region will reaffirm the negative bias and pave the way for further losses. The pair might then break below the 1.2600 mark and accelerate the downward trajectory towards testing the next relevant support near the 1.2540 area amid absent relevant market-moving economic releases.
Technical levels to watch
Despite the US dollar’s sell-off seen on Friday, the greenback remains a ‘buy on dip’ for trading, in the face of the hawkish Fed outlook, analysts at ING bank noted.
Key quotes
“It was a little surprising to see the dollar generally lower on Friday. “
Interest rate markets priced a more hawkish Fed on the back of the December jobs data, yet the dollar still fell.”
“This week's release of US December CPI should add more ammunition to the hawkish Fed story and we would expect the dollar to play its role in tightening US monetary conditions.”
- DXY regains some composure and trades closer to 96.00.
- Higher US yields sustain the recovery in the dollar so far.
- November’s Wholesale Inventories only due in the US docket.
The greenback, in terms of the US Dollar Index (DXY), returns to the positive territory and looks to reclaim the 96.00 neighbourhood at the beginning of the week.
US Dollar Index looks to data, yields, Powell
The index partially reverses Friday’s moderate pullback and trades on an upbeat note near the 96.00 mark amidst the continuation of the upside momentum in US yields across the curve, while market participants seem to have already digested the disheartening Payrolls results published on Friday (+199K).
Still on the US cash markets, the short end of curve extends the upside and already flirts with the 0.90% mark, while yields of the key 10y benchmark note remain firm and at shouting distance from the 1.80% level. Furthermore, the closely watched 2y-10y yield spread approaches once again the 90 pts yardstick.
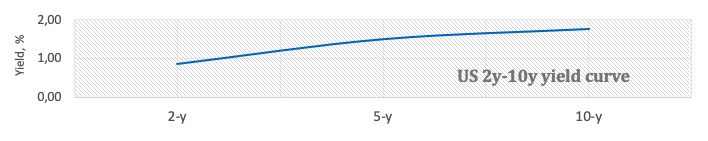
Monday’s US docket will only show the November Wholesale Inventories, although investors’ attention will largely be on the release of the inflation figures tracked by the CPI as well as December’s Retail Sales, both of them due later in the week.
What to look for around USD
The index ended last week on the defensive and in multi-day lows in the sub-96.00 area. The recent steady/bearish price action in the dollar came in contrast with the sharp advance in US yields across the curve and alternating risk appetite trends throughout the week. In the meantime, the dollar’s constructive outlook is seen underpinned by the Fed’s intentions to start the hiking cycle earlier than anticipated amidst persevering elevated inflation, supportive Fedspeak, higher yields and the solid performance of the US economy.
Key events in the US this week: Wholesale Inventories (Monday) - Fed J.Powell Testimony (Tuesday) - December CPI (Wednesday) - Initial Claims, FOMC L.Brainard Testimony, Producer Prices (Thursday) - Retail Sales, Industrial Production, Flash Consumer Sentiment, Business Inventories (Friday).
Eminent issues on the back boiler: Start of the Fed’s tightening cycle. US-China trade conflict under the Biden’s administration. Debt ceiling issue. Potential geopolitical effervescence vs. Russia and China.
US Dollar Index relevant levels
Now, the index is advancing 0.14% at 95.87 and a break above 96.46 (weekly top Jan.4) would open the door to 96.90 (weekly high Dec.15) and finally 96.93 (2021 high Nov.24). On the flip side, the next down barrier emerges at 96.61 (55-day SMA) seconded by 95.57 (monthly low Dec.31) and then 95.51 (weekly low Nov.30).
The upside momentum in USD/CNH could push the pair back to the 6.4100 level in the next weeks, according to FX Strategists at UOB Group.
Key Quotes
24-hour view: “Last Friday, we highlighted that ‘the sharp and rapid rise appears to be running ahead of itself and USD is unlikely to advance much further’ and we expected USD to ‘trade between 6.3800 and 6.4000’. USD subsequently traded between 6.3786 and 6.3965. The underlying tone has softened somewhat but any weakness is expected to encounter strong support at 6.3730. Resistance is at 6.3870 followed by 6.3920.”
Next 1-3 weeks: “After USD rose to 6.3975, we highlighted last Friday (07 Jan, spot at 6.3900) that “upward momentum has improved slightly but it appears too early to expect a sustained advance”. We added, there is room for USD to edge higher to 6.4100 but a breach of 6.3730 (no change in ‘strong support’ level) would indicate that the build-up in momentum has fizzled out. There is no change in our view for now.”
- Gold price remains at the mercy of the Treasury yields’ price action.
- Markets are now pricing in four Fed rate hikes this year; Powell, US inflation eyed.
- Gold 2022 Outlook: Correlation with US T-bond yields to drive yellow metal.
Gold is struggling to find a clear directional bias so far this Monday, having staged an impressive bounce from three-week lows. The US Treasury yields resume the rally triggered by the Fed rate hike frenzy, lifting the dollar alongside at gold’s expense. Amid a lack of top-tier economic releases on Monday, gold price will remain at the mercy of the price action in the yields. The focus remains on Fed Chair Jerome Powell’s testimony and US inflation due later this week for a decisive move in gold price.
Read: Gold Price Forecast: Risks appear skewed to the downside, eyes on Powell, US inflation
Gold Price: Key levels to watch
The Technical Confluences Detector shows that the gold price is pressuring a strong support at $1,793 once again, which is the convergence of the SMA100 one-day and Fibonacci 38.2% one-day.
The Fibonacci 61.8% one-day at $1,789 will guard the downside, below which sellers will gear up to test the previous day’s low at $1,783.
On the flip side, if the bulls find acceptance above the $1,800 mark, then the resumption of the previous recovery cannot be ruled out.
That level is the confluence of the SMA200 one-day, Fibonacci 38.2% one-month and one-week.
Further up, the intersection of SMA100 four-hour and SMA50 one-day at $1,805 will be a tough nut to crack for gold bulls.
The next relevant upside target is pegged at $1,809, where the pivot point one-day R2 meets with the SMA10 one-day.
Here is how it looks on the tool
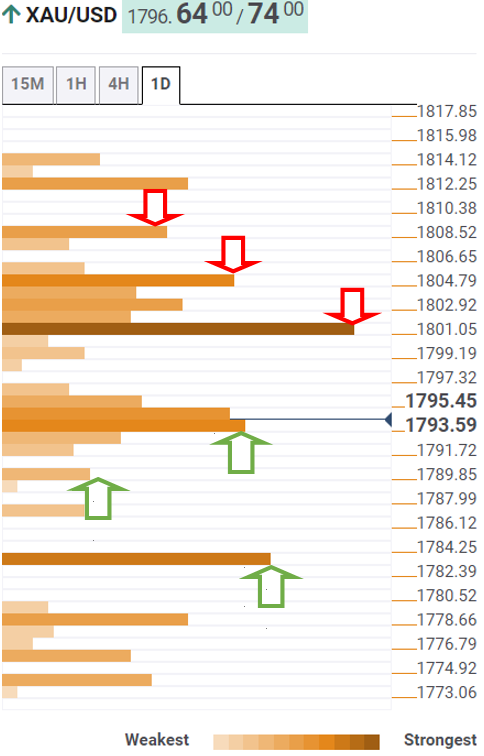
About Technical Confluences Detector
The TCD (Technical Confluences Detector) is a tool to locate and point out those price levels where there is a congestion of indicators, moving averages, Fibonacci levels, Pivot Points, etc. If you are a short-term trader, you will find entry points for counter-trend strategies and hunt a few points at a time. If you are a medium-to-long-term trader, this tool will allow you to know in advance the price levels where a medium-to-long-term trend may stop and rest, where to unwind positions, or where to increase your position size.
An advance to the mid-116.00s in USD/JPY seems to have been losing momentum as of late, commented FX Strategists at UOB Group.
Key Quotes
24-hour view: “Last Friday, we expected USD to trade sideways between 115.55 and 116.20. USD subsequently traded between 115.50 and 116.04 before settling on a soft note at 115.55 (-0.23%). The weakened underlying tone suggests USD could drift lower but a break of the strong support at 115.30 is unlikely. Resistance is at 115.80 followed by 116.00.”
Next 1-3 weeks: “We highlighted last Friday (07 Jan, spot 115.95) that while upward momentum has eased somewhat, only a breach of 115.30 (no change in ‘strong support’ level) would indicate that USD is not ready to head higher to 116.50. There is no change in our view for now even though after the soft daily closing last Friday, the prospect for USD to advance to 116.50 has diminished.”
Open interest in natural gas futures markets reversed the previous day’s pullback and rose by around 5.2K contracts on Friday, as per flash data from CME Group. Volume followed suit and went up by around 112.9K contracts.
Natural Gas targets $4.00 and above
Friday’s uptick in prices of natural gas was on the back of rising open interest and volume, leaving the door open for the continuation of the recovery and with the immediate target at the $4.00 mark per MMBtu.
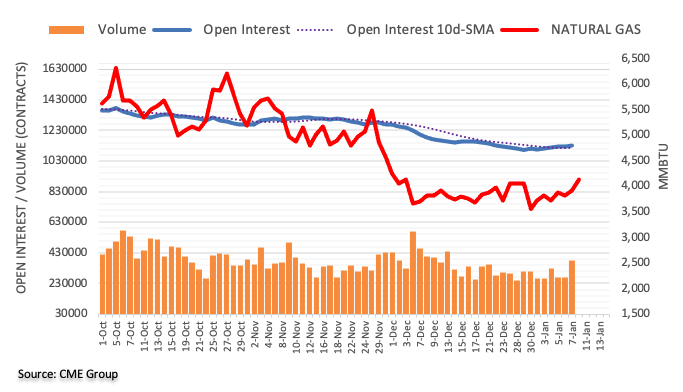
- GBP/USD was seen consolidating its recent gains to the 1.3600 mark, or a near two-month high.
- Hawkish Fed expectations, elevated US bond yields revived the USD demand and capped gains.
- Receding Omicron fears, BoE rate hike bets acted as a tailwind for the sterling and the major.
The GBP/USD pair now seems to have entered a bullish consolidation phase and was seen oscillating in a range near the highest level since November 9, just below the 1.3600 mark.
A combination of diverging forces failed to assist the GBP/USD pair to capitalize on the recent up-trend witnessed over the past three weeks or so and led to subdued/range-bound price action on Monday. Hopes that the Omicron outbreak won't derail the UK economy and rising bets for additional rate hikes by the Bank of England continued underpinning the British pound. That said, a strong pickup in the US dollar demand kept a lid on any further gains for the major, at least for the time being.
As investors looked past Friday's mixed US monthly jobs report, the USD made a solid comeback on the first day of a new week and was supported by elevated US Treasury bond yields. In fact, the yield on the benchmark 10-year US government bond climbed above the 1.80% threshold for the first time since January 2020. Moreover, the US 2-year notes, which are highly sensitive to rate hike expectations, also shot to a two-year high amid the prospects for an eventual Fed lift-off in March 2022.
Meanwhile, the mixed fundamental backdrop held back traders from placing fresh bullish bets around the GBP/USD pair amid absent relevant market-moving economic releases, either from the UK or the US. Hence, the US bond yields will continue to play a key role in influencing the USD price dynamics and provide some impetus to the major. This, in turn, makes it prudent to wait for a sustained strength beyond the 1.3600 mark before positioning for any further near-term appreciating move.
Technical levels to watch
FX option expiries for January 10 NY cut at 10:00 Eastern Time, via DTCC, can be found below.
- EUR/USD: EUR amounts
- 1.1275-80 1.2b
- 1.1300 394m
- 1.1350 552m
- 1.1390 340m
- GBP/USD: GBP amounts
- 1.3610 305m
- USD/JPY: USD amounts
- 114.00 1.2b
- 116.00 600m
- 116.50 1.2b
- USD/CHF: USD amounts
- 0.9150 260m
- 0.9240 700m
- AUD/USD: AUD amounts
- 0.7045-50 450 m
- USD/CAD: USD amounts
- 1.2750-55 395m
- AUD/JPY: AUD amounts
- 80.98-81.00 1.25b
- USD/ZAR: USD amounts
- 16.30 400m
- USD/JPY attracted some buying on Monday and stalled its recent pullback from a multi-year high.
- A generally positive risk tone undermined the safe-haven JPY and extended support to the major.
- Fed rate hike bets, elevated US bond yields revived the USD demand and provided a modest lift.
The USD/JPY pair maintained its bid tone through the early European session and was last seen hovering just a few pips below the daily high, around 115.75 region.
A combination of supporting factors assisted the USD/JPY pair to attract fresh buying near mid-115.00s on Monday and stall its recent pullback from a five-year top touched last week. A generally positive tone around the equity markets undermined the safe-haven Japanese yen and acted as a tailwind for the major. Bulls further took cues from elevated US Treasury bond yields, which helped revive the US dollar demand amid growing acceptance for a faster policy tightening by the Fed.
The disappointment from the headline NFP print, showing that the economy added only 199K jobs in December, was largely offset by a larger drop in the unemployment rate to 3.9%. Adding to this, wages reported another month of strong growth and reinforced market bets for an eventual Fed lift-off in March. This, in turn, led to a fresh leg up in the US Treasury bond yields. In fact, the yield on the benchmark 10-year Treasury note shot to 1.80% or the highest level since January 2020.
Conversely, the 10-year JGB yield remained near zero due to the Bank of Japan's yield curve control policy. This resulted in a further widening of the US-Japanese yield differential, which was seen as another factor that extended some support to the USD/JPY pair. Nevertheless, the fundamental backdrop seems tilted firmly in favour of bullish traders. A subsequent move beyond the 116.00 mark will reaffirm the positive outlook and set the stage for the resumption of the recent up-trend.
In the absence of any major market-moving economic releases from the US, the US bond yields will continue to play a key role in influencing the USD price dynamics. Apart from this, traders might take cues from the broader market risk sentiment to grab some short-term opportunities around the USD/JPY pair. The key focus, however, remains on Fed Chair Jerome Powell's testimony on Tuesday, which will be followed by the release of the latest US consumer inflation figures on Wednesday.
Technical levels to watch
AUD/USD faces the likeliness of further decline, although there is a solid support around 0.7110, suggested FX Strategists at UOB Group.
Key Quotes
24-hour view: “We highlighted last Friday that ‘the weakness in AUD has scope to extend to 0.7135 before stabilizing’. While our view was not wrong as AUD dropped to 0.7130, we did not anticipate the subsequent sharp bounce from the low. Downward pressure has eased and the current movement is viewed as part of consolidation and AUD is likely to trade between 0.7155 and 0.7210 for today.”
Next 1-3 weeks: “Last Friday, (07 Jan, spot at 0.7165) we highlighted that risk is tilted to the downside but any weakness is expected to encounter solid support at 0.7110. There is no change in our view for now but a break of 0.7235 (no change in ‘strong resistance’ level) would indicate that the downside risk has dissipated.”
- EUR/GBP remains pressured around 23-month low, seesaws near intraday bottom of late.
- Weekly support line can test bears before directing them to 61.8% FE.
- Horizontal area from last Monday, 200-HMA challenges buyers.
- Bearish MACD signals, failures to stay beyond 100-HMA favor sellers.
EUR/GBP fades bounce off intraday low near 0.8340 heading into Monday’s European session.
In doing so, the cross-currency pair extends Friday’s breakdown of the 100-HMA amid bearish MACD signals.
That said, the latest weakness eyes an upward sloping trend line from the last Wednesday, near 0.8338, before retesting the multi-day low marked on January 05, around 0.8335.
It’s worth noting that the quote’s weakness past 0.8335 will make it vulnerable to test the 61.8% Fibonacci Expansion (FE) of January 01-06 moves, near 0.8315. Following that, the year 2020 bottom surrounding 0.8280 will be crucial to watch.
Meanwhile, 100-DMA and one-week-old horizontal area, respectively near 0.8352 and 0.8372, restrict the quote’s short-term advances.
Even if the EUR/GBP prices rally beyond 0.8372, the 200-HMA level of 0.8375 and November’s low of 0.8380 will act as extra upside filters before activating a corrective pullback that can target the 0.8400 threshold.
EUR/GBP: Four-hour chart
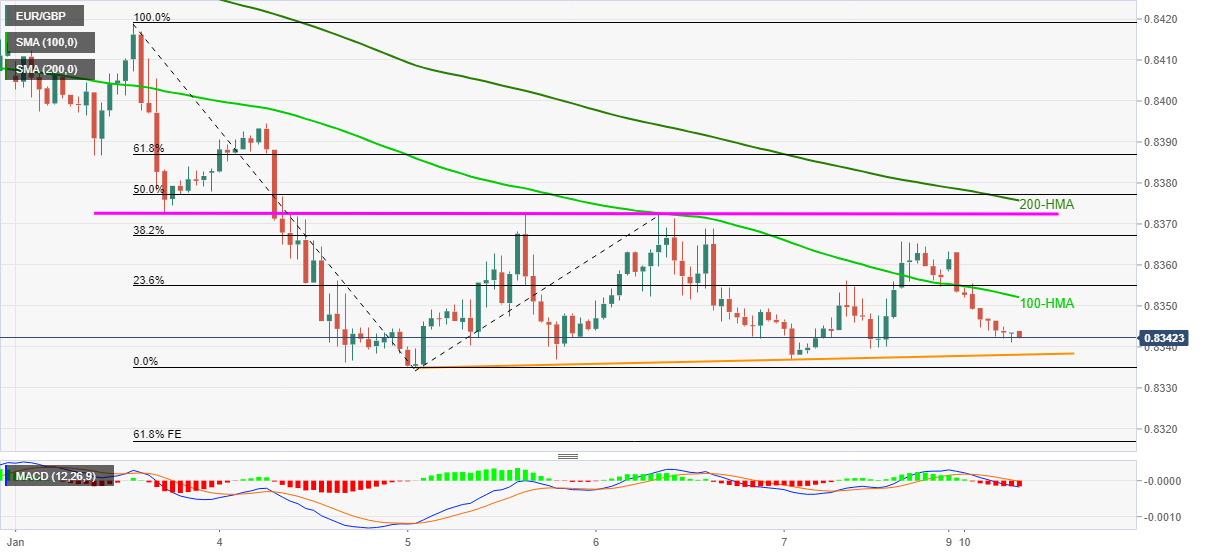
Trend: Further weakness expected
Here is what you need to know on Monday, January 10:
The benchmark 10-year US Treasury bond yield climbed to its highest level in nearly two years on Friday and helped the greenback stay resilient against its rivals despite the disappointing December Nonfarm Payrolls (NFP) reading. The US Dollar Index, which dropped to 95.70 area, is currently in the positive territory near 96.00. There won't be any high-impact data releases from the US on Monday. The European economic docket will feature January Sentix Investor Confidence and November Unemployment data. Market participants will remain focused on bond yields' impact on risk sentiment and currency valuations.
The US Bureau of Labor Statistics announced on Friday that NFP rose by only 199,000 in December, missing the market expectation of 400,000. However, wage inflation, as measured by the Average Hourly Earnings, arrived at 0.6% and 4.7% on a monthly and yearly basis, respectively. With these figures surpassing analysts' forecasts, markets started to price in a faster policy tightening by the Federal Reserve. The probability of a 25 basis points rate in March stands at 73.4% early Monday, compared to 57.1% same time last week, according to the CME Group's FedWatch tool.
In the meantime, investors remain concerned about the ongoing issues in the Chinese property sector with Evergrande closing in on the deadline for bondholders to vote on the plan to delay an option for early repayment of its yuan-denominated bonds.
US stock markets futures trade little changed on Monday. The S&P 500 Index lost nearly 2% in the first week of 2022 but the financial-heavy Dow Jones Industrial Average closed virtually unchanged.
EUR/USD advanced toward the upper limit of its five-week-old trading range above 1.1350 with the initial market reaction to the US December jobs report on Friday but reversed its direction early Friday. Currently, the pair is trading around 1.1330. It's worth noting that the 10-year German government bond yield is looking to cross into the positive territory for the first time since May 2019 and the shared currency could find demand in case that happens.
GBP/USD closed the third straight week in the positive territory but seems to be having a difficult time climbing above 1.3600 for the time being.
USD/JPY lost its bullish momentum in the second half of the previous week despite rising US Treasury bond yields as the risk-averse market environment helped the JPY gather strength as a safe haven. The pair was last seen posting modest daily gains around 115.80.
Gold struggled to capitalize on the selling pressure surrounding the dollar on Friday and closed the week below key technical resistance levels that are located around $1,800. XAU/USD seems to have gone into a consolidation phase around $1,790.
Bitcoin fluctuated in a very tight channel over the weekend but ended up losing more than 10% on a weekly basis. BTC is currently trading sideways near $42,000. Ethereum suffered its largest one-week loss since May as it erased nearly 18% but managed to stay afloat above $3,000 for the time being.
- AUD/USD gained some follow-through traction for the second successive day on Monday.
- A generally positive tone around the equity markets benefitted the perceived riskier aussie.
- Hawkish Fed expectations, elevated US bond yields underpinned the USD and capped gains.
The AUD/USD pair held on to its intraday gains heading into the European session and was last seen hovering near the daily high, around the 0.7200 mark.
The pair built on Friday's bounce from the 0.7130 area, or over two-week low and gained some follow-through traction on the first day of a new trading week. This marked the second successive day of an uptick and was sponsored by a generally positive tone around the equity markets, which tends to benefit the perceived riskier aussie. That said, resurgent US dollar demand held back bulls from placing aggressive bets and capped the upside for the AUD/USD pair, at least for now.
The greenback made a solid comeback on Monday amid elevated US Treasury bond yields, bolstered by expectations for a faster policy tightening by the Fed. The disappointing headline NFP print was offset by a larger than anticipated fall in the US unemployment rate and strong growth in wages. The data reaffirmed market bets for an eventual Fed lift-off in March 2022, which, in turn, was seen as a key factor that pushed the US bond yields higher and helped revive the USD demand.
The fundamental backdrop favours the USD bulls and warrants some caution before positioning for any further appreciating move for the AUD/USD pair. Investors might also be reluctant to place aggressive bets and prefer to wait for a fresh catalyst from the latest US consumer inflation figures, due for release on Wednesday. Apart from this, traders will further take cues from Fed Chair Jerome Powell's testimony on Tuesday and the US monthly Retail Sales data on Friday.
In the meantime, the US bond yields will continue to play a key role in influencing the USD price dynamics and provide some impetus to the AUD/USD pair. This, along with the broader market risk sentiment, should allow traders to grab some short-term opportunities around the major.
technical levels to watch
Australia’s Prime Minister Scott Morrison acknowledged on Monday, the highly-contagious Omicron coronavirus variant is having an impact on the country’s workforce and consumer spending.
Key quotes
"As the case numbers continue to rise, the volume of cases will of course have an inevitable impact on the workforce.”
"This is an incredibly tough time on business. There aren't lockdowns but there are many people obviously impacted by being close contacts or people being wary, or those indeed who have COVID themselves."
It was having a "predictable and understandable" impact on consumer spending.”
The country’s Assistant Treasurer Michael Sukkar, however, “is confident the Australian economy can overcome the Omicron challenge with households having the security of huge savings.”
Market reaction
The rebound in AUD/USD remains capped below 0.7200 amid covid and China’s real estate sector concerns.
The spot was last seen trading at 0.7190, adding 0.20% on the day, having hit a daily high of 0.7198 and a low of 0.7171.
The options market turns most bearish on the NZD/USD in six weeks, per the latest weekly data from Reuters.
One-month risk reversal (RR) of NZD/USD, a gauge of calls to puts, not only snapped a five-week uptrend but also dropped for the second consecutive day by the end of the last week, per Reuters data.
That said, the latest daily RR is 0.000, following Friday’s print of -0.050, whereas the weekly number marked -0.150 level.
It’s worth noting that the NZD/USD prices do track the bearish signals flashed by options markets, down 0.07% intraday around 0.6770 by the press time. However, the quote’s further weakness depends upon this week’s US inflation data.
Read: NZD/USD struggles to extend corrective pullback below 0.6800 on mixed clues
The Omicron-fuelled third COVID-19 wave in India prompted Citigroup to revise down the country’s FY22 growth forecast by 80 basis points
(bps) to 9%, Chief India Economist Samiran Chakraborty noted.
Key quotes
“While the economic impact of the Omicron wave in 4QFY22 (Jan-March) could be lower than previous waves, the activity momentum in 3QFY22 was much lower than our expectation.”
“Downgrades its real GDP growth forecast for FY23 to 8.3% against 8.7% earlier.”
‘Still, lower hospitalization rates, shorter Covid wave cycle period, higher vaccination coverage and weakening link between Covid and activities give enough reasons to be hopeful of a less-disruptive Covid wave.”
Read: USD/INR Price News: Rupee eyes 74.00 despite surging covid cases in India
- USD/CHF reverses Friday’s pullback from 13-day top, refreshes intraday high.
- Firmer Momentum line, sustained bounce off the key moving average favor buyers.
- Monthly resistance line appears the key for short-term, ascending trend line from December 31 adds to the downside filters.
USD/CHF takes the bids to renew intraday peak to 0.9207 during early Monday morning in Europe.
The Swiss currency (CHF) pair marked the heaviest daily losses since December 22 before bouncing off the 100-SMA. The corrective pullback gains support from a firmer Momentum line to direct the pair buyers towards the monthly resistance line, around 0.9230.
During the quote’s sustained run-up beyond 0.9230, the 61.8% Fibonacci retracement (Fibo.) of November-December downside, around 0.9270, will be crucial to watch for the USD/CHF pair’s further upside.
Meanwhile, a downside break of the 100-SMA, around 0.9185 by the press time, isn’t a green signal for USD/CHF sellers as a one-week-old support line, near 0.9178, will test the south-run towards December’s bottom surrounding 0.9100.
Overall, USD/CHF keeps the bullish consolidation to pare losses marked since late November. However, buyers will have a bumpy road ahead.
USD/CHF: Four-hour chart
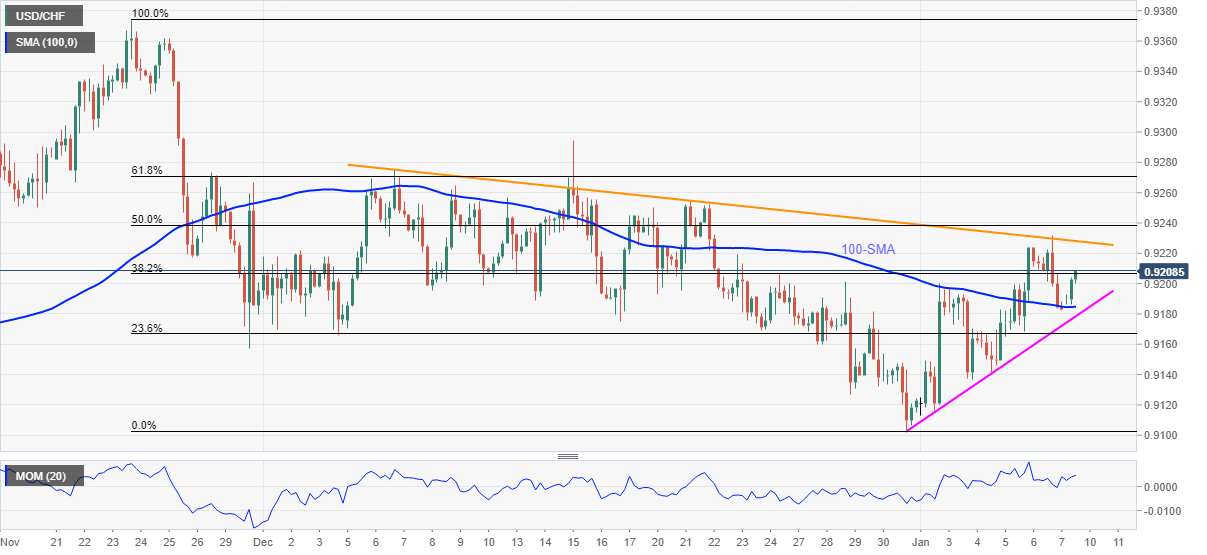
Trend: Further upside expected
CME Group’s advanced figures for crude oil futures markets noted open interest rose by around 5.4K contracts at the end of last week, extending the ongoing uptrend. Volume, instead, reversed five consecutive daily builds and shrank by around 190.7K contracts.
WTI needs to clear $80.00 to allow for extra gains
Prices of the WTI managed to advance past the $80.00 mark per barrel in past sessions, although still unable to close above it. Friday’s rising open interest coupled with the negative price action, however, hints at the idea that further correction lies ahead at least in the very near term.
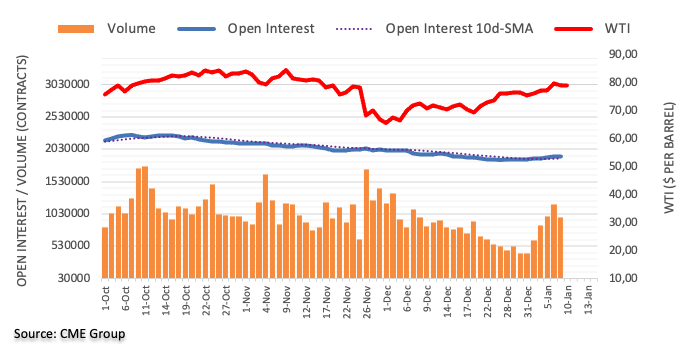
In opinion of FX Strategists at UOB Group, GBP/USD targets 1.3630/60 on a break above the 1.3600 mark.
Key Quotes
24-hour view: “We expected GBP to ‘consolidate and trade within a range of 1.3485/1.3570’ last Friday. However, GBP soared to a high of 1.3598. Upward momentum has improved, albeit not by all that much. For today, GBP is likely to move above 1.3600 but the next major resistance at 1.3630 is unlikely to come into the picture. Support is at 1.3570 followed by 1.3550.”
Next 1-3 weeks: “In our latest narrative from last Thursday (06 Jan, spot at 1.3555), we highlighted that ‘upward momentum has improved slightly but GBP has to break 1.3600 before further advance is likely’. We added, ‘the chance for GBP to break 1.3600 is not high for now but would remain intact as long as GBP does not move below 1.3460’. GBP rose strongly last Friday and came close to breaking 1.3600 (high of 1.3598). Upward momentum has built up further and a break of 1.3600 would indicate that GBP could advance to 1.3630, possibly 1.3660. Only a breach of the ‘strong support’ at 1.3525 (level was at 1.3460 last Friday) would indicate that the build-up in momentum has fizzled out.”
Germany’s federal government will ramp up efforts to counter the impact of runaway wholesale energy prices, which are delivering a blow to low-income households, Reuters reports, citing two policymakers.
Key takeaways
"We are working flat out on solutions for households that are now facing difficulties.”
"Our promise has always been that we will particularly protect people on a tight budget who find themselves suddenly caught out by social and global developments.”
“The government would prefer "unbureaucratic and prudent" solutions tailored to individual needs.”
“As for electricity and gas, the minister for environment and consumer protection, Steffi Lemke, told Reuters she would clamp down on suppliers who tried to profiteer from contract expiries, competitor insolvencies and people moving house.”
Market reaction
EUR/USD was last seen trading at 1.1330, down 0.25% on a daily basis, hit by an impressive US dollar rebound.
Considering preliminary readings from CME Group for gold futures markets, traders added nearly 5K contracts to their open interest positions on Friday, reaching the third consecutive daily build. In the same line, volume extended the uptrend for yet another session, now by around 47.5K contracts.
Gold still targets $1,800
Friday’s uptick in prices of the yellow metal was on the back of rising open interest and volume, allowing for further upside in the very near term. Against that, the $1,800 mark per ounce troy of gold remains the key target for bulls for the time being.
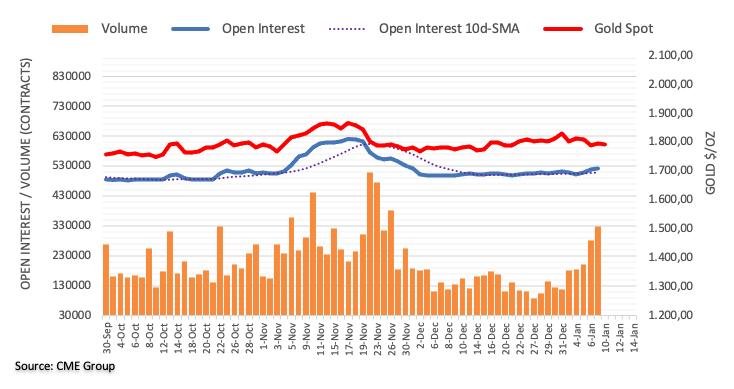
- Gold snaps three-day downtrend in Euro terms amid sluggish markets.
- Fears of faster Fed rate hike, virus woes underpin USD rebound and weigh on the bloc’s currency.
- Light calendar, off in Japan adds strength to the market’s consolidation.
Gold (XAU/EUR) pares recent gains around €1,583 heading into Monday’s European session. In doing so, the yellow metal prices in Euro terms rise for the first time in four days, not to forget mentioning the rebound from the lowest levels last seen on December 16, flashed the previous day.
Although market sentiment stays sluggish amid mixed concerns and a light calendar, not to forget the holiday in Japan, Euro remains on the back foot as the US dollar consolidates Friday’s losses. On the same line could be the Fed versus ECB battle, which recently gained attention from the International Monetary Fund (IMF). “Emerging economies must prepare for U.S. interest rate hikes, the International Monetary Fund said, warning that faster than expected Federal Reserve moves could rattle financial markets and trigger capital outflows and currency depreciation abroad,” per Reuters.
The old continent’s currency gained the previous day, dragging the XAU/EUR towards a refreshing multi-day low, after Eurozone inflation firmed versus the mixed prints of the US jobs report. That said, the US Dollar Index (DXY) dropped the most in six weeks on Friday after the headline US Nonfarm Payrolls (NFP) disappointed markets with 199K figures for December versus 400K forecasts and 249K prior (upwardly revised from 210K).
On the other hand, the first readings of the Eurozone CPI for December offered a positive surprise of 5.0% while crossing the previous month’s figure of 4.9% and 4.7% market consensus. As the inflation figures reached the highest level since the early pandemic days, EUR/USD bulls recollect Thursday’s comments from European Central Bank Chief Economist Philip Lane to tighten the grips. Following that, ECB board member Isabel Schnabel said on Saturday, “Rising energy prices may force the European Central Bank to stop ‘looking through’ high inflation and act to temper price growth.”
Against this backdrop, stock futures in the US and Europe post mild gains, following a downbeat start to the week, whereas Antipodeans keep Friday’s upside momentum.
It should be noted that the scheduled release of the US Consumer Price Index (CPI) for December, on Wednesday, highlights the inflation fears and help the greenback to recover some losses during the light calendar day, which in turn may weigh on the XAU/EUR prices. Though, strong recovery in German Bund yields could challenge the gold prices in Euro terms.
Read: Inflation and geopolitics in the week ahead
Technical analysis
Although 23.6% Fibonacci retracement (Fibo.) of November-December downtrend, around €1,578, restricts XAU/EUR’s short-term downside, confirmation of the rising wedge bearish pattern on the four-hour (4H) chart joins sustained trading below 200-SMA to favor sellers.
It should be noted, however, that nearly oversold RSI conditions hint at a further corrective pullback of gold prices in Euro towards the 200-SMA level near €1,590.
Following that, the support-turned-resistance line of the short-term wedge, around €1,600 by the press time, will be crucial to watch for the commodity buyers.
Alternatively, a downside break of the 23.6% Fibo. level near €1,578 will quickly direct the quote towards the last month’s bottom surrounding €1,555.
In a case where XAU/EUR keeps the reins past €1,555, November’s low near €1,519 could tease the bears.
XAU/EUR: Four-hour chart
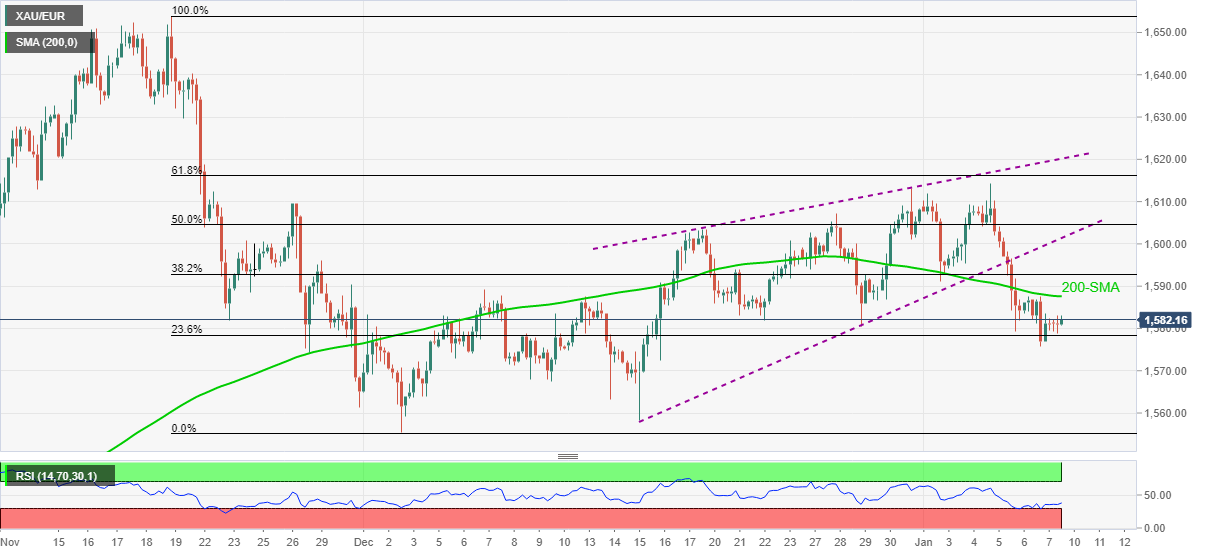
Trend: Bearish
EUR/USD is still seen within a consolidative phase in the near term, noted FX Strategists at UOB Group.
Key Quotes
24-hour view: “We did not anticipate the strong rise in EUR to 1.1364 last Friday (we were expecting sideway-trading). The sharp and swift advance appears to have room to extend but in view of the overbought conditions, the major resistance at 1.1395 is unlikely to come under threat (1.1375 is already quite a strong level). Support is at 1.1335 but only a breach of 1.1320 would indicate that the current upward pressure has eased.”
Next 1-3 weeks: “We have held the same view since last Tuesday (04 Jan, spot at 1.1305) where the outlook for EUR is unclear and we expected EUR to trade between 1.1240 and 1.1395. There is no change in our view for now even though after the sharp rise to 1.1364 last Friday, upward momentum has improved a tad. Looking ahead, EUR has to close above 1.1395 before a sustained rise can be expected.”
Analysts at Goldman Sachs foresee four interest rates hikes by the US Federal Reserve (Fed) in 2022, in light of the December FOMC meeting’s minutes.
Key quotes
“Cite rapid jobs market progress and hawkishness in the December FOMC minutes.”
“We are therefore pulling forward our runoff forecast from December to July, with risks tilted to the even earlier side.”
“With inflation probably still far above target at that point, we no longer think that the start to runoff will substitute for a quarterly rate hike.”
“We continue to see hikes in March, June, and September, and have now added a hike in December.”
- USD/CAD struggles for clear direction after two-day downtrend.
- US, Canada flashed mixed signals over December employment scenario but bears cheered USD weakness.
- Oil prices seesaw even as major supply threats are resolved and demand fears grow.
- Virus woes escalate but Fed hawks stay hopeful ahead of Wednesday’s US inflation.
USD/CAD hovers around 1.2650-45 during the sluggish early hours of Monday, after bears cheered Friday’s jobs report from the US and Canada. In doing so, the loonie pair seems to track prices of Canada’s main export item WTI crude oil amid a light calendar and mixed sentiment.
During the previous day, the pair dropped for the second consecutive day, also the most in a week even as December month jobs report from the US and Canada flashed mixed reports. However, disappointment from the US Nonfarm Payrolls (NFP) gained major attention to drown the US dollar Index (DXY) towards posting the biggest daily loss in six weeks.
That said, the headline US Nonfarm Payrolls (NFP) disappointed markets with 199K figures for December versus 400K forecasts and 249K prior (upwardly revised from 210K). However, the Unemployment Rate dropped to 3.9% compared to 4.1% market consensus and 4.2% in November while the U6 Underemployment Rate that fell to 7.3% against November's downwardly revised 7.7%, both closing in the pre-pandemic levels. As it can be easily observed, the NFP-led disappointment was largely overruled by the Unemployment Rate and U6 Underemployment Rate, which in turn seems to challenge the market sentiment of late.
On the other hand, Canadian Employment Change rose past 27.5K forecast to 54.7K, versus 153.7K prior, whereas the Unemployment Rate fell to 5.9% from 6.0% in November, below expectations for it to remain unchanged.
Elsewhere, WTI crude oil prices remain sidelined at around $78.60 despite receding fears of a supply crunch from Kazakhstan and Libya, not to forget virus-led challenges to energy demand.
Amid these plays, S&P 500 Futures reverse the early Asian losses but stay sluggish. Additionally, Treasury bond moves remain silent as Japanese markets are off for the Coming-of-Age Day.
Looking forward, a lack of major data/events may keep challenging the USD/CAD traders but hawkish bets on the Fed rate hikes will highlight Wednesday’s US Consumer Price Index (CPI) for fresh impulse.
Read: Inflation and geopolitics in the week ahead
Technical analysis
Although bearish MACD signals join 50-DMA break to keep USD/CAD sellers hopeful, a convergence of the 100-DMA and an ascending support line from December 08, around 1.2630-25, restricts short-term losses of the pair.
It’s worth noting, however, that a 12-day-old resistance line near 1.2810, challenges the pair buyers even if they manage to cross the 50-DMA level surrounding 1.2700.
“Faster Fed rate hikes could rattle financial markets, result in slowing US demand and capital outflows from emerging markets,” International Monetary Fund (IMF) said in a blog post published on Monday.
Key takeaways
Broad wage inflation or sustained supply bottlenecks could boost US prices more than expected, trigger faster-Fed rate increases.
Continues to expect robust US growth, sees inflation moderating later this year.
Expect global recovery to continue in 2022 and 2023, but risks remain elevated by the resurgent pandemic.
- GBP/USD prices remains lackluster after positing the biggest daily jump in a week.
- A clear upside break of 100-DMA joins bullish MACD signals, three-week-old support line to keep buyers hopeful.
- Horizontal area from August 20 precedes 61.8% Fibonacci retracement level to challenge bulls.
GBP/USD struggles to extend the previous day’s recovery moves near 1.3585 heading into Monday’s London open. In doing so, the cable pair seesaws below a horizontal resistance region established from August 20.
However, a clear upside break of the 100-DMA and a three-week-long uptrend, portrayed by the short-term support line, join the bullish MACD signals to favor buyers battling the 1.3600-3610 resistance zone.
It’s worth noting that the 61.8% Fibonacci retracement level of September-December downside, near 1.3625, adds to the upside filters before fueling the GBP/USD prices towards November’s peak near 1.3700.
Following that, the 200-DMA level surrounding 1.3740 will challenge the pair buyers afterward.
On the contrary, a convergence of the 100-DMA and aforementioned support line restricts short-term declines of the GBP/USD pair near 1.3555-3550.
Even if the cable pair drops below 1.3550, November 18 swing high and 38.2% Fibonacci retracement level, close to 1.3515 and 1.3450 in that order, will challenge the pair sellers.
GBP/USD: Daily chart
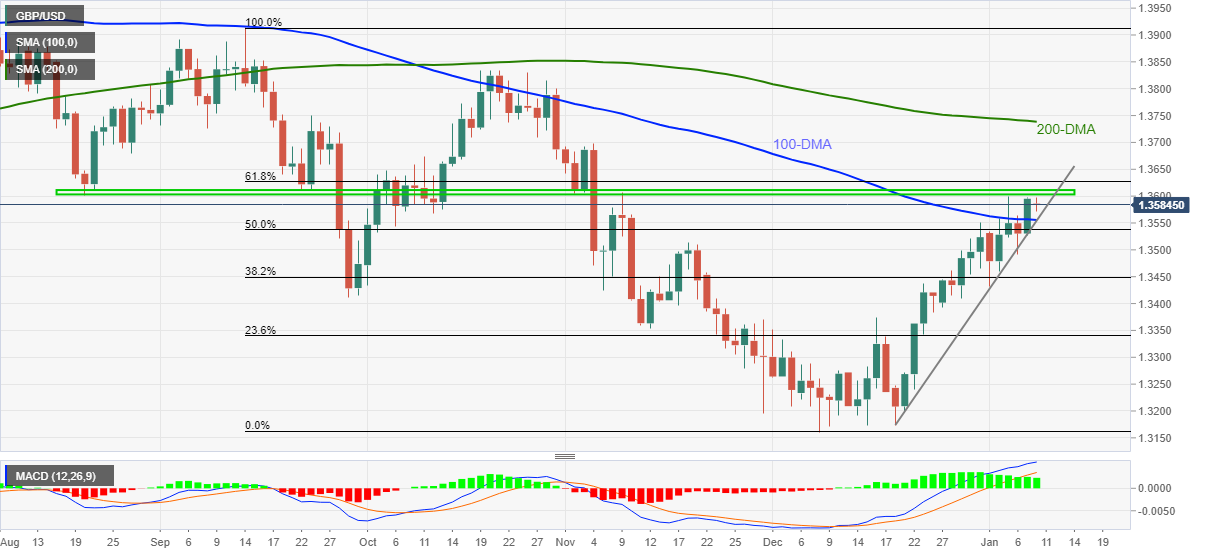
Trend: Further upside expected
- EUR/USD consolidates the biggest daily gains in a month while refreshing intraday low.
- US NFP disappointed greenback bulls but details keep Fed hawks on the table.
- EU inflation jumped to post-pandemic high, ECB’s Schnabel, Lane raise concerns over energy prices.
- Off in Japan, light calendar restricts market moves, US CPI will be the key.
EUR/USD remains on the back foot around 1.1340-35 as traders pare the biggest daily jump in a month during early Monday morning in Europe.
The major currency pair rallied the previous day after the US jobs report for December flashed mixed signals. Adding to the bullish bias were hawkish comments from the European Central Bank (ECB) officials and a jump in the Eurozone inflation data for the last month. However, details of the US employment keep the Fed hawks on the table ahead of this week’s key US Consumer Price Index (CPI). As a result, the cautious sentiment allows traders to recover Friday’s gains.
That said, the headline US Nonfarm Payrolls (NFP) disappointed markets with 199K figures for December versus 400K forecasts and 249K prior (upwardly revised from 210K). However, the Unemployment Rate dropped to 3.9% compared to 4.1% market consensus and 4.2% in November while the U6 Underemployment Rate that fell to 7.3% against November's downwardly revised 7.7%, both closing in the pre-pandemic levels. As it can be easily observed, the NFP-led disappointment was largely overruled by the Unemployment Rate and U6 Underemployment Rate, which in turn seems to challenge the market sentiment of late.
Elsewhere, the first readings of the Eurozone CPI for December offered a positive surprise of 5.0% while crossing the previous month’s figure of 4.9% and 4.7% market consensus. As the inflation figures reached the highest level since the early pandemic days, EUR/USD bulls recollect Thursday’s comments from European Central Bank Chief Economist Philip Lane to tighten the grips.
Following that, ECB board member Isabel Schnabel said on Saturday, “Rising energy prices may force the European Central Bank to stop ‘looking through’ high inflation and act to temper price growth.”
It should, however, be noted that the virus woes are firmer in the bloc than the US while the Fed versus the ECB battle also favors the EUR/USD bears. Furthermore, market bets for the Fed rate hikes in March stay around 80% while top banks, like Goldman Sachs, expect four rate hikes in 2022, which in turn challenges the pair buyers ahead of Wednesday’s US inflation data, as well as Friday’s US Retail Sales, for December.
For an intraday basis, an absence of Japanese traders restricts bond moves and hence the latest pullback may continue.
Read: Inflation and geopolitics in the week ahead
Technical analysis
Although the quote offered a decisive break of the 21-day EMA, backed by the bullish MACD signals, EUR/USD pair traders remain cautious until the prices stay between a two-month-old ascending triangle pattern. That said, an envelope of the 50-day EMA and the 21-day EMA, respectively near 1.1375 and 1.1325, restricts short-term EUR/USD moves.
- Asia-Pacific shares dribble amid a lack of major catalysts, off in Japan.
- China tries to defend struggling developers, Evergrande bond coupon payment looms while Shimao fastens asset sales.
- Australia Building Permits improved in November, covid woes escalate.
- Light calendar keeps traders on the edge after Friday’s US jobs report tested Fed hawks ahead of this week’s inflation.
Asian equities fluctuate within a minor range during early Monday as the regional leader Japan celebrates the Coming-of-Age Day holiday. Also challenging the market moves are mixed concerns over the short-term outlook of Friday’s US employment data and China’s efforts to battle the covid and financial crisis.
That said, MSCI’s index of Asia-Pacific shares ex-Japan rises 0.30% but the S&P 500 Futures remain pressured despite reversing most of the early Asian session losses.
“Officials in Guangdong province are facilitating meetings between struggling developers and SOEs to encourage mergers and acquisitions, according to a report by Cailian,” per Bloomberg. The news also cited Evergrande’s plan to delay the early interest repayment option on its one-year bond. Further, China’s Shimao group is selling its assets and tames the fears of a financial market crackdown.
It’s worth noting that the virus woes escalate in Asia-Pacific, as well as abroad, with multiple countries reporting all-time high daily COVID-19 infections and death tolls. Even so, hopes of US stimulus and China’s readiness to keep the markets liquid favor bulls.
Looking backward, Friday’s US employment details for December confused markets as the headlines Nonfarm Payrolls (NFP) disappointed bulls but Unemployment Rate and U6 Underemployment Rate reached pre-pandemic levels.
Elsewhere, Australia’s Building Permits for November rose past -12.9% prior and 0.0% expected to +3.6% MoM.
Amid these plays, ASX 200 prints mild losses while New Zealand’s NZX 50 drops 0.80% as fears of virus spread in Auckland gets more attention. Chinese equities print mild gains and so do shares from Indonesia, South Korea and India.
Additionally, the US Dollar Index (DXY) licks its wounds while commodities remain depressed while consolidating the previous day’s gains.
Moving on, this week’s US Consumer Price Index (CPI) will be crucial for markets as the bets on the Fed rate hike during March 2022 remain near 80% while Goldman Sachs signals four such actions in the current year.
Read: Inflation and geopolitics in the week ahead
- USD/INR keeps falling for the fourth day in a row, near 74.00.
- Surging covid cases in India, DXY’s solid comeback fails to lift the pair.
- Weekly closing below 200-DMA calls for more pain for USD/INR.
USD/INR is extending its losing streak into the fourth straight day on Monday, little affected by the broad rebound in the US dollar and surging coronavirus cases in India.
India’s active coronavirus cases see the biggest single-day rise since April 23, rise to highest since June 20. Meanwhile, the country detects 410 fresh cases of omicron coronavirus variant, as of Monday.
Meanwhile, the US dollar is rebounding after Friday’s NFP disappointment-led sell-off vs. its major peers. The cautious market mood also underpins the dollar’s safe-haven demand, as the attention turns towards this week’s testimony by Fed Chair Jerome Powell and US inflation data.
The ongoing rally in oil prices, courtesy of the geopolitical tensions between Russia and Kazakhstan also fail to deter INR bulls, as the cross eyes more downside going forward.
At the time of writing, the spot is trading close to the daily lows of 74.15, looking to test the 74.00 round level.
The bearish outlook remains intact after the pair gave a weekly closing below the critical 200-Daily Moving Average (DMA) at 74.29 on Friday.
The immediate cap is seen at the December 31 lows of 74.10. Further south, the November 9 lows of 73.85 will be put to test.
The 14-day Relative Strength Index (RSI) is inching towards the oversold region, well below the midline, suggesting that there is more room to fall for the pair.
USD/INR: Daily chart
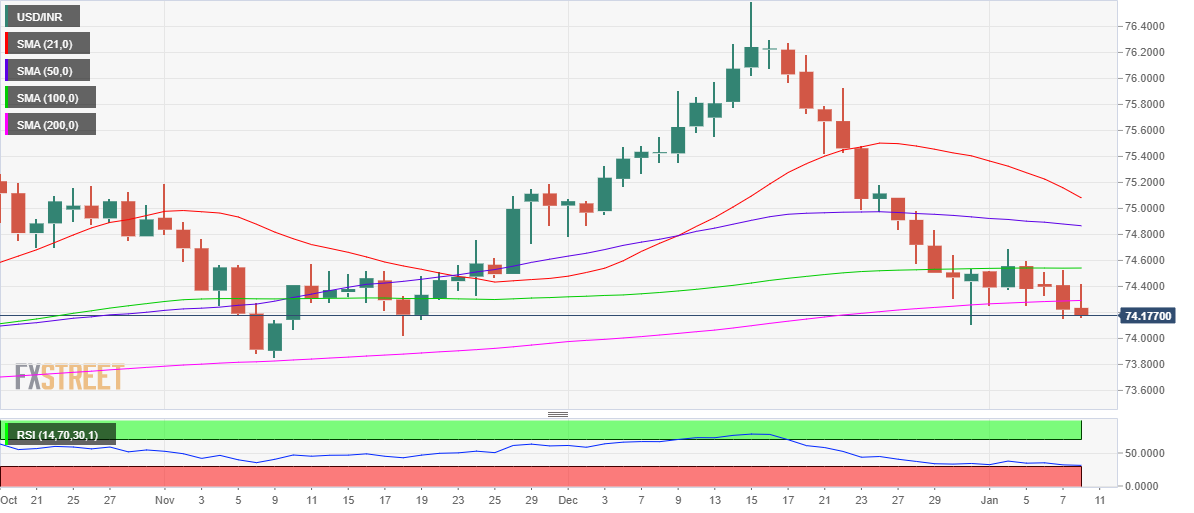
On the other hand, recapturing 200-DMA could trigger a fresh recovery rally towards the 100-DMA at 74.54.
Further up, the January high of 74.69 will be on buyers’ radars.
USD/INR: Additional levels
- GBP/JPY extends Friday’s rebound, stays firmer around intraday top at the latest.
- Two-day-old ascending trend line guards immediate upside ahead of the horizontal area from December 04.
- Upward sloping support line from the last Monday, 100-HMA restricts nearby losses.
GBP/JPY picks up bids to 157.32, up 0.14% intraday, while portraying the second consecutive daily gains during early Monday morning in Europe.
Even so, overbought RSI conditions and the short-term key resistances challenge the pair buyers.
Among them, an upward sloping trend line from Thursday, near 157.40, acts as an immediate resistance, a break of which will direct the quote towards a one-week-long horizontal resistance region near 157.45-50.
If at all the GBP/JPY buyers manage to keep reins past 157.50, the recent highs of 157.76 may act as a buffer ahead of challenging the year 2021 peak of 158.22.
Meanwhile, pullback moves remain elusive until staying beyond the short-term support line and the 100-HMA, respectively near 157.00 and 156.85.
However, a clear downside break of 156.85 will direct the quote towards Thursday’s low of 156.00, a break of which will challenge the GBP/JPY bulls to rethink their upside bias.
GBP/JPY: Hourly chart
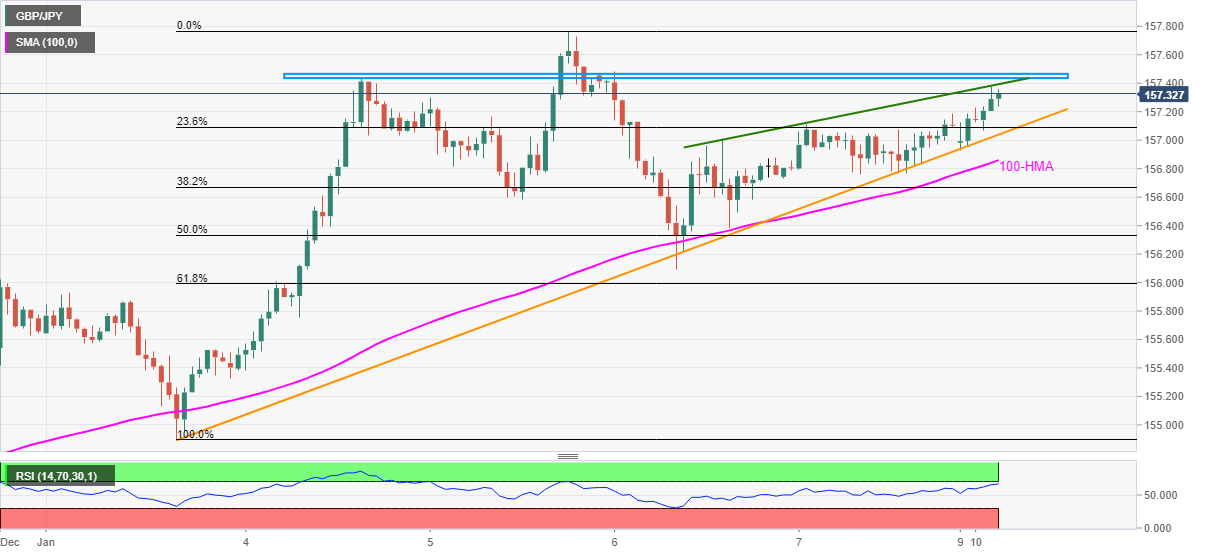
Trend: Pullback expected
The worst is far from over for the Chinese troubled property sector, as investors remain wary ahead of the deadline for bondholders to vote on property-giant Evergrande Group’s plan to delay an option for early repayment on one of its yuan-denominated bonds.
According to Bloomberg, “an online meeting held by the property developer’s onshore unit Hengda Real Estate for holders of the note is due to conclude later Monday. The bond is its 4.5 billion yuan ($706 million) 6.98% security due 2023, which has a Jan. 8 put option.”
Separately, officials in Guangdong province reportedly set up a meeting between distressed developers and state-owned property firms. Developer Shimao Group has meanwhile commissioned agents in Hong Kong to speed up disposal of assets amid a missed loan payment, Caixin reported.
Market reaction
Amid a cautious mood, in light of the recent bond market rout, the S&P 500 futures are losing 0.08% on the day while AUD/USD’s rebound remains capped by 0.7200.
- DXY consolidates the biggest daily loss in six weeks.
- RSI divergence, failures to drop beneath 50-DMA keep buyers hopeful.
- 21-DMA guards immediate upside, rising trend line from May becomes crucial support.
US Dollar Index (DXY) licks its wounds around 95.85, up 0.11% intraday during early Monday.
The greenback gauge dropped the most since mid-November on Friday’s mixed readings of the US jobs data for December. However, the prices mismatch with the RSI and join the repeated failures to break the 50-DMA to favor the bulls.
Hidden bullish RSI divergence can be portrayed by the higher lows of the prices and lower lows of the RSI line. These are the conditions witnessed during the DXY moves of late November and December.
Hence, the latest rebound is likely to extend towards the 21-DMA resistance level surrounding 96.15. Though, the monthly peak of 96.46 and multiple hurdles below the 97.00 threshold will challenge the US Dollar Index upside afterward.
On the contrary, a sustained trading below the 50-DMA level of 95.83 will direct DXY towards an ascending support line from May, near 95.00 by the press time.
Should the quote drop below 95.00, the short-term bullish trend is likely to have waned.
DXY: Daily chart
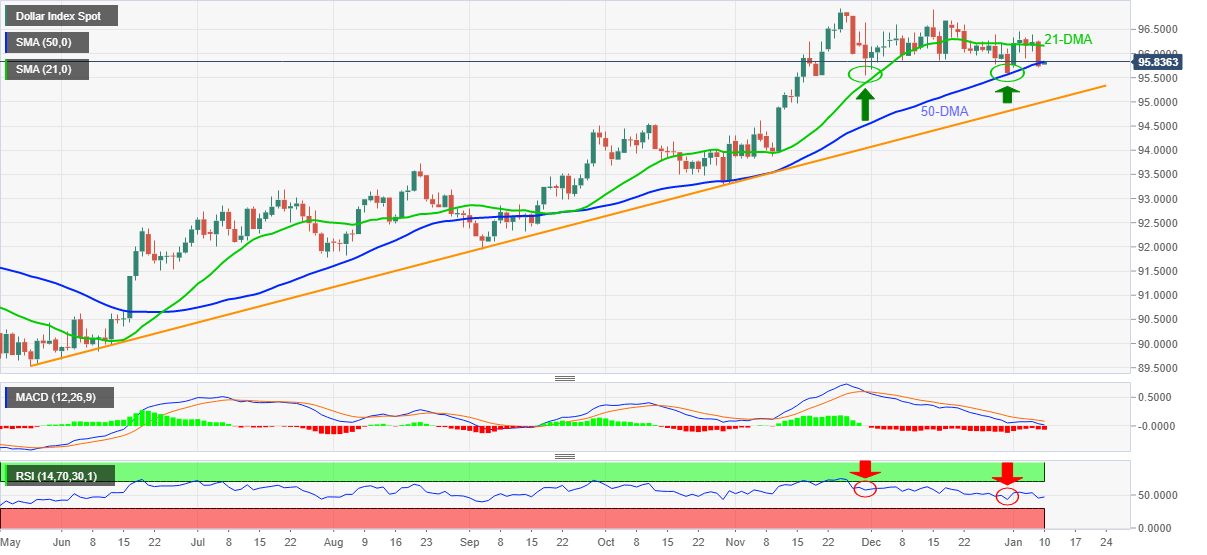
Trend: Further advances expected
The Bank of Japan (BOJ) is expected to raise its forecast for FY 2021-2022 inflation at its January 17 and 18 monetary policy meeting, the Yomiuri newspaper reported over the weekend.
Key takeaways
“The central bank’s outlook for price trends for fiscal 2022, currently at 0.9%, will be raised to 1% or higher.”
“The possible revision is due mainly to the supply-chain disruptions triggered by the Covid-19 pandemic.”
“The BOJ is likely to decide on continuing the current easing measures.”’
Market reaction
USD/JPY is trading in a narrow range of around 115.60, up 0.06% on the day.
-
USD/JPY remains sluggish around 115.50 amid Japan’s off
| Raw materials | Closed | Change, % |
|---|---|---|
| Brent | 81.88 | -0.4 |
| Silver | 22.307 | 0.49 |
| Gold | 1794.483 | 0.18 |
| Palladium | 1925.03 | 3.09 |
- USD/TRY remains sidelined around the highest levels in three weeks.
- CBRT data hints at total market intervention of $7.3 billion during December.
- US jobs report drowned DXY but a recheck keeps Fed hawks on the table.
- Inflation, covid woes test market players amid sluggish start to the key week.
USD/TRY seesaws around $13.80 during a sluggish start to the week. In doing so, the Turkish lira pair extends the previous day’s lackluster moves around a three-week top amid mixed concerns.
That said, the USD/TRY pair traders seem to struggle between the indecision over the Fed’s next move and doubts over the Turkish central bank’s capacity to keep TRY afloat. Also acting as trade barriers are the fears of the coronavirus variant linked to South Africa, namely Omicron, as well as geopolitical tensions surrounding Russia-Ukraine and US-China.
As per the official data from the Central Bank of the Republic of Turkey (CBRT), the Turkish central bank sold around $7.3 billion in domestic currency during December. The big move to propel lira raised doubts among investors fraternity as the Financial Times (FT) said, “Turkey spent more than $7.0 billion on propping up the lira in December, official data showed, as analysts warned that backdoor interventions meant that the true toll of the currency defense was even higher.”
On the contrary, the US Dollar Index (DXY) portrayed the biggest daily loss in six weeks after the December month jobs report failed to impress Fed hawks, recently up 0.10% near 95.80.
While Friday’s DXY slump could be linked to the mixed US jobs report, the latest consolidation seems to take clues from the future market bets suggesting nearly 80% chances of Fed’s rate hike in March. That said, the headline US Nonfarm Payrolls (NFP) disappointed markets with 199K figures for December versus 400K forecasts and 249K prior (upwardly revised from 210K). However, the Unemployment Rate dropped to 3.9% compared to 4.1% market consensus and 4.2% in November while the U6 Underemployment Rate that fell to 7.3% against November's downwardly revised 7.7%, both closing in the pre-pandemic levels.
Elsewhere, US-China tussles continue, recently over trade and the human rights issues, while the Russia-Ukraine matter gains major attention ahead of this week’s Washington-Moscow meeting, which in turn challenge the market sentiment.
It should be noted that the record top covid infections in Turkey, with the latest daily infections being 68,413, also challenge the USD/TRY bears.
Looking forward, risk catalysts may entertain USD/TRY traders but major attention will be given to Wednesday’s US Consumer Price Index (CPI) and Friday’s US Retail Sales for fresh impulse.
Read: Inflation and geopolitics in the week ahead
Technical analysis
Friday’s bearish Doji at multi-day high signals USD/TRY pullback towards the 21-DMA level of $13.33. However, any further downside will make the quote vulnerable to drop towards 38.2% Fibonacci retracement of December 20-23 downside, near $12.15.
Meanwhile, further recoveries remain elusive until the quote rises past December 21 top surrounding $14.15. Following that, the $15.00 threshold and $17.20 may test the USD/TRY bulls before directing them to the last month’s high, also the record top, around $18.35.
China should act on its macro policies before the US Federal Reserve's potential "steeper-than-previously-expected" monetary tightening, Chinese media outlet reports, citing comments from Yu Xuejun, a former official of the China Banking and Insurance Regulatory Commission (CBIRC).
Meanwhile, the country’s former Finance Minister Zhu Guangyao warned that “if the Fed starts to accelerate Tapering at the same time as raising interest rates, such stronger impact on emerging markets should be highly vigilant,” the Chinese daily said.
Related reads
- USD/CNH could now retest the 6.4000 level – UOB
- PBOC: Will implement new schemes to support small businesses hit by covid impact
- USD/CAD keeps corrective decline intact from six-day highs of 1.2813.
- The oil price recovery and the US dollar’s weakness weighed heavily on the spot.
- The pair’s falling wedge breakout on the daily sticks appears to be a fakeout.
Having faced rejection once again near 1.2810 in the previous week. USD/CAD changed its course and kicked off a remarkable pullback.
The downturn in the currency pair was helped by the rebound in WTI prices and the renewed US dollar’s weakness, as investors assessed the mixed American labor market report released on Friday.
The headline US NFP disappointed with 199K in December, although the hourly wages were a big surprise. The tech sell-off on Wall Street is what really caused trouble for the greenback, despite the Fed rate hike outlook for this year.
Meanwhile, stronger Canadian employment data also boded well for the CAD, collaborating with the downside in the major. The focus this week remains on the US inflation report and retail sales data amid a relatively light week.
Technically, USD/CAD confirmed a falling wedge breakout on Wednesday after closing the day above the falling trendline resistance at 1.2743. Although that appears to be a fakeout after the pair turned south on failure to find acceptance above the critical 21-Daily Moving Average (DMA) at 1.2787.
That said, the price is now testing the horizontal 100-DMA at 1.2627, having breached the 50-DMA support at 1.2693, where the wedge resistance-turned-support aligns.
A sustained break below the 100-DMA will open the additional downside towards the wedge support at 1.2542. Ahead of that the 1.2600 level could be probed.
The 14-day Relative Strength Index (RSI) is holding well below the midline, backing the bearish potential.
USD/CAD: Daily chart
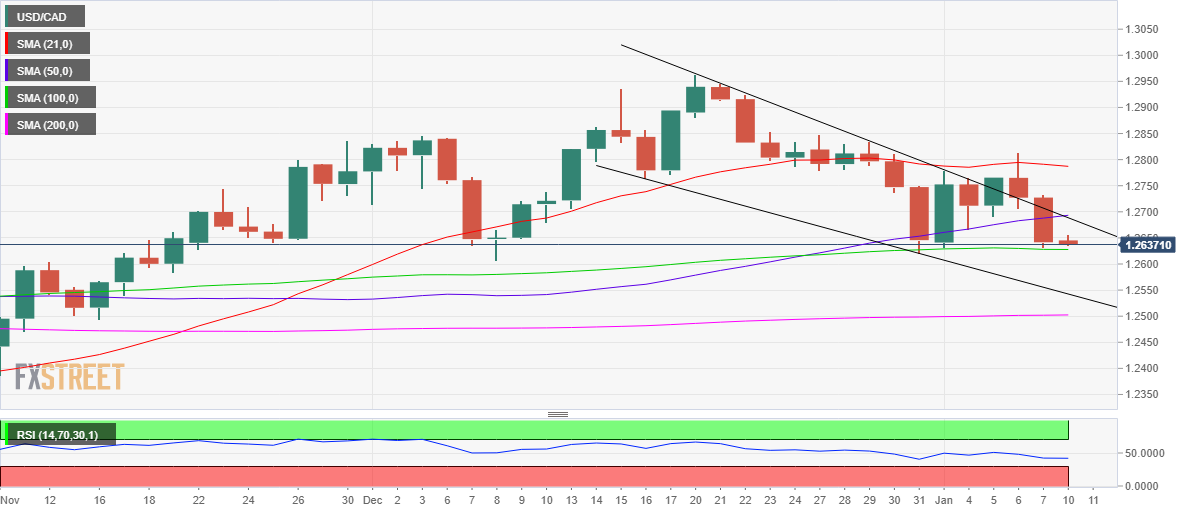
Recapturing the abovementioned powerful resistance near 1.2690 is critical to initiating any meaningful recovery.
Further up, bulls could once again challenge Friday’s high of 1.2732.
USD/CAD: Additional levels to consider
- AUD/USD takes the bids while extending Friday’s corrective pullback.
- 20-DMA guards immediate upside but 100-DMA becomes the key resistance.
- Horizontal area from August appears a tough nut to crack for sellers.
AUD/USD keeps the previous day’s recovery moves as it approaches 0.7200 threshold, up 0.11% intraday during early Monday.
The Aussie pair bounced off the 23.6% Fibonacci retracement of (Fibo.) October-December downside, around 0.7125 on Friday. However, the quote remains below stays below the 20-DMA level surrounding 0.7195, not to forget keeping the pullback from the 100-DMA. The inability to cross the key moving averages joins the receding bullish bias of the MACD and steady RSI to keep sellers hopeful.
That said, fresh downside will aim for the 23.6% Fibo. retest, around 0.7125, ahead of targeting a horizontal area from August 20 near 0.7110-05.
Additionally, the 0.7100 round figure may also test the pair bears, a break of which will direct AUD/USD sellers towards 0.7050 and then to the 0.7000 psychological magnet.
On the contrary, the 20-DMA level of 0.7195 guards the quote’s immediate upside before directing AUD/USD buyers towards the 50% Fibonacci retracement level of 0.7280.
However, the 100-DMA surrounding 0.7290 becomes a tough nut to crack for the pair bull, a break of which will not hesitate to challenge the mid-November peak of .7371.
AUD/USD: Four-hour chart
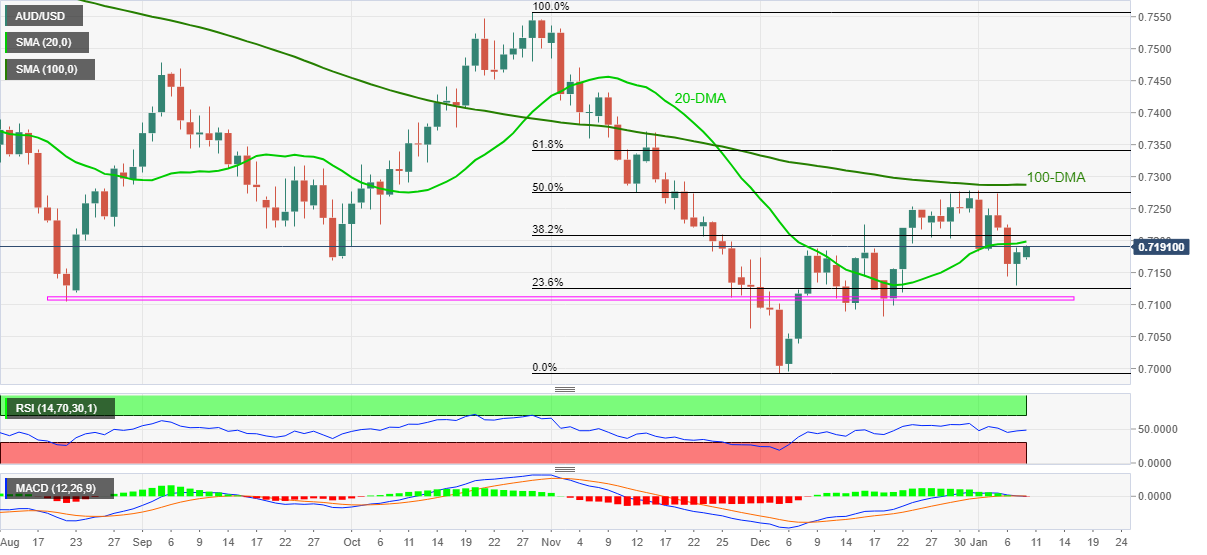
Trend: Bearish
- USD/JPY pauses two-day downtrend, bounces off intraday low during a sluggish session.
- US jobs report drowned DXY with mixed signals on Friday but covid woes put a floor to the greenback’s weakness.
- Three prefectures in Japan entered a quasi-state of emergency on Sunday due to covid.
- Japanese markets are off due to the Coming-of-Age Day, the light calendar adds to the trading inaction.
USD/JPY treads water around 115.60 as the holiday in Japan and an absence of major data/events restricts the pair’s moves during Monday’s Asian session.
In addition to the absence of domestic players, who are the key for global bond markets, mixed concerns over the Fed’s next move and the coronavirus also limit the risk barometer pair’s latest moves.
The US Dollar Index (DXY) portrayed the biggest daily loss in six weeks after the December month jobs report failed to impress Fed hawks.
That said, the headline US Nonfarm Payrolls (NFP) disappointed markets with 199K figures for December versus 400K forecasts and 249K prior (upwardly revised from 210K). However, the Unemployment Rate dropped to 3.9% compared to 4.1% market consensus and 4.2% in November while the U6 Underemployment Rate that fell to 7.3% against November's downwardly revised 7.7%, both closing in the pre-pandemic levels.
It should be noted, however, that an NFP-led disappointment was largely overruled by the Unemployment Rate and U6 Underemployment Rate, which in turn seems to challenge the market sentiment of late. As a result market bets for the Fed rate hike in March 2022 remains around 80%, following Friday’s uptick to 90% ahead of the data.
Read: US Payrolls Disappoint for the Second Month: Economy seems strong despite Omicron
At home, Okinawa, Hiroshima and Yamaguchi prefectures witness fresh virus-led activity restrictions starting from Sunday that will last till January 31. “Three Japanese prefectures hosting or neighboring U.S. military bases continued to see high coronavirus cases Sunday as COVID-19 quasi-emergency measures took effect in response to surging infections that their governors say stem from the spread of the Omicron variant at the U.S. facilities,” said Kyodo News.
Elsewhere, the US-China tussles continue, recently over trade and the human rights issues, while Russia-Ukraine matter gains major attention ahead of this week’s Washington-Moscow meeting.
Amid these plays, S&P 500 Futures drop 0.20% while the Asia-Pacific shares ex-Japan traded mixed by the press time.
Moving on, a light calendar may restrict market moves on top of Japan’s holidays. However, cautious sentiment ahead of this week’s US inflation numbers and Retail Sales for December may keep the US Treasury yields on the front foot, which in turn can keep the USD/JPY buyers hopeful.
Technical analysis
A clear downside break of the three-week-old ascending trend line, near 115.80 by the press time, keeps USD/JPY sellers hopeful around November’s peak of 115.52.
| Time | Country | Event | Period | Previous value | Forecast |
|---|---|---|---|---|---|
| 00:00 (GMT) | Australia | MI Inflation Gauge, m/m | December | 0.3% | |
| 00:30 (GMT) | Australia | Building Permits, m/m | November | -13.6% | 0% |
| 10:00 (GMT) | Eurozone | Unemployment Rate | November | 7.3% | 7.2% |
| 15:00 (GMT) | U.S. | Wholesale Inventories | November | 2.5% | 1.2% |
The People’s Bank of China (PBOC) set the USD/CNY reference rate at 6.3653 on Monday while comparing to the previous fix and the previous close at 6.3742 and 6.3777 respectively.
Following the release of daily fix, Reuters conveyed the PBOC statement saying, "China central bank injects 10 billion yuan via 7-day reverse repos at 2.20% vs prior 2.20%."
It's worth noting that the PBOC withdrew the most fund from the market since November in the last week. “China’s central bank injected minimal cash via short-term loans into the banking system on Friday, effectively withdrawing most of the liquidity support lent towards end-2021,” said Reuters. The news adds, “The PBOC drained 660 billion yuan on a net basis – the biggest weekly cash withdrawal since early November.”
- WTI extends Friday’s pullback from a two-month high, battles support line of a short-term bearish chart pattern.
- 50-SMA adds to the downside filters, bearish MACD and failures to cross $80.00 keep sellers hopeful.
WTI remains pressured towards $78.00, down 0.80% intraday during Monday’s Asian session.
The black gold reversed from the highest levels since mid-November on Friday while portraying the buyers’ exhaustion inside a monthly rising wedge bearish pattern.
That said, the commodity’s inability to cross the $80.00 threshold and downbeat MACD signals hint at the further downside of the quote.
However, a clear break of $78.00 won’t be necessary for the WTI bears as the 50-SMA level surrounding $76.90 tests the sellers.
On breaking the $76.90 support, WTI crude oil confirms a bearish chart pattern with theoretical target near late December’s low close to $66.00. Though, a convergence of the 200-SMA and 50% Fibonacci retracement (Fibo.) of November – December downside, around $72.80-90, will offer an intermediate halt during the fall.
Alternatively, an upside clearance of the $80.00 will be a trigger for the oil prices rally towards the $84.00, near to November’s top. Following that, the year 2021 peak near $85.00 will be in focus.
WTI: Four-hour chart
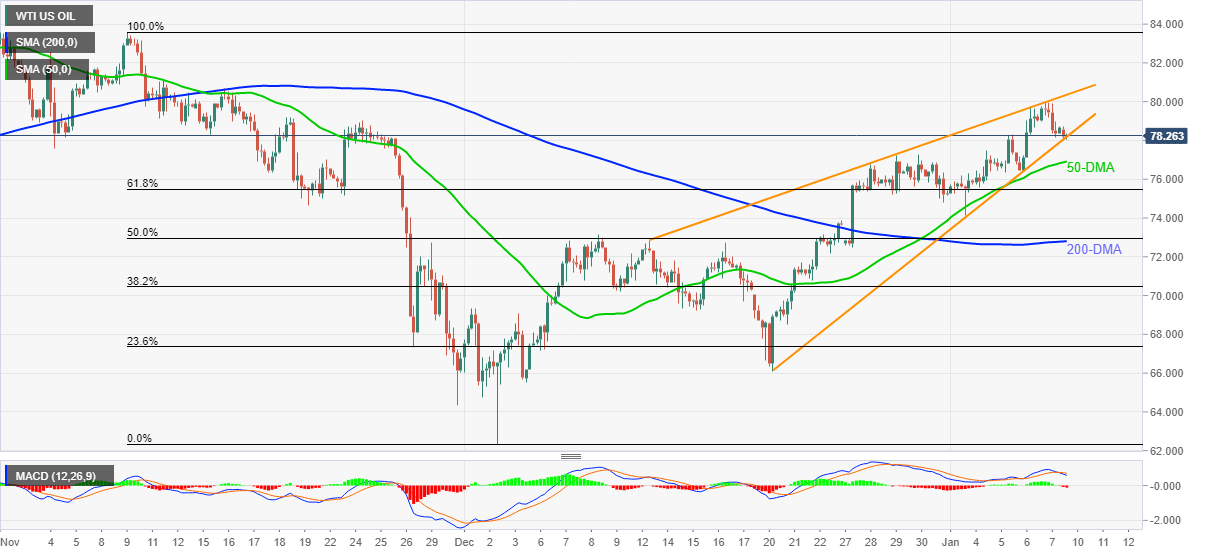
Trend: Further weakness expected
- Gold prices fade bounce off five-month-old support line.
- Risk appetite remains weak on mixed concerns over coronavirus, Fed’s next moves.
- Geopolitical fears, market bets for Fed rate hike in March 2022 weigh on sentiment, US CPI is the key.
- Gold Weekly Forecast: Technicals and rising US yields point to lower XAU/USD
Gold (XAU/USD) offers a sluggish week-start to the markets while fading the previous day’s rebound near $1,795 during Monday’s Asian session.
In doing so, the gold prices portray typical market inaction amid an absence of major data/events, as well as due to the recently mixed signals from the US employment report and the global coronavirus details.
That said, the headline US Nonfarm Payrolls (NFP) disappointed markets with 199K figures for December versus 400K forecasts and 249K prior (upwardly revised from 210K). However, the Unemployment Rate dropped to 3.9% compared to 4.1% market consensus and 4.2% in November while the U6 Underemployment Rate that fell to 7.3% against November's downwardly revised 7.7%, both closing in the pre-pandemic levels.
The US Dollar Index (DXY) portrayed the biggest daily loss in six weeks after the December month jobs report failed to impress Fed hawks.
It should be noted, however, that an NFP-led disappointment was largely overruled by the Unemployment Rate and U6 Underemployment Rate, which in turn seems to challenge the market sentiment of late. As a result market bets for the Fed rate hike in March 2022 remains around 80%, following Friday’s uptick to 90% ahead of the data.
Read: US Payrolls Disappoint for the Second Month: Economy seems strong despite Omicron
Elsewhere, global covid cases crossed the 10 million mark and the death toll recently jumped in the UK, as well as the US. On the same line are the concerns that the latest virus strain linked from France named IHU, which has both the characteristics of Omicron and Delta while showing the capacity to wider spread. It should, however, be noted that scientific studies keep the markets hopeful of overcoming the virus spread with lesser damages, health-wise, than the previous rounds of the virus spread.
Further, the US-China tussles continue, recently over trade and the human rights issues, while the Russia-Ukraine matter gains major attention ahead of this week’s Washington-Moscow meeting, which in turn challenge the market sentiment.
Amid these plays, S&P 500 Futures drop 0.20% and the DXY stabilizes around 95.75 amid an absence of the Japanese bond traders.
Moving on, gold traders will keep their eyes on the US Consumer Price Index (CPI) and Retail Sales details for December, up for publishing on Wednesday and Friday respectively, to get a confirmation of March’s rate hike. Meanwhile, challenges to market sentiment may weigh on the quote.
Technical analysis
Friday’s corrective pullback from an ascending support line from early August, around $1,785 by the press time, fails to push gold buyers towards the 200-DMA level of $1,800 for one more time.
The failures to rebound join bearish MACD signals and steady RSI to keep sellers hopeful of breaking the $1,785 support, which in turn will drag the metal towards $1,770 before challenging the multiple levels around $1,760.
It should be noted, however, that a clear downside break of the $1,760 will be a green signal for the gold bears to aim for September’s low of $1,721.
Alternatively, the 200-DMA level surrounding $1,801 guards the quote’s immediate upside ahead of a horizontal area established from late October, surrounding $1,815. However, any further advances will be challenged by tops marked during July and September around $1,834.
Should the gold buyers manage to cross the $1,834 hurdle, $1,850 and November’s peak of $1,877 will gain the market’s attention.
Gold: Daily chart
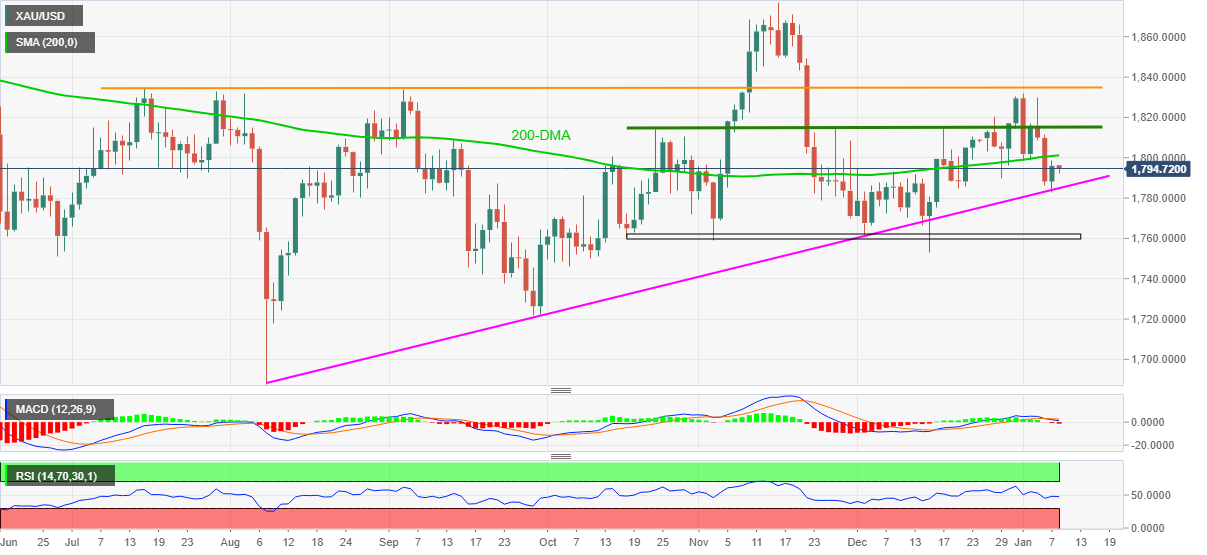
Trend: Pullback expected
- GBP/USD defends Friday’s run-up towards crucial resistance, remains sidelined of late.
- Make UK, PwC survey cites UK manufacturers’ optimism for 2022.
- Virus woes stay on the table despite easing infections as death toll crosses 150,000.
- EU ‘not impressed’ as UK’s Truss shows readiness to trigger Article 16.
GBP/USD buyers struggle for clear directions as the cable pair takes rounds to 1.3590 during Monday’s Asian session, following the strongest daily run-up in over a week.
The cable pair’s latest inaction could be linked to the contrasting signals by the key risk catalysts as well as an absence of the major data/events during the generally tepid Asian session.
The US Dollar Index (DXY) portrayed the biggest daily loss in six weeks after the December month jobs report failed to impress Fed hawks. That said, the headline Nonfarm Payrolls (NFP) disappointed markets with 199K figures for December versus 400K forecasts and 249K prior (upwardly revised from 210K). However, the Unemployment Rate dropped to 3.9% compared to 4.1% market consensus and 4.2% in November while the U6 Underemployment Rate that fell to 7.3% against November's downwardly revised 7.7%, both closing in the pre-pandemic levels.
It should be noted, however, that an NFP-led disappointment was largely overruled by the Unemployment Rate and U6 Underemployment Rate, which in turn seems to challenge the market sentiment of late.
While portraying the same, S&P 500 Futures drop 0.20% intraday while the Antipodeans and commodities remain pressured by the press time.
Elsewhere, the latest reduction in the UK’s covid cases and death toll, recently around 147,472 and 97 in that order, fails to renew market optimism as the virus-led death numbers crossed 150,000. Following the news, UK PM Boris Johnson said the covid has "taken a terrible toll on our country" while pushing for vaccination and thanking the National Health Service (NHS).
It’s worth noting that the Brexit front flashed another negative signal as the UK’s newly appointed Brexit Minister Liz Truss wrote to Telegraph on Saturday, “insisted she was ‘willing’ to use the ‘legitimate provision’ should a ‘negotiated solution’ not be reached on the Northern Ireland Protocol,” per the Daily Express. “Joao Vale de Almeida, the EU's ambassador to the UK, said it was unhelpful to ‘keep agitating the issue’, noting the bloc was not surprised by the threat but ‘we are not too impressed,’” adds the news.
On a positive side, the British manufacturers remain optimistic per the latest survey details of the UK think tank and PwC. "Trade body Make UK and accountants PwC said 73% of manufacturers believed conditions for the sector would improve and 78% foresaw at least a moderate increase in productivity in 2022," said Reuters.
Looking forward, a light calendar at home and an absence of Japanese traders could restrict GBP/USD moves in Asia, as well as early Europe. However, the cable pair’s recent recovery may persist should the greenback fails to recovery Friday’s losses.
Technical analysis
A clear upside break of the 100-DMA, surrounding 1.3555 by the press time, keeps GBP/USD buyers hopeful to overcome the 1.3600-10 resistance zone established since October 2021.
| Pare | Closed | Change, % |
|---|---|---|
| AUDUSD | 0.71805 | 0.26 |
| EURJPY | 131.322 | 0.41 |
| EURUSD | 1.13592 | 0.57 |
| GBPJPY | 157.163 | 0.3 |
| GBPUSD | 1.35945 | 0.5 |
| NZDUSD | 0.67732 | 0.46 |
| USDCAD | 1.26393 | -0.61 |
| USDCHF | 0.91852 | -0.27 |
| USDJPY | 115.61 | -0.17 |


© 2000-2026. Sva prava zaštićena.
Sajt je vlasništvo kompanije Teletrade D.J. LLC 2351 LLC 2022 (Euro House, Richmond Hill Road, Kingstown, VC0100, St. Vincent and the Grenadines).
Svi podaci koji se nalaze na sajtu ne predstavljaju osnovu za donošenje investicionih odluka, već su informativnog karaktera.
The company does not serve or provide services to customers who are residents of the US, Canada, Iran, The Democratic People's Republic of Korea, Yemen and FATF blacklisted countries.
Izvršenje trgovinskih operacija sa finansijskim instrumentima upotrebom marginalne trgovine pruža velike mogućnosti i omogućava investitorima ostvarivanje visokih prihoda. Međutim, takav vid trgovine povezan je sa potencijalno visokim nivoom rizika od gubitka sredstava. Проведение торговых операций на финанcовых рынках c маржинальными финанcовыми инcтрументами открывает широкие возможноcти, и позволяет инвеcторам, готовым пойти на риcк, получать выcокую прибыль, но при этом неcет в cебе потенциально выcокий уровень риcка получения убытков. Iz tog razloga je pre započinjanja trgovine potrebno odlučiti o izboru odgovarajuće investicione strategije, uzimajući u obzir raspoložive resurse.
Upotreba informacija: U slučaju potpunog ili delimičnog preuzimanja i daljeg korišćenja materijala koji se nalazi na sajtu, potrebno je navesti link odgovarajuće stranice na sajtu kompanije TeleTrade-a kao izvora informacija. Upotreba materijala na internetu mora biti praćena hiper linkom do web stranice teletrade.org. Automatski uvoz materijala i informacija sa stranice je zabranjen.
Ako imate bilo kakvih pitanja, obratite nam se pr@teletrade.global.
транcфери