- Analiza
- Novosti i instrumenti
- Vesti sa tržišta
Forex-novosti i prognoze od 06-01-2022
US inflation expectations, as measured by the 10-year breakeven inflation rate per the St. Louis Federal Reserve (FRED) data, dropped for the third consecutive day to by the end of Thursday’s North American session, per the FRED website.
That said, the inflation gauge dropped to the 2.46% level at the latest, the lowest readings since December 21.
The softer inflation expectations test the market fears of the Fed’s early rate hike, which in turn challenge US Treasury yields and US dollar advances.
It’s worth noting that the recently hawkish Fedspeak and FOMC Minutes weighed on the commodity prices. As a result, the US 10-year Treasury yields refreshed a nine-month high to poke 1.75% before closing with 2.5 basis points (bps) of a daily gain near 1.728%. The same weighed on the Wall Street benchmarks even as downbeat data pushed bears to satisfy with smaller losses.
While the easy inflation expectations may allow traders to pare recent losses linked to the commodities and Antipodeans, hawkish hopes from the scheduled US jobs report may favor the US bond yields and the US dollar, which in turn may weigh on the commodities.
Read: Gold Price Forecast: XAU/USD bears await US NFP near five-month-old support below $1,800
- Gold remains pressured around two-week low, sidelined ahead of the key US employment data.
- Yields weighed down the commodities, Antipodeans, Omicron adds to the bearish bias.
- Fedspeak, FOMC Minutes raised hopes of faster rate hikes, fuelling yields and USD, but today’s US NFP is the key.
- Fed hawks grow stronger: Will gold stand its ground?
Gold (XAU/USD) licks its wound around $1,790 while bracing for the first weekly fall in four during early Friday’s Asian session. The yellow metal seesaws near a 12-day low amid the market’s cautious mood ahead of the US jobs report for December. Even so, bears remain hopeful on the recent hawkish signs from the US Federal Reserve (Fed).
The yellow metal slumped to the multi-day low the previous day after the latest Fedspeak backed a rush to rate lifts, after the Federal Open Market Committee (FOMC) Meeting Minutes conveyed hawkish bias of the policymakers, suggesting a faster rate-hike and plans to discuss balance-sheet normalization. That said, St. Louis Fed President James Bullard pushed for a March rate hike whereas Federal Reserve Bank of San Francisco President and an FOMC member Mary C. Daly marked the need to raise interest rates to keep the economy in balance.
Following the increased pressure towards tighter monetary policy and balance-sheet alteration, the US Treasury yields refreshed multi-day high. That said, the US 10-year Treasury yields refreshed a nine-month high to poke 1.75% before closing with 2.5 basis points (bps) of a daily gain near 1.728%. The same weighed on the Wall Street benchmarks even as downbeat data pushed bears to satisfy with smaller losses.
Other than the hawkish Fedspeak, fears of the South African covid variant, namely Omicron, also underpin the US Treasury yields and weigh on gold prices. Although figures in the UK have eased from record tops, the record-high numbers elsewhere push policymakers to announce multiple local activity restrictions, recently in Australia. It’s worth noting that the finding of a new virus variant in France, which spreads faster than Omicron, also challenges the market sentiment and weighs on gold prices.
Talking about the data, US Factory Orders, Weekly Jobless Claims, ISM Services PMI and Good Trade Balance all came in downbeat but couldn’t stop the US dollar bulls amid strong favor for the faster Fed rate hike, which in turn propelled the yields.
Looking forward, market fears of Omicron can entertain the gold sellers but major attention will be given to the December month jobs report from the US. Forecasts suggest the headlines Nonfarm Payroll (NFP) to rise from 210K to 400K while the Unemployment Rate may have eased to 4.1% from 4.2% prior. The underemployment rate, however, is likely rising from 7.8% to 8%. Given the upbeat expectations from the US employment data, Fed’s hawkish rhetoric is likely to be justified, which in turn could propel yields and the US dollar and may weigh on the gold prices.
Technical analysis
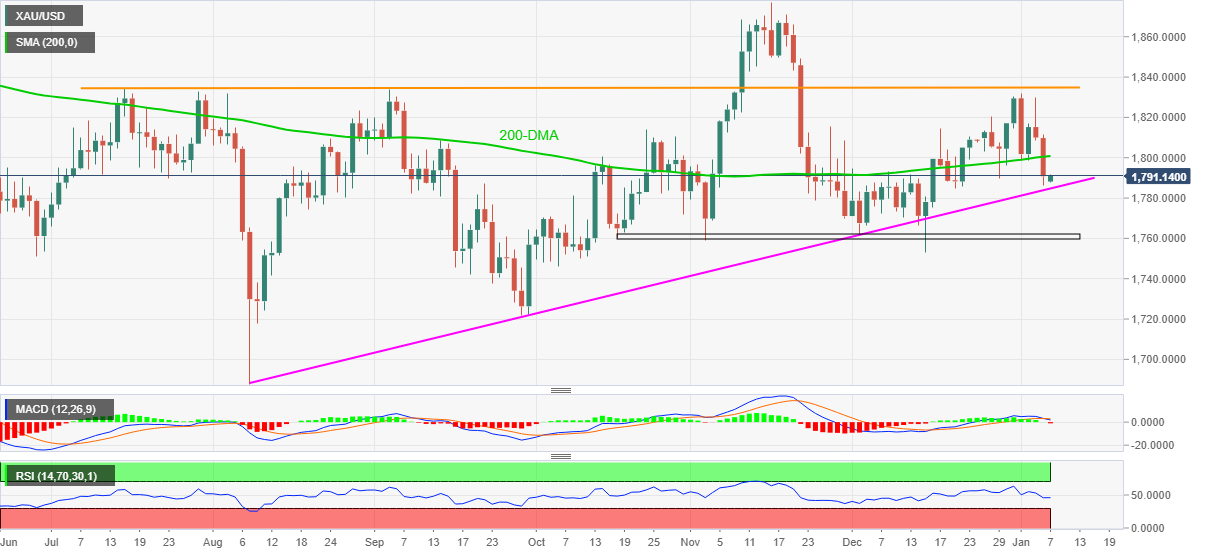
Although a clear break of the 200-DMA joins downbeat MACD signals and RSI retreat to keep gold sellers hopeful, an upward sloping trend line from August, close to $1,780, challenges the metals further downside.
Should gold bears conquer the $1,780 support, odds of a south-run towards a two-month-long horizontal area surrounding $1,760 can’t be ruled out. However, any further weakness will make gold prices vulnerable to slump towards September’s low surrounding $1,721.
Meanwhile, corrective pullback needs to stay beyond the 200-DMA level of $1,800 for a while before directing gold buyers towards October’s peak of $1,814 and the latest swing high close to $1,831.
It’s worth mentioning that tops marked in July and September offer a crucial resistance around $1,834, followed by the $1,850 threshold, to test the gold bulls during the bumpy road to November’s peak of $1,877.
Overall, gold prices have signaled bearish bias but the key support line challenges sellers ahead of the all-important US jobs report for December.
Gold: Daily chart
Trend: Further weakness expected
“The United States and Japan will sign a new research and development agreement to make it easier to collaborate on countering new defense threats, including hypersonics and space-based capabilities,” said US Secretary of State Antony Blinken on Thursday per Reuters.
“Blinken also told the opening of a virtual meeting between the foreign and defense ministers of Japan and the United States that they would sign a new five-year agreement covering the continued basing of U.S. troops in Japan that would invest greater resources to deepen military readiness and interoperability,” adds the news.
FX implications
The news should ideally help USD/JPY while being a risk-positive headline. However, cautious sentiment ahead of the US Nonfarm Payrolls (NFP) and steady yields weigh on the yen pair around 115.85 during early Friday morning in Asia.
Read: USD: Why a strong Nonfarm Payrolls may not be enough?
- NZD/JPY plummets 120-pips as market participants dump assets that have the “risk” word attached to them.
- The market mood dampened on the back of aggressive US stock selling after the Fed released its last meeting minutes.
- NZD/JPY Price Forecast: Neutral-bullish, but downside risks remains as the spot approaches the 200-DMA.
The New Zealand dollar pares most of its weekly gains and some more as market participants assess the Federal Reserve hawkish minutes released on Wednesday. In the meantime, the NZD/JPY pair slides some 0.74%, trading at 78.15 at the time of writing.
On Thursday’s overnight session, the NZD/JPY plunged from 79.14 to 77.90s on the back of a risk-off market environment, spurred by the sell-off of US stocks after the Federal Reserve released its monetary policy meeting minutes.
NZD/JPY Price Forecast: Technical outlook
The NZD/JPY daily chart shows that the cross-currency pair is neutral- bullish. Even though the 50 and the 100-daily moving averages (DMAs) reside above the spot price, the 200-DMA is below the aforementioned, meaning the uptrend remains in place.
Lately, the 50-DMA is accelerating towards the 100-DMA. In the event of the former crossing under the latter, it would trigger a bearish signal, but caution is warranted, as the overall longer time-frame trend is bullish unless the 200-DMA gives way.
The NZD/JPY first resistance would be the 100-DMA at 78.55, which opens the door for further gains once broken. The next ceiling would be December 30, 2021, daily high at 78.93, followed by the January 4 cycle high of 79.22.
On the flip side, the pair’s first support level would be the 200-DMA at 78.14, which would expose the immediate 78.00 psychological level once broken. The breach of the latter would expose December 8, 2021, the previous resistance-turned-support level at 77.56, followed by the 77.00 figure.
-637771081756361192.png)
- GBP/USD holds onto corrective pullback from 1.3490, seesaws near two-month high.
- UK’s Jacob Rees-Mogg defends government’s Brexit approach, British Competition Chief steps back.
- British covid numbers ease but scientists warn covid not getting milder.
- Yields challenge bulls with eyes on US NFP for December.
GBP/USD stays above 1.3500, taking rounds to 1.3530 during Friday’s Asia session. The cable pair snapped a two-day uptrend the previous day amid broad US dollar strength and soft UK Services PMI but covid figures and hopes of the easy path on Brexit seem to favor buyers amid the market’s inaction ahead of the key US jobs data for December.
The UK reported around 180,000 daily covid cases and 231 virus-linked deaths the previous day. The numbers have been easing since the early weekdays when above 200,000 figures were seen. While the government authorities praise strong vaccinations and activity restrictions as reasons, a leading Indian-origin scientist from the University of Cambridge warned on Thursday that it is an "evolutionary mistake". Ravindra Gupta, Professor of Clinical Microbiology at the Cambridge Institute for Therapeutic Immunology and Infectious Diseases (CITIID) also hints that the reduction in the numbers does not indicate that the virus which causes COVID-19 is becoming less virulent.
Elsewhere, news that the UK’s Head of Competition and Markets Authority (CMA), Andrea Coscelli, will step down raised hopes of softer Brexit negotiations ahead. “According to government insiders, ministers regarded Mr. Coscelli as an impediment to post-Brexit economic reforms and saw him as a hurdle to breaking with EU competition policy,” said The Telegraph.
On the other hand, US Treasury yields rallied and helped the US dollar to remain firmer as the recent Fedspeak backed faster rate hikes, after the Federal Open Market Committee (FOMC) Meeting Minutes, conveyed hawkish bias of the policymakers, suggesting a faster rate-hike and plans to discuss balance-sheet normalization. That said, St. Louis Fed President James Bullard pushed for a March rate hike whereas Federal Reserve Bank of San Francisco President and an FOMC member Mary C. Daly marked the need to raise interest rates to keep the economy in balance.
It should be noted that the UK’s Services PMI rose past the initial forecast to 53.6 in December while the US data came in softer. Among them were, US Factory Orders, Weekly Jobless Claims, ISM Services PMI and Good Trade Balance.
Amid these plays, the US 10-year Treasury yields refreshed a nine-month high to poke 1.75% before closing with 2.5 basis points (bps) of a daily gain near 1.728%. The same weighed on the Wall Street benchmarks even as downbeat data pushed bears to satisfy with smaller losses whereas the S&P 500 Futures print mild gains by the press time.
Looking forward, a light calendar in Asia-Pacific, as well as the UK, will join the cautious mood ahead of the key US data and may restrict immediate GBP/USD moves. However, Brexit and covid updates may favor the bulls.
That said, forecasts suggest the headline US Nonfarm Payroll (NFP) rise from 210K to 400K while the Unemployment Rate may have eased to 4.1% from 4.2% prior. The underemployment rate, however, is likely rising from 7.8% to 8%.
Read: US Nonfarm Payrolls December Preview: The labor market seconds Fed policy
Technical analysis
Although GBP/USD portrayed another failure to cross the 100-DMA level surrounding 1.3560 on Thursday, bears need a clear downside break of the late November’s swing high close to 1.3510 to take entries.
“Australia's New South Wales state, home to Sydney and a third of Australia's 25 million population, will reinstate restrictions including shutting nightclubs and canceling non-urgent surgeries because of record coronavirus infections, the Sydney Morning Herald reported on Friday,” per Reuters.
The news adds that the measures are expected to be approved by the state government's economic recovery committee on Friday in a bid to ease pressure on hospitals, the report said, citing senior government sources.
Key quotes
People admitted to NSW hospitals with COVID-19 have nearly doubled to a record 1,609 in just over a week. There were around 150 daily cases in the state in late November, when the first Omicron case was detected. That shot up to 35,000 on Thursday.
Neighboring Victoria state a day earlier brought back restrictions that would limit people at pubs and clubs.
FX reaction
AUD/USD remains on the back foot around a two-week low, recently taking rounds to 0.7165 amid early Friday morning in Asia. The pair’s lack of reaction to the news could be linked to the pre-NFP caution.
Read: AUD/USD slams into weekly support ahead of critical NFPs
- NZD/USD stays range-bound after refreshing 13-day low.
- US Treasury yields refreshed nine-month high as Fedspeak backs hawkish FOMC minutes.
- Downbeat US data failed to disappoint greenback buyers, Omicron woes also weaken Antipodeans.
- Light calendar in Asia, pre-NFP mood may restrict immediate moves ahead of US session, risk catalysts are the key.
NZD/USD holds lower grounds near 0.6750 during early Friday morning in Asia, keeping the immediate range after renewing a two-week low the previous day.
The kiwi pair’s latest inaction could be linked to the typical pre-NFP cautious and a light calendar in Asia-Pacific while the Fed policymakers’ comments and the FOMC Minutes need to be thanked for the pair’s previous fall. On the same line were the fears of the South African covid variant, namely Omicron.
The recent Fedspeak backed, as well as faster rate hikes, after the Federal Open Market Committee (FOMC) Meeting Minutes, conveyed hawkish bias of the policymakers, suggesting a faster rate-hike and plans to discuss balance-sheet normalization. That said, St. Louis Fed President James Bullard pushed for a March rate hike whereas Federal Reserve Bank of San Francisco President and an FOMC member Mary C. Daly marked the need to raise interest rates to keep the economy in balance.
Elsewhere, virus conditions continue to worsen and challenge the commodities, as well as Antipodeans. While global infection figures keep refreshing record tops, NZ Herald cited 19 and 43 new community cases and infections at the borders compared to 17 and 23 respective figures marked the previous day. Chatters of return of some covid-linked activity restrictions in Australia’s most populous state New South Wales (NSW) also exert downside pressure on the NZD/USD due to the strong trading links.
Talking about the data, US Factory Orders, Weekly Jobless Claims, ISM Services PMI and Good Trade Balance all came in downbeat but couldn’t stop the US dollar bulls amid strong favor for the faster Fed rate hike, which in turn propelled the yields.
That said, the US 10-year Treasury yields refreshed a nine-month high to poke 1.75% before closing with 2.5 basis points (bps) of a daily gain near 1.728%. The same weighed on the Wall Street benchmarks even as downbeat data pushed bears to satisfy with smaller losses.
Moving on, market fears of Omicron can entertain the NZD/USD traders, mostly to the sellers, but major attention will be given to the December month jobs report from the US. Forecasts suggest the headlines Nonfarm Payroll (NFP) to rise from 210K to 400K while the Unemployment Rate may have eased to 4.1% from 4.2% prior. The underemployment rate, however, is likely rising from 7.8% to 8%. Given the upbeat expectations from the US employment data, Fed’s hawkish rhetoric is likely to be justified, which in turn could propel yields and the US dollar and may weigh on the NZD/USD prices.
Technical analysis
A clear downside break of 21-DMA and a two-week-old ascending trend line joins descending RSI line, as well as receding bullish bias of the MACD, to keep NZD/USD sellers hopeful to revisit the year 2021 bottom surrounding the 0.7000 threshold.
Alternatively, the support-turned-resistance line near 0.6775 will precede the 21-DMA level surrounding 0.6790 to limit short-term advances of the NZD/USD prices.
- On Thursday, the euro edges lower some 0.11%.
- A risk-off market mood and higher US bond yields boost the greenback prospects.
- EUR/USD Technical Outlook: Bearish biases, but a daily close below the 1.1300 figure could accelerate the downtrend towards the 2021 yearly low at 1.1186.
The shared currency slumps as the North American session ends, trading at 1.1293 at the time of writing. Market conditions worsened as the US equity markets indices closed in the red, with losses between 0.04% and 0,47%, favoring the greenback’s prospects to the detriment of the euro.
Also, as Wall Street closes, the US 10-year Treasury yield advances 2.99 basis points, sitting at 1.7299%, underpins the greenback. The US Dollar Index, which measures the buck’s value against six peers, advances 0.11%, up at 96.26.
EUR/USD Price Forecast: Technical outlook
On Thursday, during the overnight session, the EUR/USD seesawed around the daily pivot point in the 1.1300-18 range, ahead of the European session. In the overlap of the Asian and European session, the EUR]/USD dipped to 1.1285, followed by a jump above the confluence of the 100 and the 200-hour simple moving averages (SMAs) at 1.1313 and 1.1317, respectively, reaching a daily high of 1.1332.
At press time, the euro is under selling pressure, as witnessed by the price action around the daily pivot point, which shows seven candlesticks, with just one piercing aggressively upwards, surrendered later, as sellers meander around the confluence of the 100 and the 200-hour SMA.
On the downside, the first support would be the S1 daily pivot point at 1.1278. A break under that level exposes crucial support levels like the January 4 daily low at 1.1272, followed by the upslope trendline around 1.1255-60 area, and then the S2 daily pivot point at 1.1243.
To the upside, the EUR/USD first resistance would be the confluence of the daily pivot point and the 100 and 200-hour SMA around the 1.1310-20 area. The breach of the latter would expose the January 5 daily high at 1.1346, followed by the January 3 cycle high at 1.1366.
-637771047519668545.png)
- AUD/USD take on critical weekly support and stall.
- Fed and RBA divergence is running the show, contrary to seasonality. NFP next in line.
Around 0.7160, AUD/USD ended the day down some 0.80% on Thursday after falling from a high of 0.7222 to a low of 0.7145 in a technical move that has pierced important daily trendline support. The hawkishness at the Federal Reserve is driving sentiment and has resulted in an offer in the Aussie, to the contrary to the usual bullish seasonal factor.
Over several years, the start of the year has been typically bullish for the commodity sector and high beta currencies, such as the Aussie. However, the caveat for the seasonal bullishness was always going to be how hawkish the Fed comminuted at the start of the year. That came sooner than the market had expected in Wednesday's Federal Open Market Committee minutes.
First off, “Participants generally noted that, given their individual outlooks for the economy, the labour market, and inflation, it may become warranted to increase the federal funds rate sooner or at a faster pace than participants had earlier anticipated.”
Additionally, the Fed has shown to markets that it is already thinking two steps ahead in discussing balance sheet runoff, as "Almost all participants agreed that it would likely be appropriate to initiate balance sheet runoff at some point after the first increase in the target range for the federal funds rate. However, participants judged that the appropriate timing of balance sheet runoff would likely be closer to that of policy rate liftoff than in the Committee’s previous experience."
as such, the divergence between the Reserve bank of Australia and the Fed is playing out in the price action of AUD/USD and couples up with the prior technical analysis as follows:
AUD/USD technical analysis
AUD/USD Price Analysis: Bears are moving in, a case building for longer-term downside
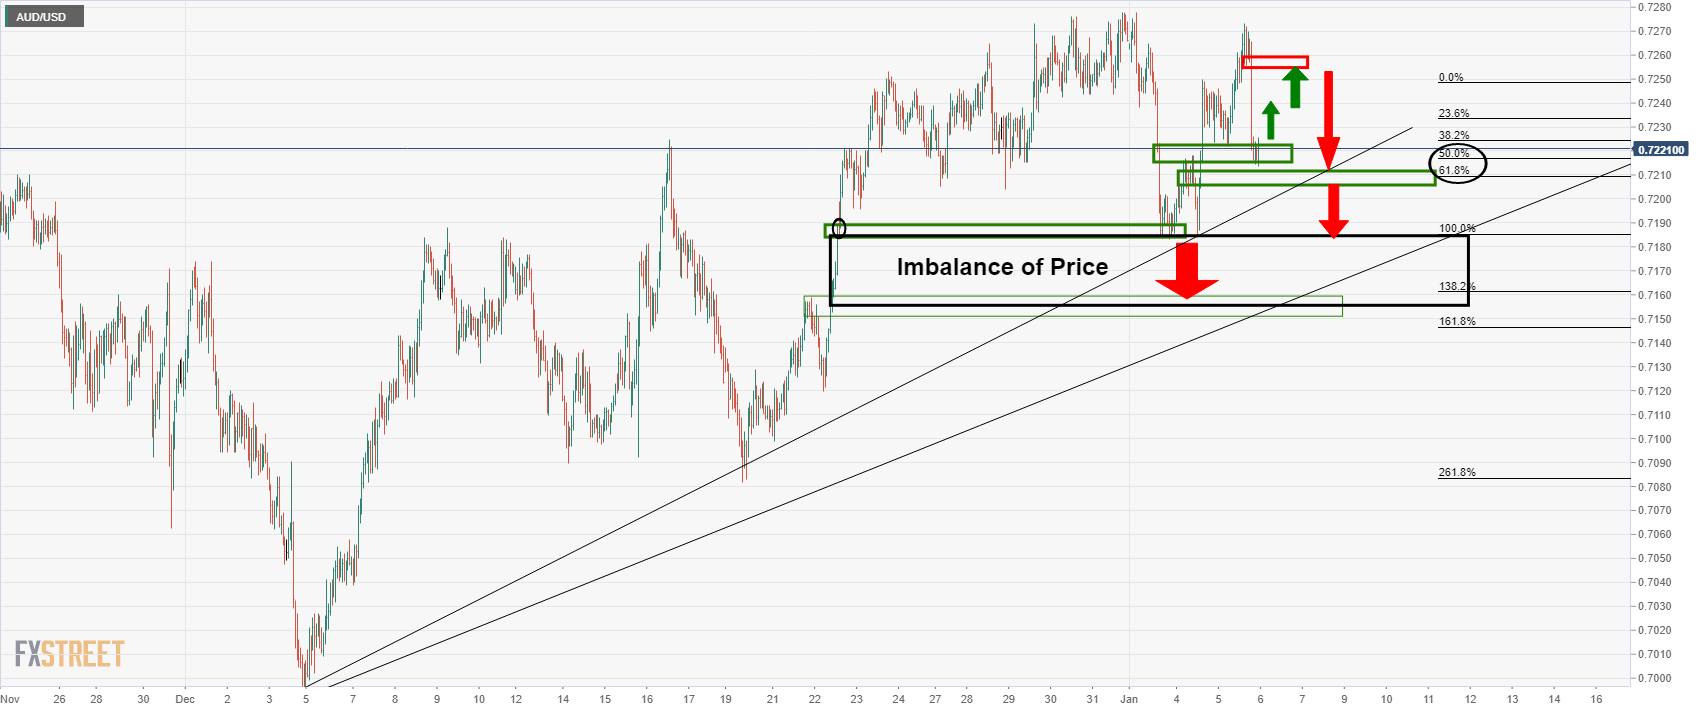
On this occasion, the price did not revisit the inefficiency of the Fed drop yesterday and instead moved in on the imbalance of price below support as follows:
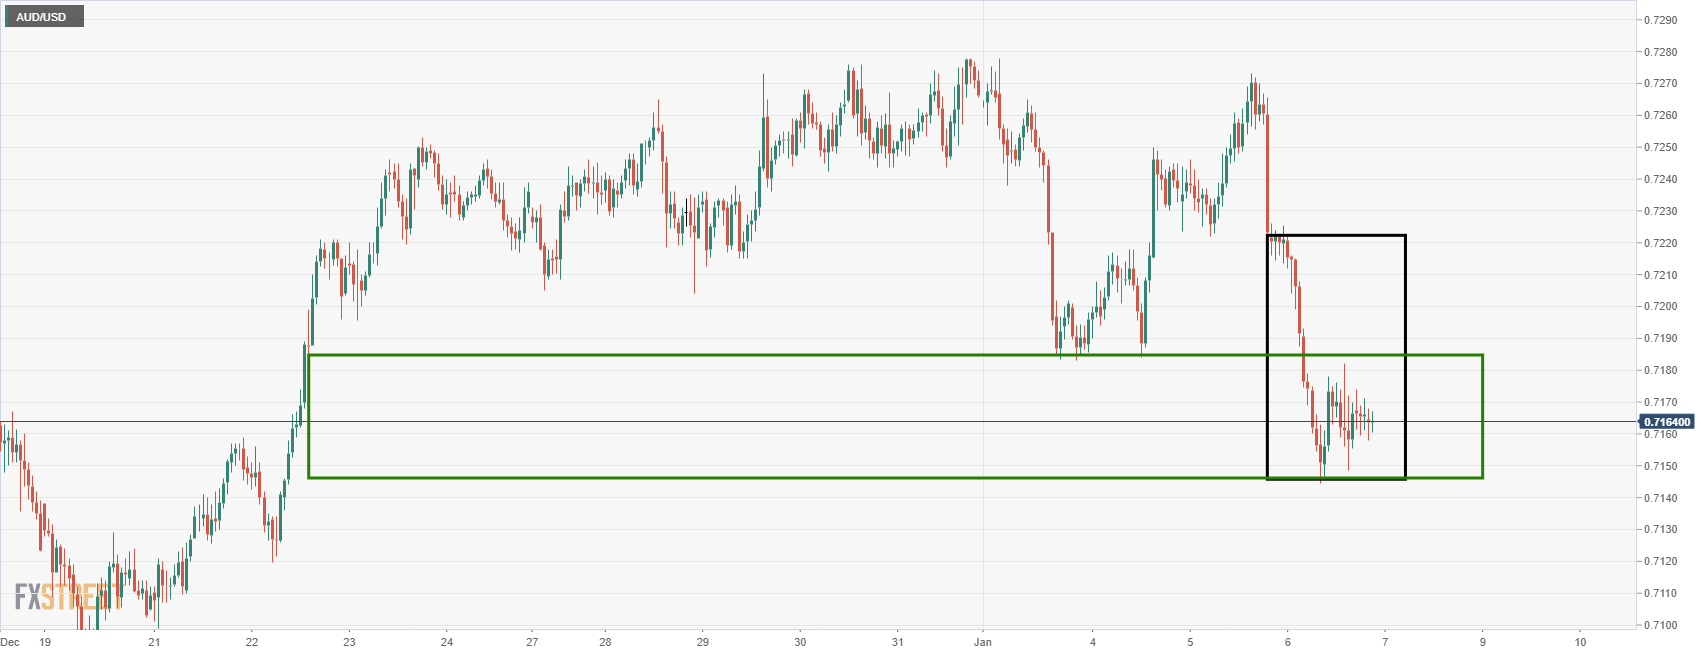
The Fed's communication meant that there will be a much quicker timeline between rate hikes and balance sheet runoff than the last time, as such, it is full steam ahead with respect to the central bank divergences. Overall, that spells a lower Aussie for the weeks ahead which leaves the weekly technical outlook intact as follows:
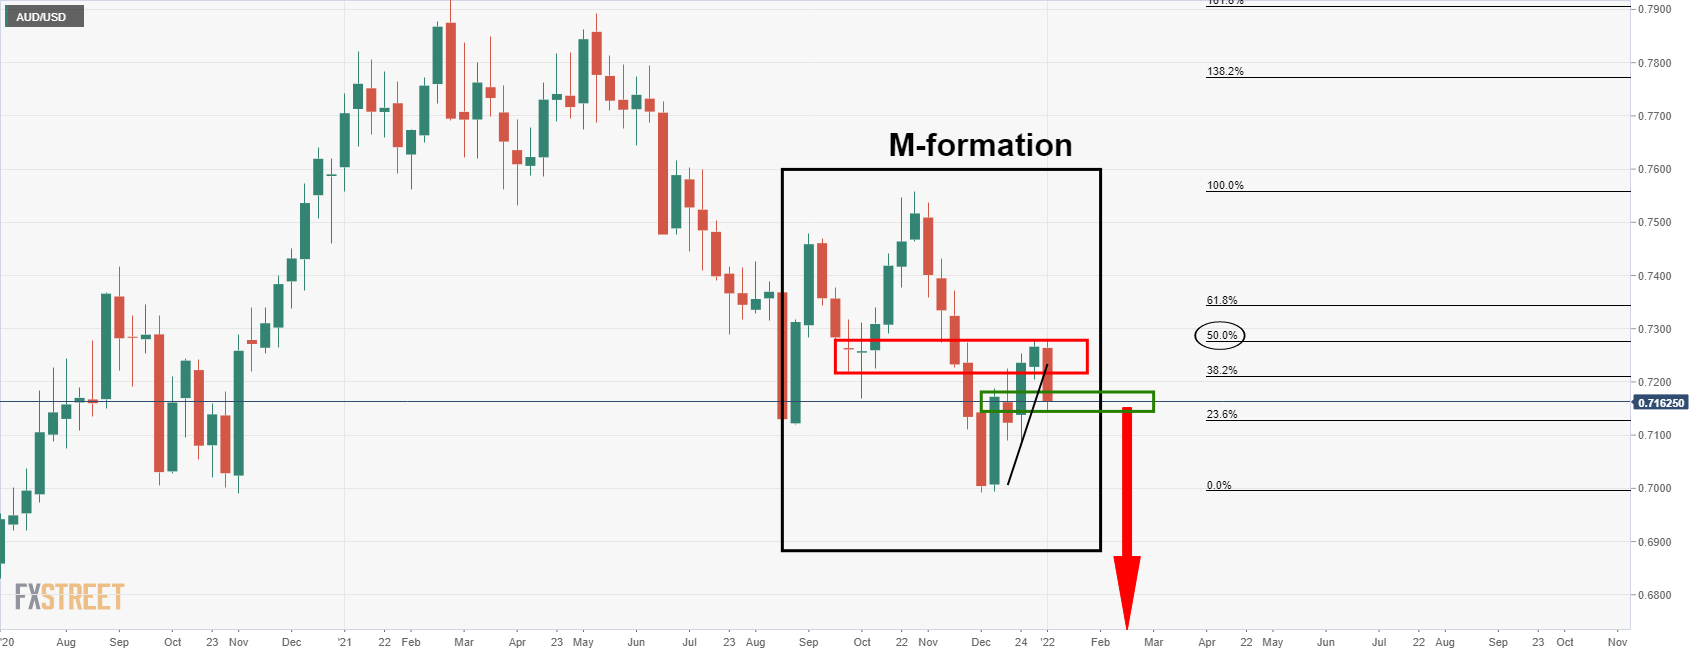
On a break of weekly support, near 0.7150, the prospect of a downside continuation will be in play. Meanwhile, there is room for a correction to the old daily support near 0.72 the figure.
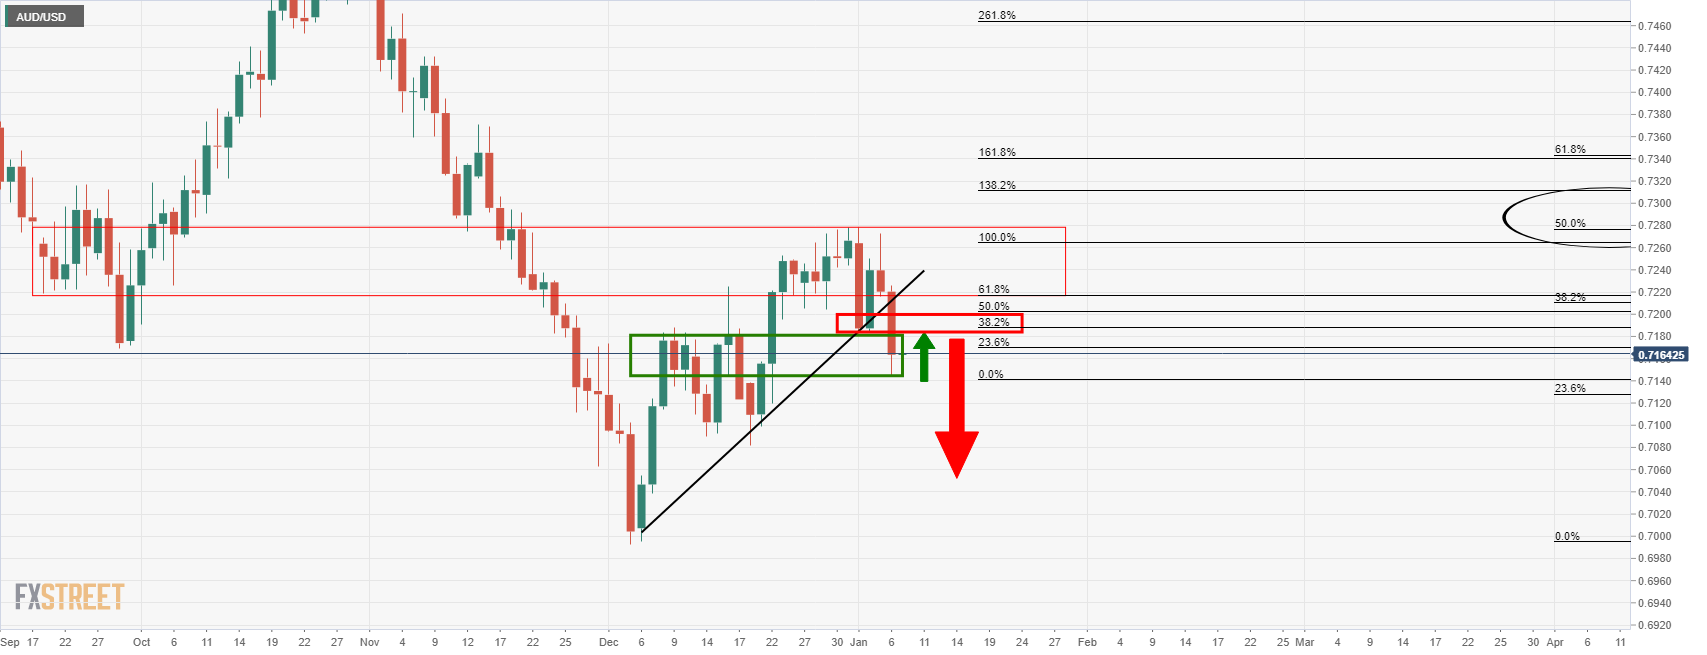
Nonfarm Payrolls is next in line for prospects of another shakeup in financial markets. However, anything outside of what is expected and a shock is unlikely to move the needle. ''The late-December COVID surge likely came too late to prevent a pickup in US payrolls after the gain in November (210k) appeared to be held down by an overly aggressive seasonal factor,'' analysts at TD Securities explained.
As traders continue to digest Wednesday’s hawkish Fed minutes, which at the time sent US equities tumbling, and discuss its implication for the outlook for Fed policy tightening, US equity trade has been much more subdued. The S&P 500 has pivoted either side of the 4700 level on Thursday between 4670 lows and 4720ish highs and at current levels, pretty much bang on the big figure is trading about 0.3% lower on the day. That leaves it roughly 2.5% below the record levels printed near 4820 earlier in the week.
The Nasdaq 100 index, which tumbled more than 3.0% on Wednesday as sharp upside in yields triggered selling in so-called “growth” stocks (which include big tech), is about 0.2% lower in the 15,700s. The Dow, which held up comparatively better on Wednesday, dropping just over 1.0% at the time, is underperforming on Thursday and is down about 0.6% but still well above the 36K mark. In terms of the sectors, as yields continue to press higher the S&P 500 financial sectors outperformed and gained nearly 1.5%. The S&P 500 CBOE volatility index or VIX was broadly flat just below 20.00, having risen from around 17.00 when equities sold off on Wednesday.
Attention turns to NFP
Having largely ignored the week’s busy slate of tier 1 US data thus far, equity investors are now turning their focus to the release of the official US labour market report on Friday. With money markets now pricing a strong possibility of a first Fed rate hike in March, traders will be looking at Friday’s jobs report through the lense of whether it boosts or hinders the chances of March lift-off. Note that the Fed in December framed the labour market as making “rapid” progress back to full employment, even in light of December’s sub-par non-farm payrolls number of 210K and has said that if this rate of improvement continues, rate hikes will soon be warranted.
The Fed is likely looking through softer monthly NFP numbers so long as measures of slack (the unemployment rate) show signs of improvement. Indeed, unemployment dropped to 4.2% in November from 4.6% in October. Fed policymakers have acknowledged that the pandemic is holding people back from the labour market (hence why the participation rate remains well below pre-pandemic levels), meaning the scope for large MoM employment gains in the foreseeable future at present is limited.
As long as measures of slack continue to point to a tight labour market (as other data releases this week did), the bar is low for Friday’s headline NFP number to fulfill the Fed’s continued rapid progress criteria. Consensus expectations for 400K jobs having been created in December easily fits this bill. If Friday’s jobs report does feed into the Fed tightening fears that have in recent days sent real and nominal yields scorching higher and weighed on equities (with the pain most concentrated in), the outlook for equities on Friday could be grim.
- Silver has taken a beating on Thursday but stabilised just above the $22.00 level as focus switches to Friday’s NFP.
- The precious metal has been under selling pressure recently as Wednesday’s hawkish Fed minutes pump Fed tightening bets.
- XAG/USD could be headed for a retest of December lows under $21.50 if the jobs report endorses a March hike.
Spot silver (XAG/USD) prices have taken a beating thus far on Thursday, though the selling pressure has eased in recent trade after the precious metal found support at the $22.00 level. At current levels just below $22.20, XAG/USD trades lower by more than 2.5% on the day and is nearly 5.0% below the highs at set above $23.20 on Wednesday prior to the latest hawkish Fed minutes. The minutes surprised on a number of fronts, with FOMC participants uniformly concerned about elevated inflation and in support of a potential sooner and faster rate hiking cycle to address risks. Moreover, strong support for a prompt reduction in the size of the Fed’s balance sheet once the hiking cycle is underway also came as a surprise, with it previously just having been hawkish Fed members to jawbone about quantitative tightening.
The hawkish nature of the minutes sent bond yields shooting higher and, most notably for precious metals markets, the move has been driven by real yields. While the US 10-year is up more than 20bps on the week, the 10-year TIPS yield is up around 25bps and recently broke out to its highest levels since June of last year. Above -0.80%. Higher real yields increase the opportunity of non-yielding assets such as precious metals, thus weighing on their appeal to investors. Precious metals traders will also note that market-based measures of inflation expectations have been heading sharply lower this week, with 10-year break-evens reversing from Tuesday’s highs above 2.64% to current levels around 2.45%. Lower inflation expectations reduce the demand for assets that offer inflation protection such as silver and gold.
In terms of what's next for spot silver, trade is likely to now enter wait-and-see mode ahead of Friday’s US jobs report. With markets pricing a strong possibility of a March rate hike, traders primarily seek to interpret how the December jobs report boosts or hinders the chances of March lift-off. The Fed in December framed the labour market as making “rapid” progress back to full-employment, even in light of December’s sub-par non-farm payrolls number of 210K and has said that if this rate of improvement continues, rate hikes will soon be warranted.
The Fed is likely looking through softer monthly NFP numbers so long as measures of slack (the unemployment rate and participation rate) show signs of improvement (particularly the former). Fed policymakers have acknowledged that the pandemic is holding people back from the labour market, meaning the scope for large MoM employment gains at present is limited. As long as slack measures continue to point to a tight labour market (as other data releases this week did), the bar is low for Friday’s headline NFP number to fulfill the Fed’s continued rapid progress criteria. Consensus expectations for 400K jobs having been created in December easily fits this bill.
That suggests the scope for a rebound in precious metals on a dollar/real yield pull-back as traders reverse recent hawkish bets for a March hike is limited. If that was to be the case and XAG/USD did rally, the main levels of resistance to look out for are the 21-day moving average and recent lows of the last few weeks around $22.60 and then the highs from the last few weeks in the $23.40 area. If a strong labour market does give a thumbs up to a March rate hike, then spot silver prices could be headed back for a test of December lows just under $21.50, a further 3.0% decline from current levels.
What you need to know on Friday, January 7:
The greenback retained most of its post-FOMC Minutes gains, despite US data being generally disappointing. Stocks maintained the sour tone, while US government bond yields held near the multi-month highs achieved on Wednesday.
The EUR/USD pair settled around 1.1290, at the lower end of its weekly range, while GBP/USD trades at around 1.3520. The AUD/USD pair edged lower, now trading in the 0.7160 area, undermined by gold prices, as the bright metal fell to end the day at $1,788 a troy ounce. The Canadian dollar, on the other hand, appreciated against the greenback, with USD/CAD trading in the 1.2720 region, as crude oil prices surged to fresh multi-month highs. The barrel of WTI peaked at $80.11, now trading at 79.70.
US Federal Reserve officials reinforced the idea of a more aggressive Fed. St. Louis Fed President James Bullard said that the Federal Reserve could raise interest rates as soon as March, while Federal Reserve Bank of San Francisco President and FOMC member Mary Daly said that they will need to raise interest rates to keep the economy in balance.
The focus on Friday will be on the US December Nonfarm Payrolls report. The country is expected to have added 400K new jobs positions after gaining 210K in November. The unemployment rate is foreseen at 4.1%, down from 4.2% previously, although the under-employment rate is seen ticking higher, from 7.8% to 8%.
Ethereum enters support zone that will see ETH return to $4,000
Like this article? Help us with some feedback by answering this survey:
St Louis Fed President and FOMC voting member in 2022 James Bullard said on Thursday that he was among those who projected that the Fed would hike interest rates three time in 2022. Moreover, he added, it is better to get started with rates hikes "sooner rather than later" and the pace of rate hikes can be moderated later if inflation slows. The balance sheet run-off (or quantitative tightening or QT) should begin "shortly after" the initial interest rate rise, he added.
Further remarks:
"It's uncertain how much inflation control will depend on "natural moderation" versus Fed intervention."
"Expect inflation to moderate naturally to some degree, but "not dramatically" and still above 3% at end of the year."
"Balance sheet could decline even below pre-pandemic levels given existence now of standing repo facility."
"Good reasons for labor force participation to be lower today than before the pandemic."
"Fed "very surprised" by the level of inflation, "incumbent" on the central bank to act to maintain its credibility."
"Pre-pandemic employment level not a good benchmark of current "very tight" labor market."
"A smaller balance sheet and higher policy rate means that both ends of the yield curve should rise in tandem."
- The GBP/JPY records a 0.34% loss, following the GBP/USD footsteps.
- In the overnight session, a risk-off market mood spurred a 150-pip drop of the pair.
- GBP/JPY Technical Outlook: It has an upward bias, as long as it remains above 156.00.
The British pound slides against the Japanese yen for the first time in the week, attributed to risk-off market mood during Thursday’s Asian and European session, influencing risk-sensitive currencies like the GBP, the AUD, and the NZD. At the time of writing, the cross-currency is trading at 156.80, down some 0.34%.
In the overnight session, the GBP/JPY opened near the highs of Wednesday, around 157.30s. However, as the Asian Pacific session began, the pair slumped sharply, breaching on its way south, support levels like the daily pivot point at 157.25, followed by the S1 daily pivot at 156.73, to finally stall at the S2 daily pivot at 156.06.
At press time, the GBP/JPY is seesawing around the S1 daily pivot and the 50-hour simple moving average (SMA), which lies at 156.96, some 30-pips above an upslope trendline in the 1-hour chart, drawn from December 2021 lows up to January swing lows.
That said, the GBP/JPY first resistance to the upside would be the 50-hour SMA at 156.96. A breach around the aforementioned and the psychological 157.00 price level would open the door for further gains. The next ceiling level would be the daily pivot at 157.25.
On the flip side, in the event of dropping further, the GBP/JPY’s first support would be the 100-hour SMA at 156.41. A breach of the latter would expose the cross-currency for a renewed test of the S2 daily pivot at 156.06, followed by the 200-hour SMA at 155.60.
GBP/JPY 1-hour chart
-637770960816100461.png)
- EUR/GBP is on the verge of completing a fifth consecutive bear week.
- The next significant support from 2020 and 2019, 0.8282 and 0.8278 respectively.
- However, UK politics could be a spanner in the works.
At 0.8347, EUR/GBP is virtually flat on the day although the range has been between 0.8338 and 0.8372 on what has been a relatively busy calendar with plenty of fundamental themes that are ongoing in the background.
Eurozone data coming through positive
Firstly, Germany reported firm November factory orders. The data was impressive jumping to 3.7% vs the expectations of just 2.3% for the month. This could be a positive prelude for the Industrial production and trade data tomorrow.
However, ''while the bounce in the German November data is welcome, the December PMI readings suggest rising risks of recession,'' analysts at Brown Brother Harriman explained in a note on Thursday. ''The composite PMI came in at 49.9, the first time below the 50 boom/bust level since June 2020 and down sharply from the 62.4 peaks in July 2021.''
The Eurozone also reported November the Producer Price Index today. These also beat expectations and arrived at 23.7% YoY vs. 23.2 expected and 21.9% in November. ''This suggests that pipeline price pressures remain strong, with upside risks to the CPI reading in early 2022,'' the analysts at BBH explained.
Meanwhile, the December eurozone inflation readings were released on Thursday, and Germany's Consumer Price Index beat prior and the expectations marginally for the month of December, both MoM and YoY. Traders will now wait for the eurozone reports that come out tomorrow. The headline inflation is expected at 4.8% YoY vs. 4.9% in November and core is expected at 2.5% YoY vs. 2.6% in November.
This all boils down to sentiment surrounding the European Central Bank and officials there remain split. With that being said, the ECB won’t meet until February 3, giving it some time to better assess the economic outlook as more data comes out. The meeting, however is expected to be a low key event for forex considering the bank has already tipped PEPP will end as scheduled in March.
One member, Martins Kazaks sounded hawkish yesterday though. On Wednesday, he said that the ECB is ready to raise rates and cut stimulus if needed. The bank, he continued, is ready to take action if the inflation outlook picks up and an early 2023 rate hike is a possible scenario.
Today, Francois Villeroy de Galhau sounded dovish and argued that the eurozone inflation is close to peaking, noting that December CPI data from France is showing the first signs of stabilization. Villeroy added that “While remaining very vigilant, we believe that supply difficulties and energy pressures should gradually subside over the course of the year.”
But the stabilization in prices doesn’t imply a policy shift. Rather, Villeroy repeated earlier in the week that his prediction for a “new inflation regime” under which price growth will be closer to the ECB’s 2% target than in the years preceding the pandemic. On that basis, monetary policy would “normalize in stages,” he argues.
As for the covid variant, Villeroy also shrugged that off. The ECB Governing Council member said the economic effects will be “relatively limited.”
“We have learned over the past two years that every Covid wave, however serious, has diminishing economic effects,” Villeroy said.
Overall, the analysts at BBH see financial conditions tightening in the eurozone this year at the worst possible time. The analysts explained that ''we are already seeing other signs of stress. Italian yields have risen over the past few weeks and low demand for its 30-year bond offer yesterday is just another sign of trouble ahead.''
UK data, not much to cheer
As for the UK, firm final services and composite PMIs were reported. Services PMI came in at 53.6 vs. 53.2 preliminary to 52.1, which dragged the composite up to 53.6 from 53.2 preliminary. Still, the composite PMI is down two straight months and the lowest since February 2021.
''There is not much to cheer about,'' analysts at BBH argued.
''Much of the November data came in firmer than expected, though some of the strength in consumption was attributed to early shopping due to supply chain concerns ahead of the holidays. We may have to wait until January to get a cleaner read on the UK economy but we see headwinds ahead from Brexit, energy shortages, and planned fiscal and monetary tightening.''
Elsewhere, besides Brexit and covid lockdown risks, investors are keeping a close eye on UK tax cut possibilities and implications for the pound. ''Cabinet member Jacob Rees-Mogg told his colleagues that the 1.25% increase in the payroll tax should be shelved as the rise in inflation and energy costs is hurting family pocketbooks,'' the analysts at BBH explained.
A toxic cocktail of Brexit, rising energy costs, covid and pressures on the healthcare system has been a burden on the UK economy. There are pressures in the UK government which are calling for cuts and Rees-Mogg’s comments come after twenty Tory backbenchers called for Johnson and Chancellor Sunak to end the 5% VAT on energy and to remove environmental taxes on electricity.
UK politics is a spanner in the works for the bears
Overall, traders are happy to be long of the pound due to the hawkishness at the Bank of England and prospects of tax cuts, so long as covid remains a minor threat. With that being said, UK political angst could throw in a spanner in the works for the pound bulls.
Recent press has reported that some in Westminster are openly talking about a potential leadership challenge.
''While there is no imminent general election in the UK, Johnson’s leadership is looking weak,'' analysts at Rabobank recent explained. ''This does nothing to strengthen confidence in post-Brexit Britain and, on the margin, will undermine the pound We see EUR/GBP creeping up towards 0.87 during the course of next year.''
EUR/GBP technical analysis
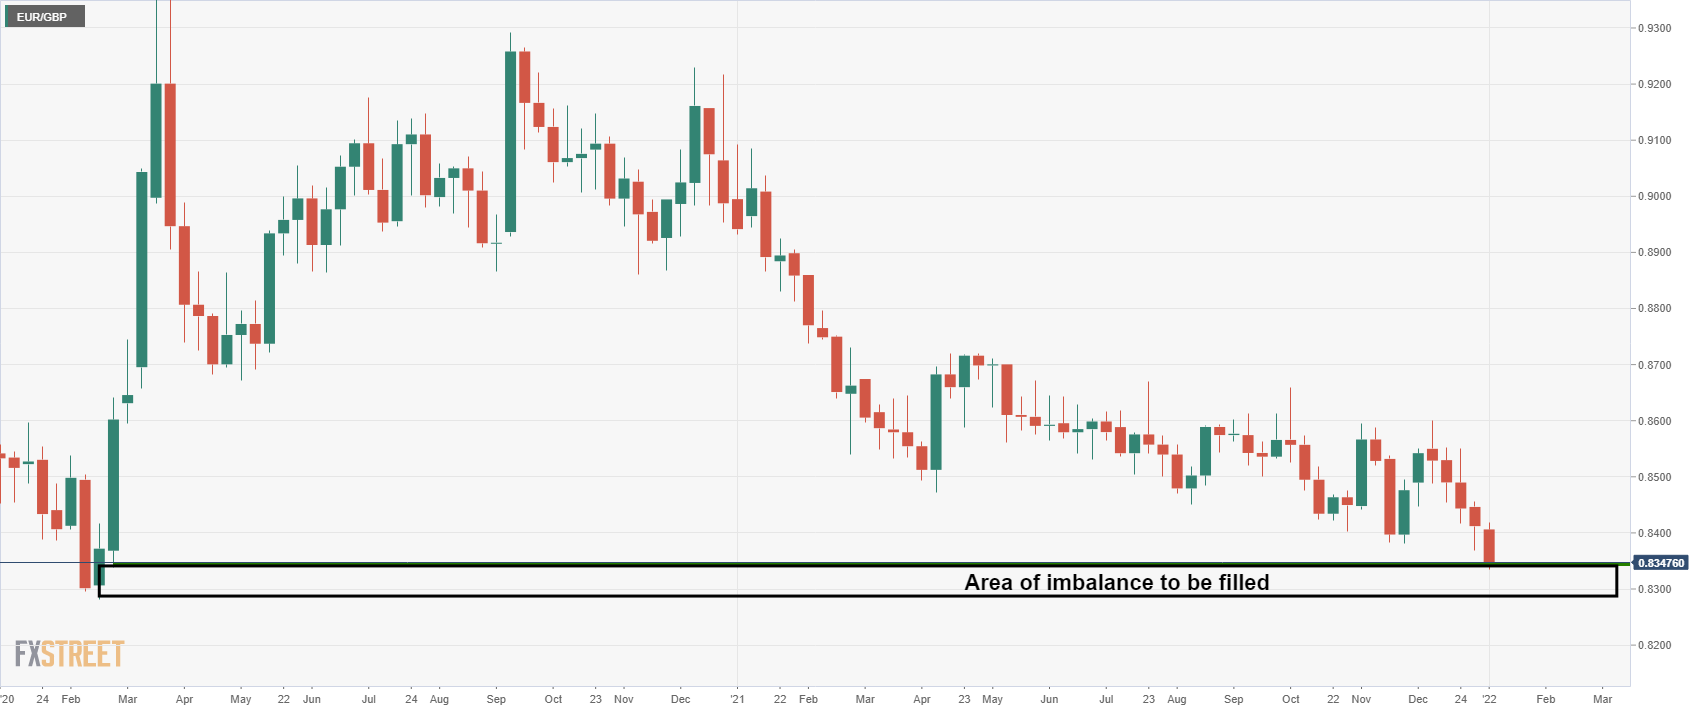
Meanwhile, from a technical standpoint, the cross is on the verge of completing a fifth consecutive bear week and the increasing bearish momentum with lower RSI readings are confirming the latest drop. 0.8338 is key as being the wick of 24 February 2020. The next significant support from 2020 and 2019 will be 0.8282 and 0.8278 respectively. This is an area of imbalance that could well be mitigated in the coming weeks prior to any significant bullish correction.
- US Initial Jobless Claims increased above the 200K mark, blaming resurgent Covid-19 cases.
- US ISM Non-Manufacturing (Services) PMI rose to 62.0, lower than the previous month's reading.
- USD/CHF Technical Outlook: It has a neutral bias.
On Thursday, during the New York session, the USD/CHF pair advances for the second time of the week, exchanging hands at 0.92016 at the time of writing. The market sentiment has improved as portrayed by US equities rising, while the Dow Jones trimmed earlier losses, now down some 0.14%.
In the overnight session, the USD/CHF was subdued, seesawing around the daily pivot point and the R1 daily pivot at the 0.9160-91 range. In the middle of the European session, the pair dipped to the confluence of the 50 and the daily pivot around 0.9158, to then resume the upward move on mixed economic data and rising US Treasury yields.
Mixed US economic data boosts the USD vs. the CHF
The US economic docket featured Initial Jobless Claims for the week ending on January 1, which showed an increase of 207K higher than the 197K estimated by economists. The 4-week moving average rose 204.5K, a tick more elevated than the 199.75K in the prior week.
In the meantime, the Institute for Supply Management (ISM) revealed that the ISM Services PMI for December came at 62.0, short of the 69.1 November reading. Despite shrinking, a reading above 50 indicates growth in the services sector.
USD/CHF Price Forecast: Technical outlook
The USD/CHF daily chart shows the pair has a neutral bias, aiming towards the 50 and 100-daily moving averages (DMAs) confluence. After bouncing off an upslope trendline drawn
from January to May 2021 lows, which passes under the 0.9160 price level, the pair reclaimed the 0.9200 figure.
To the upside, the first ceiling level would be December 22, 2021, daily high at 0.9152, followed by December 7, 2021, cycle high at 0.9274, and then the 0.9300 figure.
On the flp side, the USD/CHF first support would be 0.9200. A breach of the latter would open the door for further losses, being the next support level the upslope trendline around 0.9160-75 area. A decisive break below that level would expose December 31 daily low at 0.9102.
-637770937065241460.png)
St. Louis Fed President James Bullard said on Thursday that the Federal Reserve could raise interest rates as soon as March.
The official, known as an uber hawk and aligned with the market sentiment, explained that the Fed is now in a "good position" to take even more aggressive steps against inflation, as needed after a policy reset last month.
How comments follow yesterday's hawkish minutes and the spike in US yields and the greenback as a consequence.
In December, the Fed agreed to end its asset purchases in March and laid the groundwork for the start of rate increases that all policymakers, even the most dovish, now feel will be appropriate in 2022.
Today, Bullard explained that the Fed "is in good position to take additional steps as necessary to control inflation, including allowing passive balance sheet runoff, increasing the policy rate, and adjusting the timing and pace of subsequent policy rate increases," Bullard said in prepared remarks to the CFA Society of St. Louis.
''Subsequent rate increases during 2022 could be pulled forward or pushed back depending on inflation developments," Bullard said.
The tone reinforces the idea that an initial rate increase could be approved "as early as the March meeting.
Reuters explained in a note following Bullard's comments that ''projections issued in December showed half of the Fed policymakers expect three quarter-percentage-point rate increases will be needed this year.''
''Inflation is now running at more than twice the Fed's 2% target, and Bullard said that the inflation 'shock' experienced by the country means the central bank should be able to satisfy its inflation targeting goals now for several years to come.''
Covid will not throw Fed of course
Additionally, Bullard said he did not think the current wave of cases would throw the US economy or the Fed off course.
He explained that Infections in the United States "are projected to follow the pattern where the variant was first identified," while citing projections that daily case counts may peak late this month.
Key notes
St. Louis Fed's Bullard says the first interest rate hike could come in March.
Bullard says the Fed is now in a 'good position' to address inflation with rate increases, balance sheet runoff if needed.
Bullard says expects omicron infections to peak late this month, following a path similar to that seen in South Africa.
Bullard says the recent inflation shock means Fed's average 2% target should be met for next several years.
Bullard says focus on returning US labour force participation to pre-pandemic levels ignores trend decline.
US dollar remains in a familiar consolidated range
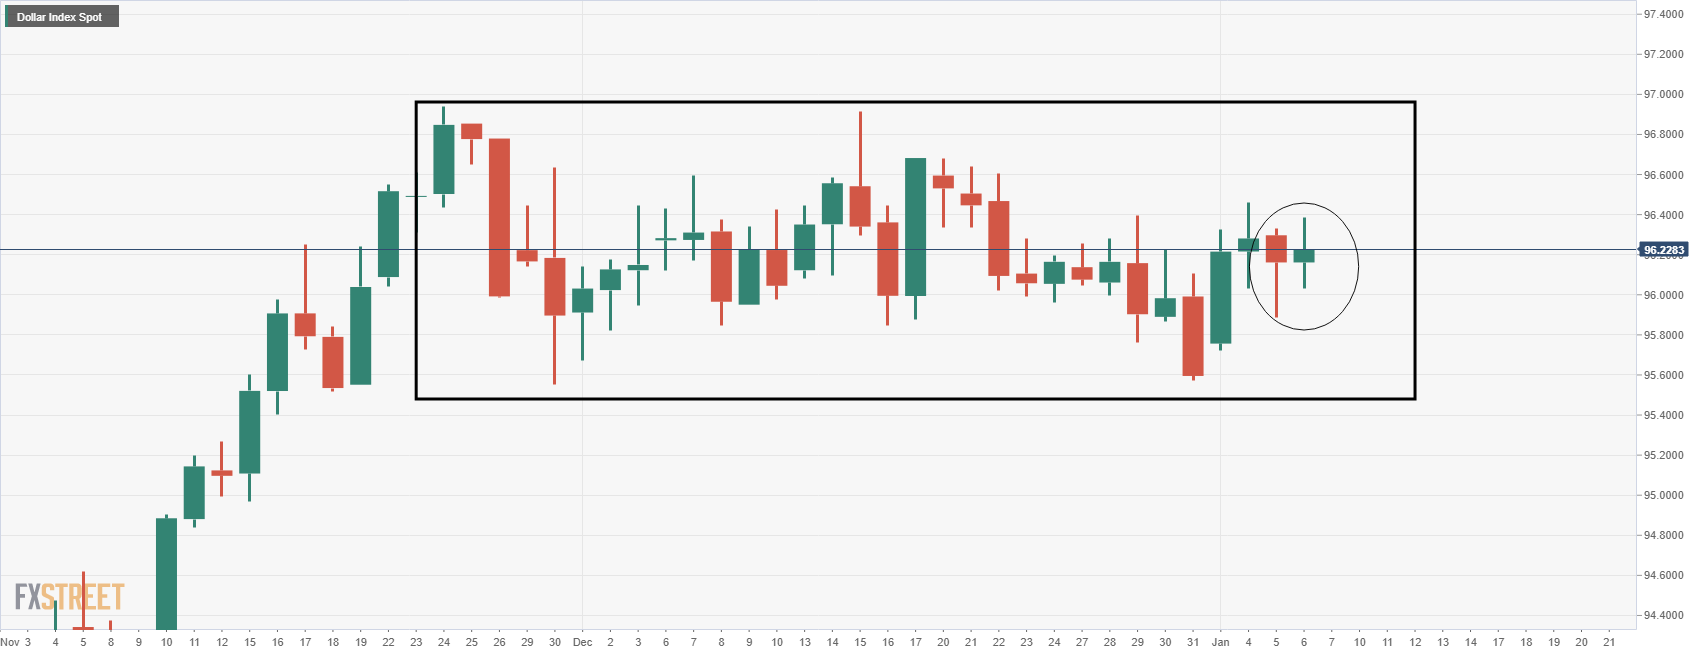
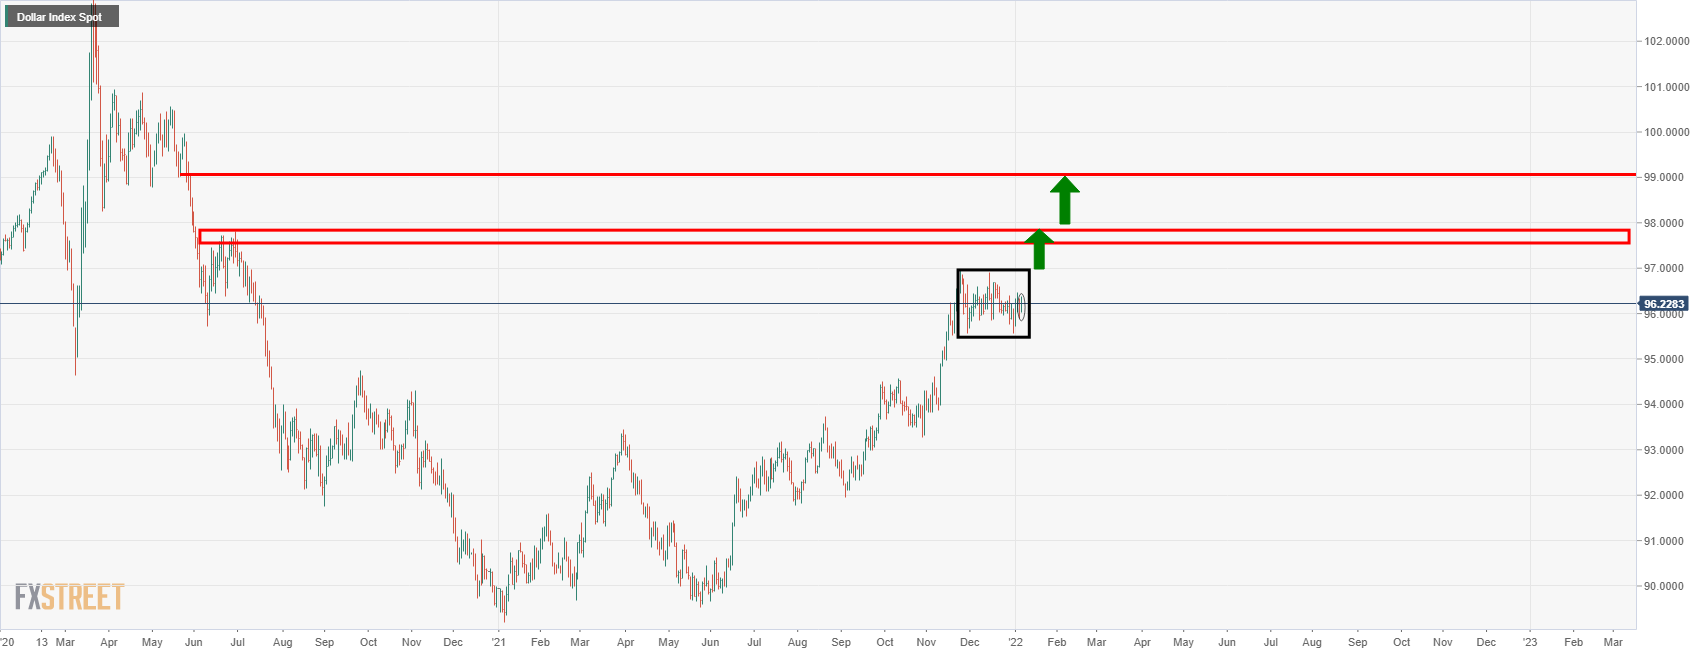
Despite the hawkishness, the greenback remains in the familiar consolidation on the daily chart.
However, if this is a phase of reaccumulation, then 98 the figure and then 99 the figure would be expected to be revisited in due course:
- USD/CAD is in the hands of the bears and eyes are on the daily H&S taking shape.
- The US dollar remains consolidated despite hawkish FOMC minutes.
The US dollar was making life difficult for the impatient bears midweek following a firmly hawkish confirmation at the Federal Reserve on the back of the Federal Open Market Committee minutes. However, following a brief rally in the greenback, the market has rebalanced and the US dollar is struggling to stay green on the day within familiar ranges as follows:
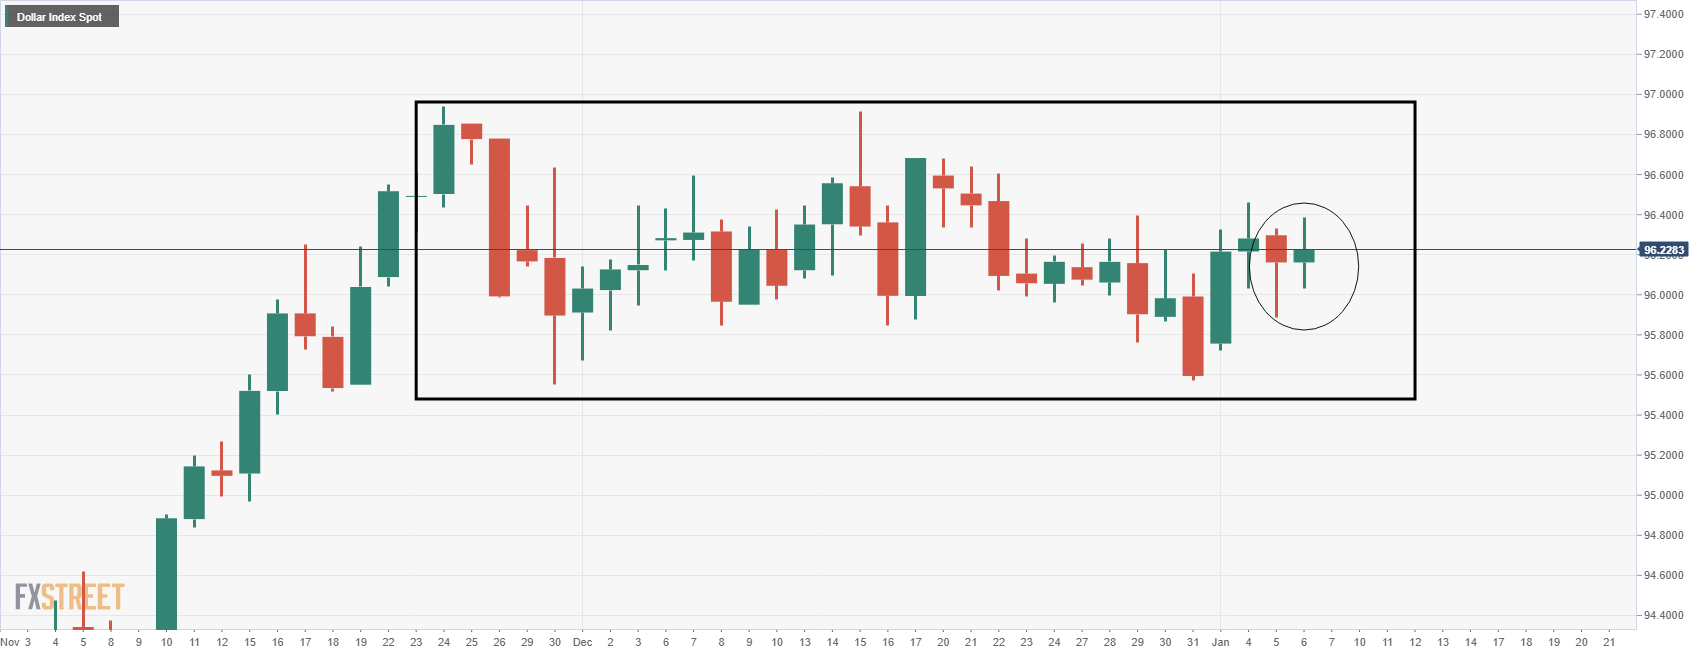
This has enabled the bears to take back control in USD/CAD and as per yesterday's analysis, USD/CAD Price Analysis: Bears line up for their discounts, as a case for a bearish breakout can still be made. The following illustrates the market structure from a daily and 4-hour bearish perspective:
USD/CAD, prior analysis
USD/CAD H&S formation in the making;
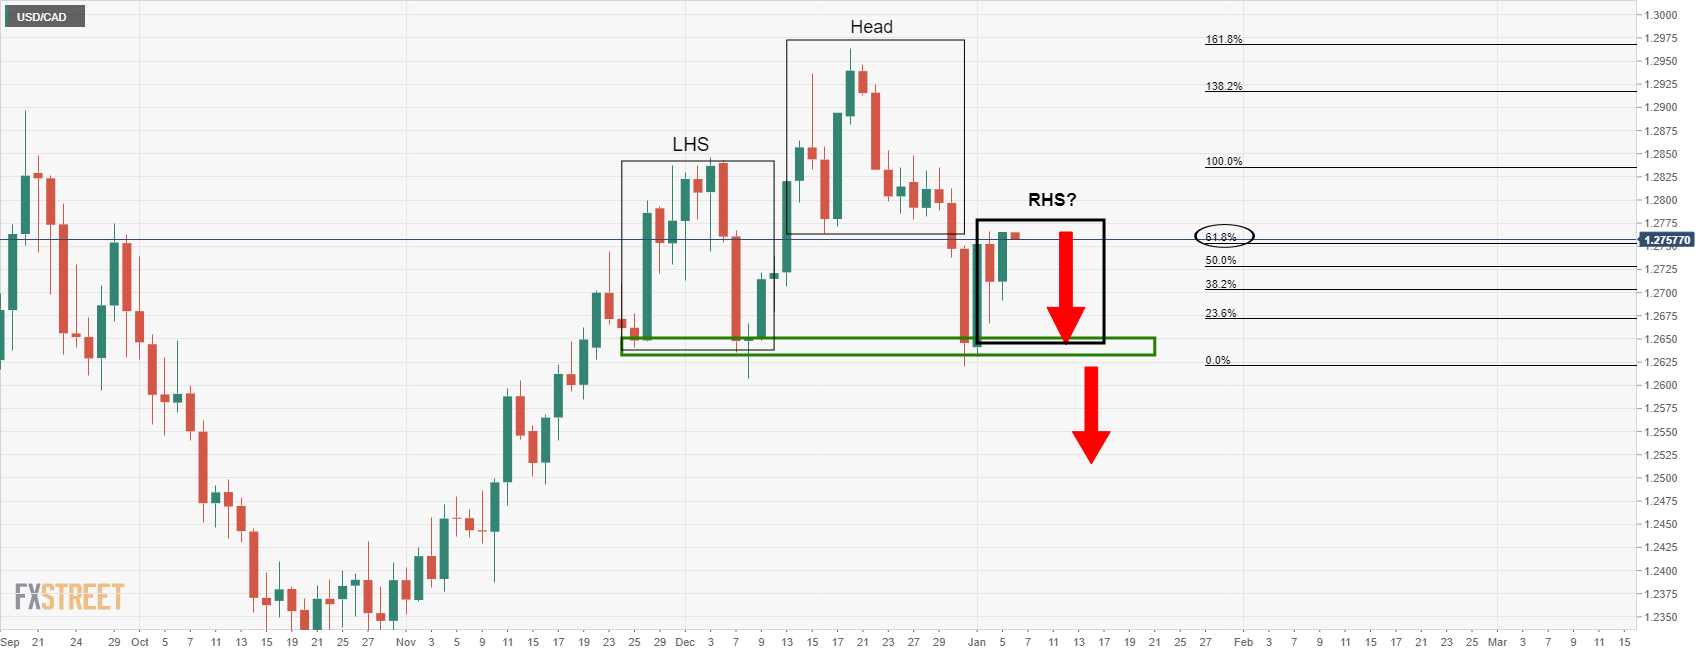
The formation of the head and shoulders pattern was explained as being a potential topping formation for the days ahead.
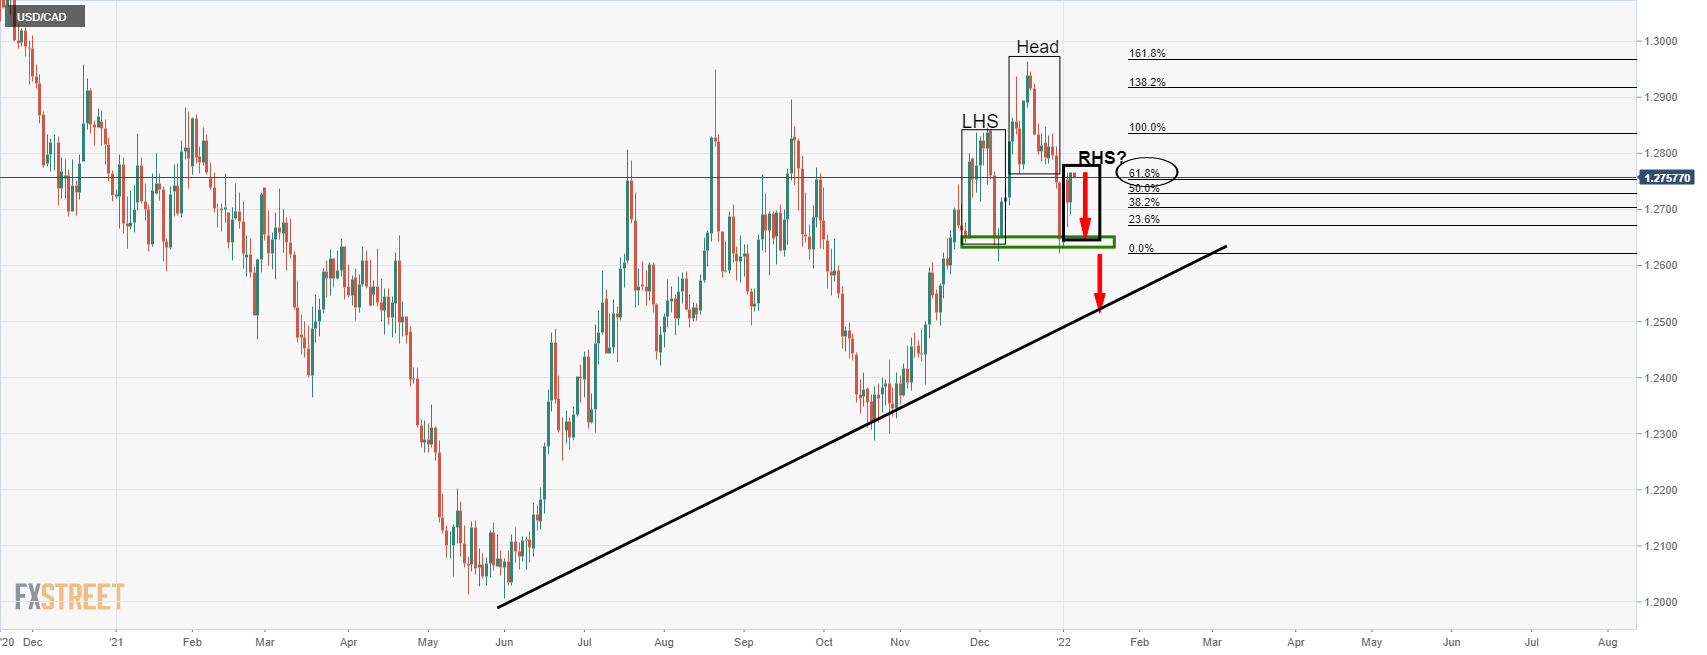
So, the price would be expected to run significantly lower on a break and retest of the neckline near 1.2630.
1.2520 will be earmarked as per the dynamic trendline support:
Bearish structure playing out
For this to play out, we wanted to see a down move in the US dollar, despite the hawkish Federal Reserve minutes.
From a 4-hour perspective, we were looking for a move as follows as illustrated in the prior analysis:
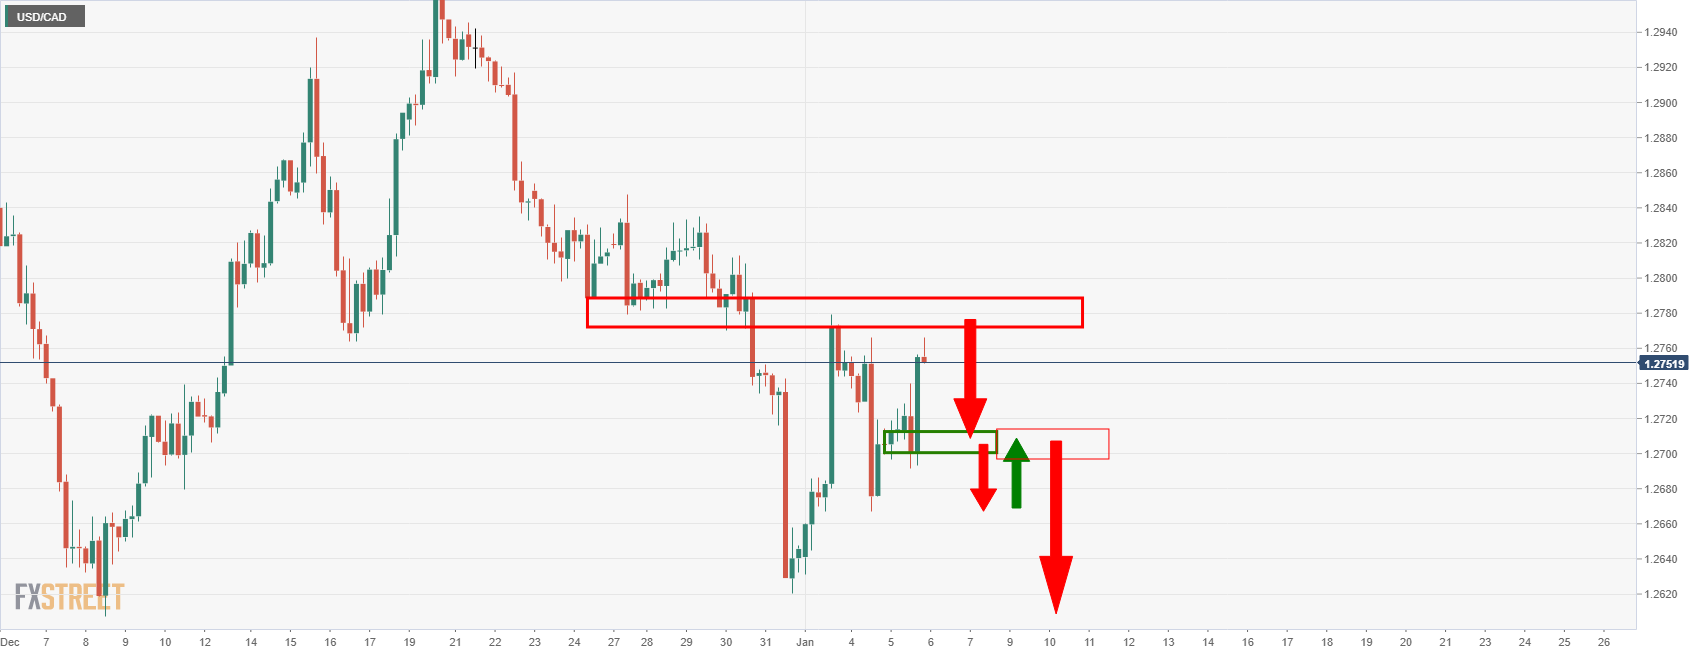
The price action is starting to play out:
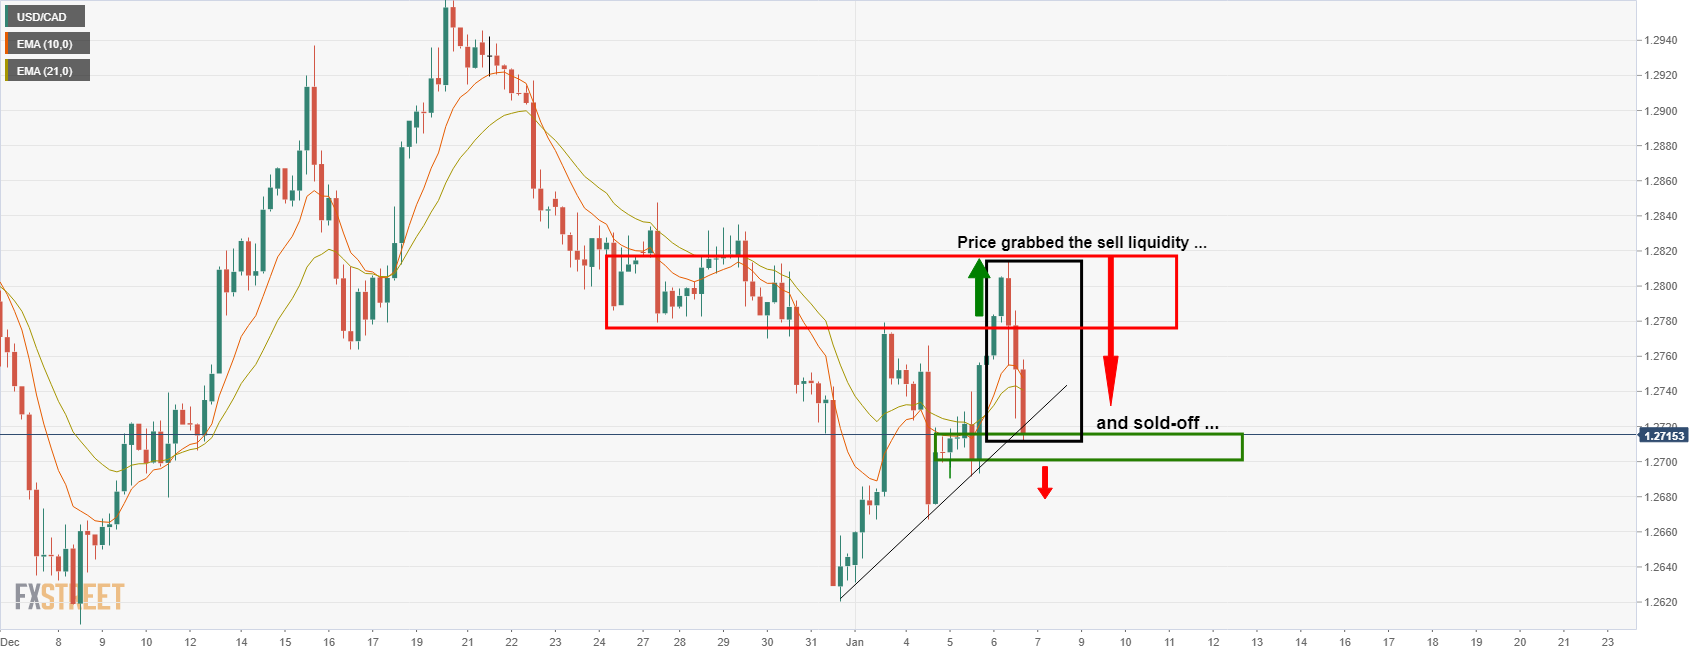
As illustrated above, the price ran into the sell stops above the prior highs and into a high volume area where the sellers took back control as a discount, as per the title of the prior analysis: (USD/CAD Price Analysis: Bears line up for their discounts).
This has marked the price action on the daily chart as follows:
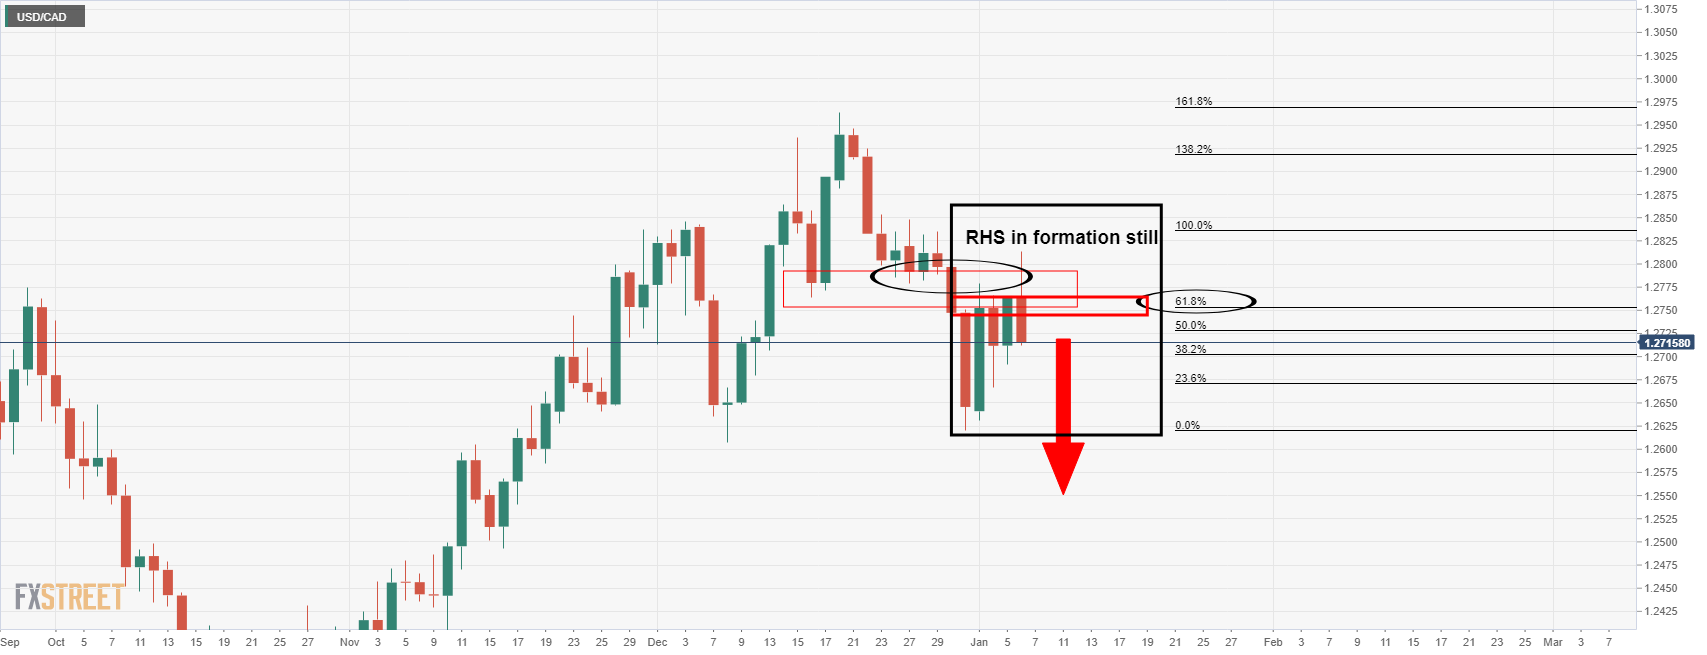
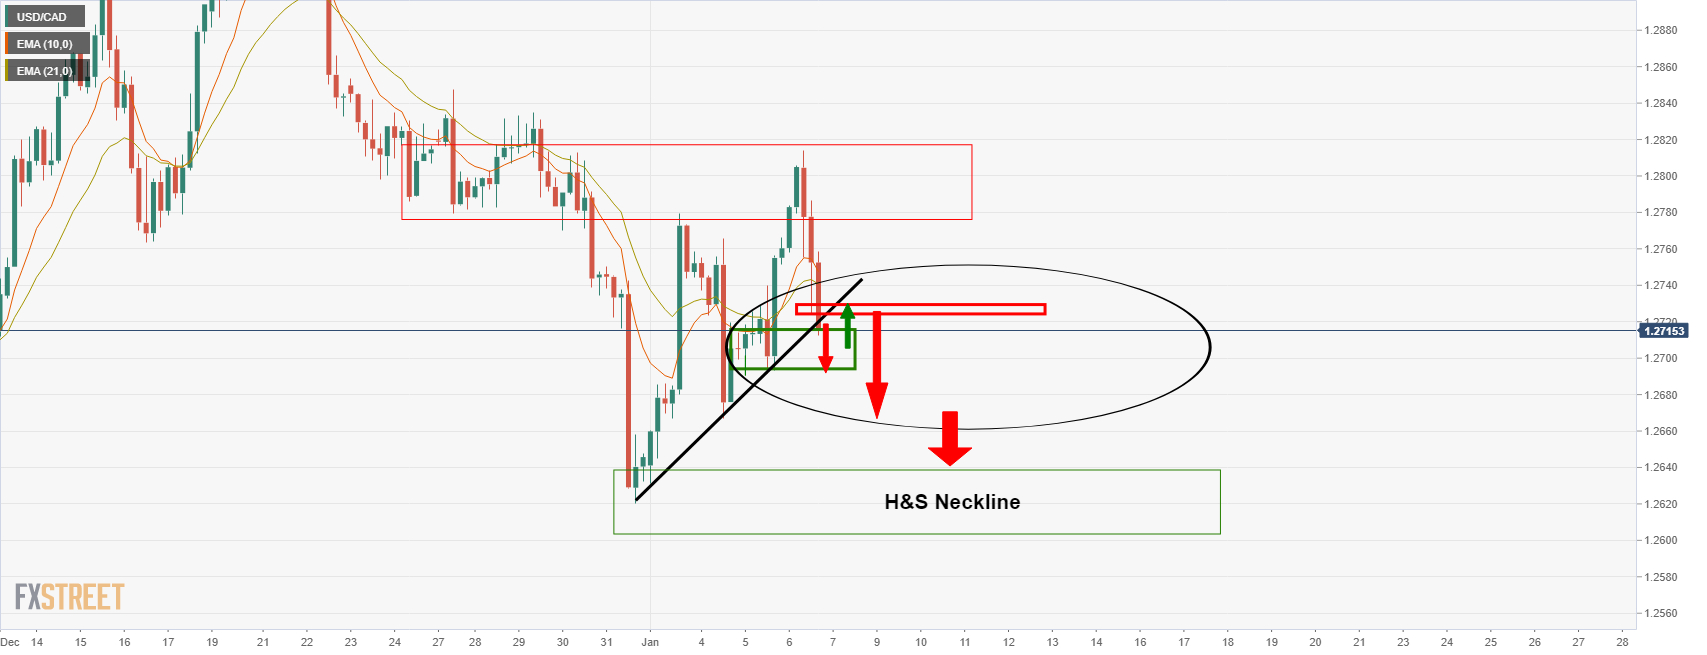
The right-hand shoulder (RHS) of the head and shoulders is taking shape. We now need to see a break out below the 4-hour support for a run to the H&S neckline between 1.2620 and 1.2600:
- USD/JPY continues to trade to the south of the 116.00 level on Thursday, having failed to rally post-hawkish Fed minutes.
- Long-term US yields will need to continue pushing higher if USD/JPY is to test late-2016 highs above 118.00.
- US 10-year yields are up sharply on the week, but are yet to break above 2021 highs around 1.77%.
After briefly moving back above the 116.00 level on Wednesday, but failing to test Tuesday’s multi-year high at 116.40, USD/JPY has gradually slipped lower on Thursday and has spent the last few hours going sideways in the 115.70s area. The pair, which has thus far failed to garner any impetus in wake of a more hawkish than expected Fed minutes release on Wednesday despite it sending US yields sharply higher across the curve, has found support in the form of Wednesday’s low close to 115.60. Below that, technicians note further support in the form of the November 2021 and February 2017 highs at 115.50.
Some FX strategists are surprised at the dollar’s failure to pick up in wake of the Fed minutes that clearly showed a strong appetite at the Fed for a fairly swift rate hiking cycle coupled with prompt balance sheet reduction. US data has been mixed this week in the run-up to Friday’s official December labour market report and not influenced FX markets too much. The labour market data already out this week continues to endorse the idea that the US labour market is very tight and businesses are continuing to struggle with personnel/skills shortages, something Friday’s data is expected to confirm. Tokyo Consumer Price Inflation figures out during Friday’s Asia Pacific session are unlikely to move the pair given that inflationary pressure in Japan remains highly subdued and unlikely to force the BoJ into deviating from its ultra-dovish policy stance any time soon.
Some have suggested that USD bulls might be keeping their powder dry ahead of the jobs report, which if as expected, might give them the green light to chase the dollar higher. However, with the yen the most sensitive G10 currency to rate differentials, long-term US yields will likely need to resume their march higher if USD/JPY is to surpass recent highs and test late-2016 highs above 118.00. Speaking of, the US 10-year poked above 1.70% on Thursday and is up over 20bps on the week, but the key level being watched by bond market participants is the 2021 high at 1.77%.
- The Mexican peso strengthens during the day, up some 0.73% against the greenback.
- Banxico’s last meeting minutes stressed concerns over inflation, labor wages as new head Victoria Rodriguez takes the helm of Banxico.
- Mixed US macroeconomic data weakened the greenback vs. the Mexican peso.
On Thursday, during the New York session, the Mexican peso advances in the North American session, trading at 20.4387 at the time of writing. The market sentiment is mixed, as European stock indices closed in the red, whereas the US equity markets advance, except for the Dow Jones, down some 0.34%.
Banxico last meeting minutes shows its members are worried over inflation and higher wages
On Thursday, the Mexican central bank, also known as Banxico, released its last meeting minutes where the central bank hiked 50 basis points the benchmark rates, up to 5.50%.
The minutes showed that all of the members said that headline and core inflation expectations for 2021, 2022, and for the next 12 months increased again. Furthermore, the policymakers noted that economic integration with the US and high inflation levels spurred elevated prices in Mexico.
Banxico’s members said that the forecasts of inflationary pressures were revised upwards, especially in 2022. Also, the minimum wage increase between the Mexican government and business groups of 22% could add upward pressures on labor costs, per Banxico’s policymakers noted.
In the meantime, the US economic docket featured Initial Jobless Claims for the week ending on January 1, which showed an increase of 207K higher than the 197K estimated by economists. The 4-week moving average rose 204.5K, a tick more elevated than the 199.75K in the prior week.
The Institute for Supply Management reported that the Services PMI in the US fell from 69.1 in November to 62.0 in December. Despite contracting, a reading above 50 indicates growth in the services sector.
On Wednesday, the Federal Reserve released its December minutes. The US central bank noted that monetary policy accommodation was unnecessary and that a faster reduction of its bond-purchasing program was needed before hiking rates. Moreover, Fed members began discussions of a contraction of its balance sheet, which was perceived by a hawkish signal by the markets, with investors selling stocks aggressively. US money market futures have priced in an 80% chance of a rate hike in the March 2022 meeting.
Federal Reserve Bank of San Francisco President and FOMC member Mary Daly said on Thursday that we will need to raise interest rates to keep the economy in balance. Even if we do a couple of interest rate increases, monetary policy will still be accommodative, she added.
Additional Remarks:
"Inflation is a regressive tax... I take it really seriously."
"Inflation has been higher than I'm comfortable with for a long time."
"If we act too aggressively to offset high inflation, we won't actually do much to solve supply chain problems."
"We've come to a point where it is clear inflation is rising in sectors not affected directly by Covid."
"We need to be vigilant on data and take a measured approach to policy."
Market Reaction
There does not seem to have been a market reaction to Daly's latest remarks.
- NZD/USD has stabilised in recent trade in the 0.6750 area after being hit after risk-appetite deteriorated post-hawkish Fed minutes.
- Risk appetite and USD flows will remain the key drivers in the days ahead.
- A break below the 0.6750 region would likely see the pair drop back to test 0.6700 again for the first time since mid-December.
NZD/USD has stabilised in the 0.6750 area as global risk appetite settles following Wednesday’s sharp post-hawkish Fed minutes deterioration. As US (and global) equities sold off on Wednesday, led by duration-sensitive big tech and growth names, risk-sensitive currencies like NZD were hit. As a result, NZD/USD dipped all the way from the 0.6820/30 area to current levels around 0.6750. The pair is now roughly 1.3% below Wednesday’s highs near 0.6840 and is about 0.7% down on the day, the pair having lost a grip on its 21-day moving average close to 0.6790 during Asia Pacific trade.
NZD/USD focused US themes
Amid an ongoing lack of domestic economic events/fundamental developments worth noting in New Zealand to drive the pair, risk appetite and dollar flows are likely to continue to reign supreme. Hawkish Fed minutes and the associated move higher in US yields and lower in US (and global) equities aside, another key point of focus this week has been US data. For the most part, the data out so far this week has been ignored. On first glance, the December data this week has been mixed to poor; yes, ADP was strong, but both headline ISM survey indices missed forecasts and JOLTs showed a drop of about half a million in job openings as opposed to an expected rise.
But digging a little deeper reveals a few key trends. Firstly, a record number of quits in November, as shown by the JOLTs data plus survey participant comments about the state of the US labour market suggest that the worker/skills shortage continues to bite, adding upside risks to wage inflation. Secondly, the ISM surveys revealed that while supply chain disruptions continue to hamper output, they are at least beginning to ease, with the manufacturing survey seeing a large associated drop in the price paid subindex.
The minutes revealed that the Fed is now acutely aware that, though total employment remains well below pre-pandemic levels, the labour market is fast approaching “short-term” full employment, something which Fed’s Mary Daly just alluded too. As Daly and other Fed members have pointed out, the pandemic continues to hold back worker supply and so the Fed must work with the labour market its got today, rather than working with the labour market it hopes to have in a post-pandemic world of higher labour supply.
That suggests that even if Friday’s US non-farm payrolls number is weak, the Fed will likely shrug this off as a result of weak labour supply rather than demand. In other words, a weak headline number (as was the case last month) shouldn’t dent Fed tightening expectations, which have leapt substantially this week. It thus feels as though the risks for NZD/USD are tilted to the downside as Fed tightening beckons. A break below the 0.6750 region would likely see the pair drop back to test 0.6700 again for the first time since mid-December.
Federal Reserve Bank of San Francisco President and FOMC member Mary Daly said on Thursday that the US labour market looks very strong, though the US remains millions of jobs short of pre-pandemic levels, with the pandemic still holding back workers.
Additional Remarks:
"Don't think monetary policy should accept today's labour market as what we want to see in the future."
"We are closing in on achieving our two goals in short-run."
"Balancing the short-run and longer-run goals in 2022 will be critical for Fed policy."
"Right now it is 'very appropriate' to taper asset purchases, so as to be out of it by the end of March."
"Normalizing the balance sheet would come after raising interest rates."
Market Reaction
The dollar does not seem to have reacted to Daly's latest remarks, which do not add any new information on top of Wednesday's minutes.
- The single currency has been unable to recover from hawkish FOMC minutes, down 0.13%.
- US ISM Services PMI slowed a tick though it remains at expansionary territory.
- US Initial Jobless Claims rose by 207K, 10K more than estimations.
- EUR/USD Technical Outlook: Bearish biased though a daily close below 1.1300 could accelerate a challenge to 2021 yearly low at 1.1186.
On Thursday, the shared currency is barely flat during the day, though it trims some Wednesday gains, as market participants assess last FOMC’s meeting minutes. The EUR/USD is trading at 1.1295 at press time.
US ISM Services PMI slowed in December
The Institute for Supply Management reported that the Services PMI in the US fell from 69.1 in November to 62.0 in December. Despite contracting, a reading above 50 indicates growth in the services sector. The contraction is likely attributed to the resurgence of Covid-19 cases, but supply constraints appear to be easing.
Before Wall Street opened, the Department of Labor reported that Initial Jobless Claims for the week ending on January 1, 2022, increased by 207K higher than the 197K foreseen by economists. The 4-week average topped 204.5K, more than the 199.75K in the prior week. In spite of rising, jobless claims hovered near a five-decade low in recent weeks.
On Wednesday, the Federal Reserve released its December minutes. The US central bank noted that monetary policy accommodation was unnecessary and that a faster reduction of its bond-purchasing program was needed before hiking rates. Moreover, Fed members began discussions of a contraction of its balance sheet, which was perceived by a hawkish signal by the markets, with investors selling stocks aggressively. US money market futures have priced in an 80% chance of a rate hike in the March 2022 meeting.
In the meantime, the US Dollar Index, which measures the greenback’s performance against six rivals, is up 0.02%, sitting at 96.20, underpinned by rising US 10-year Treasury yields rising three and a half basis points, currently at 1.7369%.
EUR/USD Price Forecast: Technical outlook
The EUR/USD daily chart depicts the pair as downward biased. The daily moving averages (DMAs) reside well above the spot price. Given that the Relative Strength Index is at 46, under the 50-midline, it means that the EUR/USD might print a leg-down before reaching oversold conditions.
On the downside, the EUR/USD first support level would be the January 4 low at 1.1273. A breach of the latter would open the door for crucial support levels, with December 15, 2021, a daily low at 1.1222, followed by a 2021 yearly low at 1.1186.
- GBP/USD has remained supported above 1.3500, but failed to rally about 1.3550 as traders await Friday’s key US jobs report.
- The dollar has so far failed to see broad strength in wake of the latest hawkish Fed minutes.
- USD bulls may be waiting for the report to confirm progress to the Fed’s full-employment goal before chasing USD higher.
GBP/USD continues to trade on the back foot on Thursday as the US session gets underway, despite a weaker than expected US December ISM Services PMI survey, having failed to recover back to the north of the 1.3550 mark earlier. At current levels in the 1.3520s, the pair is trading lower by about 0.2% or 30 pips on the day, and about 0.5% below Wednesday’s pre-hawkish Fed minutes highs at 1.3600. Some FX strategists are surprised that the dollar hasn’t strengthened more in wake of the latest Fed minutes, having been surprised by the apparent appetite amongst FOMC members for a faster pace of tightening (using rate hikes and quantitative tightening).
Its probably worth noting that even if the dollar does start to pick up in the coming sessions, sterling is likely to hold up better than other G10 currencies given that the BoE is already and set to remain well ahead of the Fed when it comes to monetary policy normalisation (both in terms of rate hikes and expectations for imminent QT). For now though, GBP/USD remains well supported above the 1.3500 level, having fended off a test of it earlier in the session.
December jobs report looms
USD bulls seem to be waiting for a “green light” in the form of a strong US December jobs report before chasing the dollar higher. Ahead of Friday’s key report, which the median economist forecast suggests will show 400K jobs being added to the US economy, taking the unemployment rate lower to 4.1% from 4.2%, labour market indicators have been strong. Weekly jobless claims and continued jobless claims in December fell below pre-pandemic levels. The November JOLTs report showed that, heading into December, the number of job vacancies far outnumbered the number of unemployed persons and that quits (a lead indicator of wage pressures) hit a record high above 4M.
Meanwhile, the ADP report on Wednesday estimated December employment change at double expectations at over 800K. Tuesday’s ISM Manufacturing PMI saw its employment subindex rise to 54.2, its highest since H1 2021 and while Thursday’s ISM Services PMI fell to 54.9 from 56.5, survey participants continued to complain of personel and skills shortages. The suggestion is that either Friday’s NFP numbers is very strong, which the Fed would see as a bullish indicator of further rapid progress to their goal of full employment, or the number is weak, but only as a result of lack of labour supply. The latter, while a less favourable outcome, is likely to still be interpreted as evidence of further progress to full-employment, given that the Fed has recently come to the conclusion that it may take some time for labour supply to properly recover and they need to “work with what they’ve got” in terms of the current, smaller labour market when making policy.
- The Australian dollar falls at the mercy of a hawkish US central bank that eyes reducing its balance sheet.
- US Initial Jobless Claims rose more than foreseen but remain at five-decade lows.
- AUD/USD Technical Outlook: The pair is bearish biased and soon might test the 0.7100.
In the North America session, the AUD/USD slides for the second day of the week, courtesy by a hawkish Federal Reserve alongside a rise in US Treasury yields, with the 10-year benchmark note above 1.70%, the highest since April 2021. At the time of writing, exchanges hands at 0.7161.
US Initial Jobless Claims increased more than estimated
In the meantime, US Initial Jobless Claims for the week ending on January 1, 2022, rose by 207,000 more than the 197,000 estimated by economists. The 10,000 increase of claims on the first week of the year impacted the 4-week average, which topped 204,500, higher than the 199,750 in the prior week. Despite rising, jobless claims hovered near a five-decade low in recent weeks.
Next on the US calendar, the ISM Services PMI for December, estimated at 66.9, would be released at 15:00 GMT, while St. Louis Fed President James Bullard (voter 2022) would cross the wires later in the day.
That said, on Wednesday, the US central bank revealed on its December minutes that monetary policy accommodation was not needed and that a faster reduction of its QE program was required before hiking rates. Also, Fed policymakers began discussions of a contraction of its balance sheet, which was perceived by a hawkish signal by the markets, with investors selling stocks aggressively. At the same time, US T-bond yields rose, with the 10-year hitting the highest level since April 2021.
Furthermore, US money market futures have priced in an 80% chance of a rate hike in the March 2022 meeting. In the meantime, the US Dollar Index, which measures the buck's value against six rivals, is barely flat at 96.16.
AUD/USD Price Forecast: Technical outlook
The AUD/USD daily chart depicts the pair as bearish biased, as the daily moving averages (DMAs) reside above the spot price, with a downslope acting as dynamic resistance levels. Additionally, at press time, the pair pierced an upslope trendline drawn from December 6, 2021, daily low up to December 20, 2021, low, that opened the door for a test of the latter at 0.7082, but it would find some hurdles on its way down.
The AUD/USD first support level would be the 0.7100 psychological level. A breach of the latter would send the pair tumbling towards the December 20, 2021, cycle low at 0.7082.
- US Factory Orders rose 1.6% in November, slightly above expected.
- There was no FX market reaction to the data.
According to US Census Bureau data, US Factory Order rose by 1.6% MoM in November. That was slightly above the expected 1.5% gain and marked an acceleration on the 1.2% MoM gain seen back in October (which was revised up from 1.0%). Excluding transportation, orders were up 0.8% on the month, though this marked a deceleration from last month's MoM growth rate of 1.5% (which was revised down from 1.6%.
Market Reaction
There was no FX market reaction to the latest factory orders figures.
- The headline ISM Services index fell to 62.0 in December from 69.1 in November.
- The New Orders subindex fell to its lowest since November.
The Institute of Supply Management's headline Services PMI index fell to 62.0 in December versus forecasts for a fall to 66.9 from 69.1 in November.
Subindices:
- Business Activity fell to 67.6 from 74.6.
- Prices Paid rose to 82.5 from 82.3.
- New Orders fell to 61.5 from 69.7, the lowest such reading since February 2021.
- Employment fell to 54.9 from 56.5.
Market Reaction
The DXY does not seem to have reacted much to the latest US ISM survey, even though it was a tad weaker than forecast.
- WTI briefly eclipsed the $80 per barrel level for the first time since mid-November as OPEC+ struggles to lift output.
- Crude oil prices have rallied despite recent downside in global equities after hawkish Fed minutes, and are watching Kazakhstan unrest.
Front-month WTI futures have surged on Thursday despite recent hawkish Fed minutes induced downside in other risk assets which oil tends to have a tight correlation to such as US and global equities. Prices momentarily eclipsed $80 per barrel for the first time since mid-November before easing back a little and at current levels in the mid-$79.00s, WTI is trading with gains of about $2.50 on the day. With the last key area of chart resistance in the $79.50 area ahead 2021 highs around $85.00 now cleared, oil bulls may now be expecting WTI to push more decisively into the $80s.
Supply-side rather than demand/macro dynamics have been dictating the price action in crude oil markets on Thursday. Kazakhstan’s 1.6M barrel per day (BPD) producing oil infrastructure is yet to face disruption, but civil unrest there adds further notable downside risk to OPEC+ supply at a time when other members are struggling to meet output quotas. Libya’s National Oil Company (NOC) said on Thursday that oil output currently stands at just over 700K BPD. Libyan output faces severe disruptions as infrastructure undergoes maintenance and repairs – output was as high as 1.3M BPD at the end of last year.
Libya has not been the only country struggling to hit output quotas and a Reuters survey release on Thursday highlighted this dynamic. The survey showed the group’s output only rose by 70K BPD in December, far below the 400K monthly output hike allowed under OPEC+’s agreement. The survey noted that output in Libya and Nigeria fell and that, as a result, OPEC+ net compliance with its output reduction pact rose in December to 127% from 1.20% in November. Concerns about OPEC+ struggles to lift output in line with plans and tightness this exerts upon global oil markets has distracted markets from the news that Saudi Arabia lowered its official selling price for all crude oil grades to Asian customers (an indicator of slowing demand).
- USD/TRY extends the march north near the 14.00 mark.
- The lira drops further after N.Nebati comments midweek.
- Investors’ attention remains on the CBRT event on January 20.
Another day, another drop in the lira. This time, the depreciation of the Turkish currency lifts USD/TRY to the vicinity of the 14.00 level, challenging at the same time the area of YTD tops.
USD/TRY up on stronger US yields, lira weakness
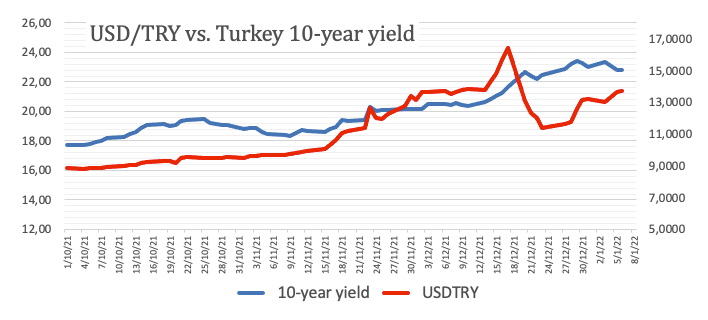
USD/TRY advances since Tuesday on the back of the move higher in US yields and increasing depreciation of the domestic currency, which has particularly exacerbated its losses following the 19-year high in Turkey’s inflation figures. It is worth recalling that consumer prices tracked by the CPI rose past 36% in December vs. the same month of 2020.
An extra hit to the lira (as if needed) came after Finance Minister N.Nebati said on Wednesday that the country will now abandon orthodox policies when it comes to tackle the rampant inflation, shifting instead to “heterodox policies” (or whatever that means), as the country will now chart its own course (?).
Further news from agency Reuters cited President Erdogan saying that “From now on, it is time to reap the benefits of our efforts, to show our people that we are approaching our goals”… (which would be…)
In the meantime, the lira shed nearly 45% in 2021 vs. the US dollar, making it one of the worst performers during the past year. Furthermore, since the Turkish central bank (CBRT) started its easing cycle back in mid/late September, TRY lost around 33%.
What to look for around TRY
The lira resumed the downtrend while market participants continue to digest the recent inflation figures and the government scheme to protect deposits in the domestic currency. The reluctance of the CBRT to change the (collision?) course and the omnipresent political pressure to favour lower interest rates in the current context of rampant inflation and (very) negative real interest rates are forecast to keep the lira under intense pressure for the time being, That said, another visit to the all-time high north of the 18.00 mark in USD/TRY should not be ruled out just yet.
Eminent issues on the back boiler: Progress (or lack of it) of the new scheme oriented to support the lira. Constant government pressure on the CBRT vs. bank’s credibility/independence. Bouts of geopolitical concerns. Much-needed structural reforms. Growth outlook vs. progress of the coronavirus pandemic. Potential assistance from the IMF in case another currency crisis re-emerges.
USD/TRY key levels
So far, the pair is gaining 0.91% at 13.7531 and a drop below 12.7523 (weekly low Jan.3) would pave the way for a test of 11.8918 (55-day SMA) and finally 10.2027 (monthly low Dec.23). On the other hand, the next up barrier lines up at 13.8967 (YTD high Jan.3) followed by 18.2582 (all-time high Dec.20) and then 19.0000 (round level).
- Spot gold prices have been choppy on Thursday and current trade around $1790, down over 1.0% on the day.
- Real yields have been surging in wake of Wednesday’s hawkish Fed minutes and this is weighing on precious metals.
Trading conditions in precious metal markets have been choppy in recent trade, though bearish momentum in wake of Wednesday’s hawkish Fed minutes seems to be winning through for now. Spot gold (XAU/USD) prices have tumbled from Asia Pacific session levels in the $1810 area to current levels (and session lows) around $1790, with on-the-day losses currently standing at just over 1.0%. A late-European morning rebound that saw spot prices rebound from the mid-$1790s to near the $1810 level again ultimately proved nothing more than an intra-day dead-cat bounce and a good opportunity for gold bears to add to short positions.
On its way lower to test the $1790 area, XAU/USD has fallen through a succession of key moving averages (the 21, 50 and 200DMAs which all reside between $1797 and $1805). But the bears have so far not been able to send gold prices decisively underneath support in the form of recent lows, including last week’s low at $1789.50 and the low from the week before at $1785. Should these lows go, bearish technicians will likely target a swift test of December’s sub-$1760 lows.
Selling pressure in gold markets has not come as a surprise to many analysts who observed US real yields, with which gold typically has a tight negative correlation, surging in wake of Wednesday’s Fed minutes. Short-Term Interest Rate markets have busily been bringing forward bets as to when the Fed’s rate-hiking cycle will get underway and how high the bank will ultimately take rates. But with markets also increasingly buying into the Fed’s bullish economic outlook, this added dose of Fed hawkishness has not been depressing long-term growth and inflation expectations. The net result is surging real yields and the 10-year TIPS yield notable surged to its highest level in over six months on Thursday above -0.80%. When the 10-year TIPS yield was last close to the 0.80% level back in September, XAU/USD was trading under $1750.
For spot gold’s losses to really accelerate, the US dollar is likely going to need to pick up a little more from current levels. The DXY remains locked within the 95.50-96.90ish range that has prevailed now for multiple weeks, despite recent upside in yields and downside in stocks in wake of the hawkish Fed. If the dollar does start kicking higher (perhaps Friday’s US jobs report could be a catalyst), that combined with higher real yields could be a big bearish risk for gold.
US ISM Services PMI Overview
The Institute of Supply Management (ISM) will release the Non-Manufacturing Purchasing Managers' Index (PMI) - also known as the ISM Services PMI – at 15:00 GMT this Tuesday. The gauge is expected to fall to 66.9 in December from 69.1 recorded in the previous month. The market focus, however, will be on the Prices Paid sub-component, which represents inflation and is expected to edge higher to 83.6 from 82.3 in November.
How Could it Affect EUR/USD?
Against the backdrop of surprisingly hawkish FOMC meeting minutes released on Wednesday, a stronger print should be enough to provide a fresh lift to the US dollar. Conversely, the market reaction to any disappointment is more likely to be muted amid expectations for an eventual Fed liftoff in March 2022. Apart from this, elevated US Treasury bond yields should continue to underpin the greenback. This, in turn, suggests that the path of least resistance for the EUR/USD pair is to the downside.
Meanwhile, Eren Sengezer, Editor at FXStreet, offered a brief technical outlook for the EUR/USD pair: “The Relative Strength Index (RSI) indicator on the four-hour chart dropped below 50 following the sharp U-turn late Wednesday. Confirming the bearish shift in the near-term outlook, EUR/USD is trading below the 200-period and 100-period SMAs, which form resistance around 1.1300.”
Eren also outlined important technical levels to trade the major: “On the downside, the next support aligns at 1.1270 (static level) before 1.1240 (static level) and 1.200 (psychological level). In case buyers manage to lift the pair back above 1.1300 and hold it there, 1.1320 (50-period SMA) could be seen as the next resistance before 1.1340 (static level) and 1.1360 (post-ECB high).”
Key Notes
• EUR/USD Forecast: FOMC Minutes remind sellers of Fed-ECB policy divergence
• EUR/USD continues to hover above 1.1300 in defiance of calls for USD strength post-hawkish Fed minutes
• EUR/USD: No change to the mixed outlook – UOB
About the US ISM Services PMI
The ISM Non-Manufacturing Index released by the Institute for Supply Management (ISM) shows business conditions in the US non-manufacturing sector. It is worth noting that services constitute the largest sector of the US economy and results above 50 should be seen as supportive for the USD.
- EUR/USD alternates gains with losses around the 1.1300 zone.
- Extra range bound remains in the pipeline in the very near term.
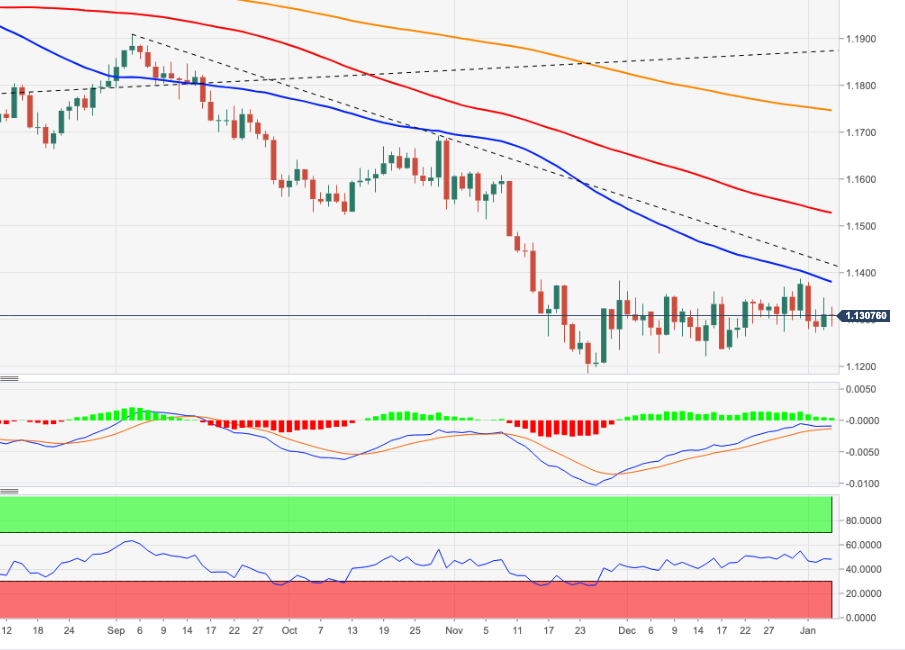
EUR/USD navigates the lower end of the so far yearly range near the 1.1300 area on Thursday.
The lack of a firm direction in either way should prompt the pair to maintain the current consolidative move in the very near term. The initial up barrier is located past the 1.1380 level (January 3), while sellers should meet contention near 1.1270 (January 4).
The broader negative outlook for EUR/USD is seen unchanged while below the key 200-day SMA at 1.1744.
EUR/USD daily chart
- Canada posted a bigger than expected trade surplus on Thursday.
- The Canadian dollar did not react to the data, with focus on Friday's jobs report.
Canada's merchandise trade surplus with the world widened to C$3.13 billion in November from C$2.26 billion in October (which has been revised up from C$2.09 billion), monthly data published by Statistics Canada revealed on Thursday. This reading beat market expectations for a surplus of C$2.03 billion. Canadian exports in October rose to C$58.57 billion from C$56.42 billion in October (which was revised up from C$56.18 billion), whilst imports rose to C$55.44 billion from C$54.16 billion (which was revised up from C$54.09 billion).
Market Reaction
The Canadian dollar did not react to the latest trade figures, with traders much more focused on Friday's Canadian jobs report, which will be closely watched by BoC policymakers.
- Initial claims rose to 207K in the week ending on January 1, above the 197K expected.
- The insured unemployment rate remains steady at 1.3%.
There were 207,000 initial claims for unemployment benefits in the US during the week ending January 1, data published by the US Department of Labor (DoL) revealed on Thursday. This reading followed last week's print of 200,000 (which was revised up from 198,000) and came in slightly above consensus market expectations for 197,000.
Continued jobless claims rose to 1.754M in the week ending December 25, the data showed, above expectations for a decline to 1.688M from 1.718M the week prior (which was revised up from 1.716M). The insured unemployment rate remained at 1.3% versus 1.3% last week.
Market Reaction
The latest data, which continues to suggest that the US labour market remained in strong health in the final weeks of December despite surging Omicron infections, did not provoke a market reaction. Focus is on Friday's official US labour market report for the month of December.
- Silver witnessed aggressive selling on Thursday and dived to a near three-week low.
- The technical set-up supports prospects for a further near-term depreciating move.
- A sustained strength above the $22.00 mark is needed to negate the negative bias.
Silver dived to a near three-week low heading into the North American session, with bears now awaiting a sustained break below the $22.00 round-figure mark.
From a technical perspective, Thursday's steep decline confirmed a bearish break through the $22.65-60 region, support marked by the lower end of a one-and-half-week-old trading range. This comes on the back of the recent failures near the 100-day SMA and favours bearish traders.
Meanwhile, technical indicators on the daily chart have been gaining negative traction and are still far away from being in the oversold territory. This further adds credence to the near-term bearish outlook and supports prospects for an extension of the downward trajectory.
Some follow-through selling below the $22.00-$21.90 area will reaffirm the negative bias and drag the XAG/USD back to challenge the 2021 low, around the $21.40 region. The bearish trend could further get extended towards the next relevant support near the $21.00 round figure.
On the flip side, any attempted recovery move could now be seen as a selling opportunity around the $21.60-65 support breakpoint. This, in turn, should cap the upside for the XAG/USD near the $22.00 mark, which should act as a pivotal point for short-term traders.
Silver daily chart
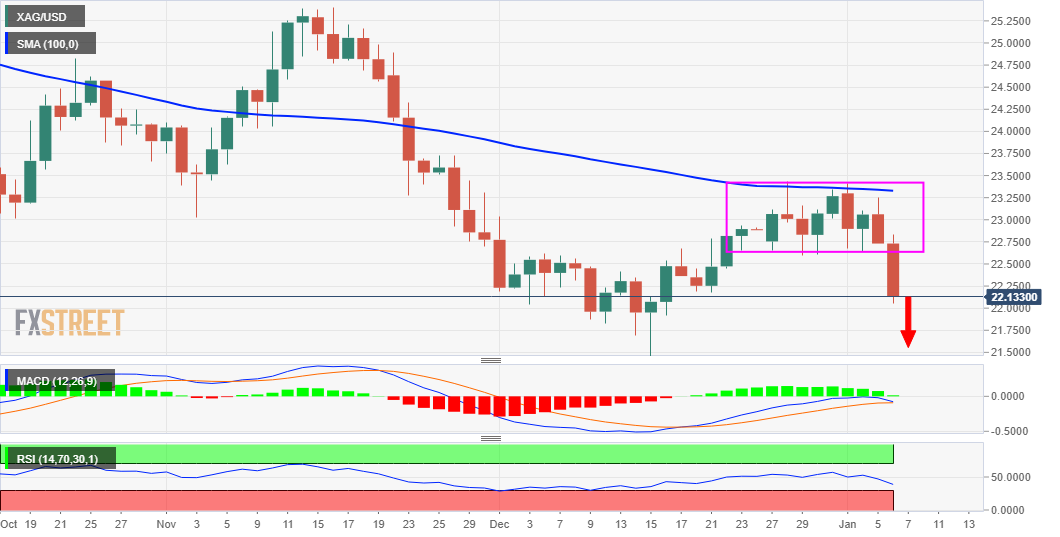
Technical levels to watch
- DXY adds to Wednesday’s losses and approaches 96.00.
- Initial contention is seen at the YTD low at 95.88.
DXY extends the 2-day knee-jerk to the 96.00 neighbourhood on Thursday.
In case the selling pressure regains conviction, then the next support of significance is located at the so far 2021 low at 95.88 (January 5) followed by the December’s low at 95.57 (December 31).
In the meantime, while above the 4-month support line (off September’s low) around 95.00, further gains in DXY are likely. Looking at the broader picture, the longer-term positive stance remains unchanged above the 200-day SMA at 93.04.
DXY daily chart
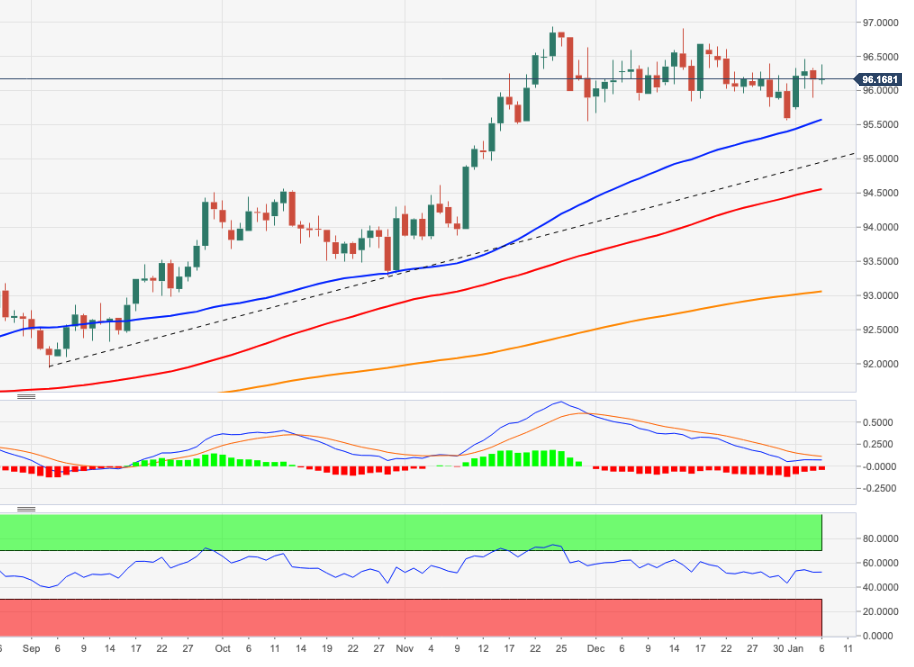
- HICP fell as expected to 5.7%, but CPI was higher than expected and rose to 5.3% in December.
- The euro saw some initial positive ticks, but state-level data earlier in the day flagged the risk of a positive surprise.
According to a preliminary estimate published by Destatist this Thursday, Germany's Harmonized Index of Consumer Prices (HICP), which is the ECB's preferred gauge of inflation, fell as expected to 5.7% in December from 6.0% in November. However, MoM HICP was higher than expected at 0.3% versus median forecasts for a drop to 0.2% in December from 0.3% in November.
The alternative Consumer Price Index (CPI) showed YoY inflation at 5.3% in December, more than the 5.1% median expectation of surveyed analysts and above November's 5.2% rate. The MoM pace of inflation according to the CPI was also higher than expected at 0.5%, above consensus forecasts for an acceleration to 0.4% from -0.2% in November.
Market Reaction
The euro has seen some minor positive ticks in recent trade, though state-level inflation data released earlier on Thursday did point to stronger than expected YoY CPI and MoM CPI and HICP inflationary pressures.
- A combination of factors failed to assist USD/CAD to find acceptance above the 1.2800 mark.
- Bullish oil prices underpinned the loonie and acted as a headwind amid subdued USD demand.
- The Fed’s hawkish outlook, elevated US bond yields should limit losses for the USD and the pair.
The USD/CAD pair retreated around 40-45 pips from the daily swing high and was last seen trading with only modest intraday gains, around the 1.2770 region.
The pair added to the previous day's hawkish FOMC minutes-inspired upward momentum and gained some follow-through traction for the second successive day on Thursday. This also marked the third day of a positive move in the previous four sessions and pushed the USD/CAD pair to a one-week high. However, a combination of factors failed to assist the major to find acceptance above the 1.2800 mark, instead attracted some sellers at higher levels.
Unrest in Kazakhstan (an OPEC+ oil producer), along with supply outages in Libya lifted crude oil prices to the highest level since November 24. Kazakhstan is experiencing the worst street protests since gaining independence three decades ago. Moreover, Libyan oil output is down due to pipeline maintenance and oilfield shutdowns. This, in turn, underpinned the commodity-linked loonie and acted as a headwind for the USD/CAD pair.
Meanwhile, signs of stability in the financial markets – as depicted by a goodish rebound in the US equity futures – dented the US dollar's relative safe-haven status. This was seen as another factor that kept a lid on any meaningful upside for the USD/CAD pair. That said, a big shift in the Fed's policy outlook and elevated US Treasury bond yields should limit losses for the greenback and lend some support to the USD/CAD pair.
In fact, the December 14-15 FOMC monetary policy meeting minutes indicated that the US central bank could hike interest rates earlier than anticipated previously to combat high inflation. The markets have started pricing in the prospects for an eventual liftoff in March. This was reinforced by the fact that the US 2-year notes, which are sensitive to rate hike expectations along with 5-year notes, jumped to a near two-year high.
Moreover, the yield on the benchmark 10-year US government bond shot to the highest level since October. This, in turn, supports prospects for the emergence of some USD dip-buying, suggesting that any meaningful slide could be seen as an opportunity to initiate fresh bullish positions around the USD/CAD pair.
Market players now look forward to the US economic docket, highlighting the usual Weekly Initial Jobless Claims and ISM Services PMI. Apart from this, the US bond yields and the broader market risk sentiment should influence the USD. Traders will further take cues from oil price dynamics to grab some short-term opportunities around the USD/CAD pair.
Technical levels to watch
- EUR/USD is precariously hovering above the 1.1300 level, as analysts/traders call for dollar strength in wake of hawkish Fed minutes.
- Bears will be looking for a test of recent lows around 1.2775 if the 21DMA and 1.1300 level is broken.
- For now, strong Eurozone data and hawkish ECB bets are aiding the euro.
EUR/USD is precariously hovering to the north of the 1.1300 level, as the bulls, for now, fend off calls from analysts and traders alike that the dollar should strengthen in wake of the latest more hawkish than anticipated Fed minutes. Markets were particularly taken aback by the degree to which FOMC members agreed on the need to press ahead promptly with reducing the size of the Fed’s balance sheet as the rate hiking cycle gets underway. Whilst the minutes sent US bond yields across the curve shooting higher and triggered a tumble in global equities (with the losses concentrated mostly in tech), FX markets are yet to join the hawkish Fed move.
At current levels around 1.1310, EUR/USD trades flat on the day. Bears will be eyeing a test of recent lows in the 1.2775 area, as well as a break below an uptrend that has loosely been supporting the price action going all the way back to November. Before breaking out to the low 1.1200s, however, the pair is going to need to break below its 21-day moving average at 1.1307 and below the key 1.1300 figure. To the upside, key resistance is in the 1.1380 area.
Euro holding off dollar advances for now
Strong Eurozone data and the fact that euro Short-Term Interest Rate markets have aggressively pulled forward expectations for the first ECB rate hike could be helping the euro. On the former, German Factory Orders surged 3.7% in November, which comes as a boost to Germany’s important manufacturing sector that has continued to struggle with supply chain snags and skills shortages in recent months. Meanwhile, individual German states have been reporting inflation data throughout the session and generally now point to the likelihood that national HICP inflation rose (unexpectedly) in December. The German flash estimate is out at 1300GMT.
Regarding money market pricing for the ECB, a 10bps rate hike is now seen as soon as October, as European money markets shift hawkishly in tandem with US money markets, which now price an 80% chance of March Fed lift-off. “There is still a sense that (euro area) inflation could surprise to the upside for longer than expected, so markets have to position for the view that the ECB could capitulate and move earlier on rates” noted analysts at Mizuho. Whether all of the above will continue to be enough to shield the euro from the US dollar’s Fed fuelled advances is another question.
“The discussion about quantitative tightening in the minutes is very significant” analysts at ING noted. “First and foremost, it shows the magnitude of the Fed’s change of tone as they contemplate a more aggressive balance sheet reduction in parallel to hikes” they add, with analysts at MUFG concluding that the “overall the hawkish tone of the minutes support our outlook for further US dollar strength at the start of this year”. Analysts at RBC agree, noting that “the combination of equity risk-off while yields continue to rise would be an interesting one if it endures, and should be broadly supportive of the US dollar”.
- The sharp rebound in EUR/JPY faltered around the 131.50 area.
- Next on the upside comes the 132.17 Fibo level.
EUR/JPY comes under pressure after briefly testing new highs in the 131.50/60 band on Wednesday.
The cross keeps the bid bias unchanged after breaking above the critical 200-day SMA in past sessions. That said, a move beyond the 131.50 zone should expose a visit to the next interim hurdle at the Fibo level (of the October-December drop) at 132.17.
While above the 200-day SMA, today at 130.52, the outlook for EUR/JPY should point to extra gains.
EUR/JPY daily chart
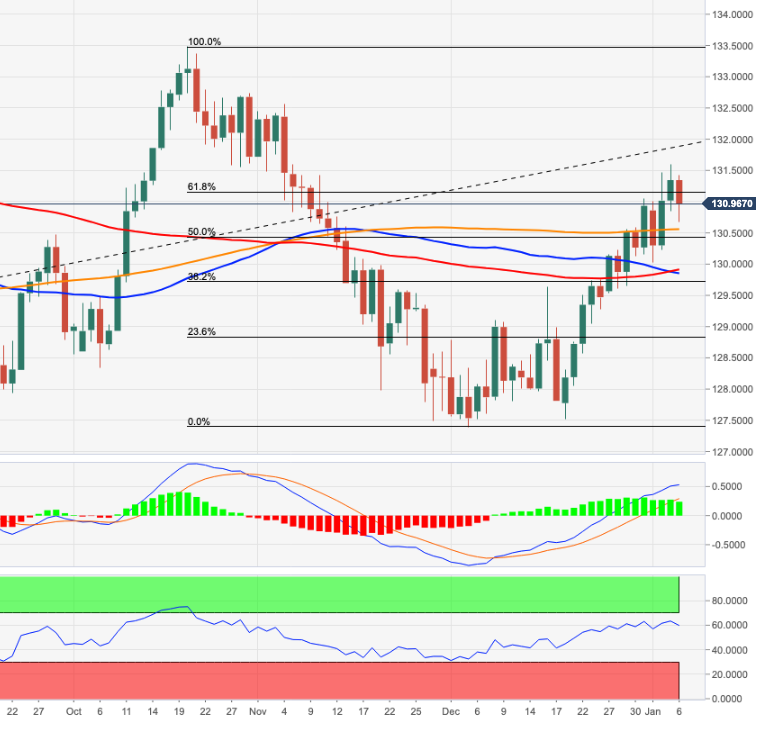 \
\
- GBP/USD attracted some dip-buying on Thursday and reversed an early slide to sub-1.3500 levels.
- The set-up favours bullish traders and supports prospects for an extension of the recent move up.
- Acceptance above 100-day SMA and the 1.3600 mark will reaffirm the near-term positive outlook.
The GBP/USD pair showed some resilience below the key 1.3500 psychological mark and has now recovered a major part of its intraday losses. The pair was last seen trading just a few pips below the daily high, around the 1.3540-30 region heading into the North American session.
From a technical perspective, the emergence of dip-buying near support marked by the 50% Fibonacci retracement level of the 1.3834-1.3161 downfall favours bullish traders. That said, the GBP/USD pair's inability to find acceptance above the 100-day SMA and the overnight rejection near the 1.3600 mark warrants some caution.
Meanwhile, oscillators on the daily chart are holding comfortably in the bullish territory and are still far from being in the overbought zone. This further validates the near-term constructive set-up, though it will be prudent to wait for a sustained strength beyond the 1.3600 mark before positioning for any further gains.
The GBP/USD pair might then aim to accelerate the momentum towards challenging a downward-sloping trend-line resistance, currently around the 1.3680 region. The mentioned hurdle extends from the July 2021 swing high, which if cleared decisively will set the stage for an extension of the recent strong move up from the vicinity of mid-1.3100s.
On the flip side, the 50% Fibo. level, around the 1.3500-1.3490 region, now seems to protect the immediate downside. This is followed by support near the 1.3460-55 region. Any subsequent decline might still be seen as a buying opportunity near the 1.3430-25 area (38.2% Fibo.), which should help limit the downside near the 1.3400 mark.
Failure to defend the mentioned support levels would negate the positive outlook and shift the bias in favour of bearish traders. The GBP/USD pair might then turn vulnerable to accelerate the downfall towards testing the 23.6% Fibo. support, around the 1.3320-15 region.
GBP/USD daily chart
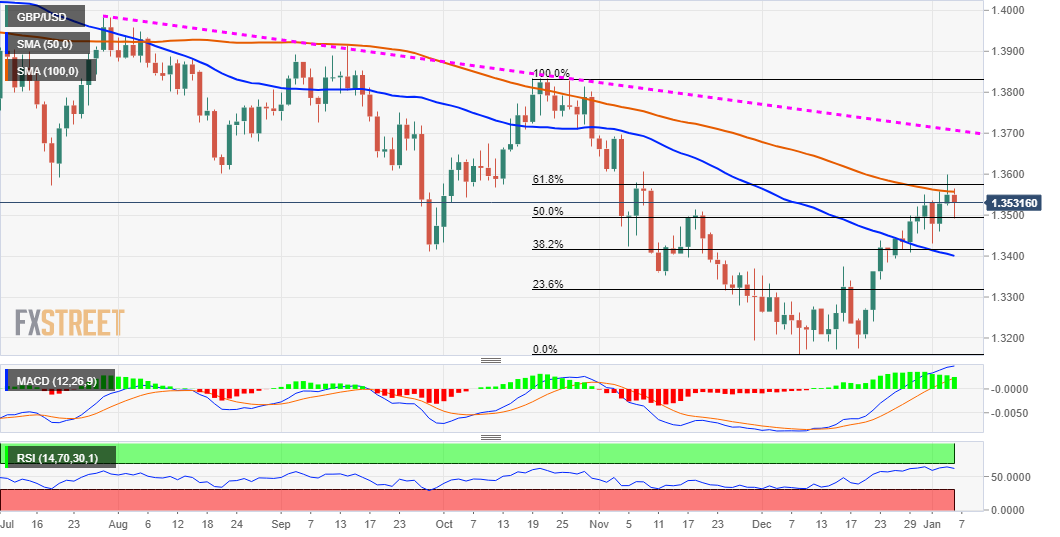
Technical levels to watch
Economist at UOB Group Barnabas Gan reviews the latest PMI data in Singapore.
Key Takeaways
“Singapore’s manufacturing Purchasing Managers’ Index (PMI) reported by SIPMM rose marginally by 0.1 point to 50.7 in Dec 2021. This marks the 18th straight month where PMI is above the expansionary 50.0 mark. Likewise, the electronic PMI registered a gain of 0.2 point to post a faster rate of expansion at 51.0.”
“The advance in Dec’s PMI reading was in line with the general improvement in Singapore’s economic conditions. Specifically, faster expansion rates were observed in new orders, new exports, factory output, inventory and employment.”
“Our view that Singapore’s manufacturing sector is one of the key economic support pillars remains unchanged. For 2022, we expect full-year manufacturing to grow by an average of 4.0%, underpinned by the buoyant global trade activity expected for the year ahead.”
Japanese Prime Minister Fumio Kishida announced on Thursday that they will decide on a quasi-emergency declaration for parts of Japan on Friday, as reported by Reuters.
"Will use Friday's 'Two-Plus-Two Talks" to again ask the US military to take preventive steps on the coronavirus spread," Kishida added.
Market reaction
These comments don't seem to be having a noticeable impact on the JPY's performance against its rivals. As of writing, the USD/JPY pair was trading at 115.83, where it was down 0.25% on a daily basis.
- GBP/JPY witnessed aggressive selling on Thursday and moved further away from a multi-month high.
- The risk-off impulse benefitted the safe-haven JPY and was seen as a key factor exerting pressure.
- A stronger USD weighed on the British pound and further contributed to the intraday selling bias.
The GBP/JPY cross maintained its heavily offered tone through the first half of the European session, albeit has recovered a few pips from the daily low and was last seen trading around the 156.60-65 area.
The cross extended the previous day's retracement slide from the 157.75 area, or the highest level since October 26 and witnessed aggressive selling on Thursday amid the risk-off impulse. Investors turned risk-averse on Wednesday in reaction to surprisingly hawkish FOMC meeting minutes. This, along with worries about the rapid spread of the Omicron variant weighed on investors' sentiment, benefitted the safe-haven Japanese yen and exerted pressure on the GBP/JPY cross.
Meanwhile, a big shift in the Fed's policy outlook continued acting as a tailwind for the US dollar and weighed on the British pound. This was seen as another factor that prompted some long-unwinding around the GBP/JPY cross amid the continuous rise in new COVID-19 cases in the United Kingdom. That said, hopes that the Omicron outbreak won't derail the UK economy and rising bets for a further policy tightening by the Bank of England helped limit deeper losses for the sterling.
On the economic data front, the UK Services PMI was finalized at 53.6 in December as against 53.2 estimated. The combination of factors held back traders from positioning from any further downfall and assisted the GBP/JPY cross to find decent support ahead of the 156.00 mark. It, however, remains to be seen if bulls are able to regain control or refrain from placing fresh bets as the focus shifts back to developments surrounding the coronavirus saga.
Technical levels to watch
- Gold price keeps falling as the DXY rises with yields amid hawkish Fed.
- Focus shifts to the US ISM Services PMI and Friday’s NFP release.
- A break below 100-DMA will drive gold towards $1,785 levels.
Gold price is losing another $20 in Thursday’s trading so far, heavily sold-off into the rally in the US Treasury yields across the curve. The benchmark 10-year yields sit above the key 1.70% mark
The FOMC minutes on Wednesday delivered a hawkish surprise after it showed that the Fed policymakers discussed the beginning of a reduction in the overall asset holdings this year. The Fed minutes also revealed that the officials are prepared for earlier and faster rate hikes to combat elevated inflation.
The hawkish Fed outlook boosted the yields, in turn, lifting the demand for the US dollar across the board. The greenback also remains underpinned by the risk-off market profile, as investors fret about aggressive Fed’s tightening expectations and the coronavirus contagion.
It’s a win-win situation for the US dollar, which is likely to weigh on the USD-sensitive gold price. Bears could likely retain control ahead of the critical US economic releases, with the ISM Services PMI due for release on Thursday while Friday sees the Nonfarm Payroll report. Also, of note remains the speech from the St. Louis Fed President James Bullard for fresh cues on the central bank’s policy normalization plans.
Gold Price Chart - Technical outlook
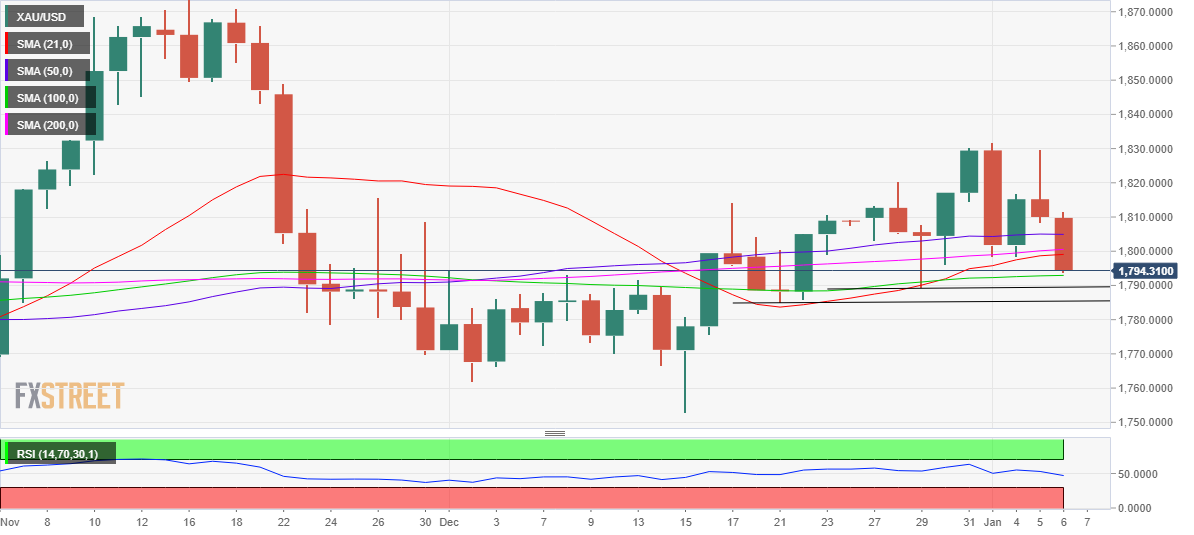
Gold: Daily chart
Gold’s daily chart shows that the latest leg down has taken out all the major Daily Moving Averages (DMA) support levels, as bears now attack the 100-DMA at $1,793.
A sharp sell-off is expected on a firm break below the latter, opening floors for a test of the December 29 low of $1,789.
The next downside target is seen at the December 21 low of $1,785. That will emerge as a powerful support for gold bulls.
The 14-day Relative Strength Index (RSI) has pierced the midline for the downside, pointing to more losses going forward.
Meanwhile, any recovery attempts will face a strong supply at $1,800, where the 21 and 200-DMAs converge.
Further up, bulls will retest the 50-DMA support-turned-resistance at $1,805. Daily highs of $1,812 will guard the additional upside.
Gold: Additional technical levels to consider
Businesses in the UK see year-ahead output price inflation at 4.5% in the three months to December, up from 4.2% in November, the Bank of England's (BOE) Decision Maker Panel (DMP) survey revealed on Thursday.
Key takeaways
"Annual output price inflation continued to increase in the DMP, reaching 5% on average in the three months to December, up by 0.1 percentage point on November."
"Overall uncertainty remained stable in December, with the percentage of businesses that viewed the overall level of uncertainty facing their business as high or very high unchanged at 48%."
"However, Covid-related uncertainty increased in December, with 21% of firms reporting it as their top source of uncertainty, up from 12% in November."
Market reaction
The market reaction to this report was largely muted and the GBP/USD pair was last seen trading in the negative territory near 1.3520.
- UK Final Services PMI upwardly revised to 53.6 in December.
- GBP/USD holds a rebound above 1.3500 on the upbeat UK data.
- Eyes on US Jobless Claims, ISM Services PMI ahead of Friday’s NFP.
The UK services sector activity expanded more than expected in December, the final report from IHS Markit confirmed this Thursday.
The seasonally adjusted IHS Markit/CIPS UK Services Purchasing Managers’ Index (PMI) was revised higher to 53.6 in December versus 53.2 expected and a 53.2 – last month’s flash reading.
Key points
Worst month for service economy since February 2021.
Export sales hard-hit by renewed pandemic restrictions.
Service providers remain upbeat about year ahead prospects.
Tim Moore, Economics Director at IHS Markit, which compiles the survey
“December data revealed a severe loss of momentum for the UK economy as many customer-facing businesses experienced a drop in demand due to escalating COVID-19 cases.”
“Total new orders in the service sector increased at the weakest pace for 10 months. Mass cancellations of bookings in response to the Omicron variant led to a slump in consumer spending on travel, leisure and entertainment. Survey respondents also noted that renewed pandemic restrictions had slowed the recovery in business services.”
FX implications
GBP/USD is holding onto its rebound above 1.3500 on the above-forecast UK data. The spot is trading at 1.3512, down 0.30% on the day.
- A combination of factors prompted aggressive selling around AUD/USD on Thursday.
- The Fed’s hawkish outlook, rising US bond yields continued underpinning the USD.
- The risk-off impulse further drove flows away from the perceived riskier aussie.
The AUD/USD pair remained under heavy selling pressure through the first half of the European session and slipped below mid-0.7100s, or over a two-week low in the last hour.
The pair witnessed aggressive selling on Thursday and extended the previous day's turnaround from the vicinity of the 100-day SMA resistance, near the 0.7275-80 region. The US dollar continued drawing some support from surprisingly hawkish FOMC meeting minutes released on Wednesday. This, along with the cautious market mood drove flows way from the perceived riskier aussie.
The December 14-15 FOMC monetary policy meeting minutes indicated that the US central bank could hike interest rates earlier than anticipated previously to combat high inflation. The markets were quick to react and started pricing in the prospects for an eventual liftoff in March. This, in turn, continued pushing the US Treasury bond yields higher and underpinned the greenback.
In fact, the US 2-year notes, which are sensitive to rate hike expectations along with 5-year notes, jumped to a near two-year high. Moreover, the yield on the benchmark 10-year US government bond shot to the highest level since October. This, along with worries about the spread of the Omicron variant, weighed on investors' sentiment and further benefitted the safe-haven USD.
The combination of factors dragged the AUD/USD pair below the previous weekly swing low, around 0.7180 region, which coincided with a one-month-old ascending trend-line. Hence, the downfall could also be attributed to some technical selling. Moreover, the trend-line breakdown might have already set the stage for a further intraday depreciating move towards the 0.7100 round figure.
Market players now look forward to the US economic docket, highlighting the releases of the usual Weekly Initial Jobless Claims and ISM Services PMI later during the early North American session. Apart from this, the US bond yields and the broader market risk sentiment should influence the USD price dynamics, which, in turn, would provide some impetus to the AUD/USD pair.
Technical levels to watch
- USD/CAD rises to the highest levels in six days above 1.2800.
- The US dollar’s strength remains unabated amid hawkish Fed outlook.
- The pair charted a falling wedge on the daily sticks, more room to rise.
USD/CAD is building onto Wednesday’s rebound, accelerating the advances above 1.2800 ahead of the US economic releases, including the key ISM Services PMI.
The main catalysts behind the pair’s bullish momentum are the extended rebound in the US dollar and weaker WTI prices.
The greenback capitalizes on firmer Treasury yields after the FOMC minutes suggested earlier and faster Fed rate hikes and also hinted at kickstarting balance sheet reduction this year.
Meanwhile. WTI keeps its corrective downside intact below $78 amid broad risk aversion, triggered by surging coronavirus cases globally and concerns over a potential Fed’s aggressive tightening.
Looking at the daily chart, USD/CAD has confirmed a falling wedge breakout on Wednesday after closing the day above the falling trendline resistance at 1.2743. The extension of the bullish breakout saw the pair recapturing the critical 21-Daily Moving Average (DMA) at 1.2798.
Buyers eye a daily closing above the latter to take on the recent range highs at around 1.2850. Further up, all eyes will remain on the 1.2900 level. The 14-day Relative Strength Index (RSI) looks north just above the midline, backing the bullish view.
USD/CAD: Daily chart
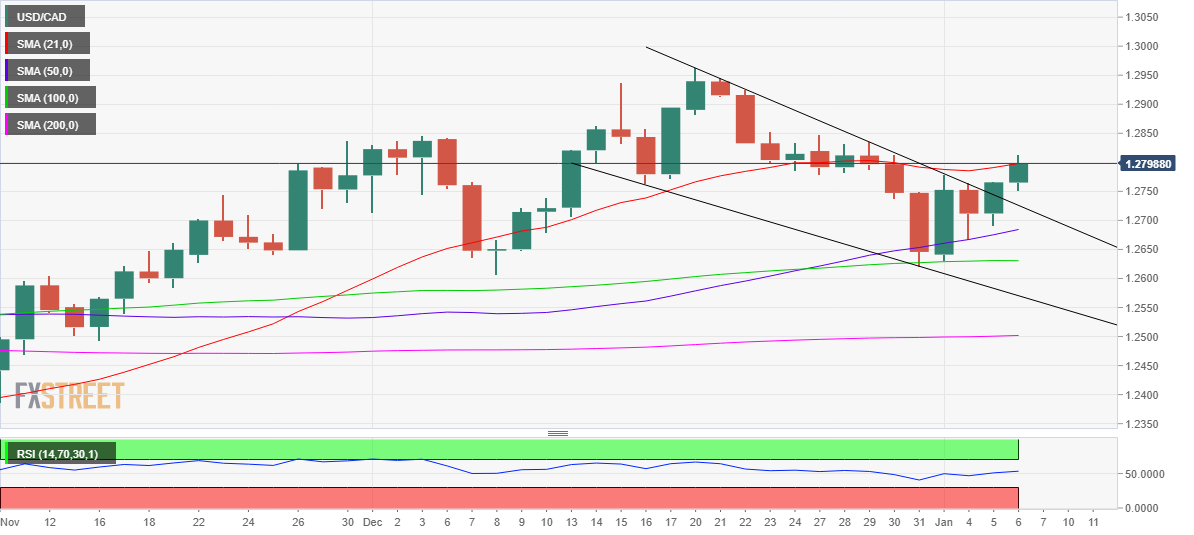
On the flip side, the spot could retrace to test the wedge resistance-turned-support at 1.2723, below which a sharp drop towards the bullish 50-DMA at 1.2684 cannot be ruled out.
If the downside momentum accelerates, sellers could aim for the horizontal 100-DMA at 1.2630.
USD/CAD: Additional levels to consider
- USD/CHF gained strong positive traction on Thursday amid broad-based USD strength.
- The Fed's hawkish outlook pushed the US bond yields higher and underpinned the USD.
- The risk-off impulse extended some support to the safe-haven CHF and capped gains.
The USD/CHF pair climbed to the top end of its weekly trading range during the early European session, though continued with its struggle to break through the 0.9200 mark.
Following the previous day's good two-way price moves, the USD/CHF pair caught some fresh bids on Thursday and seems all set to build on this week's solid bounce from the 0.9100 mark. The US dollar drew support from surprisingly hawkish FOMC meeting minutes, which, in turn, was seen as a key factor that provided a goodish lift to the USD/CHF pair.
The December 14-15 FOMC monetary policy meeting minutes indicated that the US central bank could hike interest rates sooner-than-expected to combat high inflation. The markets were quick to react and are now pricing in an 80% chance of an eventual liftoff in March. This, in turn, continued pushing the US Treasury bond yields higher and underpinned the buck.
In fact, the US 2-year notes, which are sensitive to rate hike expectations along with 5-year notes, jumped to a near two-year high. Moreover, the yield on the benchmark 10-year US government bond shot to the highest level since October. This, to a larger extent, helped offset the risk-off impulse, which tends to benefit the safe-haven Swiss franc.
An extended selloff in the US bond markets, along with worries about the rapid spread of the Omicron variant took its toll on the global risk sentiment. This was evident from the prevalent cautious mood around the equity markets. This, however, did little to hinder the intraday move up, albeit seemed to be the only factor that capped gains for the USD/CHF pair.
Meanwhile, the fundamental backdrop favour bullish traders and support prospects for additional gains. That said, it will still be prudent to wait for a sustained strength beyond the 0.9200 mark before positioning for a further appreciating move. The USD/CHF pair might then accelerate the momentum towards the next relevant hurdle near mid-0.9100s.
Market participants now look forward to the US economic docket, highlighting the releases of the usual Weekly Initial Jobless Claims and ISM Services PMI. This, along with the US bond yields, should influence the USD price dynamics. Apart from this, the broader market risk sentiment might produce some trading opportunities around the USD/CHF pair.
Technical level to watch
UOB Group’s Senior Economist Julia Goh and Economist Loke Siew Ting comment on the release of the CPI results in the Philippines.
Key Quotes
“Headline inflation eased back to the BSP’s 2.0%-4.0% target range at 3.6% y/y in the final month of 2021 (from 4.2% in Nov 2021), marking the lowest reading since Dec 2020. It also came in better than our estimate (4.0%) and Bloomberg consensus (4.1%).”
“We expect inflation to continue its downtrend in 2022 but probably still above the mid-point of the BSP’s 2.0%-4.0% target range for the greater part of the year, due to global supply bottlenecks, volatile commodity prices, currency weakness, adverse weather, petitions for transport fare hikes, and expiry of tariffs on pork imports. We reiterate our 3.5% inflation projection for 2022 (2021: 4.5%).”
“The better-than-expected inflation outturn in Dec 2021 would allow the BSP to continuously hold policy rates unchanged through 1H22 in order to uphold the nation’s fragile economic recovery.”
- EUR/USD fades part of Wednesday’s advance and challenges 1.1300.
- The dollar regains ground sustained on higher US yields.
- German advanced inflation figures next of relevance in the docket.
The selling bias has returned to the single currency and now encourages EUR/USD to re-test the 1.1300 neighbourhood on Thursday.
EUR/USD looks to German data, US yields
EUR/USD appears side-lined in the lower end of the weekly range and near the key support at 1.1300 the figure in the second half of the week, always at the mercy of dollar dynamics and the broad risk appetite trends.
The pessimism around the pair re-emerged on Thursday amidst renewed buying pressure in the dollar, which was particularly exacerbated after the FOMC Minutes (Wednesday) showed a hawkish tilt, opening the door to a potential start of the Fed’s normalization sooner than anticipated.
In the meantime, there is so far no meaningful reaction in the FX space to the relentless advance of the pandemic, with the main focus on the highly contagious omicron variant, as governments have ruled out imposing restrictions on the economic activity for the time being.
Back to the euro docket, the salient event will be the release of preliminary inflation figures in Germany for the month of December seconded by Producer Prices in the broader Euroland. Earlier, and still in Germany, Factory Orders expanded at a monthly 3.7% in November. Across the pond, Initial Claims, Factory Orders, Trade Balance and the ISM Non-Manufacturing are all due later in the NA session.
What to look for around EUR
EUR/USD met quite decent contention in the 1.1270 zone so far in the first week of the new year. In the meantime, price action around spot continues to track the performance of the greenback as well as the policy divergence between the ECB vs. the Federal Reserve and the response to the persistent elevated inflation on both sides of the Atlantic. On another front, the unabated progress of the coronavirus pandemic remains as the exclusive factor to look at when it comes to the economic growth prospects and investors’ morale.
Key events in the euro area this week: Germany Advanced December Inflation Rate (Thursday) - EMU Advanced December Inflation Rate (Friday).
Eminent issues on the back boiler: Asymmetric economic recovery post-pandemic in the euro area. ECB stance/potential reaction to the persistent elevated inflation in the region. ECB tapering speculation/rate path. Presidential elections in France.
EUR/USD levels to watch
So far, spot is losing 0.03% at 1.1307 and faces the next up barrier at 1.1386 (monthly high November 30) followed by 1.1464 (weekly high Nov.15) and finally 1.1520 (200-week SMA). On the other hand, a break below 1.1272 (weekly low Jan.4) would target 1.1221 (weekly low Dec.15) en route to 1.1186 (2021 low Nov.24).
- The risk-off impulse benefitted the safe-haven JPY and prompted fresh selling around USD/JPY.
- Rising US bond yields continued underpinning the USD and should help limit any deeper losses.
- Investors now look forward to the US economic data for some short-term trading opportunities.
The USD/JPY pair remained on the defensive through the early European session and was last seen hovering near the daily low, just below the 116.00 round-figure mark.
The pair struggled to capitalize on the previous day's hawkish FOMC minutes-inspired late rebound from the 115.60 region and came under some renewed selling pressure on Thursday. The risk-off impulse – as depicted by a generally weaker tone around the equity markets – benefitted the safe-haven Japanese yen and exerted some pressure on the USD/JPY pair. The downside, however, remains cushioned amid a goodish pickup in the US dollar demand.
The December 14-15 FOMC monetary policy meeting minutes indicated that the US central bank could hike interest rates sooner-than-expected to combat high inflation. In fact, the money markets are pricing in an 80% chance of an eventual liftoff in March, when the Fed is expected to end its monthly asset purchases. This, in turn, pushed the US Treasury bond yields higher, which underpinned the buck and extended some support to the USD/JPY pair.
In fact, the US 2-year notes, which are highly sensitive to rate hike expectations along with 5-year notes, soared to a near two-year high. Moreover, the yield on the benchmark 10-year US government bond shot to the highest level since October. Conversely, the 10-year JGB yield remained near zero due to the Bank of Japan's yield curve control policy. The widening of the US-Japanese yield differential further helped limit the downside for the USD/JPY pair.
The fundamental backdrops favour bullish traders and support prospects for the emergence of some dip-buying at lower levels. Hence, it will be prudent to wait for a strong follow-through selling before confirming that the USD/JPY pair's recent bullish run to a five-year high has lost steam and positioning for any meaningful corrective slide.
Market participants now look forward to the US economic docket, highlighting the releases of the usual Weekly Initial Jobless Claims and ISM Services PMI later during the early North American session. This, along with the US bond yields, should influence the USD price dynamics and provide a fresh impetus to the USD/JPY pair. Traders will further take cues from the broader market risk sentiment to grab some short-term opportunities.
Technical levels to watch
Further range bound trading is forecast in USD/CNH in the next weeks, suggested FX Strategists at UOB Group.
Key Quotes
24-hour view: “Yesterday, we expected USD to ‘trade sideways within a range of 6.3680/6.3830’. USD subsequently traded in a quiet manner between 6.3661 and 6.3768 before closing unchanged at 6.3755. The quiet price actions offer no fresh clues and further sideway-trading would not be surprising. Expected range for today, 6.3670/6.3830.”
Next 1-3 weeks: “Our view from Tuesday (04 Jan, spot at 6.3735) still stands. As highlighted, the outlook for USD is mixed and it could trade between 6.3400 and 6.3900 for now.”
- DXY leaves behind Wednesday’s pullback and trades near 96.40.
- US yields rose further following the release of FOMC Minutes.
- Initial Claims, ISM Non-Manufacturing, Balance of Trade next on tap.
The greenback, when gauged by the US Dollar Index (DXY), resumes the upside and regains the 96.40 region on Thursday.
US Dollar Index boosted by yields, looks to data
The index reverses the retracement seen in the previous session and regains some buying interest around 96.40 in the second half of the week, as market participants continue to digest the hawkish tilt of the FOMC Minutes published late on Wednesday.
Indeed, the Minutes of the December meeting suggested that March remains a live event, sparking speculation of three or four interest rate hikes amidst a persistent improvement in the US labour market and elevated inflation. Indeed, and according to CME FedWatch Tool, there is almost a 70% probability of an interest rate hike at the 16 March meeting.
Following the release of the Minutes, US yields edged (much) higher across the curve and prompted the buck to trim part of Wednesday’s losses and return to the positive territory so far on Thursday.
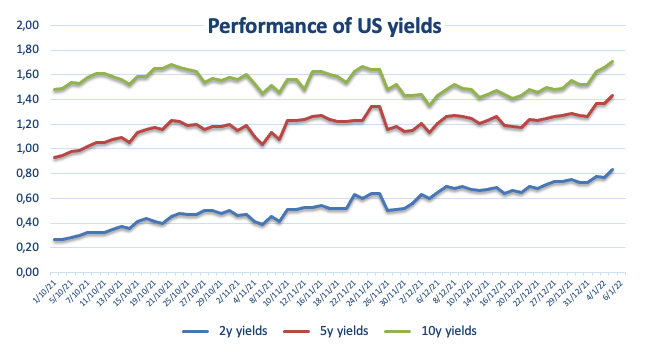
Interesting day in the US docket, where the ISM Non-Manufacturing will take centre stage seconded by usual weekly Claims, final Balance of Trade figures and Factory Orders for the month of November.
What to look for around USD
The index trades with certain conviction above the 96.00 hurdle sustained by the strong move higher in US yields, particularly following the hawkish message from the FOMC release (Wednesday). As markets slowly return to normality, the dollar’s constructive outlook is forecast to remain bolstered by the Fed’s intentions to hike the Fed Funds rates later in the year amidst persevering elevated inflation, supportive Fedspeak, higher yields and the solid performance of the US economy.
Key events in the US this week: Initial Claims, ISM Non-Manufacturing, Factory Orders, Trade Balance (Thursday) - Nonfarm Payrolls, Unemployment Rate (Friday).
Eminent issues on the back boiler: Start of the Fed’s tightening cycle. US-China trade conflict under the Biden’s administration. Debt ceiling issue. Potential geopolitical effervescence vs. Russia and China.
US Dollar Index relevant levels
Now, the index is advancing 0.19% at 96.36 and a break above 96.46 (weekly top Jan.4) would open the door to 96.90 (weekly high Dec.15) and finally 96.93 (2021 high Nov.24). On the flip side, the next down barrier emerges at 95.57 (monthly low Dec.31) followed by 95.51 (weekly low Nov.30) and then 94.96 (weekly low Nov.15).
- NZD/USD witnessed heavy selling on Thursday and dropped to over a two-week low.
- The USD remained supported by Wednesday’s more hawkish FOMC meeting minutes.
- The risk-off impulse further underpinned the safe-haven USD and weighed on the pair.
The NZD/USD pair continued losing ground through the early European session and dropped to over a two-week low, below mid-0.6700s in the last hour.
The pair extended the previous day's retracement slide from the 0.6835-40 region and witnessed heavy selling during the first half of the trading on Thursday. The US dollar was back in demand following the release of surprisingly hawkish FOMC meeting minutes on Wednesday. Apart from this, the risk-off impulse further benefitted the safe-haven greenback and drove flows away from the perceived riskier kiwi.
The December 14-15 FOMC monetary policy meeting minutes pointed to a faster-than-expected rise in interest rates. Moreover, some Fed officials also thought that it would be appropriate to initiate balance sheet runoff at some point after the first increase. This underscored a big shift in the policymakers' tone, which, in turn, was seen as a key factor that continued acting as a tailwind for the USD.
Meanwhile, the market was quick to price in a roughly 80% chance of a 25 bps Fed hike by March 2022. This was evident from an extended selloff in the US bond markets, pushing yields on the long-end US government bonds – 10 and 30-years – to their highest level since October. Apart from this, worries about the rapid spread of the Omicron variant took triggered a fresh wave of the global risk-aversion trade.
The combination of factors exerted heavy pressure on the NZD/USD pair, taking along some short-term trading stops placed near the 0.6800 round figure. Hence, a subsequent slide towards challenging 2021 low, around the 0.6700 mark touched on December 15, now looks a distinct possibility. The negative outlook is reinforced by bearish technical indicators, which are still far from being in the oversold territory.
Market players now look forward to the US economic docket, highlighting the releases of the usual Weekly Initial Jobless Claims and ISM Services PMI. This, along with the US bond yields and the broader market risk sentiment, will influence the USD price dynamics and provide a fresh impetus to the NZD/USD pair. The key focus, however, will remain on Friday's release of the US monthly jobs report (NFP).
Technical levels to watch
- German Factory Orders rebounded 3.7% MoM in November.
- On a yearly basis, Germany’s Factory Orders jumped by 1.3% in November.
- EUR/USD tests low just below 1.1300 despite strong German Factory data.
The German Factory Orders rebounded more than expected in November, suggesting that the recovery in the manufacturing sector of Europe’s economic powerhouse seems to have regained traction.
Contracts for goods ‘Made in Germany’ jumped 3.7% on the month vs. 2.1% expected and -5.8% last, the latest data published by the Federal Statistics Office showed on Thursday.
On an annualized basis, Germany’s Industrial Orders rose by 1.3% in the reported month vs. 0.1% previous.
FX implications
The shared currency remains weighed by the resurgent US dollar demand, with EUR/USD testing lows near 1.1290, down 0.18% on the day. The main currency pair ignored the encouraging German factory data.
About German Factory Orders
The Factory orders released by the Deutsche Bundesbank is an indicator that includes shipments, inventories, and new and unfilled orders. An increase in the factory order total may indicate an expansion in the German economy and could be an inflationary factor. It is worth noting that the German Factory barely influences, either positively or negatively, the total Eurozone GDP. A high reading is positive (or bullish) for the EUR, while a low reading is negative.
UOB Group’s FX Strategists noted that USD/JPY is still expected to advance to the mid-116.00s in the next weeks amidst the current upbeat momentum.
Key Quotes
24-hour view: “We highlighted yesterday that ‘further USD strength is not ruled out but deeply overbought conditions suggest that 116.50 could be out of reach’. However, USD pulled back to 115.63 before rebounding to 116.24 during NY session. Despite the rebound, upward momentum has not improved by much. From here, USD could edge higher but any advance is unlikely to break 116.50 today. Support is at 115.90 followed by 115.65.”
Next 1-3 weeks: “There is not much to add to our update from yesterday (05 Jan, spot 116.15). As highlighted, the strong surge in USD earlier this week has boosted the upward momentum and USD could strengthen further. The next resistance is at 116.50 followed by 116.80. On the downside, a breach of 115.30 (no change in ‘strong support’ level from yesterday) would indicate that the current upward pressure has eased.”
- EUR/GBP retreats from intraday high during two-day rebound from 23-month low.
- 20-SMA adds strength to the short-term resistance, RSI rebound hints at further upside.
- February 2020 lows can lure bears, fortnight-old descending trend line adds to the upside filters.
EUR/GBP struggles to extend the previous day’s bounce off February 2020 levels while heading into Thursday’s European session. That said, the cross-currency pair steps back from short-term descending trend line to 0.8357, up 0.13% intraday, by the press time.
Although the 20-SMA joins a downward sloping resistance line from December 21 to restrict short-term EUR/GBP upside around 0.8360, RSI recovery from the oversold region hint at further advances.
Hence, a clear run-up beyond 0.8360 is eyed before challenging a two-week-long resistance line near the 0.8400 round figure.
It should be noted, however, that a clear upside break of 0.8400 enables EUR/GBP buyers to aim for the 100-SMA level surrounding 0.8445.
On the flip side, a two-day-old ascending support line at 0.8338 restricts immediate declines of the EUR/GBP pair ahead of directing it to the February 2020 low of 0.8282.
Overall, EUR/GBP bears keep the reins but a corrective pullback can’t be ruled out.
EUR/GBP: Four-hour chart
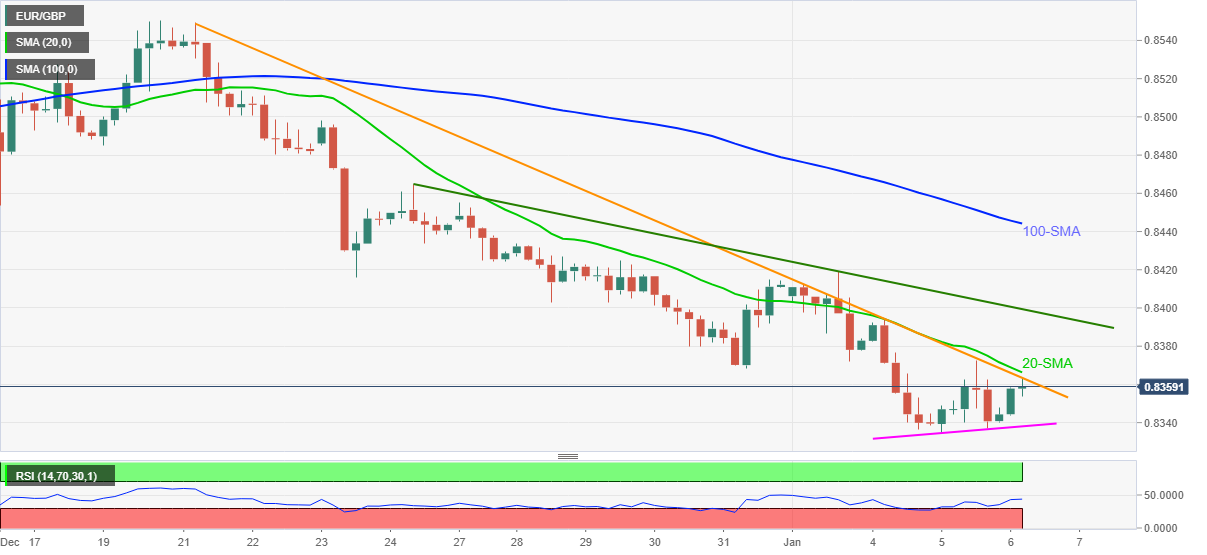
Trend: Further upside expected
In light of advanced figures from CME Group for natural gas futures markets, open interest increased for the third session in a row on Wednesday, this time by around 9.4K contracts. Volume, instead, resumed the downtrend and shrank by around 59.6K contracts.
Natural Gas still targets the $4.00 yardstick
Natural gas extended the rebound from December lows in the sub-$3.60 area on Wednesday. The daily uptick was accompanied by rising open interest, which is expected to support the continuation of the recovery with the immediate target at the key barrier at the $4.00 mark per MMBtu.
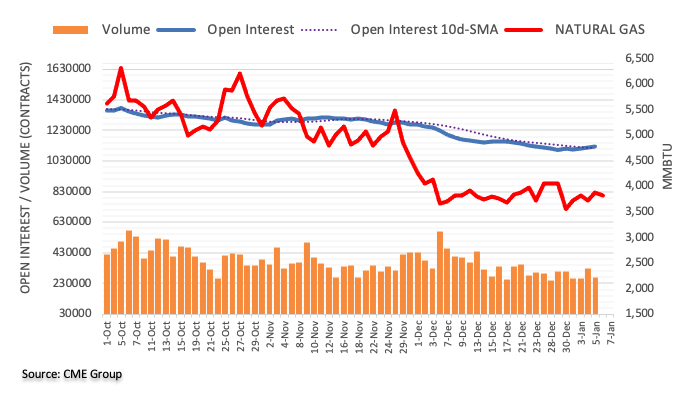
- Hawkish FOMC minutes-inspired USD strength pulled GBP/USD away from a near two-month high.
- The risk-off impulse further underpinned the safe-haven USD and also contributed to the selling bias.
- Investors now look forward to the final UK Services PMI and the US macro data for a fresh impetus.
The GBP/USD pair extended the previous day's retracement slide from the vicinity of the 1.3600 mark, or a near two-month high and edged lower through the first half of the trading on Thursday. The pair maintained its offered tone heading into the European session and was last seen flirting with the daily low, around the 1.3520-15 region.
The December 14-15 FOMC policy meeting minutes pointed to a faster-than-expected rise in interest rates. Moreover, almost all participants agreed that it would likely be appropriate to initiate balance sheet runoff at some point after the first increase. A big shift in policymakers' tone continued underpinning the US dollar, which, in turn, was seen as a key factor that prompted some follow-through selling around the GBP/USD pair.
Meanwhile, the market was quick to price in a roughly 80% chance of a 25 bps Fed hike by March 2022. This acted as a fresh catalyst for an extended selloff in the US bond markets, which along with worries about the rapid spread of the Omicron variant triggered a steep fall in the equity markets. The risk-off impulse further benefitted the greenback's relative safe-haven status and exerted additional pressure on the GBP/USD pair.
That said, hopes that the Omicron outbreak won't derail the UK economy and rising bets for a further policy tightening by the Bank of England could lend some support to the British pound. That said, the worsening COVID-19 situation in Britain could act as a headwind for the sterling. The mixed fundamental backdrop warrants some caution for aggressive traders and before positioning for any firm near-term direction for the GBP/USD pair.
Market participants now look forward to the release of the final UK Services PMI for some impetus. Later during the early North American session, traders will take cues from the US economic docket – highlighting the releases of the usual Weekly Initial Jobless Claims and ISM Services PMI. Apart from this, the US bond yields and the broader market risk sentiment, might influence the USD price dynamics and produce some trading opportunities around the GBP/USD pair.
Technical levels to watch
Here is what you need to know on Thursday, January 6:
The dollar suffered losses against its major rivals during the first half of the day on Wednesday but made a sharp U-turn in the late American session on surging US Treasury bond yields. The US Dollar Index continues to edge higher in the early European session on Thursday as investors assess the FOMC's December meeting minutes. Germany's Destatis will release the preliminary December inflation data. Later in the day, the weekly Initial Jobless Claims, November Goods Trade Balance and December ISM Services PMI will be featured in the US economic docket.
The minutes of the FOMC's December policy meeting revealed on Wednesday that policymakers expect the balance sheet normalization to start sooner after the first rate hike than last time. "Some participants also noted that it could be appropriate to begin to reduce the size of the Federal Reserve's balance sheet relatively soon after beginning to raise the federal funds rate," the publication read. With the initial market reaction, the benchmark 10-year US Treasury bond yield jumped to its strongest level since March before continuing to push higher toward 1.75% early Thursday.
The CME Group FedWatch Tool shows that markets are pricing a 68% probability of a 25 basis points rate hike in March. The hawkish policy outlook weighed heavily on US stock markets and the S&P 500 lost nearly 2% on Wednesday. Moreover, the S&P Futures were down 0.5% at the time of press, suggesting that stocks selloff could continue after the opening bell.
EUR/USD erased a large portion of its daily gains in the second half of the day on Wednesday and was last seen testing 1.1300. Eurostat will release the November Producer Price Index data but investors are likely to remain focused on US Treasury bond yields.
GBP/USD touched its highest level in nearly two months at 1.3600 late Wednesday but reversed its direction. As of writing, the pair was trading in the negative territory below 1.3550.
USD/JPY capitalized on rising yields and close above 116.00 on Wednesday. The risk-averse market environment is helping the JPY show some resilience against the dollar and the pair is posting small losses below 116.00 early Thursday.
Gold rose toward $1,830 ahead of the FOMC Minutes but ended up closing the day in the red at $1,809 pressured by surging US T-bond yields. XAU/USD remains on the back foot and continues to edge lower toward $1,800.
The bearish pressure surrounding Bitcoin has strengthened after the FOMC's publication and BTC was last seen trading at its weakest level in a month at $43,000. Ethereum continues to fall after losing more than 6% on Wednesday and trades below $3,500 for the first time since mid-October.
NZD/USD could have likely moved into a 0.6740-0.6845 consolidative range, suggested FX Strategists at UOB Group.
Key Quotes
24-hour view: “Yesterday we held the view that NZD is ‘unlikely to strengthen much further’ and we expected it to ‘trade sideways between 0.6785 and 0.6835’. NZD subsequently rose to 0.6836 before dropping quickly to 0.6791 during NY session. The decline has room to extend but in view of the lackluster momentum, a break of 0.6765 is unlikely (next support is at 0.6740). On the upside, a breach of 0.6825 (minor resistance is at 0.6810) would indicate that the current downward pressure has eased.”
Next 1-3 weeks: “We continue to hold the same view as Tuesday (04 Jan, spot at 0.6790). As highlighted, NZD has likely moved into a consolidation phase and could trade within a 0.6740/0.6845 range. Looking ahead, a clear break of 0.6845 would indicate that NZD is ready to head higher towards 0.6885.”
CME Group’s preliminary readings for crude oil futures markets noted traders added around 15.6K contracts to their open interest positions on Wednesday, recording the third consecutive daily gain. Volume followed suit and rose by the fourth straight session, this time by around 137.6K contracts.
WTI eyes a test of the $80.00 mark
Prices of the barrel of WTI charted an inconclusive session on Wednesday amidst increasing open interest and volume. That said, further range bound around current levels should not be ruled out in the very near term, always with the immediate target at the $80.00 mark per barrel.
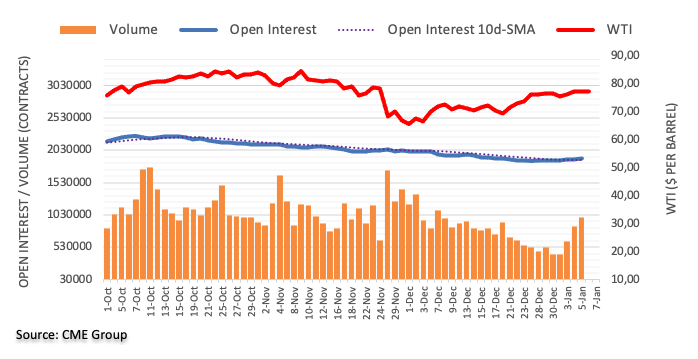
The options market turns most bullish on the USD/CHF in two months, per the latest data from Reuters.
One-month risk reversal (RR) of USD/CHF, a gauge of calls to puts, rises the most on weekly basis since early November. That said, the latest weekly index of the options market gauge is +0.175, per Reuters.
It’s worth noting that the daily RR figures, however, print the lowest count since December 27, around -0.013 by the press time.
While justifying the market’s bullish bias, the USD/CHF prices rise for the second consecutive day, up 0.06% intraday around 0.9185 heading into Thursday’s European session.
That said, the risk catalysts, mainly the Omicron woes and Fed-rate-hike chatters, direct short-term USD/CHF moves with eyes on Friday’s US Nonfarm Payrolls.
FX Strategists at UOB Group noted that further gains in GBP/USD are likely above the 1.3600 mark.
Key Quotes
24-hour view: “We highlighted yesterday that GBP ‘could edge above 1.3560 before the risk of a pullback would increase’. We added, ‘the next resistance at 1.3600 is unlikely to come under threat’. The subsequent GBP strength exceeded our expectations as GBP rose to within one pip of 1.3600 (high of 1.3599) before dropping sharply. The sharp drop coupled with overbought conditions indicate that GBP is likely to consolidate for today, expected to be within a range of 1.3525/1.3595.”
Next 1-3 weeks: “On Tuesday (04 Jan, spot at 1.3480), we highlighted that GBP is likely to trade between 1.3370 and 1.3560. Yesterday, we indicated that if GBP closes above the major resistance at 1.3560, it would suggests that GBP is likely to advance to 1.3600 and above. GBP subsequently rose to 1.3599 before pulling back to close at 1.3556. Upward momentum has improved, albeit not by much. From here, it appears that GBP has to break 1.3600 before further advance is likely. The chance for GBP to break 1.3600 is not high for now but would remain intact as long as GBP does not move below 1.3460 within these few days. Looking ahead, the next resistance above 1.3600 is at 1.3630.”
- AUD/USD drops to the lowest in two weeks on confirming a bearish chart pattern.
- RSI retreat, receding bullish bias of MACD also favor sellers.
- Key SMAs restrict immediate upside, 2021 bottom lures bears.
AUD/USD takes offers around 0.7170, down 0.70% intraday to flash a two-week low during early Thursday morning in Europe.
Following a clear downside break of 21-DMA, AUD/USD prices broke the support line of a monthly rising wedge bearish chart formation, which in turn underpin the latest losses of the quote. Also adding to the bearish bias are the downbeat RSI and MACD conditions.
That said, the late December’s swing low around 0.7080 may offer an intermediate halt during the quote’s theoretical target surrounding the 0.7000 threshold, comprising 2021 low.
In a case where the AUD/USD prices remain bearish past 0.7000, June 2020 low near 0.6775 will be in focus.
Alternatively, the support-turned-resistance line of the wedge and 21-DMA, respectively around 0.7185 and 0.7195, will restrict the quote’s corrective pullback.
It’s worth noting that a clear upside break of 0.7195 will propel the quote towards 50% Fibonacci retracement (Fibo.) of October-December downside, around 0.7275.
Though, the AUD/USD pair’s advances beyond 50% Fibo. will be challenged by the 100-DMA and resistance line of the stated wedge, close to 0.7290 and 0.7305 in that order.
AUD/USD; Daily chart
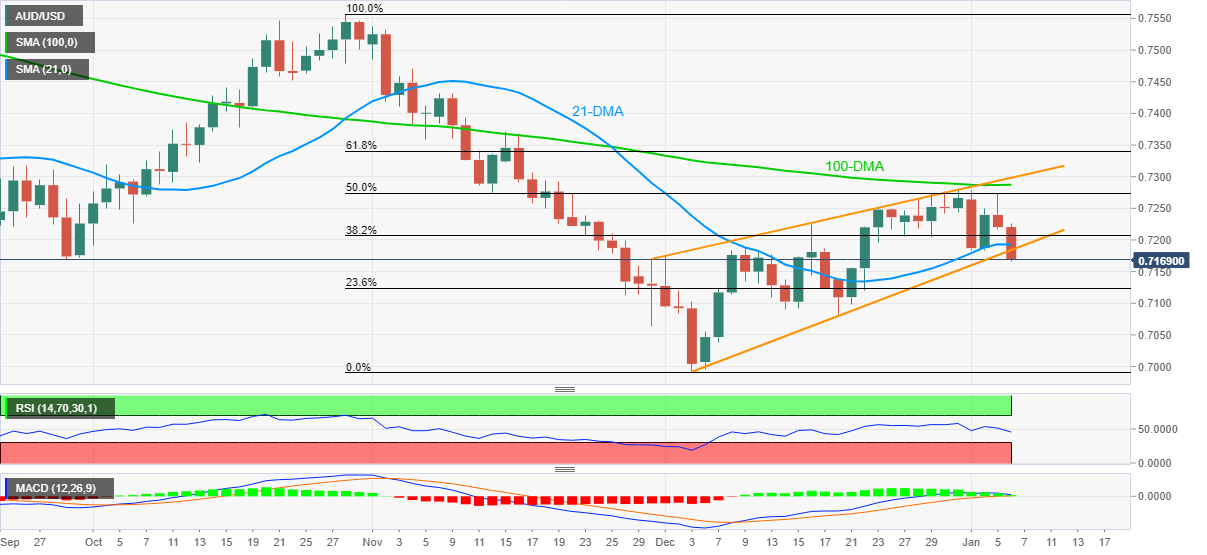
Trend: Further weakness expected
Open interest in gold futures markets went up by more than 10K contracts and reversed two consecutive daily pullbacks on Wednesday considering flash data from CME Group. In the same line, volume extended the uptrend for the third session in a row.
Gold remains focused on $1,800
Prices of gold dropped further and approached the key $1,800 region on Wednesday. The negative price action came on the back of rising open interest and volume, which is indicative that extra losses remain in the pipeline in the very near term. Against that, the key level at $1,800 still emerges as the big magnet for occasional bearish attempts.
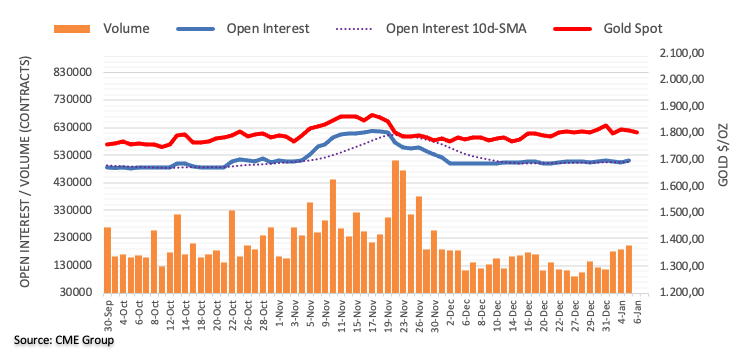
In opinion of FX Strategists at UOB Group, EUR/USD is still seen navigating within the 1.1240-1.1395 range in the next weeks.
Key Quotes
24-hour view: “We expected EUR to ‘edge lower within a range of 1.1265/1.1310’ yesterday, However, EUR rose to 1.1346 before dropping back down quickly. The outlook is mixed and EUR is likely to trade sideways between 1.1280 and 1.1340 for today.”
Next 1-3 weeks: “Our view from Tuesday (04 Jan, spot at 1.1305) still stands. As highlighted, while downward momentum has improved a tad, the outlook for EUR is unclear for now. From here, EUR could trade between 1.1240 and 1.1395.”
- USD/CAD eyes the first weekly gain in three during two-day uptrend.
- WTI extends pullback from six-week high , drops the most in a week.
- Virus woes escalate as faster doubling of cases strain medical system, new variant adds to the risk-off mood.
- Fed Minutes highlighted Friday’s NFP, Canada trade report, US ISM Services PMI will direct intraday moves.
USD/CAD bulls attack 21-DMA surrounding 1.2800 to refresh weekly top heading into Thursday’s European session.
In doing so, the Loonie pair takes clues from firmer US Treasury yields and downbeat prices of Canada’s main export item, WTI crude oil.
The US 10-year bond yields refresh a nine-month high with 2.3 basis points (bps) of gain to 1.73% during the five-day uptrend, which in turn weighed on the S&P 500 Futures to renew a two-week low around 4,675, down 0.40% at the latest. That said, WTI crude oil declined 0.15% to $76.66 after taking a U-turn from the highest levels since late November the previous day.
US Treasury yields jump the previous day amid hawkish bias of the Fed policymakers, suggesting a faster rate-hike and plans to discuss balance-sheet normalization, per the Federal Open Market Committee (FOMC) Meeting Minutes.
Recently fueling the US bond coupons are the coronavirus concerns suggesting a widespread increase in the daily infections and challenges to healthcare systems. Although Canada’s Quebec marked an early bird to announce lockdown to tame the virus infections, the cases are nowhere easing.
Read:
That said, the firmer yields and softer oil prices can keep fueling the USD/CAD prices toward the first weekly gains in three. However, today’s Canada International Merchandise Trade for November will precede the US ISM Services PMI to entertain short-term buyers ahead of Friday’s jobs report.
Technical analysis
Although a clear upside break of a 13-day-old descending trend line favors USD/CAD buyers, the 21-DMA level around 1.2800 guards the quote’s immediate upside towards the early December’s peak near 1.2850.
In addition to the previous resistance line near 1.2720, the 100-DMA level of 1.2630 also challenges USD/CAD bears.
- Gold prices in Euro refresh intraday low during two-day declines.
- ECB’s Kazaks, risk-off mood propel yields, European currency.
- German HICP, US PMIs and covid headlines can entertain traders ahead of Friday’s US NFP.
Gold (XAU/EUR) drops for the second consecutive day, down 0.22% intraday around €1,596 while heading into Thursday’s European session. The yellow metal bears the burden of firmer yields, at home and abroad, amid escalating chatters over monetary policy tightening and covid woes.
Although global markets cheered hawkish bias of the Fed policymakers, suggesting a faster rate-hike and plans to discuss balance-sheet normalization, comments from ECB’s Kazaks also threatened easy money policies in the bloc.
“In light of elevated inflation pressures and the strengthening labor market, participants judged that the increase in policy accommodation provided by the ongoing pace of net asset purchases was no longer necessary,” per the Federal Open Market Committee (FOMC) Meeting Minutes. On the other hand, Latvian central bank governor and ECB governing council member Martins Kazaks said on Wednesday that the ECB is ready to raise rates and cut stimulus if needed.
On a different page, record cases of covid and doubling of infections strain the medical systems, which in turn challenge the previous optimism backed by global studies suggesting Omicron be less severe. On the same line were the updates from France relating to a new and fast-spreading coronavirus strain, namely IHU.
Amid these plays, the US 10-year Treasury yields jumped to the highest level since April 2021 by the end of Wednesday’s North American session and drowned the Wall Street benchmark. Recently, the US 10-year bond yields refresh a nine-month high of around 1.71%, which in turn weighed on the S&P 500 Futures.
It should be noted that Germany’s 10-year bund yields refresh a two-month high while rising to -0.115% at the latest.
That said, Germany’s preliminary readings of Harmonized Index of Consumer Prices (HICP) for December, expected 5.7% YoY versus 6.0% prior, will offer immediate direction to the XAU/EUR prices. Should the inflation figures keep rising the ECB hawks may propel the quote. Following that, the monthly prints of the US Good Trade Balance and ISM Services PMI for December, as well as weekly US Jobless Claims, will entertain short-term market players. However, Friday’s US Nonfarm Payrolls (NFP) is the key.
Technical analysis
Gold prices remain pressured inside a three-week-old rising wedge bearish chart formation. Although descending RSI and bearish MACD signals keep sellers hopeful, the 100-SMA adds strength to the support line of wedge near €1,593.
Hence, a clear downside break of €1,593 becomes necessary for the XAU/EUR bears to aim for December’s low surrounding €1,555.
During the fall, €1,580 may act as an intermediate halt while July 2021 top surrounding €1,550 will add to the downside filters past €1,555.
Alternatively, 50% Fibonacci retracement (Fibo.) of November-December downside around €1,605 guards immediate recovery moves of the gold prices (in Euro).
Also acting as important resistance is the 61.8% Fibo. level and the upper line of the stated wedge, respectively near €1,616 and €1,618.
XAU/EUR: Four-hour chart
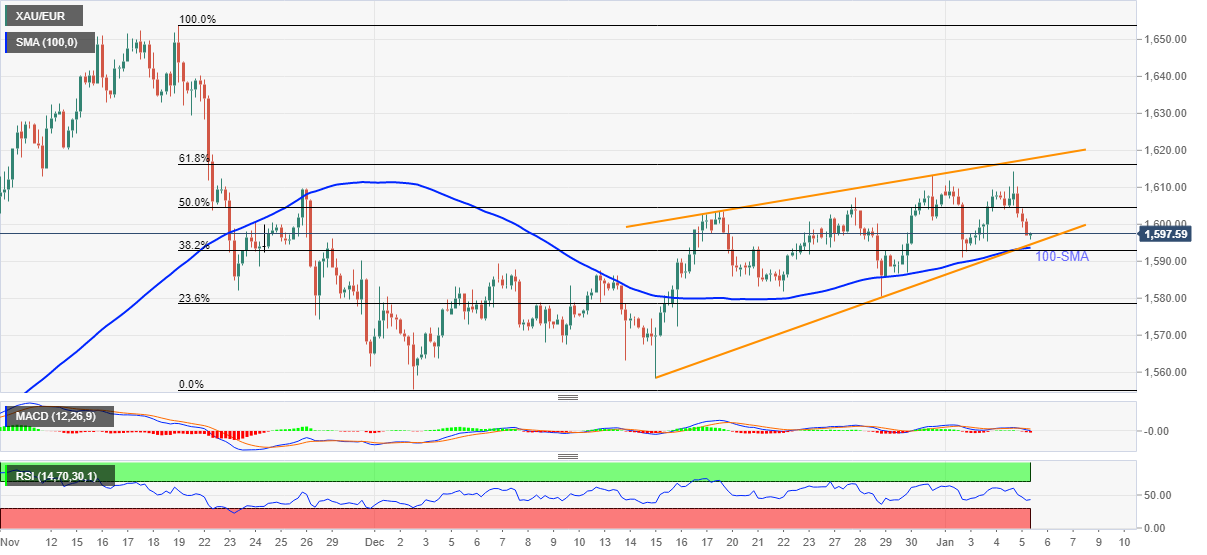
Trend: Further weakness expected
- USD/JPY remains on the back foot around intraday low.
- RSI pullback from overbought region adds to the bearish bias.
- November’s top lure short-term sellers, 11-week-old resistance line challenge buyers.
USD/JPY stays pressured around 115.85 while printing the biggest daily losses since mid-December during early Thursday.
The yen pair’s latest weakness could be linked to the earlier pullback from a multi-day-old resistance line as well as the RSI decline from the overbought region. As a result, further losses by the pair can’t be ruled out.
The same direct USD/JPY sellers towards November’s high near 115.50. However, any further downside will be challenged by an ascending support line from December 17 and 50-SMA, respectively around 115.40 and 115.25.
Meanwhile, the corrective pullback may initially aim for the 116.00 threshold before the 116.25 hurdle. In a case where USD/JPY bulls keep reins past 116.25, an upward sloping trend line from October 20, around 116.40, will be in focus.
Overall, USD/JPY prices are likely to witness further losses but a reversal of the current bullish trend is off the table, at least for now.
USD/JPY: Four-hour chart
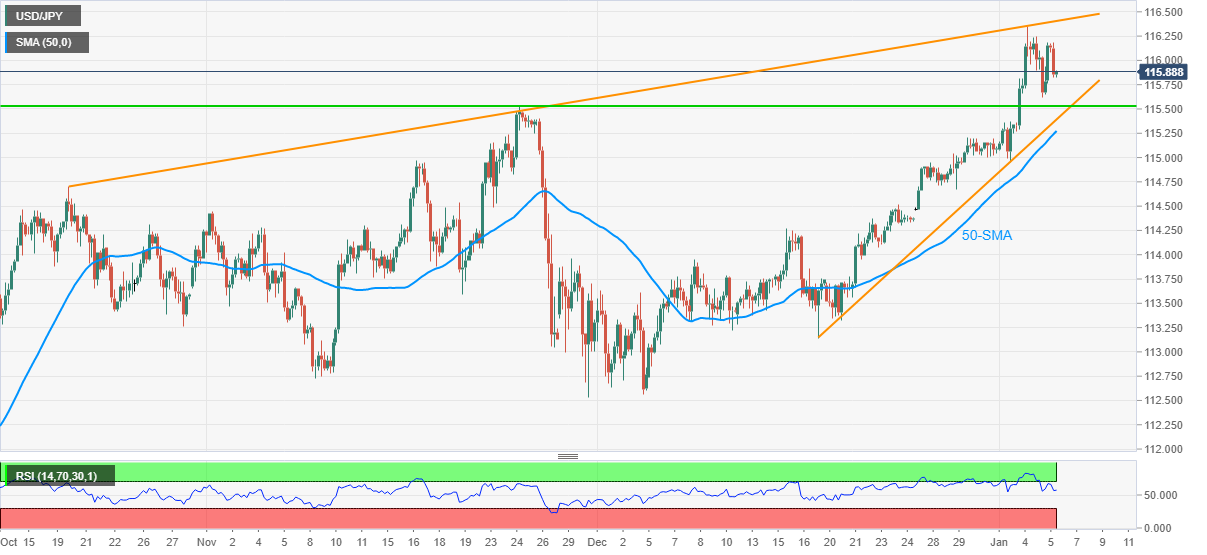
Trend: Further weakness expected
- EUR/USD keeps rebound from weekly low with a choppy range.
- US Treasury yields rise to April 2021 levels, German Bund coupons refresh two-month high.
- Covid woes escalate and so do Fed rate-hike expectations but ECB hawks join pre-data cautious to test pair traders.
EUR/USD treads water around 1.1315, irrespective of the broad risk-off mood during early Thursday.
The major currency pair rose the most in a week the previous day, despite posting losses post-Fed Minutes, amid hawkish comments from the ECB policymaker Kazaks. The recent indecision of the EUR/USD pair traders could be linked to the cautious sentiment ahead of the key data, as well as firmer yields in Germany and the US.
Latvian central bank governor and ECB governing council member Martins Kazaks said on Wednesday that the ECB is ready to raise rates and cut stimulus if needed.
On the other hand, the Federal Open Market Committee (FOMC) Meeting Minutes conveyed hawkish bias of the policymakers, suggesting a faster rate-hike and plans to discuss balance-sheet normalization. Following the Minutes, the US bond yields rally and the Fed interest rate futures point at the 80% chance of a hike in March 2022.
Given the strong US ADP Employment Change for December, 804K versus 400K expected, statements from the Fed Minutes like, “conditions for a rate hike could be met relatively soon if the recent pace of labor market improvements continues” also propelled the US bond coupons.
It should be observed that the recent doubling of the covid infections and economic concerns surrounding China also add to the risk-off mood, which in turn propel US Treasury yields and test the EUR/USD buyers.
Amid these plays, the US 10-year Treasury yields jumped to the highest level since April 2021 by the end of Wednesday’s North American session and drowned the Wall Street benchmark. Recently, the US 10-year bond yields refresh a nine-month high of around 1.71%, which in turn weighed on the S&P 500 Futures.
Moving on, Germany’s preliminary readings of Harmonized Index of Consumer Prices (HICP) for December, expected 5.7% YoY versus 6.0% prior, will offer immediate direction to the EUR/USD prices. Should the inflation figures keep rising the ECB hawks may propel the quote.
Following that, the monthly prints of the US Good Trade Balance and ISM Services PMI for December, as well as weekly US Jobless Claims, will entertain short-term market players. However, Friday’s US Nonfarm Payrolls (NFP) is the key.
Read: US December Nonfarm Payrolls Preview: Analyzing gold's reaction to NFP surprises
Technical analysis
As the MACD line teases a bear-cross to the signal line, coupled with the steady RSI, EUR/USD is likely to remain pressured. However, a clear downside break of the 21-DMA level of 1.1300 becomes necessary for the bears to aim for an ascending support line stretched from mid-December 2021, around 1.1280 by the press time.
Alternatively, sustained trading beyond the 1.1300 threshold will direct the EUR/USD prices towards the 50-DMA level surrounding 1.1360.
- Markets in Asia-Pacific see the red as virus woes extend post-FOMC Minutes losses.
- China Caixin PMI came in stronger, Aussie activity data matched forecasts.
- US T-bond yields refresh multi-day high, stock futures drop to two-week low.
- US ISM Services PMI awaited ahead of Friday’s NFP.
Asian equities track Wall Street losses as Fed-linked fears join worsening global covid conditions. That said, MSCI’s index of Asia ex-Japan shares drop 0.70% while Japan’s Nikkei 225 drops 2.6% during early Thursday.
Shares in Australia led the losers amid outcry over the Aussie policymakers’ rejection of a renowned tennis player’s visas over vaccine status. As a result, ASX 200 drops over 2.70% at the latest. New Zealand’s NZX 50 also joins the league with around 2.2% daily downside amid escalating COVID-19 cases linked to Auckland’s brothel.
It’s worth noting that China’s upbeat Caixin Services PMI for December and Premier Li Keqiang’s readiness to stabilize growth failed to impress investors in Beijing and Hong Kong.
Further, South Korea’s KOSPI declines 0.70% and Indonesia’s IDX Composite posted around 1.0% loss at the latest. India’s BSE Sensex is in the same line as daily infections jump to the highest since June.
On Wednesday, Fed policymakers’ discussion over the faster rate-hike and plans for balance-sheet normalization, per FOMC Minutes propelled the market towards risk safety. As a result, the US 10-year Treasury yields jumped to the highest level since April 2021 by the end of Wednesday’s North American session and drowned the Wall Street benchmark. Recently, the US 10-year bond yields refresh a nine-month high of around 1.71%, which in turn weighed on the S&P 500 Futures.
Looking forward, German Inflation data will precede the monthly prints of the US Good Trade Balance and ISM Services PMI for December, as well as weekly US Jobless Claims, to entertain short-term market players. However, Friday’s US Nonfarm Payrolls (NFP) is the key.
Read: Yields consolidate Fed Minutes-led gains at nine-month top, S&P 500 Futures rise 0.15%
- Silver extends Wednesday’s losses, refreshes intraday low by the press time.
- Bearish MACD, sustained trading below 200-HMA direct sellers towards key Fibonacci retracement levels.
- One-week-old resistance line adds to the upside filters.
Silver (XAG/USD) sellers battle with the support line of a weekly triangle, down 0.30% around $2.265 during early Thursday.
In doing so, the bright metal stretches the previous day’s downside break of 200-HMA amid bearish MACD signals.
That said, the metal’s further declines hinge on sustained trading below $22.65. Also acting as the downside filter is December 29 low near $22.60.
During the quote’s weakness past $26.60, 50% and 61.8% Fibonacci retracement (Fibo.) of December 15-28 upside, near $22.40 and $22.20 in that order, will challenge the XAG/USD bears.
Meanwhile, the corrective pullback may initially aim for the convergence of the 200-HMA and 23.6% Fibo. around $23.00.
Following that, the stated triangle’s resistance line will test the silver buyers around $23.25.
In a case where XAG/USD rises past $23.25, the tops marked around $23.45 since late November will be crucial to watch.
Silver: Hourly chart
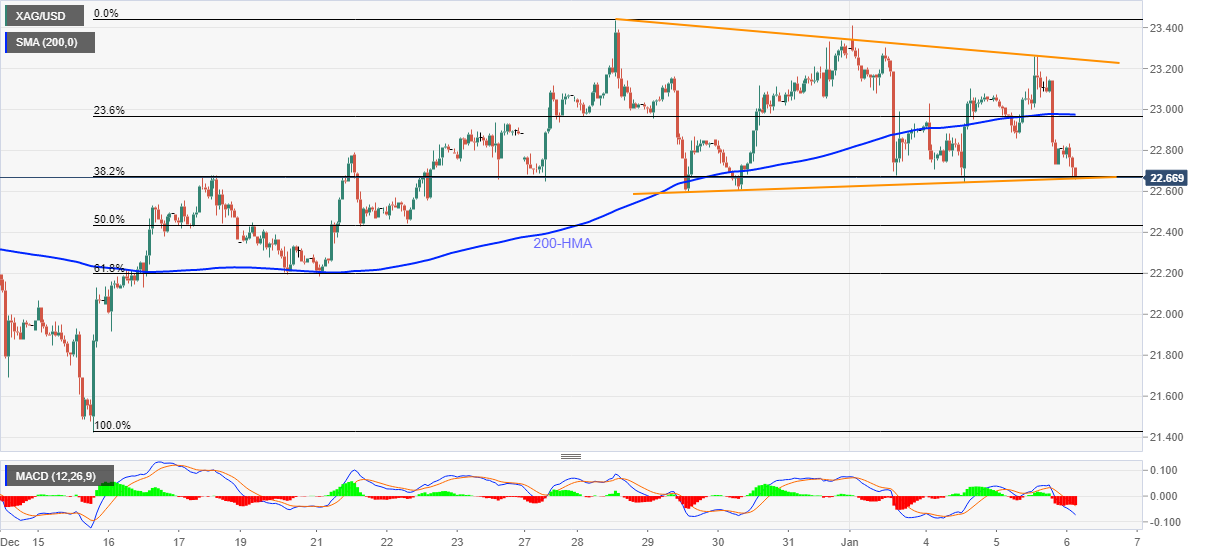
Trend: Further weakness expected
- USD/INR is potentially in a phase of accumulation.
- Bulls will have their eyes on the 38.2% Fibo near 75.10.
The US dollar surged overnight on the hawkish Federal Reserve minutes. This has prompted a boost to USD/INR that appears to be in a phase of accumulation. The following illustrates the meanwhile prospects of a bullish correction in USD/INR as a consequence from a daily perspective:
USD/INR H4 chart
-637770377550614313.png)
As illustrated above, the price has been accumulating around 74.20/40 and the bulls could be encouraged to move in to clean up some of the imbalance of the recent price run, on a break of 74.60 in the coming days. The bulls could aim as far up as the 38.2% Fibonacci retracement area on the daily chart near 75.10:
-637770380679096216.png)
- NZD/USD takes offers to refresh intraday low, down for the second consecutive day.
- Fed Minutes, ADP Employment Change previously propelled bond coupons on rate hike expectations.
- Upbeat China PMI fails to recall bulls as covid woes escalate.
- US ISM Services PMI may entertain traders ahead of Friday’s US NFP.
NZD/USD bears attack weekly bottom surrounding 0.6770, down 0.34% intraday to join AUD/USD while posting the biggest daily losses among the Group of Ten (G10) currency pairs.
In doing so, the Kiwi pair tracks firmer US Treasury bond yields to extend the previous day’s losses. That said, the worsening coronavirus conditions add to the market’s previous favor to the US bond bears, which in turn directs the traders off from commodities and linked currencies like the Aussie and Kiwi.
The US 10-year Treasury yields jumped to the highest level since April 2021 by the end of Wednesday’s North American session, up 3.4 basis points (bps) to 1.70%, which in turn drowned the Wall Street benchmark. Recently, the US 10-year bond yields refresh a nine-month high of around 1.71%, which in turn weighed on the S&P 500 Futures.
“The number of people linked to an Auckland brothel who are infected with Covid-19 is continuing to grow,” said NZ Herald while citing 17 new covid cases and 23 cases at the border at the latest. Not only at home but the COVID-19 infections also keep rising elsewhere and strain the medical systems even as policymakers reject calls of witnessing early 2021-like pandemic days.
Read: Covid update: Spreading like wildfire, but ''horrific scenes'' seen a year ago could be history
While tracking the virus woes, the NZD/USD prices ignored upbeat prints of China’s private activity gauge. China’s Caixin Services PMI rose past 52.1 figures flashed in November to 53.3 for December.
Fed policymakers discussed faster rate-hike and plans for balance-sheet normalization during the latest FOMC, signaled by the Minutes. Given the strong US ADP Employment Change for December, 804K versus 400K expected, statements from the Fed Minutes like, “conditions for a rate hike could be met relatively soon if the recent pace of labor market improvements continues” also propelled the US bond coupons.
As a result, the Fed interest rate futures pointed at the 80% chance of a hike in March 2022 after the Fed minutes.
It’s worth noting that Evergrande and geopolitics are an extra burden on the NZD/USD prices, not to forget the market’s cautious sentiment ahead of Friday’s US Nonfarm Payrolls (NFP).
Read: US December Nonfarm Payrolls Preview: Analyzing gold's reaction to NFP surprises
Technical analysis
NZD/USD stays inside a short-term trading range between 0.6860 and 0.6770. Given the quote’s pullback from 0.6838, on Wednesday, NZD/USD bears are likely to retest the 0.6860. The hopes of the pair’s further downside, also keeping the stated range, take clues from steady RSI and recently sluggish MACD.
On the contrary, 0.6740 may test the NZD/USD bears past 0.6770 before offering them the year 2021 low near 0.6701.
- AUD/USD takes a hit in sync with the risk sentiment on the Fed’s tightening concerns.
- The US dollar holds the recent rebound while global tech sell-off extends.
- The aussie ignores strong Chinese Caixin Services PMI, as it nears key support.
AUD/USD is breaking below the 0.7200 level in a renewed selling wave that has caught the high-beta assets, as investors continue to weigh the increased odds of aggressive Fed tightening.
The Fed December meeting’s minutes revealed that the central bank is prepared for earlier and faster rate increases to counter inflation while kicking off a reduction in its overall asset holdings.
Expectations of aggressive Fed’s tightening spooked investors and triggered a massive tech sell-off on the global bourses. Markets weighed in the Fed’s hawkishness against the economic recovery and looming Omicron covid variant risks.
The higher-yielding aussie shrugs off a jump in the Chinese Caixin Services PMI to 53.1 in December, as the damp mood remains a drag. Additionally, the Fed-RBA monetary policy divergence also collaborates to the downside in the aussie pair.
Attention now turns towards the US ISM Services PMI data and incoming covid updates for a fresh trading impetus in the major.
AUD/USD: Technical outlook
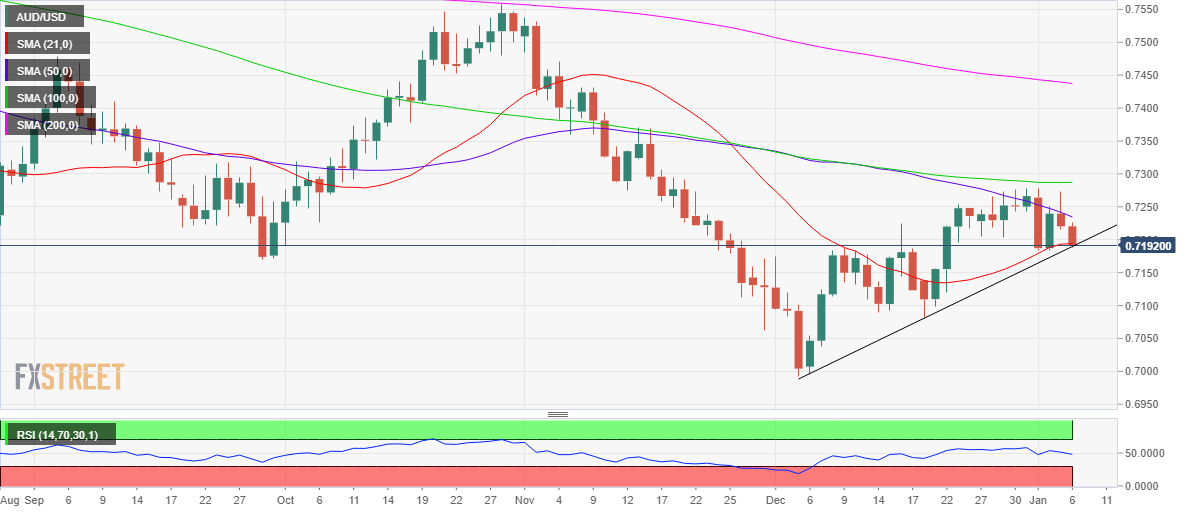
AUD/USD: Daily chart
Technically, the pair is challenging the critical daily support line at 0.7190, as of writing. That level is the confluence of the 21-Daily Moving Average (DMA) and rising trendline support.
A sustained break below the latter will trigger a fresh downtrend towards 0.7100.
The 14-day Relative Strength Index (RSI) has pierced through the midline to the downside, allowing room for more declines.
Alternatively, buyers need acceptance above the bearish 50-DMA, now placed at 0.7235 to take on the recovery mode.
AUD/USD: Additional levels to consider
Coronavirus is spreading fast throughout the world, but there is an air of cautionary optimism in the markets relying on encouraging analysis from professors of medicine, such as John Bell, a regius professor of medicine at the University of Oxford and the UK government’s life sciences advisor.
Recently speaking to BBC Radio 4, Bell analyzed data from the UK, he said that the number of people in ICUs who are vaccinated remains “very, very low.”
“The incidence of severe disease and death from this disease [Covid] has basically not changed since we all got vaccinated and that’s really important to remember,” he told the BBC.
“The horrific scenes that we saw a year ago — intensive care units being full, lots of people dying prematurely — that is now history in my view and I think we should be reassured that that’s likely to continue.”
Discussing the new omicron variant, he also explained: “the disease does appear to be less severe, and many people spend a relatively short time in hospital. They don’t need high-flow oxygen, the average length of stay is apparently three days, this is not the same disease as we were seeing a year ago.”
He is one of many who have calmed the fears of investors. Scientists are using the word “milder” with much trepidation to describe the illness conferred by the Omicron variant of SARS-Cov-2.
Real-world data will continue to come through and be monitored by markets for glimpses of further confirmation and a green light to search for yield in riskier higher-yielding asset classes.
For instance, encouragingly, according to the researchers, the Omicron variant replicated less efficiently, more than 10 times lower, once inside the human lung tissue than the original SARS-CoV-2 virus, which may suggest lower severity of the disease.
However, the lead author Dr Michael Chan has urged caution over the findings. “It is important to note that the severity of disease in humans is not determined only by virus replication but also by the host immune response to the infection,” said a lead author, Dr Michael Chan.
Covid continues to spread
However, the markets are also keeping a close eye on the spread and any precautionary measures that nation's may have to take with respect to social distancing and monetary policy. For instance, in Asia, Japan’s government is poised to declare a quasi-state of emergency on the southern island of Okinawa, media reports said.
A Covid-19 outbreak traced to US military bases has spread to the civilian population and the prime minister, Fumio Kishida, could announce the measures this week, the Mainichi newspaper said. Okinawa officials reported 225 new cases on Tuesday, including 47 of the Omicron strain. Tokyo, by comparison, registered 151 new infections.
Meanwhile, in China, the nation has locked down entire cities over the covid outbreaks to prevent the spread ahead of the Bejing Olympics. Beijing has pursued a "zero Covid" approach with tight border restrictions and targeted lockdowns since the virus first emerged. In more recent news, China's Xian Xianyang International Airport has suspended all international passenger flights and Hong Kong has suspended flights from 8 countries. As such news circulates, the price of oil could be impaired due to lower demand for jet fuel.
Across the South China Sea, China's neighbour, Australia, the daily COVID-19 cases there have hit a record high for a third day on Wednesday. This is further straining hospital resources and testing facilities as public anger grew over the handling of the fast-moving outbreak of the Omicron variant of the coronavirus. ''We have got some challenging weeks ahead of us," NSW Deputy Health Secretary Susan Pearce told reporters.
In Europe, the virus continues to spread like wildfire. Record rises in daily Covid cases were reported in at least seven countries on Wednesday as the Omicron variant continues to spread. They were: France - 332,252; Portugal - 39,570; Turkey - 66,467; Italy - 189,109; Sweden - 17,320; the Netherlands - 24,000 and Israel - 11,978. Markets are keeping an ear to the ground for the government's reactions.
- WTI pulls back from six-week high, pressured around intraday low at the latest.
- Bearish candlestick, sluggish RSI hints at buyer’s exhaustion below multi-day-old resistance line.
- 50-DMA, 100-DMA restricts immediate downside ahead of monthly support line.
WTI crude oil remains on the back foot near the intraday low of $76.56, down 0.20% on a day during early Thursday.
The oil benchmark jumped to a fresh high since November 25 the previous day before reversing gain from $78.30 to retest the opening levels at Wednesday’s end. In doing so, the black gold printed a Gravestone Doji bearish candlestick on the daily chart.
Given the sluggish RSI conditions backing the bearish candlestick below a 10-week-old resistance line, around $78.95, WTI oil prices are likely to decline further.
In doing so, the 50-DMA and the 100-DMA can lure short-term traders, respectively around $75.00 and $74.65.
However, early December’s peak near $73.15 and a one-month-old support line, close to $70.20, will challenge WTI bears afterward.
Alternatively, an upside clearance of the stated resistance line near $78.95 will need validation from the $79.00 round figure before directing the oil prices towards $83.60 and then to November’s high surrounding $84.00.
During the rise, the $80.00 psychological manget will act as an extra filter to the north.
WTI: Daily chart
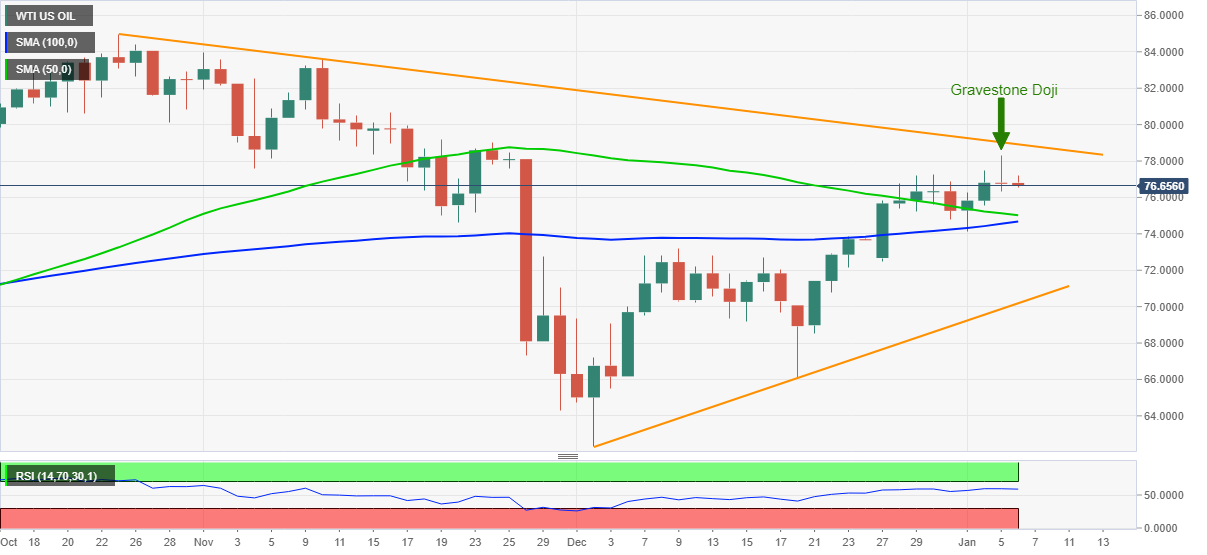
Trend: Further weakness expected
| Raw materials | Closed | Change, % |
|---|---|---|
| Brent | 80.09 | -0.04 |
| Silver | 22.799 | -1.07 |
| Gold | 1810.632 | -0.19 |
| Palladium | 1855.1 | -0.67 |
China’s Premier Li Keqiang urged further cuts to taxes and fees to revive the market entities, aimed to stabilize the country’s economy.
Key quotes
“The large-scale tax and fee cut policies are key to macroeconomic control.”
“More than 8.6 trillion yuan ($1.35 trillion) has been cumulatively cut in taxes and fees since 2016.”
“Such policies have further stimulated the vitality of market entities and contributed to expanding consumption and effective investment, and have also helped stabilize growth, ensure employment and prevent inflation.”
“Practice has proved that tax and fee cut policies considerably benefit enterprises and play a crucial role in dealing with the difficulties and challenges in keeping economic operation within a reasonable range.”
Related reads
- USD/CNY remains firmer above $6.3600 on upbeat China Caixin Services PMI
- China Caixin Services PMI (Dec): 53.1 beats prior 52.1, AUD/USD firm
- US Treasury yields retreat after rising to multi-day top on FOMC Minutes, S&P 500 Futures bounce off two-week low.
- Fed Minutes, ADP data propelled odds of rate hikes, stimulus hopes defend equity bulls.
- US ISM Services PMI will be watched for final hints of Friday’s NFP.
Market sentiment improved a bit during early Thursday, after the US Federal Open Market Committee (FOMC) Meeting Minutes triggered volatility in favor of the US Treasury yields during late Wednesday.
That said, the US 10-year Treasury yields jumped to the highest level since April 2021 by the end of Wednesday’s North American session, up 3.4 basis points (bps) to 1.70%, which in turn drowned the Wall Street benchmark. Though, the recently weaker US bond yields, down 1.5 basis points to 1.688% allowed S&P 500 Futures to print mild gains around 4,700.
Fed policymakers discussed faster rate-hike and plans for balance-sheet normalization during the latest FOMC, signaled by the Minutes. Given the strong US ADP Employment Change for December, 804K versus 400K expected, statements from the Fed Minutes like, “conditions for a rate hike could be met relatively soon if the recent pace of labor market improvements continues” also propelled the US bond coupons.
As a result, the Fed interest rate futures pointed at the 80% chance of a hike in March 2022 after the Fed minutes.
Elsewhere, China’s Evergrande and geopolitical tension surrounding Russia, Ukraine and Kazakhstan also favored yields.
Recently, Chinese policymakers showed readiness for further easing while Evergrande fears remain on the table and the economy battles covid. Even so, China China’s Caixin Services PMI rose past 52.1 figures flashed in November to 53.3 for December.
Considering the latest developments that favor US bond sellers, fueling the yields in turn, the markets are likely to pro-USD while trying to be cautious on commodities, as well as equities. However, it all depends upon Friday’s US jobs report for December.
Read: US December Nonfarm Payrolls Preview: Analyzing gold's reaction to NFP surprises
At its daily operation, the Bank of Japan (BOJ) offered to inject massive cash into the financial markets, in a bid to counter the impact of rising long-term interest rates on the economic recovery.
Key details
“BOJ offers to pump JPY2 trillion via temporary bond buying.”
“Benchmark 10-year JGB hits 0.105%, highest since November 2021.”
“Key yield still within loose range BOJ sets around target.”
Separately, the Nikkei Asian Review reported earlier on, “the Bank of Japan's government debt holdings have fallen for the first time in 13 years as the central bank quietly adjusts its massive bond-buying program in the face of looming financial risk.”
“The BOJ's balance of Japanese government bonds totaled 521 trillion yen ($4.49 trillion) at the end of 2021, according to data released Wednesday, down 14 trillion yen from a year earlier,” the Japanese media outlet added.
Market reaction
USD/JPY was last seen trading at 115.96, down 0.12% on the day.
- USD/CNY prints the biggest daily gains in a month despite showing no major reaction to strong China PMI data.
- China Caixin Services PMI crossed previous readouts during December.
- China policymakers brace for yuan restrictions, Premier Li hints at more stimulus to stabilize growth.
- DXY tracks firmer yields amid increasing hopes of Fed rate hikes, balance sheet normalization ahead US ISM Services PMI.
USD/CNY seesaws around $6.3680 while keeping the biggest daily gains in a month, up 0.20% intraday, during early Thursday. In doing so, the Chinese yuan (CNY) pair seems to believe in the latest comments from Beijing, even as the reaction to the latest data is muted when cheering hawkish hopes concerning the US Federal Reserve’s (Fed) next step.
China’s Caixin Services PMI rose past 52.1 figures flashed in November to 53.3 for December. The private services gauge followed its Manufacturing counterpart.
However, hints from the Chinese policymaker suggesting actions to control CNY strength and stabilize the economy are likely to fuel the USD/CNY prices of late. That said, Reuters came out with the news spotting China outlet while saying the Chinese authorities are seen implementing more drastic measures after the recent multi-pronged attempts.
Following that, China Premier Li Keqiang said, “The government will implement greater tax and fee cuts for businesses and would provide targeted support for COVID-affected sectors such as services,” per Reuters.
On the other hand, the US dollar cheered hawkish signals from the Federal Open Market Committee (FOMC) Meeting Minutes suggesting a faster rate-hike and plans to discuss balance-sheet normalization. Following the Minutes, the US bond yields rally and the Fed interest rate futures point at the 80% chance of a hike in March 2022.
Given the strong US ADP Employment Change for December, 804K versus 400K expected, statements from the Fed Minutes like, “conditions for a rate hike could be met relatively soon if the recent pace of labor market improvements continues” also propelled the US bond coupons.
While portraying the mood, the US 10-year Treasury yields jumped to the highest level since April 2021 by the end of Wednesday’s North American session, up 3.4 basis points (bps) to 1.70%, which in turn drowned the Wall Street benchmark. Though, the recent pause in the US bond yields allowed S&P 500 Futures to print mild gains of around 4,700.
Moving on, monthly prints of the US Good Trade Balance and ISM Services PMI for December, as well as weekly prints of US Jobless Claims, will direct immediate USD/CNY moves, mostly to the north. Though, cautious optimism prevails ahead of Friday’s US Nonfarm Payrolls (NFP).
Read: US December Nonfarm Payrolls Preview: Analyzing gold's reaction to NFP surprises
Technical analysis
Unless successfully crossing a two-month-old descending resistance line around $6.3750, USD/CNY bears keep targeting to refresh the three-year low, flashed on December 31, 2021, around $6.3400.
Analysts at Citigroup lifted their price forecast for the S&P 500 index to 5,100 from 4,900 predicted in October, citing robust corporate earnings.
Key quotes
“A US Federal Reserve policy tightening could pose valuation headwinds.”
“Expect strong corporate earnings to continue this year.”
“Upcoming quarterly results and 2022 outlook of companies could provide the cushion for growth, despite COVID-19 and supply chain woes.”
The Caixin/Markit services Purchasing Managers' Index (PMI) has risen to 53.1 in December from 52.1 in November.
This leaves the outlook solid with the reading above the expansion level of 50, a point that separates growth from contraction on a monthly basis.
Reuters reported that ''activity in China's services sector expanded at a faster pace in December amid higher demand and easing inflationary pressure but continuing small-scale COVID-19 outbreaks weighed on the outlook, a private sector survey showed on Thursday.''
Key notes
''The survey, which focuses more on small firms in coastal regions, tallied with those of an official survey, which also showed the expansion in the services sector sped up.''
''Analysts say the services sector, which has been slower to recover from the pandemic than manufacturing, is more vulnerable to sporadic COVID-19 outbreaks and anti-virus measures, with leisure and tourism businesses hurt the most.''
''Most of China's recent local cases have been in the northwestern province of Shaanxi, where the capital city Xian has been on lockdown to control the spread of the disease.''
AUD/USD is steady trading around 0.7213 after the data from a low of 0.7205 on the session so far.
About the Caixin Services PMI™
The Caixin Services PMI™, released by Markit Economics, is based on data compiled from monthly replies to questionnaires sent to purchasing executives in over 400 private service sector companies. The panel has been carefully selected to accurately replicate the true structure of the services economy.
- USD/TRY hovers around intraday high, mildly bid after two-day uptrend.
- Turkish Finance Minister praise recent steps to fight inflation.
- FOMC Minutes, US ADP Employment Change hints at faster Fed rate-hikes, balance-sheet normalization.
- US ISM Services PMI, second-tier data will join risk catalysts to direct short-term moves.
Alike other currency pairs, USD/TRY also trades quietly during an inactive Asian session on Thursday. That said, the Turkish lira (TRY) pair gains 0.25% intraday around $13.70 by the press time.
Firmer US ADP Employment Change for December, 804K versus 400K expected, bolstered bullish bias for the Fed after the Federal Open Market Committee (FOMC) Meeting Minutes said, “In light of elevated inflation pressures and the strengthening labor market, participants judged that the increase in policy accommodation provided by the ongoing pace of net asset purchases was no longer necessary.” The Fed Minutes also signals that the policymakers also judged conditions for a rate hike could be met relatively soon if the recent pace of labor market improvements continues.
Following the Minutes, the Fed interest rate futures point at the 80% chance of a hike in March 2022. Also, the US 10-year Treasury yields jumped to the highest level since April 2021 by the end of Wednesday’s North American session, up 3.4 basis points (bps) to 1.70%, which in turn drowned the Wall Street benchmark. Though, the recent pause in the US bond yields allowed S&P 500 Futures to print mild gains around 4,700.
On the other hand, Turkish Auto association portrays a 4.6% drop in 2021 while the Reuters’ poll expects the nation to snap three straight months of current account surpluses in November, with a likely deficit of $2.56 billion. Even so, Finance Minister Nureddin Nebati said on Wednesday, per Reuters, “Turkey is making the fight against rising prices a priority, putting aside ‘orthodox policies’ and charting its own course.”
Looking forward, monthly prints of the US Good Trade Balance and ISM Services PMI for December, as well as weekly prints of US Jobless Claims, will be crucial for the USD/TRY prices. Should the US statistics keep beating the cautious forecasts, the odds of the faster Fed rate hikes can’t be ignored, which in turn will favor the pair buyers. However, Friday’s US Nonfarm Payrolls (NFP) is the key.
Read: US December Nonfarm Payrolls Preview: Analyzing gold's reaction to NFP surprises
Technical analysis
Although sustained trading beyond the 21-DMA level of $13.30 keeps USD/TRY buyers hopeful, a clear upside break of the 13-day-old resistance line, around $13.90, becomes necessary for the pair’s further upside.
| Time | Country | Event | Period | Previous value | Forecast |
|---|---|---|---|---|---|
| 01:45 (GMT) | China | Markit/Caixin Services PMI | December | 52.1 | |
| 07:00 (GMT) | Germany | Factory Orders s.a. (MoM) | November | -6.9% | 2.1% |
| 09:30 (GMT) | United Kingdom | Purchasing Manager Index Services | December | 58.5 | 53.2 |
| 10:00 (GMT) | Eurozone | Producer Price Index, MoM | November | 5.4% | 1.2% |
| 10:00 (GMT) | Eurozone | Producer Price Index (YoY) | November | 21.9% | 22.9% |
| 13:00 (GMT) | Germany | CPI, m/m | December | -0.2% | 0.4% |
| 13:00 (GMT) | Germany | CPI, y/y | December | 5.2% | 5.1% |
| 13:30 (GMT) | U.S. | Continuing Jobless Claims | December | 1716 | 1688 |
| 13:30 (GMT) | U.S. | Initial Jobless Claims | January | 198 | 197 |
| 13:30 (GMT) | Canada | Trade balance, billions | November | 2.1 | 2.03 |
| 13:30 (GMT) | U.S. | International Trade, bln | November | -67.1 | -77.1 |
| 15:00 (GMT) | U.S. | Factory Orders | November | 1% | 1.5% |
| 15:00 (GMT) | U.S. | ISM Non-Manufacturing | December | 69.1 | 66.9 |
| 23:30 (GMT) | Japan | Labor Cash Earnings, YoY | November | 0.2% | |
| 23:30 (GMT) | Japan | Household spending Y/Y | November | -0.6% | 1.6% |
| 23:30 (GMT) | Japan | Tokyo CPI ex Fresh Food, y/y | December | 0.3% | 0.5% |
| 23:30 (GMT) | Japan | Tokyo Consumer Price Index, y/y | December | 0.5% |
In recent trade today, the People’s Bank of China (PBOC) set the yuan (CNY) at 6.3728 vs the last close of 6.3647.
About the fix
China maintains strict control of the yuan’s rate on the mainland.
The onshore yuan (CNY) differs from the offshore one (CNH) in trading restrictions, this last one is not as tightly controlled.
Each morning, the People’s Bank of China (PBOC) sets a so-called daily midpoint fix, based on the yuan’s previous day closing level and quotations taken from the inter-bank dealer.
- AUD/USD bears taking over following mitigation of inefficiency.
- A bearish case is building up for a long-term perspective.
As per the prior analysis, AUD/USD Price Analysis: Bulls may have run their course, 0.7180, 0.7150 and 0.7100 eyed, the bulls have indeed thrown in the towel following some final mitigation of the inefficiency of price as explained in the above article and as follows:
AUD/USD H1 chart, prior analysis
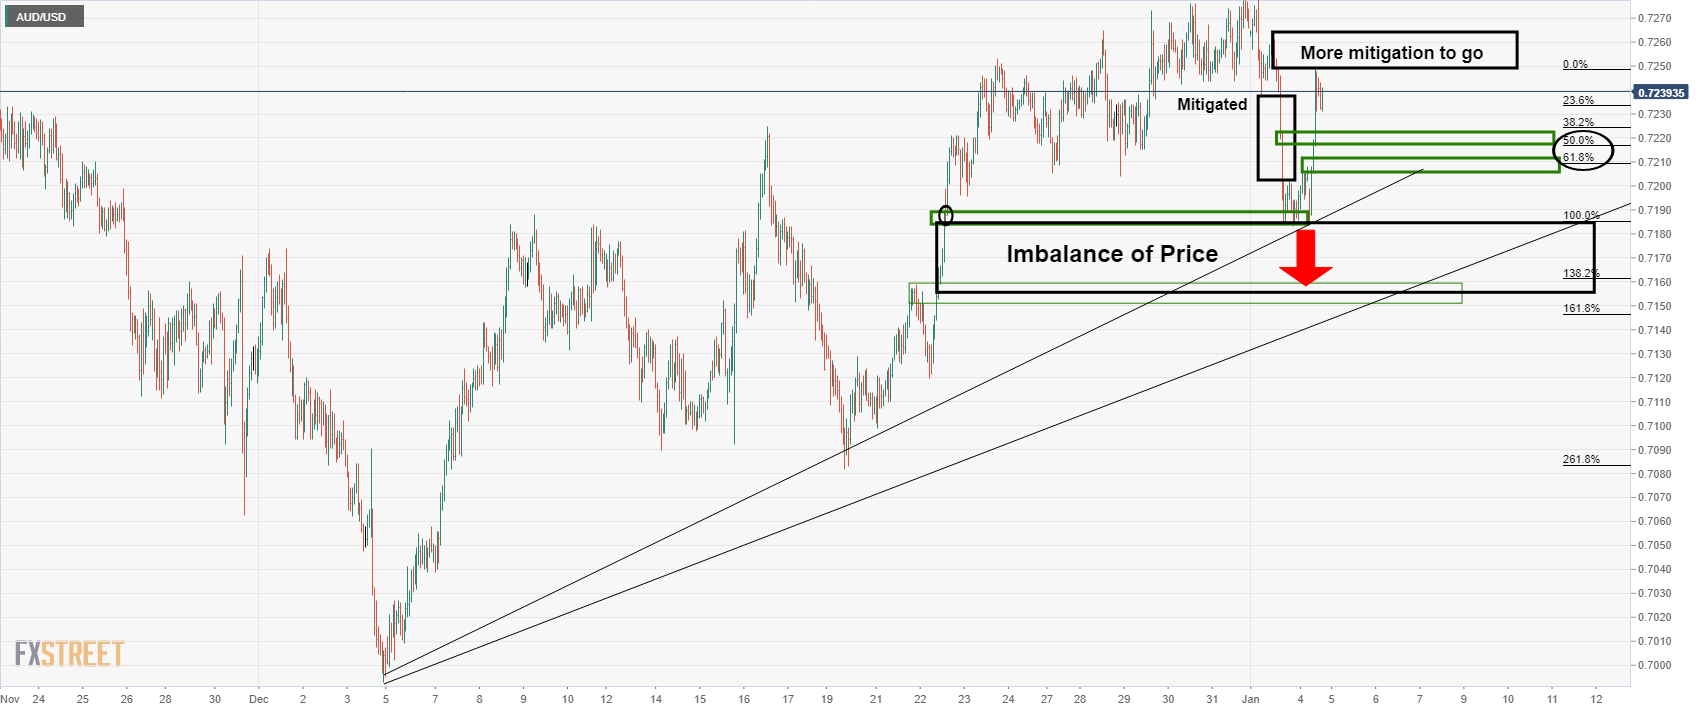
While the article was biased towards a bearish outlook, the imbalance of price to the upside was pointed out and a last-minute push to the upside was expected in order to mitigate the inefficiency. This played out as follows:
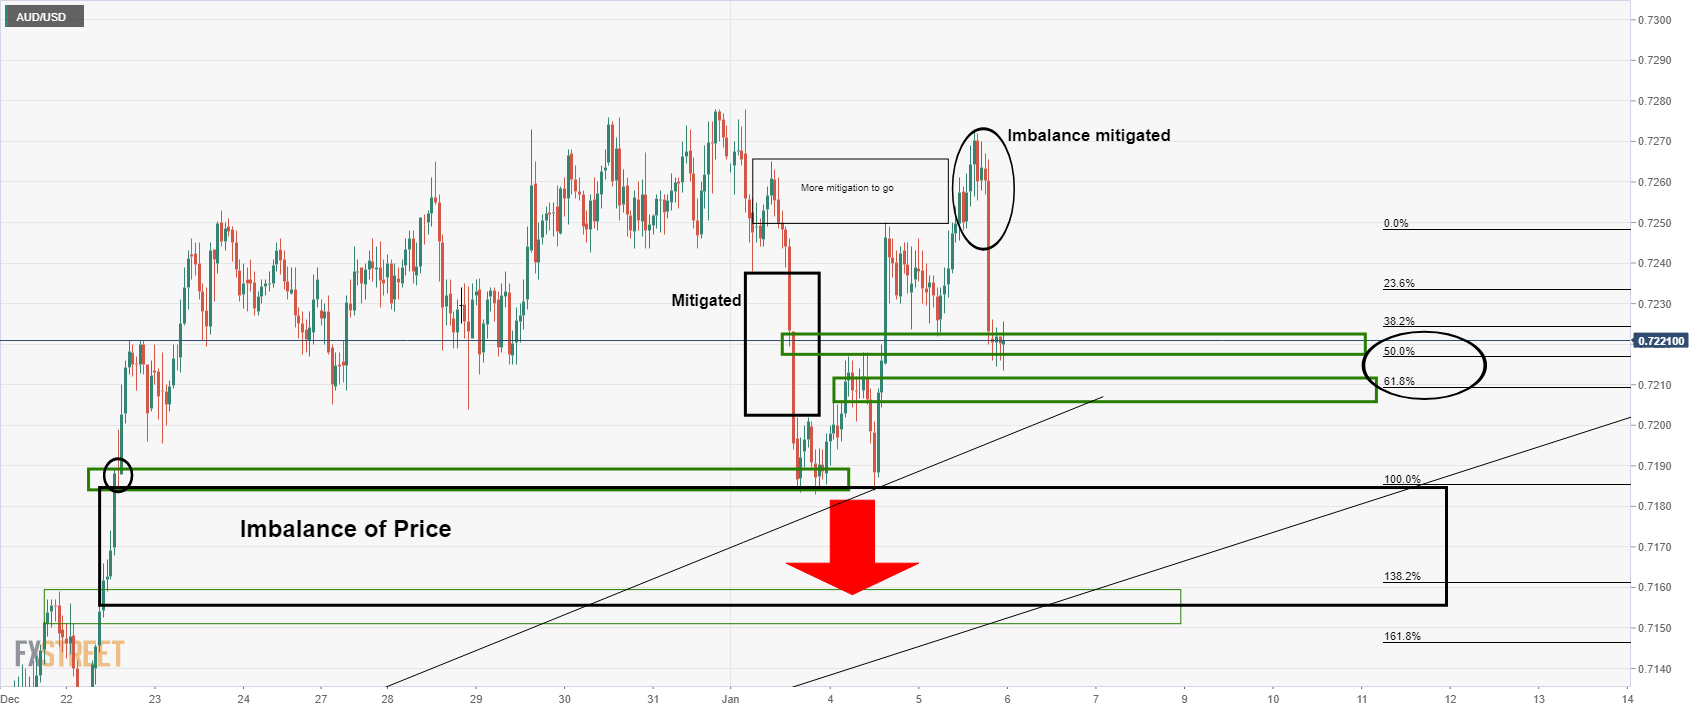
Meanwhile, the price has met what is expected to remain as a support structure and subsequent bids could drive the price higher to mitigate the bearish impulse's inefficiency of price as follows, prior to bears moving in again in what could play out to be a period of short term distribution:
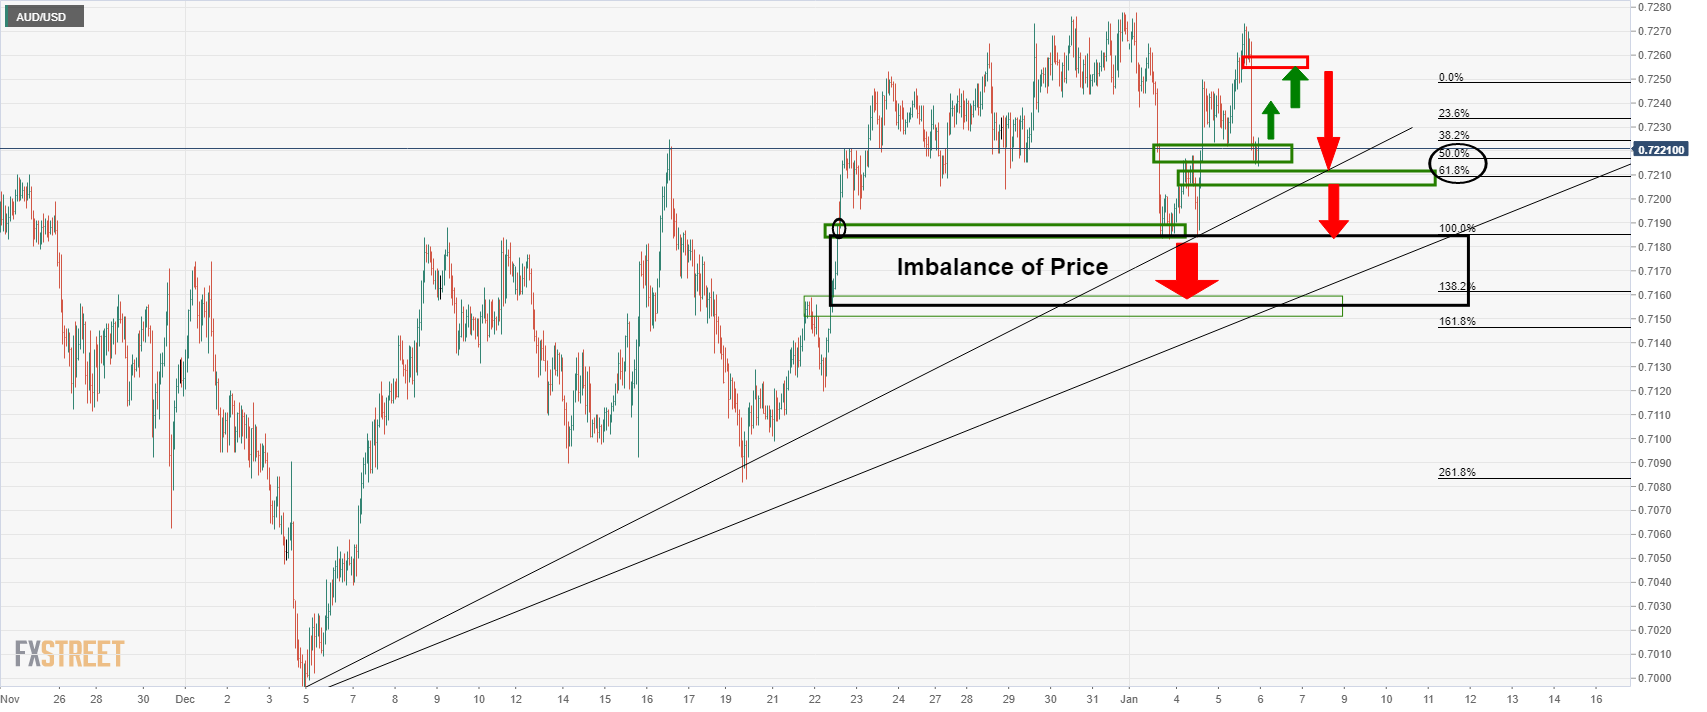
Overall, the bearish perspective for the price is based on the following longer-term chart analysis:
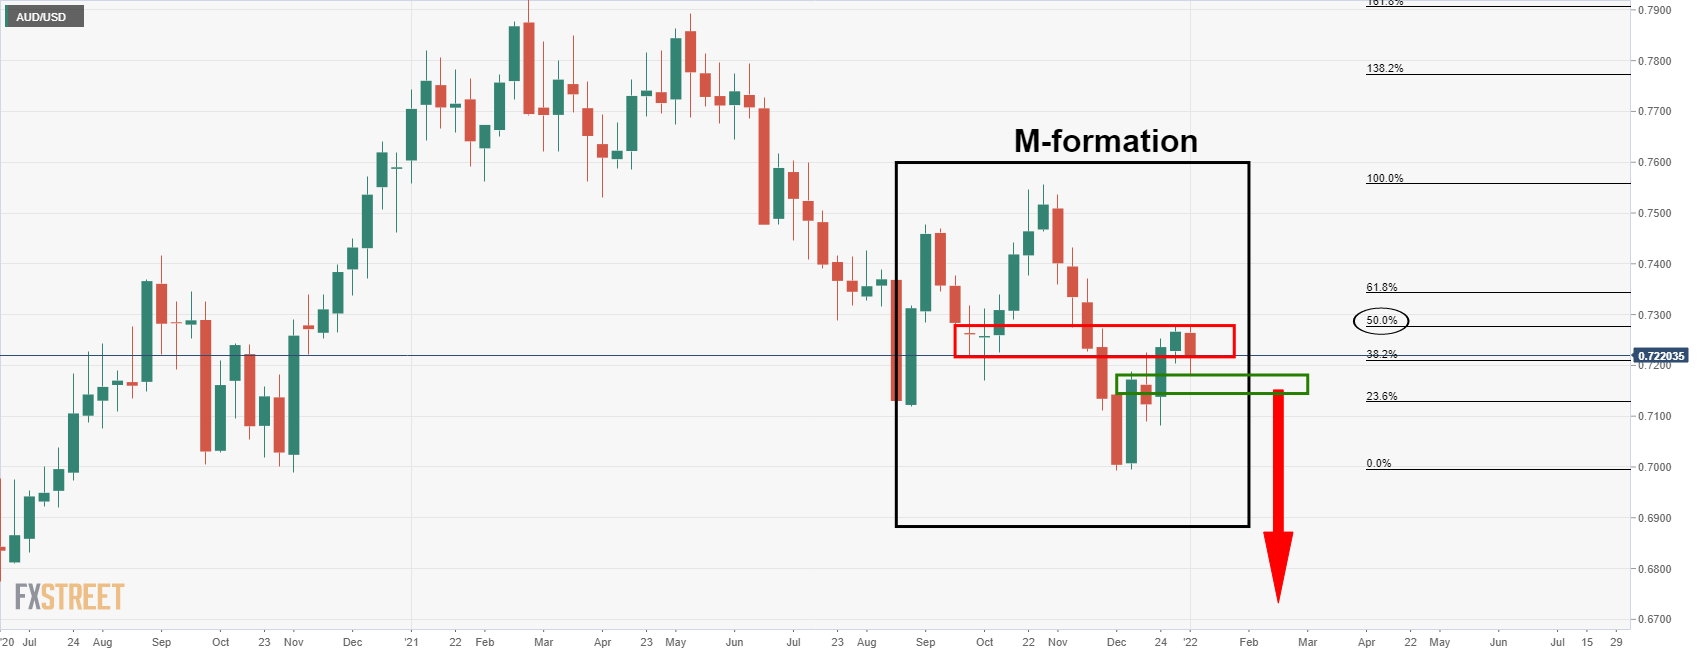
The price has met the M-formation's neckline which is currently acting as a resistance near the 50% mean reversion of the weekly bearish impulse. On a break of weekly support, near 0.7150, the prospect of a downside continuation will be in play.
- DXY holds onto recent gains post-FOMC Minutes, refreshes intraday high.
- Six-week-old resistance line lures buyers, 50-DMA also restrict nearby downside.
- Sustained bounce off monthly horizontal support, steady RSI favor bulls.
US Dollar Index (DXY) extends the Fed Minutes-led gains around 96.20 during early Thursday.
The greenback gauge dropped briefly below the 10-DMA before the FOMC Minutes triggered a rebound from 95.88 level. The recovery moves also take clues from the steady RSI and the quote’s ability to defend the monthly horizontal support.
That said, the US Dollar Index bulls currency aim for a descending resistance line from November 24, around 96.45.
However, any further upside will be challenged by 96.65 and the 97.00 threshold, not to forget multiple tops marked in November and December around 96.90-95.
Alternatively, 10-DMA and 50-DMA challenge the short-term downside of the DXY, around 96.05 and 95.75 respectively, ahead of the stated monthly horizontal support area near 95.60-55.
Following that, an ascending trend line from September, close to 94.97, will be crucial to watch.
To sum up, DXY bulls keep reins but have a bumpy road ahead.
DXY: Daily chart
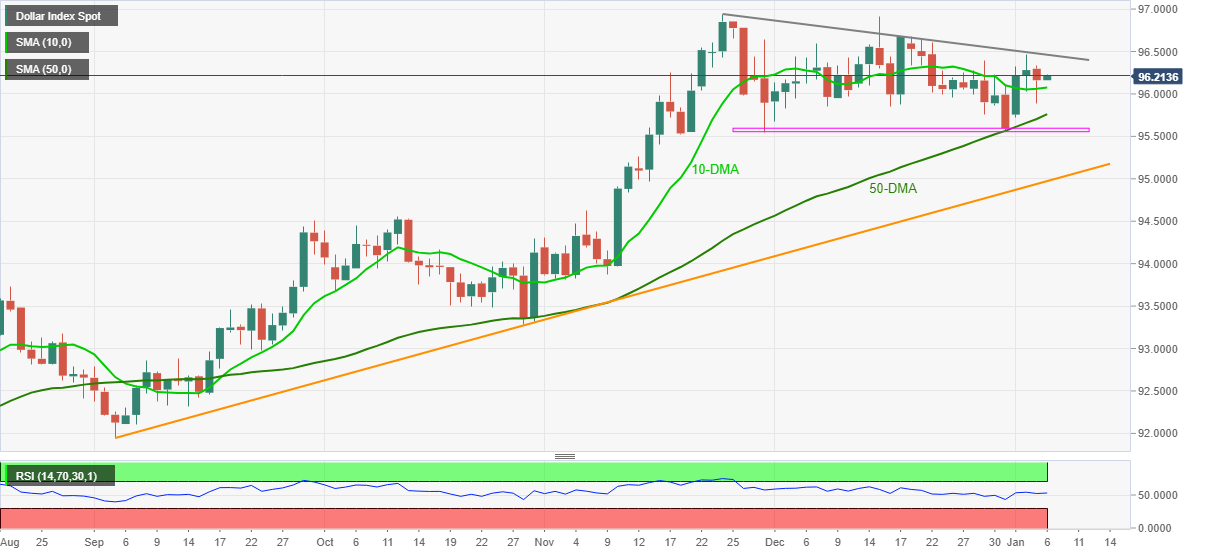
Trend: Further upside expected
- GBP/USD refreshes intraday low, extends pullback from two-month top.
- Fed Minutes, ADP Employment Change fuelled yields, USD.
- EU takes multiple Brexit-linked sites offline, UK-France jostle over immigration.
- UK PM Johnson hints at easing covid restrictions over travel to England, British businesses see record inflation.
GBP/USD consolidates recent losses around a two-month top, refreshing intraday low to 1.3545 during Thursday’s Asians session.
The cable pair took a U-turn from highest levels since early November the previous day after the US Federal Open Market Committee (FOMC) Meeting Minutes conveyed hawkish bias of the policymakers, suggesting a faster rate-hike and plans to discuss balance-sheet normalization.
US ADP Employment Change for December, up 807K versus 400K expected, also backed the hawkish FOMC Minutes, which propelled the US bond yields and portrayed an 80% chance of Fed rate hike in March per Fed interest rate futures.
In addition to the Fed-linked chatters and market reaction, fears of the South African covid variant, Omicron, also weighed on the market’s risk appetite, as well as the GBP/USD prices. Although global policymakers tried not to scream on record covid infections, by citing scientific studies terming Omicron as a mild covid strain, findings of another virus variant and strain on multiple medical systems highlighted the COVID-19 woes. It’s worth noting that the virus cases are doubling faster and the fresh virus version, founded by France, is said to spread more widely than Omicron.
At home, the UK reported 194,747 daily covid cases, easing from the previous day’s record top of more than 218,000 infections. The same should have favored UK PM Boris Johnson to say, “I can announce that in England from 4:00 am on Friday we will be scrapping the pre-departure test, which discourages many from traveling for fear of being trapped overseas and incurring significant extra expense.” On the same line was the news from Telegraph saying, “British health officials have made plans to limit PCR tests to symptomatic people allowing asymptomatic Britons to return to work faster.”
Elsewhere, the European Union (EU) took down multiple Brexit-linked sites, including the leave.eu, while marking the latest spark with the UK. Additionally, news of the British-France tussles over immigration also portrayed Brexit woes.
However, hopes of government support to the London, due to Brexit-linked losses to the financial hub, join the positive progress on the US-UK Brexit trade talks to favor GBP/USD bulls.
Amid these plays, the US 10-year Treasury yields jumped to the highest level since April 2021 by the end of Wednesday’s North American session, up 3.4 basis points (bps) to 1.70%, which in turn drowned the Wall Street benchmark. Though, the recent pause in the US bond yields allowed S&P 500 Futures to print mild gains around 4,700.
That said, the GBP/USD pair may remain pressured amid hawkish hopes from the Fed. Though, today’s UK Services PMI for December, expected to confirm initial readings of 53.2, will be important after the Manufacturing PMI jumped. Also crucial will be monthly prints of the US Good Trade Balance and ISM Services PMI for December, as well as weekly prints of US Jobless Claims.
Technical analysis
With nearly overbought RSI conditions backing the GBP/USD pullback from a two-month-old horizontal hurdle surrounding 1.3600, the pair sellers may aim to retest November’s high near 1.3510. However, any further weakness will be challenged by a 13-day-old support line near 1.3505, as well as by the 1.3500 threshold.
- GBP/JPY bulls are on the lookout for a discount.
- The bears note the weekly W-formation and prospects for a deeper correction.
GBP/JPY has settled back into a potential hourly support zone on the hourly charts. On the longer-term time frames, there is a more complicated structure that has formed for which is illustrated in the following top-down analysis:
GBP/JPY weekly charts
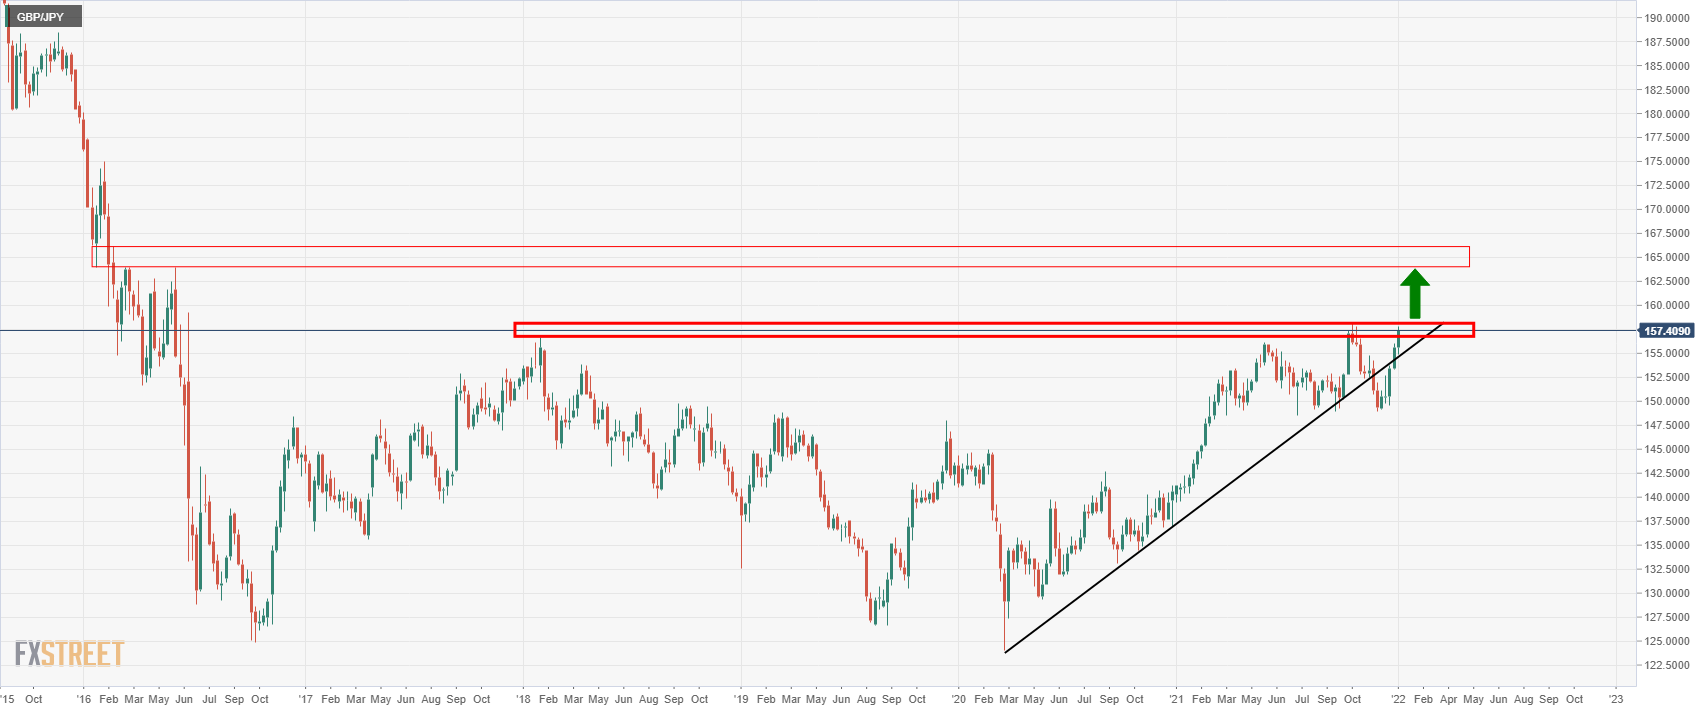
Alternatively, the price could revisit the structure below for a retest and additional buy liquidity prior to running north again as follows:
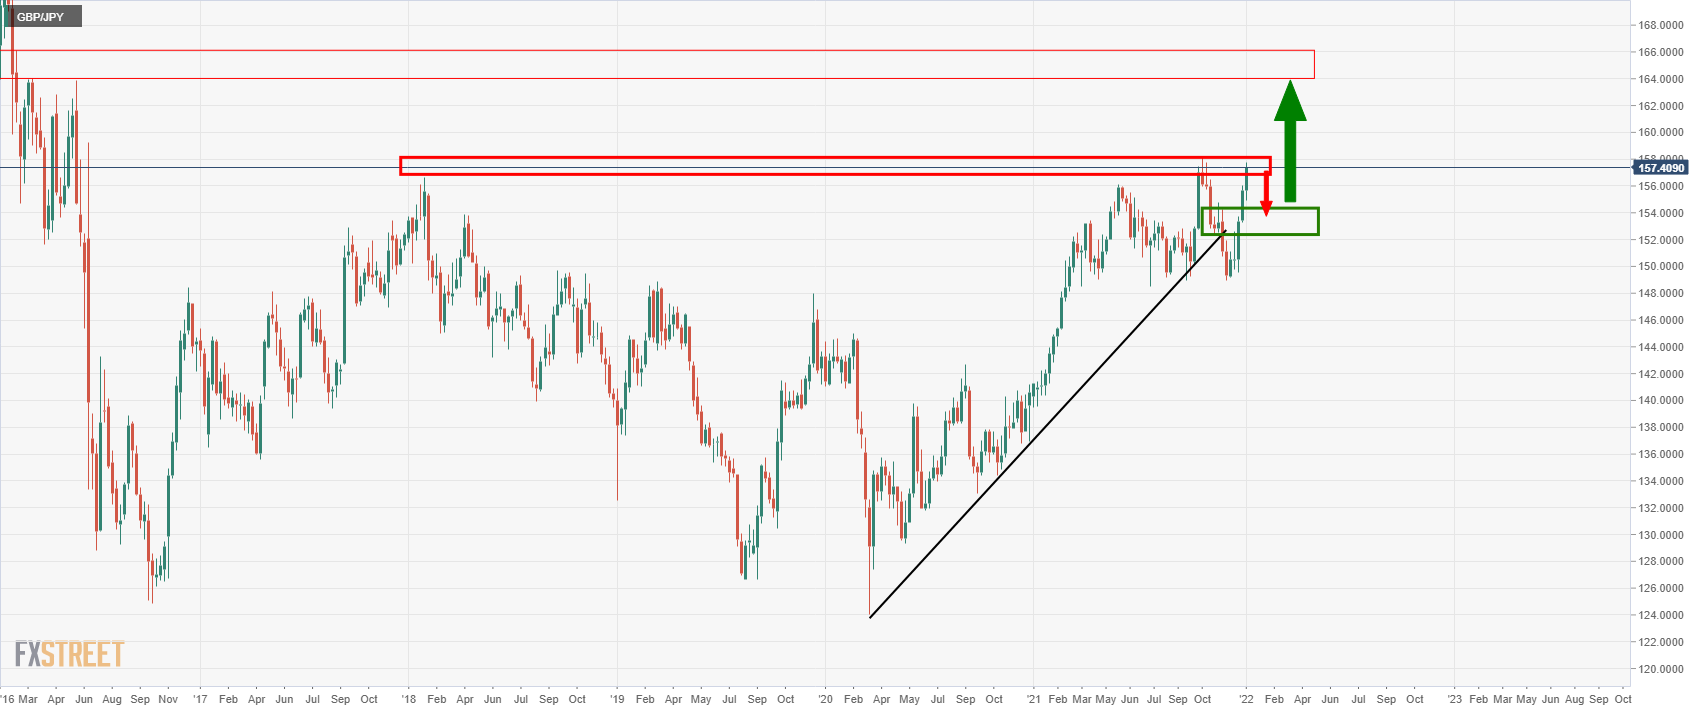
GBP/JPY W-formation
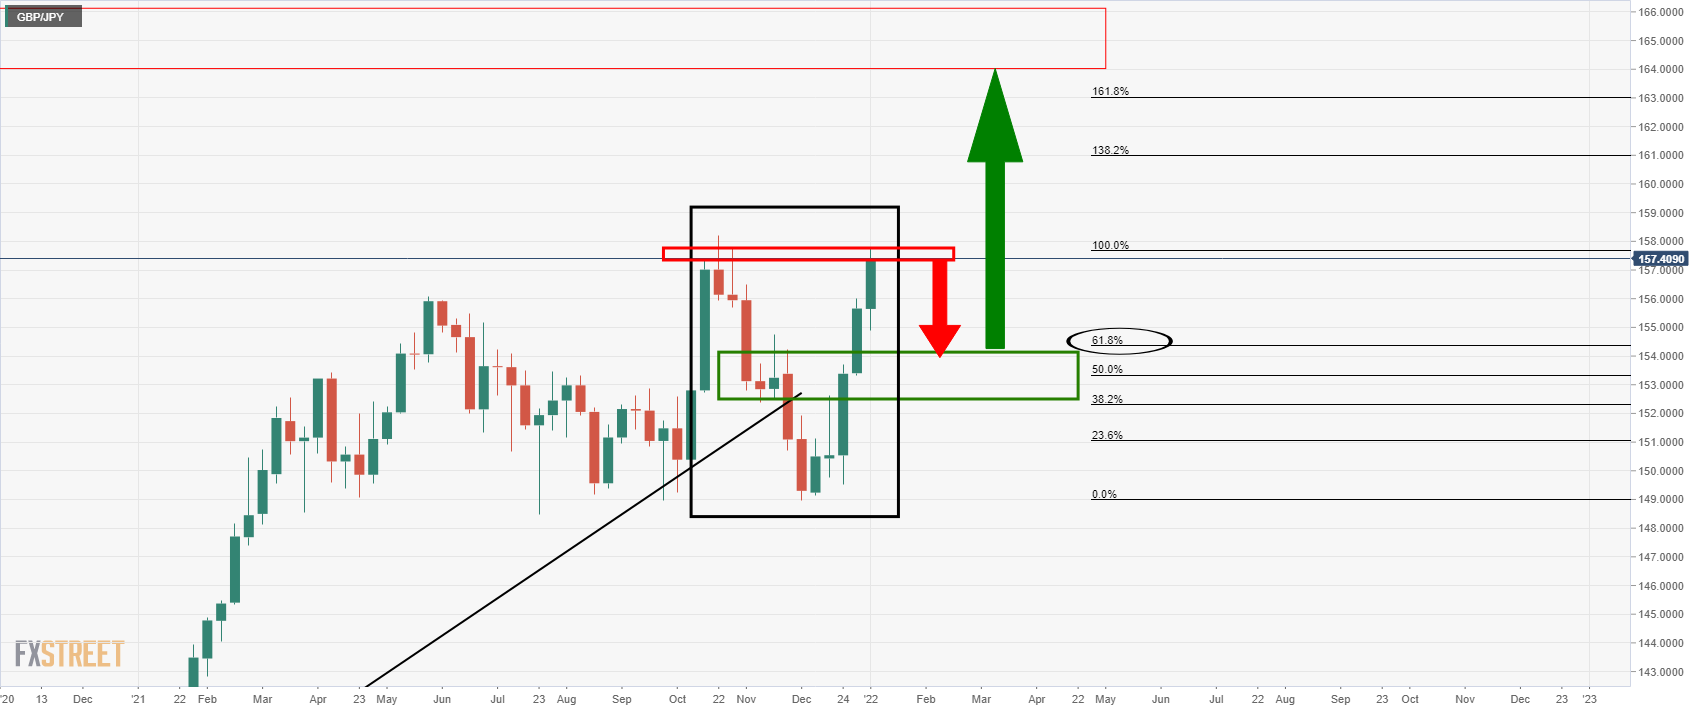
Zooming in, we can see the reversion pattern more clearly in the form of a W-shape. The neckline has a high completion rate for the price to restest the zone, near to 153.40 in this case.
On the other hand, should the price break this area, then the downside will be back in favour:
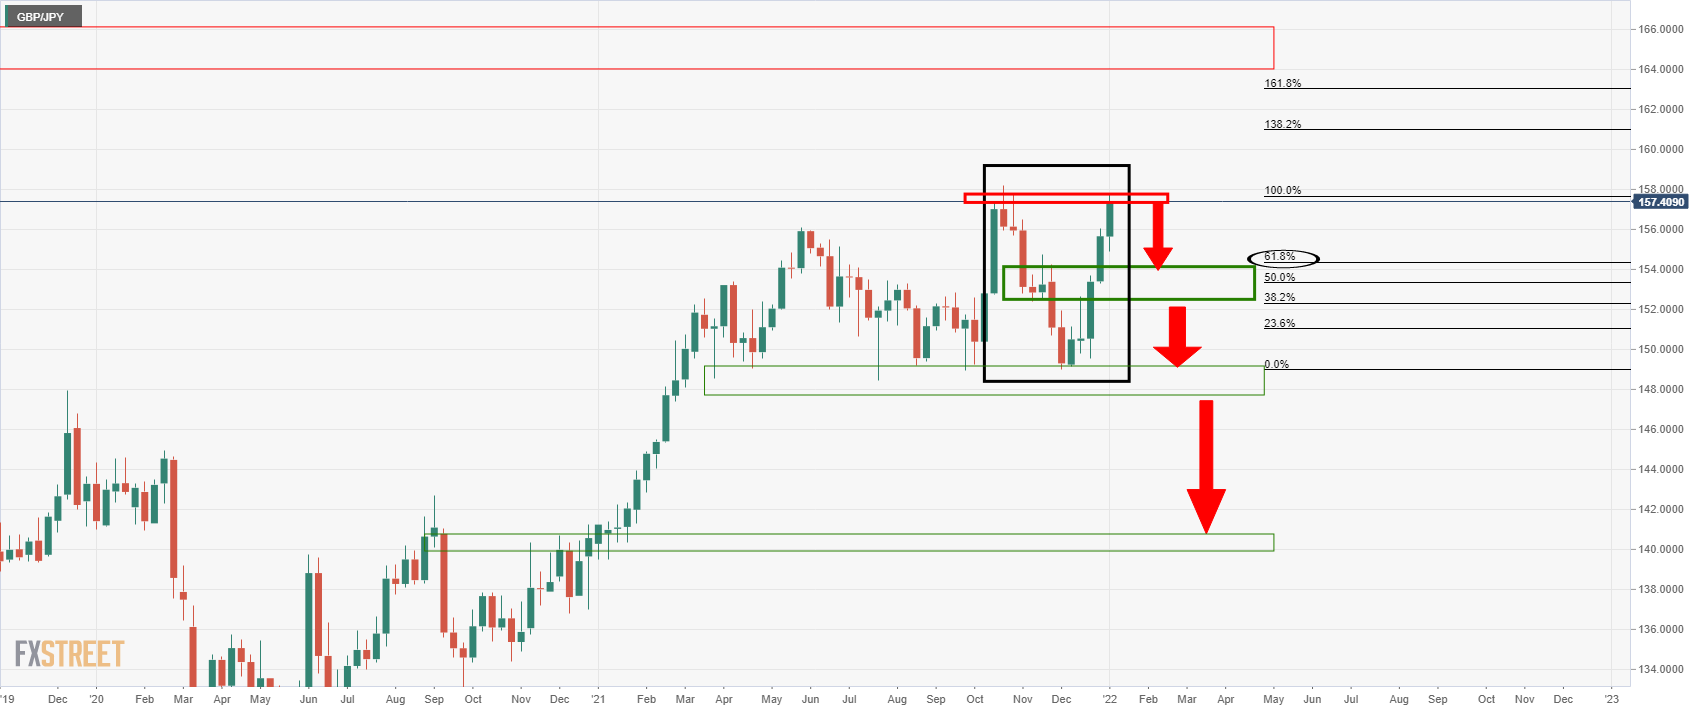
GBP/JPY H1 charts
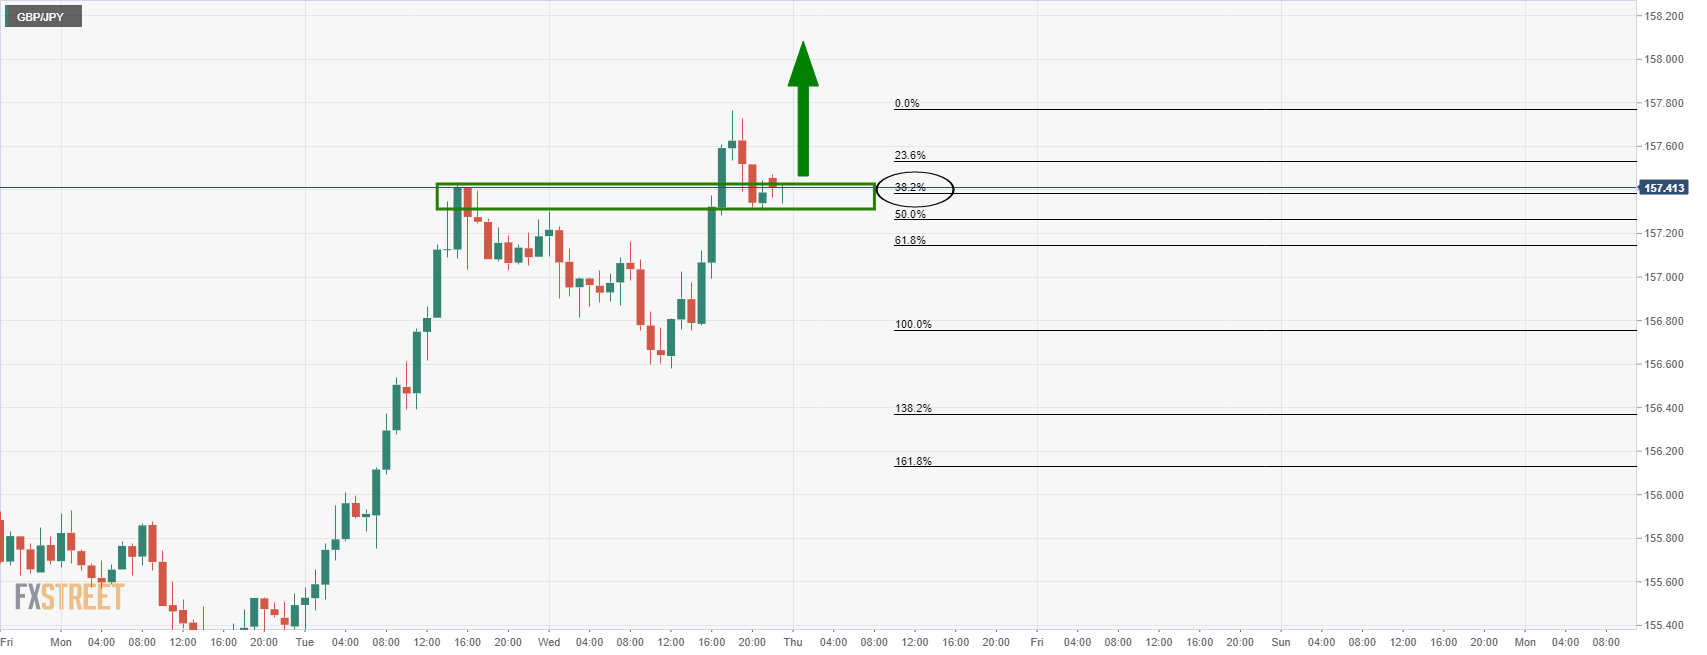
Meanwhile, the bulls may not be done yet. The hourly bullish impulse was met with a significant correction to the 38.2% Fibonacci level. This may act as support and encourage a second wind.
On the other hand, there is an imbalance of price below which could attract the price into a deeper correction prior to the next bullish accumulation:
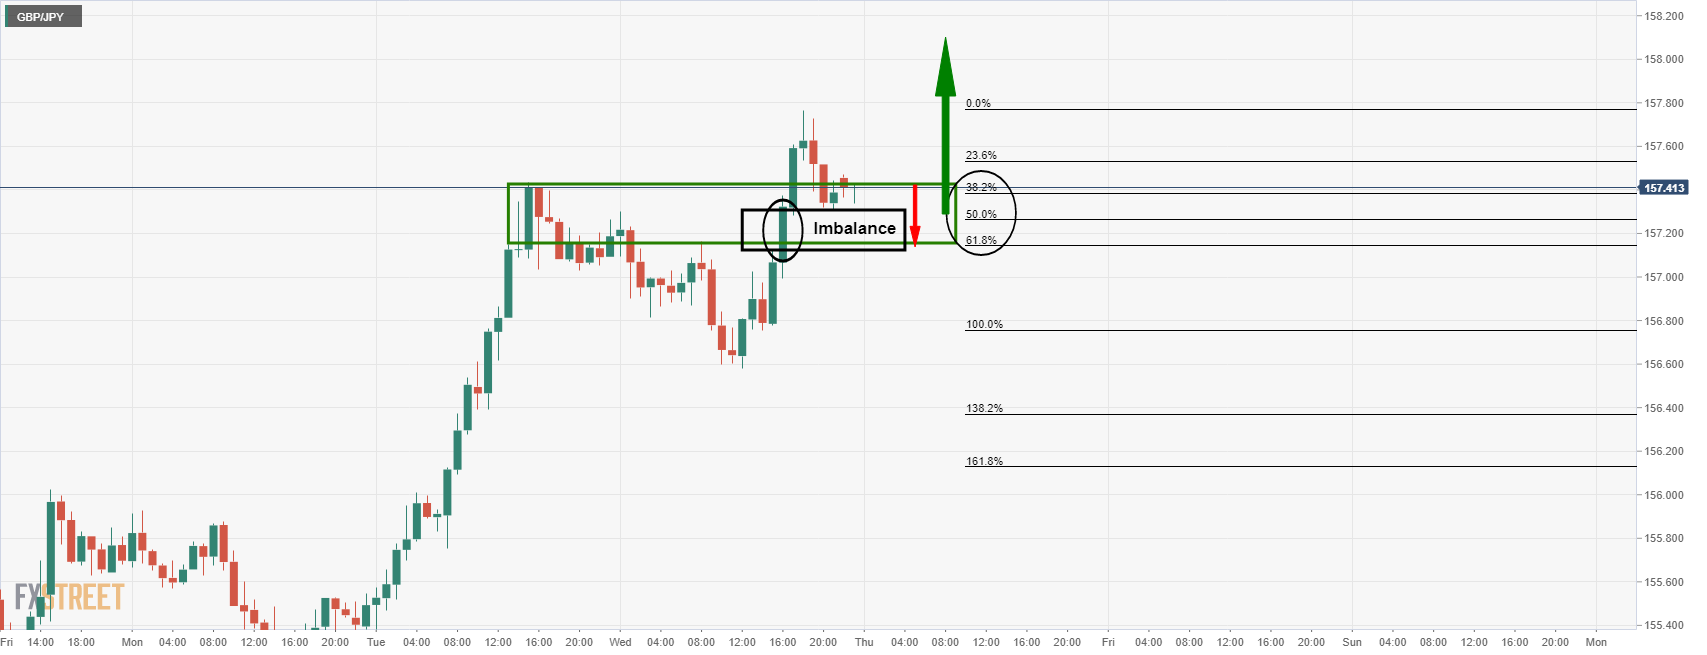
- NZD/USD keeps FOMC Minutes-led bearish bias, recently depressed around intraday low.
- Oscillators suggest continuation of sideways grind but bears command more powers.
- 200-SMA, key Fibonacci retracement levels add to the upside filters.
NZD/USD remains pressured around daily low, keeping the previous day’s bearish bias. That said, the kiwi pair edges lower to 0.6790 during Thursday’s Asian session.
Even so, NZD/USD stays inside a short-term trading range between 0.6860 and 0.6770.
Given the quote’s pullback from 0.6838, on Wednesday, NZD/USD bears are likely to retest the 0.6860. The hopes of the pair’s further downside, also keeping the stated range, take clues from steady RSI and recently sluggish MACD.
That said, the 200-SMA level of 0.6810 acts as an immediate hurdle before the 0.6860 resistance. However, an upside clearance of 0.6860 will open the door for the Kiwi pair’s run-up towards 50% and 61.8% Fibonacci retracement (Fibo.) of mid-November to December downside, respectively around 0.6890 and 0.6935.
On the contrary, 0.6740 may test the NZD/USD bears past 0.6770 before offering them the year 2021 low near 0.6701.
NZD/USD: Four-hour chart
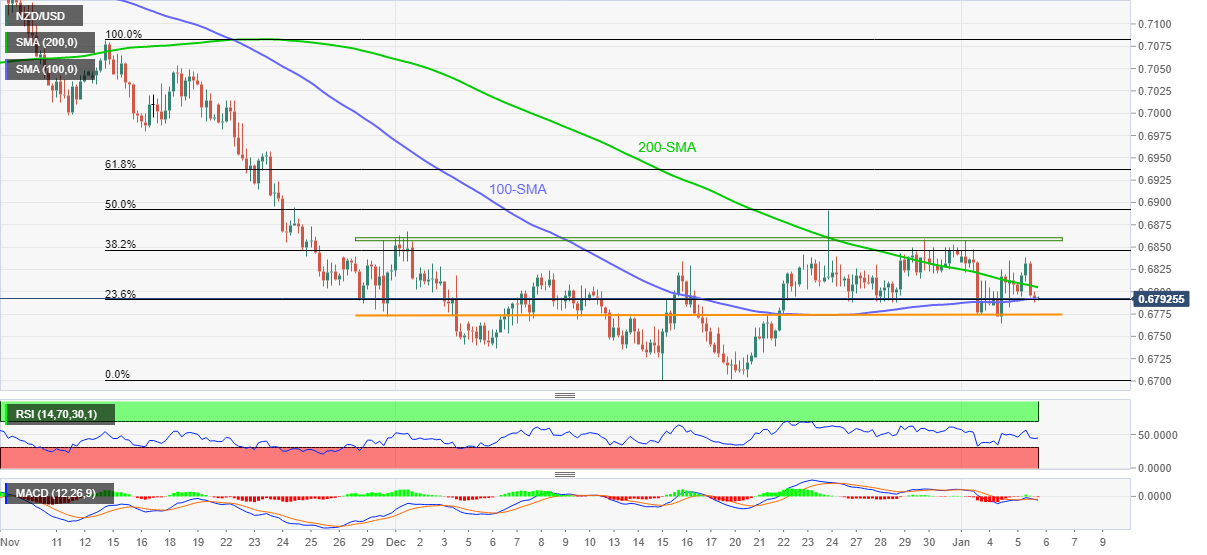
Trend: Further weakness expected
| Pare | Closed | Change, % |
|---|---|---|
| AUDUSD | 0.72218 | -0.14 |
| EURJPY | 131.355 | 0.32 |
| EURUSD | 1.13129 | 0.27 |
| GBPJPY | 157.385 | 0.22 |
| GBPUSD | 1.35553 | 0.21 |
| NZDUSD | 0.67975 | -0.02 |
| USDCAD | 1.27595 | 0.44 |
| USDCHF | 0.91731 | 0.22 |
| USDJPY | 116.108 | 0 |
Following the hawkish FOMC Minutes, the US banks rolled out their analysis of when the US Federal Reserve (Fed) can start the balance-sheet normalization.
“We think the Fed will start ‘quantitative tightening’ this September by allowing maturing assets to run off its balance sheet,” said JP Morgan. The bank adds, “We expect the FOMC will phase in a $100bn-per-month cap on runoff... double the maximum pace its balance sheet was reduced during 2017 to 2019.”
On the other hand, Goldman Sachs expects the balance sheet squeeze could begin relatively quickly following the interest rate lift.
Read: S&P 500 tumbles to low-4700s as big tech/growth stocks battered after surprisingly hawkish FOMC minutes trigger QT fears
© 2000-2026. Sva prava zaštićena.
Sajt je vlasništvo kompanije Teletrade D.J. LLC 2351 LLC 2022 (Euro House, Richmond Hill Road, Kingstown, VC0100, St. Vincent and the Grenadines).
Svi podaci koji se nalaze na sajtu ne predstavljaju osnovu za donošenje investicionih odluka, već su informativnog karaktera.
The company does not serve or provide services to customers who are residents of the US, Canada, Iran, The Democratic People's Republic of Korea, Yemen and FATF blacklisted countries.
Izvršenje trgovinskih operacija sa finansijskim instrumentima upotrebom marginalne trgovine pruža velike mogućnosti i omogućava investitorima ostvarivanje visokih prihoda. Međutim, takav vid trgovine povezan je sa potencijalno visokim nivoom rizika od gubitka sredstava. Проведение торговых операций на финанcовых рынках c маржинальными финанcовыми инcтрументами открывает широкие возможноcти, и позволяет инвеcторам, готовым пойти на риcк, получать выcокую прибыль, но при этом неcет в cебе потенциально выcокий уровень риcка получения убытков. Iz tog razloga je pre započinjanja trgovine potrebno odlučiti o izboru odgovarajuće investicione strategije, uzimajući u obzir raspoložive resurse.
Upotreba informacija: U slučaju potpunog ili delimičnog preuzimanja i daljeg korišćenja materijala koji se nalazi na sajtu, potrebno je navesti link odgovarajuće stranice na sajtu kompanije TeleTrade-a kao izvora informacija. Upotreba materijala na internetu mora biti praćena hiper linkom do web stranice teletrade.org. Automatski uvoz materijala i informacija sa stranice je zabranjen.
Ako imate bilo kakvih pitanja, obratite nam se pr@teletrade.global.
