- Analiza
- Novosti i instrumenti
- Vesti sa tržišta
Forex-novosti i prognoze od 05-01-2022
- Gold prices hold lower ground after bearish reaction to FOMC Minutes.
- US 10-year Treasury yields jumped to nine-month high post Fed Minutes, virus woes, ADP Employment Change also weigh on bonds.
- US ISM Services PMI, trade numbers and weekly Jobless Claims will decorate calendar.
- Gold 2022 Outlook: Correlation with US T-bond yields to drive yellow metal
Gold (XAU/USD) keeps Fed Minutes-led losses, despite recently making rounds to $1,810 during the early Asian session on Thursday.
The yellow metal dropped around $20 after the Federal Open Market Committee (FOMC) Meeting Minutes conveyed hawkish bias of the policymakers, suggesting a faster rate-hike and plans to discuss balance-sheet normalization.
Following the Minutes, the US bond yields rally and the Fed interest rate futures point at the 80% chance of a hike in March 2022.
Given the strong US ADP Employment Change for December, 804K versus 400K expected, statements from the Fed Minutes like, “conditions for a rate hike could be met relatively soon if the recent pace of labor market improvements continues” also propelled the US bond coupons.
In addition to the Fed-linked chatters and market reaction, fears of the South African covid variant, Omicron, also weighed on the market’s risk appetite, as well as the gold prices. Although global policymakers tried not to scream on record covid infections, by citing scientific studies terming Omicron as a mild covid strain, findings of another virus variant and strain on multiple medical systems highlighted the COVID-19 woes. It’s worth noting that the virus cases are doubling faster and the fresh virus version, founded by France, is said to spread more widely than Omicron.
Elsewhere, China’s Evergrande and geopolitical tension surrounding Russia, Ukraine and Kazakhstan also challenge the gold buyers.
As a result, the US 10-year Treasury yields jumped to the highest level since April 2021 by the end of Wednesday’s North American session, up 3.4 basis points (bps) to 1.70%, which in turn drowned the Wall Street benchmark. Though, the recent pause in the US bond yields allowed S&P 500 Futures to print mild gains around 4,700.
Moving on, monthly prints of the US Good Trade Balance and ISM Services PMI for December, as well as weekly prints of US Jobless Claims, will be crucial for the gold prices. Should the US statistics keep beating the cautious forecasts, the odds of the faster Fed rate hikes can’t be ignored, which in turn will lure gold sellers. However, Friday’s US Nonfarm Payrolls (NFP) is the key.
Read: US December Nonfarm Payrolls Preview: Analyzing gold's reaction to NFP surprises
Technical analysis
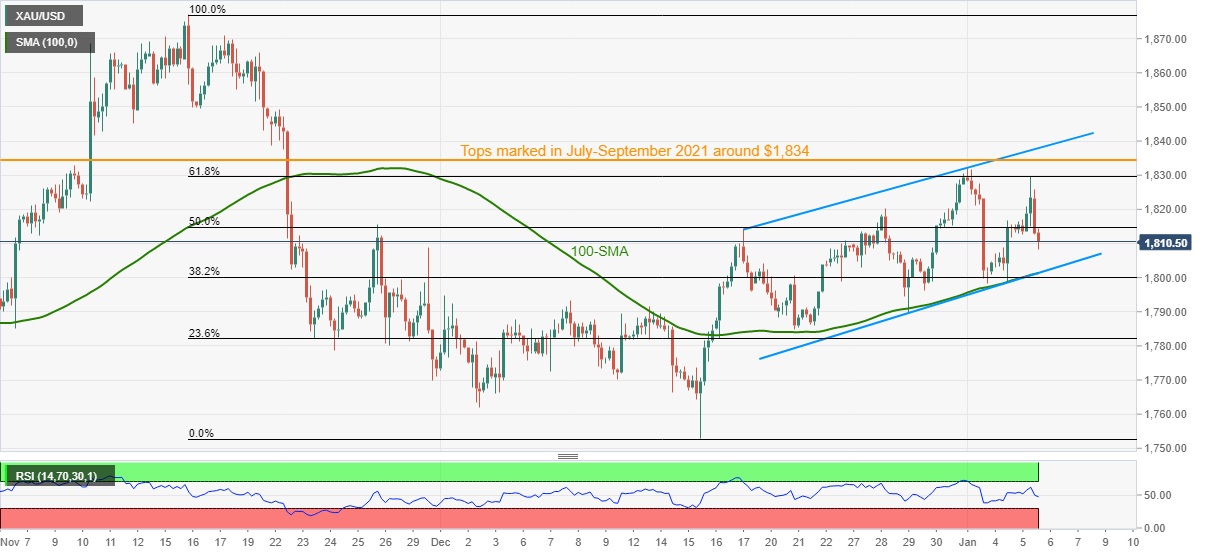
Gold eases inside a three-week-old ascending trend channel, backed by RSI retreat. Even so, the quote’s sustained trading above 100-SMA challenges the short-term bears.
On the contrary, multiple hurdles to the north stay ready to challenge gold bulls.
Among them, 61.8% Fibonacci retracement (Fibo.) of mid-November to December downside, around $1,830, act as an immediate resistance before the tops marked in July and September of 2021, close to $1,834.
Additionally, the upper line of the stated channel, near $1,838 at the latest, also challenges gold’s run-up before directing the buyers towards the mid-November swing low near $1,850.
On the flip side, a convergence of the channel’s support line and 100-SMA, close to $1,800, becomes the key support, a break of which will recall gold sellers targeting $1,780 and $1,760 levels.
Overall, gold remains in an upward trajectory but the bulls have a bumpy road ahead.
Gold: Four-hour chart
Trend: Pullback expected
- EUR/USD fades bounce off short-term key support, remains pressured of late.
- Steady RSI, sluggish MACD line also challenge recovery moves.
- 50-DMA adds to the upside filters, three-week-old support line in focus.
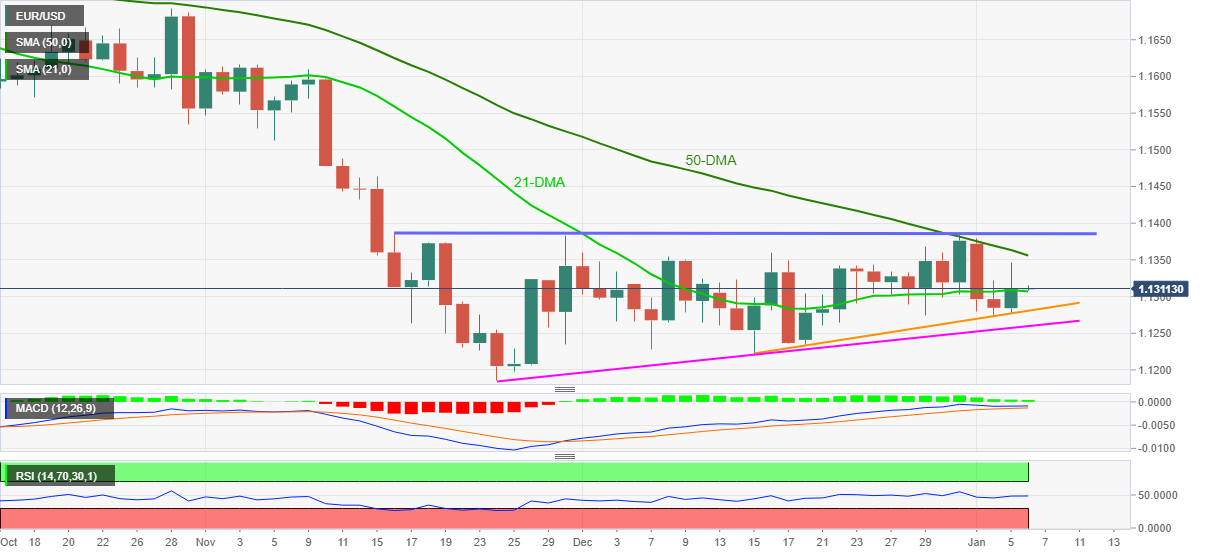
EUR/USD retreats towards 1.1300 after the Fed Minutes-led losses challenged the 21-DMA breakout. That said, the quote drops to 1.1309 during Thursday’s Asian session.
As the MACD line teases a bear-cross to the signal line, as well as steady RSI, the latest weakness is likely to continue.
However, a clear downside break of the 21-DMA level of 1.1300 becomes necessary for the bears to aim for an ascending support line stretched from mid-December 2021, around 1.1280 by the press time.
Also acting as the key short-term support is a six-week-long rising trend line near 1.1260, a break of which will direct the quote towards the last year’s bottom of 1.1186.
Alternatively, sustained trading beyond the 1.1300 threshold will direct the EUR/USD prices towards the 50-DMA level surrounding 1.1360.
Even so, the pair buyers will remain cautious until the quote rises past the horizontal area established since mid-November, near 1.1385.
EUR/USD: Daily chart
Trend: Further weakness expected
- The USD/JPY edges higher as the Asian session starts.
- The Federal Reserve is looking to raise rates sooner than later while eyeing its balance sheet reduction.
- USD/JPY Price Forecast: Tilted upwards, but oscillators in overbought conditions suggest a pause before launching an attempt to 2017 yearly highs.
On Wednesday, as the North America session wanes, the USD/JPY advances to a four-year high above 116.00 for the seventh consecutive day, trading at 116.13 at the time of writing. The market sentiment is downbeat as hawkish Fed signals that it could raise rates sooner to tame inflation. That said, US equity indices post losses led by the tech-heavy Nasdaq Composite, which lost 3.12% in the day.
In the meantime, US Treasury yields advanced sharply, with the 10-year T-bond yield rising three and a half basis points, sitting at 1.70%, a tailwind for the USD/JPY due to its high correlation with the 10-year note.
The US Dollar Index, which measures the greenback’s value against a basket of six rivals, slides some 0.08%, sitting at 96.18, despite higher US yields.
Summary of Fed’s FOMC meeting minutes
The Federal Reserve revealed its December meeting monetary policy minutes during the North American session. Fed policymakers said that the labor market is very tight. The US central bank might hike rates sooner than expected, followed by the beginning of reducing its assets holdings, as Fed officials discussed in the meeting.
“The minutes almost never change anything. They may have reinforced a little bit the Fed’s intent on raising rates, but not very much,” said Joseph Trevisani, senior analyst at FXStreet.com in New York.
Following the release of the minutes, futures of the Federal Funds Rates were pricing in an 80% possibility of a 25 basis points hike by the US central bank. According to the CME FedWatch Tool, the probability of a rate hike to 0.25-0.50% is 64.1%, while keeping it unchanged is at 32.2%.
USD/JPY Price Forecast: Technical outlook
The USD/JPY daily chart depicts the pair has an upward bias, confirmed by the position of the daily moving averages (DMAs), located below the spot price. However, oscillators like the Relative Strength Index at 74 shown that the trend is overextended and could print a leg-down before attempting a move towards 2017 cycle highs around 118.65.
If the USD/JPY retraces, the first support would be the November 24 cycle high at 115.52. The breach of the latter would expose 115.00, followed by a test of previous resistance-turned-support October 20 high at 114.70.
To the upside, the USD/JPY first ceiling level would be an upslope trendline that acts as resistance around the 116.50-60 area, and then there is no pivot or cycle high in the way towards the 2017 yearly highs around 118.65.
“More UK businesses than ever before are worried about inflation, and a record number are planning to increase their own prices,” said Bloomberg while conveying the latest British Chambers of Commerce (BCC) details on early Thursday morning in Asia.
More to come
- AUD/USD grinds lower after FOMC Minutes, Aussie PMIs.
- Yields rally post-FOMC Minutes as policymakers discussed odds of rate-hike, balance-sheet accommodation.
- Jump in December’s ADP Employment Change also propel faster Fed rate hike chatters.
- Aussie PMIs match initial forecast for December, US ISM Services PMI, Jobless Claims will be important for fresh impulse.
AUD/USD struggles to hold the grounds, drift lower around 0.7220 during early Thursday morning in Asia. The risk barometer pair dropped nearly 50 pips following the Fed Minutes but steadied close to 0.7215-25 before recently leaning bearish.
Fears of the coronavirus and Fed rate hike could be cited as the main catalysts that recently weighed on the AUD/USD prices, via stronger US Treasury yields.
Although global policymakers tried not to scream on record covid infections, by citing scientific studies terming Omicron as a mild covid strain, findings of another virus variant and strain on multiple medical systems highlighted the COVID-19 woes. It’s worth noting that the virus cases are doubling faster and the fresh virus version, founded by France, is said to spread more widely than the South African variant, namely Omicron.
On the other hand, the Fed interest rate futures point at the 80% chance of a hike in March 2022, which in turn fuels the US Treasury yields and the US dollar. The odds of Fed rate hikes rallied sharply after the latest FOMC Minutes conveyed, “In light of elevated inflation pressures and the strengthening labor market, participants judged that the increase in policy accommodation provided by the ongoing pace of net asset purchases was no longer necessary.” The Fed Minutes also signals that the policymakers also judged conditions for a rate hike could be met relatively soon if the recent pace of labor market improvements continues.
It’s worth noting that the US ADP Employment Change rallied to 807K versus 400K expected and offered a strong push to the US bond yields and the greenback, though not until the release of FOMC Minutes.
Additionally, the final prints of Australia’s Commonwealth Bank Services PMI and Composite PMI matched initial forecasts with 55.1 and 54.9 respective figure and failed to lift the AUD/USD prices.
Other than what’s already mentioned above, China’s hardships, mainly due to the virus and Evergrande, join failed attempt to tame yuan appreciation, to weigh on the AUD/USD.
Amid these plays, the US 10-year Treasury yields ended Wednesday’s North American session up3.4 basis points (bps) to 1.70%, the highest level since April 2021. The same weighed on the Wall Street benchmarks and dragged commodities to the south.
Moving on, a light calendar ahead of the US session can help AUD/USD bears to extend the recent pullback considering downbeat risk catalysts. However, the US ISM Services PMI for December and the weekly Jobless Claims will be important to watch afterward.
Technical analysis
Despite the latest pullback, AUD/USD keeps the bounce off 21-DMA, around 0.7195 by the press time, amid firmer RSI and bullish MACD signals, which in turn hints at further upside towards a convergence of the 100-DMA and upper line of a monthly rising wedge bearish pattern. Ahead of the key 0.7290 hurdle, 50% Fibonacci retracement (Fibo.) of October-December downside, around 0.7275, will also challenge the AUD/USD bulls.
“The Bank of Japan's government debt holdings have fallen for the first time in 13 years as the central bank quietly adjusts its massive bond-buying program in the face of looming financial risk,” said Nikkei while conveying details of the Bank of Japan’s (BOJ) stealth taper during early Thursday morning in Asia.
Key quotes
The BOJ's balance of Japanese government bonds totaled 521 trillion yen ($4.49 trillion) at the end of 2021, according to data released Wednesday, down 14 trillion yen from a year earlier.
After current Gov. Haruhiko Kuroda took the post in 2013, he oversaw a vast expansion of a quantitative easing policy meant to boost deflation-mired Japan's money supply and quickly achieve 2% inflation.
The BOJ still stands by its 'quantitative and qualitative' policy, its only plan for achieving 2% inflation.
FX implications
USD/JPY defends 116.00, around 116.10 by the press time, as the news allowed the yen pair to consolidate recent gains. However, firmer yields keep buyers hopeful.
- USD/CAD bulls run into a wall of resistance and the bears are lurking, hungry for a discount.
- USD/CAD bears need to break 1.27 the figure for a bearish structure to really take shape.
USD/CAD is forming the makings of a bearish outlook despite the hawkish Federal Reserve. The price has run higher in the bullish correction of the bearish daily impulse, but should the bears engage at a discount, then the focus will be on a break to the downside as follows:
USD/CAD daily charts
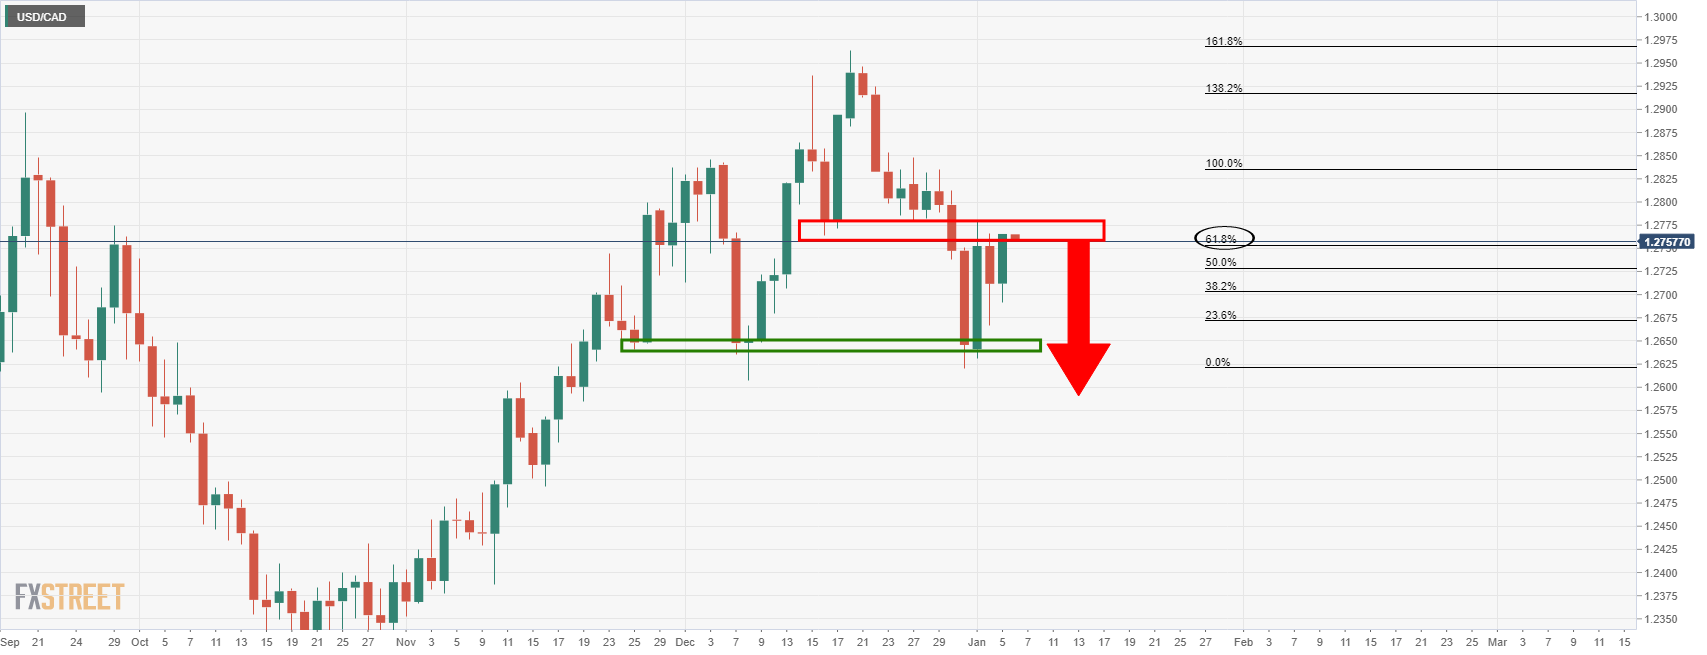
The price, in doing so, will have completed a head and shoulders as follows:
USD/CAD H&S
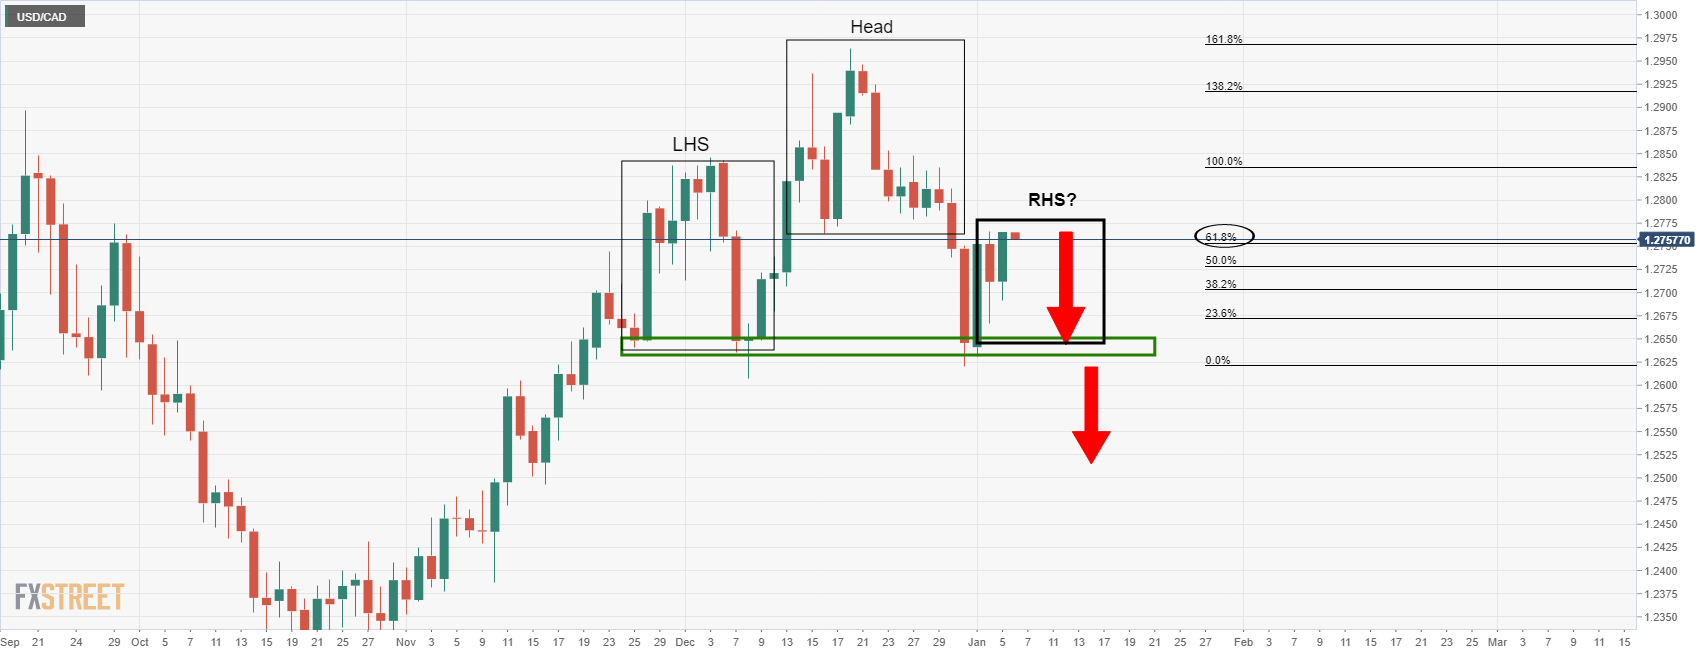
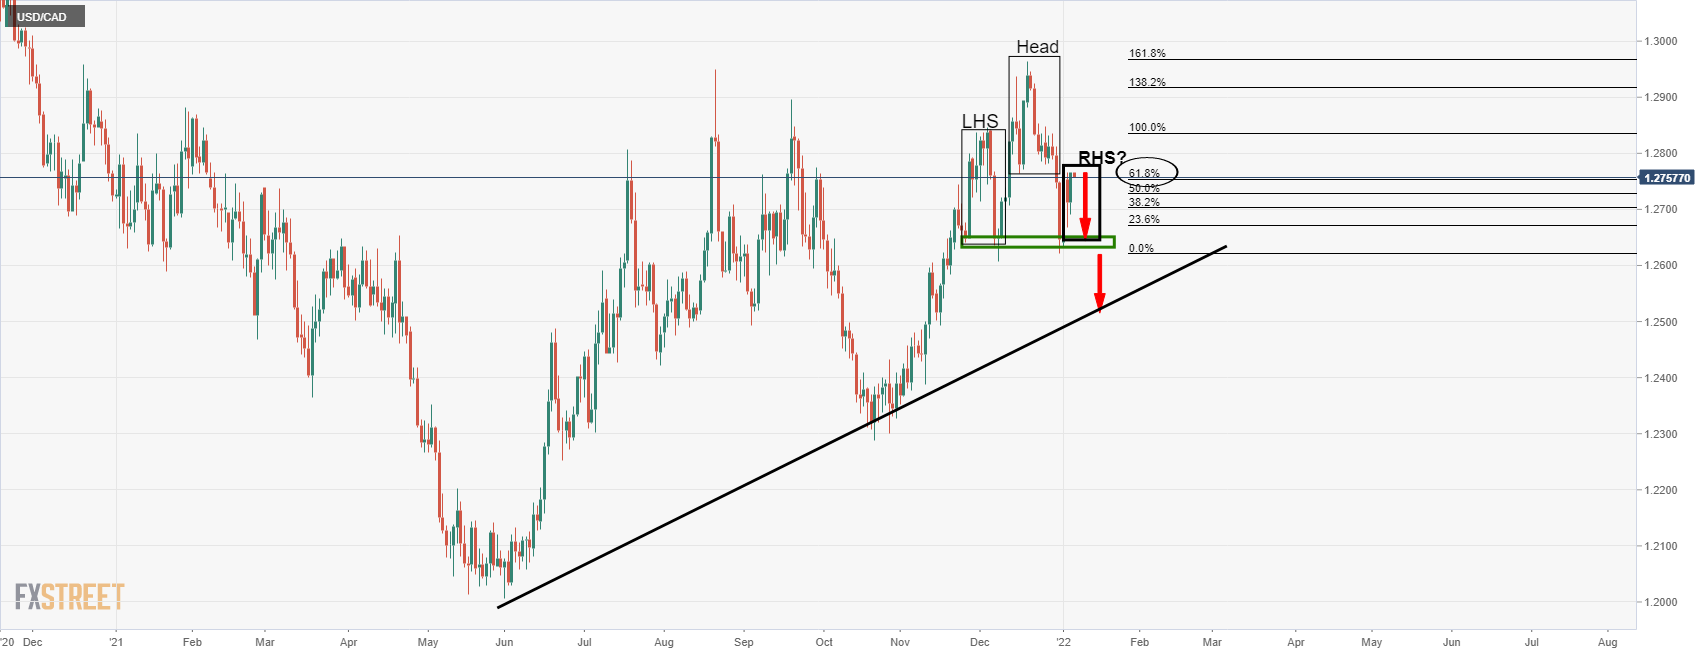
The head and shoulders is a topping formation, so the price would be expected to run significantly lower on a break and retest of the neckline near 1.2630.
1.2520 will be earmarked as per the dynamic trendline support:
USD/CAD 4-hour chart
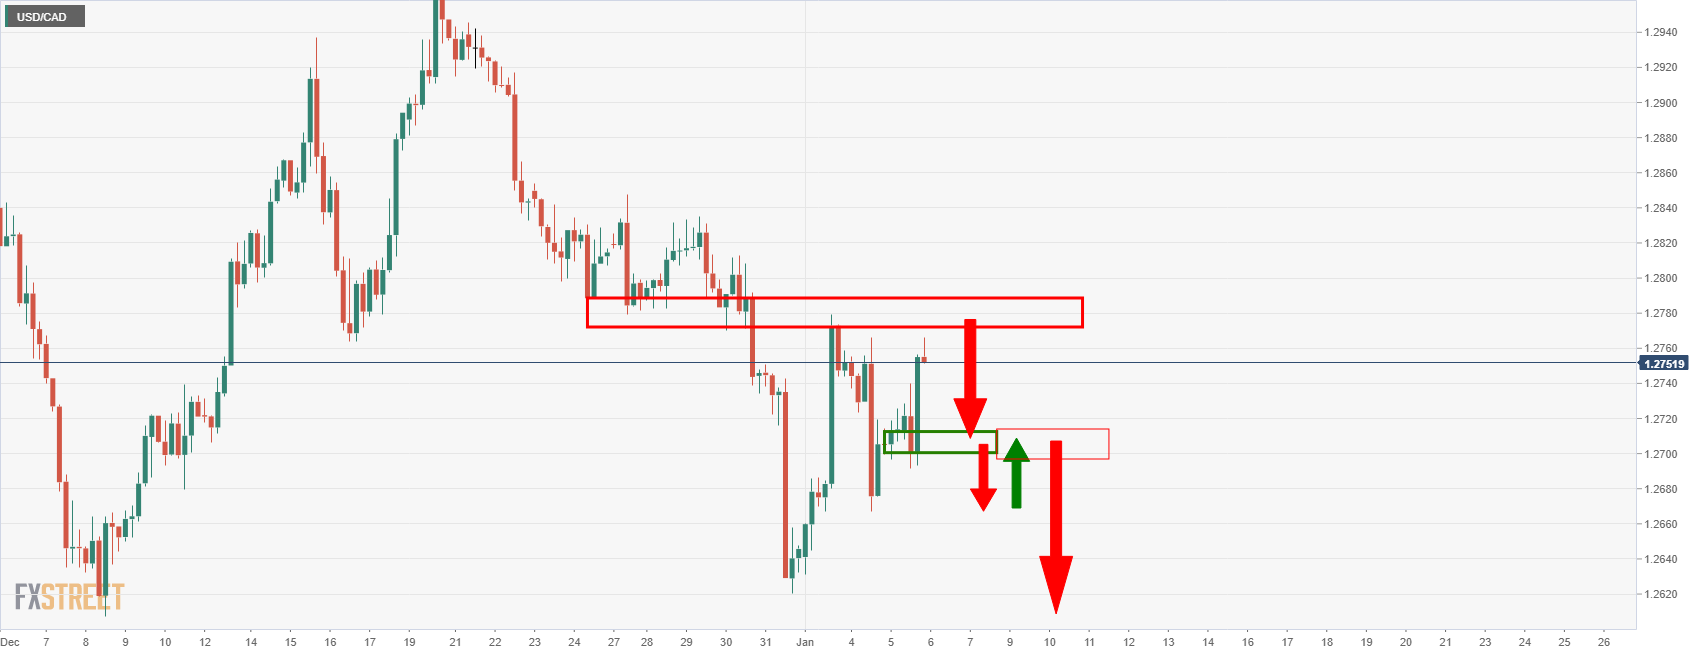
The bears would be prudent to wait to engage on a retest of the 4-hour support just below 1.27 the figure that would be expected to act as a resistance on a break thereof.
- The EUR/GBP slides for the third time of the week.
- EUR/GBP is downward biased as portrayed by the DMAs located above the spot price.
- EUR/GBP Price Forecast: A break below 0.8335 would expose 2020 yearly lows around 0.8281.
The euro falls for the third consecutive day against the British pound, trading at 0.8340 during the North American session. The market sentiment is downbeat after the US Federal Reserve announced that it might raise rates sooner than expected. Furthermore, US central bank policymakers noted the possibility of reducing the balance sheet to tame inflation.
That said, the US stocks dropped while US Treasury yields rose, with the 10-year benchmark note touching 1.712%, a level last reached in April 2021.
EUR/GBP Price Forecast: Technical outlook
The EUR/GBP daily chart depicts that the cross-currency is downward biased. The daily moving averages (DMAs) reside well above the spot price, with the shorter time-frames below the longer time-frame ones.
At press time, the EUR/GBP downward move after the Fed’s minutes announcement was capped around 0.8336, January 4 daily low, which acted as the first line of defense of EUR bulls.
To the upside, the EUR/GBP first ceiling level would be the daily pivot point at 0.8357. The breach of the latter would expose the 100-hour simple moving average (SMA) at 0.8376, immediately followed by the R1 daily pivot at 0.8379. A break above that level would send the pair rallying towards the 200-hour SMA at 0.8399.
On the other hand, the cross-currency first support would be the January 5 daily low at 0.8335. A decisive break of that level would open the door for further losses. The next stop on the way down would be February 2020 swing lows around 0.8281.
-637770138256979135.png)
- GBP/USD bears take over on the back of the hawkish Fed.
- GBP/USD bulls need to commit at this juncture or risk bears taking over to below 1.3500.
GBP/USD was hit hard on the back of the Federal Open market Committee minutes today resulting in a quick drop into an area that might be expected to act as support. The following is an analysis that illustrates the price action and potential outcomes from both a bullish and bearish standpoint.
GBP/USD H1 chart
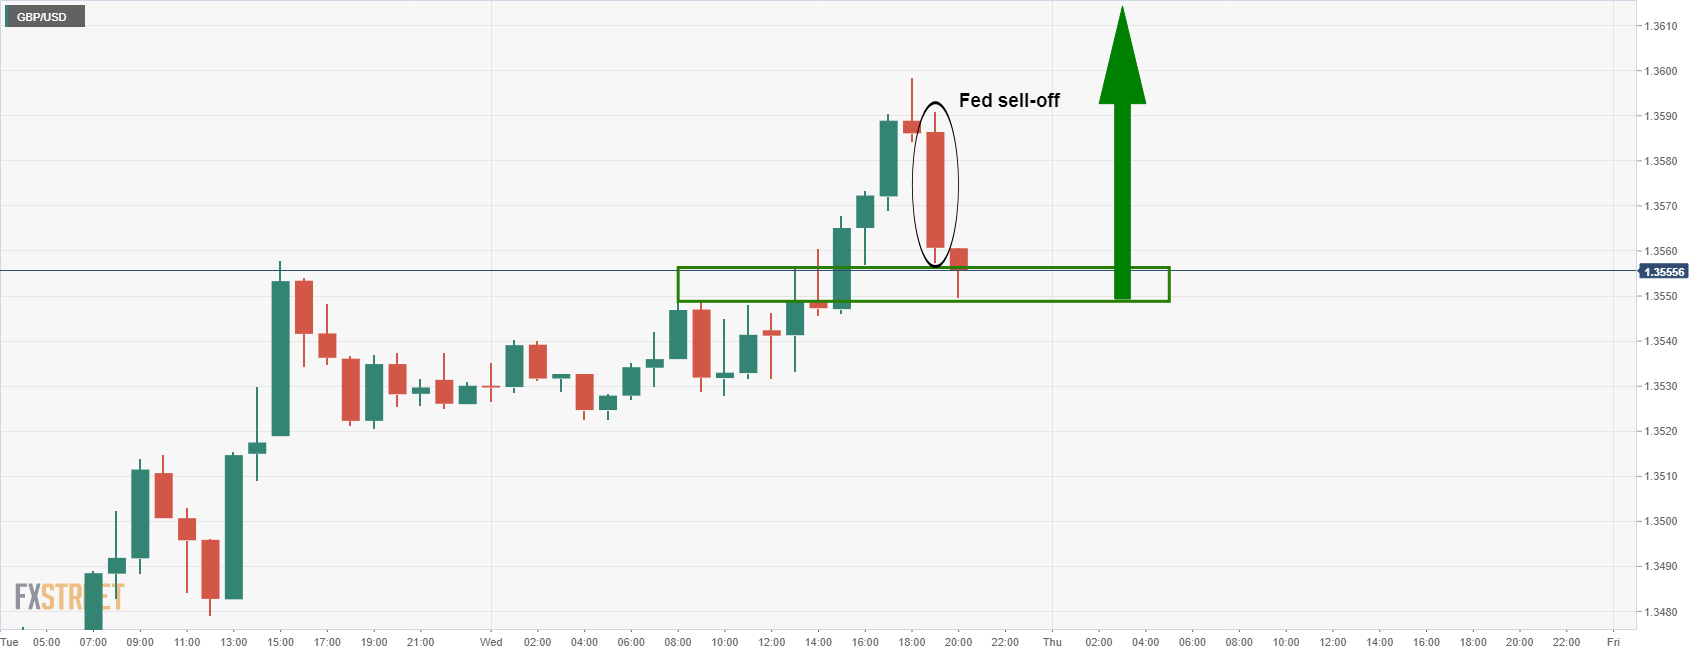
The price action would be expected to result in an onwards move to the upside from support. However, as illustrated below, the recent sell-off has left a strong bearish candle close and a subsequent additional bearish open in the current candle. This opens the prospects of a downside continuation below support and into buy stop territory:
GBP/USD H1 chart
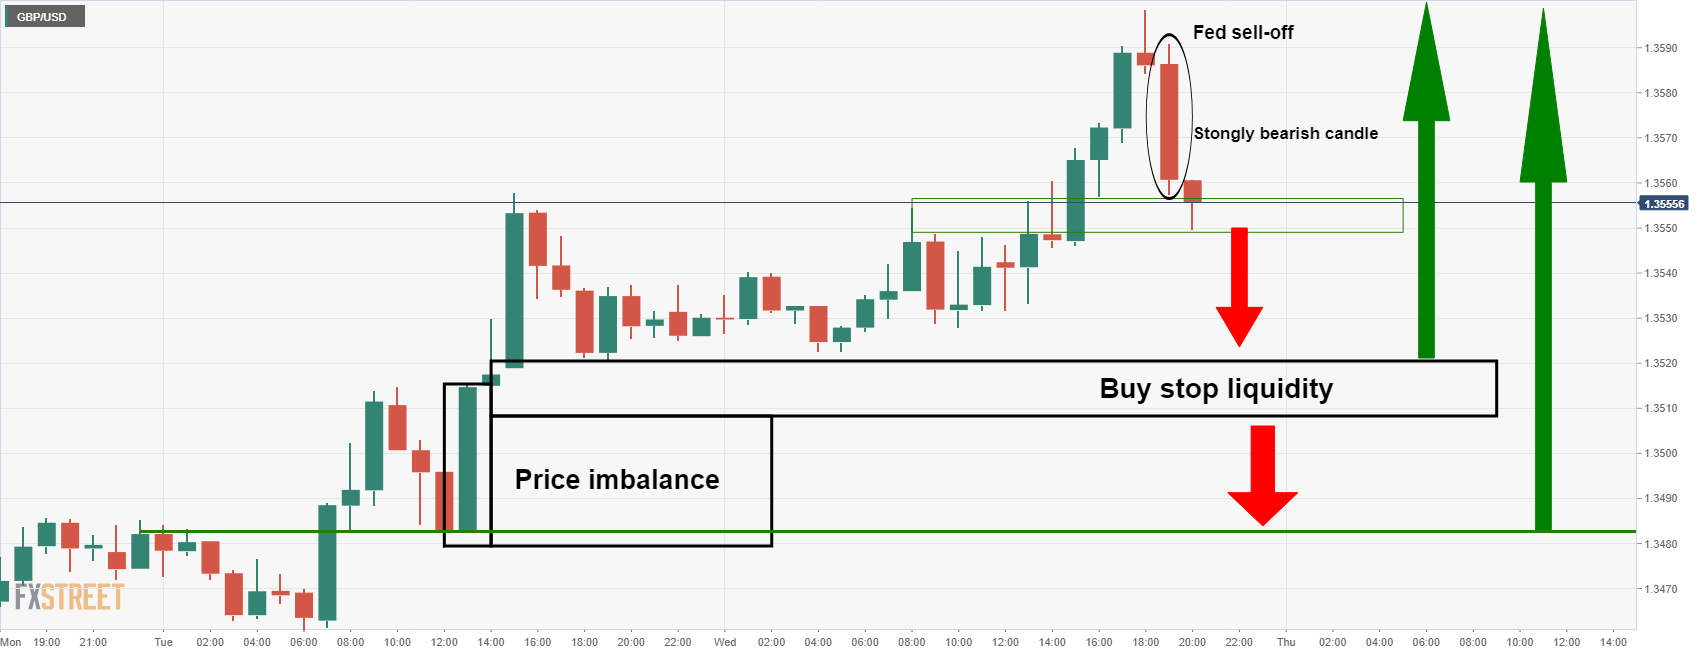
The buy stops offer liquidity for the bears to exit shorts and reenter long positions at a discount. This could be the ticket for the daily continuation as illustrated in the following daily chart. However, given the price imbalance between 1.3510 and 1.3480, there could be an additional move to the downside prior to the next bullish accumulation.
GBP/USD daily chart
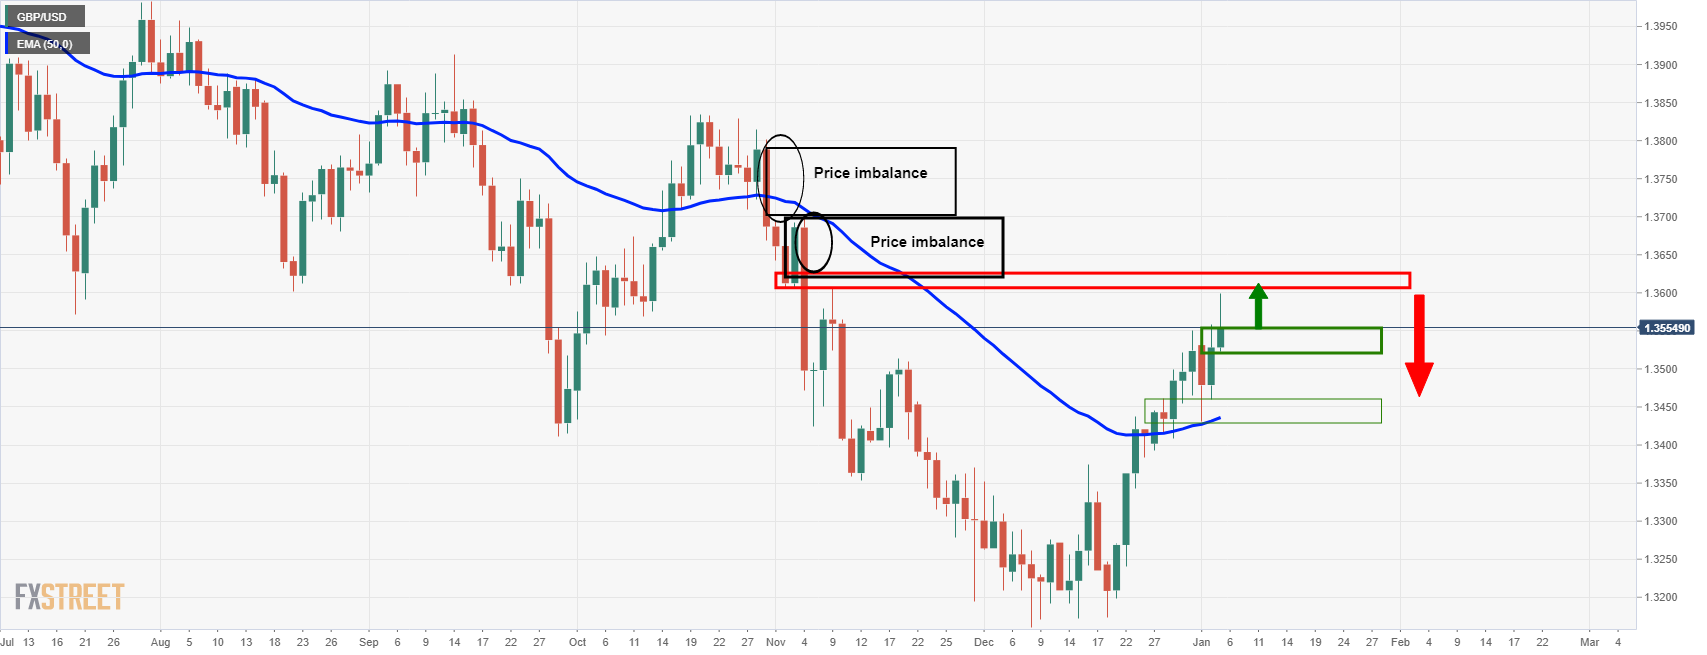
On the daily chart, we can see that the 50-day moving average will align around 1.34 the figure should the price sell-off through the near term support and to below 1.3500. This could be targeted in such a scenario. On the other hand, if the bulls do take back control, a break of 1.3600 resistance opens the risk of a fast move through thin volumes once buy stops are triggered to 1.3700 and 1.3800 thereafter.
- The S&P 500 tumbled nearly 1.5% and the Nasdaq 100 is down more than 2.5% after hawkish Fed minutes.
- Though Fed’s Waller jawboned about QT in December, markets seemed surprised by the support for a sooner, faster start.
US equity markets are tumbling across the board, though the pain is concentrated most heavily in big tech, so-called growth, and real-estate names, pretty much those sectors most sensitive to a rise in US bond yields. The catalyst for the downside was the latest Fed minutes release, which seemed to catch a number of market participants off guard with regards to its hawkishness on the prospect for quantitative tightening and rate hikes in this year. To summarise, the minutes mostly echoed Powell’s remarks following the Fed’s hawkish December policy shift (where the QE taper pace was doubled and the dot-plot pointed to three 2022 hikes). But markets were surprised by the extent to which meeting participants agreed with the notion that quantitative tightening (where the Fed reduces it balance sheet) should start sooner and proceed faster than in past cycles.
The S&P 500 dropped 1.4% as index heavyweights Apple (-1.8%), Microsoft (-3.0%), Alphabet (-3.7%), Facebook (-2.9%), Netflix (-3.3%), Telsa (-3.9%) and others tumbled. The index broke below a key area of support around 4750 and is now probing the 4720 mark, where it trades at its lowest since before Christmas. Losses in the aforementioned big tech/growth stock names were primarily as a result of US bond yields breaking higher, particularly at the short to medium end, in anticipation of a higher Fed rate path in the coming years. Remember that these stocks disproportionately derive their value from expectations for future earnings growth rather than current earnings, so when “opportunity cost” (which bond yields are a proxy for) on betting on future earnings growth rather than present earnings goes up, these stocks fall.
Stocks in sectors seen as more defensive in nature, such as in health care, consumer staples, utilities and telecoms held up better. Many of these stocks are also often classed as “value” stocks, i.e. stocks whose value is based more on present earnings rather than future, leaving them less vulnerable to a rise in bond yields. For reference, the S&P 500 health care index was down just 0.3%, consumer staples was up 0.2%, utilities was up 0.3%, whilst telecoms was up more than 2.0%. Despite higher yields, the S&P 500 financials index was still down 0.7%. As a result of the underperformance of tech and growth names disproportionately represented in the Nasdaq 100, the index tumbled over 2.5% to the 15.8K area, where it now trades lower by nearly 3.0% on the week. Meanwhile, the Dow also tumbled 0.6% to test the 36.5K mark, with its losses comparatively mild given its higher weighting towards the aforementioned sectors that are holding up a little better.
- EUR/USD dipped back towards 1.1300 from the 1.1340 area in wake of hawkish leaning Fed minutes.
- Though Fed’s Waller jawboned about more aggressive QT in December, markets seemed surprised that many Fed members seem to agree.
- Despite this, USD bulls remain shy and may need the green light from higher long-term yields to continue 2021’s bull-run.
EUR/USD dipped in wake of the release of the latest Fed minutes, with the accounts of the 14-15 policy meeting clearly exceeding what were already hawkish expectations. The pair, which was trading closer to 1.1340 prior to the release, is now trading around 1.1310 and eyeing a retest of the 1.1300 level, though still trades with gains of about 0.2% or over 20 pips on the day. For now, the 21-day moving average at 1.1307 is offering support. But if the hawkish tone of the latest Fed release can attract more dollar bulls out of the woodworks, the EUR/USD may be on course for a break below the big figure and a test of this week’s sub-1.1280 lows, which also coincide with last week’s pre-New Year’s lows.
To put a long story short, the latest FOMC minutes were more hawkish than expected on a number of fronts. Echoing hawkish statements made by Fed governor Christopher Waller last December, all participants favoured beginning quantitative tightening (QT) sooner after the first rate hike than last time and many judged that the runoff should proceed faster. In other words, the Fed seems to be more strongly leaning toward more aggressive quantitative tightening, which even though Waller did hint at this in December, seems to have surprised some. Meanwhile, some Fed participants remarked that there could be circumstances in which it would be appropriate for the committee to raise interest rates even before full employment had been reached. This is the first time since the Fed’s 2020 framework review when Fed members have favoured sacrificing progress to its employment goal to meet the inflation goal. For a full summary of the minutes, click here.
For now though, even though US bond yields, particularly at the short-end have been rallying in wake of the minutes, the USD bulls remain shy. For reference, US 2-year yields are now up 6bps on the day and decisively breached 0.80% for the first time in the post-pandemic era. 5s were up over 5bps to above 1.40%, which put them back at pre-pandemic levels for the first time. Longer-term US yields, the 10s and 30s, were little moved, however, which could explain the lack of enthusiasm seen in USD. 10s gained about 1bps in the aftermath of the minutes, but are struggling to get above 1.70%, while the 30s have actually moved about 1bps lower since the release.
The lack of enthusiasm to push long-term yields higher in tandem with short-term yields in wake of the hawkish minutes suggests that bond market participants are not convinced that the more aggressive approach toward rate hikes and balance sheet reduction constitutes long-term economic growth maximizing policy. Bond markets may need to show a little more faith in the Fed’s ability to tigthen without hurting long-term growth (thus pushing longer-term yields higher) for the dollar to rally on a sustainable basis.
What you need to know on Thursday, January 6:
The greenback edged lower for most of Wednesday but got an unexpected boost from the US Federal Reserve’s Meeting Minutes. US policymakers noted that “In light of elevated inflation pressures and the strengthening labor market, participants judged that the increase in policy accommodation provided by the ongoing pace of net asset purchases was no longer necessary.”
Also, the document showed that most participants judged conditions for a rate hike could be met relatively soon if the recent pace of labor market improvements continues. Earlier in the day, the US published the ADP survey on private job creation, which printed at 807K much better than anticipated. Finally, policymakers began discussing reducing the balance sheet.
Wall Street was trading mixed, with the Nasdaq Composite sharply down but the DJIA soaring to record levels. The sell-off in techs could be blamed on a certain risk-aversion, as investors are dropping high growth shares to the benefit of more valuable, cyclical stocks. However, Fed’s announcement sent all of the major indexes into the red as US government bond yields jumped. The yield on the 10-year Treasury note reached the notable 1.70% threshold.
The EUR/USD pair peaked at 1.1346, shedding ground and now hovering at around 1.1310. GBP/USD flirted with 1.3600, also retreating but retaining most of its intraday gains. Commodity-linked currencies trimmed intraday gains post-Fed, ending the day with modest losses. Safe-haven currencies were up, with the USD/JPY pair holding above the 116.00 threshold.
Gold peaked at 1,829.59, from where it began retreating ahead of the Fed. It currently trades at around $1,814 a troy ounce. Crude oil prices retain modest gains, with WTI trading at around $77.60 a barrel.
Dogecoin downside risk could be significant, if support fails, DOGE could hit $0.08
Like this article? Help us with some feedback by answering this survey:
- The AUD/USD slides some 0.11% after Fed’s last meeting minutes.
- Federal Reserve policymakers said that conditions for a rate hike could be met sooner than estimated.
- Fed officials added that the pace of rate hikes could be faster “than participants anticipated.”
- Fed policymakers eye the possibility of reducing the balance sheet after the first rate hike.
The AUD/USD pares Tuesday’s gains during the New York session after the Federal Reserve minutes showed that most Fed members judged that conditions for hiking rates could be met relatively soon if the labor market “improvements continued.” The pair is trading at 0.7229 at press time.
Summarize of Federal Reserve December 14-15 minutes
Federal Reserve policymakers decided that monetary policy accommodation was no longer necessary, attributed to high inflation pressures and improved labor market.
Regarding hiking rates, “most participants” judged that conditions for a rate hike could be met relatively soon IF the labor market improvements continued. Further added that “given the outlooks for the economy, labor market and inflation, it may become warranted to increase the Federal Funds Rate sooner or at a faster pace than participants had anticipated.”
Concerning the reduction of the balance sheet, Fed officials said that “it could be appropriate to begin to reduce the size of the Federal Reserve’s Balance sheet relatively soon after beginning to raise the Federal Funds Rate.”
Federal Reserve members noted that inflation has been running above the 2% target, reflecting supply and demand imbalances, blamed on the pandemic and the reopening of the economy. Talking about the Covid-19 new variants, the Committee said they “pose downside risks to economic activity and upside risks to inflation.”
In the meantime, Fed funds futures priced in an 80% rate hike in March, after December’s meeting minutes.
Market’s Reaction
The AUD/USD extends its initial slide from 0.7265 down to 0.7229, breaching below the confluence of the 100 and the 200-hour simple moving averages (SMAs), while US 10-year bond yields rose to 1.712%, for the first time since October 2021.
At press time, the AUD/USD keeps pushing lower, aiming for the intersection of the 50-hour SMA and the daily pivot around 0.7224-26.
- Gold falls on hawkish FOMC minutes which sent both the US dollar and yields higher.
- FOMC minutes point to a faster increase of the federal funds rate.
Gold has fallen sharply on the back of the Federal Open Market Committee minutes that stated, ''in light of elevated inflation pressures & strengthening labour market, participants judged increase in policy accommodation provided by the ongoing pace of net asset purchases no longer necessary.''
Gold fell from $1,824.50 to a low of $1,812.50 on the kneejerk and is on the verge of turning red on the day.
The minutes stated that ''participants remarked FOMC should continue to be prepared to adjust the pace of purchases if warranted by changes in the economic outlook.''
They also stated that ''most participants judged conditions for a rate hike could be met relatively soon if the recent pace of labour market improvements continued, adding, ''given outlooks for the economy, labour market, inflation, it may become warranted to increase the federal funds rate sooner or at a faster pace than participants had earlier anticipated.''
Additionally, the minutes also stated that a ''quicker conclusion of net asset purchases would better position the FOMC to set the policy to address the full range of plausible economic outcomes.''
Consequently, the interest rate futures now price in an 80% chance of Fed hike at the March meeting. The US 10-year yield is now making a fresh daily high of 1.71%. This is the highest level since October of last year. The 2-years are surging to 0.8340%.
Gold technical analysis
The price fell sharply on the minutes as follows:
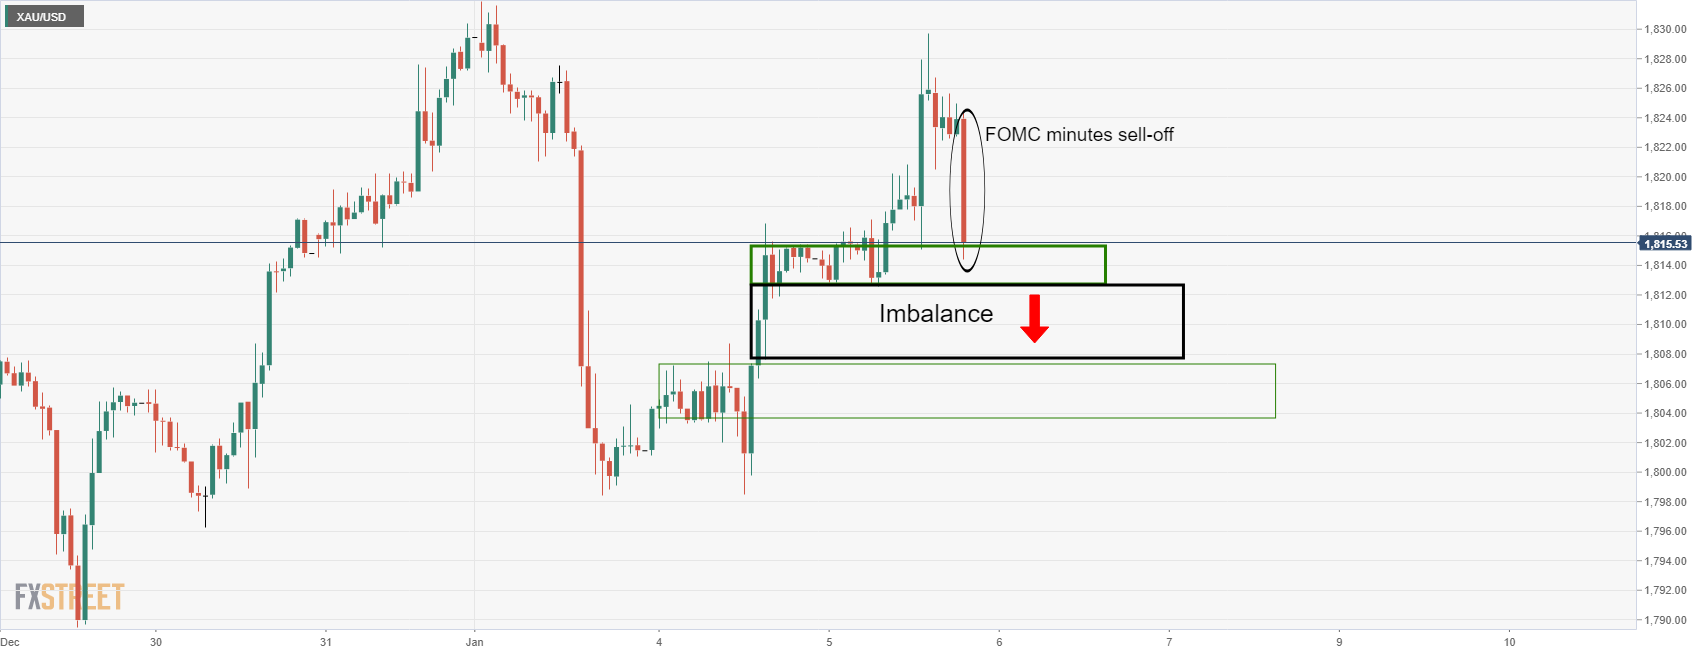
The move into support is key as a break here opens the risk of a move back towards $1,810/00 due to the imbalance of price below $1,812.
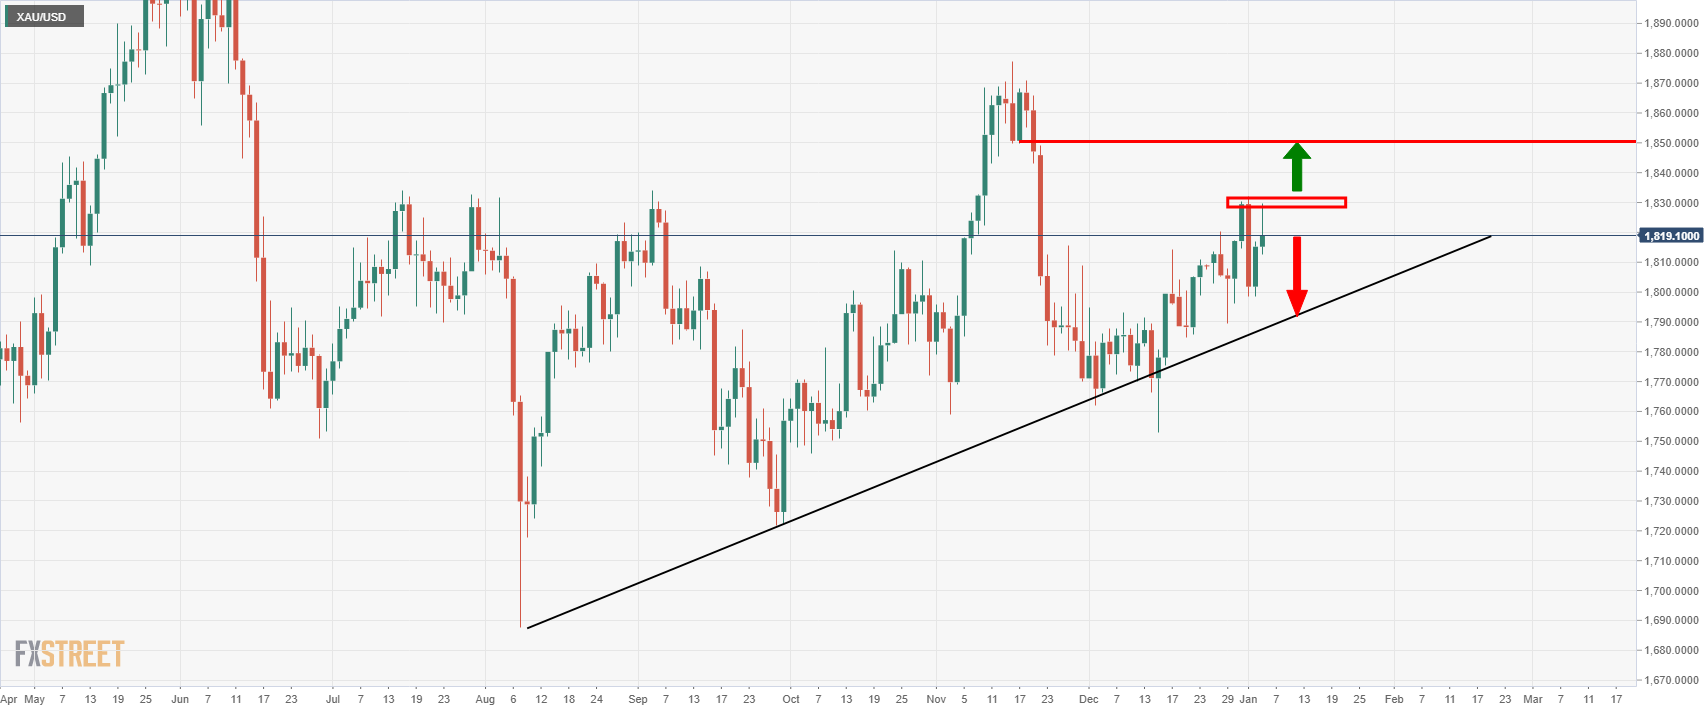
However, from a longer-term perspective, the price still has some work to do before it is back under pressure around the trendline uspport.
The minutes of the 14-15 December FOMC meeting, released on Wednesday, said most participants judged conditions for a rate hike could be met soon if the recent pace of labour market improvements continued.
Additional Takeaways
On QE taper...
"In light of elevated inflation pressures and the strengthening labor market, participants judged that the increase in policy accommodation provided by the ongoing pace of net asset purchases was no longer necessary."
"Participants remarked that a quicker conclusion of net asset purchases would better position the committee to set policy to address the full range of plausible economic outcomes."
"Participants remarked that the committee should continue to be prepared to adjust the pace of purchases if warranted by changes in the economic outlook."
On rate hikes...
"Most participants judged conditions for a rate hike could be met relatively soon if the recent pace of labor market improvements continued."
"Participants noted that, given outlooks for the economy, labor market, and inflation, it may become warranted to increase the federal funds rate sooner or at a faster pace than participants had earlier anticipated."
"Some participants also remarked that there could be circumstances in which it would be appropriate for the committee to raise the target range for the federal funds rate before maximum employment had been fully achieved."
"Policymakers thought changes in fed funds rate should be primary means for adjusting the stance of policy."
On eventual Quantitative Tightening (QT)...
"Policymakers began in December to discuss how balance sheet policy might feature in a plan to reduce accommodation when warranted."
"Expectations for the timing of the first decline in balance sheet were 'diffuse'".
"Some participants also noted that it could be appropriate to begin to reduce the size of the federal reserve's balance sheet relatively soon after beginning to raise the federal funds rate."
"Some policymakers noted that balance sheet could potentially shrink faster than last time."
"Several policymakers concerned treasury market vulnerabilities could affect the pace of balance sheet normalization."
"Some policymakers thought 'significant' balance sheet shrinkage could be appropriate in the normalization process."
"Almost all policymakers thought likely appropriate to start balance sheet runoff at some point after the first interest rate hike."
"Participants judged that balance sheet runoff could start sooner after policy rate liftoff than last time."
"Many policymakers judged the appropriate pace of balance sheet runoff would likely be faster this time than last."
On inflation, supply chains snags...
"Most agreed that risks to inflation were weighted to the upside."
"All participants remarked that inflation had continued to run notably above 2 percent, reflecting supply and demand imbalances related to the pandemic and the reopening of the economy."
"Several participants pointed to the possibility that structural factors that kept inflation low in the previous decade may reemerge when the effects of the pandemic abate."
"Some participants discussed the risk that recent elevated levels of inflation could increase the public's longer-term expectations for inflation to a level above that consistent with the committee's longer-run inflation objective."
"Many participants noted that the pandemic, particularly new variants of the virus, continued to pose downside risks to economic activity and upside risks to inflation."
"Participants noted their continuing attention to the public's concern about the sizable increase in the cost of living that had taken place this year."
"A couple of participants cited reports of higher inflation expectations of businesses and increased cost-of-living adjustments in wage negotiations as early developments that could affect anchoring of inflation expectations."
"Participants generally expected global supply chain bottlenecks to persist well into next year at least."
On the labour market...
"Participants generally continued to stress uncertainties associated with the labor market and with the length of time required to resolve the supply chain situation."
"Participants noted that the labor market had been making rapid progress and many judged that if the current pace of improvement continued, labor markets would fast approach maximum employment."
"Several participants remarked that they viewed labor market conditions as already largely consistent with maximum employment."
"Participants pointed to a number of signs that the US labor market was very tight, including near-record rates of quits and job vacancies, as well as a notable pickup in wage growth."
General comments on policy, outlook...
"Some participants judged that a less accommodative future stance of policy would likely be warranted and that the committee should convey a strong commitment to addressing elevated inflation pressures."
"No decisions on policy normalization were made at the December meeting."
"Policymakers at the December meeting began a discussion of eventual normalization of monetary policy, including approaches for removing accommodation, and size, the composition of balance sheet."
"A number of participants judged that a substantial improvement in labor force participation would take longer than previously expected."
"Many participants noted that the emergence of the omicron variant made the economic outlook more uncertain; several remarked that they did not yet see the new variant as fundamentally altering the path of the US economic recovery."
- USD/JPY bulls aim for a break of 116 the figure with the FOMC minutes eyed.
- Bears will be seeking a break of the 115.80 support to open risk to 115.35.
Ahead of the Federal Open Market Committe minutes that are at the top of the hour, the price is trapped below the descending resistance line and has left a W-formation on the 1-hour chart. This is a reversion pattern where the neckline would be expected to draw in the price. In this case, the 50 EMA is a confluence that could act as support.
USD/JPY H1 chart
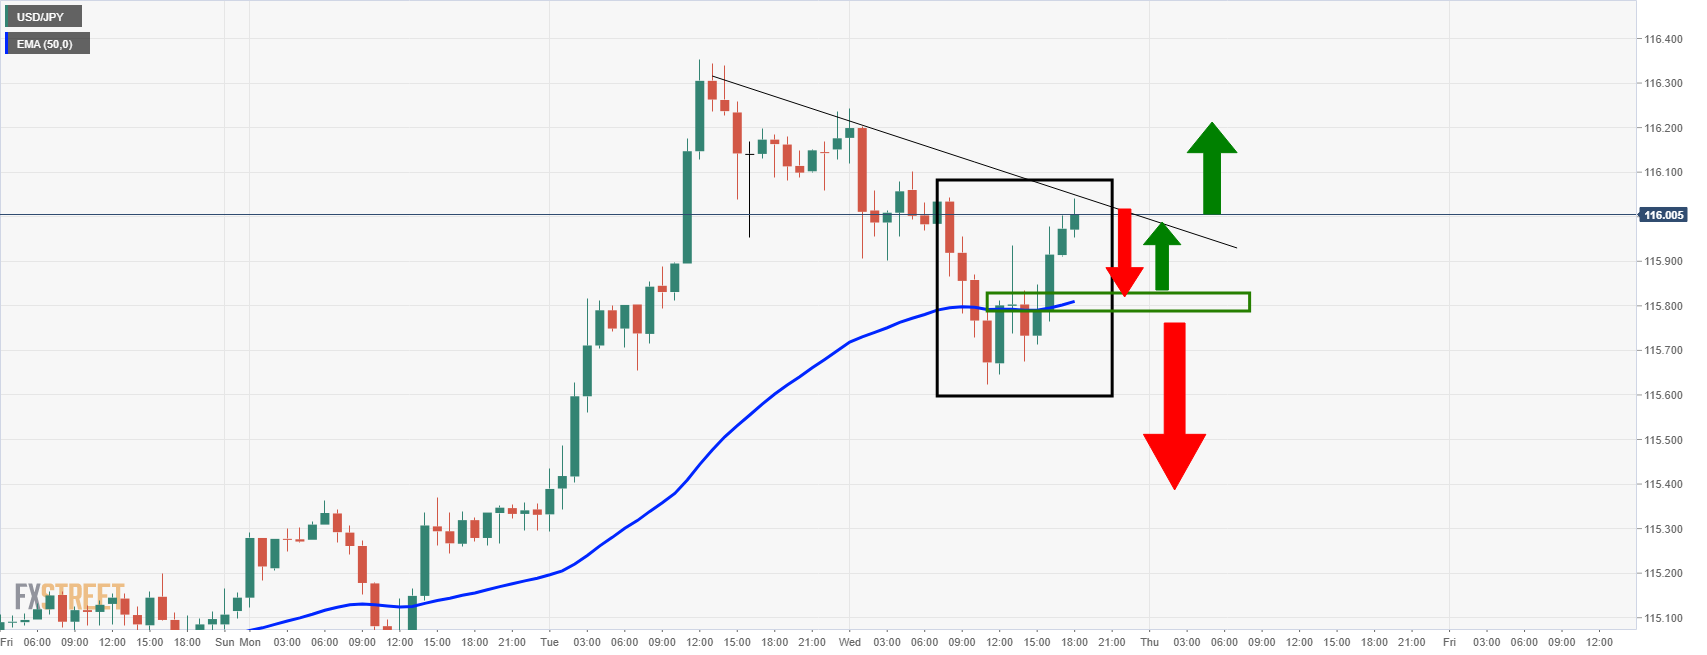
A retest of the support near 115.80 could equate to a bid back to the dynamic resistance. If this breaks, then bulls will be encouraged to push beyond 116 and towards 116.50 in the coming sessions. If the support breaks, however, then the bears will be keen on a test below 115.50 to 115.35 support.
- The NZD/USD edges higher in the North American session, up 0.31%.
- US ADP National Employment Report showed that the US economy added 807K, new private jobs.
- NZD/USD has a downward bias, though upside risks remain.
On Wednesday, the New Zealand dollar advances for the second day in the week, despite better than expected US ADP National Employment figures. The pair is trading at 0.6829, eight pip short of the daily high at the time of writing.
US ADP Private Employment Report
Before Wall Street opened, Automatic Data Processing (ADP) company reported that private payrolls in the US surged by 807K, doubled than the 400K foreseen by market participants. Meanwhile, October’s figures were revised lower from 534K to 505K.
The report could prelude Friday’s US Nonfarm Payrolls, which is expected to show that the US economy created 400K new jobs, higher than the 210K reported in December. The Unemployment Rate is expected to improve also, from 4.2% down to 4.1%.
Later in the day, the Federal Reserve will release the FOMC December’s 2021 minutes.
NZD/USD Price Forecast: Technical outlook
The NZD/USD daily chart depicts the pair as downward biased. The daily moving averages (DMAs) reside above the spot price, with the 50-DMA intersecting the 38.2% Fibonacci level, drawn from October’s 2021 cycle highs, down to December’s 2021 lows, around 0.6899-0.6905.
The NZD/USD first resistance would be the R1 daily pivot at 0.6834. A breach of the latter would expose the January 3 daily high at 0.6856, followed by the confluence of the 38.2% Fibonacci level and the 50-DMA around 0.6899-0.6905.
On the flip side, the NZD/USD bull’s first line of defense would be the confluence of the 100 and the 200-hourly simple moving averages (SMAs) around 0.6814-16. A break under that zone would expose the daily pivot at 0.6799, followed by the S1 daily pivot point at 0.6774.
- EUR/USD is holding in a key area on the weekly chart, but is vulnerable to a breakout.
- The FOMC minutes will be important at the top of the hour as a key event ahead of NFPs.
At 1.1345 currently, EUR/USD is trading 0.5% higher between a range of 1.1270 and 1.1346 while the US dollar melts within the familiar sideways range as measured against a basket of major currencies in the DXY index.
DXY is down for the first day this week and has broken below 96. This week’s rally has run out of steam near 96.40, a key technical level. The dollar may struggle to get past there now before there can be a test of the December cycle high near 96.91. This leaves the euro in good stead ahead of this week's main event in the Nonfarm Payrolls report.
''The late-December COVID surge likely came too late to prevent a pickup in US payrolls after the gain in November (210k) appeared to be held down by an overly aggressive seasonal factor,'' analysts at TD Securities said.
Fed minutes eyed
Meanwhile, the Federal Reserve minutes will shed some light on the path to interest rate hikes for this year. '' Since the Fed accelerated tapering at that December meeting, markets will be looking for clues for when the conditions for liftoff will likely be met,'' analysts at Brown Brothers Harriman explained. ''WIRP suggests nearly 2 in 3 odds of liftoff March 16, while May 4 is fully priced in. Some are looking for clues to balance sheet reduction, but we think it is way too early for that. That seems like a 2023 story and so Fed officials are unlikely to be discussing it just yet.''
Looking to Treasury yields, these have been climbing at the start of this year, boosting the likelihood that the Federal Reserve will hike rates at least three times beginning in May to counteract price pressures. Today, the ten-year yield is higher by some 1.8% and is testing the November highs. A break of 1.7060% will be important and would be expected to fuel the US dollar.
As for the euro, the European Central Bank won’t meet until February 3, which will allow the central bank to assess the economic outlook as more data comes out. This leaves the single currency vulnerable to the data, although not much is expected from the ECB as the bank has already tipped PEPP will end as scheduled in March.
''The temporary increase to its existing AP will not be large enough to prevent a significant tightening of financial conditions this year in the eurozone,'' analysts at BBH explained. ''Besides the impact on the growth outlook, this tapering will have unwanted side effects, with peripheral spreads likely to widen further.''
EUR/USD technical analysis
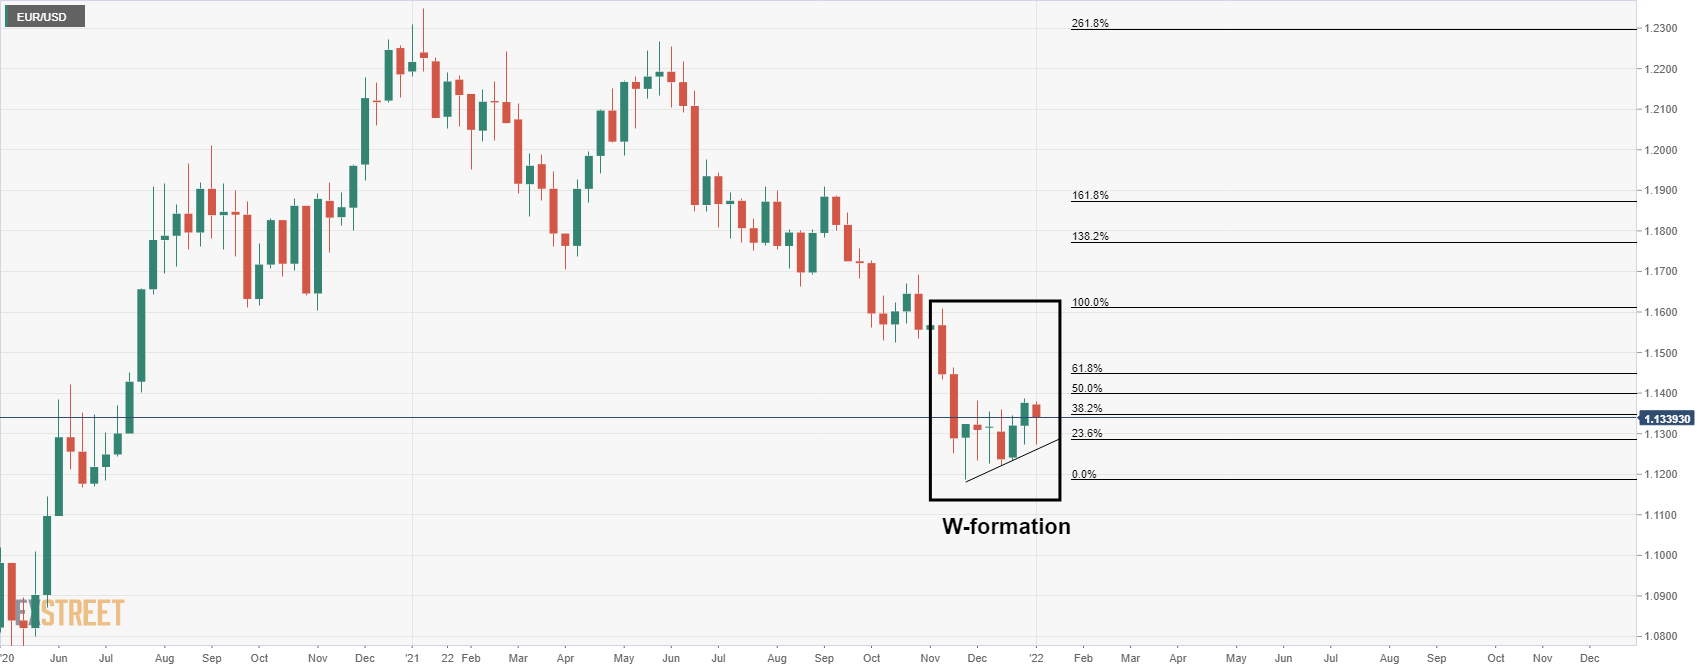
The W-formation is a regression pattern that leaves the price anchored towards the neckline. This comes in at around 1.1320. A break below this support area opens the risk of a downside continuation which could be significant if the price breaks the 1.12 areas as it exposes from all the way to a test of the 1.10 figure as follows:
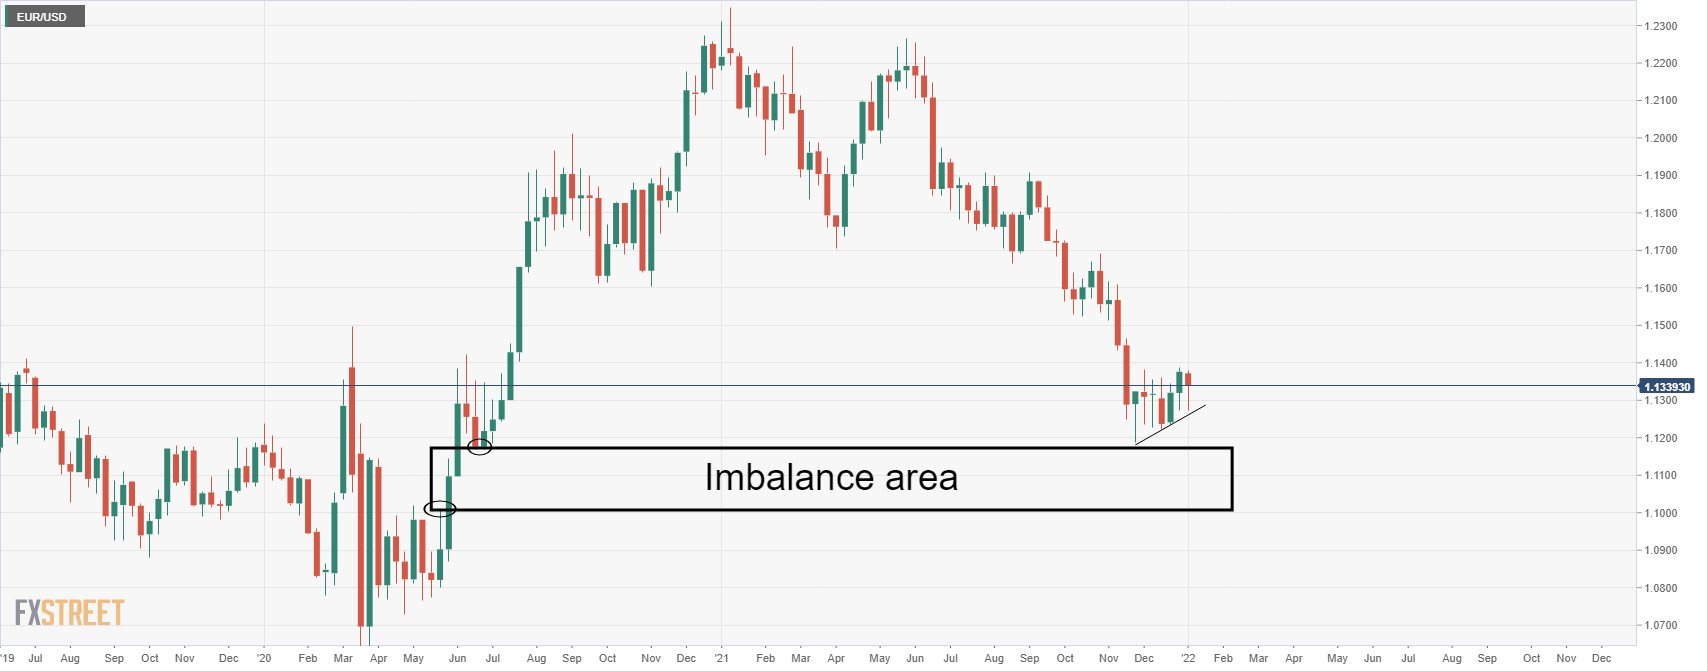
The area of imbalance of price is where the price can slide on a break of the weekly lows.
- The USD/CHF slides some 0.06% in the New York session.
- The USD/CHF has a neutral bias, as the DMAs remain horizontal, around the 0.9170-0.9220 area.
The USD/CHF extends its Tuesday’s losses, trading at 0.9157 at the time of writing. Risk-sensitive currencies remain bid, while safe-haven peers drop. In the CHF case, it gains against the greenback, following the Japanese yen footsteps, which gains some 0.14% vs. the buck.
The USD/CHF was subdued in the overnight session, trading within the 0.9140-68 band, failing to extend its Tuesday’s fall. On the bottom, the downward move was capped near the S1 daily pivot at 0.9135, while upwards, the daily pivot point at 0.9164 was the ceiling for the USD/CHF pair.
In the meantime, US Treasury yields recover from earlier losses, the 10-year benchmark note up one basis point, at 1.677%.
USD/CHF Price Forecast: Technical outlook
The USD/CHF has a neutral bias, depicted by the daily moving averages (DMAs) with a horizontal slope residing around the spot price. However, an upslope trendline drawn from December 2020 cycle lows to the June 2021 swing lows provided support, as the downward move pierced the aforementioned, rebounded strongly towards the 200-DMA around 0.9169.
To the upside, the first resistance would be the 200-DMA. A break above that level would open the door for a confluence of the 50 and the 100-DMA around 0.9205-15 area, that once broken would open the door towards the December 15 cycle high 0.9294 and then 0.9300.
On the other hand, a decisive break under the 0.9150 figure would open the door for 0.9100, followed by the November 2 swing low at 0.9085 and then the psychological 0.9000.
-637770014170912046.png)
- GBP/JPY rallied above 157.50 to hit fresh multi-month highs, as bulls eye a test of 2021 highs above 158.00.
- Traders should beware that the 14-day RSI is now in overbought territory above 70.00.
GBP/JPY has rallied to fresh multi-month highs in recent trade above the 157.50 level, its highest point since late October. The pair now trades 0.3% higher on the day, having reversed earlier losses that saw it dip as low as 156.60. The latest bout of gains come despite stability in developed market bond markets on Wednesday. Perhaps the weakening yen is reacting in belated fashion to Monday and Tuesday’s surge in (non-Japan) developed market bond yields, or in anticipation that the run higher has further to go.
Sterling may also have garnered further impetus after UK PM Boris Johnson reiterated for a second day running that he was keen to avoid more lockdowns, despite also noting a rapid rise in hospital admissions. However, sterling’s performance is roughly in line with other outperforming G10 currencies on the day including the euro, Aussie and kiwi (all of which are up 0.2-0.3% versus the yen).
GBP/JPY bulls will be eyeing a test of the 2021 highs just to the north of the 158.00 level amid a lack of any notable resistance in the interim. Traders should beware, however, that GBP/JPY’s 14-day Relative Strength Index is in overbought territory above 70.00, suggesting that it may be difficult for the pair to manage a sustained break above resistance at 158.00.
The yen did not seem to react much to newswires reporting that BoJ sources had told them the bank would be upping its fiscal year 2022 forecasts at the coming meeting earlier on Wednesday. Whilst the core inflation forecast for the coming fiscal year was set to be lifted above 1.0% (from the current 0.9%), it will remain well below th BoJ’s 2.0% target, this will not prompt any policy shift from the bank. As long as the BoJ maintains its ultra-dovish stance as Japan continues to face deflation risks, the yen will continue trading as a function of global themes, risk appetite and bond yields.
US President Joe Biden could announce remaining Federal Reserve Board of Governor Nominees as soon as this week, a source told Reuters. Michigan State University economist Lisa Cook, former Fed research economist Philip Jefferson, and former Fed Governor Sarah Bloom Raskin are the leading candidates as the Biden administration seeks to diversify the Board of Governors.
Market Reaction
There has not been a market reaction to the news. Rumours that these candidates were under consideration has been swirling for some time.
- Silver is trading with modest gains ahead of the release of what are expected to be hawkish leaning FOMC minutes.
- XAG/USD currently trading just above the $23.00 level, up about 0.4% or about 8 cents on the day.
- Silver’s resilience in the face of higher real yields has been surprising, but may not last.
Spot silver (XAG/USD) prices are trading with modest gains in the run-up to the release of what is widely expected to be hawkish leaning FOMC minutes release at 1900GMT. Prices are currently trading just above the $23.00 level, up about 0.4% or about 8 cents on the day and slightly above the midpoint of the $22.60-$23.40ish range that has prevailed over the past two weeks.
Silver’s resilience in the face of a sharp rise in US real yields, which is typically a negative for precious metals, has been surprising. 10-year TIPS yields (the 10-year nominal yield minus inflation expectations) is currently probing two-month highs near-0.9% and is up a further 3bps on the day, taking its on the week gains to about 17bps. Tuesday’s ISM Manufacturing PMI survey saw the prices paid subindex fall dramatically, a sign that peak levels of (MoM) inflation in the US might be in.
That raises the chance that the Fed’s inflation forecasts for 2.6% in 2022 and then closer to 2.0% in the subsequent years (which have been criticised by many as understating inflation risks) may prove correct. 10-year yields at current levels just abov 1.65%, though sharply up on the week (with the upside driven by real yields), suggest that bond markets see the Fed’s rate projections as overly optimistic.
But optimism has been growing in markets as of late regarding the prospects for continued strong economic growth into 2022 and beyond amid strong consumer demand, tight labour markets (as Tuesday’s JOLTs report and Wednesday’s ADP numbers emphasises). There is a risk that markets increasingly start to believe the Fed’s dot plot, which suggests rates will reach 2.1% by the end of 2024, before reaching 2.5% in the long run.
10-year break-even inflation expectations remain stable in the 2.50% area and if the Fed is right (about a stronger long-term growth than markets expect, but lower inflation than many fear) that suggests it should remain stable. But if they are right about the strong economy, that means long-term nominal yields will need to move higher. That means real yields (nominal yields minus inflation expectations) will need to move higher as well.
A move back towards 0% in the 10-year TIPS yield would be a massive tailwind for silver and other precious metals. Traders betting on such a long-term outcome (which would likely take at least a year to unfold in full), would likely expect to see XAG/USD drop under support in the mid-$21.00s and to pre-pandemic levels in the upper teens.
- The British pound advances for the second day in a row, up 0.43%.
- UK’s Prime Minister said that England could handle the Omicron variant without reimposing lockdown restrictions.
- US ADP National Employment Figures smashed economists estimates, rises above 800K.
On Wednesday, the British pound advances during the New York session, trading at 1.3571 at the time of writing. The market sentiment remains mixed, with US equities fluctuating between gainers and losers. Despite the aforementioned, risk-sensitive currencies like the GBP advances some 0.43% to the detriment of the greenback.
The UK is under mild pressure due to the Omicron surge. On Tuesday, the UK reported 218,724 new Covid-19 cases. The British Prime Minister Boris Johnson said that England could withstand a rise in Covid-19 infections without shutting down the economy.
The Prime Minister further noted that “together with the Plan B measures that we introduced before Christmas, we have a chance to ride out this Omicron wave without shutting down our country once again. We can keep our schools and our businesses open, and we can find a way to live with this virus.”
In the meantime, during the overnight session, the GBP/USD remained subdued in the 1.3525-55 range, but in the last couple of hours, pierced a downslope trendline drawn from June 2021 cycle highs, which intersects with the 100-day moving average (DMA) around the 1.3545-60 area. The trendline break is courtesy of the softer trading tone of the greenback, with the US Dollar Index falling some 0.27%, sitting at 96.00.
On Wednesday, the US ADP National Employment Report portrayed that private payrolls for November surged by 807K more than the 400K estimated by analysts. The same data reported a revision lower for October’s reading from 534K down to 505K.
The data could prelude the Nonfarm Payrolls to be released on Friday, January 7th, by the US Bureau of Labor Statistics. Economists expect the employment figures to come at 400K, while the Unemployment Rate is expected to drop from 4.2% to 4.1%.
Later in the day, the Federal Reserve will release the FOMC December’s 2021 minutes.
GBP/USD Price Analysis: Bulls flirt with 100-day SMA ahead of US ADP/FOMC minutes
- Mexican peso remains strong versus US dollar early in 2022.
- USD/MXN keeps testing the 20.35/40 support area.
- Recovery above 20.90 would negate the bearish bias.
The USD/MXN dropped to test the December low around slightly below 20.35 and then rebounded back above 20.40. The area around 20.35/40 is a key support that is preventing more losses for the moment. The next level to watch comes at 20.28, a flat 2090-day simple moving average and then 20.15.
On the upside, the immediate resistance emerges at 20.60. A daily close above would expose the next one at 20.90; if broken the short-term bearish bias would be negated.
Technical indicators are slightly biased to the downside, particularly key moving averages. At the same time, USD/MXN has been falling constantly for over a month; so if it does not break firmly under 20.30 in the short term, it may have established an interim bottom.
Risk events ahead: Later on Wednesday, FOMC minutes; US jobless claims on Thursday and NFP report and Mexico CPI on Friday.
USD/MXN daily chart
-637769964002480076.png)
- WTI has advanced into the $78.00s, up $4.0 from earlier weekly lows and back to pre-Omicron levels.
- Oil prices have shrugged off a bearish weekly US oil inventory report as post-OPEC+ meeting optimism continues.
Oil markets have shrugged off bearish weekly US inventory numbers and are advancing higher, with front-month WTI futures having broken to the north of resistance in the mid-$77.0s to now trade in the mid-$78.0s. That marks its highest price since 25 November, the day before Omicron fears swept financial markets, with WTI now up roughly $4.0 from earlier weekly lows. Short-term bullish oil speculators will likely be targeting a test of a key level of support turned resistance from back in mid-November around $79.30. The most notable support to the downside is around $77.50 and the 50-day moving average just under $76.00.
There hasn’t been anyone notable catalyst for Wednesday’s move higher. Traders continue to sight Tuesday’s OPEC+ decision to press ahead with pre-existing plans to hike output by 400K barrels per day in February. The decision has been taken by some as a vote of confidence in the oil market’s ability to take more supply. Meanwhile, analysts at Barclays noted that “while OPEC+ raised its output target, it will likely struggle to reach it, as members including Nigeria, Angola and Libya face difficulties ramping up production”. “OPEC+ has adopted the path of least (political) resistance, as it continues to stay the course on increasing output targets,” the bank continued, “but actual incremental supplies are likely to be much smaller, similar to the demand effect from Omicron”.
Elsewhere, oil prices shrugged off a bearish weekly US EIA crude oil inventory report. To recap the details, crude oil stocks saw a smaller than expected draw of 2.144M barrels (versus 3.283M expected), gasoline stocks saw a massive 10.128M barrel build (versus 1.775M expected) and distillates saw a large 4.418M barrel build (versus 1.525M expected). The report did not come as that much of a surprise given that the alternative private inventory report from API released on Tuesday also showed big gasoline and distillate inventory builds.
- Aussei extends gains versus US dollar on American hours despite upbeat US data.
- DXY drops 0.30%, US yields modestly higher, below Tuesday’s highs.
- FOMC minutes to be released at 19:00 GMT.
The AUD/USD pair gained momentum during the American session and climbed to 0.7268, reaching the highest level since Monday’s Asian session. It remains near the top as traders await the release of the FOMC minutes.
The US dollar is falling across the board, unable to benefit from better-than-expected economic data. US yields remained below Tuesday’s top, still near monthly highs.
The AUD/USD is back near the 0.7275/80 resistance area that capped the upside last week. A break higher should clear the way for 0.7300. On the flip side, support emerges at 0.7240 and then 0.7220. A daily close under the 20-day moving average at 0.7190 would weaken Aussie’s outlook.
US data surpass expectations, FOCM minutes ahead
The ADP employment report for December came in above expectation with the private sector adding 807K jobs, against market consensus of 400K. The dollar initially rose but then weakened. Those numbers are seen as a preview for Friday’s Non-farm Payrolls.
Later on Wednesday, the Federal Reserve will release the minutes of its December meeting. Markets will be looking for clues for when the conditions for liftoff will likely be met. WIRP suggests nearly 2 in 3 odds of liftoff March 16, while May 4 is fully priced in. Some are looking for clues to balance sheet reduction, but we think it is way too early for that”, said analysts at Brown Brother Harriman.
Technical levels
- The S&P 500 is a tad lower but trading within recent ranges under 4800 ahead of the Fed minutes release.
- Growth continues to underperform value, meaning the Nasdaq 100 is performing poorly whilst the Dow is holding up better.
US equities are mixed in the run-up to the release of the minutes from the hawkish December Fed meeting at 1900GMT on Wednesday. The S&P 500 is trading marginally softer just under 4790 but continues to trade within recent 4760-4820 ranges. The tech/growth stocks continue to underperform, even though long-term US bond yields are taking a breather from their recent run of gains. The Nasdaq 100 is as a result lower by a further 0.5% on Wednesday and trading in the 16.2K region having earlier tested 16.1K. The Dow, meanwhile, continues to outperform amid an underlying bid in “value” equity sectors such as energy, industrials and materials. The index is up about 0.25% on Wednesday again a test of the 37K level (which would mark fresh all-time highs) is highly possible.
So-called value stocks continue to perform well in wake of recent upside in long-term bond yields which seems to have signalled positivity about the state of the US economy and its outlook for 2022 and beyond. “Value”, sometimes also referred to as income-generating stocks or cyclical stocks, disproportionately derive their valuation from current earnings rather than expectations for future earnings growth. That means their price is more sensitive to perceptions about the strength of the economy (which long-term bond yields encapsulate well).
A much stronger than expected estimate of the change in private US payrolls in December from ADP failed to impact equities, or bonds or FX markets for that matter. Markets seem much more focused on the upcoming Fed minutes release. Recall that in the December meeting, the US central bank doubled the pace of its QE taper and indicated three rate hikes were possible in 2022. The minutes should shed more light on the thinking behind this decision, as well as on opinions on things that are yet to be decided/announced, such as the Fed’s plans to eventually reduce the level of its bond holdings.
- XAU/USD’s advances during the New York session some 0.42%.
- Covid-19 Omicron variant woes and lockdowns in China triggered a risk-off market mood.
- XAU/USD Price Forecast: Neutral biased, but subject to a breakout.
Gold spot (XAU/USD) advances during the North American session, trading at $1,822 at the time of writing. The market sentiment is a mixed bag, with European and US stock indices fluctuating between gainers and losers, amid the spread of the Omicron variant, with Hong Kong reimposing social restrictions. At the same time, two Chinese cities enter into lockdown, spurring a risk-off market mood.
On Tuesday, Minnesota Federal Reserve President Neil Kashkari, one of the doves of the Fed and voter in 2022 in the Federal Open Market Committee, said that he expects at least two rate hikes in 2022.
Before Wall Street opened, the US ADP National Employment Report showed that private payrolls for November surged by 807K more than the 400K estimated by analysts. The same data reported a revision lower for October’s reading from 534K down to 505K.
The data could prelude the Nonfarm Payrolls to be released on Friday, January 7th, by the US Bureau of Labor Statistics. Economists expect the employment figures to come at 400K, while the Unemployment Rate is expected to drop from 4.2% to 4.1%.
Later in the day, the Federal Reserve will release the FOMC December’s 2021 minutes.
In the meantime, US T-bond yields drop, with the 10-year benchmark note, falling one and a half basis points, sitting at 1.653%, a headwind for the greenback, with the US Dollar Index sliding 0.34%, below the 96.00 yardstick for the first time in the week, at 95.93.
XAU/USD Price Forecast: Technical outlook
Gold’s daily chart depicts that the yellow metal has a neutral bias despite trading above the $1,800 threshold. The daily moving averages (DMAs) reside below the spot price in a horizontal linear fashion, trendless, with the 200-DMA trapped between the 50-DMA on the top and the 100-DMA at the bottom.
To the upside, XAU/USD’s first resistance would be $1,834. A breach of the latter would open the door for a test of November 16, 2021, a daily high at $1,877, followed by $1,900. A clear break of that level would open the door for a test of 2021 high at $1916.
On the flip side, failure at the abovementioned leaves the $1,800 psychological level as the first support for gold prices. In the event of breaking lower, it would expose crucial demand levels, being the next one, the 200-DMA at $1,799, followed by the 100-DMA at $1,793, and then the December 15, 2021, cycle low at $1,753.
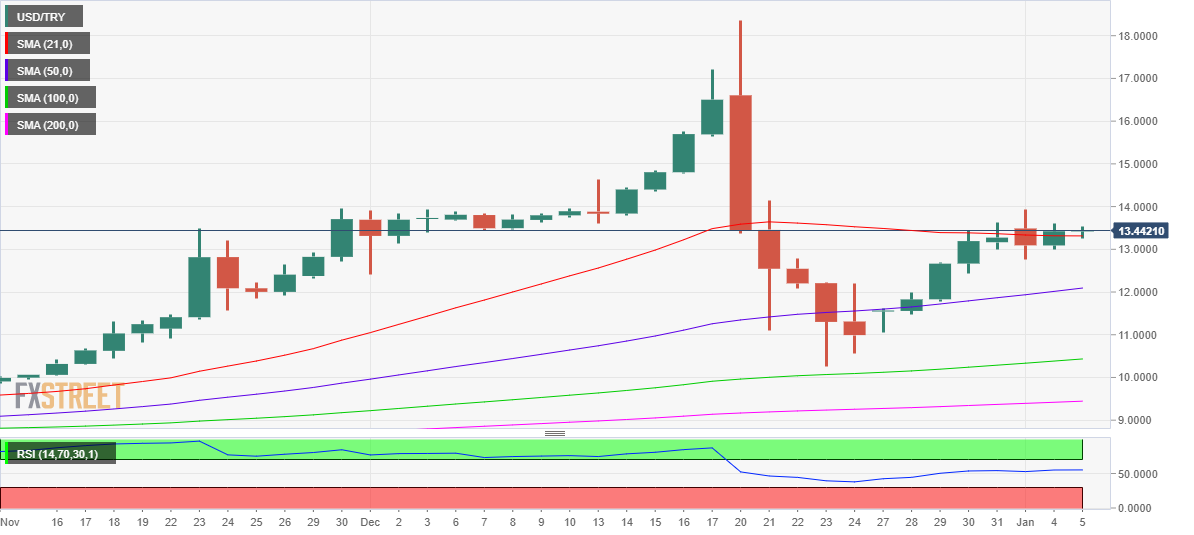
- USD/TRY adds to Tuesday’s gains well above 13.00.
- The lira loses further ground after a positive start of the year.
- Focus remains on the next CBRT event later in the month.
The Turkish lira accelerates losses and pushes USD/TRY to new 2-day highs in the 13.60 region midweek.
USD/TRY stronger after Turkey’s CPI
USD/TRY posts gains for the second day in a row on Wednesday, regaining the upside traction and extending the bounce off Monday’s lows in the 12.70 region.
The lira resumed the downside in past sessions after cracks seem to have turned up in the Turk’s confidence after the government announced a plan to reduce the dollarization of the economy and therefore promote savings in the domestic currency.
In the meantime, the effects of President Erdogan’s rescue plan continue to wear off and the impact on the lira becomes more visible, particularly after inflation in the country rose above 36% in the year to December, the highest level in the last 19 years.
What to look for around TRY
The lira resumed the downtrend while market participants continue to digest the recent inflation figures and the government measures to promote the shift from dollars to the domestic currency. The reluctance of the CBRT to change the (collision?) course and the omnipresent political pressure to favour lower interest rates in the current context of rampant inflation are forecast to keep the lira under intense pressure. That said, another visit to the all-time high north of the 18.00 mark in USD/TRY should not be ruled out just yet.
Eminent issues on the back boiler: Progress (or lack of it) of the new scheme oriented to support the lira. Constant government pressure on the CBRT vs. bank’s credibility/independence. Bouts of geopolitical concerns. Much-needed structural reforms. Growth outlook vs. progress of the coronavirus pandemic. Potential assistance from the IMF in case another currency crisis re-emerges.
USD/TRY key levels
So far, the pair is gaining 1.36% at 13.5339 and a drop below 12.7523 (weekly low Jan.3) would pave the way for a test of 11.8128 (55-day SMA) and finally 10.2027 (monthly low Dec.23). On the other hand, the next up barrier lines up at 13.8967 (weekly high Jan.3) followed by 18.2582 (all-time high Dec.20) and then 19.0000 (round level).
- USD/CAD has traded indecisively on Wednesday and is one of the worse G10 performers despite higher oil prices.
- A hot US ADP report and mixed Canadian housing data was ignored, with markets focused on the Fed minutes.
USD/CAD has traded indecisively thus far this Wednesday, trading within a relatively thin 1.2700-1.2750 range, roughly midway between its 21 and 50-day moving averages which reside at 1.2670 and 1.2787 respectively. At current levels just above 1.2700, the pair is trading flat on the day.
A much strong than forecast US ADP national employment change report did little to shift the dial for the pair. USD may be struggling to pick up in wake of the hot labour market data given that we still need confirmation from the official December jobs report that last month saw bumper jobs growth. Meanwhile, Tuesday’s ISM manufacturing survey sent strong signals via the prices paid subindex that the peak in US inflation may soon be in, which some think will ease pressure on the Fed to be hawkish in 2022.
Canadian data in the form of November Building Permits, which saw MoM growth beat expectations, and November New Housing Price Index numbers, which fell short of expectations, have not influenced the loonie. The Canadian dollar is actually one of the G10 underperformers on Wednesday, despite strength in crude oil prices. FX traders will not want to read too much into the loonie’s intraday underperformance ahead of the release of key Canadian jobs data on Friday, which is released alongside the official US jobs report. Ahead of that though, USD/CAD traders will need to keep an eye on the release of the minutes from the hawkish December Fed meeting at 1900GMT.
The Canadian dollar is drifting a little after failing to hold gains against the USD below the 1.27 level on Tuesday. Economists at Scotiabank remain bullish on the loonie, however, USD/CAD may lurch higher in the short-term to test the 1.2750 mark.
USD/CAD continues to consolidate
“We remain constructive on the CAD outlook – given the prospect of fairly rapid BoC tightening this year. But we do expect seasonal trends to keep the CAD trading more defensively in the early part of the new year.”
“Spot remains in a downtrend on the short-term charts, following the late Dec rejection of 1.29+ levels. We think this is a bullish cue for the CAD in the medium-term but, in the short run, the downtrend suggests intraday resistance at 1.2750.”
“We continue to see support near yesterday’s low around 1.2620/30.”
The EUR/USD pair again bounced off the 1.1270/80 support zone this morning to now run into the 1.1320/25 resistance. Economists at Scotiabank note that the technical picture remains bearish.
Resistance is 1.1340/60/80
“EUR/USD remains in its sideways trajectory since late-November while the broad technical picture (since last May) remains bearish and points to losses continuing after this lengthy consolidation period.”
“Support after 1.1270/80 is the mid-figure zone followed by ~1.1220.”
“Resistance is 1.1340/60/80; note 50-day MA at 1.1364.”
USD/CAD has been capped and fallen sharply from major medium-term resistance at 1.2950/3024. However, key support at 1.2645/2608 should hold, in the opinion of the Credit Suisse analyst team.
USD/CAD finds a floor at 1.2645/08
“The market has found a floor at more important support at 1.2645/08 and we look for a deeper tactical recovery from here, with first short-term resistance at 1.2836/48. Thereafter, we lean towards a breakout above the major 1.2950/3030 zone, given that medium-term momentum remains bullish and given that medium-term moving averages are all now rising, unlike earlier this year, which supports the case for an eventual breakout.”
“Key support remains at 1.2645/08, which we look to hold. Whilst not our base case, a closing break below here would complete a clear top to turn the risks back lower within the range, with next support at 1.2500/2491.”
Julia Goh, Senior Economist at UOB Group and Economist Locke Siew Ting comment on the release of the latest Investment Approvals figures.
Key Takeaways
“Malaysia’s total investment approvals rose 51.5% y/y to MYR177.8bn in Jan-Sep 2021 (vs. MYR117.4bn in Jan-Sep 2020). The manufacturing sector accounted for the largest share of total investments which amounted to MYR103.9bn (58.4% share), followed by the services sector with MYR57.8bn (32.5%) and the primary sector with MYR16.1bn (9.1%).”
“Foreign direct investment (FDI) approvals accounted for nearly 60% of overall approved investments (or at MYR106.1bn) with major investments from Singapore, China, Austria, Japan, and the Netherlands.”
“With year-to-date total investment approvals reaching 96% of our initial full-year target of MYR185bn and incorporating the recent announcement of over MYR30bn worth of investment by a US chip giant, we raise our 2021 full-year target to MYR215bn (2020: MYR167.4bn). However, expectations of tighter global monetary conditions and lingering uncertainties surrounding the pandemic would continue to pose challenges to FDI flows in emerging markets including Malaysia next year. We project MYR200bn worth of investment approvals for 2022.”
- EUR/USD has been moving higher in recent trade, unfazed by hot US ADP numbers and perhaps helped by hawkish ECB-speak.
- The pair is up over 0.3% or roughly 40 pips in the 1.1320s.
EUR/USD has been moving higher in recent trade, unfazed by a massive beat on expectations from the latest US ADP employment report that adds upside risk to Friday’s official US jobs report, and seemingly garnering impetus from hawkish ECB speak. The pair is currently trading at session highs in the 1.1320s, up more than 0.3% or roughly 40 pips on the day, as it continues to rebound from Tuesday’s sub-1.1280 lows. The pair is now roughly 0.5% above these levels and also back to the north of its 21-day moving average which currently resides at 1.1305. Short-term bullish speculators may be betting that EUR/USD retests the top of the 1.1240-1.1380ish range that has contained it since the end of November. Further resistance will come into play in the 1.1360s in the form of the 1.1360s.
In terms of the major fundamental catalysts of the day; ECB’s Martins Kazaks (the Lithuanian central bank head) hawkishly warned that if the inflation outlook picks up, the ECB is ready to raise rates and cut stimulus and that an early 2023 rate hike is a possible scenario. One would assume that the outlined scenario also includes the axing of the bank’s Asset Purchase Programme, which is currently scheduled to continue in perpituity at a rate of EUR 20B per month from Q4 2022. A throng of ECB members have in recent weeks warned of upside risks to the bank’s 2023 and beyond forecasts. It seems that in the case of further upwards revision to the bank’s inflation forecasts, it would take increasingly less to convince a majority of ECB policymakers that monetary policy tightening is needed.
The above hawkish rhetoric seems to have contributed to euro strength on Wednesday, while the latest much stronger than forecast ADP report has been ignored. The failure of USD to strengthen could be a reflection of fears that tight US labour market conditions encourage the Fed to tighten stimulus in the near-term at a faster pace (referred to as “front-loading” its hiking cycle). Though long-term bond yields are higher on the week, they remain well below the Fed’s estimate of the neutral level which presumably the Fed hopes it will be able to get rates back to in the long run.
Perhaps markets remain fearful that a more front-loaded tightening of policy will hamper long-term growth and the ability of the Fed to get rates back to neutral in the long run. FX strategists have suggested that for the dollar’s bull-run to continue, longer-term US bond yields will need to move towards the sort of levels where the Fed currently thinks it will be taking rates too. In the meantime, the Fed 2022 tightening story will receive further inputs this week in the form of the minutes of the hawkish December FOMC meeting, which may contain chatter at the timing of a first hike and quantitative tightening. Meanwhile, Friday’s US labour market report is likely to point to hot pre-Omicron labour market conditions, as the JOLTs and ADP reports have done.
USD/JPY has surged higher to start the year. Economists at Credit Suisse maintain a core bullish outlook for a test of the long-term downtrend from April 1990 at 116.83.
Support at 114.96 ideally holds
“A knee-jerk pullback should be allowed for following the strength yesterday but we expect the market to remain well supported ahead of a move to test the long-term downtrend from April 1990, now seen at 116.83.”
“Whilst we would expect to see a fresh phase of consolidation to emerge at the downtrend from April 1990 of 116.80/85, we look for a break higher post this for a challenge on the 118.61/66 highs of late 2016 and 2017.”
“Big picture, with 10yr US Bond yields also expected to establish a major base we look for an eventual rise to 122.90/123.00.”
“Near-term support moves to 115.90/81, then 115.68 which we look to ideally hold. A close below 114.96 though is needed to ease the immediate upside bias.”
- DXY trades on the defensive near the 96.00 mark.
- The US ADP report surprised to the upside in December.
- Investors’ attention now shifts to the FOMC Minutes.
The US Dollar Index (DXY), which gauges the greenback vs. a bundle of its main rivals, trades on the defensive and close to the 96.00 neighbourhood on Wednesday.
US Dollar Index now looks to FOMC
The index remains unable to reverse the resurgence of the selling pressure so far and navigates in the lower end of the daily range and at shouting distance from the key 96.00 yardstick.
The lack of conviction in US yields amidst mixed performance across the curve and the investors’ bias towards the risk complex keep the buck under scrutiny despite the auspicious results from the ADP report in December.
Indeed, the US private sector added 807K jobs during last month, crushing estimates for a 400K gain and up from November’s 505K.
Later in the session, Markit will release its final Services PMI for the month of December and the FOMC will publish its Minutes of the last meeting.
US Dollar Index relevant levels
Now, the index is retreating 0.30% at 95.99 and a break above 96.46 (weekly top Jan.4) would open the door to 96.90 (weekly high Dec.15) and finally 96.93 (2021 high Nov.24). On the flip side, the next down barrier emerges at 95.57 (monthly low Dec.31) followed by 95.51 (weekly low Nov.30) and then 94.96 (weekly low Nov.15).
- A combination of factors triggered a modest USD/JPY pullback on Wednesday from a multi-year high.
- The JPY benefitted from reviving safe-haven demand; retreating US bond yields weighed on the USD.
- Surprisingly stronger ADP report, hawkish Fed expectations limited losses for the USD and the major.
The USD/JPY pair maintained its offered tone through the early North American session, albeit has managed to rebound a few pips from the daily low. The pair was last seen trading just below the 116.00 mark and had a rather muted reaction to upbeat US macro data.
The Automatic Data Processing (ADP) reported that the US private-sector employers added 807K jobs in December as compared to consensus estimates pointing to a reading of 400K. The previous month's reading, however, was revised lower to 505K from 534K and did little to provide any meaningful lift to the US dollar, which was weighed down by retreating US Treasury bond yields.
Apart from this, the cautious mood around the equity markets underpinned the safe-haven Japanese yen and was seen as another factor that exerted some downward pressure on the USD/JPY pair. That said, expectations for a faster policy tightening by the Fed continued acting as a tailwind for the buck and helped limit any further losses for the major, at least for the time being.
In fact, the money markets have fully priced in an eventual Fed liftoff by May and two more rate hikes by the end of 2022. Hence, the focus will remain on the FOMC monetary policy meeting minutes, due later during the US session. This, in turn, warrants caution before confirming that the recent USD/JPY runup to a five-year high has run out of steam.
Even from a technical perspective, the overnight sharp move up validated a near-term bullish breakout through a one-month-old ascending trend-channel resistance. Given the constructive setup, the ongoing downtick might still be categorized as a corrective pullback and might still be seen as a buying opportunity near the previous swing high, around the 115.50 region.
Technical levels to watch
EUR/USD price action remains viewed as a potential bearish continuation pattern. Analysts at Credit Suisse look for 1.1387 to continue to cap for an eventual fall to 1.1019/02.
Resistance at 1.1387 to cap for an eventual fall to 1.1019/02
“We remain of the view price action remains a bearish continuation pattern. Below near-term trend support at 1.1260 should add weight to our view for a fall back to 1.1224/23. Beneath here should confirm completion of the pattern to clear the way for a retest of key price support and the current cycle low at 1.1186/68.”
“An eventual break below 1.1186/68 can see a resumption of the core bear trend to the “measured ‘head & shoulders’ top objective at 1.1075, then our 1.1019/02 core objective – the 78.6% retracement of the 2020/2021 uptrend and ‘neckline’ to the April/May 2020 base.”
“A close above 1.1387 would mark a near-term base to clear the way for recovery to 1.1431/40, then the 38.2% retracement of the fall from last September at 1.1464, but with a fresh cap expected here.”
- ADP's latest report estimates the private sector added more than 800K jobs in December.
- The dollar saw knee-jerk strength as traders tweak Friday's NFP forecasts.
Employment in the US private sector rose by 807,000 in December, monthly data published by the Automatic Data Processing (ADP) Research Institute revealed on Wednesday, the largest such monthly employment gains since May 2021. That was well above median economist forecasts for a rise in employment of 400,000 and marked an acceleration in the pace of job gains versus November when 534,000 jobs were added.
According to Nela Richardson, chief economist at ADP, “December’s job market strengthened as the fallout from the Delta variant faded and Omicron’s impact had yet to be seen”. “Job gains were broad-based, as goods producers added the strongest reading of the year, while service providers dominated growth," she said, adding that "December’s job growth brought the fourth quarter average to 625,000, surpassing the 514,000 average for the year". However, Richardson caveats, "while job gains eclipsed 6 million in 2021, private-sector payrolls are still nearly 4 million jobs short of pre-COVID-19 levels".
Market Reaction
The US dollar saw knee-jerk strength following the data, with the DXY bouncing from around 96.05 to around 96.15, though still trades slightly lower on the day. The data adds upside risks to median economist forecasts for this week's official December non-farm payrolls number of 400K.
- EUR/USD regains the 1.1300 neighbourhood midweek.
- Further weakness is seen revisiting the 1.1220 zone.
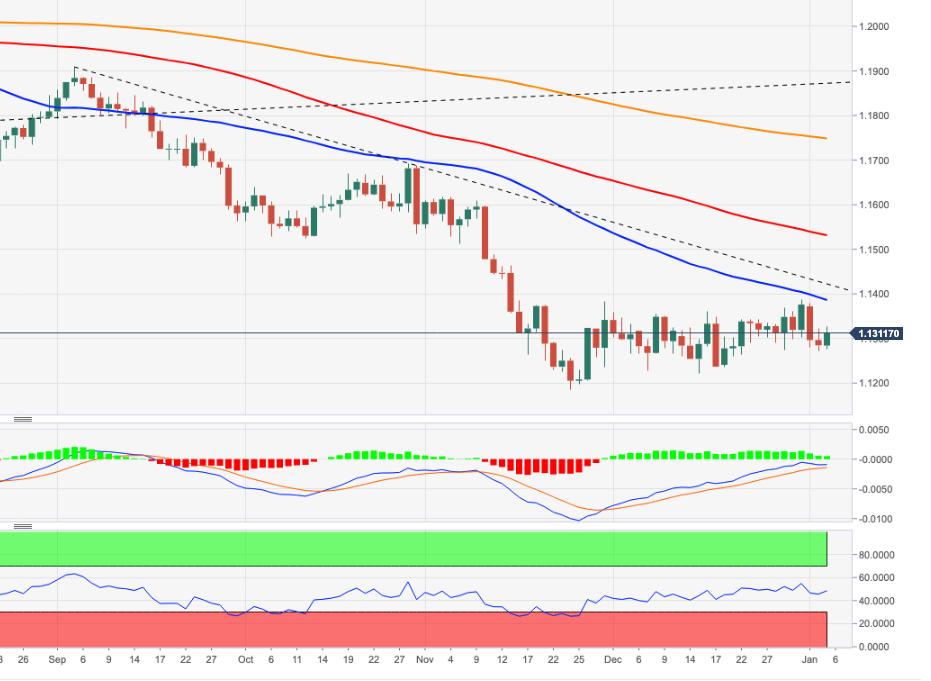
EUR/USD manages to regain the smile and bounces off recent lows around 1.1270 on Wednesday.
While below the 4-month resistance line (off September’s high) around 1.1420 there is scope for further decline. That said, the next contention area is predicted to emerge at the monthly low at 1.1221 (December 15).
The broader negative outlook for EUR/USD is seen unchanged while below the key 200-day SMA at 1.1747.
EUR/USD daily chart
- Spot gold prices continue to advance and have in recent trade been testing $1820, aided by a weaker US dollar.
- Focus now turn to US ADP jobs data and the release of the minutes from the hawkish December FOMC meeting.
Dollar weakness on Wednesday, primarily versus the likes of the euro and yen, that has seen the DXY drop back to probe the 96.00 level has put spot gold (XAU/USD) prices on course for a second successive day of gains. A weaker dollar makes USD-denominated gold cheaper for international buyers, increasing its demand. Prices have in recent trade been testing the $1820 level, though are for now unable to break it, but remain on course to post a daily gain of about 0.2% or slightly more than $3.0 on the day. Attention now turns to the release of ADP’s estimate of US national employment change in December, which will help traders calibrate expectations for Friday’s official non-farm payrolls number, and could thus cause some choppiness.
The data is released at 1315GMT, a few hours before the release of the minutes of the hawkish December Fed meeting where the bank doubled its QE tapering pace and signaled that three rate hikes in 2022 was likely. The minutes should match the hawkish tone of the meeting, with Fed members expected to sound bullish on 2022 growth, concerned about inflation and surprised about the extent of the labour shortage which arguably means the US is already very close to full employment. Any chatter about potential Quantitative Tightening (i.e. the Fed reducing its bond holdings) later in the year could underpin the dollar and yields and present headwinds for gold.
But gold has been remarkably resilient to this week’s sharp rise in long-term bond yields, which has been primarily driven by rising real yields. Typically, this is a negative for gold given that an increase in opportunity cost (for which real yields are a proxy) typically undermines demand for non-yielding assets. But long-term real yields remain in deeply negative territory, indicative of the fact that investors still do not expect long-term US interest rates to come anywhere near inflation. As a result, demand for alternative safe-haven assets that offer better inflation protection, such as gold, remains strong. It will be interesting to see whether real yields can continue their recent pick up from December lows and the extent to which this weighs on gold.
- GBP/USD gained traction for the second successive day on Wednesday.
- Bulls, however, struggled to make it through the 100-day SMA barrier.
- The technical setup supports prospects for additional near-term gains.
The GBP/USD pair edged higher for the second successive day on Wednesday and maintained its bid tone through the mid-European session. The pair inched back closer to a near two-month high, around the 1.3555-60 region set in the previous day, albeit struggled to make it through the 100-day SMA barrier.
This is closely followed by the 61.8% Fibonacci level of the 1.3834-1.3161 downfall, which should now act as a pivotal point. Given that oscillators on the daily chart are holding comfortably in the positive territory, a sustained strength beyond will be seen as a fresh trigger for bullish traders.
The GBP/USD pair might then aim to surpass the 1.3600 mark and accelerate the momentum towards a downward-sloping trend-line resistance, around the 1.3685 region. The said hurdle extends from July 2021 high, which if cleared decisively would set the stage for an extension of the appreciating move.
On the flip side, the 50% Fibo. level, around the key 1.3500 psychological mark, now seems to protect the downside ahead of the 1.3460-55 region and the weekly low, around the 1.3430 area. Any further slide might attract some buying near the 38.2% Fibo./50-day SMA confluence, around the 1.3400 mark.
Failure to defend the mentioned support levels, leading to a further decline below the 1.3385-75 region might shift the bias back in favour of bearish traders. The pair might then turn vulnerable and accelerate the downfall towards testing the 23.6% Fibo. level support, around the 1.3320 area.
GBP/USD daily chart
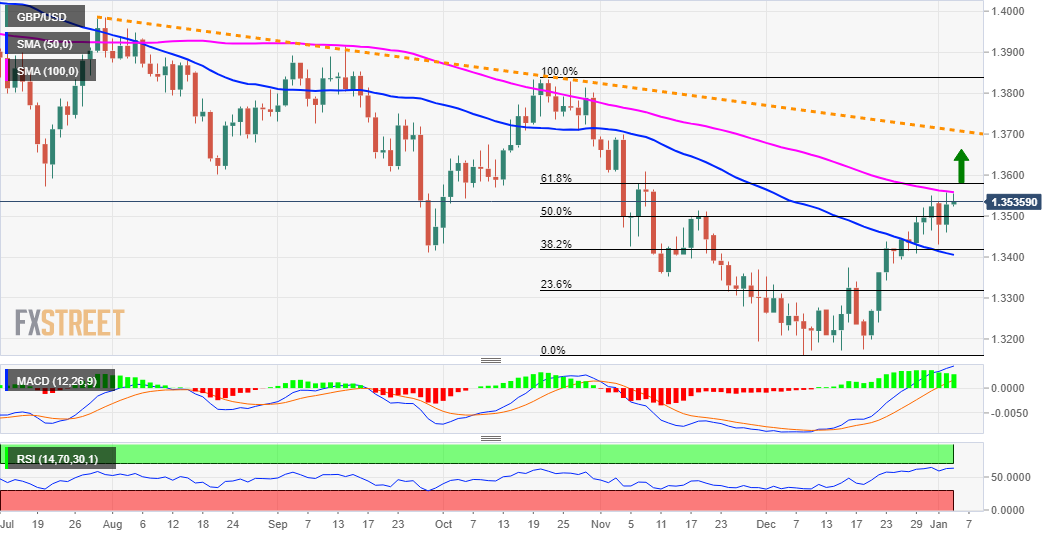
Levels to watch
- DXY gives away part of the recent gains on Wednesday.
- Immediately to the upside comes the weekly top near 96.50.
DXY deflated somewhat after hitting new tops around 96.50 on Tuesday.
Next on the upside now emerges 96.46 (January 4) and a break of this level should put a test of the 2021 high at 96.93 (November 24) back on the radar just before the round level at 97.00.
In the meantime, while above the 4-month support line (off September’s low) around 94.90, the constructive view in DXY should remain unchanged. In addition, the broader positive stance stays underpinned by the 200-day SMA at 93.02.
DXY daily chart
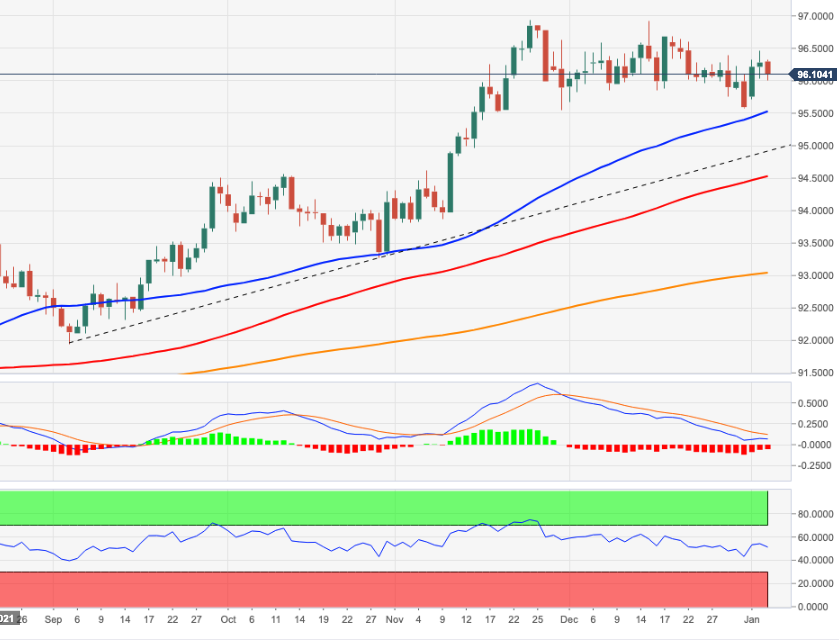
Latvian central bank governor and ECB governing council member Martins Kazaks said on Wednesday that the ECB is ready to raise rates and cut stimulus if needed. The bank, he continued, is ready to take action if the inflation outlook picks up and an early 2023 rate hike is a possible scenario.
- EUR/JPY’s rally met a solid hurdle in the mid-131.00s.
- The short-term outlook points to the continuation of the uptrend.
EUR/JPY came under pressure following Tuesday’s new 2-month peaks around 131.50.
The recent breakout of the critical 200-day SMA should prop up extra gains in the cross in the short-term horizon. That said, the next resistance emerges at the so far YTD high at 131.49 (January 4) before a Fibo level at 132.17.
While above the 200-day SMA, today at 130.51, the outlook for EUR/JPY should point to extra gains.
EUR/JPY daily chart

US ADP jobs report overview
Wednesday's US economic docket highlights the release of the ADP report on private-sector employment, scheduled at 13:15 GMT. Consensus estimates suggest that the US private-sector employers added 400K jobs in December, marking a clear slowdown from the 534K reported in the previous month. The report might influence expectations from the official Nonfarm Payrolls (NFP) report and help predict how things could move on Friday.
Joseph Trevisani, Senior Analyst at FXStreet, offered his take on the report and explained: American firms closed out the year with moderate hiring despite rampant pandemic cases in parts of the country, an unsettled economy and a newly assertive Federal Reserve.
How could it affect EUR/USD?
Ahead of the key release, retreating US Treasury bond yields exerted some downward pressure on the US dollar and assisted the EUR/USD pair to attract fresh buying near the 1.1275-70 area on Wednesday. That said, a stronger reading would validate bets for a more aggressive policy tightening by the Fed and lift the buck.
Conversely, a softer print might do little to influence the greenback ahead of the latest FOMC meeting minutes, due later during the US session. Moreover, investors might also wait for a confirmation from the official report. This, in turn, suggests that the market would react little to the data, albeit any significant divergence from the expected reading might still provide some impetus.
Meanwhile, Eren Sengezer, Editor at FXStreet, outlined important technical levels to trade the EUR/USD pair: “As of writing, EUR/USD was trading near the 200-period and 100-period SMAs on the four-hour chart, which have been moving sideways near 1.1300 since the beginning of the week. On the upside, 1.1320 (20-period SMA, 50-period SMA, broken ascending trend line) aligns as the first technical hurdle before 1.1340 (static level) and 1.1360 (post-ECB high, static level).”
“Initial static support is located at 1.1270. With a daily close below that level, EUR/USD could target 1.1240 (static level) on the downside before testing 1.1200 (psychological level),” Eren added further.
Key Notes
• US ADP December Preview: Suddenly its inflation, not jobs
• EUR/USD Forecast: Euro unlikely to stage a convincing rebound ahead of US events
• EUR/USD to break to a new low in the first half of the year – ING
About the US ADP jobs report
The Employment Change released by the Automatic Data Processing, Inc, Inc is a measure of the change in the number of employed people in the US. Generally speaking, a rise in this indicator has positive implications for consumer spending, stimulating economic growth. So a high reading is traditionally seen as positive, or bullish for the USD, while a low reading is seen as negative, or bearish.
Economist at UOB Group Ho Woei Chen, CFA, assesses the recently published PMIs in the Chinese economy.
Key Takeaways
“China’s official manufacturing and non-manufacturing Purchasing Manager’s Indexes (PMIs) improved and were both above consensus expectation in December. Improvement in the manufacturing outlook was also seen in the private sector Caixin manufacturing PMI.”
“Manufacturing outlook improved mainly due to easing raw material supply constraints but production and external demand weakened in December.”
“Non-manufacturing PMI rose in December after dipping in the two preceding months with services recovery offsetting seasonal weakness in construction. Domestic demand has remained fairly resilient despite outbreaks of COVID-19 in some cities.”
“We remain of the view that China’s 4Q21 GDP growth could slow further to 3.5% y/y from 4.9% in 3Q21. For 2022, our growth forecast is at 5.7% with downside risk from the downturn in the domestic property market, virus resurgence and US-China tensions.”
US lawmakers began early talks about another round of COVID-19 relief targeting businesses, the Washington Post reported on Wednesday, per Reuters.
No additional details on the matter had been disclosed yet.
Market reaction
This headline doesn't seem to be having a noticeable impact on market sentiment for the time being. As of writing, the S&P Futures and the Nasdaq Futures were down 0.1% and 0.4%, respectively. Meanwhile, the benchmark 10-year US Treasury bond yield continues to move sideways near 1.65% following the impressive rally witnessed earlier in the week.
China’s Premier Li Keqiang said on Wednesday that they will ensure stable economic operations in the first quarter, as reported by Reuters.
"We will implement larger tax and fee cuts," Li noted and added that they will step up transfer payments for local governments while providing targeted support to COVID-affected sectors such as services.
Market reaction
These comments don't seem to be having a noticeable impact on market sentiment. As of writing, the Nasdaq Futures were down 0.33% on the day and the S&P Futures were unchanged.
- A combination of supporting factors pushed AUD/USD higher for the second straight day.
- The overnight bounce from an ascending trend-line supports prospects for further gains.
- A move beyond 100-DMA will reaffirm the constructive outlook and prompt fresh buying.
The AUD/USD pair built on the previous day's positive move and gained some follow-through traction for the second successive day on Wednesday. The pair maintained its bid tone through the first half of the European session and was last seen trading near a two-day high, around mid-0.7200s.
Retreating US Treasury bond yields undermined the US dollar, which, in turn, was seen as a key factor that provided a modest lift to the AUD/USD pair. Apart from this, a positive turnaround in the risk sentiment further benefitted the perceived riskier aussie and remained supportive.
From a technical perspective, this week's corrective slide from the highest level since November 19 stalled near an ascending trend-line extending from the key 0.7000 psychological mark. The mentioned support, currently around the 0.7180-75 region should now act as a pivotal point.
Meanwhile, technical indicators on the daily chart have just started moving into positive territory. This, along with the emergence of dip-buying on Tuesday and the subsequent move up, favours bullish traders supports prospects for a further near-term appreciating move.
Hence, a move back towards challenging the 100-day SMA barrier, just ahead of the 0.7300 round-figure mark, remains a distinct possibility. Some follow-through buying has the potential to lift the AUD/USD pair towards the 0.7340-45 area en-route the 0.7375-80 zone and the 0.7400 mark.
On the flip side, a convincing break below the ascending trend-line support, near the 0.7180-75 region, will shift the bias back in favour of bearish traders. The AUD/USD pair might then turn vulnerable to accelerate the fall back towards the 0.7100 round-figure mark.
The downfall could further get extended towards intermediate support near the 0.7085 horizontal zone before the AUD/USD pair eventually drops to 2021 low, around the 0.7000 mark.
AUD/USD daily chart
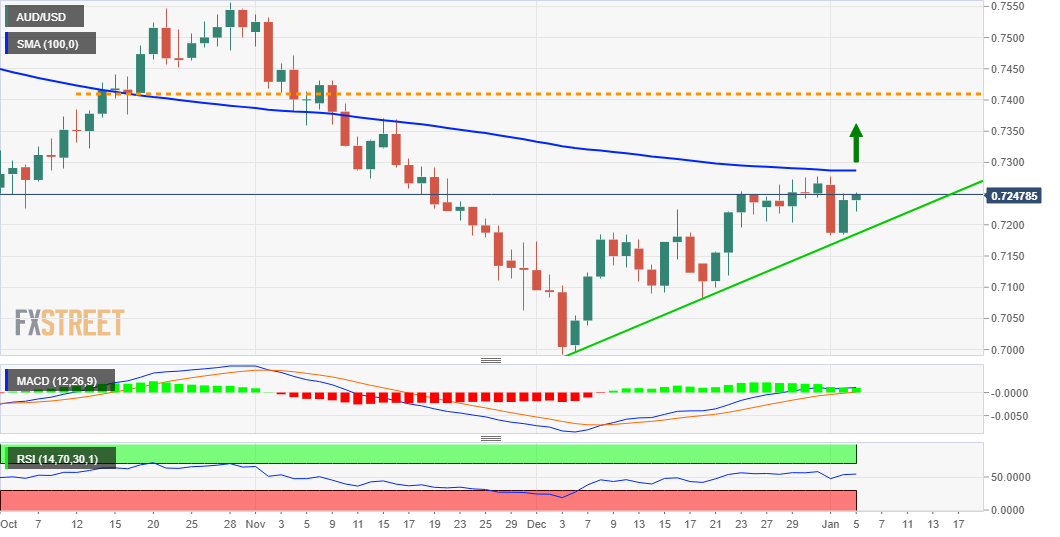
Levels to watch
The 10-year US-T bond yield jumped further on Tuesday to a high of 1.68%. On Wednesday, US private sector employment report published by the ADP and FOMC's minutes of the December policy meeting will be watched closely by market participants. Economists at MUFG Bank believe 10-year yields could hit new highs.
FOMC minutes in focus as yield surge continues
“How concerned the Fed has become over inflation may be evident in the FOMC minutes of the December meeting, released this evening. The focus will be on the inflation debate and how confident the FOMC remains over the fall in inflation. Discussions on the level that equates to full employment and the willingness to move more quickly to ‘Quantitative Tightening’ will also be important for rates and the dollar.”
“Given the momentum for higher rates we’d be surprised to see these minutes resulting in a reversal given how clear the Fed was in shifting to focusing on inflation risks. That could well see 10yr yields hitting new highs, especially if the ADP employment data is strong.”
“While the dollar can perform best versus the low-yielding G10 currencies it will become increasingly difficult for the high-beta G10 currencies to advance if US yields continue to drift higher from here.”
Russia is expected to restore oil production by 85% in 2022 from the maximum reduction level in May-June 2020 as part of the OPEC+ agreement, the country’s Deputy Prime Minister Alexander Novak said in an interview with Russia-24 news channel after the OPEC and non-OPEC Ministerial Meeting on Tuesday.
Key quotes (via TASS)
"For Russia, it means that in February we will reach 85% in the production recovery from the maximum reduction level we had in May and June 2020. That is, we will restore 1.7 million barrels per day.”
"As for Russia’s compliance with the deal in November, the level was 97%. As before, we are almost 100% compliant with our commitments."
OPEC and its allies agreed on Tuesday to maintain a planned increase of 400,000 barrels per day in its crude output quota for February.
WTI reaction
WTI was last seen trading at $76.65, little changed on the day, consolidating the previous advance to six-week highs of $77.48.
- A combination of diverging forces failed to provide any impetus to NZD/USD on Wednesday.
- The risk-off impulse was seen as a key factor that capped gains for the perceived riskier kiwi.
- Subdued USD demand extended some support ahead of the US macro data/FOMC minutes.
The NZD/USD pair seesawed between tepid gains/minor losses through the first half of the European session and remained confined in a range, just above the 0.6800 mark.
The pair struggled to capitalize on the previous day's bounce from the 0.6765 area or a near two-week low and witnessed a subdued/range-bound price move on Wednesday. Retreating US Treasury bond yields kept the US dollar bulls on the defensive and extended some support to the NZD/USD pair. That said, a softer risk tone acted as a tailwind for the safe-haven greenback and capped gains for the perceived riskier kiwi.
An extended selloff in the US bond markets weighed on the tech sector and prompted traders to take some profits off the table following the recent strong runup in the equity markets to record highs. Apart from this, expectations for a faster policy tightening by the Fed could further lend support to the buck. In fact, the money markets have fully priced in an eventual liftoff by May and two more rate hikes by the end of 2022.
This was evident from the fact that the US 2-year notes, which are sensitive to rate hike expectations along with 5-year notes, soared to levels not seen since February 2020 on Tuesday. Moreover, the yield on the benchmark 10-year bond shot to the highest level since November 24. Hence, the market focus will remain glued to Wednesday's release of the FOMC monetary policy meeting minutes, due later during the US trading session.
In the meantime, traders might take cues from the US macro data – the ADP report on private-sector employment, Building Permits and the final Services PMI. Apart from this, the US bond yields might influence the USD price dynamics. This, along with the broader risk sentiment, should provide some impetus to the NBZD/USD pair and allow traders to grab some short-term opportunities.
Technical levels to watch
- USD/TRY consolidates its recovery rally around the midpoint of 13.00.
- The lira remains weighed down by the economic and inflation concerns.
- USD/TRY yearns for a daily closing above 14.00 to resume the rebound.
USD/TRY is almost unchanged on the day, hovering around 13.50, as bulls take a breather after Tuesday’s turnaround from 13.00.
Having failed to find acceptance above the 14.00 level on a couple of occasions, the currency pair has entered a phase of consolidation, as bulls bide time before the next push higher.
The odds for the further upside remain higher, as the Turkish lira continues to look weak amid soaring inflation and instability in the country’s economic policies. Turkey’s President Recep Tayyip Erdogan’s promises to stabilize the economy fail to excite TRY buyers.
The main headwind for the economy and beleaguered currency remains the relentless rise in inflation, which offsets any optimism from a new rescue plan announced last month to bolster the lira.
Inflation in the country hit a 19-year high of 36.1% for December, with Goldman Sachs projecting Turkey’s inflation to go above 40% for most of the coming year.
USD/TRY: Technical outlook
Looking at USD/TRY’s technical chart, the pair is trying hard to defend the critical 21-Daily Moving Average (DMA) at 13.29.
Acceptance above the latter on a daily closing basis will fuel a fresh advance towards the 14.00 supply zone.
Further up, the December 21 high of 14.14 will challenge the bearish commitments.
The 14-day Relative Strength Index (RSI) is trading firmer above the midline, suggesting that there is more scope for the recovery.
Meanwhile, a sustained break below the 21-DMA will drag the rates back towards the January 3 low of 12.75, below which the 12.09 cap will come in the way. That level is the bullish 50-DMA support.
USD/TRY: Daily chart
Economist at UOB Group Enrico Tanuwidjaja reviews the latest inflation figures in Indonesia.
Key Takeaways
“Indonesia’s annual inflation rate rose to 1.87% y/y in December vis-à-vis 1.75% a month earlier, higher than market expectation of 1.80% (Reuters). This was the highest inflation rate since May, amidst loosening restrictions in some regions in the country. On a month-on-month basis, Indonesia’s inflation came in at 0.57% inflation in December, following a reading of 0.37% m/m in November. Annual core inflation rate rose slightly to 1.56% y/y in December (vs. November’s at 1.44%) and volatile prices component slowed to 3.20% y/y (vs. November 3.05%).”
“Going forward, we expect the headline inflation to gradually recover, and exceed the lower end of the government’s inflation target (2.0% - 4.0%), as the daily COVID-19 cases are now more under control. With the inflation still below the central bank’s target range; Bank Indonesia (BI) will have the policy space to remain accommodative to support the economic recovery.”
- EUR/USD regains upside traction around 1.1300 midweek.
- German final Services PMI slipped back into the contraction territory.
- Investors’ attention remains on the release of the FOMC Minutes.
The single currency regains the smile and motivates EUR/USD to return to the area above the key 1.1300 the figure.
EUR/USD appears supported around 1.1270
EUR/USD reverses two consecutive daily declines and regains the 1.1300 neighbourhood on the back of the corrective downside in the greenback and amidst some loss of momentum in US yields on Wednesday.
In fact, the better note in the risk complex weighs on the buck and lends the pair fresh oxygen against the backdrop of rising cautiousness among market participants ahead of the release of critical data in the US docket later in the week (Nonfarm Payrolls).
In the domestic calendar, the German Services PMI retreated to the contraction territory after dropping to 48.7 in December, while the same indicator in the broader euro bloc came at 53.3 (from 55.9). Later in the US trading hours, weekly Mortgage Applications measured by MBA are due in the first turn seconded by the ADP report for the month of December, while the FOMC Minutes will close the daily docket.
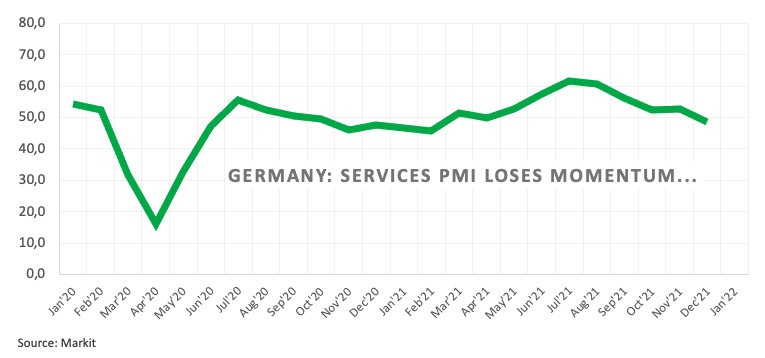
What to look for around EUR
EUR/USD met quite decent contention in the 1.1270 zone so far in the first week of the new year. In the meantime, price action around spot is expected to follow dollar-dynamics as well as the policy divergence between the ECB vs. the Federal Reserve and the response to the persistent elevated inflation on both sides of the Atlantic. On another front, the unabated progress of the coronavirus pandemic coupled with the fast-spreading omicron variant remain as the exclusive factor to look at when it comes to the economic growth prospects and investors’ morale.
Key events in the euro area this week: EMU/Germany Final Services PMIs (Wednesday) - Germany Advanced December Inflation Rate (Thursday) - EMU Advanced December Inflation Rate (Friday).
Eminent issues on the back boiler: Asymmetric economic recovery post-pandemic in the euro area. ECB stance/potential reaction to the persistent elevated inflation in the region. ECB tapering speculation/rate path.
EUR/USD levels to watch
So far, spot is up 0.14% at 1.1302 and faces the next up barrier at 1.1386 (monthly high November 30) followed by 1.1464 (weekly high Nov.15) and finally 1.1520 (200-week SMA). On the other hand, a break below 1.1272 (weekly low Jan.4) would target 1.1221 (weekly low Dec.15) en route to 1.1186 (2021 low Nov.24).
GBP/USD has managed to stage a decisive rebound after dropping below 1.3500 on Tuesday and continued to stretch higher early Wednesday. The pair is closing in on a key technical resistance that could cap its potential gains, according to FXStreet’s Eren Sengezer.
US private sector employment report and FOMC's minutes will be watched closely
“In the second half of the day, the ADP Employment Change data for December will be featured in the US economic docket. Markets expect the employment in the private sector to increase by 400,000. A better-than-expected print could lift US T-bond yields higher while helping the greenback regather its strength and vice versa.”
“Later in the session, the FOMC will release the minutes of its December policy meeting. The dollar should be able to outperform its rivals in case this publication reaffirms the Fed's hawkish policy outlook.”
“GBP/USD has failed to climb above the static resistance that seems to have formed at 1.3560 and buyers could move to the sidelines as long as this level holds. In case a four-hour candle closes above that hurdle, the next target on the upside could be seen at 1.3600 (psychological level).”
“Initial support is located at 1.3500 (psychological level, lower line of the regression channel) before 1.3470 (50-period SMA) and 1.3440 (static level).”
The US stock market has rewarded passive investors handsomely in recent years, but that could soon change. Lisa Shalett, Chief Investment Officer, Wealth Management at Morgan Stanley, explains why passive investors may have a tougher time in 2022.
More challenging investing landscape in 2022
“Better-than-expected economic growth and persistent inflation will likely cause the Federal Reserve to raise the fed funds rate, which could unmoor real rates from historic negative lows and prompt market volatility.”
“Overwhelming liquidity in the markets and year-end technical positioning are factors expected to fade this year. In addition, higher costs for labor, energy and logistics will likely continue to weigh on corporate profits.”
“While many believe that Congress will pass a version of these education, healthcare and climate initiatives ahead of the 2022 midterm elections, timing matters. Ambiguity around stimulus extensions could fuel concerns about a ‘fiscal cliff’ just as the Fed is poised to make its first interest-rate hike at mid-year. That could compound the effects on consumers of tightening financial conditions.”
“The Treasury market could see outflows against a backdrop of persistent inflation and lessening liquidity.”
“The S&P 500 has come to be dominated by a handful of mega-cap technology stocks. With federal regulators and global tax policymakers taking a hard look at these companies, new oversight could have ripple effects on markets.”
At its monetary policy meeting on January 17-18, the Bank of Japan (BOJ) is expected to make upward revisions to its inflation forecast for the fiscal year 2022-2023, in light of rising energy cost, Reuters reports, citing sources with knowledge of the matter.
more to come ...
USD/JPY continued to extend on risk dynamics, having breached the 2021 high and pushing through the 116.00 resistance. On Wednesday, the pair is trading in the negative territory near 116.00, and analysts at OCBC Bank prefer to buy dips towards 115.50/70 as USD/JPY could attempt to test the 2017 high of 118.60.
Immediate support seen at the 115.50/70 region
“Prefer to buy dips towards 115.50/70 in the near-term, where the immediate support level is seen.”
“Further out in the horizon, the 2017 high at 118.60 may be the next natural target, and cannot be explicitly ruled out for now.”
Sterling has had a good Christmas period. Economists at ING believe that the EUR/GBP pair has potential to plummet as low as 0.8200 in the first half of the year.
Front-loaded tightening cycle favours the GBP
“The UK government's decision to power through the Omicron surge with relatively few restrictions seems to have been rewarded by investors. Here the rationale seems to be that an open economy and continued high energy prices will keep the risk of a further BoE tightening in February in play.”
“Remember that UK inflation may not peak until the 6% area in April – compared to Eurozone inflation which may be peaking around now as German VAT adjustments fall out in the base effects.”
“We had never really backed the idea of a policy error hitting GBP last year and feel that we have a window – probably in 1H22 – for EUR/GBP to test the 0.8275/85 early 20 lows and potentially trade closer to 0.8200.”
US 10Y IRS eventually defended the weekly Ichimoku cloud and a multi-month up sloping trend line near 1.41% resulting in regain of upside momentum. Economists at Société Générale expect 10-year US Treasury bond yield to reach 1.92% on a break above 1.74%.
First support is at 1.61%
“10-year US Treasury bond yield is now probing the neckline of a large Inverse Head and Shoulders at 1.74%. The more pertinent question resurfacing with 10y UST yields in earshot of 1.70% is at what level the bond vigilantes will short-circuit the bullish price action in stocks. For now, optimism about the economy means yields and stocks can move higher in lockstep.”
“Weekly MACD is crossing above its trigger line which points towards possibility of an upside break.”
“A move beyond 1.74% will take the swap rate towards 1.79% and perhaps even towards the peak of 2020 at 1.92%.”
“First support is at 1.61%.”
- USD/JPY edged lower on Wednesday and eroded a part of the overnight gains to a multi-year high.
- A softer risk tone benefitted the safe-haven JPY and exerted pressure amid sliding US bond yields.
- Investors now look forward to the US macro releases and the FOMC minutes for a fresh impetus.
The USD/JPY pair maintained its offered tone through the early part of the European session and was last seen trading near the daily low, just below the 116.00 mark.
The pair witnessed some selling on Wednesday and moved away from a five-year high touched in the previous day amid a softer risk tone. An extended selloff in the US bond markets led to the overnight corrective pullback in the US tech stocks. The spillover effect was evident from a generally weaker trading sentiment around the equity markets, which, in turn, drove some haven flows towards the Japanese yen.
On the other hand, retreating US Treasury bond yields kept the US dollar bulls on the defensive and exerted additional pressure on the USD/JPY pair. The downside, however, remains cushioned amid the recent widening of the US-Japanese yield differential. In fact, the yield on the benchmark 10-year government bond shot to the highest level since November 24 amid expectations for a faster policy tightening by the Fed.
the money markets have been pricing in the possibility for an eventual liftoff by May and two more rate hikes by the end of 2022. This was reinforced by the fact that the US 2-year notes, which are sensitive to rate hike expectations along with 5-year notes, soared to the highest since February 2020. Conversely, the yield on the 10-year Japanese government bond remained near zero due to the Bank of Japan's yield curve control policy.
Hence, the focus will remain on Wednesday's release of the FOMC monetary policy meeting minutes, due later during the US session. In the meantime, traders might take cues from the US macro data – the ADP report on private-sector employment, Building Permits and the final Services PMI. Apart from this, the US bond yields might influence the USD price dynamics, which along with the broader risk sentiment should provide some impetus to the USD/JPY pair.
Technical levels to watch
USD/CNH is predicted to trade within the 6.3400-6.3900 range amidst the current mixed outlook, noted FX Strategists at UOB Group.
Key Quotes
24-hour view: “Yesterday, we highlighted that ‘there is scope for USD to edge higher to 6.3800’. We added, ‘a sustained rise above this level appears unlikely’. Our view was not wrong as USD rose to 6.3833 before easing off to close largely unchanged at 6.3753 (+0.02%). Upward pressure has waned and for today, USD is likely to trade sideways, expected to be between 6.3680 and 6.3830.”
Next 1-3 weeks: “Our view from yesterday (04 Jan, spot at 6.3735) still stands. As highlighted, the outlook for USD is mixed and it could trade between 6.3400 and 6.3900 for now.”
EUR/USD has been trading in a 1.1180-1.1380 range since late November. Economists at ING expect the pair to break the range to the downside in the first half of this new year.
EUR/USD to recover in the second half of 2022
“Our preference is still for the 1.1180-1.1380 range to be broken to the downside, but this may have to wait until US data is strong enough to convince investors of three Fed rate hikes this year (our house view) and a bigger multi-year tightening cycle.”
“We favour the break lower coming in the early part of the year since through 2H22 the market will start to shift its focus to the first ECB hike, probably coming in March 23.”
“In short, 1H22 may be the window for EUR/USD to break a new low (e.g. 1.08/1.10) before recovery is seen towards the end of the year.”
EUR/GBP struggled to establish itself above the 200-DMA (0.8590) which has resulted in extension of the downtrend. Economists at Société Générale expect the pair to plunge towards 0.8220 in case the 0.8300/0.8270 support zone gets violated.
Resistance seen at 0.8420
“The pair is now drifting towards the key support zone of 0.8300/0.8270 which happens to be the lower band of the range since December 2016. In the event this gets violated, the down move could deepen towards next projections at 0.8220 and 0.8110.”
“The high formed earlier this week at 0.8420 is near term hurdle.”
FX option expiries for January 5 NY cut at 10:00 Eastern Time, via DTCC, can be found below.
- EUR/USD: EUR amounts
- 1.1200 625m
- 1.1290 519m
- 1.1340 438m
- 1.1400 373m
- USD/JPY: USD amounts
- 113.45-55 1.2b
- AUD/USD: AUD amounts
- 0.7280-85 729m
- 0.7300 422m
- 0.7320 634m
Economists at Credit Suisse see scope for still sizable volatility in USD/TRY in the weeks ahead as the government continues to tackle lira weakness via unconventional policies. At current levels of around 13.40, they see mainly upside risk to USD/TRY.
Unconventional policies
“There is scope for still sizable moves in USD/TRY in the weeks ahead as the government experiments with unconventional measures. The fact that USD/TRY implied volatility remains at multi-year highs is justifiable.”
“We cannot forecast levels for USD/TRY with a high degree of confidence at this point but at current levels of around 13.40, we think USD/TRY risk remains weighted towards the upside.”
- DXY retreats modestly and retests the 96.20 area midweek.
- The US ADP report will be the salient event later in the NA session.
- The FOMC will publish its Minutes of the December meeting.
The greenback, in terms of the US Dollar Index (DXY), gives away part of the recent gains and retreats to the 96.20 zone on Wednesday.
US Dollar Index looks to data, FOMC
After two consecutive daily advances, the index meets some selling pressure and recedes from Tuesday’s peaks near 96.50 to revisit the 96.20 region on Wednesday.
The corrective downside in the buck appears in contrast to the firm note in yields in the US cash markets, where the short-term note flirts with 22-month peaks near 0.80% and the key10y reference approaches the 1.70% mark for the first time since later November.
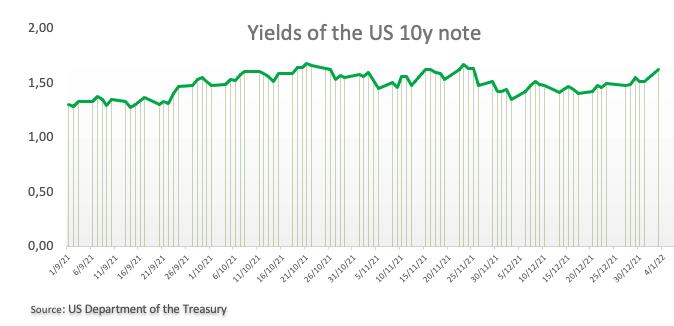
Further pressure around the greenback comes from the improvement in the risk complex, where the Dow Jones clinched new all-time highs on Tuesday and European reference stock indices opened on an upbeat note on Wednesday.
In the US docket, MBA Mortgage Applications in the week to December 31 are due seconded by the more relevant ADP report for the month of December. Later in the session, the FOMC will release the Minutes of the December’s meeting.
What to look for around USD
The index managed to regain the 96.00 barrier and above at the beginning of the new year, almost exclusively on the back of the move higher in US yields. As markets slowly return to normality, the dollar is forecast to remain bolstered by the Fed’s intentions to hike the interest rates later in the year amidst persevering elevated inflation, supportive Fedspeak, higher yields and the solid performance of the US economy.
Key events in the US this week: ADP Report, FOMC Minutes (Wednesday) - Initial Claims, ISM Non-Manufacturing, Factory Orders (Thursday) - Nonfarm Payrolls, Unemployment Rate (Friday).
Eminent issues on the back boiler: Start of the Fed’s tightening cycle. US-China trade conflict under the Biden’s administration. Debt ceiling issue. Potential geopolitical effervescence vs. Russia and China.
US Dollar Index relevant levels
Now, the index is retreating 0.16% at 96.12 and a break above 96.46 (weekly top Jan.4) would open the door to 96.90 (weekly high Dec.15) and finally 96.93 (2021 high Nov.24). On the flip side, the next down barrier emerges at 95.57 (monthly low Dec.31) followed by 95.51 (weekly low Nov.30) and then 94.96 (weekly low Nov.15).
- USD/CHF turned lower for the second successive day and was pressured by a combination of factors.
- A softer risk tone benefitted the safe-haven CHF and exerted pressure amid subdued USD demand.
- The downside seems cushioned ahead of the US economic releases and the FOMC meeting minutes.
The USD/CHF pair remained on the defensive through the early European session and was last seen hovering near the daily low, around mid-0.9100s.
A combination of factors failed to assist the USD/CHF pair to capitalize on the overnight late bounce, instead attracted fresh sellers near the 200-day SMA, around 0.9165-70 region on Wednesday. An extended selloff in the US money markets led to a corrective pullback in the US tech stocks on Tuesday. The spillover effect was evident from a generally weaker trading sentiment around the equity markets, which, in turn, benefitted the safe-haven Swiss franc.
The flight to safety was reinforced by retreating US Treasury bond yields, which undermined the US dollar and exerted some pressure on the USD/CHF pair for the second successive day. That said, expectations for a faster policy tightening by the Fed should act as a tailwind for the greenback. In fact, the money markets have been pricing in the possibility for an eventual liftoff by May and two more interest rate hikes by the end of 2022.
Hence, the market focus will remain glued to Wednesday's release of the FOMC meeting minutes, due later during the US session. In the meantime, traders might take cues from the US macro data – the ADP report on private-sector employment, Building Permits and the final Services PMI. Apart from this, the US bond yields might influence the USD price dynamics, which along with the broader market risk sentiment should provide some impetus to the USD/CHF pair.
Technical levels to watch
EUR/USD seems to have settled around 1.1300 mid-week. The pair remains indecisive in the near-term but the shared currency looks increasingly unlikely to outperform the greenback in a convincing way, in the view of FXStreet’s Eren Sengezer.
Euro unlikely to stage a convincing rebound ahead of US events
“The US T-bond yields' reaction to Wednesday's US events will be the key driver behind the dollar's market valuation. In case the benchmark 10-year US T-bond yield climbs above 1.7% on a hawkish Fed outlook, we could see EUR/USD turning south in the second half of the day. On the other hand, the pair's upside could remain capped even if the dollar weakens on falling yields.”
“On the upside, 1.1320 (20-period SMA, 50-period SMA, broken ascending trend line) aligns as the first technical hurdle before 1.1340 (static level) and 1.1360 (post-ECB high, static level).”
“Initial static support is located at 1.1270. With a daily close below that level, EUR/USD could target 1.1240 (static level) on the downside before testing 1.1200 (psychological level).”
With the EUR/GBP 0.8350 target reached, economists at Credit Suisse choose now to shift their target still lower to 0.8275, around the lows of 2020 and levels not materially breached since July 2016.
The prospect of a supportive BoE
“Although the BoE arguably did not handle well its hike messaging in Q4 of last year, as of now it has established itself as a pack leader when it comes to openness to monetary tightening, not least because it was prepared to act during peak omicron fears. With 10yr UK inflation breakevens again near 4%, the market is sending a clear message that more needs to be done for inflation expectations to be brought under control.”
The backdrop of markets still short GBP
“In terms of positioning, IMM data point to a continued large GBP short position in the market. The consistency of this backdrop has been a source of encouragement for our GBP-positive stance throughout our bullish phase over much of the last 12 months.”
Risk reversal skews still priced for GBP puts
“Although GBP implied volatility has tumbled of late, risk reversal skews remain well bid for GBP puts, suggesting there is still risk aversion that can be priced out in relation to the currency.”
More benign Brexit political outlook
“As far as Brexit / Northern Ireland Protocol negotiations go, we suspect the departure of hardliner Lord Frost as the key UK negotiator and his replacement by Foreign Secretary Truss could herald a more conciliatory stance by PM Johnson. Simply put, a disastrous election in May could be the beginning of the end for Johnson, raising the pressure on him to move the country forward economically rather than leaving it mired in persistent uncertainty and never-ending battles with the EU. For us, this lowers the risk to GBP from the political angle and helps our bullish stance.”
The Singapore economy is likely to see a robust expansion in 2022 which allows the MAS to focus on taming inflation. According to economists at TD Securities, January is the month to watch for any surprise move from the MAS. They expect the USD/SGD pair to edge lower to 1.32 by the second quarter.
MAS to wrestle with inflation in 2022
“We think external cost pressures are likely to remain in the quarters ahead while domestic policy developments and disinflationary effects from past policies could also contribute to higher inflation.”
“We see room for the MAS to take a more aggressive stance at its April 2022 policy review, with a combination of an upward re-centering of the midpoint and a 50bps increase in the slope of the policy band.”
“We can't completely rule out an off-cycle tightening before the April meeting, especially if global central banks start to tighten faster than expected.”
“Given our call for a more aggressive tightening, we expect the S$NEER to continue trending higher and for USD/SGD to trade lower to 1.32 by end of Q2 2022.”
Economists at Danske Bank continue to see a stronger CHF versus EUR. Notably, this does not imply a large risk-off event but rather, continued high inflation differentials amid a push towards a-cyclicals will likely be enough.
SNB is officially sidelined
“Whereas headline equities and especially small caps have been wobbling or outright retracing, the defensive sectors such as healthcare, utilities and staples have shown relative and outright strength. A push towards defensives, though with headline indices going higher, would likely complement our view for a stronger CHF over coming quarters.”
“With SNB lifting its short-term inflation forecast to 1.0% in 2022 (from 0.7%) this leaves room for the SNB to allow for a stronger nominal CHF to counteract the rising inflation pressures, which supports our narrative of a SNB refraining from intervention at current levels. This is further reinforced by strong Swiss CPI for December at 1.5% YoY.”
- GBP/USD edged higher on Wednesday amid subdued USD demand, though lacked bullish conviction.
- A softer risk tone acted as a tailwind for the safe-haven USD and kept a lid on any meaningful gains.
- The worsening COVID-19 situation in the UK capped the upside ahead of the US data/FOMC minutes.
The GBP/USD pair now seems to have entered a bullish consolidation phase and was seen oscillating in a range, around the 1.3530-40 region through the early European session.
Following the previous day's modest pullback from the 100-day SMA, around the 1.3555-60 region, the GBP/USD pair regained some positive traction on Wednesday amid subdued US dollar demand. Retreating US Treasury bond yields turned out to be a key factor that kept the USD bulls on the defensive through the first half of the trading.
The British pound was further underpinned by hopes that the Omicron outbreak won't derail the UK economy and rising bets for a further policy tightening by the Bank of England. That said, the worsening COVID-19 situation in the United Kingdom might hold back traders from placing aggressive bullish bets around the sterling.
In fact, Britain reported 218,724 coronavirus cases on Tuesday – the highest daily total since the pandemic began – amid the alarming spread of the highly transmissible Omicron strain. The UK Prime Minister Boris Johnson, however, had suggested that there would be no further tightening of measures soon to contain the outbreak.
Meanwhile, a generally weaker tone around the equity markets, along with speculations for a faster policy tightening by the Fed acted as a tailwind for the greenback. This might further contribute to capping any meaningful gains for the GBP/USD pair. Investors might also be reluctant ahead of Wednesday's release of the FOMC minutes.
Heading into the key event risk, traders will take cues from the US economic docket – featuring the ADP report on private-sector employment, Building Permits and the final Services PMI. This, along with the US bond yields and the broader market risk sentiment, might influence the USD and provide some impetus to the GBP/USD pair.
Technical levels to watch
Economists at Natixis believe that the energy transition since it is carried out primarily on the supply side will lead to high variability in energy prices and in inflation. What would be the consequences of high inflation variability? High variability in real wages, high variability in real interest rates and strong demand for inflation hedges and to higher term premia.
Towards high variability in inflation and therefore in the economy
“We believe that, structurally, inflation variability will be high in OECD countries (we look at the US and the eurozone) since, during the energy transition, the supply of fossil fuels may fall faster than demand for fossil fuels, leading to periodic sharp increases in energy prices.”
“If inflation has high variability, real wages will also have high variability. If the variability in real wages is persistently high, this will also be the case for the variability in consumption and GDP.”
“Inflation variability leads to variability in real interest rates and therefore in asset prices (equities, real estate). We have just seen that the sharp rise in inflation has driven down real interest rates sharply and driven up share prices and real estate prices.”
“Holders of nominal bonds (those paying a fixed nominal interest rate) are the losers from inflation variability. They will therefore try to hedge against inflation risk, which will drive up inflation risk premia. If central banks are expected to react to inflation, higher inflation variability also leads to increased term premia and steeper yield curves.”
According to economists at TD Securities, the Indian rupee is set to struggle in the weeks ahead. Position for renewed depreciation amid widening trade and current account deficits.
USD/INR to reach 75.4 by end Q1
“It's hard to see the trade and current account deficits narrow much, especially as oil prices are likely to move higher, while domestic demand continues to strengthen.”
Given that the Fed is primed to hike rates by mid-year and is accelerating the pace of tapering, India may struggle to see a rebound in portfolio inflows.”
“The worsening in India's broad basic balance position implies less support for INR and more susceptibility to bouts of risk aversion.”
“The rupee is looking stretched from a valuation perspective. As such, a weaker currency may help exporters, something that the RBI would likely want to encourage.”
“We forecast USD/INR to reach 75.4 by end Q1, with INR risks skewed to the downside.”
The strength of the US dollar has been too much for the New Zealand dollar, and that will likely persist for longer. However, the kiwi has reasons to rise when the dust settles – or at least to outperform its peers, in the opinion of FXStreet’s Analyst Yohay Elam.
New Zealand's dependence on dairy products is a positive for the kiwi
“The Reserve Bank of New Zealand (RBNZ) is not sitting on the sidelines – it raised interest rates both in October and then in November. The RBNZ is backed by a robust economy.”
“New Zealand has an advantage over other countries in that it relies on the export of agricultural goods, mostly dairy products. That contrasts Australia's metal resources and Canada's oil. If China imposes more lockdowns due to Omicron or extends the crackdown of its property sector, that would have no impact on its demand for food.”
“Another source of income for New Zealand is its tourism sector. Only recently has the country reopened to some visitors from abroad. If the economy is doing so well without foreign tourists, it could further thrive when they come back.”
“How does the Fed-driven dollar match with New Zealand's upbeat fundamentals? In the short-term, bears will likely remain on top, as King Dollar reigns supreme. They could receive further boosts from Nonfarm Payrolls and later from US inflation data. Later on, the kiwi could claw its way back up. While most economic releases in New Zealand are only quarterly, they tend to have a significant impact.”
In opinion of FX Strategists at UOB Group, USD/JPY faces the next hurdle at 116.50 ahead of 116.80 in the next weeks.
Key Quotes
24-hour view: “While we expected USD to strengthen yesterday, we were of the view that ‘the resistance at 115.80 is unlikely to come under threat’. However, USD cracked 115.80 with ease and soared to 116.34. Further USD strength is not ruled out but deeply overbought conditions suggest that 116.50 could be out of reach for today. Support is at 115.90 followed by 115.70.”
Next 1-3 weeks: “On Monday (03 Jan, spot at 115.20), we highlighted, there is room for USD to edge above Nov’s peak near 115.50. We added, ‘barring a surge in momentum, a sustained rise above this level appears unlikely’. In other words, we did not expect the manner by which USD surged to a high of 116.34 yesterday. The boost in momentum is likely to lead to further USD strength. The next resistance is at 116.50 followed by 116.80. On the downside, a breach of 115.30 (‘strong support’ level was at 114.80 yesterday) would indicate that the current upward pressure has eased.”
- USD/CAD edged higher on Wednesday, though the uptick lacked bullish conviction.
- Retreating US bond yields acted as a headwind for the USD and capped the upside.
- Bullish oil prices underpinned the loonie and held traders from placing bullish bets.
- Investors also seemed reluctant ahead of the US macro data, FOMC meeting minutes.
The USD/CAD pair traded with a positive bias heading into the European session and was last seen hovering just a few pips below the daily high, around the 1.2715 region.
The pair managed to attract some buying on Wednesday and built on the overnight bounce from the 1.2665 area, though the uptick lacked follow-through buying or bullish conviction. Retreating US Treasury bond yields kept the US dollar bulls on the defensive and capped gains for the USD/CAD pair.
That said, speculations for a faster policy tightening by the Fed, along with a softer risk tone extended some support to the safe-haven greenback. In fact, the money markets have been pricing in the possibility for an eventual liftoff by May and two more interest rate hikes by the end of 2022.
This was reinforced by the fact that the US 2-year notes, which are highly sensitive to rate hike expectations along with 5-year notes, soared to levels not seen since February 2020 on Tuesday. Moreover, the yield on the benchmark 10-year bond shot to the highest level since November 24.
Meanwhile, an extended selloff in the US bond markets led to the overnight corrective pullback in the US tech stocks. The spillover effect was evident from a generally weaker sentiment around the Asian equity markets, which could further benefit the greenback's relative safe-haven status.
On the other hand, the commodity-linked loonie drew some support from bullish crude oil prices, though signs of declining global energy demand amid a massive spike in COVID-19 cases acted as a headwind. The market worries resurfaced after API reported that US fuel stockpiles rose last week.
The fundamental backdrop supports prospects for further gains, though traders preferred to wait for the release of FOMC minutes later during the US session. In the meantime, the US macro data – the ADP report, Building Permits and the final Services PMI – might provide some impetus to the USD/CAD pair.
Technical levels to watch
Open interest in natural gas futures markets rose for the second straight session on Tuesday, now by around 8.5K contracts according to advanced prints from CME Group. In the same line, volume increased by around 68.3K contracts after two consecutive daily pullbacks.
Natural Gas stays capped by $4.00
Tuesday’s negative session in prices of natural gas was amidst rising open interest and volume, opening the door to the continuation of the leg lower in the very near term at least. Occasional bullish attempts, in the meantime, appear limited by the 200-day SMA, today at the $4.00 mark per MMBtu.
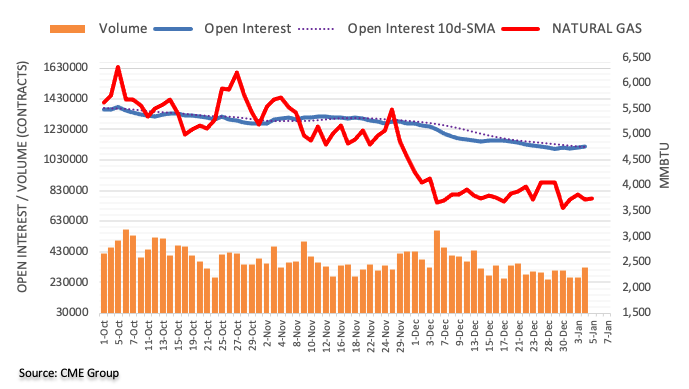
XAU/USD tested $1,800 on Tuesday but ended up closing the day in the positive territory above $1,810. Gold awaits Fed minutes for the next directional move.
Impending bull cross on the daily sticks
“Traders mull the Fed’s rate hike prospects this year, prompting a pullback in the Treasury yields while keeping gold price afloat. Meanwhile, a cautious market, in the wake of covid concerns and Fed speculation, will likely keep bulls cheerful. However, the sentiment around the yields will continue to lead the way for gold price.”
“The 21-Daily Moving Average (DMA) is looking to cross the 200-DMA to the upside. If that materializes, then bulls could get the much-needed impetus to extend the recovery from the 200-DMA support, as a test of the $1,820 round figure remains on the table. Further up, the monthly high of $1,832 will be challenged once again.”
“To the south, immediate support is seen at the horizontal 50-DMA at $1,805, below which the confluence of the 21 and 200-DMAs at $1,800 will offer strong support to gold bulls. The next best safety net for gold optimists is envisioned at $1,793, the 100-DMA cap.”
- WTI struggles after rising to the highest level since late November, pauses two-day uptrend.
- Successful trading above the key DMAs, bullish MACD signals keep buyers hopeful.
WTI crude oil consolidates early Asian session losses while picking up bids to $76.80 ahead of Wednesday’s European trading bell. In doing so, the black gold battles a downward sloping resistance line from October 25.
Given the firmer MACD signals and the commodity’s ability to stay beyond the 100-DMA, as well as the 200-DMA, the US oil benchmark remains on the bull’s radar.
That said, the short-term descending trend line restricts the quote’s immediate upside around $77.00, a break of which will direct WTI prices towards the late November’s peak near $79.00.
During the commodity’s upside past $79.00, the $80.00 round figure and November 09 top near $83.60 may offer intermediate halts before highlighting October’s peak surrounding $85.00 for the WTI bulls.
On the contrary, 61.8% Fibonacci retracement (Fibo.) of October-December downside, near $76.30, restricts the short-term downside of the commodity ahead of the 100-DMA level of $74.55.
In a case where the oil prices remain weak below $74.55, a convergence of the 200-DMA and 38.2% Fibo. around $71.00 becomes the key for WTI sellers to watch for further control.
WTI: Daily chart
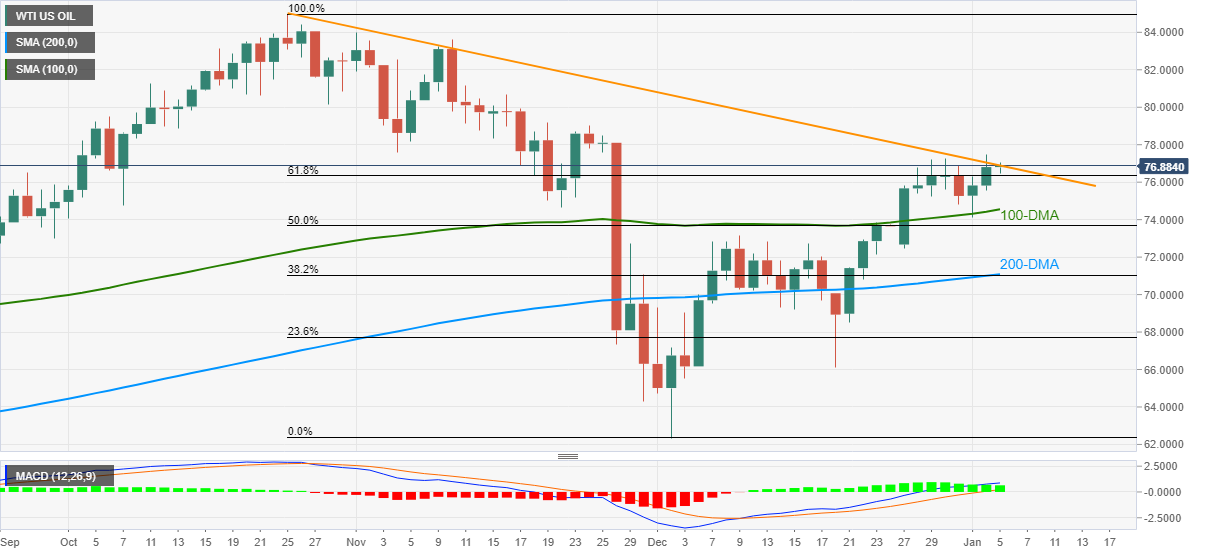
Trend: Further upside expected
According to FX Strategists at UOB Group, AUD/USD could lose further ground and retest the 0.7165/30 band in the next weeks.
Key Quotes
24-hour view: “Our expectations for AUD to ‘weaken further’ yesterday was incorrect as it rebounded strongly to 0.7249. The sharp rebound appears to be running ahead of itself and the upside risk appears to be limited. For today, AUD is likely to trade sideways between 0.7215 and 0.7265.”
Next 1-3 weeks: “There is no change in our view from yesterday (04 Jan, spot at 0.7195). As highlighted, AUD is likely to trade with a downward bias. Support is at 0.7165 followed by 0.7130. On the upside, a breach of 0.7265 (no change in ‘strong resistance’ level) would indicate that our view is incorrect.”
Here is what you need to know on Wednesday, January 5:
The greenback gathered strength against its rivals during the first half of the day on Tuesday but lost its momentum in the late American session. The risk-averse market environment caused US Treasury bond yields to retreat and the US Dollar Index pulled away from the two-week high it set earlier in the day. Later in the day, the US private sector employment report published by the ADP and the FOMC's minutes of the December policy meeting will be watched closely by market participants. The IHS Markit will release the final revisions to Services and Composite PMI data for the euro area, Germany and the US as well.
Reflecting the souring marked mood, the Shanghai Composite Index is losing 1% and US stocks futures are down between 0.3% and 0.55%. Ongoing concerns surrounding the Chinese real estate giant Evergrande, inflation fears and the rapid spread of the coronavirus Omicron variant force risk rallies to remain limited.
Meanwhile, the data from the US showed on Tuesday that the business activity in the manufacturing sector expanded at a softer pace than expected in December. On a positive note, the Prices Paid component of the ISM Manufacturing PMI dropped sharply to 68.2 from 82.4 in November.
EUR/USD closed the second straight day in the negative territory on Tuesday but it seems to have settled around 1.1300 in the early European session.
GBP/USD dropped below 1.3500 but managed to regather its bullish momentum. British Prime Minister Boris Johnson said that they have a chance to "ride out this Omicron wave" without imposing lockdowns and helped the pound find demand.
USD/JPY extended its rally to a fresh five-year high above 116.00 on Tuesday. With the benchmark 10-year US Treasury bond yield edging lower early Wednesday, the pair is trading in the negative territory near 116.00.
Gold's inverse correlation with US Treasury bond yields remains intact mid-week. XAU/USD tested $1,800 on Tuesday but ended up closing the day in the positive territory above $1,810.
Bitcoin continues to trade near the lower limit of its one-month-old trading range at $46,000. Ethereum closed little changed on Tuesday and started to edge higher toward $4,000 early Wednesday.
CME Group’s flash data for crude oil futures markets showed traders added around 1.1K contracts to their open interest positions on Tuesday. Volume followed suit and went up for the third session in a row, this time by around 239.5K contracts.
WTI looks constructive above the 200-day SMA
Prices of the WTI extended the optimism in the first half of the week. Tuesday’s uptick comes against the backdrop of rising open interest and volume, which remain supportive of higher prices in the very near term. Above the 200-day SMA at $71.25, the outlook for the commodity remains constructive, with the next target for bulls at the key $80.00 mark per barrel.
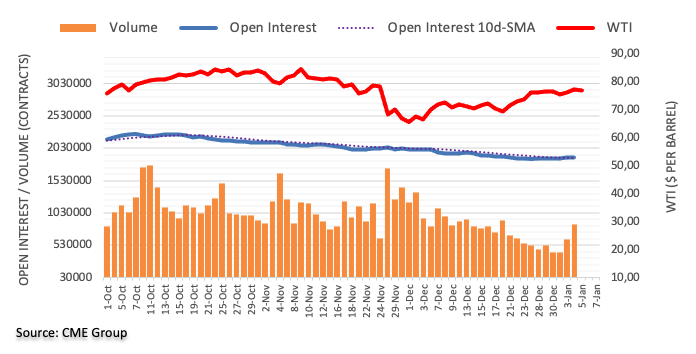
- A softer risk tone acted as a headwind for the perceived riskier aussie on Wednesday.
- Retreating US bond yields undermined the USD and extended support to AUD/USD.
- Investors now look forward to the US macro data/FOMC minutes for a fresh impetus.
The AUD/USD pair edged lower heading into the European session and was last seen trading near the daily low, around the 0.7225-20 region.
The pair struggled to capitalize on the previous day's goodish rebound from a near two-week through and met with a fresh supply near the 0.7245-50 region on Wednesday. An extended selloff in the US money markets led to the overnight corrective pullback in the US tech stocks. The spillover effect was evident from a generally weaker trading sentiment around the Asian equity markets, which, in turn, weighed on the perceived riskier aussie.
The downside, however, remains cushioned amid subdued US dollar demand, undermined by retreating US bond yields. That said, expectations for a faster policy tightening by the Fed should act as a tailwind for the greenback. The money markets have been pricing in the possibility for an eventual liftoff by May and two more rate hikes by the end of 2022. This was reinforced by the recent sharp surge in the US Treasury bond yields.
In fact, the US 2-year notes, which are highly sensitive to rate hike expectations along with 5-year notes, soared to their highest since February 2020 on Tuesday. Adding to this, the yield on the benchmark 10-year government bond shot to the highest level since November 24. Hence, the focus will remain on the FOMC meeting minutes, due later this Wednesday.
In the meantime, traders might take cues from the US economic docket – featuring the ADP report on private-sector employment, Building Permits and the final Services PMI. This, along with the US bond yields and the broader market risk sentiment, might produce some short-term trading opportunities around the AUD/USD pair.
Technical levels to watch
- USD/CNH snaps two-day uptrend, pokes intraday low at the latest.
- Chinese authorities are seen implementing more drastic current control measures.
- Evergrande seeks to delay onshore bond payment during this weekend’s meeting.
- Market sentiment remains sluggish, yields retreat, stock futures ease ahead of the US catalysts.
USD/CNH remains on the back foot, extending pullback from a two-week high to $6.3745 during early Wednesday morning in Europe.
In doing so, the offshore Chinese currency (CNH) pair ignores recent concerns suggesting the policymakers’ readiness to restrict the domestic currency’s gains. “If USD/CNY shorts continue to ignore the shrinking gap between Treasury yields and Chinese sovereign bonds, the PBOC may also lower rates again, which would serve Beijing's interests in propping up the flagging economy,” said Reuters while citing Chinese outlet.
On the same line were chatters surrounding the troubled real-estate firmer Evergrande. Reuters mentions, “China Evergrande Group will seek a six-month delay in the redemption and coupon payments of a 4.5 billion yuan ($156.92 million) bond in a meeting with bondholders this weekend, underscoring the pressure on the debt-laden property developer.”
Elsewhere, mixed signals concerning the South African covid variant, namely Omicron, as well as the Fed’s next moves challenge the market moves ahead of awaiting the US ADP Employment Change for December, expected 400K versus 534K prior, as well as FOMC Minutes. While portraying the mood, US Treasury yields drop from a six-week high whereas stocks in Asia-Pacific grind lower, with major losses in China and Hong Kong.
The upbeat scientific studies and comments from the World Health Organization (WHO) Incident Manager Abdi Mahamud tamed fears concerning the South African covid variant, namely Omicron. However, the faster spread of the virus variant and news of another strain being found in France, having more pace in spreading than Omicron, challenge the market’s optimism of overcoming the pandemic.
On a different page, mixed US data and a pause in the US Treasury yields, as well as receding inflation expectations, also challenge the USD/CNH traders. It’s worth noting that Minneapolis Fed President and 2022 voting FOMC member Neil Kashkari signaled the need for two rate hikes but couldn’t match the money market bets for three such actions in 2022, which in turn probed gold buyers the previous day.
Moving on, likely actions by the Chinese authorities and Evergrande woes may recall the USD/CNH bulls but expected weakness in the US ADP figures could delay the run-up. Even so, the hawkish tone of the policymakers in the FOMC Minutes will be enough to recall the pair bears.
Technical analysis
Unless crossing a two-month-old resistance line, around $6.3870, USD/CNH remains vulnerable to revisit the multi-day bottom marked in 2021 surrounding $6.3300.
Cable is forecast to extend the range bound theme within the 1.3370-1.3560 area in the next weeks, suggested FX Strategists at UOB Group.
Key Quotes
24-hour view: “While we held the view yesterday that GBP ‘is unlikely to weaken further’, we expected it to ‘trade sideways’. However, GBP soared to 1.3557 before closing on a firm note at 1.3527 (+0.34%). Despite the advance, upward momentum has not improved by much. For today, GBP could edge above 1.3560 before the risk of a pullback would increase. The next resistance at 1.3600 is unlikely to come under threat. On the downside, a breach of 1.3480 (minor support is at 1.3505) would indicate that the current upward pressure has eased.”
Next 1-3 weeks: “There is no change in our view from yesterday (04 Jan, spot at 1.3480). As highlighted, the current movement is viewed as part of a consolidation phase and GBP is likely to trade between 1.3370 and 1.3560 for now. Looking ahead, if GBP closes above the major resistance at 1.3560, it would indicate that GBP is likely to advance to 1.3600 and above.”
Considering preliminary readings from CME Group for gold futures markets, open interest shrank for the second session in a row on Tuesday, now by around 3.2K contracts. Volume, instead, rose for the second consecutive day, this time by nearly 5K contracts.
Gold stays supported by the 200-day SMA
Gold prices edged higher on Tuesday amidst shrinking open interest, which is indicative that extra gains appear out of favour in the very near term. Against that, prices of the ounce troy of the precious metal remain supported by the $1,800 region, where also coincides the 200-day SMA.
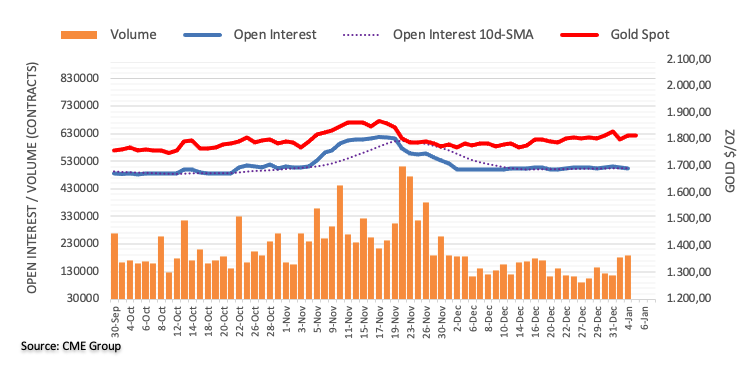
- Palladium refreshes intraday low, fades early-week bounce from the key SMAs.
- RSI retreat, downside break of 50-SMA favor sellers.
Palladium (XPD/USD) takes offers to refresh intraday low around $1,850, down 0.76% on a day ahead of Wednesday’s European session.
In doing so, precious metal justifies the failure to cross a one-week-old horizontal resistance, as well as a clear downside below 50-SMA.
Given the RSI retreat adds to the bearish bias, the XPD/USD prices are likely to revisit the key SMAs it bounced from during the early weekdays.
That said, the 100-SMA level of $1,830 acts as immediate support ahead of the 200-SMA surrounding $1,820.
Should palladium bears keep reins past $1,820, the $1,800 threshold and 61.8% Fibonacci retracement of late December upside, close to $1,721, will be in focus.
Meanwhile, corrective pullback remains elusive below the 50-SMA level of $1,926 while the weekly horizontal line near $1,885 and the $1,900 round figure may test the short-term buyers of the commodity.
In a case where XPD/USD remains firmer past $1,925, the odds of its run-up towards the December 2021 peak of $1,998 can’t be ruled out.
Palladium: Four-hour chart
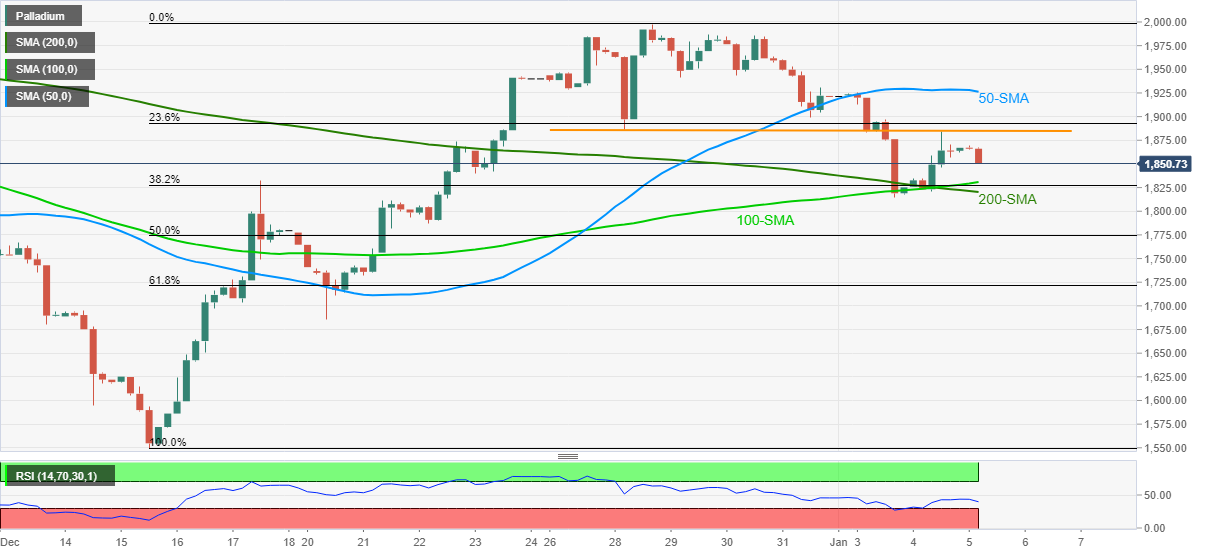
Trend: Further weakness expected
UOB Group’s FX Strategists noted EUR/USD could navigate within the 1.1240-1.1395 range in the next weeks.
Key Quotes
24-hour view: “We highlighted yesterday that EUR ‘is unlikely to weaken much further’ and expected it to consolidate and trade between 1.1275 and 1.1345”. EUR subsequently traded within a narrower range than expected (1.1270/1.1322) before closing little changed at 1.1285 (-0.08%). While the underlying tone has weakened somewhat, the downside risk appears to be limited. From here, EUR could edge lower, but any weakness is viewed as part of a trading range of 1.1265/1.1310.”
Next 1-3 weeks: “Our view from yesterday (04 Jan, spot at 1.1305) still stands. As highlighted, while downward momentum has improved a tad, the outlook for EUR is unclear for now. From here, EUR could trade between 1.1240 and 1.1395.”
- Gold prices struggle for clear direction after bouncing off key support the previous day.
- Market sentiment dwindles as Omicron fears ebb, indecision over Fed’s next moves.
- Yields retreat from multi-day top, DXY softens ahead of early signals for Friday’s NFP, FOMC Minutes.
- Bang and Plunge: 2022 replays 2021 for gold
Gold (XAU/USD) prices grind higher past $1,815 heading into Wednesday’s European session. In doing so, the yellow metal struggles to extend the previous day’s recovery moves from the 200-DMA as markets await the key catalysts from the US.
The upbeat scientific studies and comments from the World Health Organization (WHO) Incident Manager Abdi Mahamud tamed fears concerning the South African covid variant, namely Omicron. However, the faster spread of the virus variant and news of another strain being found in France, having more pace in spreading than Omicron, challenge the market’s optimism of overcoming the pandemic.
On a different page, mixed US data and a pause in the US Treasury yields, as well as receding inflation expectations, tease the gold buyers.
The ISM Manufacturing PMI dropped to the lowest in 11 months in December, 58.7 versus 60.0 forecast and 61.1 prior whereas November’s JOLTS Jobs Openings came in lower than the upwardly revised previous reading of 11.091M to 10.562M. Further, US inflation expectations, as per 10-Year Breakeven Inflation Rate numbers from the Federal Reserve Bank of St. Louis (FRED) eased from a six-week high.
It’s worth noting that Minneapolis Fed President and 2022 voting FOMC member Neil Kashkari signaled the need for two rate hikes but couldn’t match the money market bets for three such actions in 2022, which in turn probed gold buyers the previous day.
Amid these plays, S&P 500 Futures drop 0.40% whereas the US 10-year Treasury yields drop 1.5 basis points (bps) to 1.65% while portraying a pullback from a six-week high.
Hence, the market sentiment is mostly mixed, slightly bearish, but the gold traders await the US ADP Employment Change for December, expected 400K versus 534K prior, as well as Federal Open Market Committee (FOMC) Meeting Minutes. Should the Fed policymakers agree over a faster pace of rate hikes in 2022, gold buyers have a reason to worry.
Read: US ADP December Preview: Suddenly its inflation, not jobs
Technical analysis
Gold stays above 200-DMA with firmer MACD and RSI adding to the bullish bias targeting another battle with the $1,834 hurdle comprising tops marked during July and September.
In a case where the gold buyers manage to cross the $1,834 hurdle, the run-up towards $1,850 and November’s swing high near $1,877 can’t be ruled out.
Meanwhile, a daily closing below 200-DMA surrounding $1,800 is a call to the gold sellers as an upward sloping trend line from August, near $1,780, becomes crucial support to watch afterward.
Though, a sustained break of $1,780 will make gold vulnerable to challenge December’s low of $1,753.
To sum up, gold buyers are gradually tightening their grips ahead of this week’s key data/events.
Gold: Daily chart
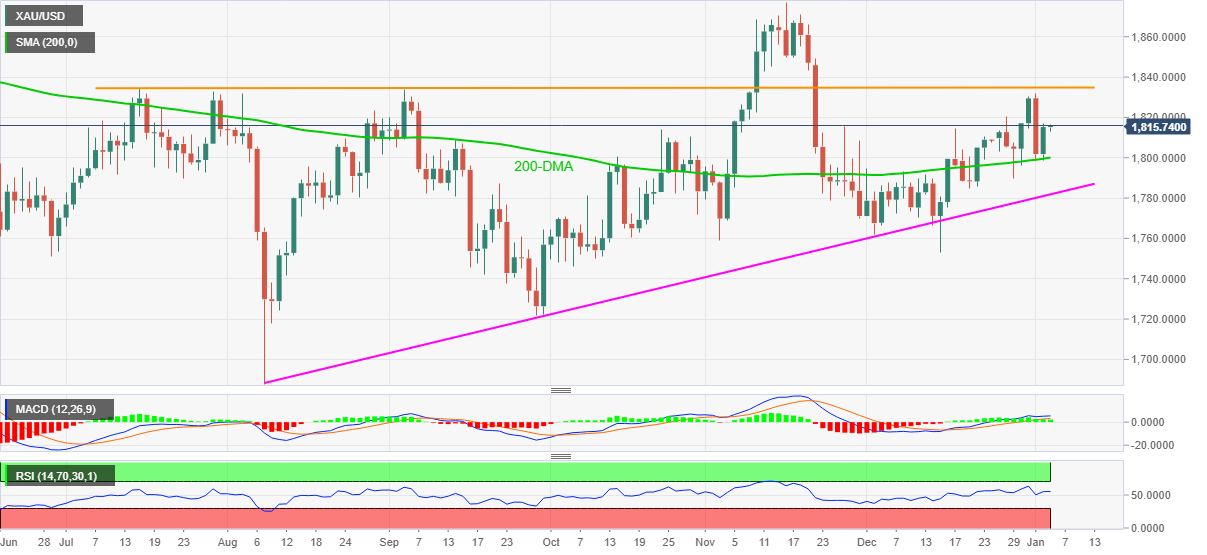
Trend: Further upside expected
- EUR/GBP snaps the downbeat momentum, rebounds from two-year lows.
- The cross clings to the critical daily support line at 0.8341.
- RSI sits above the oversold region, keeping sellers hopeful.
EUR/GBP is attempting a bounce heading into the European session, having hit a new two-year low of 0.8335 in the Asian trading.
At the time of writing, EUR/GBP is trading at 0.8345, up 0.09% on the day, struggling to recapture the 0.8350 psychological barrier.
On the daily chart, the EUR/GBP cross has reclaimed ground above the two-month-long falling trendline support at 0.8341.
Although bulls remain cautious after the price closed Tuesday beneath the latter. A downside breakout from the trendline support open floors for a deeper decline towards the February 2020 trough of 0.8282.
The bears, however, need to crack the 0.8300 round level support beforehand.
The 14-day Relative Strength Index (RSI) has rebounded from lower levels, supporting the corrective pullback in the pair. But the leading indicator sits above the oversold region, suggesting that there is more room left to the downside.
EUR/GBP daily chart
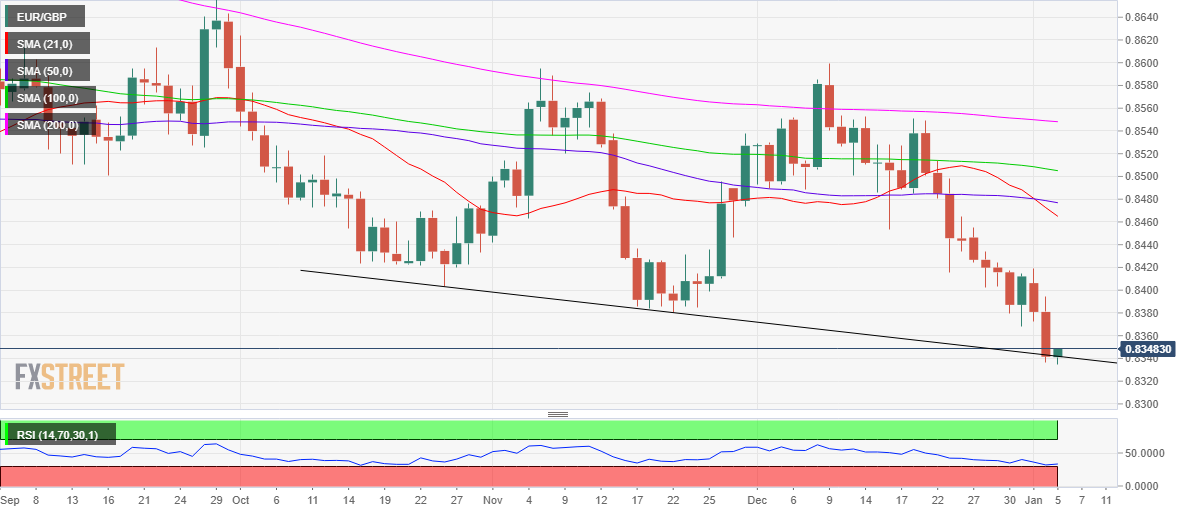
Alternatively, if the upturn in the spot gathers traction, then a rally towards 0.8400 will be inevitable. Tuesday’s high hangs around the round figure.
Fresh buying opportunities will emerge above that level, calling for a test of Monday’s high of 0.8419.
EUR/GBP additional levels
- Asia-Pacific markets traded mixed, mostly bearish, as investors await the key US data/events.
- Omicron fears ebb but Evergrande keeps weighing on the Asian market sentiment.
- Yields signal Fed’s hawkish path but US data, FOMC Minutes eyed for now.
Asian shares remain on the back foot during early Wednesday, despite mixed concerns and an absence of major data/events. The reason could be linked to the fears emanating from China and the Fed’s next move ahead the US ADP Employment Change for December and FOMC Minutes.
With the Chinese policymakers’ readiness to arrest yuan gains battling sustained financial tensions relating to the struggled real-estate firm Evergrande, markets in Beijing print losses of late. Adding to the bearish bias was the heavy sell-off by the technology shares in Wall Street, led by strong US Treasury yields.
Alternatively, receding fears of the South African covid variant, namely Omicron and recently downbeat US data, not to forget hopes of a faster recovery in Asia-Pacific than the West, keeps investors hopeful.
That said, the MSCI’s index of Asia-Pacific shares ex-Japan drops around 1.0% whereas Japan’s Nikkei 225 consolidates the previous day’s gains heading into the European session. That said, Australia’s ASX 200 prints mild losses tracking China but New Zealand’s optimism concerning the virus help NZX 50 to rise 0.15% intraday at the latest.
Moving on, Hong Kong’s Hang Sang and South Korea’s KOSPI drop over 1.0% but Indonesia’s IDX Composite rises 0.40% by the press time. India’s BSE Sensex also prints mild gains at the latest amid recently easing virus cases and hopes of further stimulus at home.
On a broader front, S&P 500 Futures drop 0.40% whereas the US 10-year Treasury yields drop 1.5 basis points (bps) to 1.65% while portraying a pullback from a six-week high.
Looking forward, the anticipated easing in the ADP may help keep the investors hawkish but readiness for a faster rate hike in 2022 by the Fed policymakers, per FOMC Minutes, will be enough to recall the pair bears.
Read: US T-bond yields retreat from six-week high, S&P 500 Futures ease amid cautious sentiment
- USD/JPY consolidates the heaviest daily gains in six weeks near five-year top.
- Bullish flag, sustained trading above 50-HMA keeps buyers hopeful.
- Bears may wait for downside break of November’s top, 116.20 acts as the key resistance.
- Overbought RSI triggered pullback on D1, 114.00 is crucial support.
USD/JPY pulls back from five-year high to retest 116.00, down 0.06% intraday heading into Wednesday‘s European session.
In doing so, the yen pair seesaws inside a short-term bull-flag chart pattern amid overbought RSI on the daily and bearish MACD signals on the hourly formations. That said, the quote’s latest weakness could be linked to a downside break of the weekly support line, now resistance.
It’s worth noting that the stated flag’s support line near 115.90 restricts the quote’s immediate downside ahead of the 50-HMA level of 115.67.
Meanwhile, a convergence of the previous support and flag’s upper line, near 116.20, appears a tough nut to crack for the USD/JPY bulls.
USD/JPY: Hourly chart
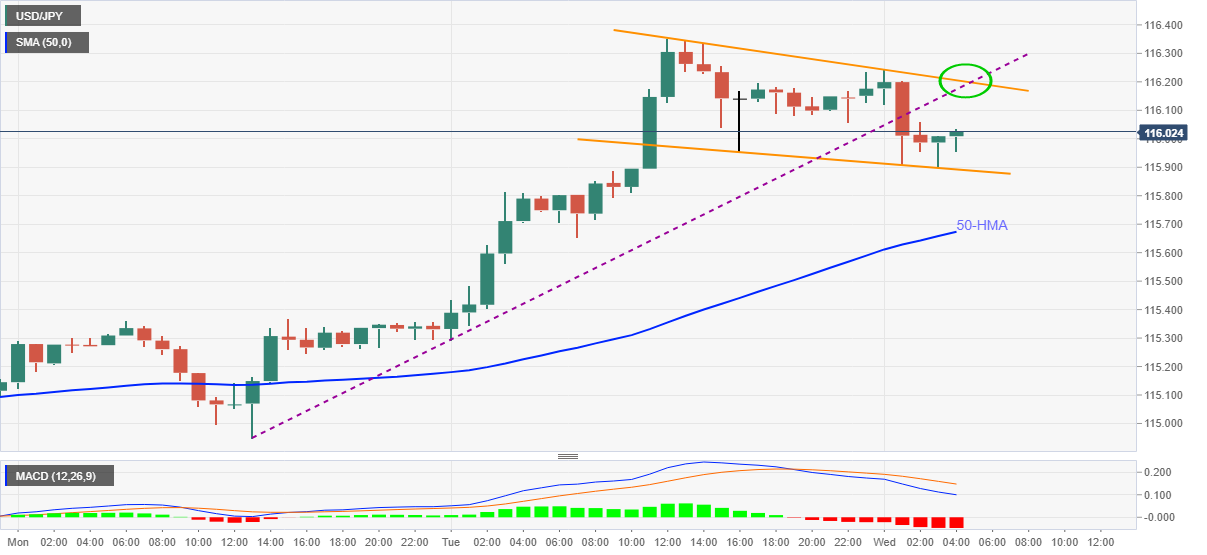
In contrast to the hourly chart, the daily play suggests that the USD/JPY bulls are running out of steam, per overbought RSI, around an upward sloping trend line from October around 116.50.
The pullback moves, however, remain less worrisome until breaking a two-week-old support line near 115.25.
Even so, the USD/JPY pair seller remains cautious until the quote stays beyond 50-DMA and an upward sloping trend line from September, close to 114.00.
To sum up, USD/JPY traders are seeking fresh clues around the multi-day top.
USD/JPY: Daily chart
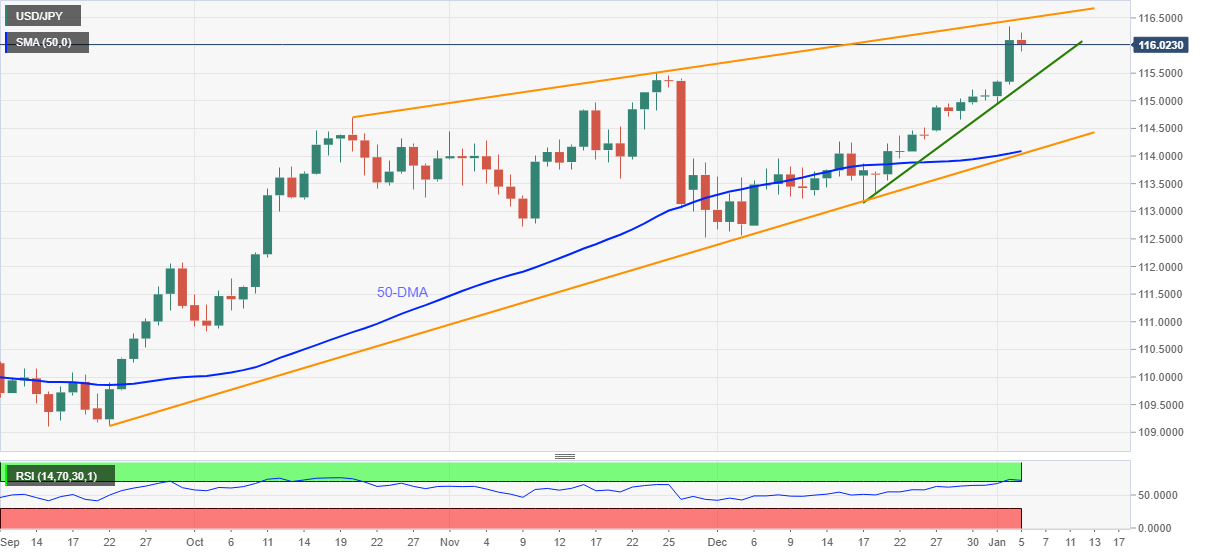
- EUR/USD bounces off fortnight low to consolidate recent losses, snaps two-day downtrend.
- US Treasury yields retreat amid mixed concerns over Omicron, Fed’s next move.
- European data contrasted softer US statistics, inflation expectations but Bund v/s Bond moves weighed on pair.
- Risk catalysts, second-tier figures from the bloc are also important for clear direction.
EUR/USD struggles to defend the bounce off two-week low, retreating to 1.1290 ahead of Wednesday’s European session.
A disparity between the US and German Treasury bond yields joined chatters surrounding the South African covid variant, namely Omicron, as well as the relating to the US Federal Reserve’s (Fed) next moves, to refresh fortnight low the previous day. However, the market’s indecision ahead of the US ADP Employment Change for December and FOMC Minutes seems to challenge the pair’s latest moves.
That said, the US Treasury yields struggle to extend the previous run-up while taking rounds to the six-week high flashed on Tuesday. On the contrary, German Bund yields retreated from a two-month high the previous day.
Talking about the data, German Retail Sales for December crossed MoM forecasts of -0.5% with +0.6%, the US figures came in comparatively weaker. That said, the ISM Manufacturing PMI dropped to the lowest in 11 months in December, 58.7 versus 60.0 forecast and 61.1 prior, whereas November’s JOLTS Jobs Openings came in lower than the upwardly revised previous reading of 11.091M to 10.562M.
Other than the data, receding US inflation expectations and mixed comments from Minneapolis Fed President and 2022 voting FOMC member Neil Kashkari also challenge EUR/USD bears.
US inflation expectations, as per 10-Year Breakeven Inflation Rate numbers from the Federal Reserve Bank of St. Louis (FRED) eased from a six-week high, while Fed’s Kashkari signaled the need for two rate hikes but couldn’t match the money market bets for three such actions in 2022.
Elsewhere, the World Health Organization (WHO) Incident Manager Abdi Mahamud sounds hopeful of overcoming the virus with lesser damage and challenging the US dollar’s safe-haven demand. "We are seeing more and more studies pointing out that Omicron is infecting the upper part of the body. Unlike other ones, the lungs who would be causing severe pneumonia," WHO Incident Manager Abdi Mahamud told Geneva-based journalists per Reuters.
That said, the EUR/USD pair’s near-term momentum depends upon the US data and Federal Open Market Committee (FOMC) Meeting Minutes. Although market forecasts and recent job-linked data signal a downbeat print of ADP, which in turn could favor EUR/USD rebound, a hawkish surprise from the FOMC Minutes can’t be ruled out.
Read: US ADP December Preview: Suddenly its inflation, not jobs
Technical analysis
Despite the latest rebound, EUR/USD justifies the bearish cross of the 50-HMA under 200-HMA, as well as a clear downside break of an upward sloping trend line from December 19, currently around 1.1305. Given the steady RSI line baking the aforementioned bearish technical catalysts, the latest grind to the south may continue.
Meanwhile, the corrective pullback may aim for the previous support line near 1.1305 but may remain elusive until crossing the 200-HMA level close to 1.1325.
- GBP/USD seesaws around two-month top, indecisive of late.
- Post-Brexit border checks widen supply crunch, no major meetings on the calendar.
- UK PM Johnson hopes to overcome virus wave without lockdown, Frost joins Tory anti-Covid regulations group.
- US ADP Employment Change, FOMC Minutes will be crucial for immediate direction.
GBP/USD hangs in balance around 1.3530 during the early Wednesday morning in Europe.
The cable pair portrays the market’s cautious sentiment around the highest levels in two months while consolidating the previous day’s gains inside a 20-pip trading range. It’s worth noting that an absence of major updates over Brexit and mixed concerns surrounding the South African covid variant, namely Omicron, adds filters to the GBP/USD pair’s latest moves.
Starting with the Brexit, Bloomberg spots the recent challenges faced by the British haulers due to the post-Brexit border checks and IT changes. “U.K. traders are falling foul of a new IT system policing goods crossing the English Channel, as companies grapple with a fresh wave of post-Brexit red tape.” The same adds to the already strained supply chain and challenges GBP/USD bulls. However, an absence of a major meeting between the European Union (EU) and the UK diplomats on the calendar seems to keep the impasse on the table for a while. It’s worth noting that the ex-Brexit Minister David Frost recently joined the Tory group that is against covid-linked regulations.
Elsewhere, the UK records over 200,000 daily covid infections and refreshed all-time high but upbeat scientific studies and comments from the World Health Organization (WHO) Incident Manager Abdi Mahamud helped UK PM Boris Johnson to stay positive. In his latest national address, UK PM Johnson said, “We have a chance to ride out this Omicron wave without lockdowns.”
On the other hand, the UK Manufacturing PMI rose past 57.6 previous forecast to 57.9 in December whereas the US ISM Manufacturing PMI dropped to the lowest in 11 months in December, 58.7 versus 60.0 forecast and 61.1 prior. Further, November’s US JOLTS Jobs Openings came in lower than the upwardly revised previous reading of 11.091M to 10.562M.
Additionally, comments from Minneapolis Fed President and 2022 voting FOMC member Neil Kashkari joined downbeat US inflation expectations, as per 10-Year Breakeven Inflation Rate numbers from the Federal Reserve Bank of St. Louis (FRED) also favored GBP/USD bulls the previous day.
Looking forward, the anticipated easing in the ADP may help the GBP/USD pair to remain firm. However, the hawkish tone of the policymakers in the FOMC Minutes will be enough to recall the pair bears.
Read: US ADP December Preview: Suddenly its inflation, not jobs
Technical analysis
A 12-day-old rising wedge challenges the GBP/USD buyers amid sluggish oscillators. Though, the sellers may wait for a confirmation of the bearish chart pattern, as well as breaking the 50-SMA level of 1.3465, before taking fresh entry. Meanwhile, the wedge’s resistance line and multi-day-old horizontal hurdle surrounding 1.3610 will challenge the pair buyers during further advances.
- GBP/JPY consolidates the heaviest daily gains since September 23 around 10-week high.
- Mid-October tops restrict immediate upside, RSI signals short-term downside.
- 10-DMA adds to the downside filters, yearly peak on bull’s radar.
GBP/JPY refreshes intraday low around 156.85, down 0.12% intraday during early Wednesday morning in Europe.
The cross-currency pair jumped to the highest levels last seen on October 26 while posting the biggest daily jump in over three months the previous day. However, overbought RSI and mid-October peaks allowed GBP/JPY bulls to take a breather afterward.
The latest weakness directs the quote towards a horizontal area from May, around 156.00, but the 10-DMA level of 155.10, may restrict the further downside.
In a case where the GBP/JPY prices drop below 155.10, the 155.00 threshold and November's high of 154.74 will challenge the pair bears.
Alternatively, a clear upside break of the latest swing high near 157.45 will direct GBP/JPY bulls towards 157.80 and the 158.00 round figure before challenging the last year’s peak of 158.22.
It’s worth observing that the pair’s ability to stay beyond 158.22 will push it towards the 160.00 psychological magnet before May 2016 peak around 163.90.
GBP/JPY: Daily chart
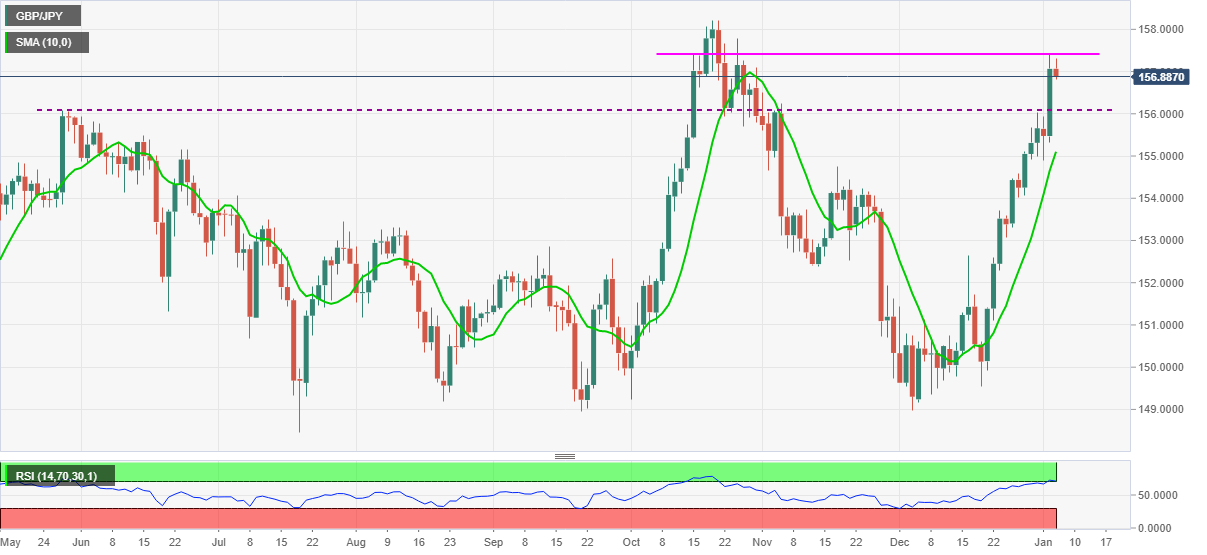
Trend: Pullback expected
In order to check the appreciation in the yuan against the US dollar, the Chinese authorities are seen implementing more drastic measures after the recent multi-pronged attempts, Reuters reports, citing China’s media outlet.
Key takeaways
“Chinese FX authorities may therefore intervene more aggressively, and directly, in the yuan market.”
“If USD/CNY shorts continue to ignore the shrinking gap between Treasury yields and Chinese sovereign bonds, the PBOC may also lower rates again, which would serve Beijing's interests in propping up the flagging economy.”
Meanwhile, USD/CNY is trading flatlined around 6.3721, as of writing, having recovered sharply from over three-year lows of 6.3384 reached last week.
Ahead of Wednesday’s December Federal Reserve (Fed) meeting’s minutes, Lisa Shalett, Chief Investment Officer at Morgan Stanley Wealth Management, offered her take on the impact of rising interest rates on markets and the economy as a whole.
The Fed, in a little over two months, is set to enact its first rate increase in three years.
Key quotes
“Market turbulence would be more pronounced even as the economy grows.”
Markets are coming off a prolonged period of “a long decline in real interest rates, which allowed stocks to break free from economic fundamentals and their price/earnings multiples to expand.”
“Now, the period of declining fed funds rates which began in early 2019 is ending, which should allow real rates to rise from historic negative lows. This shift is likely to unleash volatility and prompt changes in market leadership.”
| Raw materials | Closed | Change, % |
|---|---|---|
| Brent | 80.11 | 1.28 |
| Silver | 23.041 | 0.65 |
| Gold | 1814.362 | 0.65 |
| Palladium | 1862.54 | 2.59 |
- USD/INR defends corrective latest pullback around seven-week low.
- Bearish chart pattern needs validation from 20-SMA, buyers need to conquer 200-SMA for conviction.
USD/INR seesaws around 74.55-60 during Wednesday’s Asian session, after rising the most in three weeks the previous day. In doing so, the Indian rupee (INR) pair holds onto the recovery moves from the lowest levels since mid-November, flashed on Friday.
Even so, a bearish chart pattern called flag challenges USD/INR buyers on the four-hour (4H) play.
The quote’s latest rebound, however, takes clues from ascending RSI line and hints at another attempt to cross the 50-SMA level of 74.65.
Following that, the flag’s upper line, around 74.75, will precede the 75.00 threshold to challenge the USD/INR bulls. Also acting as the key upside hurdle is the 200-SMA level of 75.15.
On the flip side, 20-SMA adds strength to the bearish formation’s support line near 74.65, a break of which will theoretically confirm the south-run towards the last year’s bottom surrounding 72.20-15.
During the anticipated fall, lows marked in November and September 2021, respectively around 73.85 and 72.90, may offer a breather space to the USD/INR bears.
USD/INR: Four-hour chart
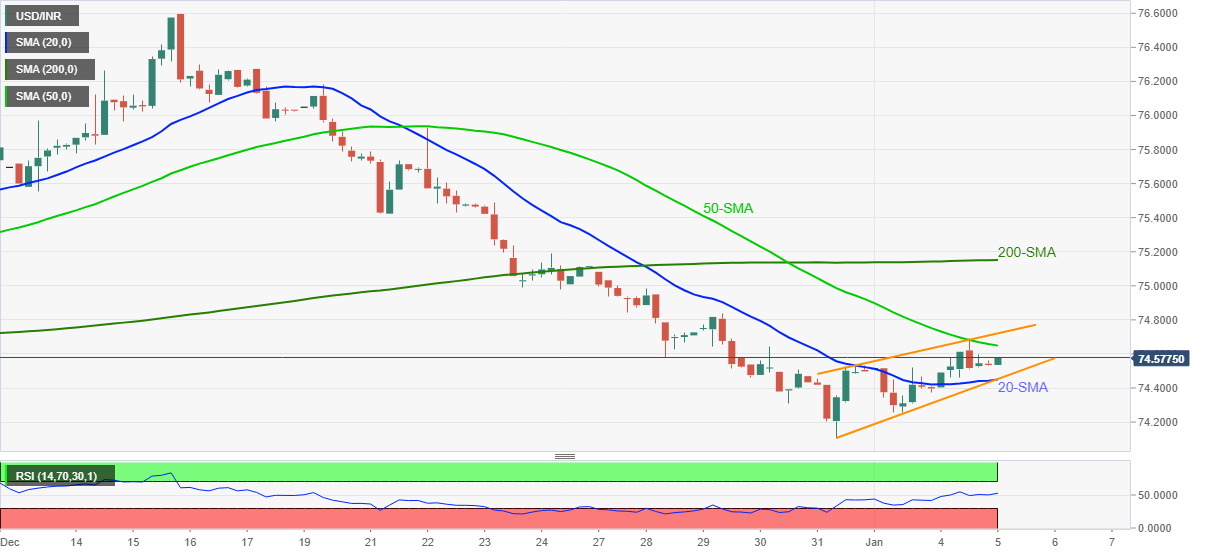
Trend: Bearish
- USD/CHF remains sidelined after declining the most in two weeks.
- Tepid risk appetite, cautious mood ahead of the key US data/events challenge momentum.
- Updates concerning Omicron, China’s Evergrande may entertain intraday traders ahead of the key US session.
USD/CHF treads water around 0.9165, recently bounced off the intraday low amid Wednesday’s Asian session. The Swiss currency (CHF) pair dropped the most in a fortnight the previous day while consolidating the early week’s heavy gains.
That being said, recently softer Treasury yields and mixed concerns over the South African covid variant, namely Omicron, seem to challenge the USD/CHF pair traders, not to forget cautious mood ahead of the US ADP Employment Change for December and FOMC Minutes.
World Health Organization (WHO) WHO Incident Manager Abdi Mahamud cites fresh clues to placate Omicron fears but the recent rally in infections challenges the national medical systems in multiple nations.
It’s worth noting that a jump in the global vaccinations keeps policymakers hopeful of overcoming the pandemic, which in turn favored market sentiment the previous day.
Also, mixed data from the US and a pause in the bullish inflation expectations joined comments from the Fed policymaker to confuse the market players.
Talking about data, the ISM Manufacturing PMI dropped to the lowest in 11 months in December, 58.7 versus 60.0 forecast and 61.1 prior, whereas November’s JOLTS Jobs Openings came in lower than the upwardly revised previous reading of 11.091M to 10.562M.
Moving on, the US inflation expectations, as per 10-Year Breakeven Inflation Rate numbers from the Federal Reserve Bank of St. Louis (FRED) eased from a six-week high to 2.57% at the latest, which in turn tamed Fed rate-hike chatters.
Also, Minneapolis Fed President and 2022 voting FOMC member Neil Kashkari, who surprised markets with this hawkish hopes of two rate lifts in 2022 still fall short of the money market bets favoring three such actions, which in turn weigh on the sentiment.
Elsewhere, fresh fears concerning China’s troubled real-estate player Evergrande also weigh on the market sentiment and the USD/CHF prices.
Against this backdrop, the US Treasury yields struggle to extend the previous run-up while taking rounds to the six-week high flashed on Tuesday whereas the US stock futures print mild losses by the press time.
Looking forward, USD/CHF traders will pay attention to the Omicron and China headlines before the US data docket gets active. While the anticipated easing in the ADP may help the Aussie pair to keep the latest rebound, the hawkish tone of the policymakers in the Federal Open Market Committee (FOMC) Meeting Minutes will be enough to keep the quote weak.
Read: US ADP December Preview: Suddenly its inflation, not jobs
Technical analysis
USD/CHF remains confined between 20-DMA and a five-month-old support line, respectively around 0.9195 and 0.9135. However, bearish MACD signals and descending RSI line keep sellers hopeful.
- Silver fades the previous day’s rebound, eases from intraday top.
- 20-SMA guards immediate upside, 100-SMA adds strength to the triangle’s support.
- Steady Momentum, key technical hurdles hint at further sideways grind of the metal.
Silver (XAG/USD) consolidates the previous day’s gains around $23.00, down 0.12% intraday, during Wednesday’s Asian session.
In doing so, the bright metal eases from 20-SMA while staying inside a one-week-old symmetrical triangle.
Given the steady Momentum line and continuation chart pattern, XAG/USD is likely to grind for the short term.
That said, the latest pullback from the 20-SMA can drag the quote towards $22.90 nearby support. However, a convergence of the stated triangle’s support line and 100-SMA, around $22.60, offers a tough nut to crack for the silver bears.
Alternatively, an upside clearance of the 20-SMA level of $23.06 will direct XAG/USD bulls towards the triangle’s resistance line of $23.25.
In a case where silver buyers keep reins past $23.25, highs marked on November 29 and December 28, around $23.45, will be crucial to watch.
Silver: Four-hour chart
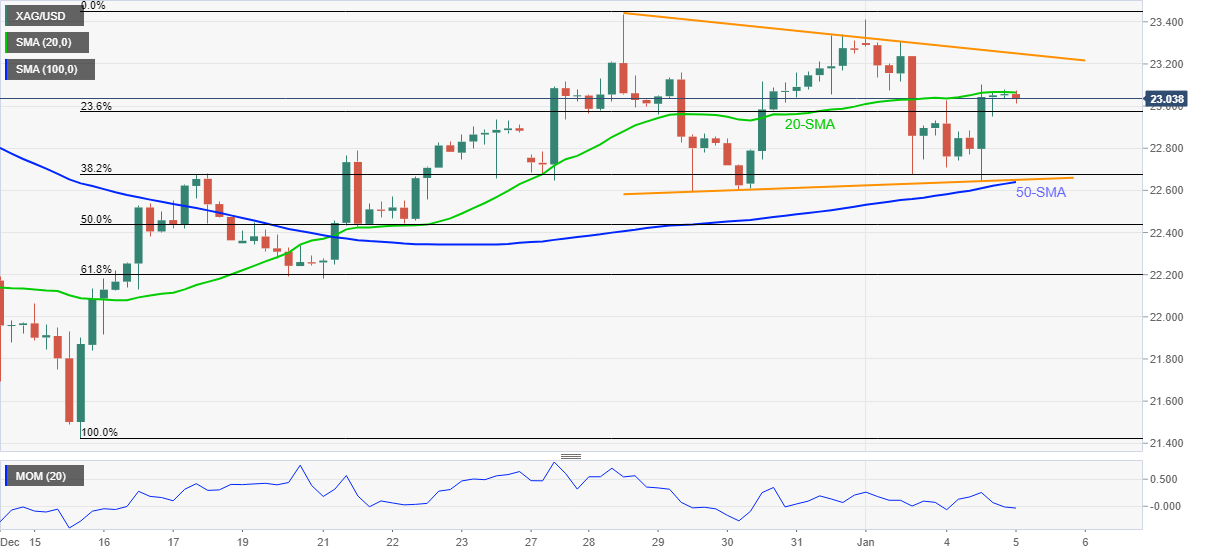
Trend: Pullback expected
After China’s real estate giant Evergrande Group was declared in default last month, the troubles for the indebted company are far from over.
Starting out 2022, Evergrande announced on Monday that it had suspended trade in its shares in Hong Kong as investors await news on its restructuring plan.
Late on Monday, Evergrande confirmed that it had received an order from authorities in Danzhou city, Hainan province on 30 December telling it to demolish 39 buildings that were under construction at its Ocean Flower Island project.
In lieu of the above piece of news, Evergrande shares rebounded on Tuesday, as trading resumed.
China Evergrande is scheduled to hold a meeting with bondholders on January 7-10, Reuters reported, citing the company’s filing.
Meanwhile, “China Huarong Asset Management Co. is set to resume trading Wednesday following a $6.6 billion bailout, a type of state-orchestrated rescue that appears unlikely for embattled developer China Evergrande Group,” Bloomberg reports.
developing story ...
- NZD/USD is on the verge of either a break to the upside or restest of critical support that could open the downside.
- The bears are seeking a weekly downside extension, but the M-formation is a bullish reversion pattern.
With the recent lower low in NZU/USD and the bearish impulse on the daily chart, the bears could be in the running following the restest of the 61.8% Fibonacci retracement level.
NZD/USD daily chart
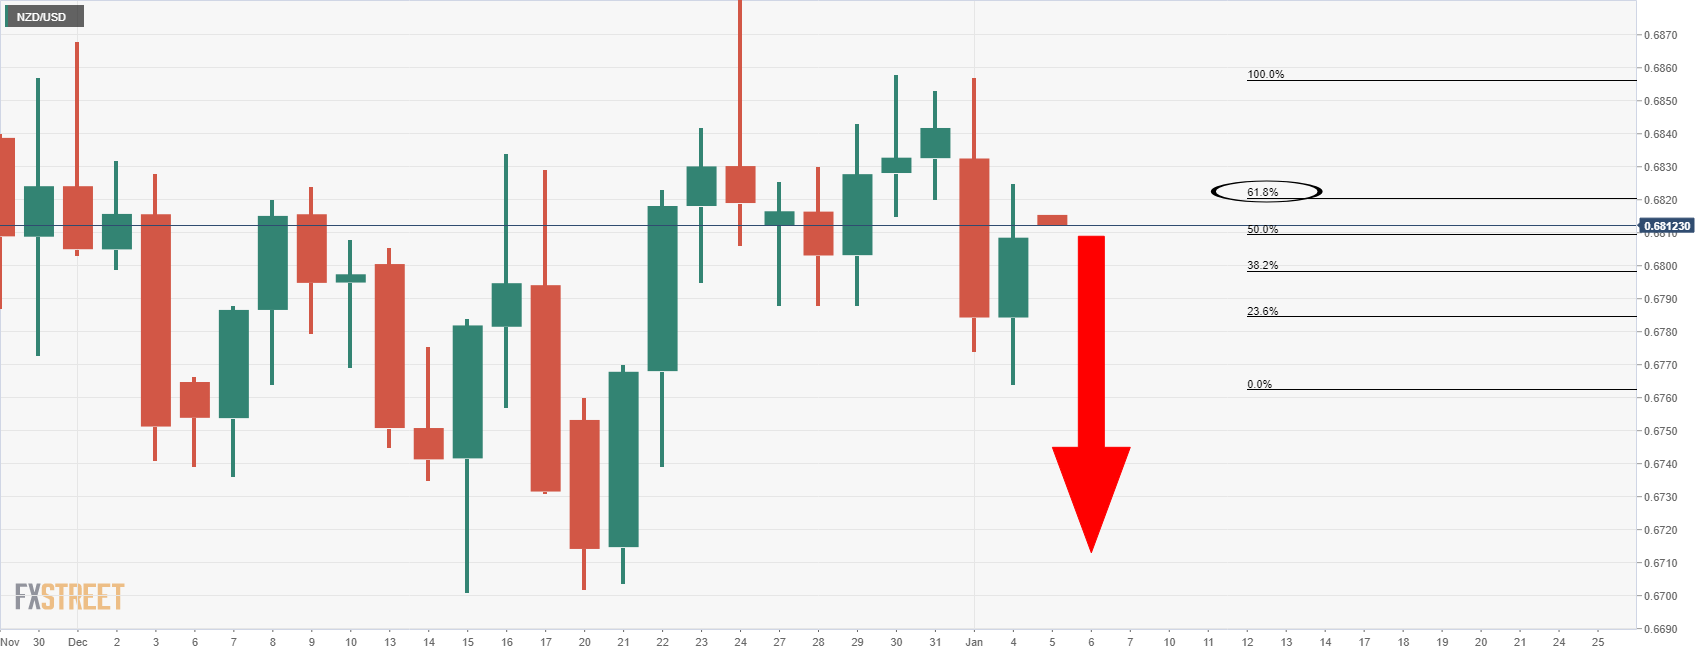
However, the prospects for a deeper downside move are reinforced by the weekly chart as follows:
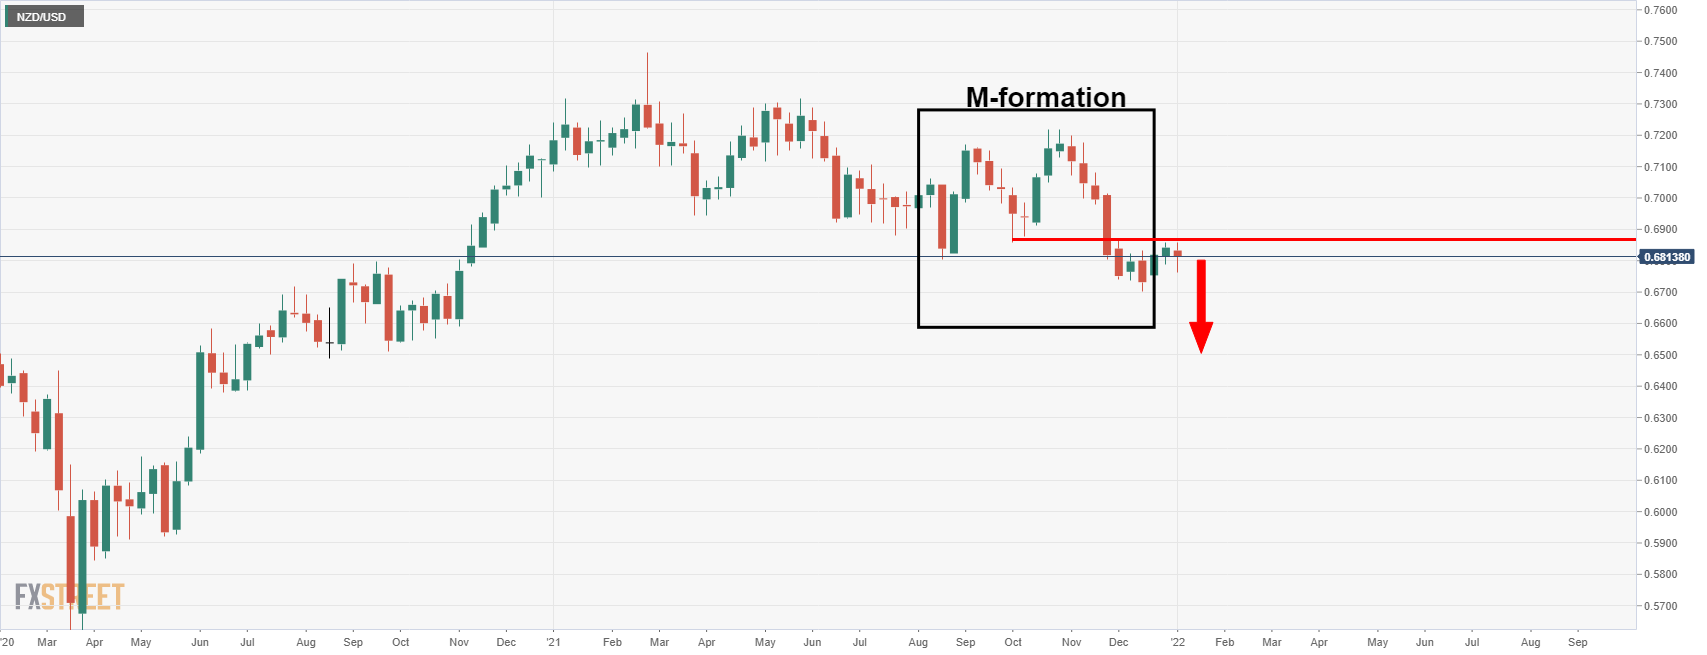
On the other hand, should the price hold at this support, then a deeper test of the M-formation's neckline would be expected to play out into the hands of the bulls:
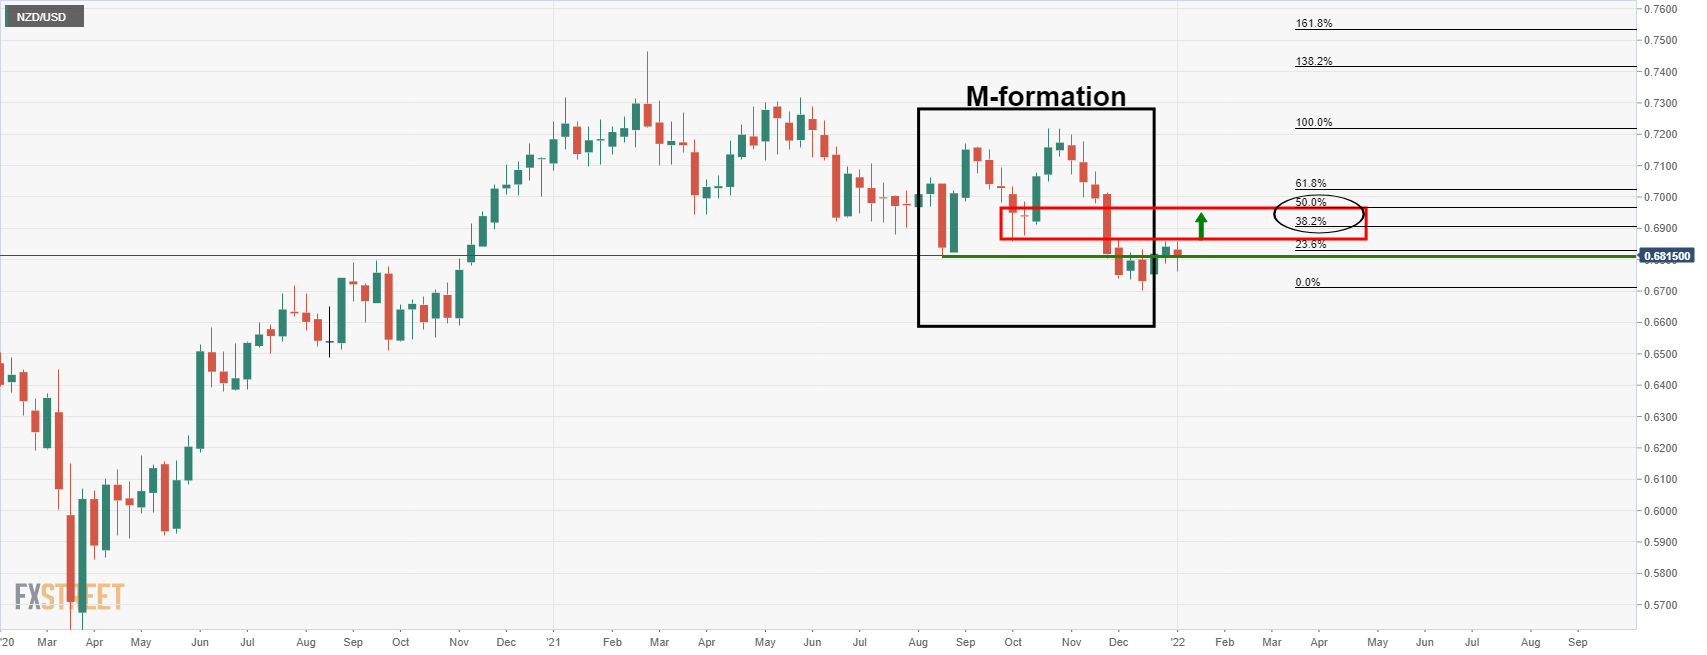
NZD/USD H4 chart
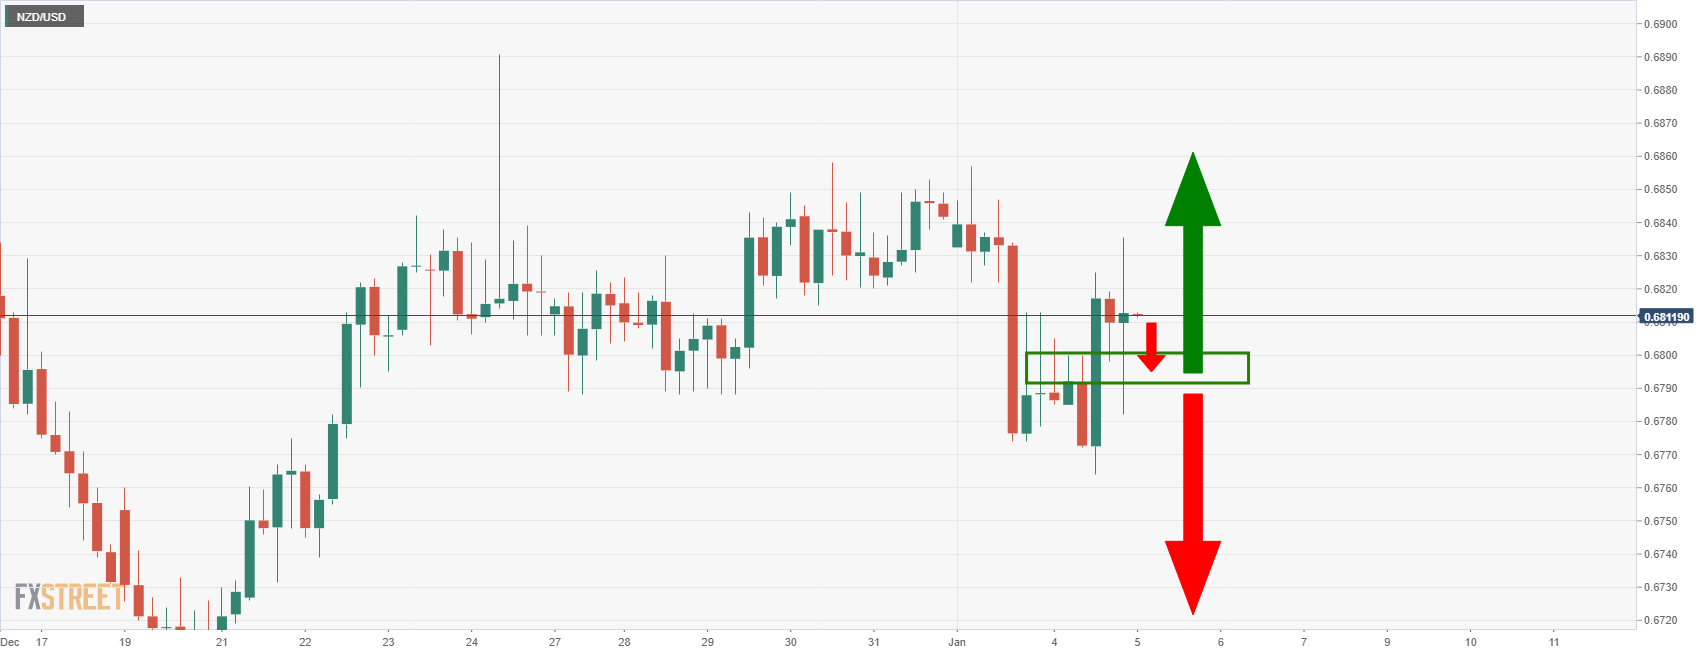
The 4-hour prospects are also less bearish while the price is holding above the meanwhile support near 0.68 the figure. Only a break of there will enable the daily outlook a chance to play out.
- DXY pauses two-day uptrend after refreshing fortnight high.
- Yields retreat, stock futures ease amid mixed concerns over Omicron, Fed’s next move.
- US data came in softer, inflation expectations also softened on Tuesday.
- US ADP figures will be tracked for early signal of Friday’s NFP, Fed policymakers eyed for rate hike clues.
US Dollar Index (DXY) retreats from a two-week high to 96.28 during Wednesday’s Asian session. In doing so, the greenback gauge drops for the first time in the last three days while following the US Treasury yields and mixed catalysts.
The US 10-year Treasury bond coupon seesaws around the six-week high, down one basis point (bp) near 1.65% at the latest after refreshing the multi-day top the previous day. Even so, the S&P 500 Futures remain pressured, down 0.15% intraday around 4,775, after the Wall Street benchmarks closed mixed.
Mixed clues concerning the Fed’s next action and the South African covid variant, Omicron, joins cautious mood ahead of the key US data/events seem to weigh on the sentiment of late. That being said, hopes of stimulus and receding fears from the South African covid variant could be cited as the key catalysts for the previous optimism.
On the positive side are comments from World Health Organization (WHO) official that again tried to placate fears over Omicron. "We are seeing more and more studies pointing out that Omicron is infecting the upper part of the body. Unlike other ones, the lungs who would be causing severe pneumonia," WHO Incident Manager Abdi Mahamud told Geneva-based journalists per Reuters. Also, a steady increase in global covid vaccinations and hopes of further stimulus from the US and China could be cited for the market’s previously positive mood.
Furthermore, mixed data from the US and a pause in the inflation expectations joined comments from the Fed to also probe the bulls.
The ISM Manufacturing PMI dropped to the lowest in 11 months in December, 58.7 versus 60.0 forecast and 61.1 prior, whereas November’s JOLTS Jobs Openings came in lower than the upwardly revised previous reading of 11.091M to 10.562M.
The US inflation expectations, as per 10-Year Breakeven Inflation Rate numbers from the Federal Reserve Bank of St. Louis (FRED) eased from a six-week high to 2.57% at the latest, which in turn tamed Fed rate-hike chatters.
Also, Minneapolis Fed President and 2022 voting FOMC member Neil Kashkari, who surprised markets with this hawkish hopes of two rate lifts in 2022 still fall short of the money market bets favoring three such actions, which in turn weigh on the sentiment.
Moving on, the anticipated easing in the ADP may exert additional downside pressure on the DXY, the hawkish tone of the policymakers in the Federal Open Market Committee (FOMC) Meeting Minutes will be enough to keep the firmer around the highest level in two weeks.
Read: US ADP December Preview: Suddenly its inflation, not jobs
Technical analysis
Having bounced off the 50-DMA during Friday, the US Dollar Index crossed the 20-DMA level on Tuesday and has been above the same of late. As a result, DXY bulls remain hopeful until witnessing a downside break of the 50-DMA level of 95.70 while the 96.20 level, comprising 20-DMA, offers immediate support to watch during the quote’s pullback moves.
On the contrary, a descending resistance line from November 22, near 96.22 by the press time, becomes crucial to watch during the quote’s further upside.
| Time | Country | Event | Period | Previous value | Forecast |
|---|---|---|---|---|---|
| 05:00 (GMT) | Japan | Consumer Confidence | December | 39.2 | |
| 07:45 (GMT) | France | Consumer confidence | December | 99 | 97 |
| 08:50 (GMT) | France | Services PMI | December | 57.4 | 57.1 |
| 08:55 (GMT) | Germany | Services PMI | December | 52.7 | 48.4 |
| 09:00 (GMT) | Eurozone | Services PMI | December | 55.9 | 53.3 |
| 13:15 (GMT) | U.S. | ADP Employment Report | December | 534 | 438 |
| 13:30 (GMT) | Canada | Building Permits (MoM) | November | 1.3% | 2.3% |
| 13:30 (GMT) | Canada | New Housing Price Index, YoY | November | 11.5% | |
| 13:30 (GMT) | Canada | New Housing Price Index, MoM | November | 0.9% | 1.4% |
| 14:45 (GMT) | U.S. | Services PMI | December | 58 | 57.5 |
| 15:30 (GMT) | U.S. | Crude Oil Inventories | December | -3.576 | -3.283 |
| 19:00 (GMT) | U.S. | FOMC meeting minutes |
In recent trade today, the People’s Bank of China (PBOC) set the yuan (CNY) at 6.3779 vs last close 6.3720.
About the fix
China maintains strict control of the yuan’s rate on the mainland.
The onshore yuan (CNY) differs from the offshore one (CNH) in trading restrictions, this last one is not as tightly controlled.
Each morning, the People’s Bank of China (PBOC) sets a so-called daily midpoint fix, based on the yuan’s previous day closing level and quotations taken from the inter-bank dealer.
- AUD/USD seesaws inside 20-pip trading range after the biggest daily jump in two weeks.
- Bearish chart pattern, sluggish oscillators keep sellers hopeful.
- 200-SMA acts as a validation point for a slump, seven-week-old horizontal area restricts immediate upside.
AUD/USD remains inside the latest 20-pip trading range around 0.7230-50 during Wednesday’s Asian session. The Aussie pair jumped the most since December 22 the previous day while consolidating Monday’s heavy losses.
That said, the AUD/USD pair’s failure to keep the bounce off 100-SMA joins sluggish MACD and RSI to favor sellers. However, confirmation of the monthly rising wedge and a downside break of 200-SMA becomes necessary for the bears to take an entry, which in turn highlights the 0.7170 level as the key support.
Following that, a slump towards the late December swing low near 0.7080 becomes imminent. Given the bear’s ability to keep reins past 0.7080, the 2021 low of 0.7000 will be in focus.
Alternatively, recovery moves may aim for 0.7250 but a seven-week-old horizontal area restricts short-term upside around 0.7280. Adding to the upside filter is the stated wedge’s upper line near 0.7285.
In a case where AUD/USD crosses the 0.7285 hurdle, the 0.7300 threshold and mid-November peak surrounding 0.7370 should return to the charts.
AUD/USD: Four-hour chart
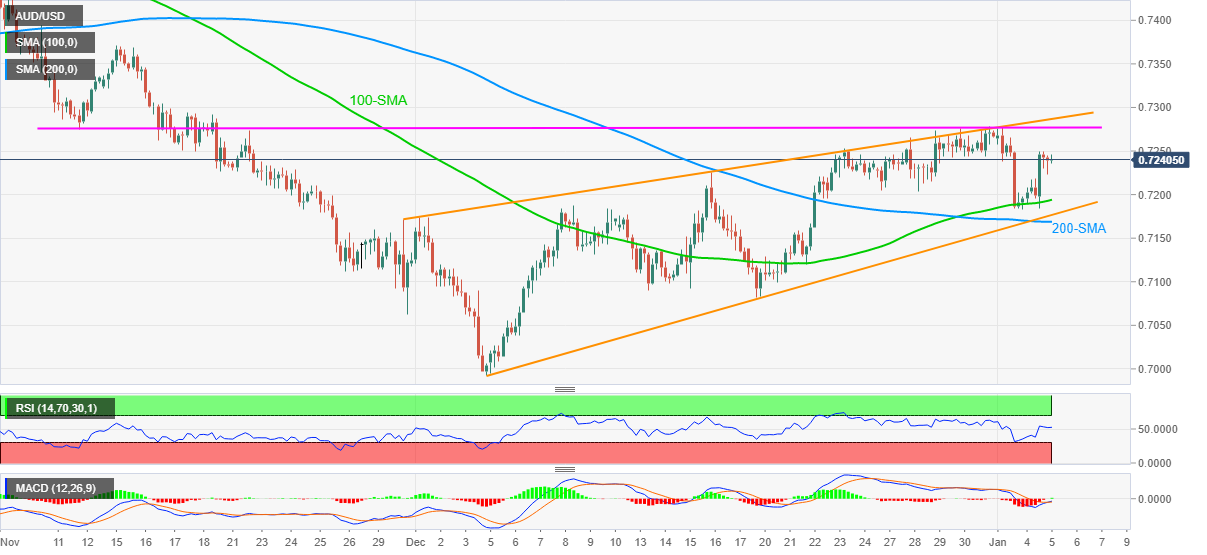
Trend: Pullback expected
Global supply chain pressures, which are at historic highs and have prompted high inflation, may have peaked, Reuters reports, citing a new index released by the New York Federal Reserve (Fed) on Tuesday.
Key takeaways
“The Global Supply Chain Pressure Index (GSCPI) surged early in the pandemic when China imposed lockdown measures.”
"More recently, the [index] seems to suggest that global supply chain pressures, while still historically high, have peaked and might start to moderate somewhat going forward.”
“Researchers found "enormous growth" in shipping costs since the beginning of the recovery from the lows at the start of the pandemic. But that growth has started to slow in recent months.”
Related reads
- US T-bond yields retreat from six-week high, S&P 500 Futures ease amid cautious sentiment
- ECB's Villeroy: Inflation close to peaking in France and the Eurozone
- US Treasury yields pause two-day advances, stock futures track Wall Street benchmark.
- Market players turn cautious ahead of key US data/events.
- Mixed updates over Omicron, easing US inflation expectations also challenge optimists.
- US ADP Employment Change, FOMC Minutes eyed for fresh impulse.
After a solid start of 2022, the market’s risk appetite dwindles during early Wednesday. As a result, the key risk barometers, namely the US Treasury yields and stock futures, print mild losses at the latest.
That said, the US 10-year Treasury bond coupon seesaws around the six-week high, down one basis point (bp) near 1.65% at the latest. Also, the S& 500 Futures drop 0.20% intraday.
While hopes of stimulus and receding fears from the South African covid variant could be cited as the key catalysts for the previous optimism, mixed clues concerning the Fed’s next action and Omicron joins cautious mood ahead of the key US data/events seem to weigh on the sentiment of late.
It’s worth noting that Wall Street benchmarks closed mixed and the US 10-year Treasury yields refreshed six-week top, before recently easing, during the previous day.
Among the main positives could be comments from World Health Organization (WHO) official that again tried to placate fears over the South African covid variant, Omicron. "We are seeing more and more studies pointing out that Omicron is infecting the upper part of the body. Unlike other ones, the lungs who would be causing severe pneumonia," WHO Incident Manager Abdi Mahamud told Geneva-based journalists per Reuters.
Furthermore, a steady increase in global covid vaccinations and hopes of further stimulus from the US and China could also be cited for the market’s previously upbeat sentiment.
Additionally, mixed data from the US and a pause in the inflation expectations joined comments from the Fed to also probe the bulls.
The ISM Manufacturing PMI dropped to the lowest in 11 months in December, 58.7 versus 60.0 forecast and 61.1 prior, whereas November’s JOLTS Jobs Openings came in lower than the upwardly revised previous reading of 11.091M to 10.562M. Further, the US inflation expectations, as per 10-Year Breakeven Inflation Rate numbers from the Federal Reserve Bank of St. Louis (FRED) eased from a six-week high to 2.57% at the latest, which in turn tamed Fed rate-hike chatters. Moreover, Minneapolis Fed President and 2022 voting FOMC member Neil Kashkari, who said on Monday that he now sees two rate hikes in 2022, versus the money market bets of three rate lifts.
Moving on, global financial markets are likely to remain sidelined amid mixed clues and pre-data caution. That said, the anticipated easing in the ADP may help the Aussie pair to keep the latest rebound, the hawkish tone of the policymakers in the Federal Open Market Committee (FOMC) Meeting Minutes. will be enough to challenge the market’s risk appetite.
Read: US ADP December Preview: Suddenly its inflation, not jobs
The Australian Financial Review (AFR) cited a bullish outlook on AUD/USD from Nomura’s analysts.
Key quotes
“The Australian dollar accompanying the 0.78 December 2023 forecast.”
“As we move through Q1 and Q2, we expect the RBA to be turning increasingly hawkish as inflation rises, and we expect China’s growth momentum to start to recover as we move into Q2, with further policy support being rolled out.”
“This should support a higher AUD/USD over the course of 2022.”
- USD/TRY holds onto the weekly grind around key technical indicators.
- 20-DMA, 50% Fibonacci retracement clutch the immediate moves.
- Sustained trading above 50-DMA, MACD conditions signal further upside.
- Five-week-old horizontal line challenges short-term buyers, 61.8% Fibo. adds to the downside filters.
USD/TRY remains sidelined around $13.40 during Wednesday’s Asian session.
In doing so, the Turkish lira (TRY) pair takes rounds to the 20-DMA and 50% Fibonacci retracement (Fibo.) of September-December upside of late.
It’s worth noting, however, that the quote’s sustained trading above 50-DMA, as well as ability to bounce off 78.6% Fibo., favor buyers to aim for the horizontal resistance established since November 30, around $14.00.
Following that, $14.80 and $15.70 may test the bulls before directing them to the record high marked in the last month around $18.35.
Alternatively, pullback moves remain elusive beyond convergence of the 50-DMA and 61.8% Fibonacci retracement level near $12.10.
Also acting as short-term support is the $12.00 threshold, a break of which will again direct the quote towards 78.6% Fibo. level surrounding $10.40.
Overall, USD/TRY bulls are in command but seem cautious ahead of the key US data docket.
USD/TRY: Daily chart
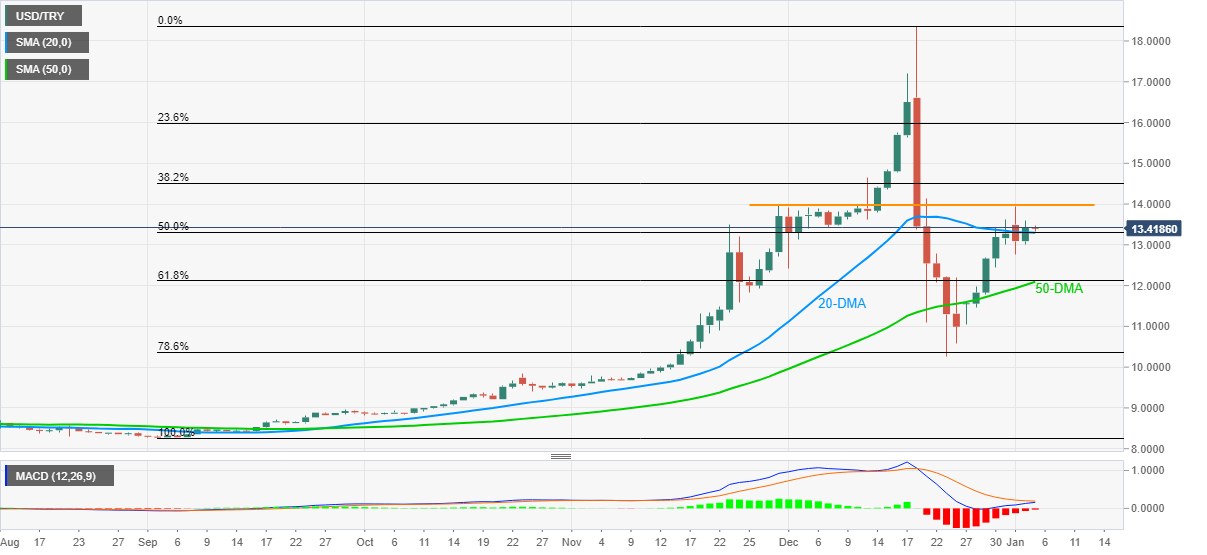
Trend: Further upside expected
- Bearish structures are formed across the time frames for USD/CAD.
- USD/CAD bears looking for a restest of the weekly trendline support.
USD/CAD is a complex technical structure across the time frames and the following top-down analysis illustrates the prospects of a downside extension across the weekly, daily, 4-hour and hourly charts:
USD/CAD weekly chart
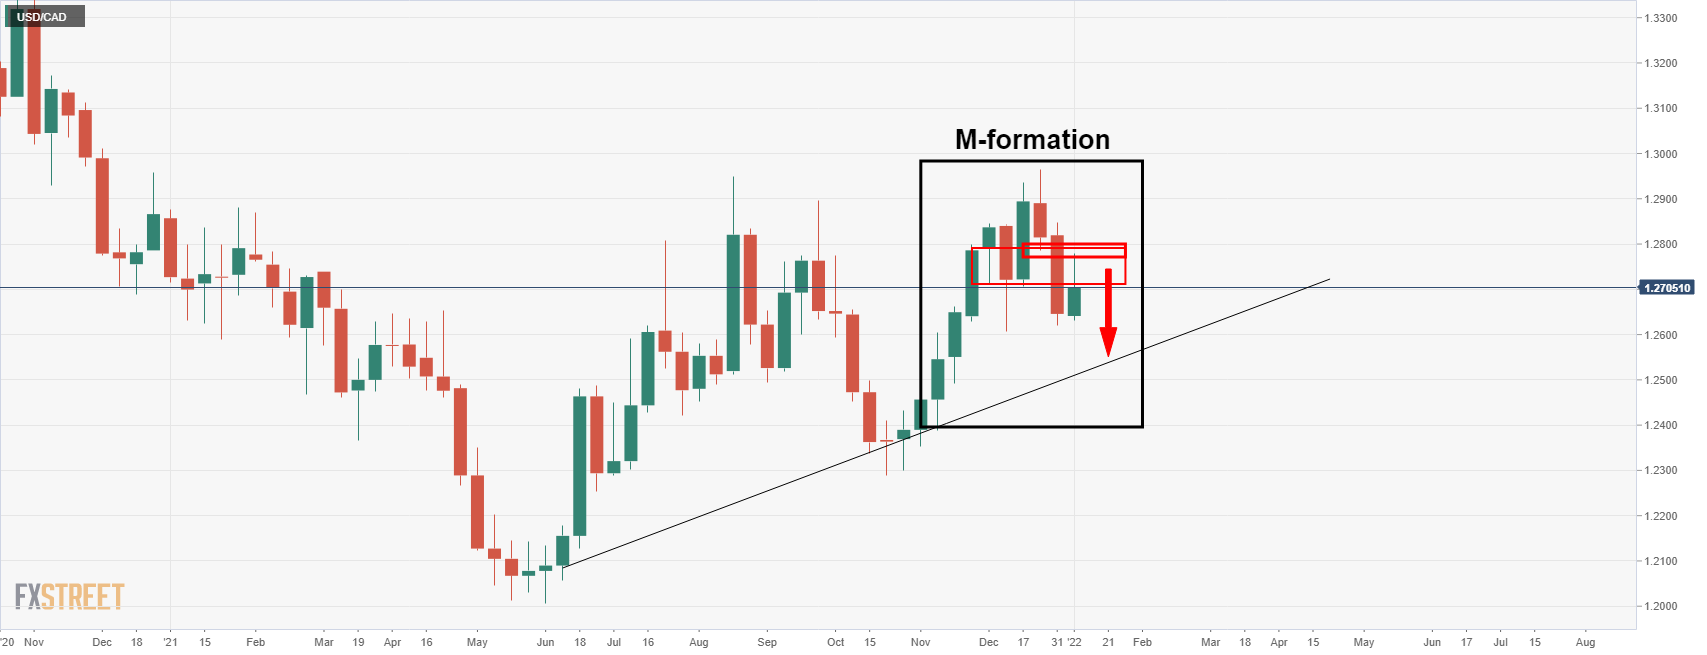
From a weekly perspective, we can see that the price has been attempting to retest the neckline of the M-formation but has so far struggled to bypass the offers which are leaving a bearish outlook for the lower time frames.
USD/CAD daily chart
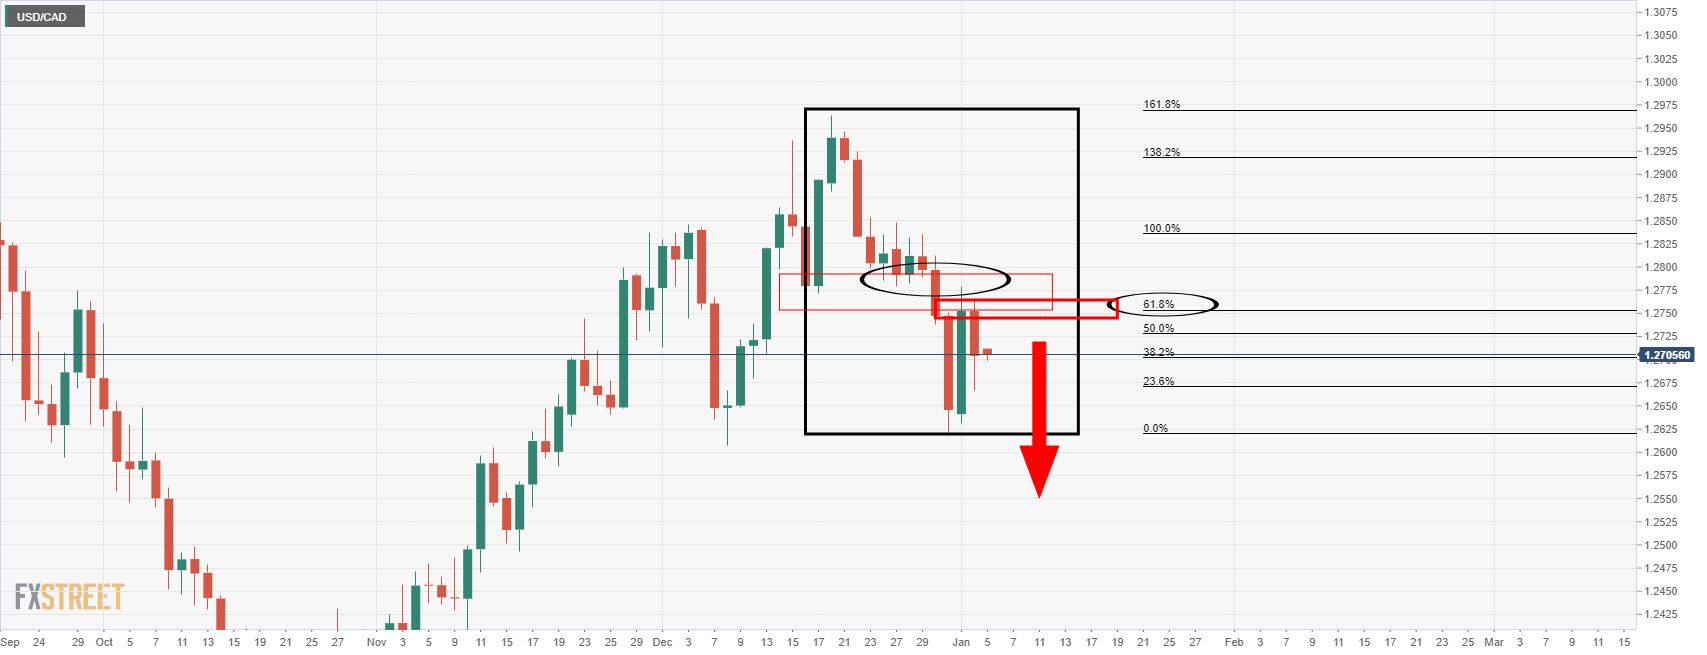
On the daily chart, we can see a similar scenario. It might be too premature to expect an immediate downside extension. However, there has been a significant restest of the bearish structure so further bullish attempts would be expected to be met with supply.
USD/CAD H4 chart
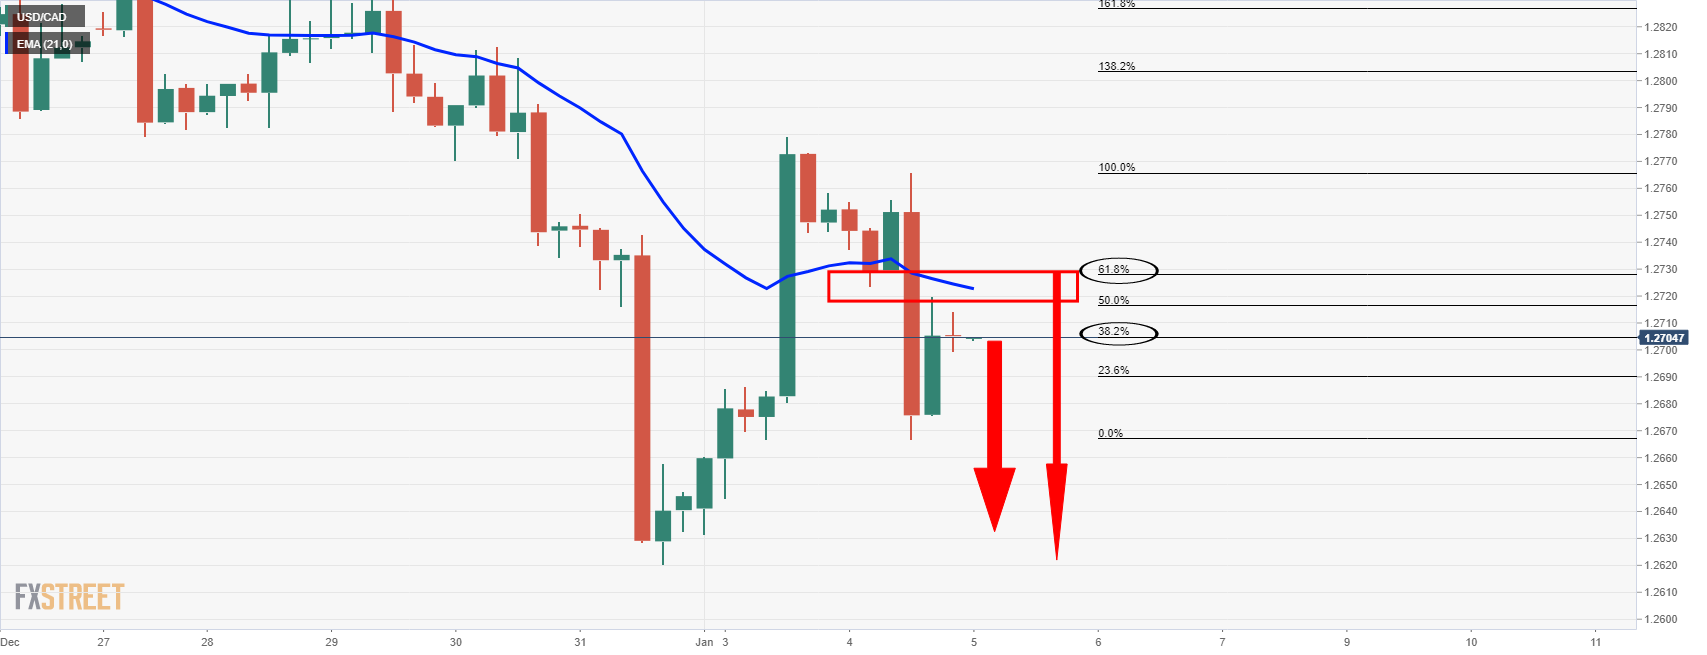
As for the 4-hour chart, there is room for a deeper correction into the 21-EMA and the 61.8% Fibo towards 1.2730 having already corrected to the 38.2% ratio. With that being said, the price seems to be climaxing around this level, 1.2705. If the bears press here, then it could be all downhill from here on.
USD/CAD H1 chart
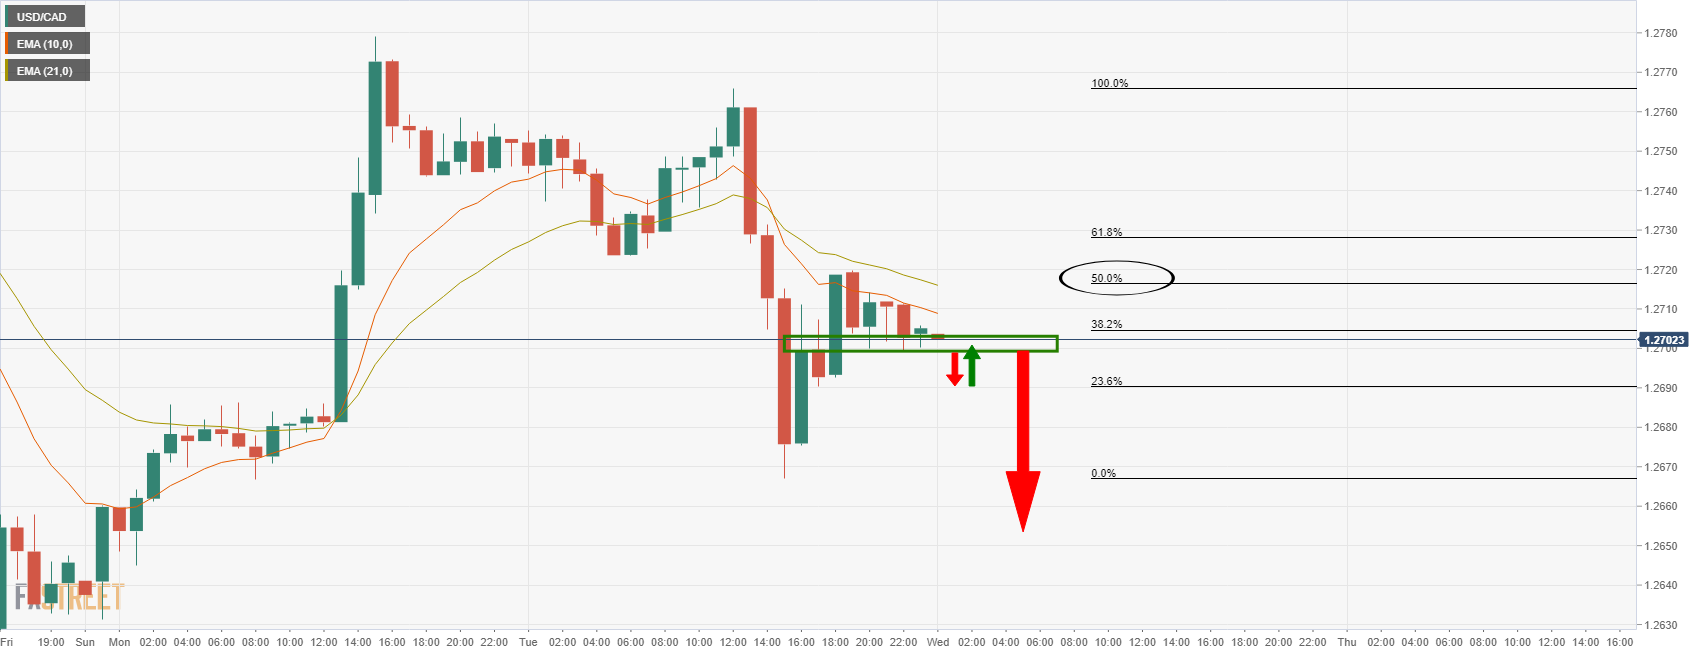
Meanwhile, on the hourly chart, this area represents support. A break at this juncture will rhyme with the above scenarios for a downside run in a bearish hourly extension beyond the hourly lows of 1.2667.
North Korea fired a suspected ballistic missile off its east coast on Wednesday, the Nikkei Asia Review reported on Wednesday, citing the Japanese Coast Guard.
Meanwhile, South Korea reported the launch of an unspecified projectile.
more to come ...
- USD/JPY struggles to extend the biggest daily jump in six week, edges higher around January 2017 levels.
- Market sentiment turns cautious ahead of the key US data/events.
- Mixed concerns over Omicron, another covid variant also challenge optimists.
- Japan Monetary Base eased in December, early signal of Friday’s US jobs report, Fed policymaker’s view eyed for fresh impulse.
USD/JPY grinds higher around 116.15 after refreshing the multi-day high with the heaviest daily jump in six weeks. With this, the risk barometer pair stays defensive around the five-year top as Tokyo opens for Wednesday.
Japanese traders witnessed a warm welcome as they began 2022 the previous day. The reason could be linked to the market’s receding fears of the South African covid variant, Omicron, as well as easing odds of a faster rate hike by the US Federal Reserve (Fed) than initially feared.
Even so, cautious sentiment ahead of the US ADP Employment Change for December and Federal Open Market Committee (FOMC) Meeting Minutes seems to restrict the yen pair’s latest upside during the three-day run-up.
Also challenging the USD/JPY buyers could be the softer-than-expected figures of Japan’s Monetary Base for December, 8.3% versus 8.6% forecast and 9.3% prior. The US economics also eased during the latest releases as the ISM Manufacturing PMI dropped to the lowest in 11 months in December, 58.7 versus 60.0 forecast and 61.1 prior whereas November’s JOLTS Jobs Openings came in lower than the upwardly revised previous reading of 11.091M to 10.562M.
Furthermore, recent news that North Korea fired a ballistic missile, per Japan Coast Guard, also challenged the USD/JPY upside.
On Tuesday, the US inflation expectations, as per 10-Year Breakeven Inflation Rate numbers from the Federal Reserve Bank of St. Louis (FRED) eased from a six-week high to 2.57% at the latest, which in turn tamed Fed rate-hike chatters and helped USD/JPY to rally. On the same line were comments from the Bank of Japan (BOJ) Governor Haruhiko Kuroda and Japanese Prime Minister (PM) Fumio Kishida signaling further easy money.
It should be observed that comments from Minneapolis Fed President and 2022 voting FOMC member Neil Kashkari, who said on Monday that he now sees two rate hikes in 2022, versus the money market bets of three rate lifts also favored USD/JPY bulls the previous day.
Amid these plays, Wall Street benchmarks closed mixed and the US 10-year Treasury yields refreshed six-week top before recently easing to 1.653%, down 1.3 basis points (bps). Further, Japan’s Nikkei prints mild decline following the heavy run-up the previous day whereas S&P 500 Futures print 0.15% intraday loss at the latest.
Looking forward, markets may remain cautious and hence the USD/JPY bulls can take a long breather until the ADP report cross downbeat market forecasts and Federal Open Market Committee (FOMC) Meeting Minutes convey hawkish bias of the Fed policymakers.
Read: US ADP December Preview: Suddenly its inflation, not jobs
Technical analysis
An ascending resistance line from October 20, near 116.50 by the press time, lures USD/JPY buyers until the quote drops below the 13-day-old support line near 115.20.
| Pare | Closed | Change, % |
|---|---|---|
| AUDUSD | 0.72393 | 0.71 |
| EURJPY | 131.075 | 0.69 |
| EURUSD | 1.1286 | -0.07 |
| GBPJPY | 157.108 | 1.15 |
| GBPUSD | 1.3528 | 0.42 |
| NZDUSD | 0.6809 | 0.49 |
| USDCAD | 1.27041 | -0.3 |
| USDCHF | 0.91629 | -0.25 |
| USDJPY | 116.139 | 0.74 |
© 2000-2026. Sva prava zaštićena.
Sajt je vlasništvo kompanije Teletrade D.J. LLC 2351 LLC 2022 (Euro House, Richmond Hill Road, Kingstown, VC0100, St. Vincent and the Grenadines).
Svi podaci koji se nalaze na sajtu ne predstavljaju osnovu za donošenje investicionih odluka, već su informativnog karaktera.
The company does not serve or provide services to customers who are residents of the US, Canada, Iran, The Democratic People's Republic of Korea, Yemen and FATF blacklisted countries.
Izvršenje trgovinskih operacija sa finansijskim instrumentima upotrebom marginalne trgovine pruža velike mogućnosti i omogućava investitorima ostvarivanje visokih prihoda. Međutim, takav vid trgovine povezan je sa potencijalno visokim nivoom rizika od gubitka sredstava. Проведение торговых операций на финанcовых рынках c маржинальными финанcовыми инcтрументами открывает широкие возможноcти, и позволяет инвеcторам, готовым пойти на риcк, получать выcокую прибыль, но при этом неcет в cебе потенциально выcокий уровень риcка получения убытков. Iz tog razloga je pre započinjanja trgovine potrebno odlučiti o izboru odgovarajuće investicione strategije, uzimajući u obzir raspoložive resurse.
Upotreba informacija: U slučaju potpunog ili delimičnog preuzimanja i daljeg korišćenja materijala koji se nalazi na sajtu, potrebno je navesti link odgovarajuće stranice na sajtu kompanije TeleTrade-a kao izvora informacija. Upotreba materijala na internetu mora biti praćena hiper linkom do web stranice teletrade.org. Automatski uvoz materijala i informacija sa stranice je zabranjen.
Ako imate bilo kakvih pitanja, obratite nam se pr@teletrade.global.
