- Analiza
- Novosti i instrumenti
- Vesti sa tržišta
Forex-novosti i prognoze od 20-10-2021
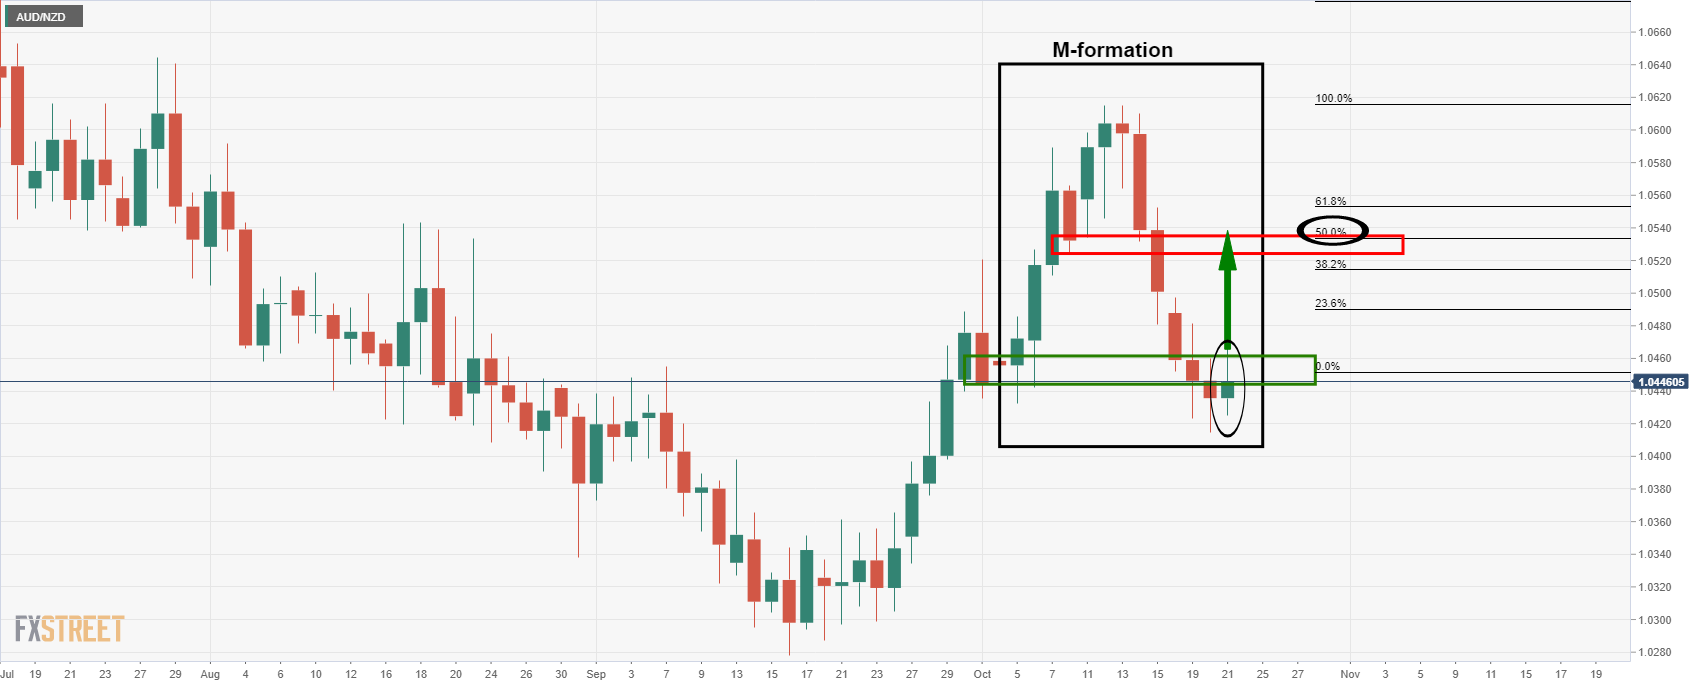
- AUD/NZD M-formation on the daily chart is compelling.
- Wycoff Methodology is playing out on the 1-hour chart.
As per the prior analysis, ''AUD/NZD Price Analysis: Bulls waiting to pounce'', the price is representing much of the Wycoff accumulation theory in the recent consolidation of the bear trend on the daily chart.
The daily chart is compelling given the harmonic M-formation. This is a reversion pattern as follows:

This chart was from the prior day's analysis where it was explained that ''the pattern that would be expected to draw in the price for a test of the formation's neckline. In this case, that level is the 8 Oct low at 1.0524.''
Since that analysis, we have seen the price start to correct, as expected:
Meanwhile, traders can approach the reversion from an hourly perspective and taking into consideration the Wycoff method can help traders keep out of bull and bear traps throughout the prolonged accumulation phase. This phase of accumulation is renowned for its whipsaw price action as demand outstrips supply in a battle between the bears and bulls, aka, the barroom brawl. In applying the thesis, it can assist traders to be patient and wait for signals that supply is exhausted before committing to the market long.
Wycoff 1HR chart

In the above analysis from yesterday, it was illustrated that Phase A was playing out. This was intended to help traders to stay patient and wait for the accumulation to play out through stages as follows:
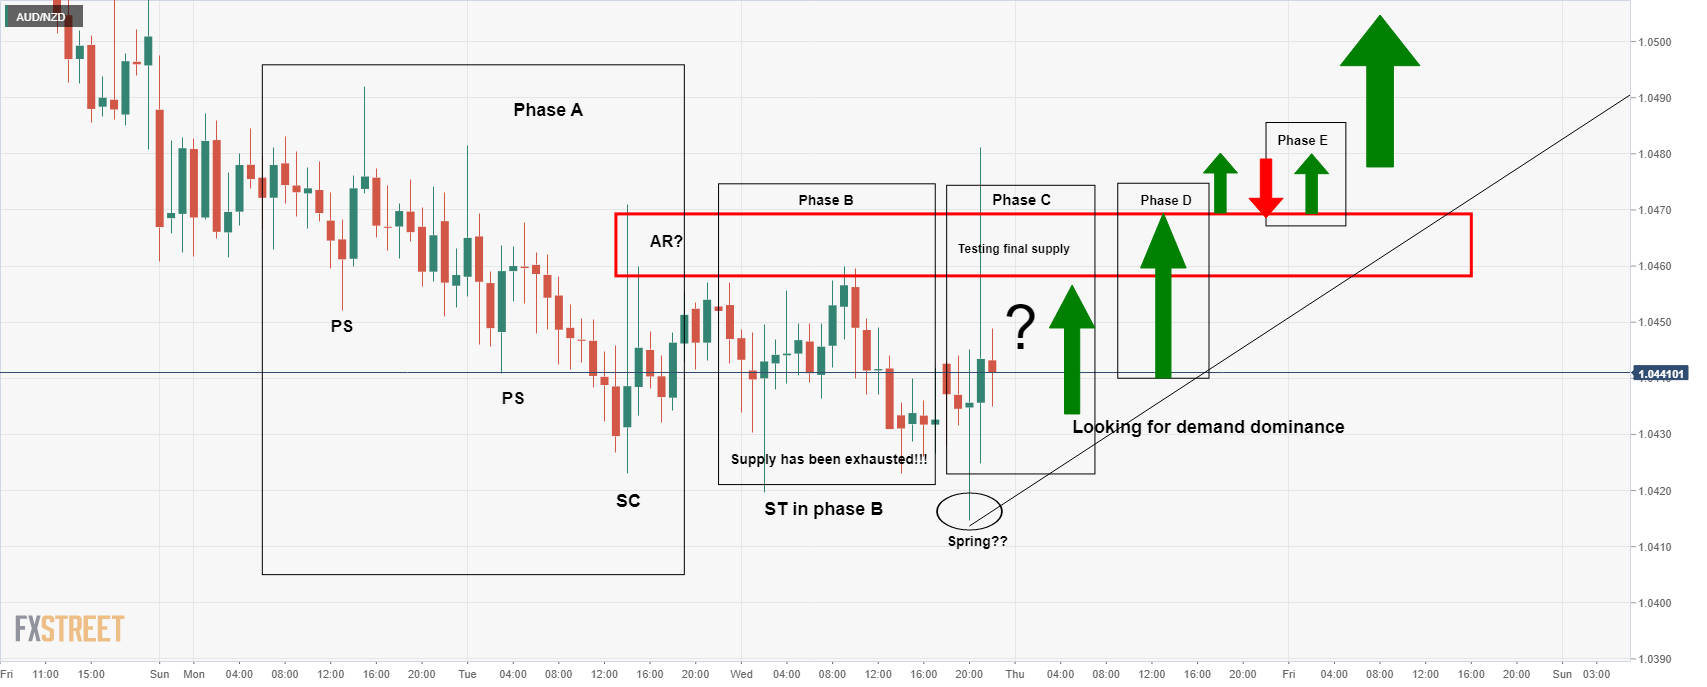
In this updated version in today's live market analysis, we can see how well this theory is playing out. At this juncture, traders can expect demand to dominate while investors buy up the cross one chunk at a time as sellers move to the sidelines and exit their long positions, propelling the price even higher towards the resistance.
How to know when accumulation is going to lead to a breakout?
Traders can read both the price action, looking for higher lows and higher highs, as well as useful indicators. One way to identify bullish territory is to apply MACD and a moving average crossover as follows:
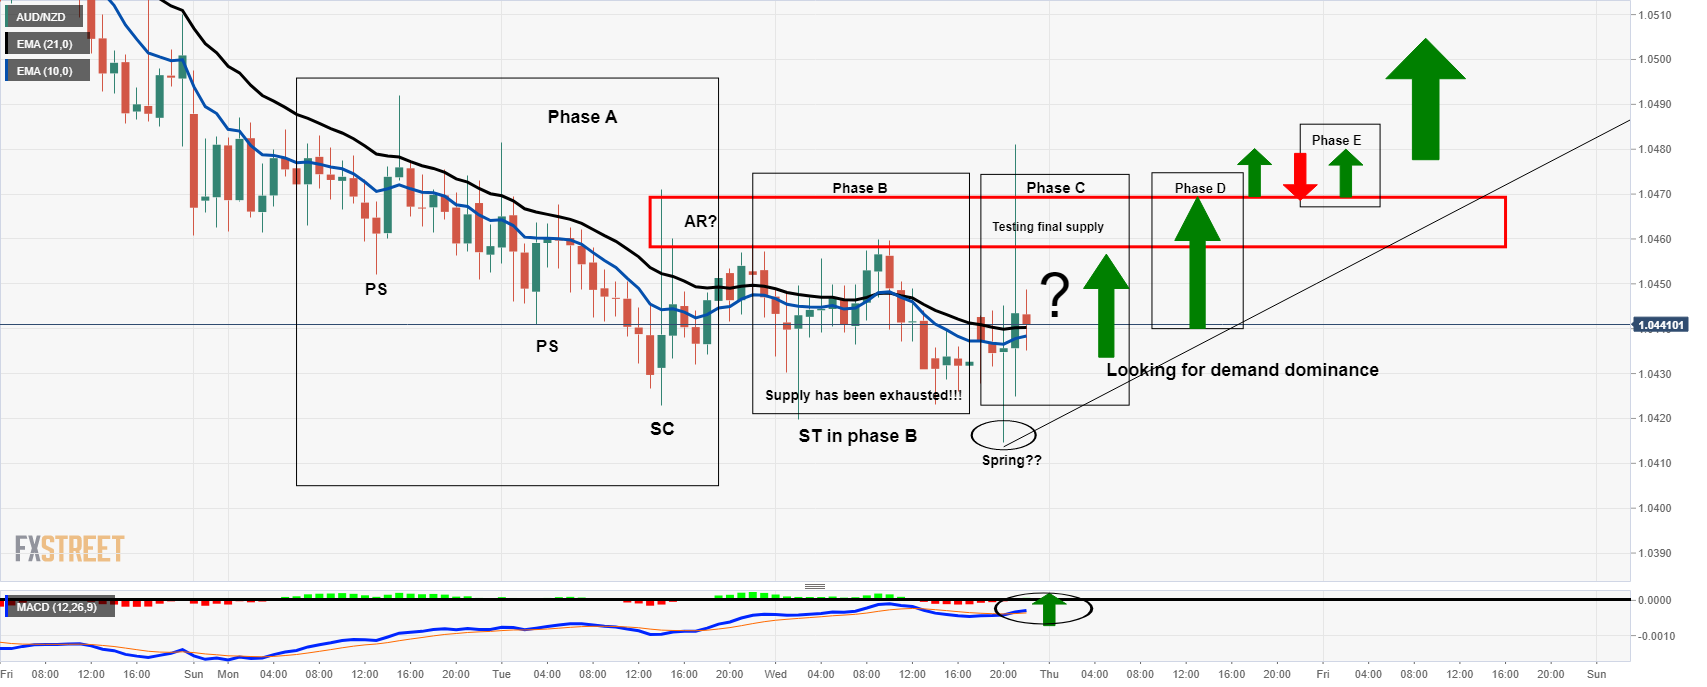
When MACD, blue line, crosses above the zero line, black horizontal, then this is regarded as indicating that buyers indeed have control and that the environment is turning bullish. When applying a moving average crossover, such as the 10 moving up through the 21 EMA, this is a powerful combination to help identify buying conditions. At such a point that this occurs, bulls can look to engage, depending on price action and market structure, and target towards the daily M-formation's neckline.
Traders will look to price action for engulfing candles and/or momentum candles that are breaking short-term resistances. Once the resistance is broken, a classic way to engage is to wait for a pullback to restest the old resistance that would be expected to act as support and lead to a bull rally.
- WTI holds the head high at seven-year top even as bulls recently take a breather.
- EIA inventories, brighter mood and US dollar weakness add to the bullish bias.
- Supply outage, demand forecasts favor upside momentum going forward.
WTI stays on the front foot around $83.50, the highest level since October 2014, during Thursday’s Asian session. The oil benchmark rose during the last two days to refresh the multi-day high.
The latest run-up could be linked to the lower-than-anticipated weekly inventory data from the Energy Information Administration (EIA), as well as US dollar weakness and risk-on mood.
That said, the EIA Crude Oil Stocks Change for the week ended on October 15 dropped below +1.857M forecast and +6.088M prior to -0.431M reading at the latest.
The US Dollar Index (DXY) printed a six-day south-run near the lowest levels in three weeks, pressured around 93.60 by the press time. In doing so, the greenback gauge failed to benefit from the tapering signals from Federal Reserve Governor Randal Quarles and Cleveland Fed President Loretta Mester as equities rallied on firmer earnings and the Treasury yields also softened after refreshing the multi-day top.
The risk-on mood could be witnessed by strong equities and a pullback in the US Treasury yields, following its run-up to the fresh five-month high. That said, the 10-year Treasury yields around 1.66%, up 2.6 basis points (bps), following the bond yields’ run-up to the five-month high.
It’s worth noting that China’s recent crackdown on energy production and expectations of strong oil demand going forward, as the global economies overcome the pandemic-led activity restrictions, adds to the bullish bias for the WTI crude oil prices.
However, Fed tapering concerns highlight the incoming US data, like today’s US Weekly Jobless Claims and monthly housing figures, for fresh impulse, in addition to the risk catalysts.
Technical analysis
November 2012 low near $84.10 remains on the WTI bull’s radar until the quote stays beyond the year 2018 top of $76.80.
- The British pound extends its three-day rally, relying on hawkish comments of BoE’s Governor Bailey.
- UK’s softer than expected inflation will not change the Bank of England intention of hiking rates.
- The US Dollar Index has fallen almost 1% in the current week, despite higher US T-bond yields.
The GBP/USD advances as the New York session ends and the Asian session begins, up a minimal 0.02% exchanges hands at 1.3824 during the day at the time of writing. The North American session positive sentiment has carried onto the Asian session. The major Asian equity futures indices rise between 0.01% and 1.45%, except the Japanese Topix, which drops 0.25%.
The British pound has rallied in the last three days on the back of hawkish comments by Bank of England members. However, on the same days, the pound stalled around 1.3845, it seems due to higher US T-bond yields, with the 10-benchmark note rate being just ten basis points short of the 2021 year high, currently at 1.66%.
Despite the rising US bond yields, the greenback has been falling throughout the week 0.71%, with the US Dollar Index sitting at 93.60 at press time.
UK’s softer than expected inflation will not deter the Bank of England from raising rates
On the macroeconomic front, inflation in the United Kingdom for September slowed surprisingly, but it would not stop the Bank of England from hiking interest rates as soon as the next month.
The headline Consumer Price Index (CPI) for the UK rose by 3.1% on an annual basis, lower than the August 3.2% increase, as reported by the Office for National Statistics. The so-called Core CPI, excluding food and energy prices, expanded by 2.9% shorter than the 3% estimated by economists.
Overall the market expectations that the BoE will be the first among the major central banks to raise rates stills, due to investors betting it will do it by the November meeting.
In the last monetary policy meeting, the BoE said it expected inflation to rise above 4% in the Q4 of 2021, but energy prices have risen sharply since then.
On Sunday, BoE Governor Andrew Bailey said that the central bank would “have to act” to curb inflationary forces. Furthermore, he noted that inflation “will last longer, and it will, of course, get into the annual numbers for longer as a consequence.” Moreover, he reiterated that “we, at the Bank of England, have signaled, and this is another signal that we will have to act.”
Federal Reserve policymakers, ready to announce the bond tapering by FOMC’s November meeting
The US economic docket is absent except for the EIA Crude Oil inventories and Federal Reserve speakers.
On Wednesday, the Federal Reserve Vice-chairman Randal Quarles said that the test for a bond taper has been met and supports the decision at the November meeting to reduce the QE asset purchases by the first half of 2022.
Later on the same day, Cleveland’s Federal Reserve President Loretta Mester said that “The Federal Reserve should begin tapering its asset purchases soon, but the US central bank is not likely to raise interest rates in the near term.” She added that “So far medium and longer-run inflation expectations are consistent with 2% inflation goal.”
Morgan Stanley (MS) reiterates its bearish bias for the EUR/USD in the latest analytical note published on Wednesday.
The US bank highlights the European Central Bank’s (ECB) ‘transitory’ consideration to the inflation fears exerting downside pressure on the Eurozone nominal and real yields and weighing on the regional currency.
“At the same time, Eurozone data have also been missing market expectations lately, consistent with our economists' projection of growth momentum in the bloc moderating in 4Q,” said Morgan Stanley.
The MS adds, “This stands in contrast with the acceleration in US growth that our economists are expecting, which should also put downward pressure on EUR/USD.”
Read: EUR/USD Price Analysis: Further upside hinges on 1.1670 breakout
- USD/CHF holds lower ground at mid-September lows, sidelined of late.
- Descending RSI line, weekly falling trend line favor sellers.
- 200-DMA, ascending trend line from early June offer strong support.
USD/CHF remains on the back foot around 0.9185, taking rounds to a five-week low flashed during the early week amid Thursday’s Asian session.
The Swiss currency (CHF) pair dropped the most in a week the previous day while printing a two-day south-run backed by a downward sloping RSI line, also taking a u-turn from the one-week-old resistance line.
Hence, the USD/CHF bears are all set to attack the nearby support, namely the 100-DMA level of 0.9177.
However, any further weakness past 100-DMA will be challenged by a convergence of 200-DMA and a four-month-long support line, close to 0.9140, a break of which will give way to the USD/CHF sellers targeting mid-August lows near the 0.9100 threshold.
Alternatively, the 0.9200 round figure and stated immediate resistance line, close to 0.9240, will question the short-term upside momentum of the pair.
In a case where USD/CHF bulls manage to cross 0.9240, July’s top and September 20 peak, respectively around 0.9275 and 0.9335, will be crucial levels to watch.
USD/CHF: Daily chart
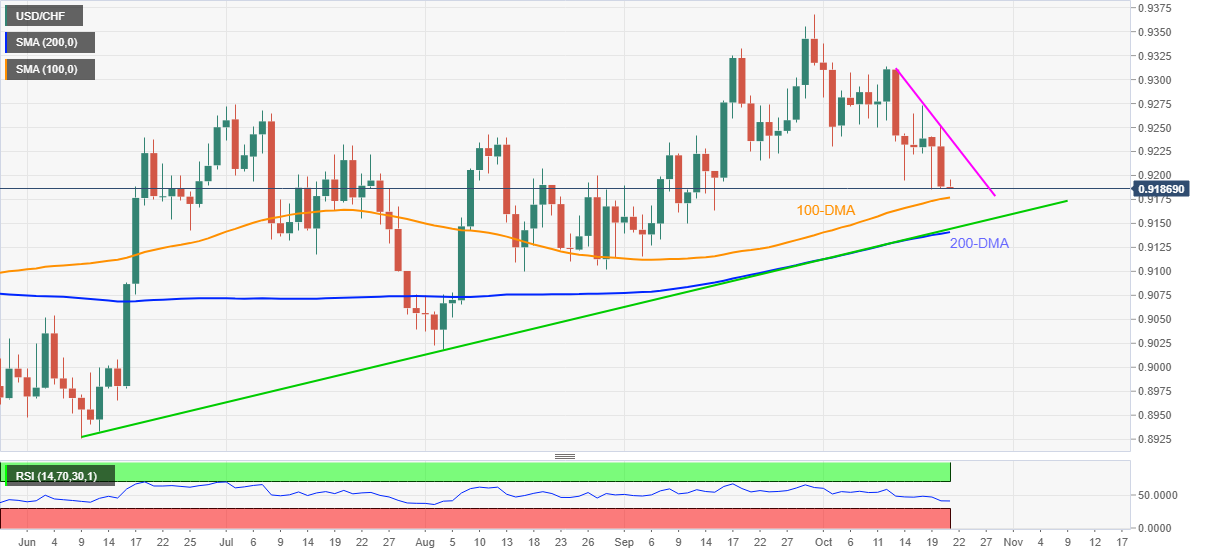
Trend: Further weakness expected
- USD/JPY trades virtually unchanged on Wednesday in the initial Asia session.
- The US dollar trades below 94.00 despite higher US T-bond yields.
- Mixed Fed’s officials and data weighs on the US dollar.
USD/JPY remains muted on Thursday after testing the fresh four year high in the previous session’s. The pair stays in a relatively narrow price band, after hovering near the daily highs in the US session. At the time of writing, USD/JPY is trading at 114.37, up 0.02% for the day.
The US benchmark 10-year Treasury bond yields trade at 1.65%, the highest in the two years. Investors continue to anticipate the Fed’s tapering next month amid rising inflationary pressure and soaring energy prices.
US Cleveland Fed’s President Loretta Mester remained bullish on Fed’s tapering but refrained from the interest rate hike timeline.
On the other hand, the Japanese yen surrenders its gains on improved risk sentiment. It is worth noting that, S&P 500 Future is trading at 4,524, up 0.02% for the day.
As for now, traders are waiting for the US Initial Jobless Claims and Fed’s Offical’s speeches to gauge the market sentiment.
USD/JPY additional levels
- USD/CAD awaits fresh clues to extend two-day downtrend.
- Firmer inflation at home joins strong WTI crude oil prices to favor bears.
- Risk-on mood, broad USD weakness adds strength to the bearish bias.
- US data, risk catalysts will be in focus amid a light calendar in Canada.
USD/CAD licks its wounds around three-month low, sidelined near 1.2320 during Thursday’s Asian session.
The Loonie pair refreshed the multi-day bottom during a two-day fall the previous day after the Canadian inflation data came out better-than-expected. Further, firmer prices of Canada’s main export item WTI crude oil and US dollar weakness added to the downside pressure.
In addition to Canada’s headlines Consumer Price Index (CPI) for September, the Bank of Canada’s (BOC) CPI Core figures also rose past YoY forecasts and prior readings. The same hints at the BOC’s further tightening of monetary policy and favor for the USD/CAD bulls.
Elsewhere, oil prices cheered lower-than-anticipated weekly inventory data from the Energy Information Administration (EIA), as well as US dollar weakness and risk-on mood. That said, WTI crude oil jumped to the fresh high since October 2014 of $83.55, around $83.40 by the press time.
That said, the US Dollar Index (DXY) prints a six-day south-run near the lowest levels in three weeks, flashing 93.60 level by the end of Wednesday’s North American session. The greenback gauge failed to benefit from the tapering signals from Federal Reserve Governor Randal Quarles as equities rallied on firmer earnings and the Treasury yields also softened after refreshing the multi-day top.
While portraying the mood, Wall Street benchmarks gained upside momentum amid strong Q3 reports from the industry leaders like Tesla and chatters over US stimulus passage. The same exerted pressure on the 10-year Treasury yields around 1.66%, up 2.6 basis points (bps), following the bond yields’ run-up to the five-month high.
Given the lack of major data/events, USD/CAD traders need to pay close attention to the risk catalysts and the second-tier US economics for fresh impulse.
Technical analysis
A clear downside break of 61.8% Fibonacci retracement of June-August upside, near 1.2365, directs USD/CAD towards late June’s low surrounding 1.2250 should the quote manage to conquer the 1.2300 immediate support.
- EUR/USD bulls take a breather following six-day uptrend.
- Bullish MACD, 21-DMA cross keeps buyers hopeful to overcome two-month-old upside hurdle.
- 23.6% Fibonacci retracement adds strength to the downside support.
EUR/USD remains sidelined below the 1.1670 key hurdle, around 1.1650 during the initial Asian session on Thursday. The currency major pair poked the crucial horizontal resistance during the early week but failed to provide a follow-though on Wednesday.
Even so, bullish MACD signals and a clear run-up beyond 21-DMA, as well as 23.6% Fibonacci retracement (Fibo.) of July-October upside, near 1.1615, favor the buyers to aim for further advances.
However, a daily closing beyond 1.1670, comprising August lows, becomes necessary. Also adding to the upside filter is the September 22 swing bottom around 1.1685 and 50% Fibo. level near 1.1715.
Should the quote manage to clear the 1.1715 resistance, the late September high near 1.1755 will return to the chart.
Meanwhile, pullback moves remain less problematic until staying beyond 1.1615 support confluence.
Following that, the 1.1600 and 1.1550 may entertain EUR/USD bears before dragging them to the yearly bottom near 1.1525.
EUR/USD: Daily chart
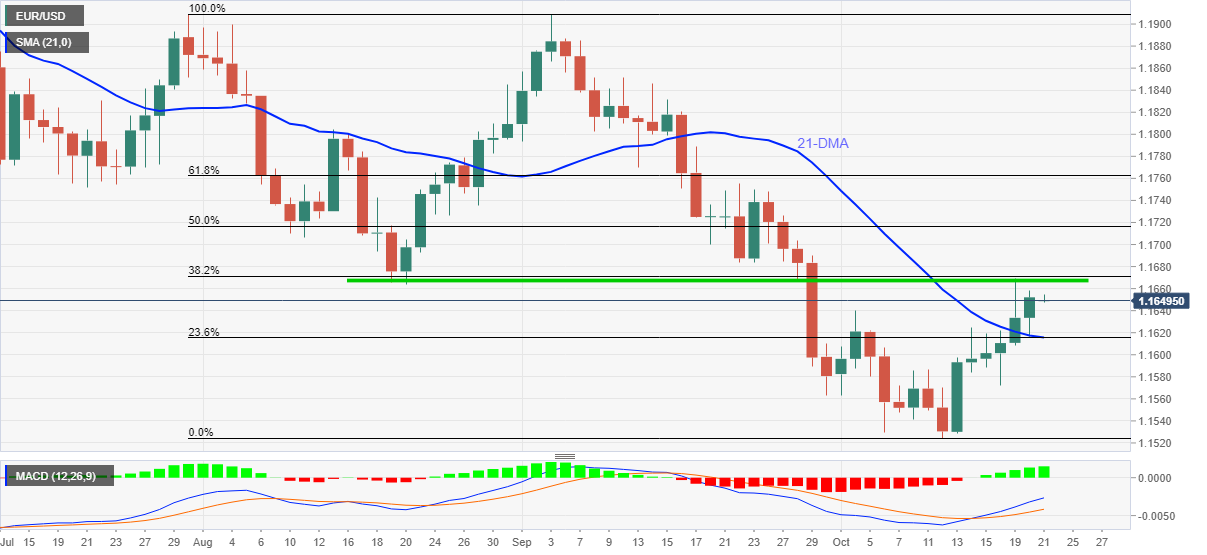
Trend: Further upside expected
“The Federal Reserve should begin tapering its asset purchases soon, but the US central bank is not likely to raise interest rates in the near term,” said Cleveland Federal Reserve Bank President Loretta Mester during Wednesday’s interview with CNBC, per Reuters.
Fed’s Mester adds “The thought about raising interest rates is not a near-term consideration at all.”
Key quotes
A lot of the increase inflation is tied to COVID-19, whether it's to demand or supply.
As asset purchases wind down, will have time to assess inflation, employment.
Revised up inflation forecast for this year.
Expects bottlenecks to last longer than originally expected.
Will see inflation readings come back down next year.
If we don't see inflation coming down next year, will need to reassess.
Baseline forecast is for inflation to come down, but there are upside risks.
So far medium and longer run inflation expectations are consistent with 2% inflation goal.
Some house price increases are a covid effect; not a reason to change monetary policy.
We've met test for taper.
Fed policy is well-calibrated to outlook.
Very comfortable with where policy is right now.
Banking system is quite healthy.
Q3 GDP will be weaker than 1h, but still expect US GDP to grow 5% to 6% this year.
Market’s reaction
Given the lack of key catalysts and attention on equity rallies, traders paid little heed to the news.
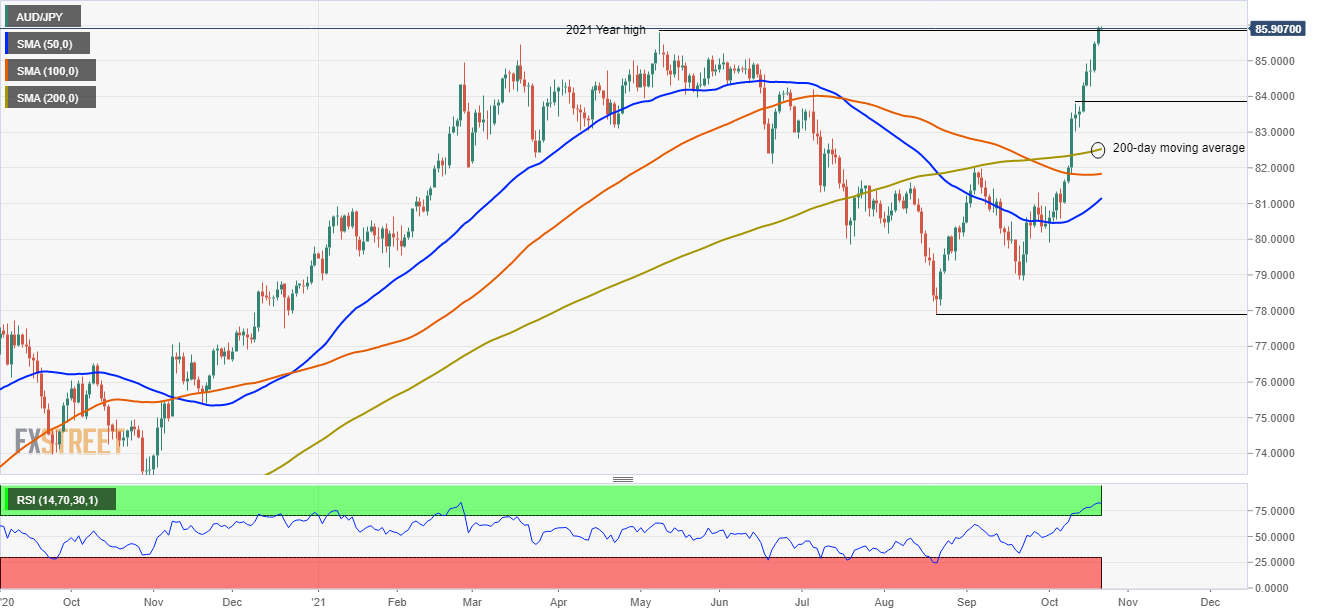
- Positive market sentiment favors risk-sensitive currencies, like the AUD.
- AUD/JPY: The prevailing trend still tilted to the upside on the back of the interest rate differentials.
- AUD/JPY: Closes to 86.00, on the back of a risk-on environment.
The AUD/JPY advances as the Asian session begins, barely up 0.02%, trading at 85.93 at the time of writing. The market sentiment is upbeat, as the Asian sessions follow through the New York footsteps, with Asian equity futures rising between 0.02% and 1.45%, except for the Japanese Topix, which drops 0.25% at press time.
The positive market sentiment has gained follow-through since Monday. Robust third-quarter US corporate earnings remain the main driver of the financial markets, as companies have printed numbers better than expected, despite the ongoing elevated energy costs and rising raw materials around the globe.
AUD/JPY Price Forecast: Technical outlook
Daily chart
The AUD/JPY is trading at fresh five-month highs, trading above the May 10 high of 85.80, on the doors of 86.00. In the case of a daily close above the latter, December 5, 2017, high at 86.84 would be the first resistance. A sustained break of that level would expose crucial supply areas towards an 89.00 challenge. Firstly January 10, 2018, low at 87.20, followed by January 31, 2018, high at 88.49.
On the other hand, failure at 86.00 could send the AUD/JPY tumbling lower. A daily close below the 84.27 level could spur a downward move towards 83.80. A breach of the latter would expose the 200-day moving average (DMA) at 82.47.
The Relative Strength Index (RSI), a momentum indicator, is at 82, in overbought levels, indicating that the AUD/JPY might consolidate. That outcome could open the door to a “buy the dip” narrative, as the upward bias is confirmed by the daily moving averages (DMA’s), which are located well below the spot price.
- NZD/USD grinds higher after refreshing four-month peak, six-day uptrend.
- Carry trade, firmer equities and US Treasury yields’ retreat favor pair buyers.
- ANZ rate change, UK-NZ free trade deal add to the bullish bias.
- Risk catalysts remain on the driver’s seat amid a light calendar.
NZD/USD edges higher around multi-day top close to 0.7200 during early Thursday morning in Asia. Alike other major currency pairs, the quote also cheers broad US dollar weakness, in addition to the carry trade opportunity that has been applauded of late.
The US Dollar Index (DXY) prints a six-day south-run near the lowest levels in three weeks, flashing 93.60 level by the end of Wednesday’s North American session. The greenback gauge failed to benefit from the tapering signals from Federal Reserve Governor Randal Quarles as equities rallied on firmer earnings and the Treasury yields also softened after refreshing the multi-day top.
That said, Wall Street benchmarks gained upside momentum amid strong Q3 reports from the industry leaders like Tesla and chatters over US stimulus passage. The same exerted pressure on the 10-year Treasury yields around 1.66%, up 2.6 basis points (bps), following the bond yields’ run-up to the five-month high.
On the other hand, the Fed policymaker Quarles said, per Reuters, “Fed to begin dialing down its bond-buying program, it would be "premature" to start raising interest rates in the face of high inflation that is likely to recede next year.”
It’s worth observing that Evergrande’s failure to seal the asset sale deal with Hopson Development Holdings and fears that China’s economy is gradually losing momentum probe NZD/USD bulls, despite being ignored so far.
Above all, the Reserve Bank of New Zealand’s (RBNZ) rate hike gives rise to the carry and backs the NZD/USD bulls. Though, fears surrounding the virus-led activity restrictions’ impact on the jobs seem to poke the RBNZ hawks even as the September inflation figures came in strong earlier in the week.
Additionally, the recent news suggesting higher interest rates for the housing loan consumers, raised by the Australia and New Zealand Banking Group (ANZ) also propelled the RBNZ towards another rate hike. Furthermore, the news relating to the UK and New Zealand’s (NZ) agreement over a free trade deal adds to the NZD/USD strength.
“NZ stands a better chance than most to be able to keep inflation expectations anchored. That in turn speaks to FX markets focusing on carry, not high inflation. A higher NZD will also help tame inflation; that reward “should” go to those who are proactive,” said the ANZ.
Moving on, a lack of major data/events will highlight risk catalysts as crucial factors to watch for fresh impulse ahead of the US session when the weekly jobless claims and monthly housing data may entertain traders.
Technical analysis
A clear upside break of September’s top surrounding 0.7170 enables NZD/USD bulls to aim for May’s peak near 0.7320. However, overbought RSI conditions may probe the advances with intermediate pullbacks.
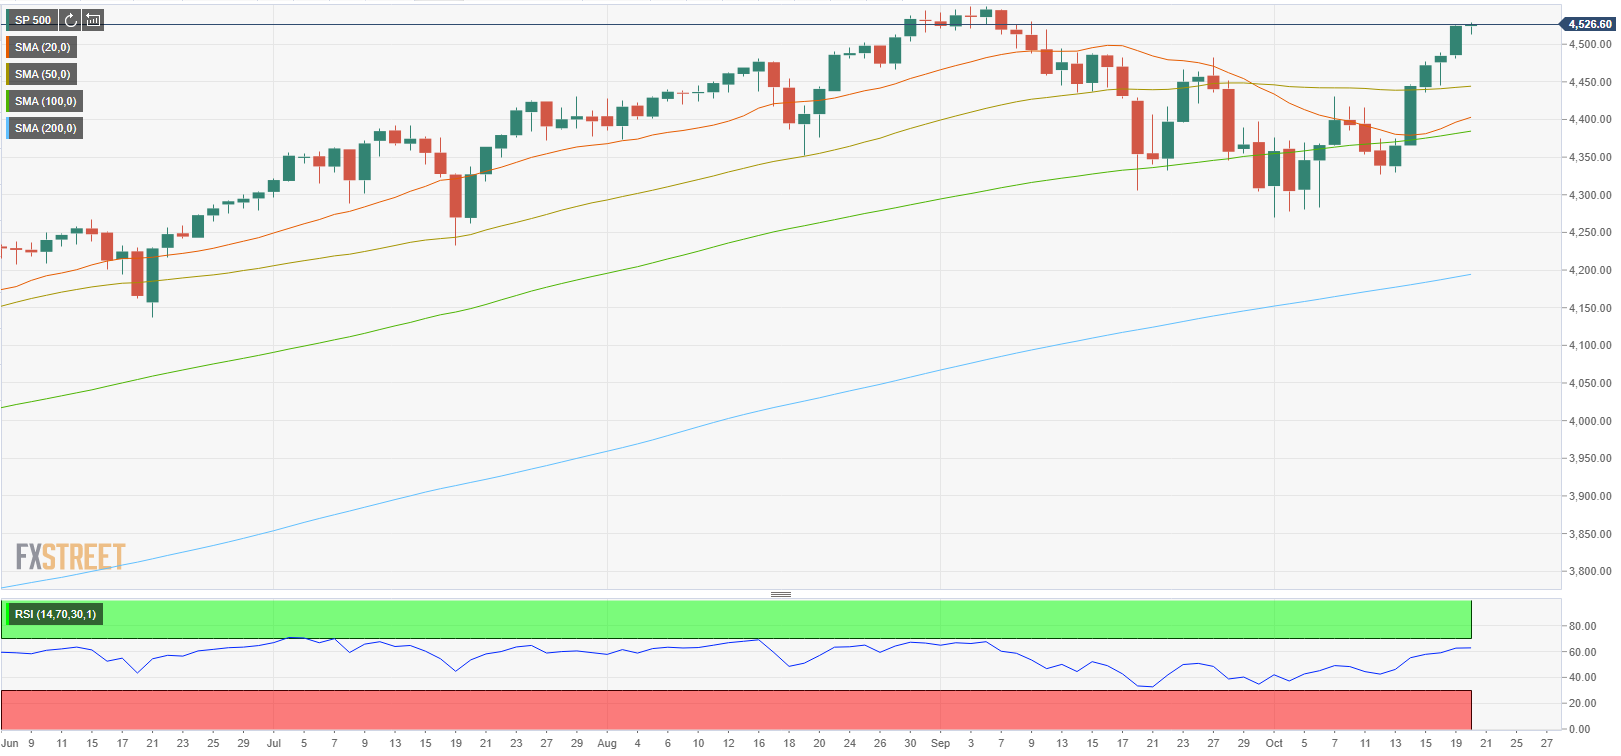
- The S&P 500 added 17.14 points, or 0.38%, to end at 4,536.77.
- The Nasdaq Composite dropped 6.25 points, or 0.05%, to 15,121.68.
- The Dow Jones Industrial Average climbed 157.95 points, or 0.45%, to 35,615.26.
The S&P 500 and the Dow were moving towards record highs on Wednesday following strong forecasts from healthcare companies Anthem and Abbott. However, the Nasdaq was unable to match form and wilted below =the prior days closing level which likely spurred some additional profit-taking as US yields tried to rebound mid-day.
The S&P 500 did close up for a sixth-straight session. The Dow hit a new intraday high but moved lower later in the day and it failed to set a record close. According to preliminary data, the S&P 500 added 17.14 points, or 0.38%, to end at 4,536.77 points, while the Nasdaq Composite dropped 6.25 points, or 0.05%, to 15,121.68. The Dow Jones Industrial Average climbed 157.95 points, or 0.45%, to 35,615.26.
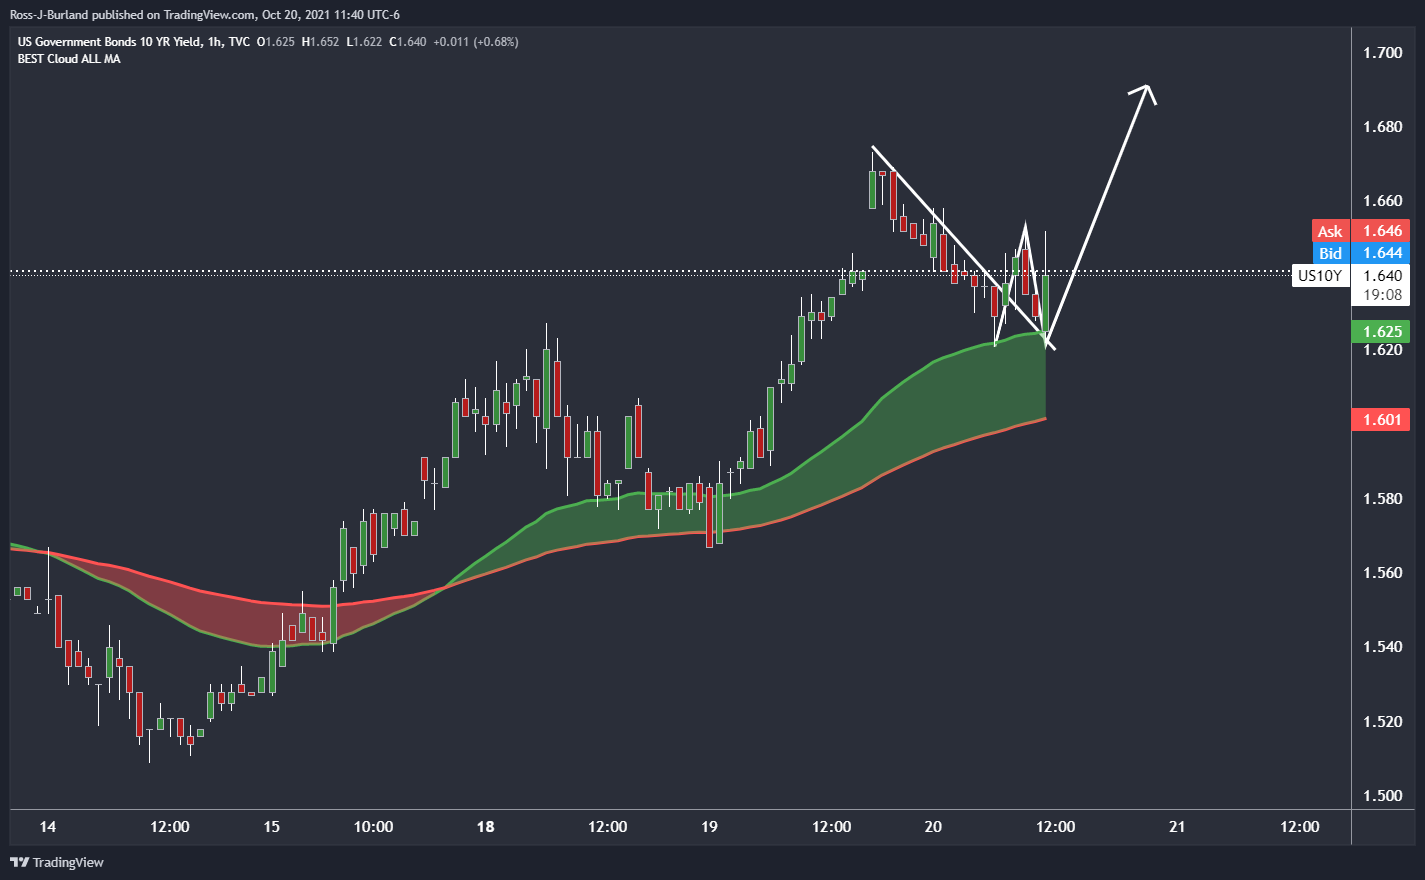
US yields in focus
This as the US 10-Year Treasury yield rallied to 1.6730% to score a fresh five-month high before it sank to 1.62% on Wednesday from a high of 1.673%. However, they are now steadied and could be on the verge of another surge to the upside from a technical perspective as the yield spikes from the 21-50 hour SMMA cloud and building demand at counter-trendline support following a break of the hourly flag resistance:
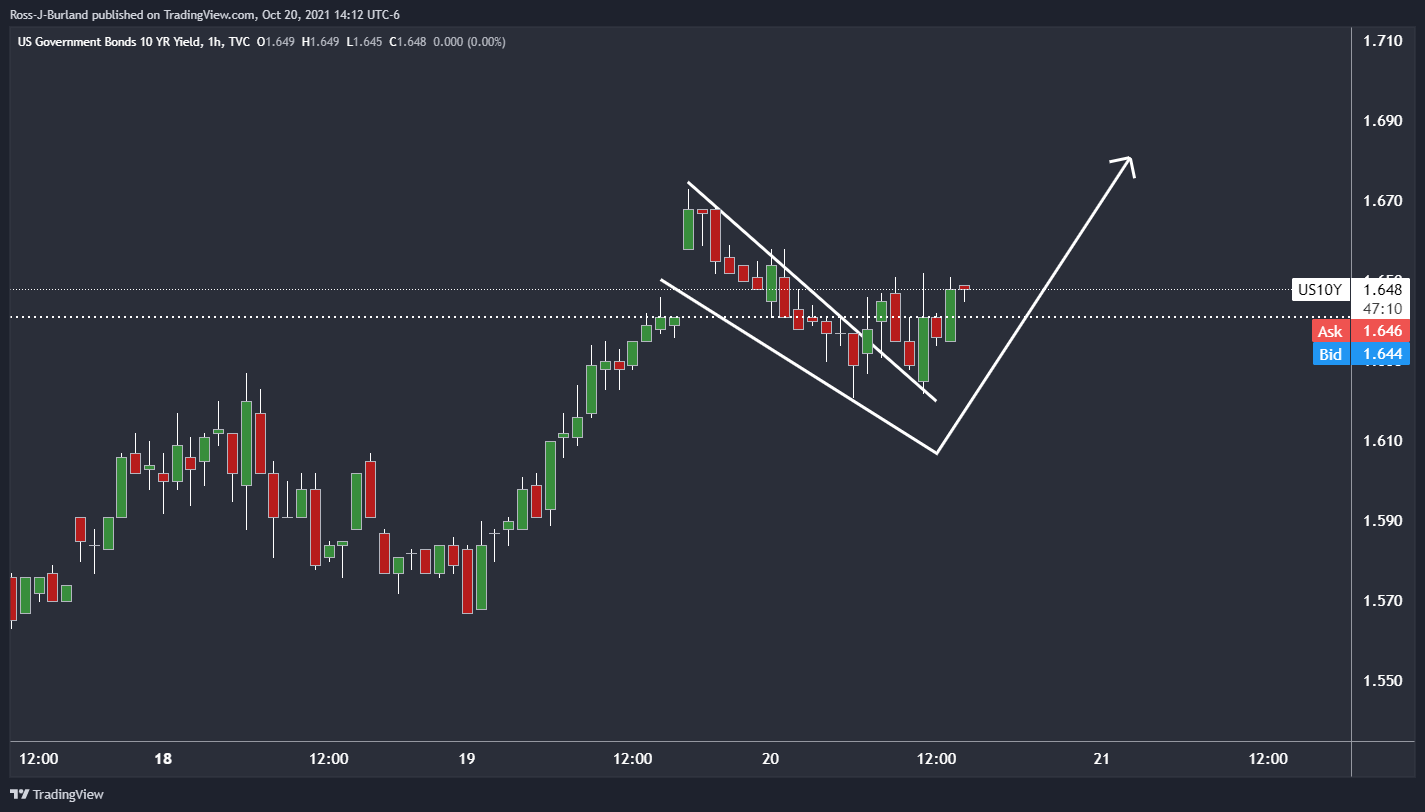
A rise in yields could put pressure on the benchmarks as investors fret about inflation and rising borrowing costs.
- AUD/USD has been in a parabolic daily rally that could face headwinds.
- US yields are trying to make a comeback and that should support US dollar.
AUD/USD has been an impressive show mid-week, rallying from a low of 0.7465 and reaching a high of 0.7522. It was a US dollar story to start the day with risk sentiment upbeat and as investors focused on rising commodity prices which supported the Aussie. Into the Wall Street close, the bulls are trying and have shied away from the 0.7532 target as the April 1 lows. Instead, the price is levelling out near 0.7520.
The US dollar fell from a one-year high against a basket of other currencies last week with other central banks also sounding the alarm with regards to inflation and a need to act. Both the Reserve Bank of New Zealand and the bank of England are expected to lift off immanently which has stolen the greenback's thunder of late. However, the Federal Reserve is also expected to raise rates sooner than expected to quell rising price pressures, so the Us dollar remains a strong contender for the leader board in the forex space also.
AUD/USD vs US yields
There is also a technical case for a rebound in the 10-year US yield which sank to 1.62% on Wednesday from a high of 1.673%. However, they are now steadied and could be on the verge of another surge to the upside from a technical perspective as the yield spikes from the 21-50 hour SMMA cloud and building demand at counter-trendline support following a break of the hourly flag resistance:
Should the US yields break higher and take the US dollar for a ride to the upside as well. This could prove a major headwind for commodity currencies for the end of the week's sessions.
Meanwhile, the markets are going to be watchful of Reserve Bank of Australia's governor, Phillip Lowe tomorrow who is making a speech, but he is unlikely to reference Australia's monetary policy specifically at the Conference on Central Bank Independence, Mandates and Policies. Next week's RBA’s November statement is the next key AUD risk event for this cross.
- Despite higher US T-bond yields, gold advances during the New York session.
- Risk-on market sentiment weakened the safe-haven status of the greenback, favoring flows towards the non-yielding metal.
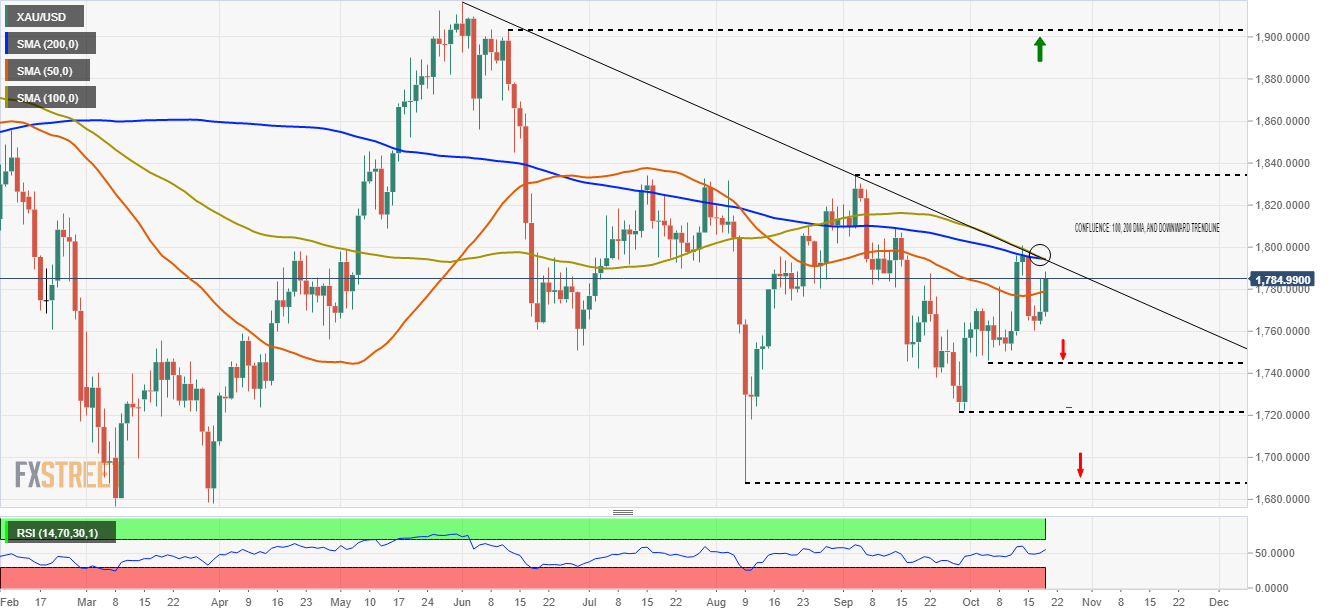
- XAU/USD: For buyers, strong resistance lies ahead at $1,800.00.
Gold (XAU/USD) climbs during the New York session, up 0.91%, trading at $1,785.38 at the time of writing. The market mood is in risk-on mode due to robust US corporate earnings, which eases concerns about labor shortages and elevated prices for raw materials.
Meanwhile, gold extended its two-day rally after the last Friday’s collapse that witnessed the yellow metal tumbling $32.00 on the back of a good US Retail Sales Report.
In the meantime, the US Dollar Index, which correlates inversely to the non-yielding metal, sinks 0.21%, sitting at 93.59, contrarily to the US T-bond 10-year yield, which is advancing one basis point, currently at 1.645%, at press time
XAU/USD Price Forecast: Technical outlook
Daily chart
In the daily chart, XAU/USD is trading above the 50-day moving average (DMA) at $1,779.05, approaching the $1,800.00 area. Around this level lies the confluence of a downward slope trendline, coupled with the convergence of the 100 and the 200 DMA would add selling pressure on the precious metal.
In the outcome of an upside break of the abovementioned could exert upward pressure on XAU/USD. The first resistance level on the way up would be the September 3 high at $1,834.02, followed by the June 11 high at $1,903.33.
On the flip side, failure at the latter could send gold tumbling towards the October 6 low at $1,765.09. A breach of the latter would expose crucial support levels, as the September 29 low at $1,745.56, followed by the August 9 low at $1,687.78
The Relative Strenght Index (RSI), a momentum indicator, is at 55, aiming higher, suggesting that buying pressure could may help a gold rally towards a $1,800.00 test.
Tesla (TSLA) released earnings after the close on Wednesday, October 20. Earnings Per Share (EPS) were $1.86 versus the estimate of $1.57.
Revenue for the quarter came in at $13.76 versus the estimate of $13.63 billion.
Tesla (TSLA) shares are trading $858.74 in the after market, a change of -0.81% on Wednesdays close.
See more here on why the earnings beat may not be enough to keep the recent rally in Tesla (TSLA) stock going.
What you need to know on Thursday, October 21:
The greenback remained under selling pressure and shed ground against all of its major rivals, including that considered safe-haven. The American dollar enjoyed from some temporal demand early in the European session, as US government bond yields jumped to fresh multi-month highs, with the yield on the 10-year Treasury note peaked at 1.673%, but retreated toward 1.64%. Earlier in the year, the yield moving past 1.70% used to trigger sharp dollar’s demand.
The EUR/USD pair trades around 1.1650, posting a modest intraday advance. European Central Bank policymaker Francois Villeroy repeated that current inflation spikes are expected to be temporary. The EU released the final version of the September Consumer Price Index, which was confirmed at 3.4% YoY in September, while the core annual reading printed at 1.9%, validating the European Central Bank’s wait-and-see stance.
GBP/USD finished the day above 1.3800 despite mixed UK inflation data. The Consumer Prices Index came in at 3.1% YoY in September when compared to 3.2% recorded in August. The core reading fell to 2.9% YoY last month from 3.1% registered in August, falling short of the consensus forecast of 3.0%. The BOE is anyway expected to raise rates sooner rather than later, which helped to keep the pound afloat.
Commodity-linked currencies reached fresh multi-month highs versus the greenback. AUD/USD trades around 0.7520, while USD/CAD pressures the 1.2300 mark. The USD/JPY pair ticked lower and settled at 114.26.
Gold posted a third consecutive higher high on a daily basis and settled at around $1.784 a troy ounce. Crude oil prices dipped ahead of the US opening but ended the day at fresh multi-year highs. WTI settled at $83.25 a barrel.
Bitcoin price targets $125,000 as next major all-time high
Like this article? Help us with some feedback by answering this survey:
- GBP/JPY stalls around 158.00 on a softer than expected UK inflation reading.
- A risk-on market mood boosts the prospects of the risk-sensitive British pound.
- GBP/JPY: The pair is tilted to the upside, but any lower corrections might be good opportunities for buyers.
The GBP/JPY stalls its upward trend around 158.00, either way, it climbs 0.10% during the New York session, trading at 157.95 at the time of writing. The market sentiment remains positive, even though central banks are looking to normalize monetary policy conditions, higher energy prices, and the Federal Reserve bond taper announcement.
The British pound slid on Wednesday following the UK CPI release, which showed that the Consumer Price Index for September rose by 3.1% annually, lower than the 3.2% foreseen by analysts. Furthermore, the UK Core CPI, which excludes volatile food and energy prices, decelerated to 2.9% on a yearly basis, lower than the August reading of 3.1%.
Despite the lower inflation reading, the market still expects the Bank of England (BoE) to hike interest rates before the year's end, ultimately giving a lift to the GBP/JPY as the pair tumbled below 158.00.
That said, and if the Bank of England hiking rates prospects remain on investors' minds, the British pound could appreciate more in the following days.
GBP/JPY Price Forecast: Technical outlook
Daily chart
The GBP/JPY upward trend is overextended, as depicted by the Relative Strength Index (RSI), a momentum indicator at 78 within the overbought area, indicating that the pair might correct before resuming the ongoing trend. However, as long as the daily moving averages (DMA's) remain well below the spot price, this favors the British pound.
In case of a correction lower, there could be some dip buyers around the October 18 low at 156.60, immediately followed by the May 27 high at 156.07.
On the other hand, if the GBP/JPY rally extends, a daily close above the 157.00 psychological level could open the way for a 158.00 test.
- The euro returns above 1.1600 to approach Octpober's top at 1.1670.
- US dollar weakness allows for further euro appreciation.
- EUR/USD: On a recovery mood, heading towards 1.1741 – Commerzbank.
The euro keeps crawling higher against a somewhat softer US dollar on Wednesday, on track to complete a three-day recovery. The pair has confirmed above 1.1600 earlier today to ease negative pressure, before hitting resistance right below October’s peak, at 1.1670.
The euro takes advantage of a weaker US dollar
The common currency has been buoyed by a weaker greenback again on Wednesday, with the US dollar is losing ground on the back of upbeat quarterly earnings in the Healthcare sector. Better than expected earnings reported by Anthem and Abbott Laboratories have eased investors’ fears about surging inflation and supply chain disruptions.
In this background, the US Dollar Index has retreated further from the one-year high at 94.50 hit last week, reaching session lows at 93.50 area, 1% below last week’s top. The positive market sentiment has been reflected on moderate advances in Wall Street, with the S&P 500 Index rallying for the sixth consecutive day to test year-to-date highs at 4,545. The Dow Jones Index is 0.45% up, while the Nasdaq has dipped into negative territory halfway through the session to trade nearly flat at the moment of writing.
EUR/USD: Seen appreciating beyond 1.1700 – Commerzbank
Karen Jones, Team Head FICC Technical Analysis Research at Commerzbank, sees the pair in a recovery mood, targeting 1.1741: “EUR/USD is in recovery mode near-term. The intraday Elliott wave counts remain positive and we would allow for a deeper retracement to the 1.1741 four-month downtrend.”
Technical levels to watch
- WTI bulls step back in on inventories and demand outlook.
- Oil markets continue to benefit as delta-variant risks have proved benign.
Oil prices edged higher on Wednesday, with West Texas Intermediate shaking off early weakness following the Energy Information Administration report on an unexpected draw on US oil inventories. At the time of writing, WTI is trading 0.38% higher at $83.35 and has travelled between a low of $80.81 and a high of $83.45.
WTI climbed on the back the EIA reporting US oil inventories falling by 0.4-million barrels last week, while analysts, on average, expected a 1.9-million-barrel rise, according to a Reuters poll. The American Petroleum Institute's weekly survey on Tuesday reported a 3.3-million-barrel rise.
US crude stocks fell by 431,000 barrels in the most recent week, the US Energy Information Administration said, against expectations for an increase, and gasoline stocks plunged by more than 5 million barrels as refiners cut processing due to maintenance.
US stocks at the Cushing, Oklahoma delivery hub hit their lowest level since October 2018. Gasoline stocks are now at their lowest since November 2019, the EIA said.
Additionally, the Organization of the Petroleum Exporting Countries maintains a slow increase in supply rather than intervening to add more barrels to the market. This has occurred at the same time that US demand has ramped up.
Oil prices hit on China coal move
Oil prices have enjoyed a combination of factors, one of which is China's switch from coal to oil to prove electricity. However, overnight, the market had softened overnight after the Chinese government seeks to ensure coal mines operate at full capacity as Beijing moved to ease a power shortage.
''Saudi Arabia's minister of energy said users switching from gas to oil could account for the demand of 500,000-600,000 barrels per day, depending on winter weather and prices of other sources of energy,'' Reuters reported.
Covid risks benign, supporting energy prices
Meanwhile, ''oil markets continue to benefit as delta-variant risks have proved benign while growing departure levels suggest air traffic will continue to support jet fuel demand across both APAC and the US,'' analysts at TD Securities explained.
''This supports a tight supply-demand outlook that is particularly fueling upside momentum in Brent crude and heating oil, which can be exacerbated by up to 1 million bpd of incremental winter demand due to natural gas switching for crude and fuel oils. This informs our long-short heating oil-gasoline trade.''
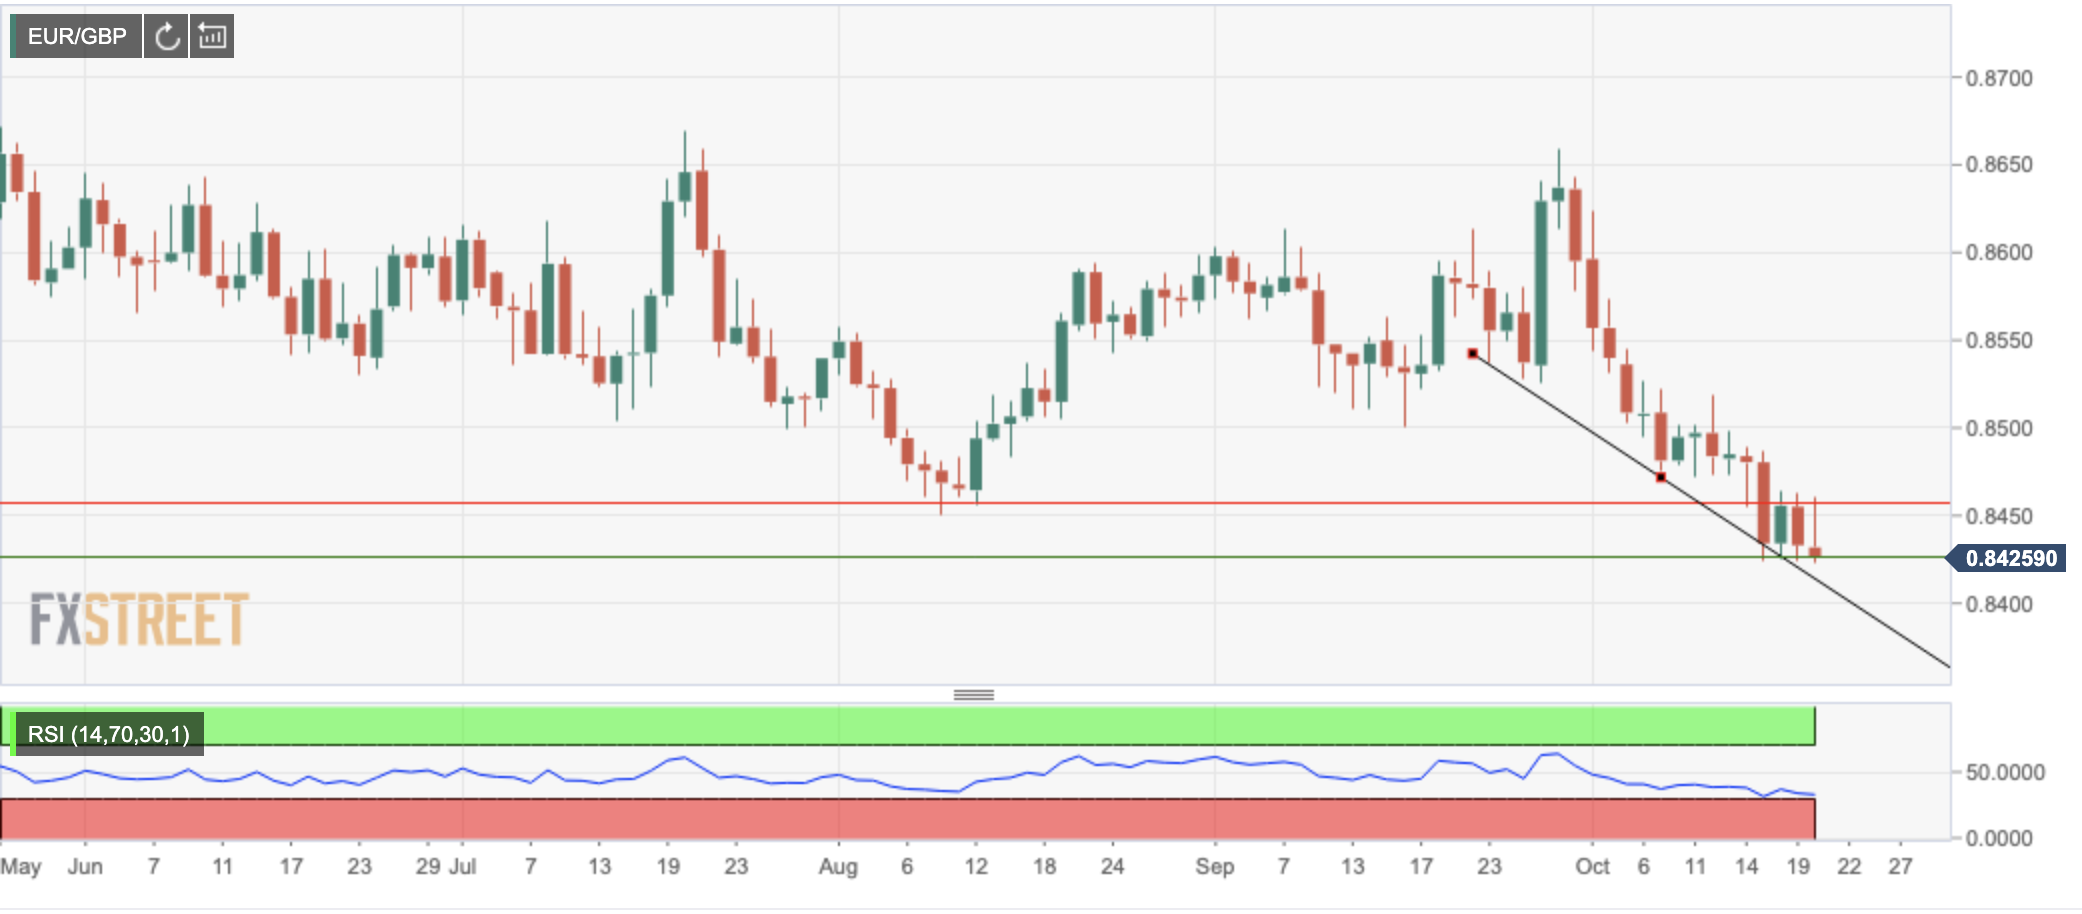
- The euro remains capped below 0.8460, with YTD low, at 0.8420 under pressure.
- Further decline towards 0.8400 and 0.8325 should not be discarded.
The euro’s recovery attempt from year-to-date lows at 0.8420 has been capped again on Wednesday at 0.8460 previous support turned resistance, and the pair pulled back again, to retest the mentioned 0.8420 low, which is under pressure at the time of writing.
Technical indicators show the pair biased lower with hourly chart still far from oversold levels, which could help to break below 0.8420 (October 15,18, and 19 lows) on track to 0.8400 trendline support, and below there, with the next potential target at 0.8325 (late February 2020 lows).
On the upside, the pair should return above 0.8460/65 (August, 12 low, October 18, 19 highs) before extending recovery towards 0.8520 (October 8 and 12 highs) ahead of 0.8660 (September 29 high).
EUR/GBP daily chart
Technical levels to watch
- Silver bulls are in control but are facing a wall of resistance.
- The US dollar is moving into support near 93.50 and yields could pick up as a headwind for precious metals.
Silver has continued with its northerly projection, testing deeper into daily resistance territory. At the time of writing, XAG/USD is trading 2.8% higher on the day so far and has travelled from a low of $23.57 to a high of $24.42. Meanwhile, the greenback has suffered a sell-off from 93.879 to a low of 93.541 as measured against a basket of currencies in the DXY index.
Also boosting precious metals, US benchmark 10-year Treasury yields pulled back after hitting a five-month peak earlier in the session. The 10-year yield fell from a high of 1.673% to a low of 1.621%. However, they are now steadied and could be on the verge of another surge to the upside from a technical perspective as the yield spikes from the 21-50 hour SMMA cloud and building demand at counter-trendline support following a break of the hourly flag resistance:
Should the US yields break higher and take the US dollar for a ride to the upside as well, this could prove a major headwind for silver for the end of the week's sessions, as illustrated below in the technical analysis. Meanwhile, investors are starting to consider where the Federal Reserve is reacting too little too late to the threat of inflation.
In the global supply crunch, inflation issues make precious metals attractive as a hedge. However, analysts at TD Securities have argued that the ''market pricing for Fed hikes remains far too hawkish, as it fails to consider that a rise in inflation tied to a potential energy shock and lingering supply chain shortages would be unlikely to elicit a Fed response.''
''The market is increasingly pricing in a policy mistake which is unlikely to take place, considering that central banks are likely to look past these disruptions as their reaction functions have been historically more correlated to growth than inflation,'' the analysts said.
Silver technical analysis
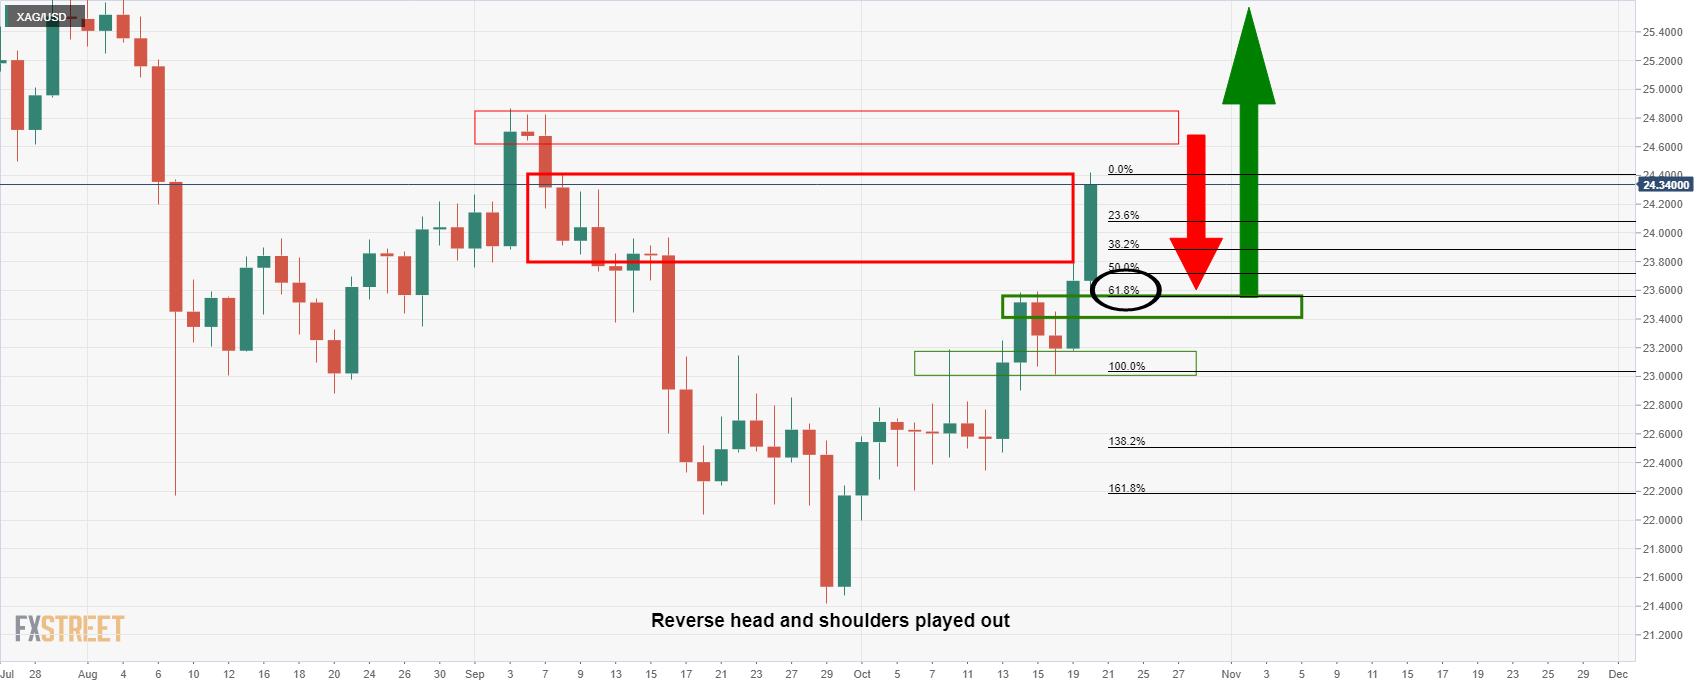
The price of silver has rallied into resistance and a pullback to restest the old resistance as new support could be expected at this juncture, especially o the US dollar bounces back into action. There is a 61.8% Fibonacci retracement level that aligns with the old resistance anear 23.60.
- The kiwi appreciates for the sitch day in a row to reach levels past 0.7200.
- A higher appetite for risk buoys the NZD and hurts the US dollar.
- NZD/USD: Seen appreciating to 0.7462/07569 – Commerzbank.
The New Zealand dollar has appreciated further on Wednesday, breaching the previous four-months high, at 0.7170, to explore prices above 0.7200 for the first time since June. The pair is extending its rally for the sixth consecutive day favored by a somewhat weaker US dollar.
The kiwi appreciates on a risk-on session
A string of positive quarterly earnings, with better-than-expected quarterly earnings figures in the Healthcare sector, following upbeat results in the banking sector last week, have buoyed market mood and offset concerns about inflation and supply-chain bottlenecks.
The S&P 500 Index is rallying for the sixth day in a row on Wednesday, pushing against year-to-date highs at 4.545 buoyed by better-than-expected quarterly earnings of the insurance company Anthem and the pharmaceutical Abbott Laboratories, with all eyes on Tesla’s results, which are expected to release record-high earnings in spite of supply-chain restrictions.
Furthermore, US Treasury yields’ rally, boosted by expectations of an imminent announcement of QE tapering by the Federal Reserve, seems to have taken a breather. Other major central banks, namely the Bank of England and the Bank of Canada, are suggesting the possibility of accelerating their monetary normalization plans to tackle high inflation and are pushing the Fed out of the limelight.
In this backdrop, the US Dollar Index, which measures the value of the dollar against the most traded currencies, has extended its retreat to 93.50 area, 1% below the one-year high, at 94.50, hit last week.
NZD/USD is aiming towards 0.7462/0.7559 – Westpac
From a technical perspective, Karen Jones, Team Head FICC Technical Analysis Research at Commerzbank sees further upside potential on the pair and points out to the 0.7462/0.7559 area: “NZD/USD yesterday broke above the 2021 downtrend and its 200-day ma and its 55-week ma at 0.7101/04, this was one tough nut to crack and the break above here should lead to some further dollar weakness (…) Target 0.7462/0.7559 long-term pivot.”
Technical levels to watch
- Risk-on market sentiment weighs on the USD versus the CHF.
- The USD/CHF falls on the back of overall US dollar weakness.
- USD/CHF: To enjoy considerable gains on a break above 0.9274 – Credit Suisse.
The USD/CHF slides during the New York session, down 0.42%, trading at 0.9191 at the time of writing. Investors' appetite is in risk-on mode, depicted by US stock indices rising between 0.27% and 0.85%, except for the Nasdaq 100, which drops 0.34% at press time.
Meanwhile, the US Dollar Index, which tracks the greenback's performance versus a basket of six peers, drops 0.21%, sits at 93.58, whereas the US T-bond 10-year yield rises one basis point, up to 1.644%, reinforcing the Fed's bond tapering thesis.
USD/CHF Price Forecast: Technical outlook
Daily chart
In the daily chart, the USD/CHF shows the pair has been under intense selling pressure around the 0.9250 area, which was unsuccessfully tested four times before driving prices lower. However, the upward bias remains in place, as the 100 and 200-day moving averages (DMA's) remain below the spot price, while the Relative Strenght Index (RSI) at 41 suggests that downward pressure remains in place.
For USD/CHF buyers to resume the upward trend, they need a daily close above the 50-DMA at 0.9213. In that outcome, the pair could push towards the October 18 high at 0.9274 resistance level. A break above the latter would expose crucial resistance zones like the October 12 high at 0.9312, followed by the September 30 high at 0.9368.
On the flip side, Wednesday's price action confirms that sellers remain in charge, but they will need a daily close below 0.9200. Once the break is accomplished, the 100-DMA at 0.9172 would be the first support, immediately followed by the 200-DMA at 0.9139.
USD/CHF: To enjoy considerable gains on a break above 0.9274 – Credit Suisse
According to Credit Suisse Analysts, an upside break above 0.9274, could pave the way for further gains on the USD/CHF:
"With trend-following indicators all still generally pointing to the upside, with the 200-day average still rising and weekly MACD still outright bullish, we look for an eventual break above short.term resistance at 0.9274 to negate the recently highlighted top."
"Whilst our core outlook stays bullish, we cannot rule out further corrective weakness whilst below 0.9274 and more important support if the market does manage to close below 0.9214 is at the 200-day average at 0.9139, which is expected to hold if reached."
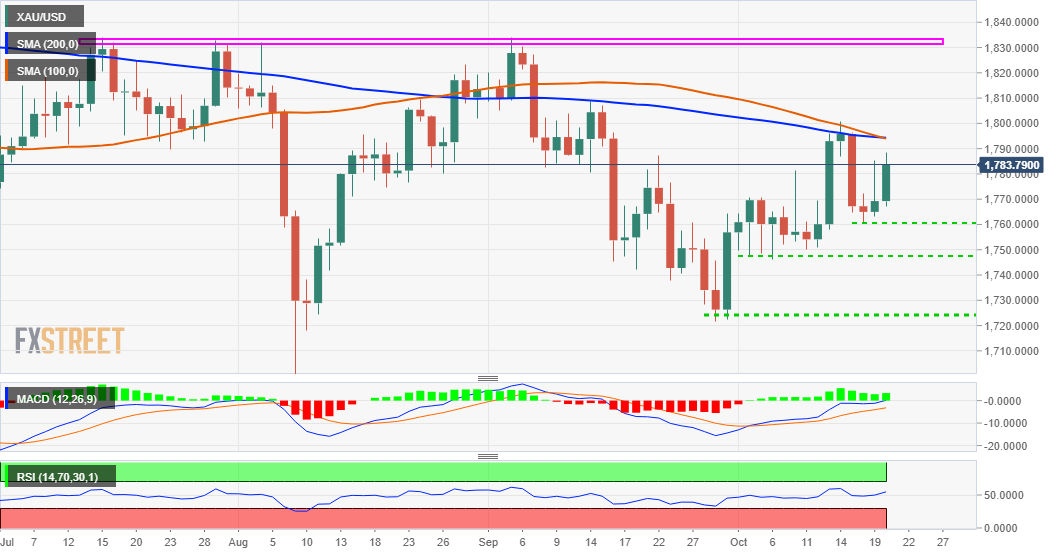
- Gold regains bullish momentum to approach $1,800.
- Risk appetite and sideways US treasury yields hurt the USD.
- XAU/USD pushing against $1,780/85 resistance area.
Gold futures have bounced higher on Wednesday, favored by broad-based US dollar pullback, amid a higher appetite for risk. The yellow metal has appreciated about $20 so far today, after having remained flat, near $1.760, during the previous two days.
The dollar falters with investors focusing on quarterly earnings
Bullion has regained upside traction on Wednesday, amid a weaker US dollar, with upbeat earnings from the Healthcare sector buoying appetite for risk and easing concerns about supply chain disruptions and surging inflation. Wall Street is trading with moderate advances, while the US Dollar Index, which measures the greenback's value against the most traded currencies has extended its retreat to 93.50 area, 1% below the one-year high, at 94.50 reached last week.
Furthermore, the recent US Treasury bonds' rally fuelled by increasing expectations of imminent QE tapering, seems to have paused. Other major central banks, namely the Bank of England and the Bank of Canada, are coming under increasing pressure to protect their economy against the impact of surging consumer prices and are forcing the Federal Reserve away from the limelight.
XAU/USD is pushing against the $1.770/80 resistance area
The pair has appreciated about 1% so far today and is trying to confirm above $1,780/85 resistance area (September 22 and October 8 highs) ahead of $1,807 (Sept. 15 high) which would expose July and September’s peak. At $1.830,
On the downside, immediate support lies at $1.760 area (October 18 low). Below here, the pair might extend losses to $1,745 (October 6 low), to face, then, a key support area at $1,725 (September 29, 30 low).
Technical levels to watch
Reuters has reported that Federal Reserve Governor Randal Quarles on Wednesday said that while it's time for the Fed to begin dialing down its bond-buying program, it would be "premature" to start raising interest rates in the face of high inflation that is likely to recede next year.
Key comments
It's clear we've met test for taper.
Supports decision at November meeting to reduce fed's asset purchases, end taper by mid-2022.
Fed remains patient to allow more recovery in jobs.
Fed is not behind the curve on inflation fight.
Inflation likely will decline considerably next year, but upside risks 'significant'.
Constraining demand now would be premature.
Monitoring how additional fiscal programs could further boost demand.
Will wait to see further improvements in employment, evolution of inflation in coming months.
If inflation does not recede next year, or if expectations become unanchored, fed's tools can bring inflation down.
Own focus is turning to inflation, from labor market.
Sees strong economic growth for rest of 2021 and 2022.
Strong demand for labor outpacing supply, pushing up wages.
Labor force participation unlikely to return to pre-pandemic level.
Market implications
The market has priced in earlier Fed hikes and tapering to start imminently and the US dollar is giving back some initial speculative gains since the Fed started to turn hawkish over the last couple of meetings. The dollar index, DXY, was last down 0.23% at 93.57 as risk sentiment on the day has improved.
The Bank of Canada (BoC) is set to taper QE purchases further to C$1bn per week with the programme likely concluded in December as the market increasingly prices in 2022 rate hike, explained analysts at ING. They expect a neutral impact on the loonie (CAD) which seems to have most of the positives in the price and may experience corrections in the near term.
Key Quotes:
“USD/CAD is finding some consolidation in the 1.23/1.24 area after a marked correction from the 1.27 level where it used to trade at the end of September. The move has been in line with the rally in other commodity currencies, which was exacerbated by the sharp rise in energy prices.”
“Domestic factors have also contributed, as the data flow has proven particularly supportive for the loonie, as a tighter jobs market and rising inflation kept strengthening the case for more Bank of Canada tapering.”
“We expect the BoC to taper asset purchases again next week and in December, formally ending QE by the end of 2021. We think this is very much in the price, and we doubt CAD can receive any significant lift from the tapering announcement next week.”
“Any material FX impact from the BoC announcement will likely rely on the degree by which the BoC will address the current market expectations that see a first 25bp rate hike almost fully priced in for the April 2024 meeting.”
- The dollar takes a breather after reaching fresh five-year highs at 114.70.
- A higher appetite for risk and a pause on US yield's rally are weighing on the US dollar.
- USD/JPY remains positive and might reach 117.80/118.60 – SocGen.
The US dollar has pulled pack after hitting fresh five-year highs at 114.70 pm Wednesday, to consolidate in the lower range of 114.00. The pair has turned negative on daily charts, although the near-term trend remains positive, after having rallied nearly 5% over the last four weeks.
The USD loses steam on higher appetite for risk
The JPY is taking advantage of a somewhat softer US dollar on Wednesday, weighed by a positive market sentiment. Wall Street’s indexes are trading with moderate advances for the second consecutive day; the Dow Jones is 0.49% up, the S&P 500 appreciates 0.39% and the Nasdaq Technical Index advances 0.66%, on the back of the release of upbeat quarterly earnings results on the Healthcare sector.
Investors’ optimism and the pause on US bond yields' rally have dented demand for the dollar, allowing most majors to post moderate recoveries. The US Dollar Index is trading about 1% down from the 94.50, one-year high, reached last week, as investor’s expectations about monetary tightening by the Federal Reserve have faded somewhat as other major central banks start to anticipate the possibility of accelerating their monetary normalization plans to tackle inflationary pressures.
The Japanese yen, on the other hand, remains heavy on the back of an adverse monetary policy differential. Federal Reserve’s hints towards QE tapering have been widening the treasury yield gap between the US and Japan -whose central bank maintains the 10-year note near zero through a yield control curve- and has squeezed the yen’s attractiveness for the investors.
USD/JPY: Still heading towards 117.80/118.60 – SocGen
The FX Analysis team at Société Générale maintains their bullish bias on the pair, with a potential target at 117.80/118.60: “Signals of a pullback are still not visible; 110.80 should cushion (…) Next potential objectives are at 115.50 and 2016 high of 117.80/118.60.”
Technical levels to watch
- The Loonie rises on the back of broad US dollar weakness across the board.
- The market sentiment is in risk-on mode, as witnessed by the oil-commodity linked CAD.
- Higher crude oil prices boost the Canadian dollar.
- Canada’s CPI for September rose by 4.4%, higher than the 4.1% in August.
The USD/CAD slides to fresh weekly lows during the New York session, down 0.24%, trading at 1.2326 at the time of writing. Despite the Federal Reserve bond taper announcement in November’s meeting and higher energy prices, the market sentiment is upbeat, boosted by robust US third-quarter corporate earnings.
The Dow Jones, the S&P 500, and the Nasdaq rise between 0.10% and 0.50%, whereas the CBOE Volatility Index (VIX), also known as the “fear index,” slid to 15.7, near the lowest since February 2020, spurring the stocks rally in the week.
In the meantime, the US Dollar Index, which measures the buck’s performance against a basket of its peers, slumps 0.15%, sits at 93.64. On the contrary, the US 10-year Treasury yield, rises one basis point, is currently at 1.635%, failing to boost the greenback.
High crude oil prices boost the CAD
Western Texas Intermediate (WTI), the US crude oil benchmark, is rising almost half percent, trading at $82.80 per barrel, weighing on the USD/CAD pair, as depicted by the 0.24% fall.
On the macroeconomic front, the US economic docket featured the EIA Crude Oil Stocks change for the week ending in October the 15. Inventories slump by 0.4 million barrels, spurring a slight jump in WTI prices.
As data published by Statistics Canada, the Canadian economic docket unveiled the Consumer Price Index (CPI) for September, which rose by 4.4% from 4.1% in August. Meanwhile, the Bank of Canada (BoC) Core CPI, excluding food and energy, increased by 3.7%, higher than the 3.6%.
Analysts at Scotiabank expect eight rate hikes by the end of 2023
According to analysts at Scotiabank, they expect eight Bank of Canada rate hikes by the end of 2023, starting on July 2022. The forecast came after Canada’s inflation was reported, which is the highest reading since February 2003.
Analysts at Wells Fargo expect the Bank of England to raise its policy rate by 15 bps at its November announcement. They expected more rate hikes during 2022 but below what is priced into interest rate markets, so they explain the pound could face some mild downside risks.
Key Quotes:
“Growth and inflation trends don't offer an open-and-shut case for an imminent rate hike. However, in the context of increasingly hawkish comments from Bank of England (BoE) policymakers, we think today's CPI will be enough for a November interest rate lift-off, and a gradual pace of rate hikes thereafter.”
“Looking beyond November we expect a relatively gradual pace of rate increases. We believe economic growth could remain somewhat choppy which could limit the speed at which policymakers move, while CPI inflation should also ease back gradually as 2022 progress. Following the initial November hike, we expect another 25 bps increase in May 2022 and a further 25 bps in November 2022, meaning we see the Bank of England's policy rate ending next year at 0.75%—a bit less than currently priced into interest rate markets. As a result, the pound could face some downside for now, and there may also be some mild downside risk to our forecast of GBP/USD appreciation over the medium-term.”
The Federal Reserve will probably have enacted rate lift-off twelve months from now according to analysts at Danske Bank. They expect to see continuing upward pressure on long-term yields. They see the 10Y US Treasury yields reaching 2% on a twelve-month horizon.
Key Quotes:
“We now expect two rate hikes, against previously only one, from the US Federal Reserve in 2022 (September and December).”
“We still do not expect the ECB to hike rates for the next few years. However, as inflation is proving to be less transitory than previously expected, and given the latest signals from the BoE, markets look likely to continue to price rate hikes into the yield curve. This has led to upward pressure on 2Y-5Y EUR swap rates.”
“We expect the market focus for the remainder of the year to shift between the factors supporting higher long yields and those pointing to lower yields. In other words, the outlook has remained quite muddy. Looking 6 and 12 months ahead, we still expect the global economy, and particularly the US economy, to continue to grow. And with an initial rate hike having moved closer and a reduced volume of bond buybacks from both the ECB and the Fed, this should tend to push long yields higher in both the US and Europe. We continue to expect US 10Y Treasury yields to rise to 2% on a 12M horizon, while 10Y Bund yields look set to increase to 0.25%.”
Data released on Wednesday showed inflation in September rose more than expected, but not boosting the loonie. According to analysts at the National Bank of Canada, inflation could continue to surprise the Bank of Canada (BoC) on the upside.
Key Quotes:
“The Canadian CPI print for September surprised on the upside, clocking in with higher inflation than consensus expectations for the fifth time over the last 6 months. As a result, annual inflation reached 4.4%, its highest level in 18 years. The month over month variation would have been stronger it was not from the sharp decline in airfares in September (-14.8%) following last month's surge (+37.5%). Again this month, gains are widespread with no less than six of the eight major components ticking up, which is also confirmed by the central bank's three preferred measures annual inflation accelerating to an average of 2.7%.”
“When the BoC makes its rate decision and releases its Monetary Policy Report next week, we expect that it will maintain its view that this is largely due to transitory factors, while acknowledging that these factors are more persistent than expected.”
“We still believe that inflation could continue to surprise the central bank on the upside. With continued supply chain disruptions and the rise in food commodity prices (historically impacting the food CPI with a 7-month lag), price pressures could persist for some time. Additionally, labor shortage indicators are currently pointing to potential wage push inflation in the coming months as workers appear to have the bargaining power to demand compensation.”
- Sterling's reversal finds support at 1.3745 before bouncing back above 1.3800.
- The pair faltered after weaker than expected UK inflation data.
- GBP/USD approaching key resistance at 1.3910/30 – SocGen.
The British pound has resumed its uptrend on Wednesday, to resume the last two weeks’ rally after a corrective reversal seen during the European session. The pair has found buyers at 1.3745, to bounce up again during the US trading time and return above 1.3800, a few pips below one-month highs at 1.3835.
UK inflation figures weigh on the GBP
According to data from National Statistics released earlier today, UK CPI accelerated at a 3.1% yearly pace, and 0.3% on the month in September, missing expectations of 3.2% and 0.4% increments respectively. These figures have dampened expectations of higher consumer inflation, which would add pressure on the Bank of England to accelerate its monetary normalization plan.
The surging energy prices have boosted consumer prices well above the Bank’s target for price stability prompting BoE officials, namely the Bank Governor, Andrew Bailey, to suggest the possibility of accelerating the monetary policy normalization plan, and thus boosting the pound’s rally from late September.
Sterling's weakness, however, has been short-lived, with the risk-sensitive GBP has buoyed by positive market sentiment. Upbeat quarterly earnings from the healthcare sector have extended the risk-on mood seen on Tuesday, fading concerns higher prices and supply chain disruptions, ultimately weighing on demand for the safe-haven US dollar.
GBP/USD should breach 1.3910/30 to see further appreciation – SocGen
From a technical perspective, the FX analysis team at Société Générale warn about a key resistance area at 1.3910/30: “The GBP/USD pair is approaching potential hurdle of 1.3910/1.3930 representing the recent peak and the 61.8% retracement from June. Overcoming this resistance zone would be crucial for the next leg of rebound (...) Failure to reclaim the 1.3910/1.3930 zone can lead to a short-term pullback. 1.3670 and last week's trough of 1.3570 are near-term supports.”
Technical levels to watch
- US dollar tumbles across the board amid risk appetite.
- Euro turns positive versus the dollar and negative against the pound.
The EUR/USD is rising modestly on Wednesday after making a rebound from 1.1615. During the American session, the pair climbed to 1.1651, slightly below the daily highs. The euro remains unable to break the 1.1650 barrier.
DXY drops as EUR/USD rebounds
The EUR/USD erased daily losses amid a decline of the greenback across the board. A risk-on mood across financial markets weighs on the dollar. The DXY is falling by 0.15% even as US yields hold around monthly highs.
On Wall Street stocks are rising. The Dow Jones gains 0.35% and the Nasdaq 0.08%. Crude oil prices are up, with WTI rising 0.60%. Gold gains more than 10$. Positive corporate results contribute to optimism. Later on Wednesday, the Federal Reserve will release the Beige Book.
From a technical perspective, the recovery of EUR/USD remains capped by the 1.1650 area. A break higher should clear the way to more gains, exposing Monday’s high of 1.1669. On the flip side, 1.1615 is the daily low, a support area and also the 20-day moving average. A daily close clearly below should weaken the euro.
Technical levels
- AUD/USD soars to fresh four-month highs above 0.7500.
- Risk-on market appetite boosts risk-sensitive currencies like the AUD and hurts safe-haven peers like the USD and the JPY.
- High Australian 10-year bond yields boost the AUD, despite RBA signals to not hike rates until 2024.
The AUD/USD climbs to four-month fresh highs, up 0.54%, trading at 0.7514 during the New York session at the time of writing. Positive market sentiment surrounds the financial market, even though the Federal Reserve’s imminent bond taper announcement and higher energy prices.
Major European and US stocks indices soar, while the CBOE Volatility Index (VIX) dropped to 15.7, near the lowest since February 2020. Meanwhile, the US Dollar Index that measures the greenback’s performance against a basket of six rivals edged lower 0.13%, sits at 93.66, contrarily to the US 10-year Treasury yield, rises one basis point, is currently at 1.635%.
The AUD/USD pair has risen more than 1% since the beginning of the week, in line with investors’ risk appetite. Although the Reserve Bank of Australia (RBA) signaled that a rate hike would not come until 2024, the market expectations are others. On Tuesday, the New Zealand CPI reading reached a 10-year high, triggering a jump on the New Zealand 10-year yield up to 2.40%, whereas the Australian 10-year coupon rose to 1.86%.
Furthermore, positive news on the COVID-19 front is that Melbourne welcomes vaccinated Sydney residents without quarantine, so as the country eases lockdowns, the economic recovery would not be jeopardized.
On the macroeconomic front, the Australian economic docket is absent. Concerning the US economic docket, the EIA Crude Oil Stocks change for the week ending in October the 15, stockpiles declined by 0.4 million barrels, triggering a slight jump in WTI prices. Moreover, Federal Reserve Vice-chair Randal Quarles will cross the wires, offering fresh impetus for AUD/USD traders.
AUD/USD Price Forecast: Technical outlook
Daily chart
The AUD/USD pair broke the resistance at 0.7477, closing to the 200-day moving average (DMA) lying at 0.7563. However, as the Relative Strength Index (RSI) is at 72 in overbought levels, the AUD/USD might consolidate before resuming the upward trend.
As the pair heads north, the first resistance would be the 200-DMA at 0.7563. A break of the latter could open the door for a test of the confluence of a downward slope trendline coupled with the June 25 high around the 0.7616 area, followed by the June 11 high at 0.7775.
On the flip side, failure at 0.7500, AUD/USD traders will find 0.7477 as its first support. A breach of that level could push the pair towards the 100-DMA at 0.7404, immediately followed by the October 13 low at 0.7323.
Commercial crude oil inventories in the US decreased by 0.4 million barrels in the week ending October 15, the weekly report published by the US Energy Information Administration (EIA) revealed on Wednesday. This reading came in much lower than the market expectation for an inventory build of 1.8 million barrels.
Market reaction
Crude oil prices started to edge higher after this report. The barrel of West Texas Intermediate, which touched a daily low of $80.77 earlier in the session, was last seen trading at $82.45, where it was still down 0.7% on the day.
Additional takeaways
"Total motor gasoline inventories decreased by 5.4 million barrels last week and are about 3% below the five year average for this time of year."
"US crude oil refinery inputs averaged 15.0 million barrels per day during the week ending October 15, 2021."
"US crude oil imports averaged 5.8 million barrels per day last week, down by 169,000 barrels per day from the previous week."
"Total products supplied over the last four-week period averaged 20.9 million barrels a day, up by 14.0% from the same period last year."
Citing the speech prepared to be delivered at the WTO trade review policy of China, Reuters reported that the US will note that they cannot ignore reports of China’s use of forced labour in several sectors.
"China’s industrial policies skew the playing field against imported goods and services, foreign manufacturers and services suppliers," the US will say. "China's other unfair trade practices include preferential treatment for state enterprises, data restrictions, inadequate enforcement of intellectual property rights and cyber theft."
Market reaction
This headline doesn't seem to be having an impact on market sentiment. As of writing, the S&P 500 Index was up 0.3% on the day at 4,530.
Alfred Kammer, the Director of the European Department at the International Monetary Fund, said on Wednesday that they are not expecting an inflation spiral in Europe, as reported by Reuters.
Additional takeaways
"Inflation driven by energy prices is expected to fade."
"Not expecting second-round inflationary effects in Europe due to slack in the European labour market."
"European Central Bank can react to deeper inflation concerns."
Market reaction
The EUR/USD pair showed no immediate reaction to these comments and was last seen rising 0.12% on the day at 1.1645.
- USD/TRY loses further momentum and tests 9.2000.
- The offered stance in the dollar weighs on the pair.
- The CBRT meets on Thursday and is likely to reduce rates.
The Turkish lira adds to Tuesday’s gains and drags USD/TRY to new 3-day lows in the boundaries of the 9.2000 yardstick on Wednesday.
USD/TRY focuses on CBRT decision
USD/TRY loses ground for the second session in a row midweek against the persistent corrective downside in the greenback. Indeed, the dollar faded the initial optimism and now the US Dollar Index (DXY) slipped back into the negative territory for yet another session.
The softer note in the buck, in the meantime, allows the risk complex – and the beleaguered lira - to extend gains for an extra session on Wednesday ahead of the CBRT event on Thursday.
It is worth noting that consensus among traders remains largely tilted towards another 100 bps interest rate cut, taking the One-Week Repo Rate to 17.00%.
Other than the CBRT meeting, the Turkish calendar will see the release of the Consumer Confidence for the current month.
USD/TRY key levels
So far, the pair is losing 0.46% at 9.2518 and a drop below 9.1234 (10-day SMA) would aim for 8.9881 (20-day SMA) and finally 8.8317 (monthly low Oct.4). On the other hand, the next up barrier lines up at 9.3699 (all-time high Oct.19) followed by 10.0000 (round level).
The UK released a raft of price data this morning, with weaker than expected results clearly weighing on the GBP. Economists at Scotiabank expect the GBP/USD pair to extend its decline towards 1.3675 after breaking below the 1.3785 support.
GBP weakens on softer than expected inflation data
“CPI rose 0.3% MoM in September, against expectations of a 0.4% gain, pushing the YoY rate of inflation down to 2.9% (from 3.0% in August). Core inflation eased to 2.9% from 3.1%. PPI data showed a 0.4% rise in input prices, well below forecasts of a 1.0% rise.”
“Cable has cracked minor support at 1.3785 (now resistance intraday) and should edge lower towards key support at 1.3675.”
- Wall Street's main indexes continue to edge higher.
- Energy stocks underperform amid falling crude oil prices.
Major equity indexes opened in the positive territory for the sixth straight day on Wednesday as risk flows remain in control of financial markets in the absence of high-tier data releases. Reflecting the upbeat market mood, the CBOE Volatility Index is down 2% on the day.
As of writing, the S&P 500, which set an all-time high of 4,545 on September 2, was up 0.15% on the day at 4,525. The Dow Jones Industrial Average was rising 0.1% at 35,487 and the Nasdaq Composite was gaining 0.08% at 15,142.
Among the 11 major S&P 500 sectors, the Energy Index is down nearly 1% pressured by the 2% decline witnessed in US crude oil prices. On the other hand, the Healthcare Index is rising 0.9% as the biggest gainer after the opening bell.
S&P 500 chart (daily)
Concerns about the UK’s growth outlook were highlighted last week by the IMF, which warned of more longer-lasting damage to the UK economy than any other country in the G7. Consequently, economists at Rabobank see a bumpy road ahead for the pound.
EUR/GBP still seen at 0.85 on a three-month view
“The IMF’s forecasts indicated that while most other advanced nations were on track to return to their pre-pandemic growth trends next year, and to exceed it by 2024, the UK’s economy would still be 3% smaller in 2024. This warning may be feeding concerns about the medium-term outlook for GBP.”
“Although the hawkishness of the BoE has pushed EUR/GBP moderately lower, both the Bank and GBP will be judged harshly if the UK recovery shows signs of faltering in the new year.”
“Despite the hawkish tone of the BoE, we retain a three-month EUR/GBP forecast of 0.85.”
USD/CAD holds in mid 1.23s. Economists at Scotiabank expect the pair to see further gains on a break above 1.2380.
Initial support seen at 1.2340
“We spot key resistance intraday at 1.2380 and would look for USD gains to pick up above here in the short run.”
“Support is 1.2340 and 1.2310/20.”
- A combination of factors assisted gold to regain positive traction on Wednesday.
- Retreating US bond yields weighed on the USD and extended support to the metal.
- The cautious market mood further benefitted the commodity’s safe-haven status.
- Gold Price Forecast: XAU/USD’s bullish potential appears limited amid bear cross
Gold gained positive traction for the second successive day and shot to fresh weekly tops, closer to the $1,790 level during the early North American session. The US dollar struggled to capitalize on the previous day's bounce from three-week lows, instead met with some fresh supply on Wednesday. This was seen as a key factor that acted as a tailwind for the dollar-denominated commodity. Apart from this, the cautious market mood further extended some support to the safe-haven precious metal.
Meanwhile, the latest leg of a sudden spike over the past hour or so could be attributed to a modest pullback in the US Treasury bond yields, which benefitted the non-yielding gold. In fact, the yield on the benchmark 10-year US government bond witnessed an intraday turnaround from the highest level since May amid moderation of Fed hike expectations. This week's dismal US macro releases – Industrial Production and housing market data – pointed to weakening economic activity and tempered market expectations for an early policy tightening by the Fed.
That said, worries that the recent widespread rally in commodity prices will stoke inflation might force the Fed to adopt a more aggressive policy response in 2022. This, in turn, might hold investors from placing aggressive bullish bets around gold and cap the upside, at least for the time being. In the absence of any major market-moving economic releases from the US, traders might take cues from a scheduled speech by Fed Governor Randal Quarles. This, along with the US bond yields, will influence the USD price dynamics and provide some impetus to the commodity. Apart from this, the broader market risk sentiment might provide some impetus to the XAU/USD.
Technical outlook
From a technical perspective, any subsequent positive move is likely to confront stiff resistance near the $1,800 level. The mentioned handle marks a confluence hurdle comprising technically significant 100/200-day SMAs and should act as a key pivotal point for short-term traders. A sustained breakthrough, leading to a subsequent strength beyond the $1,808-10 region, should pave the way for a move towards challenging the $1,832-.34 heavy supply zone.
On the flip side, immediate support is pegged near the $1,775 level, below which gold prices could slide back towards the $1,763-60 region. Some follow-through selling will negate any near-term positive bias and prompt some technical selling, exposing the $1,750 support zone. The downward trajectory has the potential to drag the XAU/USD further towards September monthly swing lows, around the $1723-21 area.
Gold daily chart
Levels to watch
Gold continues to see signs of recovery. In the view of Karen Jones, Team Head FICC Technical Analysis Research at Commerzbank, XAU/USD will need to regain the 200-day moving average at $1794 to confirm upside scope to the July highs.
XAU/USD looking for a deeper rally
“The bounce has yet to clear moving average resistance at $1794 and only above here will allow for a rally towards $1834.16/21, which are the highs since July and we look for rallies to struggle on moves to here. The 55-week ma also is found at $1815.
“We are relatively neutral but only a close above the $1845 2020-2021 resistance line would regenerate upside interest for a recovery to $1856/57 4th June low. Above here lies the $1917 May 2021 peak.”
“Below $1721, support is found at $1679.80/$1677.83 and is reinforced by the $1670 June 2020 low. Below $1670 would target the 2018-2021 uptrend at $1608.”
See – Gold Price Forecast: XAU/USD to suffer further weakness on a dip below $1691/77 – Credit Suisse
Economist Enrico Tanuwidjaja and Yari Mayaseti at UOB Group comment on the latest trade balance results in Indonesia.
Key Takeaways
“Indonesia’s trade surplus narrowed slightly to USD4.4bn in September vs. USD4.7bn in the previous month (albeit less than expectations of USD3.8bn), amidst slower pace of imports, notably for capital goods. Imports slowed to 40.3% y/y in September vs. 55.3% in August, vs. 50.0% forecast. Meanwhile, exports slowed to 47.6% y/y in September vs. 64.1% in the previous month, vs. market consensus of 51.6% due to the slower exports in manufacturing sector as well as lower exports in agriculture.”
“From January to September this year, Indonesia booked USD25.1bn of trade surplus which was significantly higher than the USD13.4bn surplus recorded over the same period last year. If the commodity prices remain high, exports could sustain their solid expansion to keep the trade surplus at an elevated level. This certainly will help to push the current account deficit (CAD) to a narrower position this year despite the rebound in imports (due to higher domestic demand) and higher primary income deficit. This should provide more support to Indonesia external resiliency. It also remains a possibility for Indonesia to even run current account surplus in the third quarter of 2021 (or even this year). Indonesia has been recording a trade surplus since May 2020 (17-month running and may continue so), and for 2021 to-date, a cumulative trade surplus of USD21.85bn already exceeded 2020 total trade surplus of USD21.74bn.”
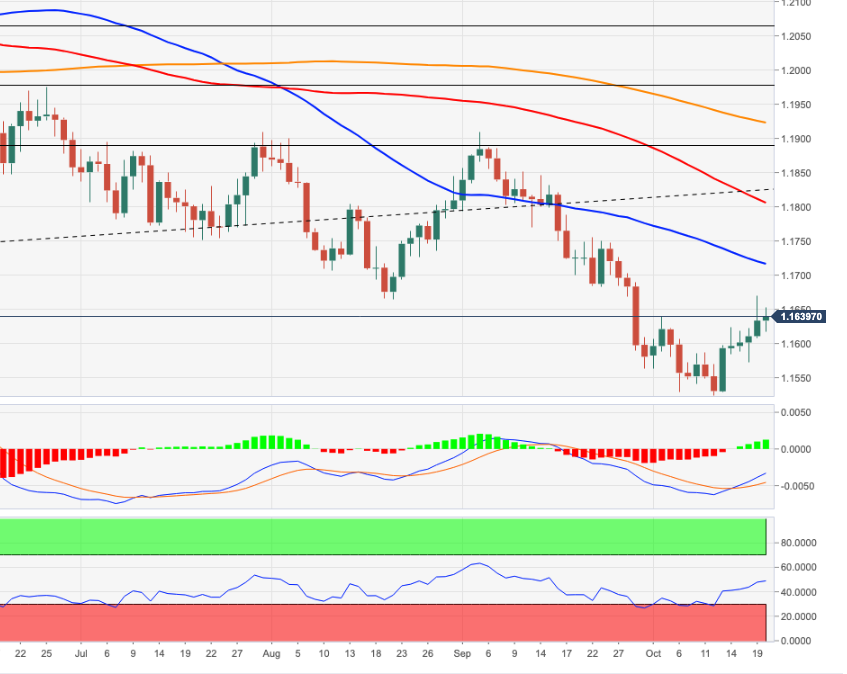
- EUR/USD keeps the bid bias unchanged above 1.1600.
- The 55-day SMA at 1.1715 comes next on the upside.
EUR/USD manages well to leave behind the initial pessimism and regains the upper hand near 1.1650 on Wednesday.
That said, the pair could now attempt to take out the round level at 1.1700 the figure ahead of the interim hurdle at the 55-day SMA, today at 1.1715. Further north comes the short-term resistance line around 1.1740. A breakout of the latter should see the selling pressure mitigated and therefore allow for extra gains to the next relevant resistance in the mid-1.1700s.
In the meantime, the near-term outlook for EUR/USD is seen on the negative side below the key 200-day SMA, today at 1.1921.
EUR/USD daily chart
- Inflation in Canada rose at a stronger pace than expected in September.
- USD/CAD stays in the negative territory around 1.2350.
Annual inflation in Canada, as measured by the Consumer Price Index (CPI), advanced to 4.4% in September from 4.1% in August, the data published by Statistics Canada revealed on Wednesday. This reading came in higher than the market expectation of 4.3%.
Moreover, the Bank of Canada's (BoC) Core CPI, which excludes volatile food and energy prices, rose to 3.7% in the same period, compared to analysts' estimate of 3.6%.
Market reaction
These readings don't seem to be having a significant impact on USD/CAD, which was last seen losing 0.1% on a daily basis at 1.2350.
- EUR/GBP staged a modest bounce after dropping to fresh 18-month lows earlier this Wednesday.
- Softer UK CPI weighed on the British pound and prompted a short-covering move around the cross.
- BoE rate hike expectations, the emergence of some selling around the common currency capped gains
The EUR/GBP cross edged higher through the mid-European session and climbed back above mid-0.8400s, refreshing daily tops in the last hour.
The cross quickly reversed an intraday dip to the 0.8420 region, or the lowest level since February 2020 and inched back closer to the top end of its weekly trading range. Softer-than-expected UK CPI print turned out to be one of the key factors behind the British pound's relative underperformance and prompted some short-covering around the EUR/GBP cross.
The UK Office for National Statistics reported that the headline CPI decelerated to 0.3% MoM in September as against expectations for a fall to 0.4% from 0.7% reported in the previous month. Adding to this, the yearly rate unexpectedly edged lower from 3.2% in August to 3.1% during the reported month, still well above the Bank of England's 2% target.
Investors, however, seem convinced that the decline will be temporary and expect that the BoE will increase interest rates from record lows as soon as November. Apart from this, the emergence of some selling around the shared currency – led by a modest pickup in the US dollar demand – should keep a lid on any meaningful gains for the EUR/GBP cross.
Hence, any subsequent positive move might still be seen as an opportunity for bearish traders and runs the risk of fizzling out rather quickly. This, in turn, makes it prudent to wait for a strong follow-through buying before confirming that the EUR/GBP cross has bottomed out in the near term and positioning for any meaningful recovery.
Technical levels to watch
Economists at ING think Sweden's Riksbank will push back against the market’s hawkish pricing and refrain from pencilling in any hike in November’s rate projections. EUR/SEK may edge below 10.00 in the very short-term but they see a high risk for upside correction in the pair later this year.
SEK may put off further gains to 2022
“Our view is that the market has rushed too quickly to price in a hawkish tilt by the Riksbank and we, therefore, think there is very little room for short-term rates to keep rising in Sweden.”
“We would not be surprised to see EUR/SEK edge below 10.00 before the RB November meeting, especially if the global market mood remains upbeat.”
“We expect markets will be forced to scale down their expectations on Riksbank’s tightening later this year, so we think EUR/SEK will correct higher towards the end of November.”
“EUR/SEK is seasonally weaker in December, so we could see EUR/SEK close the year slightly below the 10.00 mark.”
“As the Riksbank may instead start to provide hawkish hints in 2022 ahead of a 2023 rate hike – which is currently our base case – we expect EUR/SEK to enter a downward path in 2022, aiming towards the middle of the 9.50/10.00 range.”
Canada CPI Overview
Wednesday's economic docket highlights the release of the Canadian consumer inflation figures for September, scheduled later during the early North American session at 12:30 GMT. The headline CPI is expected to ease to 0.1% during the reported month from the 0.2% rise recorded in August. Meanwhile, the yearly rate is anticipated to come in at 4.3% in September, up from 4.1% previous.
More importantly, the Bank of Canada's Core CPI, which excludes volatile food and energy prices, is forecast to remain well above the upper target. The gauge is expected to have increased by 0.3% MoM and 3.6% on yearly basis, up from 0.2% and 3.5%, respectively, in the previous month.
How Could it Affect USD/CAD?
A stronger than expected print may put additional pressure on the BoC to continue rolling back its pandemic-era stimulus. This should provide a modest lift to the Canadian dollar and exert additional pressure on the already weaker USD/CAD pair. The market reaction, however, is likely to be limited amid a modest pullback in crude oil prices, which should act as a headwind for the commodity-linked loonie.
Conversely, a softer reading might be enough to force investors to lighten their bearish bets around the major amid the emergence of some buying around the US dollar. This, in turn, suggests that the path of least resistance for the pair is to the downside and any meaningful slide back towards the 1.2300 neighbourhood could be seen as a buying opportunity.
Key Notes
• USD/CAD hangs near multi-month lows, around mid-1.2300s ahead of Canadian CPI
• USD/CAD Analysis: Bears await a sustained break below descending channel support
• USD/CAD: Target lowered from 1.2450 to 1.2200 – Credit Suisse
About Canadian CPI
The Consumer Price Index (CPI) released by the Statistics Canada is a measure of price movements by the comparison between the retail prices of a representative shopping basket of goods and services. The purchase power of CAD is dragged down by inflation. The Bank of Canada aims at an inflation range (1%-3%). Generally speaking, a high reading is seen as anticipatory of a rate hike and is positive (or bullish) for the CAD.
USD/CHF has once again reversed higher into the close to hold above support at the rising 55-day average at 0.9214. Economists at Credit Suisse now look for a break above 0.9274 to confirm a floor is in place.
Further weakness is on the cards while below 0.9274
“With trend-following indicators all still generally pointing to the upside, with the 200-day average still rising and weekly MACD still outright bullish, we look for an eventual break above short.term resistance at 0.9274 to negate the recently highlighted top.”
“Above 0.9308/15 would then clear the way for a retest of 0.9349/70. Beyond here would still mark a very significant break higher, with little then seen in the way of meaningful resistance until the 0.9473 April high.”
“Whilst our core outlook stays bullish, we cannot rule out further corrective weakness whilst below 0.9274 and more important support if the market does manage to close below 0.9214 is at the 200-day average at 0.9139, which is expected to hold if reached.”
Silver has eroded its four-month downtrend and 55-day moving average and is expected to rally higher, according to Karen Jones, Team Head FICC Technical Analysis Research at Commerzbank.
XAG/USD looking for further gains
“Above the market is the $24.95 recent high, but resistance extends up to tougher resistance offered by the 200-day ma at $25.56 and $26.07, the August high. The market will need to regain this area to regenerate bullish impetus. Please note that the 55-week ma also lies at $25.30. We favour the topside but it may take several attempts to clear this band.”
“Initial support is $22.85, the 20th August low but the market is underpinned by its long term pivotal support at $21.87/17. These represent the September and November 2020 lows and also the July 2014 high and the 2016 high. These are considered to be a major band of support and we expect them to act as a floor for the market.”
- DXY trades within a volatile fashion in the 93.80 area.
- Immediately to the downside comes the monthly low at 93.50.
DXY remains unable to gather some serious upside traction and stays mired in the 93.80 zone midweek.
In case the selling impulse gathers further steam, the monthly low at 93.50 (October 19) should hold the initial test ahead of the 55-day SMA at 93.21. Further downside could well see the 93.00 neighbourhood (low September 23) re-visited in the not-so-distant future. Further south comes the 100-day SMA, today at 92.61.
Looking at the broader picture, the constructive stance on the index is seen unchanged above the 200-day SMA at 91.84.
DXY daily chart
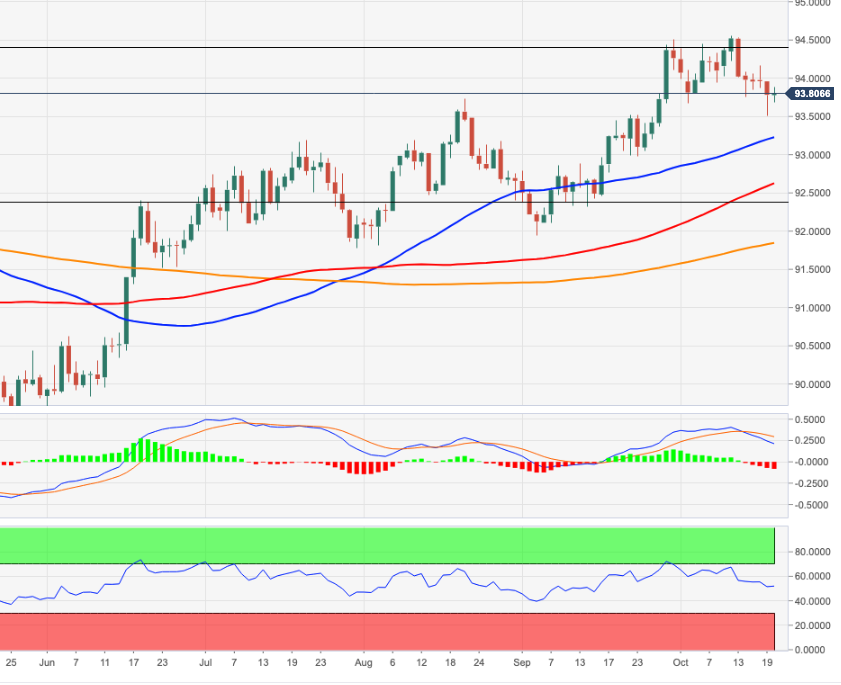
French government spokesman Gabriel Attal said on Wednesday that they could announce an update on possible sanctions against the UK over not respecting the Brexit deal and fishing arrangements by the end of the week, as reported by Reuters.
Market reaction
This headline doesn't seem to be having a noticeable impact on market sentiment. As of writing, the UK's FTSE 100 Index was virtually unchanged on the day at 7,222.
Meanwhile, the British pound is having a difficult time finding demand following the UK inflation report. Currently, the GBP/USD pair is down 0.25% on the day at 1.3760.
Economist at UOB Group Lee Sue Ann reviews the latest inflation figures in New Zealand.
Key Takeaways
“Consumer prices in New Zealand climbed 2.2% q/q in the third quarter, surpassing expectations for a gain of 1.5% q/q, and much higher than the 1.3% q/q print in the second quarter… Excluding quarters impacted by increases to GST rates, the September quarter movement was the highest since the June 1987 quarter, which saw a 3.3% q/q rise.”
“Compared to the same period a year ago, CPI advanced 4.9% y/y, the biggest annual movement since inflation reached 5.3% between the June 2010 and June 2011 quarters. Excluding periods impacted by changes to GST rates, the latest annual inflation reading was the highest since it reached 5.1% y/y in 3Q08. The spike was well above the consensus forecast of 4.2% y/y, and 0.8ppts higher than the Reserve Bank of New Zealand (RBNZ)’s forecast in its August Monetary Policy Statement.”
“Going forward, inflationary pressures will likely be supported by rising oil and food prices, construction costs, as well as the ongoing supply disruptions. That said, further out, when borders reopen, a rebound in labor supply will likely see a return of labor market slack. This will ease pressures on wages, while price pressures from global supply disruptions ease. We previously highlighted our cautious view as far as the pace of rate hikes is concerned.”
- Silver caught some fresh bids on Wednesday and inched back closer to multi-week tops.
- The set-up favours bullish traders and supports prospects for additional near-term gains.
- A sustained break below the $23.00 mark is needed to negate the constructive outlook.
Silver attracted some dip-buying on Wednesday and inched back closer to the $24.00 round-figure mark during the first half of the European session. This is closely followed by six-week tops, around the $24.10-15 region touched on Tuesday and the 38.2% Fibonacci level of the $28.75-$21.42 downfall.
Given the overnight sustained move beyond a downward-sloping trend-line extending from July monthly swing highs, the near-term bias remains tilted in favour of bullish traders. The positive outlook is reinforced by bullish technical indicators, which are still far from being in the overbought zone.
This comes on the back of the recent bullish breakout through an inverted head and shoulders neckline and supports prospects for additional gains. Hence, a subsequent strength beyond the $24.15-20 area, towards the next relevant hurdle around the $24.75-80 region, remains a distinct possibility.
The momentum could further get extended and allow the XAG/USD to aim back to reclaim the key $25.00 psychological mark. The latter nears the 50% Fibo. level, which if cleared decisively will be seen as a fresh trigger for bullish traders and pave the way for a further near-term appreciating move.
On the flip side, the descending trend-line resistance breakpoint, around the $23.60-55 region, now seems to protect the immediate downside ahead of the 23.6% Fibo. level, around the $23.20-15 area. This is followed by the $23.00 round-figure mark, which should act as a strong base for the XAG/USD.
A convincing break below will negate the near-term positive outlook, instead shift the bias in favour of bearish traders and prompt aggressive technical selling. Some follow-through weakness below the $22.75-70 region will reaffirm the negative bias and turn the XAG/USD vulnerable to slide further.
Silver daily chart
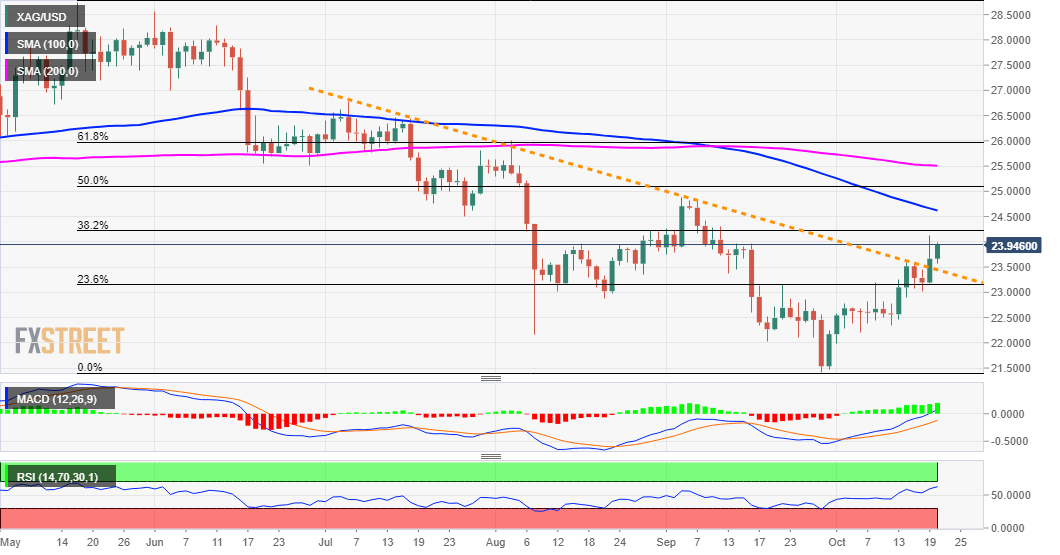
Technical levels to watch
- There is no respite for the strong rally in EUR/JPY for the time being.
- Bets are rising on a probable visit to the 2021 highs past 134.00 near term.
The intense move higher in EUR/JPY seems to have met some initial resistance around the 133.50 level so far on Wednesday.
The sharp move higher shows no signs of exhaustion so far, although the current overbought condition of the cross could trigger some consolidation or even a corrective move in the short-term horizon. Once digested one or the other, the cross should be able to resume the uptrend and attempt an assault to the YTD high at 134.12 recorded on June 1. Previously, there are minor hurdles at 133.68 (June 15) and 133.76 (June 10).
In the broader scenario, while above the 200-day SMA at 129.97, the outlook for the cross is expected to remain constructive.
EUR/JPY daily chart
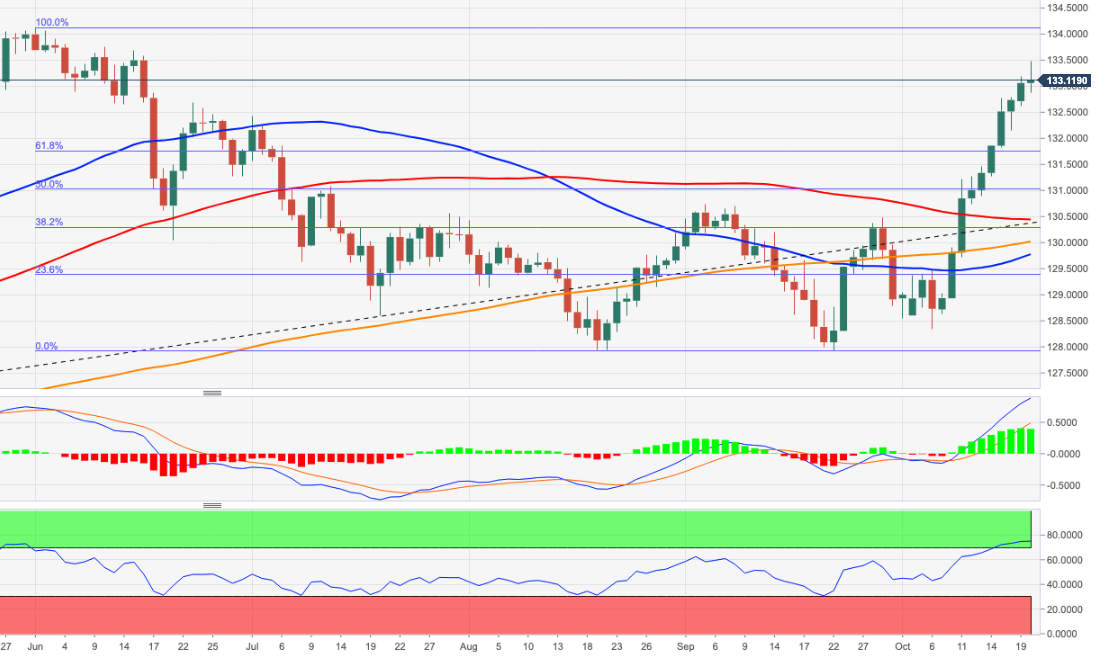
Economist at UOB Group Ho Woei Chen, CFA, assesses the latest GDP figures in the Chinese economy.
Key Takeaways
“China’s 3Q21 GDP growth slowed sharply to 4.9% (0.2% q/q SA) from 7.9% in 2Q21 and was marginally below consensus expectation (Bloomberg est: 5.0% y/y, 0.4% q/q SA; UOB est: 5.7% y/y, 0.9% q/q). The 3Q21 growth rate also matched the same period last year when the economy was recovering from the depth of its pandemic. Overall, the economy grew by 9.8% y/y in the first three quarters of 2021.”
“The September economic data that were released with the 3Q21 GDP showed that the energy crunch was having a larger than expected impact on industrial production while retail sales rebounded with the easing of COVID containment measures. The improvement in private consumption contributed to the recovery in labour market condition as the surveyed jobless rate fell to 4.9% in September from 5.1% in the two preceding months. Meanwhile, property investment continued to moderate as the funding stress at local property developers weighed.”
“The more challenging economic environment in 4Q21 including the energy crunch which is likely to worsen due to the colder weather, supply bottlenecks and the widening regulatory crackdown will further slow China’s growth. At the same time, China’s zero-COVID strategy and more contagious virus strains limit any potential upside surprise from private consumption. As such, we have revised down the outlook for China’s 4Q21 GDP growth to 3.5% with full-year GDP at 7.9% (from previous 2021 forecast of 8.6%).”
- A combination of factors assisted USD/CHF to gain some positive traction on Wednesday.
- Rallying US bond yields revived the USD demand and extended some support to the major.
- The dominant risk-on mood undermined the safe-haven CHF and contributed to the uptick.
- The lack of any strong follow-through buying warrants caution for aggressive bullish traders.
The USD/CHF pair traded with a mild positive bias through the first half of the European session and refreshed daily tops, around mid-0.9200s in the last hour, albeit lacked follow-through.
Following an early dip to the 0.9210 area, the USD/CHF pair caught some bids on Wednesday and moved further away from one-month lows, around the 0.9185 region touched in the previous day. The uptick was sponsored by a modest pickup in the US dollar demand and the dominant risk-on mood, which tends to undermine the safe-haven Swiss franc.
The USD drew some support from a further rise in the US Treasury bond yields, bolstered by the growing acceptance that the Fed will soon begin tapering its bond purchases. In fact, the yield on the benchmark 10-year US government bond shot to the highest level since May, around 1.672% on Wednesday and acted as a tailwind for the greenback.
Moreover, the markets also seem to have started pricing in the possibility of an interest rate hike in 2022 amid worries about a faster-than-expected rise in inflation. Despite hawkish Fed expectations, the USD uptick lacked bullish conviction and so far, has failed to assist the USD/CHF pair to capitalize on its modest intraday gains.
Looking at the broader picture, the USD/CHF pair has been oscillating in a familiar trading range over the past one week or so. This further makes it prudent to wait for a strong follow-through buying before confirming that the recent corrective pullback has run its course and positioning for any meaningful appreciating move.
In the absence of any major market-moving US economic releases, traders will take cues from scheduled speeches by Chicago Fed President Charles Evans and Fed Governor Randal Quarles. This, along with the US bond yields, will influence the USD. Apart from this, the broader market risk sentiment might provide some impetus to the USD/CHF pair.
Technical levels to watch
European Central Bank (ECB) policymaker Pierre Wunsch told WirtschaftsWoche magazine on Wednesday that he advocates for a gradual exit from the ECB's expansionary monetary policy, as reported by Reuters.
"Expansionary monetary policy has negative side effects that increase over time," Wunsch added and argued that it would be logical to end the Pandemic Emergency Purchase Programme (PEPP) given the current economic data.
Market reaction
These remarks don't seem to be having a noticeable impact on the common currency's performance against its major rivals. As of writing, the EUR/USD pair was trading at 1.1627, losing only 0.05% on a daily basis. Meanwhile, the EUR/GBP pair was up 0.25% at 0.8450.
- A combination of factors prompted some selling around GBP/USD on Wednesday.
- Softer UK CPI print weighed on the GBP amid a modest pickup in the USD demand.
- The set-up supports prospects for the emergence of some dip-buying at lower levels.
The GBP/USD pair dropped to fresh daily lows, around 1.3765-60 region during the early part of the European session and has now eroded a part of the overnight gains to one-month tops.
A combination of factors failed to assist the GBP/USD pair to capitalize on its modest intraday uptick on Wednesday, instead prompted some selling around the 1.3815 region. The British pound was weighed down by a softer-than-expected UK CPI print for September. Apart from this, a goodish pickup in the US dollar demand extended some downward pressure on the major.
Looking at the technical picture, the recent strong positive move from the vicinity of the 1.3400 mark stalled on Tuesday near the 1.3830-35 confluence hurdle. The mentioned region comprises the very important 200-day SMA and the top boundary of an upward sloping channel extending from late September, which should act as a pivotal point for short-term traders.
Meanwhile, technical indicators on the daily chart maintained their bullish bias and have also eased from the overbought territory on the 4-hour chart. The formation of an ascending channel, along with bullish oscillators support prospects for the emergence of dip-buying. This, in turn, should help limit any meaningful corrective pullback for the GBP/USD pair.
Hence, any subsequent slide might be seen as a buying opportunity around the 1.3760-50 horizontal support. This is followed by weekly swing lows, around the 1.3710-05 region, which should act as a strong base for the GBP/USD pair. A convincing break below might trigger some technical selling and expose the descending trend-channel support near mid-1.3600s.
On the flip side, the 1.3800 round-figure mark now seems to act as immediate resistance. Some follow-through buying has the potential to push the GBP/USD pair back towards the 200-DMA/ascending channel confluence hurdle, currently around the 1.3840-45 region. A sustained move beyond should pave the way for an extension of the recent appreciating move.
The GBP/USD pair might then aim back to reclaim the 1.3900 round-figure mark. The momentum could further get extended beyond the 1.3960-65 intermediate resistance, en-route the next major hurdle near the key 1.4000 psychological mark.
GBP/USD daily chart
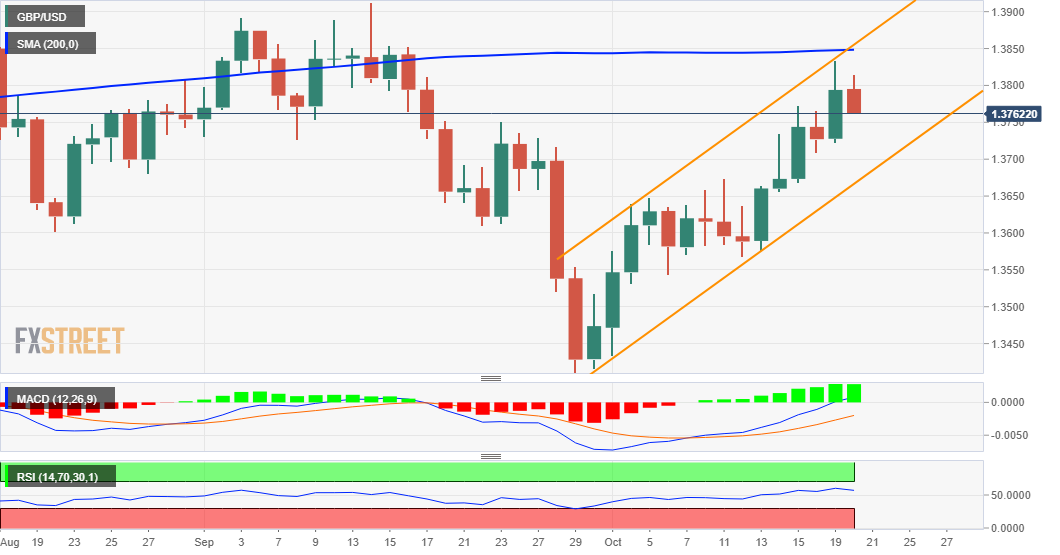
Technical levels to watch
Commenting on Bundesbank President Jens Weidmann's decision to resign at the end of the year, Christine Lagarde, President of the Europen Central Bank (ECB), said that she immensely regrets his resignation.
"Jens is a good personal friend on whose loyalty I could always count," Lagarde noted in a statement, per Reuters. "While Jens had clear views on monetary policy I was always impressed by his search for common ground in the Governing Council, by his empathy for his Eurosystem colleagues, and his willingness to find a compromise."
Market reaction
These comments don't seem to be having a significant impact on the shared currency's performance against its major rivals. As of writing, the EUR/USD pair was down 0.07% on the day at 1.1623.
USD/TRY has reached 9.35 achieving the target for recent rectangle breakout. Economists at Société Générale expect the pair to extend its advance towards 9.44, then 10.15.
Downside limited
“Signals of pullback are still not visible; 8.80 should now be an important support.”
“Next projections are located at 9.44 and 10.15.”
Gold extends its consolidation beneath the July and August highs at $1832/34. XAU/USD climbed above $1,780 on Tuesday but reversed its direction in the second half of the day. The yellow metal is set to come under pressure only below the $1691/77 region, strategists at Credit Suisse report.
Break above $1834/45 to clear the way for a deeper recovery to $1917
“Although downward pressure is seen increasing, only below $1691/77 would mark a major top for an important change of trend lower, with support then seen at $1620/15 initially, before $1565/60.”
“Only a break above $1834/45 would be seen to complete an in range base to clear the way for a deeper recovery to $1917.”
See – Gold Price Forecast: XAU/USD's bullish potential limited amid higher real yields – ANZ
- Gold price extends previous gains, with eyes again on the $1791 level.
- Gold bulls defy the uptick in the USD, as Treasury yields pare gains.
- Gold: Sellers defend $1,800, all eyes on US T-bond yields.
Gold price is holding the higher ground, extending the previous advance amid a pullback in the US 10-year Treasury yields from five-month highs of 1.672%. However, with the risk-off mood seeping back into the market, amid mixed European corporate earnings, the US dollar is finding its feet across the board, which could likely cap the upside in gold price. In absence of the first-tier US economic data, the broader market sentiment will continue to lead the way while investors will closely follow the price action in the yields and the dollar.
Read: Gold Price Forecast: XAU/USD’s bullish potential appears limited amid bear cross, firmer yields
Gold Price: Key levels to watch
According to the Technical Confluences Detector, gold eyes a smooth sail towards the Fibonacci 23.6% one-week at $1789.
However, a bunch of minor resistance levels stacked up around $1783 could challenge the bullish attempts. That zone is the confluence of the Fibonacci 38.2% one-week, pivot point one-day R1 and Fibonacci 23.6% one-day.
The crucial upside target at $1791 still remains on gold buyers’ radars. That level is the intersection of the Fibonacci 61.8% one-month and Bollinger Band one-hour Upper.
Sellers will then need to the defend $1795, which is the convergence of the SMA100 and 200 one-day.
On the flip side, strong support awaits at $1774, the point where the previous low four-hour coincides with the SMA10 four-hour.
The confluence of the SMA200 four-hour, Fibonacci 61.8% one-day and SMA50 four-hour at $1771 will be the level to beat for gold bears.
The next downside target is envisioned at the Fibonacci 38.2% one-month at $1766.
Here is how it looks on the tool
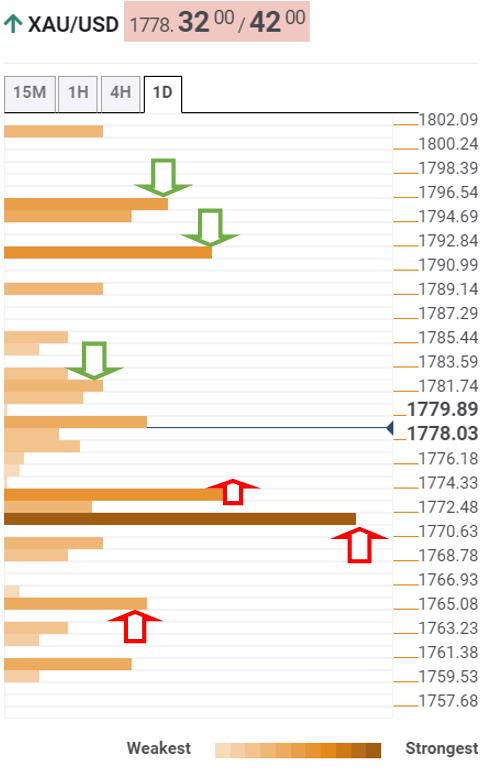
About Technical Confluences Detector
The TCD (Technical Confluences Detector) is a tool to locate and point out those price levels where there is a congestion of indicators, moving averages, Fibonacci levels, Pivot Points, etc. If you are a short-term trader, you will find entry points for counter-trend strategies and hunt a few points at a time. If you are a medium-to-long-term trader, this tool will allow you to know in advance the price levels where a medium-to-long-term trend may stop and rest, where to unwind positions, or where to increase your position size.
- Rising bets for an additional RBNZ rate hike move pushed NZD/USD to over four-month tops.
- Rallying US bond yields helped revive the USD demand and capped the upside for the major.
- Any meaningful corrective slide could be seen as a buying opportunity and remain limited.
The NZD/USD pair traded with a positive bias through the early part of the European session, albeit has retreated a few pips from over four-month tops touched earlier this Wednesday.
The pair built on the previous day's bullish breakout momentum beyond the very important 200-day SMA, around the 0.7100 mark and gained traction for the sixth successive day. The momentum pushed the NZD/USD pair to the highest level since June 11 and was sponsored by rising bets that the RBNZ will hike interest rates further to contain stubbornly high inflation.
The quarterly CPI report released earlier this week showed consumer prices in New Zealand rose 4.9% YoY, a decade-high speed during the July-September period. This comes amid the dominant risk-on mood in the markets, which further acted as a tailwind for the perceived riskier kiwi. That said, a combination of factors capped the upside for the NZD/USD pair.
The US dollar drew some support from the continuous surge in the US Treasury bond yields, bolstered by prospects for an early policy tightening by the Fed. In fact, the yield on the benchmark 10-year US government bond shot to the highest level since May, around 1.672% amid growing market acceptance that the Fed will soon begin rolling back its massive pandemic-era stimulus.
The markets also seem to have started pricing in the possibility of a potential interest rate hike in 2022 amid fears about a faster-than-expected rise in inflation. Adding to this, a generally cautious mood around the equity markets further benefitted the safe-haven greenback and collaborated to keep a lid on any further gains for the perceived riskier kiwi.
Investors also seemed reluctant to place fresh bullish bets around the NZD/USD pair amid overbought conditions on short-term charts and absent relevant market moving economic releases from the US. That said, scheduled speeches by Chicago Fed President Charles Evans and Fed Governor Randal Quarles might provide some impetus later during the North American session.
Traders will further take cues from the broader market risk sentiment to grab some short-term opportunities. Nevertheless, the bias remains tilted in favour of bullish traders and any meaningful pullback is more likely to remain limited, rather attract some dip-buying near the 0.7100 round-figure mark.
Technical levels to watch
USD/CNH remains under pressure and could attempt a test of the 6.3525 level in the next weeks, noted FX Strategists at UOB Group.
Key Quotes
24-hour view: “We highlighted yesterday that USD ‘could weaken to 6.4180 but it is left to be seen if it could maintain a foothold below this level’. We clearly did not anticipate the subsequent outsized sell-off that sent USD nosediving to a low of 6.3685. While the sell-off appears to be overdone, the weakness has not stabilized. In other words, USD could weaken further even though May’s low near 6.3525 could be just out of reach. Resistance is at 6.3900 followed by 6.4000.”
Next 1-3 weeks: “Last Thursday (14 Oct, spot at 6.4340), we highlighted that ‘downward momentum is beginning to build but USD has to close below 6.4240 before a sustained decline can be expected’. We added, ‘the chance for USD to close below 6.4240 is quite high’. USD subsequently probed 6.4240 a couple of times but did not close below this level. Yesterday (19 Oct), USD staged a sudden and sharp sell-off that sent it plunging by -0.82% (NY close of 6.3759), its largest 1-day drop since Dec 2019. While the outsized sell-off is overdone, there is scope for USD to drop to May’s low near 6.3525. Looking ahead, USD has to close below this support before further weakness can be expected. The downside risk is intact as long as USD does not move above the ‘strong resistance’ level at 6.4200.”
GBP/USD showed no immediate reaction to September inflation figures and continues to move sideways around 1.3800. The cable needs to surpass the 1.3910/30 region to extend its advance, economists at Société Générale report.
BoE hawks won’t drop call for higher rates after softer CPI
“A downtick in UK inflation to 3.1% in September from 3.2% in August is not the end of the upswing in prices and will therefore not deter sterling money markets from nailing down hawkish rate expectations for the BoE. The core rate slowed to 2.9% from 3.1%.”
“The GBP/USD pair is approaching potential hurdle of 1.3910/1.3930 representing the recent peak and the 61.8% retracement from June. Overcoming this resistance zone would be crucial for the next leg of rebound.”
“Failure to reclaim the 1.3910/1.3930 zone can lead to a short-term pullback. 1.3670 and last week's trough of 1.3570 are near term supports.”
- EUR/USD gives away part of the recent advance to 1.1670.
- The recovery in the dollar weighs on the pair midweek.
- Final September EMU CPI came in at 3.4% YoY, 0.5% MoM.
The single currency comes under some pressure and prompts EUR/USD to recede from recent tops and revisit the 1.1620/15 band on Wednesday.
EUR/USD looks to dollar, risk trends
EUR/USD now sheds some ground and reverses at the same time two consecutive daily advances, including new monthly peaks near 1.1670 recorded on Tuesday.
The greenback regains the smile and sparks the current knee-jerk in the risk-linked universe, lifting the US Dollar Index (DXY) back to the vicinity of the 94.00 barrier in response to the move higher in US yields.
On Tuesday, several ECB Board members defended the need for further accommodation in the region’s monetary conditions, while stressing the persistent slack in the economy, the low level of the core inflation and the little chance of a move on rates by the central bank during the next year.
In the domestic docket, the Current Account surplus shrank to €17.6B in August, while final inflation figures for the broader Euroland in September showed the headline CPI rising 0.5% MoM and 3.4% YoY, while the Core CPI rose 1.9%, all prints matching the preliminary readings.
Across the pond, the weekly MBA Mortgage Applications will be the only release ahead of the EIA’s report on crude oil inventories and the speech by FOMC’s R.Quarles.
What to look for around EUR
EUR/USD advanced further and clinched fresh October peaks near 1.1670 on Tuesday. While the improvement in the sentiment surrounding the risk complex lent extra wings to the par, price action is expected to keep looking to dollar dynamics for the time being, where tapering chatter remains well in centre stage. In the meantime, the idea that elevated inflation could last longer coupled with the loss of momentum in the economic recovery in the region, as per some weakness observed in key fundamentals, are seen pouring cold water over investors’ optimism as well as bullish attempts in the European currency.
Key events in the euro area this week: Final EMU CPI (Wednesday) – Preliminary PMIs in the euro zone (Friday).
Eminent issues on the back boiler: Asymmetric economic recovery post-pandemic in the region. Sustainability of the pick-up in inflation figures. Probable political effervescence around the EU Recovery Fund. Investors’ shift to European equities in the wake of the pandemic could lend extra oxygen to the euro. ECB tapering speculations.
EUR/USD levels to watch
So far, spot is losing 0.04% at 1.1627 and faces the next up barrier at 1.1669 (monthly high Oct.19) followed by 1.1714 (55-day SMA) and finally 1.1755 (weekly high Sep.22). On the other hand, a break below 1.1571 (low Oct.18) would target 1.1524 (2021 low Oct.12) en route to 1.1495 (high Mar.9 2020).
- Eurozone inflation arrives at 3.4% YoY in September.
- Monthly CPI in the bloc rises to 0.5% in September.
- EUR/USD remains unfazed below 1.1650 on the EZ data.
According to Eurostat’s final reading of the Eurozone CPI report for September, the consumer prices came in at 3.4% on a yearly basis, in line with the flash estimate of 3.4% and 3.4% expectations. While the core figures rose by 1.9%, matching the 1.9% consensus forecasts.
On a monthly basis, the bloc’s CPI figure for September arrived at 0.5% versus 0.5% expectations and 0.4% previous while the core CPI numbers came in at 0.5% versus 0.5% expected and 0.5% last.
Key details (via Eurostat):
“The lowest annual rates were registered in Malta (0.7%), Portugal (1.3%) and Greece (1.9%). The highest annual rates were recorded in Estonia, Lithuania (both 6.4%) and Poland (5.6%). Compared with August, annual inflation fell in one Member State, remained stable in one and rose in twenty-five.”
“In September, the highest contribution to the annual euro area inflation rate came from energy (+1.63 percentage points, pp), followed by services (+0.72 pp), non-energy industrial goods (+0.57 pp) and food, alcohol & tobacco (+0.44 pp).”
FX implications:
EUR/USD is trading under pressure below 1.1650 on the data release.
At the press time, the spot is trading 0.04% lower on the day at 1.1625.
Jens Weidmann, European Central Bank (ECB) Governing Council member and Bundesbank President, announced on Wednesday that he will be resigning from his position by the end of the year.
In a statement published on Bundesbank's website, "I have come to the conclusion that more than 10 years is a good measure of time to turn over a new leaf – for the Bundesbank, but also for me personally," Weidmann said.
Regarding the ECB's policy strategy, "a symmetrical, clearer inflation target has been agreed. Side effects and in particular financial stability risks are to be given greater attention. A targeted overshooting of the inflation rate was rejected," Weidmann noted and continued:
"In this context, it will be crucial not to look one-sidedly at deflationary risks, but not to lose sight of prospective inflationary dangers either."
Market reaction
The EUR/USD pair trade in the negative territory near 1.1620 following this development.
The upside momentum in USD/JPY could extend to the 115.00 level in the short-term horizon, commented FX Strategists at UOB Group.
Key Quotes
24-hour view: “Yesterday, we held the view that USD ‘could edge higher but the major resistance at 114.55 is unlikely to come into the picture’. USD subsequently rose to 114.39 before closing at 114.36 (+0.04%). While USD moved above 114.55 during early Asian hours, upward momentum is not that strong and the next major resistance at 115.00 is unlikely to come under threat (there is another resistance at 114.80). That said, only a break of 114.10 (minor support is at 114.30) would indicate that the current upward pressure has eased.”
Next 1-3 weeks: “We have maintained a strong USD view for 2 weeks now. In our latest narrative from Monday (18 Oct, spot at 114.20), we indicated that USD ‘is still strong but overbought conditions could lead to consolidation first’. We added, ‘the next resistance is at 114.55 followed by 115.00’. USD moved above 114.55 during early Asian hours and the focus now is at 115.00. That said, deeply overbought conditions suggest that the odds for a sustained advance above 115.00 are not high. The next major resistance at 115.60 is likely out of reach this time round. On the downside, a breach of 113.75 (‘strong support’ level previously at 113.50) would indicate that USD strength has come to an end.”
- Softer UK CPI report prompted some profit-taking around GBP/JPY on Wednesday.
- The recent widening of the UK-Japanese yield spread acted as a tailwind for the pair.
- BoE rate hike bets support prospects for the emergence of dip-buying at lower levels.
The GBP/JPY cross reversed an early European session dip to the 157.40 area and was last seen trading in the neutral territory, around the 157.70-65 region.
The British pound edged lower on Wednesday following the release of softer-than-expected UK consumer inflation figures, which, in turn, prompted some profit-taking around the GBP/JPY cross. The UK Office for National Statistics (ONS) reported that the headline CPI edged lower to 3.1% YoY rate in September as against 3.2% expected and previous.
Adding to this, the core inflation gauge (excluding volatile food and energy items) decelerated to 2.9% YoY last month from 3.1% reported in August, again falling short of consensus estimates. The data might have forced investors to trim their bets for an imminent rate hike by the Bank of England in November and acted as a headwind for the sterling.
The GBP/JPY cross retreated around 80 pips from the 158.20 region, or the highest level since June 2016, though lacked any follow-through and found a decent support near the 157.40 region. The recent widening of the UK-Japanese government bond yield differential continued weighing on the Japanese yen and helped limit any deeper pullback from the cross.
Moreover, investors still seem convinced about an imminent BoE rate hike in 2021. This was seen as another factor that extended some support to the GBP/JPY cross, though overbought conditions held traders from placing fresh bullish bets. Nevertheless, the bias remains tilted in favour of bulls and supports prospects for the emergence of some dip-buying at lower levels.
Technical levels to watch
Iraqi Oil Minister Ihsan Abdul-Jabbar Ismail said on Wednesday, he is expecting oil prices to reach $100/ barrel in the first half of 2022.
He added that “global oil inventories are at their lowest levels.”
Market reaction
WTI is unimpressed by the above comments, as it keeps its corrective stint intact below the $82 mark.
The US oil was last seen trading at $81.67, down 0.95% on a daily basis.
AUD/USD has briefly reclaimed the 0.75 handle. Economists at Société Générale expect the aussie to extend its steady rebound towards the 200-day moving average (DMA) around 0.7550/0.7580.
Support is seen at the 0.7300 level
“The AUD/USD pair is likely to head higher towards 200-DMA near 0.7550/0.7580.”
“Short-term support is at 0.7300.”
USD/JPY is moving sideways around 114.50 after the pair snapped back from 114.70. Economists at Société Générale expect the pair to edge higher towards the 115.50 level, then 117.80/118.60.
Signals of down move are still not visible
“Signals of a pullback are still not visible; 110.80 should cushion.”
“Next potential objectives are at 115.50 and 2016 high of 117.80/118.60.”
- USD/CAD lacked any firm directional bias and remained confined in a range on Wednesday.
- Rallying US bond yields revived the USD demand and extended some support to the major.
- A modest pullback in crude oil prices undermined the loonie ahead of the Canadian CPI report.
The USD/CAD pair now seems to have entered a bearish consolidation phase and was seen oscillating in a range, around mid-1.2300s through the early European session.
The pair struggled to capitalize on the previous day's late rebound from the vicinity of the 1.2300 mark, or over three-month lows and witnessed a subdued/range-bound price action on Wednesday. However, a combination of factors helped limit the downside for the USD/CAD pair, at least for the time being.
Crude oil prices edged lower after the Chinese government stepped up efforts to tame record high coal prices and ease a power shortage. The move triggered a selloff in Chinese coal and other commodities, which, in turn, prompted some profit-taking and pulled crude oil prices away from multi-year tops.
Retreating oil prices undermined the commodity-linked loonie, which, along with a goodish pickup in the US dollar demand, extended some support to the USD/CAD pair. The greenback drew some support from an extension of the recent strong move up in the US Treasury bond yields and a softer risk tone.
The US bond yields have been rally amid growing acceptance that the Fed will soon begin rolling back its massive pandemic-era stimulus. The markets also seem to have started pricing in the possibility of a potential interest rate hike in 2022 amid fears about a faster-than-expected rise in inflation.
The prospects for an early policy tightening by the Fed pushed the yield on the benchmark 10-year US government bond to the highest level since May, around 1.672% on Wednesday. This was seen as a key factor that helped revive the USD demand, though the uptick lacked any bullish conviction.
Wednesday's key highlight will be the release of Canadian consumer inflation figures, due later during the early North American session. Apart from this, oil price dynamics will influence the Canadian dollar and provide some impetus to the USD/CAD pair amid absent relevant economic data from the US.
Technical levels to watch
The September inflation data has just been released in the UK and so far there has been limited reaction to the weaker than expected print. Economists at MUFG Bank believe that a soft growth data is more likely to drag the pound down.
UK annual inflation comes in modestly weaker but still elevated
“The data, while a relief perhaps given the fears of late over surging inflation, might not dramatically change the thinking at the BoE. The overall annual inflation rate slowed from 3.0% to 2.9% in September. But the Q3 annual inflation reading has come in at 2.76%, close to but slightly above the BoE projection in August of 2.7%.”
“Even before this inflation release this morning we were arguing that the forward OIS market was indicating an excessive degree of monetary tightening priced into the markets. This leaves us with the view that the pound is vulnerable to some degree of correction to the downside, although perhaps not just yet.”
“A trigger for a GBP correction lower is more likely to materialise from evidence of weaker growth in the hard data.”
On Tuesday, USD/RUB fell to a fresh year-to-date low of 70.82 after convincingly falling through the previous low (71.55) seen in the middle of June. Economists at Credit Suisse stay constructive on the rouble and lower their short-term USD/RUB target to 68.00 (from 72.00 previously).
Rouble to continue to benefit from declining political risk, elevated carry and a positive terms-of-trade shock
“Now that USD/RUB has fallen convincingly below our previous short-term target of 72.00, we lower that short-term target to the low-end of our Q4 range – i.e. to 68.00. Our rationale remains that the rouble will continue to benefit from falling political risk and elevated carry. Additionally, the recent rally in oil prices is likely to result in strength in Russian macro data in the months to come.”
“Risks to our constructive views on the rouble come predominantly from the possibility of a major negative turn in the US/Russia relationship or a sharp drop in oil prices. Absent such developments we would recommend that investors sell USD/RUB on possible spikes back to the 73.00 area.”
“The central bank is widely expected to deliver another policy rate hike on Friday (22 October). Rates markets’ pricing for the outcome of this meeting has shifted from a policy rate hike of close to 25bps earlier this month to a hike of 40bps-50bps. The rouble does not tend to react much to policy rate decisions. We do not see a reason to expect the coming meeting to differ from the norm in this respect.”
AUD/USD continues to make a topside grind higher. Attention is on the 200-day moving average (DMA) 0.7567 and 0.7553, a price extension target, which are set to cap the aussie, according to Benjamin Wong, Strategist at DBS Bank.
Working along the calibration of the inverse head-and-shoulders pattern
“For the first time since mid-June, the aussie is marking time above 100-DMA 0.7407. That is a bullish signal of intent, but ultimately still requires validation of an ongoing bullish inverse head-and-shoulders pattern. The MACD signal is staying in its positive trench, supportive of this upside grind.”
“AUD/USD has sights at its 200-DMA of 0.7567. However, the price extension that targets 0.7509; 0.7553 suggests the up move from 0.7170 is likely to run out of tarmac before reaching out to 200-DMA of 0.7567. 0.7567, together with 0.7595 (weekly Ichimoku cloud fringe resistance) are likely to offer resistance of some determination.”
- DXY retakes the 93.80 region following recent tops.
- US yields regain upside traction with 10y USTs approaching 1.70%.
- MBA Mortgage Applications, Fed’s Quarles next on tap in the docket.
Following recent 3-week lows near 93.50, the US Dollar Index (DXY) manages to regain some traction and retake the 93.80/85 band on Wednesday.
US Dollar Index looks risk trends, yields
The index alternates gains with losses midweek and looks to leave behind the multi-session leg lower sparked soon after the dollar clinched new 2021 highs past 94.50 on October 12.
The ongoing rebound in the buck comes in response to higher US yields, as the 10-year reference note advance above 1.67% - levels last seen back in May - and yields of the 30-year note surpass the 2.10% level to record new multi-day peaks.
On Tuesday, FOMC Governor M.Bowman suggested that the elevated inflation could linger for longer, while her colleague C.Waller defended the start of the tapering process as soon as in November.
Later in the NA session, the usual weekly report by the MBA on Mortgage Applications will be the sole release in the calendar ahead of the EIA’s report and the speech by FOMC’s Governor R.Quarles (permanent voter, centrist).
What to look for around USD
The index seems to have met some decent contention in the mid-93.00s for the time being (October 19). The corrective move in the dollar came in response to the repricing of several central banks particularly in light of elevated inflation and the firm improvement in the risk complex. Supportive Fedspeak, an anticipated start of the tapering process, higher yields and the rising probability that high inflation could linger for longer remain as the exclusive factors behind the constructive outlook for the buck in the near-to-medium term.
Key events in the US this week: Claims, Philly Fed Index, CB Leading Index, Existing Home Sales (Thursday) – Flash Manufacturing PMI (Friday).
Eminent issues on the back boiler: Persistent uncertainty around Biden’s multi-billion Build Back Better plan. US-China trade conflict under the Biden’s administration. Tapering speculation vs. economic recovery. Debt ceiling debate. Geopolitical risks stemming from Afghanistan.
US Dollar Index relevant levels
Now, the index is gaining 0.07% at 93.85 and a break above 94.56 (2021 high Oct.12) would open the door to 94.74 (monthly high Sep.25 2020) and then 94.76 (200-week SMA). On the flip side, the next down barrier emerges at 93.50 (monthly low October 19) followed by 93.22 (55-day SMA) and finally 92.98 (weekly low Sep.23).
European Central Bank (ECB) Governing Council member Francois Villeroy de Galhau reiterated on Wednesday that the inflation spike in the euro area is expected to be temporary, per Reuters.
The ECB's monetary policy must be vigilant but they can also afford to stay patient, Villeroy further added.
Market reaction
The shared currency seems to be struggling to find demand in the early trading hours of the European session. As of writing, the EUR/USD pair was trading at 1.1620, losing 0.1% on a daily basis.
With the market now bullish on Indonesia, the main question for IDR is whether Bank Indonesia (BI) will limit IDR strength to 14,000 per dollar. Economists at Credit Suisse think downward momentum in USD/IDR should continue towards 13,600-13,700, though the pair could take some time to break 14,000 as markets test BI’s tolerance for FX strength.
BI will allow further rupiah appreciation, albeit gradually
“Now that the key USD/IDR level of 14,000 is fast approaching, there is a chance BI begins to accumulate USD reserves more aggressively and keeps USD/IDR stable near 14,000. However, we think the prospect of strong global demand for Indonesia’s exports, along with still-subdued domestic demand and low imports, suggest that IDR remains undervalued and that BI should allow further gradual rupiah appreciation.”
“The pre-covid low in USD/IDR was near 13,600-13,700 (in January-February 2020), when Indonesia’s trade balance was much weaker.”
“With trade and portfolio inflows now positive, we expect BI to resume FX reserve accumulation in ‘light’ amounts of $2-4 B per month. That could slow rupiah appreciation, but in our view, it is not yet clear BI aims to draw ‘red lines’ for USD/IDR at 14,000.”
“We think downward momentum in USD/IDR should continue, though the pair could take some time to break 14,000 as markets test the central bank’s tolerance for FX strength.”
- USD/JPY shot to fresh multi-year tops during the early part of the trading action on Wednesday.
- The risk-on mood, a further widening of the US-Japanese bond yields weighed the safe-haven JPY.
- A subdued USD demand kept a lid on any further gains amid near-term overbought conditions.
The USD/JPY pair consolidated its recent gains to multi-year tops and seesawed between tepid gains/minor losses through the early European session. The pair was last seen trading just below mid-114.00s, nearly unchanged for the day.
Following the previous day's goodish rebound from sub-114.00 levels, the USD/JPY pair gained some positive traction during the early part of the trading action on Wednesday. The prevalent risk-on mood continued undermining the safe-haven Japanese yen, which was further pressured by the widening of the US-Japanese government bond yield differential.
The US bond yields resumed their uptrend that has been underway since late September when the Fed signalled that it would begin tapering its monthly bond purchases by the end of 2021. Adding to this, worries that the recent widespread rally in commodity prices will stoke inflation have been fueling speculation about a potential rate hike in 2022.
The prospects for an early policy tightening by the Fed pushed the yield on the benchmark 10-year US government bond to the highest level since May, around 1.672% on Wednesday. On the other hand, the yield on the 10-year Japanese government bond remained near zero due to the Bank of Japan's yield curve control policy.
The fundamental backdrop remains tilted in favour of bullish traders, though extremely overstretched conditions on short-term charts held investors from positioning for any further appreciating move. Apart from this, a subdued US dollar demand was seen as another factor that contributed to the USD/JPY pair's range-bound price action.
In the absence of any major market-moving economic releases from the US, traders will take cues from scheduled speeches by Chicago Fed President Charles Evans and Fed Governor Randal Quarles. This, along with the US bond yields, will influence the USD price dynamics. Apart from this, the broader market risk sentiment might provide some impetus to the USD/JPY pair.
Technical levels to watch
Gold (XAU/USD) is facing pressure from higher real yields, as the US Federal Reserve gets closer to tapering its asset purchases. Furthermore, strong risk appetite is weighing on safe-haven investment, though retail investment remains strong, strategists at ANZ Bank report.
See – Gold Price Forecast: Further gains for XAU/USD may be limited – HSBC
Gold spot premium rising in India and China
“Higher real yields are capping gold’s upside. Downside risks to economic growth are increasing amid the ongoing power shortages, although risk appetite is holding up.”
“An appreciating US dollar is a headwind stirred up by the Fed’s tapering plans and the outlook for rates next year. An outperformance of US economic growth against other regions could lift the greenback.”
“ETF holdings of gold are declining. Even so, investors have added some long positions in recent weeks. Retail investment is showing encouraging signs, with US eagle gold coin sales rebounding by 32% YTD.”
“Physical demand is recovering in China and India, with spot premium rebounding for both countries.”
The GBP/JPY cross is basing out, reinforcing the case for further yen weakness. Economists at Credit Suisse expect the pair to grind higher towards the 163.91 mark.
Broken 156.62/06 highs to hold the downside
“GBP/JPY recently completed a near-term base above 152.86 and has subsequently surged higher, breaking above the 156.08/156.62 highs of 2018 and the previous 2021 high.”
“With a major base already established in February 2021, we look for a move to next resistance at 159.80, then 163.91.”
“The broken 156.62/06 highs should now floor the market over the medium-term.”
In opinion of FX Strategists at UOB Group, AUD/USD could attempt a test of 0.7500 as long as 0.7410 holds the downside.
Key Quotes
24-hour view: “While we expected AUD to advance yesterday, we were of the view that ‘the major resistance at 0.7450 is unlikely to come into the picture’. The manner by which AUD blew past 0.7450 and surged 0.7486 came as a surprise. Deeply overbought conditions coupled with early signs of slowing momentum suggest that AUD is unlikely to strengthen much further. For today, AUD is more likely to trade between 0.7440 and 0.7490.”
Next 1-3 weeks: “We have expected AUD to strengthen for more than a week. In our latest narrative from last Friday (13 Oct, spot at 0.7415), we indicated that AUD could consolidate for a couple of days first before heading towards 0.7450. Our view was correct even though we did not quite expect the ease by which AUD blew past 0.7450 yesterday (high of 0.7486). Deeply overbought shorter-term conditions could lead to 1 to 2 days of consolidation again but as long as 0.7410 is not breached (‘strong support’ level previously at 0.7350), AUD is likely to tackle the next major resistance at 0.7500 (next resistance is at 0.7530).”
NZD/USD retains upward momentum. A break above 0.7170 would open up the 0.7315 mark. Bigger picture, economists at Westpac expect the kiwi to hit the 0.7465 high by year-end.
RBNZ will lead NZ-US yield spreads higher
“A break above 0.7170 looking likely, in which case the next major target would be 0.7315.”
“Yield spreads have jumped in the NZD’s favour following strong inflation data, and NZD/USD appears well on track to reach the 0.7465 high, last seen in February, by year-end.”
“The economy remains on a solid footing and activity should jump once covid restrictions are relaxed (expected before December), the RBNZ will lead NZ-US yield spreads higher, and commodity prices retain a positive outlook.”
In Turkey, tomorrow’s central bank meeting is going to be particularly interesting following the recent sharp sell-off in the lira. Economists at Credit Suisse raise their short-term USD/TRY target to 9.60 from a range of 8.60-9.20.
USD/TRY downside limited to the 9.05 area even if the central bank surprises by staying on hold
“Although the inflation outlook has deteriorated, most investors and analysts expect a policy rate cut after last week’s dismissal of three MPC members.”
“We raise our short-term USD/TRY target to 9.60 from a range of 8.60-9.20 and we see USD/TRY downside limited to 9.05 even if the central bank surprises tomorrow and keeps the policy rate on hold.”
Supply chain disruption and elevated energy costs are weighing on euro area GDP. However, economists at ANZ Bank believe that the recovery is becoming more uneven rather than faltering. They expect the yield curve to steepen, which can lend the euro support.
Markets start to price change in ECB policy
“Against the current backdrop of uneven but firm growth, the market may continue to bring forward the timing of expected ECB rate rises.”
“We expect that above-trend growth will continue into 2023 and possibly beyond. The prospect of high investment in climate remediation and digital development also supports the view that growth could remain higher for longer.”
“We expect that the ECB will strongly resist calls for early interest rate rises and will be very patient before it shifts its guidance. We expect ECB President, Christine Lagarde, will reinforce that message at the 28 October monetary policy meeting and press conference.”
“We think that the yield curve will steepen as opposed to bear flatten. Such a development would also normally be associated with EUR appreciation. In fact, the ECB may view a modest appreciation in the currency as preferable to monetary policy adjustments. We continue to forecast moderate EUR appreciation versus USD.”
NZD/USD was the biggest gainer on Tuesday and it continues to edge higher on Wednesday. The kiwi is set to continue edging higher aided by a combination of USD weakness and its own credentials, economists at ANZ Bank report.
Inflation forecasts upgraded
“While the reaction seems delayed and had been haphazard, the sharp move higher in short-end interest rates looks to now be impacting. Yesterday we changed our OCR call; we now expect six more hikes – one at each meeting between now and August, taking the OCR to 2%.”
“Perhaps, more importantly, we have also lifted our inflation forecasts. In an environment of still well-anchored inflation expectations, that speaks to the RBNZ being ahead of the pack and cyclically higher rates, which should benefit the NZD.”
Monetary policy divergence between the euro area and Switzerland should continue to weigh on the EUR/CHF pair. Economists at Credit Suisse revise their EUR/CHF target from 1.0650 to 1.0500, as SNB FX intervention might be less aggressive going forward.
Further decline in euro area real yields should continue to weigh on EUR/CHF
“Real yields in the euro area should resume their downward trend, which could weigh on EUR/CHF.”
“We believe that the appreciation of the Swiss franc versus the euro will likely continue from here. Consequently, we lower our current target of 1.0650, which we narrowly missed last week, to 1.0500. We would consider ourselves wrong at levels above 1.0974.”
“The risk to our view would be a more aggressive SNB FX intervention policy instead of just smoothing the accelerating trend in the Swiss franc. Higher wage growth in the euro area, albeit not visible yet, is another risk factor as such a development could lead to a more hawkish ECB and higher yields in the euro area than in Switzerland.”
EUR/USD seems to have gone into a consolidation phase around 1.1650 on Wednesday. In the view of Karen Jones, Team Head FICC Technical Analysis Research at Commerzbank, the pair is set to see gains towards the four-month downtrend at 1.1741.
Attention is on the four-month downtrend at 1.1741
“EUR/USD is in recovery mode near-term. The intraday Elliott wave counts remain positive and we would allow for a deeper retracement to the 1.1741 four-month downtrend.”
“Dips lower are indicated to hold around 1.1600. Below 1.1522 (last week's low) lies the 50% retracement of the move from 2020 and the March 2020 high at 1.1492/95.”
“Key support is the previous downtrend (from 2008) which is now located at 1.1395.”
Following the release of the UK September CPI data, UK Business Secretary Kwasi Kwarteng said that he remains “confident that inflation will be contained.”
Key quotes
"I think it's a real cause of some concern because, clearly, we want inflation rates to be lower.”
"There's a debate at the moment as to how long this inflation will last, I'm confident that it'll be contained."
Related reads
- UK’s NHS: Number of COVID-19 cases in hospital seems to be rising
- UK CPI misses estimates with 3.1% YoY in September
USD/CAD has traded cleanly through the 1.2450 target that analysts at Credit Suisse set on 29 September. They now look for the pair to trade to 1.2200 in the next three months.
Loonie still attractive, at the right level
“We remain bullish CAD and now move our three-months target lower from 1.2450 to 1.2200. The core driver of our change in view is, unsurprisingly, the ongoing surge in energy prices, and the numerous ways in which it benefits the CAD outlook, beyond the simple export revenue math.”
“In USD/CAD, we would look to fade rallies to the 200-day moving average of 1.2510, with a 1.2200 target and a stop loss at 1.2650.”
USD/JPY is eroding the 114.55 2018 high. Nonetheless, Karen Jones, Team Head FICC Technical Analysis Research at Commerzbank, expects the pair to correct lower in the day ahead.
Bullish bias while above the uptrend at 113.02
“USD/JPY is starting to erode the 114.55 October 2018 high, but we have not yet closed above here and we have a number of warning signals intraday.”
“We would allow for a retracement towards 113.20/02 the short-term uptrend ahead of further strength.”
“Above 114.55 we have 115.60, the 61.8% retracement of the move down from 2015 and then the 117.06 the 1998-2021 resistance line.”
“The market stays bid above the accelerated uptrend at 113.02 and this guards 110.80 the mid-August high.”
The United Kingdom National Health Service (NHS) Chief Executive Officer Matthew Taylor warned Wednesday, the number of COVID-19 cases in the hospital seems to be rising.
Additional takeaways
“Intense pressure on health service is only going to get worse into winter.”
“Health service is right on the edge.”
“If pushed further, we will not be able to provide the level of service people need.”
Separately, UK Business Secretary Kwasi Kwarteng ruled out another winter lockdown.
Kwarteng said: "I would rule that out. Conversations about more restrictions on travel, more lockdowns are completely unhelpful."
Market reaction
Amidst weaker UK CPI inflation and covid resurgence, GBP/USD is falling back below 1.3800.
The spot was last seen trading at 1.3784, down 0.09% on a daily basis.
Here is what you need to know on Wednesday, October 20:
The greenback managed to erase a large portion of its losses on the back of recovering US Treasury bond yields on Tuesday but struggled to find demand against its risk-sensitive rivals with risk flows influencing the financial markets. The market mood seems to have turned cautious early Wednesday as investors await inflation data from the euro area and Canada. Later in the day, the Federal Reserve will release its Beige Book.
Macro data: The data from the US showed on Tuesday that Housing Starts and Building Permits declined by 1.6% and 7.7%, respectively, in September. On Wednesday, the People's Bank of China (PBoC) left its one-year prime rate unchanged at 3.85% as expected. The UK’s Office for National Statistics announced that the Consumer Price Index (CPI) edged lower to 3.1% on a yearly basis in September from 3.2% in August. Furthermore, the Core CPI declined to 2.9% in the same period, missing the market expectation of 3%.
The benchmark 10-year US Treasury bond yield pushed higher during the American trading hours and ended up gaining more than 2% on Tuesday. Currently, the 10-year yield is staying relatively calm around 1.65%, helping the dollar stay resilient against its rivals. In the meantime, the US Dollar Index, which touched a three-week low of 93.50, is fluctuating around 93.70.
Wall Street: The S&P 500 Index closed fifth straight trading day in the positive territory and reached its highest level since early September at 4,520. The Dow Jones Industrial Average rose 0.55% and the Nasdaq Composite advanced 0.7%. US stock index futures are posting modest losses in the early European session. After the closing bell, Tesla will release third-quarter earnings figures.
AUD/USD and NZD/USD were the biggest gainers on Tuesday and they continue to edge higher on Wednesday. A negative shift in risk sentiment could cause these pairs to stage a sharp correction.
EUR/USD rose to its highest level in a month at 1.1670 but dovish comments from European Central Bank officials made it difficult for it to preserve its bullish momentum. The pair seems to have gone into a consolidation phase around 1.1650 on Wednesday.
GBP/USD showed no immediate reaction to September inflation figures and continues to move sideways around 1.3800 as investors assess the probability of a Bank of England rate hike before the end of the year.
Gold climbed above $1,780 on Tuesday but reversed its direction in the second half of the day as it remains one of the most sensitive assets to fluctuations in US T-bond yields. On Wednesday, XAU/USD is staying afloat in the green above $1,770.
Cryptocurrencies: As the trading in the first Bitcoin ETF kicked off on Tuesday, BTC gained more than 3% and stays within a touching distance of all-time highs near $64,000 on Wednesday. Ethereum bulls are still waiting for the ETH to break above $4,000.
When commenting on the yen’s decline, Yoshihiko Isozaki, the Japanese Deputy Chief Cabinet Secretary, said on Wednesday, the exchange rate stability is important and, therefore, they will monitor currency movements carefully.
Key quotes
“Govt watching currency moves carefully.”
“Exchange rate stability is 'extremely important.
“Weak yen, rising energy costs, risk cooling consumption.”
Market reaction
USD/JPY was last seen trading at 114.50, up 0.14% on the day.
- EUR/GBP remains muted on Wednesday in the European session.
- The euro gains limited on dismal Eurozone data, dovish ECB.
- UK CPI data fails to trigger a meaningful action for EUR/GBP, EU CPI eyed.
The EUR/GBP cross-currency pair consolidates in a narrow trade band on Wednesday’s European session. At the time of writing, EUR/GBP is trading at 0.8437, up 0.06% for the day.
The single currency managed to gain a little traction against the British pound, following the UK’s inflation data. The UK’s Consumer Price Index (CPI) came in at 3.1% in September on yearly basis as compared to market expectations of 3.2%. The Producer Prices Index (PPI) came in at 5.9% in September slightly above the market forecast of 5.8%. EUR/GBP remains virtually unchanged on the mixed inflation data.
Investors accelerated their bets on the Bank of England (BOE) rate hikes in November and December respectively. The BOE has forecasted that Britain’s inflation rate will go over 4%, more than double its target.
The European Central Bank’s (ECB) members maintained their dovish stance on inflation and interest rate hikes. ECB Governing Council Member Olli Rehn said that the current inflation is being transitory as there was enough evidence in support of his comments. The core inflation remained subdued.
As for now, traders are waiting for the ECB’s members' speeches, Eurozone Consumer Price Index (CPI) to gauge market sentiment data.
EUR/GBP technical levels to consider
Gold price snapped a two-day downtrend on Tuesday and rallied as high as $1785 before reversing sharply to finish the day with moderate gains at $1769. In the view of FXStreet’s Dhwani Mehta, XAU/USD’s bullish potential appears limited amid bear cross and firmer yields.
See – Gold Price Forecast: Further gains for XAU/USD may be limited – HSBC
Bullish potential appears limited in gold amid a bear cross on the daily sticks
“It remains to be seen if the yellow metal manages to extend the recent gains, as the rally in the global yields will likely continue amid hawkish expectations from the key central banks, including the Fed and the BoE.”
“The 14-day Relative Strength Index (RSI) is trading flattish above the midline, backing the renewed upside. However, the bear cross confirmed on the daily sticks on Tuesday warrants caution for gold bulls. The 100-DMA cut the 200-DMA from above flagging a bearish signal.”
“XAU/USD is likely to face resistance once again at the horizontal 50-DMA at $1779. A sustained move above the latter could call for a retest of the 100 and 200-DMAs confluence zone at $1794. A sustained break above the latter could expose the $1800 round number.”
“Only a daily closing below the 21-DMA at $1761 support will negate the recent upbeat tone. If the latter yields in, then the previous week’s support area around $1750-$1745 would be challenged. The multi-week lows of $1722 could be tested should the downside momentum pick up pace.”
- WTI picks up bids to consolidation early Asian losses.
- Downbeat Momentum line, two-week-old previous support line probe buyers.
- Bears need to conquer horizontal area from October 11 for fresh entry.
WTI licks its wounds near $82.00, down 0.50% intraday amid Wednesday’s initial European session. In doing so, the oil benchmark holds onto the early Asian rebound from 100-HMA.
However, descending Momentum line and weekly resistance line, not to forget the previous support line from October 07, respectively near $82.80 and $83.45, will challenge the oil buyers.
In a case where WTI bulls dominate past $83.45, late 2012 lows near $84.10 will be in focus.
Meanwhile, a downside break of the 100-HMA near $81.70 will aim for the short-term horizontal support line near $81.15.
During the quote’s weakness past $81.15, an October 13 low of $78.84 could lure the short-term oil bears.
Overall, WTI remains in the bullish trajectory but immediate pullback can’t be ruled out.
WTI: Hourly chart
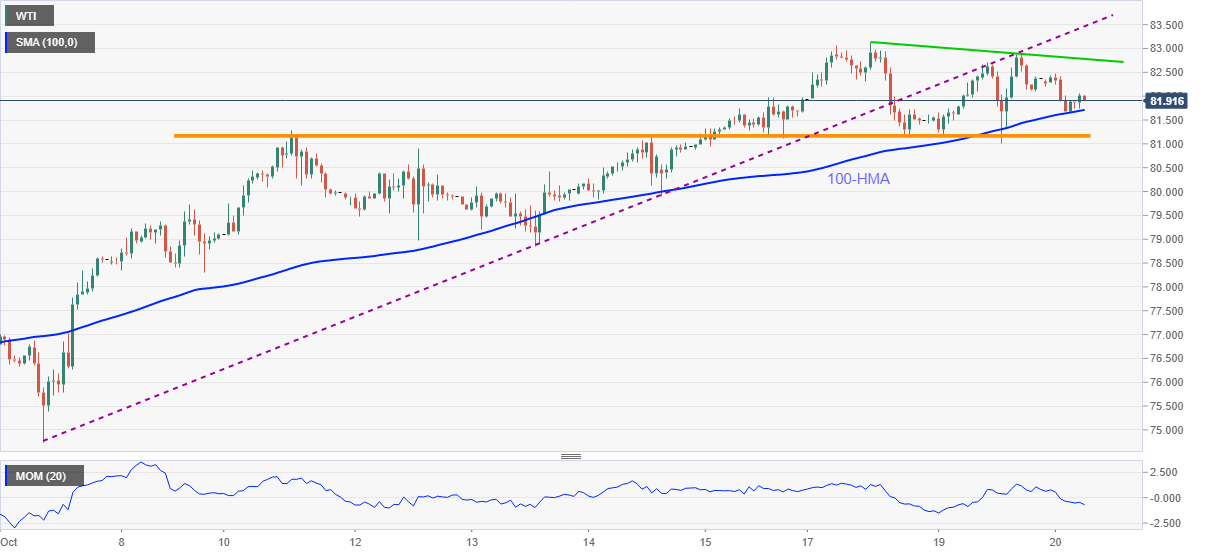
Trend: Further recovery expected
- UK CPI rises by 3.1% YoY in September vs. +3.2% expected.
- Monthly UK CPI arrives at 0.3% in September vs. +0.4% expected.
- GBP/USD holds steady around 1.3800 on downbeat UK CPIs.
The UK Consumer Prices Index (CPI) 12-month rate came in at +3.1% in September when compared to +3.2% recorded in August while missing expectations of a +3.2% print, the UK Office for National Statistics (ONS) reported on Wednesday.
Meanwhile, the core inflation gauge (excluding volatile food and energy items) fell to 2.9% YoY last month versus 3.1% registered in August, falling short of the consensus forecast of 3.0%.
The monthly figures showed that the UK consumer prices arrived at 0.3% in September vs. 0.4% expectations and 0.7% prior.
Main points (via ONS):
The largest upward contribution to the September 2021 CPIH 12-month inflation rate came from transport (0.91 percentage points).
Restaurants and hotels made the largest downward contribution to the change in the CPIH.
FX implications:
In an initial reaction to the downbeat UK CPI numbers, the GBP/USD pair eased a few pips below 1.3800.
The spot was last seen trading at 1.3802, up 0.05% on the day.
- Palladium consolidates the heaviest daily gains in six weeks.
- Bullish MACD signals, fortnight-old support line keeps buyers hopeful.
Palladium (XPD/USD) keeps pullback from 200-EMA near intraday low surrounding $2,075, down 0.25% on a day as European traders brace for Wednesday’s bell.
Although the key moving average challenges XPD/USD buyers, bullish MACD signals and the commodity’s ability to defend an ascending support line from October 06, near the $2,000 threshold, challenge the commodity sellers.
Hence, palladium buyers remain hopeful of overcoming the immediate EMA hurdle near $2,085.
Following that, $2,100 and October 10 peak close to $2,160 may entertain the commodity bulls ahead of the monthly high near $2,180.
Alternatively, a downside break of $2,000 may take a breather around 61.8% Fibonacci retracement of October 06-14 upside, near $1,975, before directing the XPD/USD bears towards September’s low near $1,848, also the lowest since June 2020.
XPD/USD: Four-hour chart
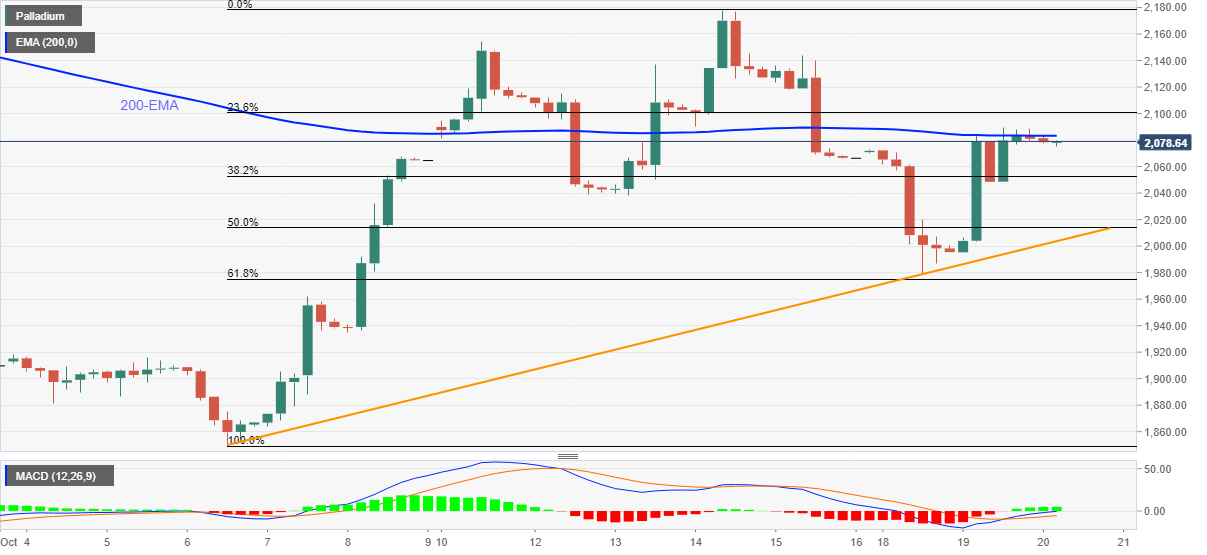
Trend: Further recovery expected
Open interest in natural gas dropped for the third session in a row on Tuesday, this time by nearly 4K contracts, as per advanced figures from CME Group. In the same direction, volume went down for the second straight session, now by almost 60K contracts.
Natural Gas looks supported around $4.70
Natural gas prices managed to partially reverse the recent downtrend on Tuesday. The daily advance, however, was amidst diminishing open interest and volume, supporting the view that extra pullbacks remain on the cards in the very near term. Against that, the $4.70 area emerges as the next contention area.
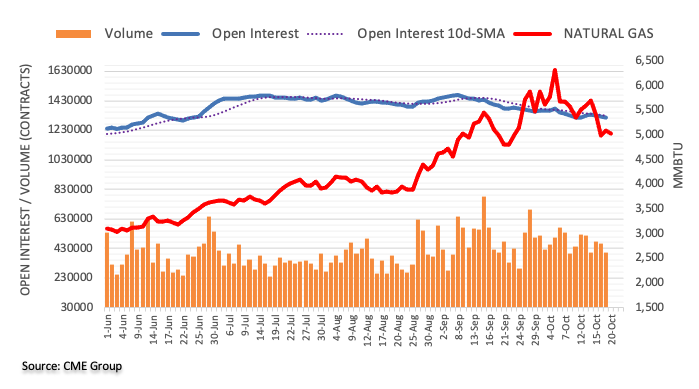
FX option expiries for October 20 NY cut at 10:00 Eastern Time, via DTCC, can be found below.
- EUR/USD: EUR amounts
- 1.1595-00 883m
- 1.1695 570m
- 1.1775 975m
- GBP/USD: GBP amounts
- 1.3425 596m
- 1.3550 605m
- 1.3575 583m
- USD/JPY: USD amounts
- 113.70 490m
- USD/CHF: USD amounts
- 0.9320 600m
- AUD/USD: AUD amounts
- 0.7300 506m
- 0.7600 330m
- USD/CAD: USD amounts
- 1.2300 838m
- 1.2400 450m
CME Group’s flash data for crude oil futures markets noted traders trimmed their open interest positions for the second session in a row on Tuesday, this time by around 23.5K contracts. Volume followed suit and shrank by nearly 29K contracts.
WTI looks capped by $84.00 so far
Prices of the barrel of WTI charted an inconclusive session on Tuesday, closing the day with marginal gains. The move was accompanied by shrinking open interest and volume and allows for further side-lined price action in the very near term. In the meantime, the upside in the commodity faces decent hurdle around the $84.00 mark per barrel for the time being.
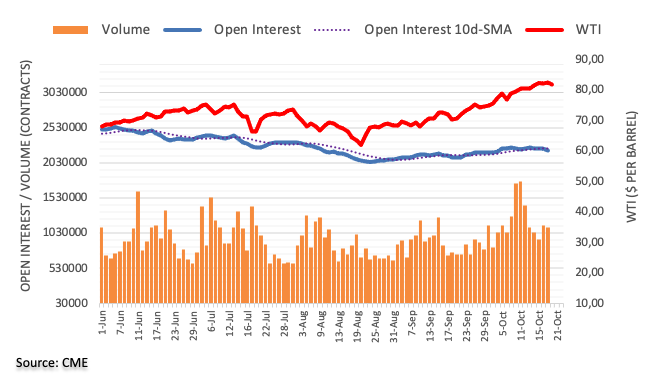
- USD/TRY fades pullback from record top, sidelined around intraday low of late.
- Fears of Turkey being grey-listed by global financial watchdog test pair bears.
- US Treasury yields retreat from multi-day high, extending US dollar weakness.
- Fedspeak can entertain traders ahead of Thursday’s CBRT Interest Rate Decision.
USD/TRY remains pressured around intraday low of $9.2899, seesaws of late ahead of Wednesday’s European session. In doing so, the Turkish Lira (TRY) pair struggles to justify the US dollar weakness, as well as negative headlines concerning Turkey.
The Financial Times (FT) came out with the news suggesting that Turkey should be subject to special monitoring by the taskforce’s International Co-operation Review Group — a process known as “greylisting” — joining 22 other states including Albania, Morocco, Syria, South Sudan and Yemen. The news relies on two western officials to highlight the likely Financial Action Task Force (FATF) actions.
“A greylisting could strike a further blow at a time when the Turkish lira, which has lost about 20 percent of its value against the dollar this year, has hit a succession of record lows and could fall further on Thursday if, as markets expect, the country’s central bank cuts its benchmark interest rate again,” adds FT.
On the other hand, the US Dollar Index (DXY) remains heavy near the three-week low surrounding 93.70 at the latest. The greenback gauge prints a six-day downtrend while ignoring firmer Treasury yields amid hopes of further stimulus and sluggish session.
It’s worth noting that the hopes of US virus-led aid package battle Fed tapering woes as Fed Governor Christopher Waller backed hopes of monetary policy consolidation in his latest comments.
Against this backdrop, US stock futures drop 0.10% intraday whereas the US 10-year Treasury yields step back from the highest since late May while printing 1.8 basis points (bps) of an upside to 1.652% by the press time.
Looking forward, comments from various Fed policymakers may entertain USD/TRY traders ahead of Thursday’s CBRT rate decision. Market forecasts favor a 0.25% cut into the benchmark interest rates.
Technical analysis
An eight-day-old ascending trend line near $9.2635 acts as immediate support for USD/TRY traders to watch during the pullback moves. However, the pair sellers remain unconvinced until the quote stays beyond an ascending support line from August 11, near $9.0350.
- Asian stocks pull up the sleeves on Wednesday tracking higher Wall Street.
- Higher corporate earnings, rising energy prices, and supply chain constraints book traders' diaries.
- IMF downgrades’ Asia pacific economic forecast, comments on Evergranda’s risk soothes investor nerves.
Asian stocks edge mostly higher on Wednesday, following the positive cues from the overnight gains on Wall Street as traders rejoice higher US corporate earnings. However, investors remain concerned about weaker global growth recovery amid supply chain disruptions.
Meanwhile, the International Monetary Fund (IMF) slashed its Asia-Pacific growth outlook for 2021 and warned that supply chain bottlenecks, inflationary pressures amid higher energy prices pose downside risks. Nevertheless, it raised the economic growth outlook for 2022.
MSCI’s broadest index of Asia-Pacific shares outside Japan gained 0.03%.
The Shanghai Composite Index is trading down 0.3%, following a downward revision by the International Monetary Fund (IMF) for China’s 2021 Gross Domestic Product (GDP) to 8% from 8.4% as recovery remained uneven.
The Nikkei 225 index gained 0.7%, tracking better-than-expected export data.
The ASX 200 traded higher 0.7% on Wednesday, Hang Seng hitting a 5-week high at 26,109.
The US Treasury yields rise higher at 1.65% with more than 1% gains.
Cable’s performance remains solid and a test of 1.3850 remains on the table in the next weeks, suggested FX Strategists at UOB Group.
Key Quotes
24-hour view: “Yesterday, we highlighted that ‘GBP could edge higher but it is unlikely to break the resistance at 1.3770’. We did not anticipate the surge in momentum that sent GBP soaring to 1.3834. The sharp and rapid advance appears to be overdone and GBP is unlikely to strengthen further. For today, GBP is more likely to trade sideways at these higher levels, expected to be within a 1.3765/1.3830 range.”
Next 1-3 weeks: “We have expected GBP to move higher since late last week. On Monday (18 Oct, spot at 1.3765), we highlighted that GBP ‘is likely to advance further to 1.3800’. We added, ‘further extension to 1.3850 is not ruled out but the odds are not high for now’. Our view was not wrong even though we did not quite expect the ease by which GBP took out 1.3800 (GBP rose to 1.3834 during London hours yesterday). GBP strength is still intact and as long as it does not breach 1.3720 (‘strong support’ level previously at 1.3665), an advance to 1.3850 would not be surprising. Looking ahead, the next resistance above 1.3850 is at 1.3915.”
Considering preliminary readings from CME Group for gold futures markets, open interest reversed two consecutive daily pullbacks and rose by around 1.5K contracts on Tuesday. In the same line, volume went up by around 10.6K contracts, extending the recent erratic performance.
Gold re-focuses on $1,800
Tuesday’s recovery in prices of the yellow metal was amidst rising open interest and volume, indicative that further upside appears likely in the very near term at least. That said, gold could start a gradual approach to the key resistance in the $1,800 mark per ounce troy.
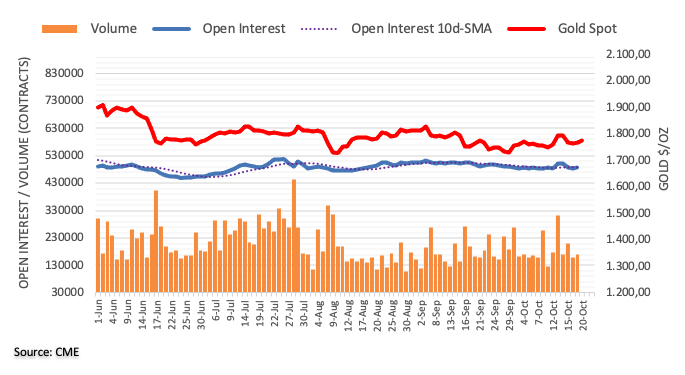
- USD/INR refreshes intraday low, extends previous day’s losses.
- Indian FinMin Sitharaman eyes double-digit GDP growth for FY 2022.
- India prints biggest single fall in active coronavirus cases since March.
- US dollar remains weak amid sluggish markets, Fedspeak eyed for fresh impulse.
USD/INR stays offered around an intraday low of 75.05, down 0.07% on a day as European traders prepare for Wednesday’s bell. In doing so, the Indian rupee (INR) pair drops for the second consecutive day as positive headlines concerning India join the softer US dollar.
Among the key positives were comments from Indian Finance Minister (FinMin) Nirmala Sitharaman. The Union Finance Minister was quoted by the Mint as saying, “The country is looking at near close to double-digit growth this year and India will be one of the fastest-growing economies.” The news shared by Reuters also states that Indian FinMin Sitharaman stressed, “In 2022, the economic growth will be in the range of 7.5-8.5%, which will be sustained for the next decade.”
On a different page, India’s active COVID-19 cases drop the most since March 5 while flashing 178,098 level per Reuters. However, the daily rise in coronavirus infections rose from 13,058 reported yesterday to 14,623, per the news.
Alternatively, the US Dollar Index (DXY) fades rebound from a three-week low, flashed on Tuesday, by dropping back to 93.70 at the latest. The greenback gauge prints a six-day downtrend while ignoring firmer Treasury yields amid hopes of further stimulus and sluggish session.
That being said, the US 10-year Treasury yields step back from the highest since late May while printing 1.8 basis points (bps) of an upside to 1.652% by the press time.
Looking forward, USD/INR traders will pay close attention to the Fedspeak during a light calendar ahead of Friday’s preliminary activity numbers for October.
Technical analysis
A one-week-old bullish triangle formation keeps USD/INR buyers hopeful until the quote stays beyond 74.88. However, an upside clearance of 75.25 becomes necessary for the bulls to retake controls.
According to FX Strategists at UOB Group, EUR/USD could attempt some consolidation ahead of a probable move to 1.1680.
Key Quotes
24-hour view: “We highlighted yesterday that ‘the bias is on the upside but EUR is unlikely to break the major resistance at 1.1640’. While our view for a higher EUR was correct, we did not anticipate the strong advance that sent EUR to a high of 1.1669. The rapid pullback from the high coupled with overbought conditions indicates that EUR is unlikely to strengthen further. For today, EUR is more likely to trade sideways between 1.1605 and 1.1655.”
Next 1-3 weeks: “We have held the same view since last Thursday (14 Oct, spot at 1.1595) where EUR ‘is likely trade with an upward bias towards 1.1640’. Our view was correct as EUR easily took out 1.1640 as it rose to 1.1669 yesterday (19 Oct). Upward momentum has improved, albeit not by all that much. From here, overbought shorter-term conditions could lead to 1 to 2 days of consolidation first but as long as 1.1570 (‘strong support’ level previously at 1.1540) is not breached; EUR is likely to head to the next major resistance at 1.1680 later on. Looking ahead, the next resistance above 1.1680 is at 1.1710.”
- EUR/USD remains on the front foot at three-week high.
- DXY drops for sixth day despite firmer US Treasury yields.
- EU CPI, Fed/ECB policymakers’ comments eyed for fresh impulse.
EUR/USD stays firmer around 1.1650, up 0.11% intraday heading into Wednesday’s European session. The major currency pair jumped to the highest level since late September the previous day before easing from 1.1669.
In doing so, the quote failed to cross a downward sloping trend line, previous support, from March 31. However, the bulls keep the reins amid the softer US dollar amid a quiet session in Asia.
US Dollar Index (DXY) fades rebound from a three-week low, flashed on Tuesday, by dropping back to 93.70 at the latest. The greenback gauge prints a six-day downtrend while ignoring firmer Treasury yields. That being said, the US 10-year Treasury yields step back from the highest since late May while printing 1.8 basis points (bps) of an upside to 1.652% by the press time.
While comments from the European Central Bank (ECB) chief economist Philip Lane could be linked to the EUR/USD pair’s pullback from the multi-day high the previous day, Fed Governor Christopher Waller renewed tapering concerns but couldn’t recall DXY bulls. The same help the currency pair bears to remain hopeful.
ECB’s Lane said, t is challenging to reconcile the market rate pricing with forward guidance, as reported by Reuters. On the other hand, Fed’s Waller mentioned, “If inflation keeps rising at its current pace in coming months rather than subsiding as expected, Federal Reserve policymakers may need to adopt ‘a more aggressive policy response’ next year.” Additionally, Reuters’ latest poll of economists cites the risk of an earlier rate hike by spotting the reflation fears. It should be noted that the downbeat US housing data and worsening of the construction activity in the Eurozone challenge the rate hike concerns.
Even so, concerns over the US stimulus being nearby and hopes of overcoming the China-linked fears seem to underpin the risk-on mood, weighing on the US dollar’s safe-haven demand.
That said, the final reading of the Eurozone Consumer Price Index (CPI) for September, expected to rise from 0.4% to 0.5%, will join Germany’s Producer Price Index (PPI) for the stated month, likely rising to 12.7% from 12.0% prior, to direct immediate EUR/USD moves. However, major attention will be given to the comments from the ECB and the Fed officials’ statements, lined up for release during the day.
Technical analysis
A daily closing beyond the support-turned-resistance line from March 31, around 1.1650, becomes necessary for the EUR/USD bulls to aim for a 50-DMA level surrounding 1.1715. Failures to do so can drag the quote back to the 21-DMA level of 1.1617.
- USD/CAD edges lower on Wednesday in the early European session.
- The formation of multiple doji candlesticks mark indecisiveness among traders.
- Momentum oscillator approaches the oversold zone, warns caution for aggressive bids.
USD/CAD remains on the backfoot in the middle of the week. After testing the low near 1.2311, the pair managed to bounce above 1.2340 amid downside risk. At the time of writing, USD/CAD is trading at 1.2343, down 0.11% for the day.
USD/CAD daily chart
-637703004472397096.png)
On the daily chart, after testing the high of 1.2896 on September 20, the USD/CAD pair came under selling pressure. The selling pressure intensified once it broke below the 21-day Simple Moving Average (SMA) at 1.2680.
A daily close below the session’s low would open gates for the 1.2300 horizontal support level followed by the low made on June 17 at 1.2262. The receding Moving Average Convergence Divergence (MACD) would prompt the USD/CAD bears to take out the 1.2200 horizontal support level.
Alternatively, on the higher side the first target appears to be the 1.2400 horizontal resistance level and then march toward the high made on October, 14 at 1.2445. Next, the market participant would keep their eyes on the 1.2500 horizontal resistance level.
USD/CAD additional levels
China’s Vice Commerce Minister Wang Bingnan said on Wednesday, his government will push for more measures to promote the consumption recovery.
Wang added that “it requires greater efforts to maintain the steady recovery in consumption.”
Market reaction
The Chinese yuan fails to react to these comments, as USD/CNY remains deep in the red around 6.3820, as of writing. The spot is losing 0.72% so far.
- USD/CNH bounces off 19-week low as PBOC holds Interest Rate intact for 18 months
- Gold refreshes intraday high during a two-day rebound from 21-DMA.
- Treasury yields await fresh clues after refreshing five-month top.
- Fed tapering concerns, China fears stay on table amid quiet session.
- Gold Price Forecast: Bulls side-lined as sentiment leads
Gold (XAU/USD) takes the bids to renew intraday high near $1,775, up 0.30% on a day ahead of Wednesday’s European session. The yellow metal cheers US dollar weakness to extend the early week rebound from 21-DMA.
US Dollar Index (DXY) fades rebound from a three-week low, tested on Tuesday, by easing near 93.70 at the latest. In doing so, the greenback gauge prints a six-day downtrend while ignoring firmer Treasury yields. That being said, the US 10-year Treasury yields step back from the highest since late May while printing 1.8 basis points (bps) of an upside to 1.652% by the press time.
While the Fed tapering chatters seem to support the firmer US Treasury yields, hopes of US stimulus and a lack of major data/events allow the US dollar to consolidate gains around multi-day tops.
Fed Governor Christopher Waller was the latest to support rate hike as saying, per Reuters, “If inflation keeps rising at its current pace in coming months rather than subsiding as expected, Federal Reserve policymakers may need to adopt ‘a more aggressive policy response’ next year.” Additionally, Reuters’ latest poll of economists cites the risk of an earlier rate hike by spotting the reflation fears.
Elsewhere, the International Monetary Fund’s (IMF) China Mission Chief and Assistant Director in the Asia and Pacific Department, Helge Berger highlights risks emanating from the world’s second-largest economy. The diplomat signaled that the Evergrande risk to China is contained for now but the nation is accumulating downside risks. On the same line were the previous day’s comments from IMF citing expectations of an 8.0% 2021 GDP growth from China while also saying, per Reuters, “the economic recovery remains unbalanced.”
Looking forward, inflation headlines, Fedspeak and China-linked fears may entertain gold traders ahead of Friday’s preliminary readings of October month PMIs.
Technical analysis
Gold’s rebound from 21-DMA, as well as a three-week-old support line, gains support from bullish MACD signals while aiming the 200-DMA hurdle surrounding $1,795.
However, the monthly high and the mid-September peak, respectively near $1,801 and $1,808, will challenge XAU/USD bulls afterward. In a case where gold prices manage to cross the $1,808 resistance, the $1,834 horizontal resistance will be in focus.
Meanwhile, pullback moves may target the stated support line and 21-DMA, near $1,771 and $1,760 in that order.
Gold bears may take control on a daily closing below $1,760. Following that, multiple supports near $1,740 and the monthly low close to $1,721 should gain the market’s attention.
Overall, gold prices are in a bullish consolidation mode but multiple resistances will challenge the buyers.
Gold: Daily chart
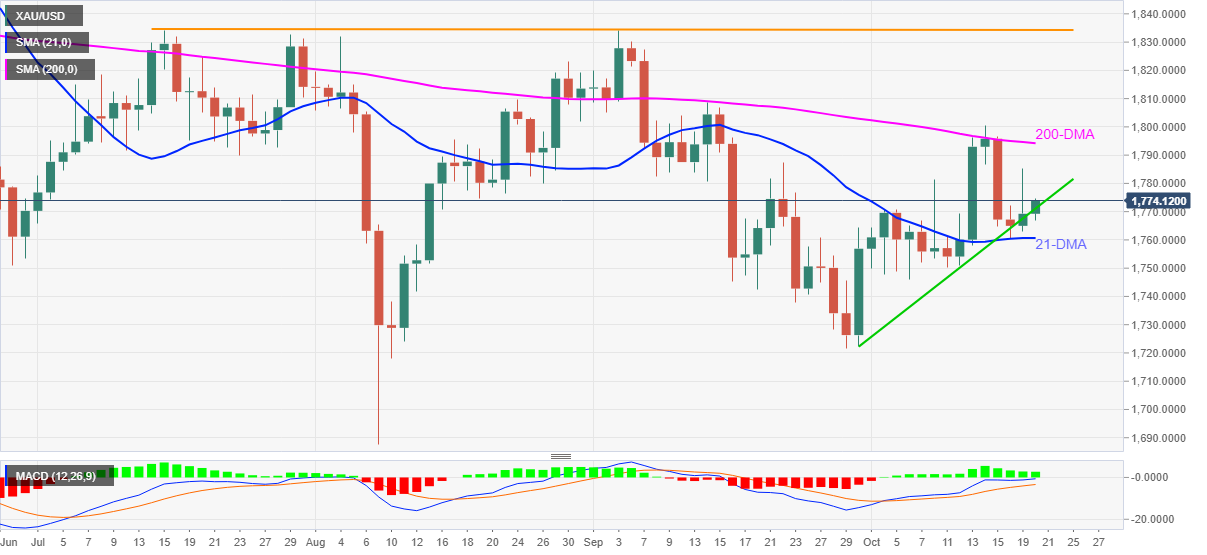
Trend: Further recovery expected
- GBP/JPY records a fresh yearly high on Wednesday in the Asian trading hours.
- The cross-currency pair surges above 158.00 in the October series.
- Japan’s trade data, hawkish BOE, and Brexit headlines sum up the price action.
GBP/JPY continues to extend its previous session’s gain on Wednesday. The pair stays in a narrow trade band after hitting a fresh yearly high near 158.30. At the time of writing, the GBP/JPY pair is trading at 158.05 up 0.20% for the day.
The British pound rose against its peers on Wednesday following a hawkish tone from the Bank of England (BOE). Investors remain invested in GBP amid a broadly supportive global sentiment backdrop and an expectation of higher UK interest rates. BOE Governor Andrew Bailey said on Sunday ‘“will have to act” to keep a lid on pricing pressures. Nevertheless, supply constraints and tight labor conditions could limit the gains for the sterling.
Furthermore, the UK’s Prime Minister Boris Johnson sounds optimistic, noting that job losses and disruptions to capital flows have been lower than feared post-Brexit, per Bloomberg.
Meanwhile, the S&P 500 Futures are trading at 4,509 with 0.03% losses.
On the other hand, the Japanese yen remained on the backfoot amid monetary policy divergence. While most of the major banks talk about reducing the stimulus in the economy, the Bank of Japan (BOJ) maintains its ultra-accommodative policy stance amid a depressing growth and inflation scenario in the country.
As for now, investors are waiting for the UK Consumer Price Index (CPI) and Producer Price Index (PPI) to take fresh trading impetus.
GBP/JPY technical levels
The UK CPIs Overview
The cost of living in the UK as represented by the Consumer Price Index (CPI) for September month is due early on Wednesday at 06:00 GMT. Given the recently positive inflation and employment data, coupled with the Bank of England’s (BOE) emphasis on CPI to dial back the bond purchase, today’s data will be watched closely by the GBP/USD bulls.
The headline CPI inflation is expected to remain unchanged at 3.2% on an annual basis while the Core CPI, which excludes volatile food and energy items, is likely to ease from 3.1% to 3.0% during September. Talking about the monthly figures, the CPI could soften to 0.4% MoM from 0.7% marked in August.
It’s worth noting that the supply crunch also highlights the Producer Price Index (PPI) for immediate GBP/USD direction. That being said, the PPI Core Output YoY may jump from 5.3% to 5.8% on a non-seasonally adjusted basis whereas the monthly prints can recede to 0.9% from 1.0% prior. Furthermore, the Retail Price Index (RPI) is also on the table for release, expected 4.7% YoY versus 4.8% prior.
In this regard, analysts at TD Securities said,
UK inflation for September is released on Wednesday, and we look for headline inflation to remain unchanged at 3.2% y/y (expectations: 3.2%, BoE: 3.0%) while core inflation slips a tick to 3.0% y/y (market forecasts: 3.0%). Supply-chain price pressures are starting to build, and October's 12% utility price boost will show up in next month's data. September's data is far from the anticipated peak, which we see coming next spring, when headline inflation could hit close to 5% y/y and core inflation at 4% y/y. BoE rate hikes are coming soon, though likely not until February.
How could it affect GBP/USD?
GBP/USD stays on the front foot near a five-week top, piercing 1.3800 heading into Wednesday’s London open. In doing so, the cable pair cheers broad US dollar weakness, as well as chatters that the Bank of England (BOE) inches closer to a rate hike. Also favoring the buyers are the UK gilt yields that shot higher suggesting the BOE’s rate lift before 2021 ends. By the press time, the CME Group's BoEWatch shows that there is a 70% chance of a BoE rate hike by the December 16 meeting.
That said, today’s inflation numbers could help the BOE hawks to reiterate their policy adjustment demands. The latest comments from the BOE Governor Andrew Bailey also hint at the higher interest rate should the price pressure mount. “Speaking to an online panel organized by the Group of 30, Bailey said that while central banks don’t have the tools to counter supply disruptions and he still believes the recent acceleration of inflation will be temporary, officials need to seek to prevent higher inflation expectations from becoming entrenched,” per Reuters.
Hence, a firmer CPI print will bolster the GBP/USD prices to overcome immediate resistances, namely the 100 and 200-DMA, respectively around 1.3810 and 1.3850 by the press time.
Key notes
GBP/USD bulls flirt with 1.3800 around monthly high, focus on UK inflation
UK September CPI Inflation Preview: Will rising price pressures boost British pound?
About the UK CPIs
The Consumer Price Index released by the Office for National Statistics is a measure of price movements by the comparison between the retail prices of a representative shopping basket of goods and services. The purchasing power of GBP is dragged down by inflation. The CPI is a key indicator to measure inflation and changes in purchasing trends. Generally, a high reading is seen as positive (or bullish) for the GBP, while a low reading is seen as negative (or Bearish).
The economy will "bounce back" quickly, with Australians having accumulated 250 billion AUD (183.2 billion USD) in savings during the COVID-19 pandemic, Australia's Treasurer Josh Frydenberg said in a press conference on Wednesday.
Additional takeaways
“Expect Australia's gross domestic product (GDP) to fall by three percent or more in the September quarter due to more than half the population being locked-down in Sydney, Melbourne and Canberra.”
“The sharp economic downturn put the cost of the strict restrictions at approximately two billion Australian dollars (1.4 billion US. dollars) per week.”
"We are seeing a light at the end of the tunnel as vaccination rates rise.”
"Vaccines are the cheapest form of economic stimulus available."
Market reaction
AUD/USD is little changed on the above comments, consolidating its Asian rebound below 0.7490.
At the press time, the currency pair is trading at 0.7481, adding 0.13% so far.
According to the analysts at JP Morgan, USD/CAD looks south towards mid-1.2000s on a sustained break below the 1.2400 threshold.
Key quotes
"In our view a sustained move below 1.24 puts bears firmly in control and sets the market up for an eventual retest of the 1.2047 Aug 2011 50% retrace, 1.206 Sep 2017 low, and 1.20 June 2021 cycle trough."
"The 50-day MA now marks tactical resistance. Jul, Aug, and Sep saw blow-off type highs fail below the 1.2782-1.2993 price lows that defined the longer-term 2019-2020 bearish reversal pattern. We continue to view that threshold as a key area on the chart."
| Raw materials | Closed | Change, % |
|---|---|---|
| Brent | 85.04 | 0.96 |
| Silver | 23.639 | 1.98 |
| Gold | 1768.758 | 0.23 |
| Palladium | 2090.92 | 4.08 |
- AUD/USD refreshes multi-day top on crossing the key resistance zone.
- Horizontal area from April lures the buyers but RSI conditions become a challenge.
- Convergence of 100-DMA, monthly support line restricts short-term downside.
AUD/USD takes the bids around 0.7485, up 0.15% intraday to poke the highest levels since July 13 during early Wednesday.
Following its failure to provide a daily closing beyond a four-month-old horizontal resistance, the Aussie currency pair again pierces the key hurdle to the north surrounding 0.7480-85.
It should be noted, however, that the RSI conditions pose a serious threat to the pair’s further advances should it fail to cross the 0.7485 mark on a day’s close.
In a case where the AUD/USD bulls manage to cross the 0.7485 resistance, an area including multiple levels marked since early April, near 0.7530 will be on their radars ahead of the 200-DMA level of 0.7566.
Alternatively, pullback moves remain less worrisome until staying beyond the 0.7400 threshold comprising 100-DMA and a three-week-long rising support line.
Overall, AUD/USD remains in the uptrend but the bulls seemed to have tired of late.
AUD/USD: Daily chart
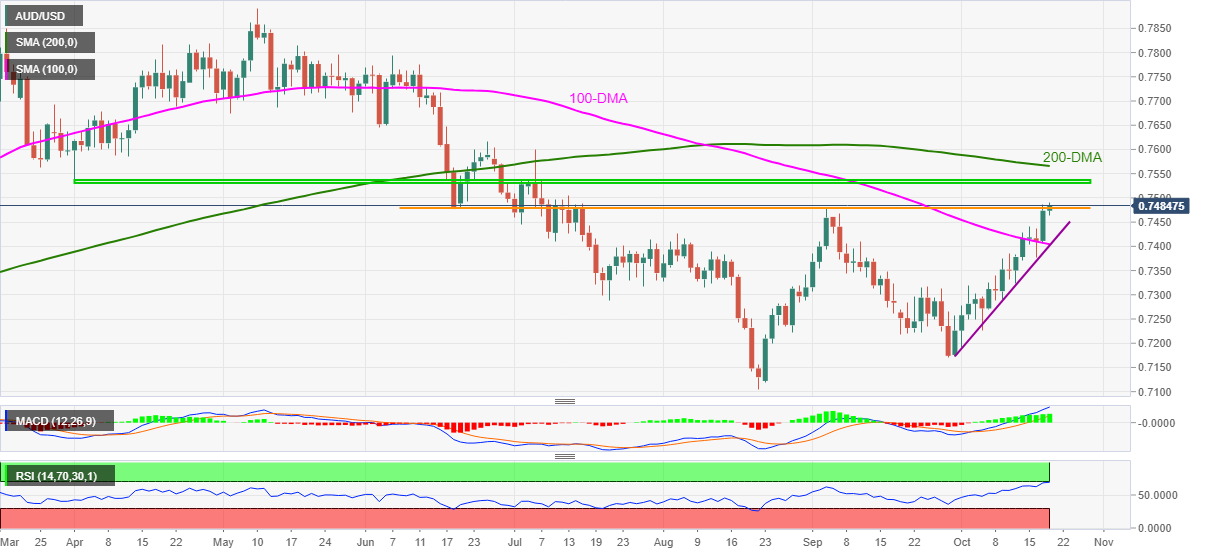
Trend: Further upside expected
- USD/CNH struggles for clear direction near four-month low, fades bounce off multi-day bottom of late.
- PBOC kept five-year and one-year rates unchanged as widely expected.
- IMF’s Berger cites accumulating downside risk for China even as Evergrande fears contained for now.
USD/CNH consolidates the biggest daily losses in 11 months around $6.3850 during early Wednesday. In doing so, the offshore Chinese currency (CNH) pair portrays a rebound from the lowest levels since June even as the US Dollar Index (DXY) prints a six-day downtrend near the late September lows.
The USD/CNH pair’s corrective pullback could also be linked to the People’s Bank of China’s (PBOC) inaction, matching market forecasts. The Chinese central bank held the one-year loan prime rate (LPR) at 3.85% for the 18th month in a row at its October fixing. Further, the five-year LPR was also left unchanged at 4.65% in October.
On a different page, the International Monetary Fund’s (IMF) China Mission Chief and Assistant Director in the Asia and Pacific Department, Helge Berger highlights risks emanating from the world’s second-largest economy. The diplomat signaled that the Evergrande risk to China is contained for now but the nation is accumulating downside risks.
It should be noted that the escalation in the Aussie-China tussles and the Fed tapering concerns battle the hopes of overcoming China’s coal shortage to portray mixed sentiment.
On a different page, Fed Governor Christopher Waller was the latest to support rate hike as saying, per Reuters, “If inflation keeps rising at its current pace in coming months rather than subsiding as expected, Federal Reserve policymakers may need to adopt ‘a more aggressive policy response’ next year.” Additionally, Reuters’ latest poll of economists cites the risk of an earlier rate hike by spotting the reflation fears.
To portray the mood, the US 10-year Treasury yields rise 3.8 basis points (bps) to 1.672%, a fresh high since late May, while the US Dollar Index (DXY) fades rebound from a three-week low, tested on Tuesday, by easing near 93.70 at the latest.
Given the light calendar and mixed concerns over China’s economic growth, USD/CNH traders may have to pay close attention to the risk catalysts for fresh impulse. It should be observed that the International Monetary Fund (IMF) expects the Chinese economy to grow by 8% in 2021 but added that the economic recovery remains unbalanced, per Reuters.
Technical analysis
Unless providing a daily closing beyond February’s low surrounding $6.4000, USD/CNH remains vulnerable to test the yearly bottom of $6.3524.
- USD/INR bulls stay in charge and eye an upside continuation.
- USD/INR holds above the required support area on the daily chart for an upside continuation.
As per the prior analysis in the previous Asian session, USD/INR Price Analysis: Bulls advance and eye fresh daily highs, the price is behaving accordingly to the bullish outlook. The following is an analysis of the same daily chart that illustrates the prospects of an upside continuation.
USD/INR daily chart
-637702914946280370.png)
The price corrected to the prior resistance and has started to correlate. The bulls are accumulating at this juncture so there are prospects of an upside continuation.
Once again, the Sino-Australian trade tussle has emerged this Wednesday, as China suspends its imports from a ninth Australian meatworks, per ABC News.
ACC becomes the ninth Australian meatworks to be suspended from trading with China since May last year.
Key quotes
“Brisbane-based Australian Country Choice (ACC) was alerted by Australian authorities this morning that its trade to China has been suspended from October 18.”
“ACC said that Chinese authorities had detected a chemical often used to treat bacterial infections in dogs in meat that had been processed at its Cannon Hill abattoir.”
“ACC said chloramphenicol was a drug used to treat bacterial infections in dogs and sometimes horses, but was not prescribed for use in cattle in Australia.”
Market reaction
AUD/USD, as well as USD/CNY, are unperturbed by these headlines, as the risk tone remains on the positive side in Asia.
AUD/USD is closing on in the 0.7500 level while USD/CNY tumbles to fresh four-month lows.
- US 10-year Treasury yields stay firmer at the highest since mid-May during four-day uptrend.
- S&P 500 Futures snap five-day run-up, refreshes intraday low of late.
- Fed tapering concerns join China-linked fears to probe sentiment amid quiet Asian session.
After an upbeat start to the week, market sentiment dwindles during early Wednesday amid mixed clues from the US and China. While portraying the mood, the US 10-year Treasury yields rise 3.8 basis points (bps) to 1.672%, a fresh high since late May, whereas S&P 500 Future drop two points, or 0.04% intraday, to 4,509 by the press time.
It’s worth noting that the gap between the 3-year and the 10-year Treasury yields also widens the most since June, suggesting the market’s optimism towards the Fed rate hike.
Fed tapering woes propel the US Treasury yields, weighing on the equities, during the recent days. Fed Governor Christopher Waller was the latest to support rate hike as saying, per Reuters, “If inflation keeps rising at its current pace in coming months rather than subsiding as expected, Federal Reserve policymakers may need to adopt ‘a more aggressive policy response’ next year.” Additionally, Reuters’ latest poll of economists cites the risk of an earlier rate hike by spotting the reflation fears.
Elsewhere, comments from Helge Berger, the IMF's China Mission Chief and Assistant Director in the IMF's Asia and Pacific Department, highlights risks emanating from the world’s second-largest economy. The diplomat signaled that the Evergrande risk to China is contained for now but the nation is accumulating downside risks. That being said, the People’s Bank of China (PBOC) keeps benchmark interest rates unchanged for the eighteenth time in a row during the latest Interest Rate Decision.
On Tuesday, global market sentiment improved after the downbeat US housing number questioned the Fed’s tapering plans. US Housing Starts registered a sharp fall in September, -1.6% MoM versus +1.2% prior, whereas the Building Permits registered the largest contraction since February, down 7.7% compared to 5.6% previous readouts.
To portray the previous risk-on mood, the Wall Street benchmarks flirt with the record tops whereas the US Dollar Index (DXY) dropped to a three-week low, down 0.07% intraday around 93.70 by the press time.
Looking forward, inflation concerns and China headlines may help the markets to find short-term direction ahead of Friday’s preliminary readings of September PMIs.
Read: US Stocks Forecast: Wall Street's earnings cheerd by investors
Commenting on the unfolding risks from indebted China’s property sector, Hedge Berger, International Monetary Fund’s China mission Chief and Assistant Director in the Asia and Pacific Department, said that “Evergrande risk to China is contained for now.”
Additional quotes
China is accumulating downside risks.
China's government has the tools to contain risks.
Deleveraging in China is a positive but they need to take care.
We need to find ways to ease the pressure in the power sector.
Current drivers of the higher PPI are global commodities.
CPI is not so big a problem as consumption is still weak.
We should consider easing in 2022 if growth slows.
Related reads
- PBOC keeps one-year loan prime rate steady at 3.85%
-
US 10-year Treasury yields renew five-month top, S&P 500 Futures defend 4,500
- AUD/NZD bulls are in accumilaiton at this juncture.
- Bulls look to the M-formation's neckline and await breakout signals.
As per the prior analysis, AUD/NZD Price Analysis: Traders, don't get caught out! the price is indeed showing all the signs that the downside is tiring. The following analysis illustrates the prospects of a retracement to the neckline of the daily M-formation. Additionally, we can start to see price action that resembles the Wycoff method in the accumulation phase.
AUD/NZD daily chart
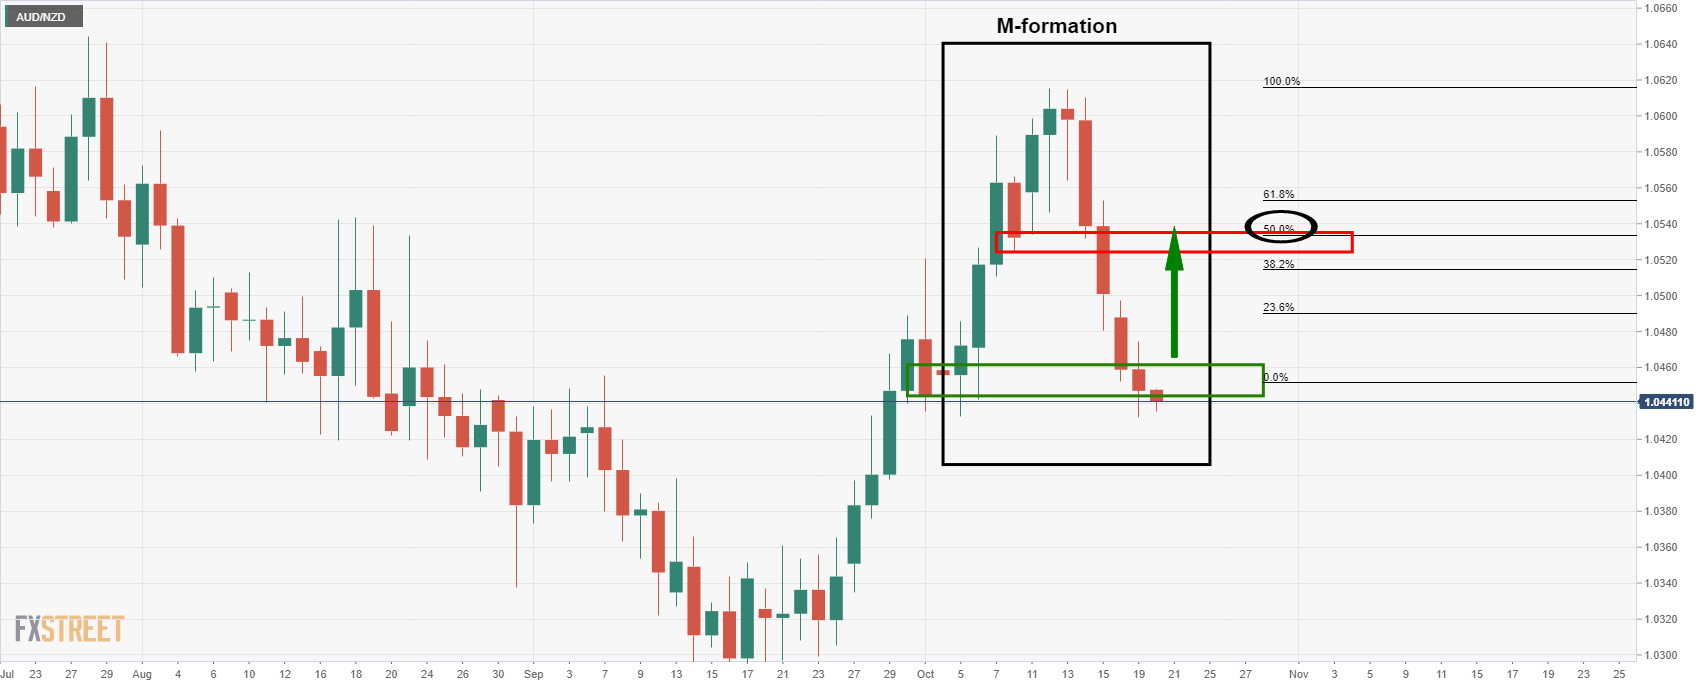
The M-formation is a bullish reversion pattern that would be expected to draw in the price for a test of the formation's neckline. In this case, that level is the 8 Oct low at 1.0524.
AUD/NZD hourly chart
While in the prior session's analysis, from an hourly perspective, the price went against the core projection. The expectations were for a move higher from the lower low. However, the door was left open for a test of the support zone between 1.0420/30 which has played out as follows:
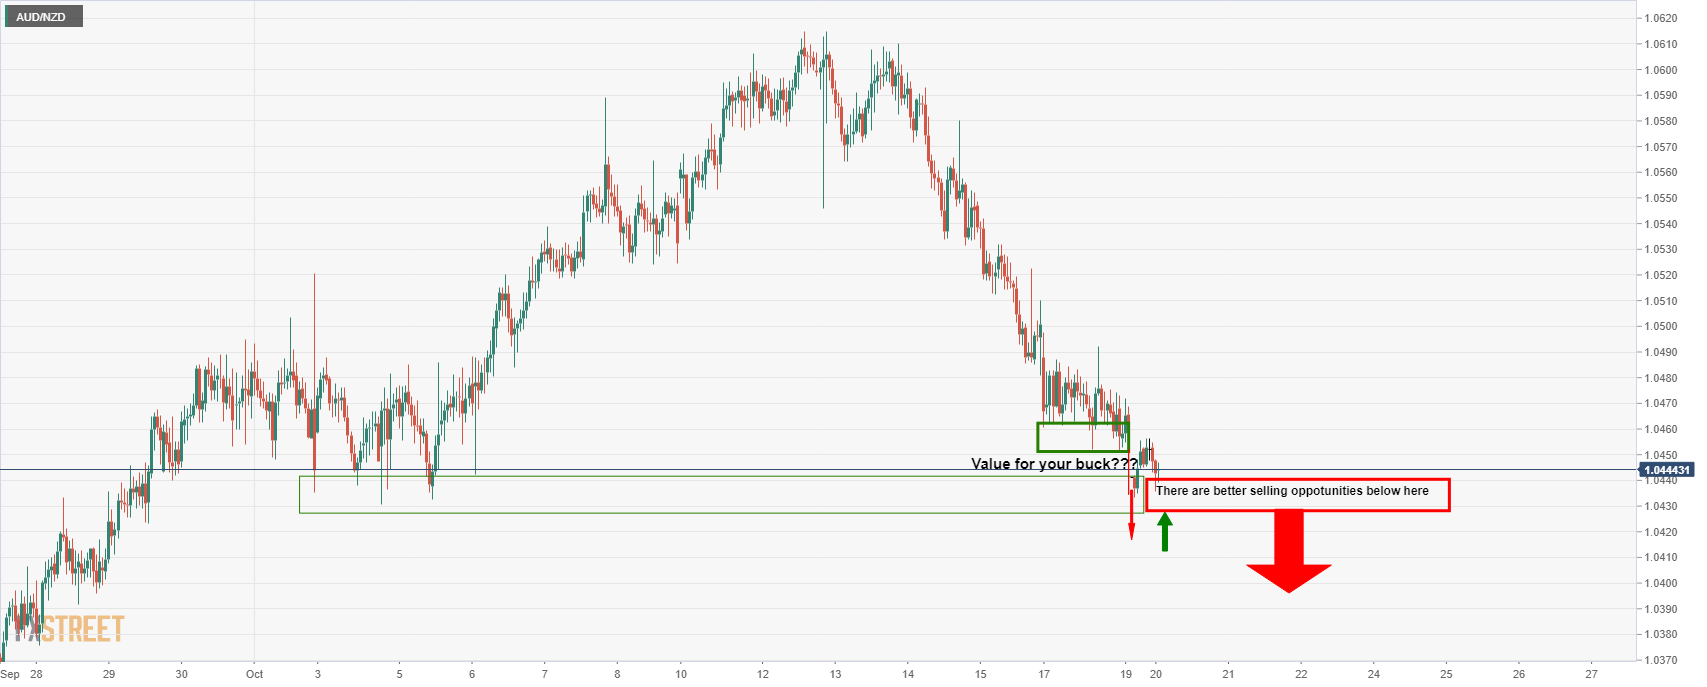
This brings us to the Wycoff Method:
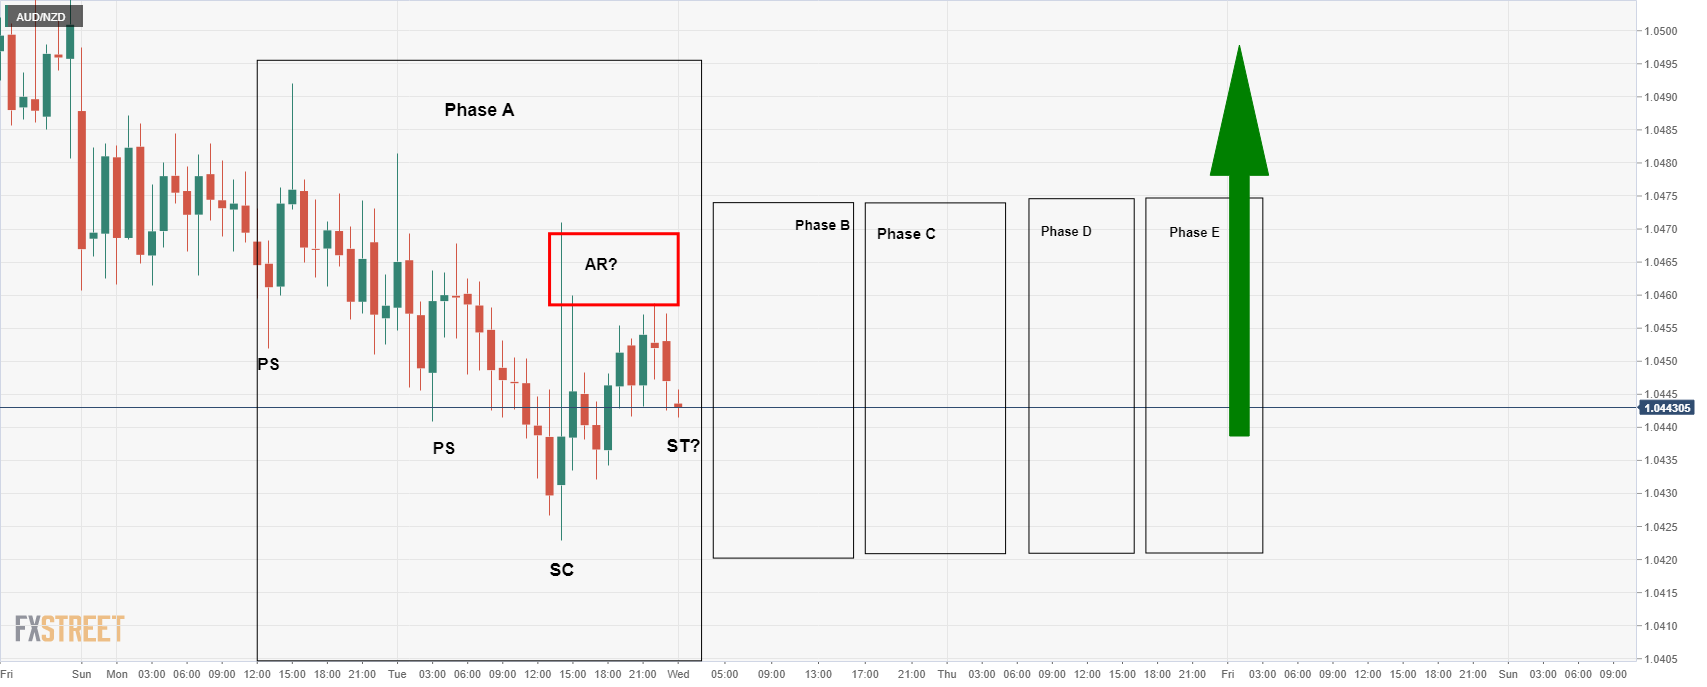
The Wycoff accumulation methodology is a long-winded process but we have already seen Phase A potentially play out...
The People’s Bank of China (PBOC) is out with the latest statement, announcing that it has maintained the one-year loan prime rate (LPR) at 3.85% for the 18th month in a row at its October fixing.
Meanwhile, the five-year LPR was also left unchanged at 4.65% in October. The Chinese central bank’s decision met market expectations.
According to the latest Reuters poll, China was seen keeping the one-year LPR unchanged at the October decision.
The AUD/USD pair ticked higher on the PBOC rate decision, looking to take out the 0.75 barrier. The spot is up 0.21% on the day.
Meanwhile, USD/CNY slumps 0.72% on a daily basis, currently trading at 6.3822, fresh four-month lows.
About PBOC Rate decision
The PBOC Interest Rate Decision is announced by the People´s Bank of China. If the PBoC is hawkish about the inflationary outlook of the economy and rises the interest rates it is positive, or bullish, for the CNY. Likewise, if the PBoC has a dovish view on the Chinese economy and keeps the ongoing interest rate, or cuts the interest rate it is negative, or bearish.
- EUR/JPY renews the highest levels since mid-June, eases from multi-day top of late.
- Horizontal line from late May challenges short-term buyers amid overbought RSI conditions.
- Pullback moves may fade around mid 132.00s, comprising 5-DMA.
EUR/JPY prints 0.15% intraday gains despite recently easing from the highest levels since June 16 to 133.25 during early Wednesday.
The cross-currency pair pierced a broad horizontal area from early May during the last week to flag the quote’s further advances toward the fresh multi-day top.
However, overbought RSI conditions and a horizontal line comprising multiple levels marked since May 28 could challenge the EUR/JPY bulls around 133.70.
Should the pair prices remain firm past 133.70, the yearly peak of 134.12, also the highest since February 2018, will be in the spotlight.
On the contrary, pullback moves need to slip beneath the 132.65-50 support area comprising 5-DMA to recall the sellers.
Following that, the mid-July tops near 131.00 and the last month’s peak around 130.70 will be on the EUR/JPY bears’ radars.
EUR/JPY: Daily chart
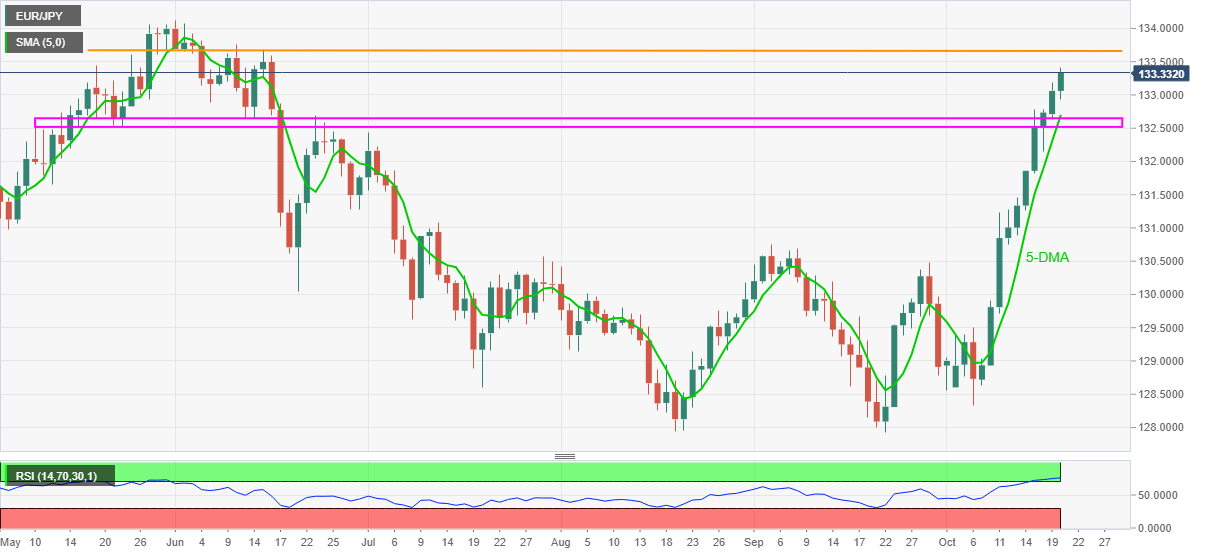
Trend: Limited upside expected
In recent trade today, the People’s Bank of China (PBOC) set the yuan (CNY) at 6.4069 vs the estimated 6.4090 and the previous 6.4307.
About the fix
China maintains strict control of the yuan’s rate on the mainland.
The onshore yuan (CNY) differs from the offshore one (CNH) in trading restrictions, this last one is not as tightly controlled.
Each morning, the People’s Bank of China (PBOC) sets a so-called daily midpoint fix, based on the yuan’s previous day closing level and quotations taken from the inter-bank dealer.
- AUD/USD consolidates recent gains near three-month high, refreshes intraday low of late.
- Aussie Westpac Leading Index recovers in September but risk-on mood fades and challenge the bulls.
- US Treasury yields refresh five-month high, S&P 500 Futures stay directionless.
- PBOC interest rate decision, risk catalysts are the key amid a light calendar day.
AUD/USD drops to 0.7464, a fresh intraday low, consolidating the previous day’s gains during Wednesday’s Asian session. In doing so, the Aussie pair steps back after rising to the fresh high since May 20.
The pullback moves could be linked to the sluggish sentiment in the market, as well as the firmer US Treasury yields, thanks to the Fed tapering concerns and mixed headlines over the coronavirus conditions from Australia. As a result, the Australian data gets fewer accolades amid a quiet session.
Fed Governor Christopher Waller reiterated his support for the rate hike while saying, per Reuters, “If inflation keeps rising at its current pace in coming months rather than subsiding as expected, Federal Reserve policymakers may need to adopt ‘a more aggressive policy response’ next year.” On the same line, Reuters’ latest poll of economists cites the risk of an earlier rate hike by spotting the reflation fears.
Talking about the data, Australia Westpac Leading Index for September improved from -0.27% MoM to -0.02%. it’s worth noting that Aussie COVID-19 infections rose from 2,047 to 2,125 per the ABC News data.
Amid these plays, the US 10-year Treasury yields rise 3.8 basis points (bps) to 1.672%, a fresh high since late May, while the US Dollar Index (DXY) keeps rebound from a three-week low, tested on Tuesday, near 93.80.
With the People’s Bank of China (PBOC) Interest Rate Decision looming, AUD/USD traders will wait for clues on how the Chinese central bank defends the local monetary system from the financial risks emanating from Evergrande and the likes. As per the latest survey from Reuters, “China is expected to keep its benchmark lending rate steady for the 18th straight month at its October fixing on Wednesday, despite growing pressure on the economy.”
Also highlighting the downside risk of the AUD/USD prices are the latest comments from Helge Berger, the IMF's China Mission Chief and Assistant Director in the IMF's Asia and Pacific Department. The diplomat cited that the Evergrande risk to China is contained for now but the nation is accumulating downside risks.
Technical analysis
AUD/USD pair’s failure to provide a daily closing beyond the four-month-old horizontal resistance line surrounding 0.7480 joins overbought RSI conditions to hint at a pullback towards the confluence of 100-DMA and an ascending support line from September 30 near 0.7405.
- EUR/USD starts the Wednesday's session on a muted note.
- US Dollar Index pares its initial losses to trade near 94.00 amid firmer US yields.
- Dovish ECB, Fed tapering, and US economic revival package back the euro underperformance.
The EUR/USD pair remains subdued in the Asian session on Wednesday. The pair stays in a narrow trade band of less than 10-pips movement. At the time of writing, EUR/USD is trading at 1.1632, down 0.02% for the day.
The greenback rises near 94.00, tracking higher US 10-year benchmark Treasury yields. Fed’s tapering expectations amid higher inflationary pressure despite weaker data kept US T-yields rolling at 1.66%, best since May. Higher corporate earnings also lifted the sentiment.
Investors are bracing up for the Fed’s tapering as soon as November whereas the European Central Bank's (ECB) dovish stance weighs on the shared currency. In addition to that, US President and the Democratic remained on track to agree upon a deal on the scope of their cornerstone economic revival package and hope to finalise a compromise in the week later.
The European Central Bank (ECB) President Christine Lagarde said that the central bank will continue to aid the eurozone economy as the fallout from the pandemic lingers, adding to her previous comments on the inflation as “ largely transitory”. In addition to that, ECB Governing Council member and Bank of France Governor Francois Villeroy remained pessimistic over the interest rate hikes by the end of 2022 as the eurozone inflation is expected to fall back below the ECB’s 2% target.
As for now, traders are waiting for the German Inflation Rate, Eurozone Consumer Price Index (CPI), ECB Elderson’s speech, and US Fed’s Quarles speech to take fresh trading impetus.
- USD/JPY is moving in on critical resistance and would be expected to falter if 115 holds.
- Bears will be looking for a significant correction in the coming days.
USD/JPY has rallied with the yen unable to benefit from risk aversion of late because higher oil prices and higher bond yields are encouraging yen shorts to stick to the game plan. Yen shorts from the CFTC data (dated last Tuesday) and they have grown further. Additionally, the yen short in options is currently the biggest ever.
This leaves the yen short position vulnerable to a squeeze and the following charts illustrate the technical bearish bias from a longer-term chart resistance point of view:
Weekly chart
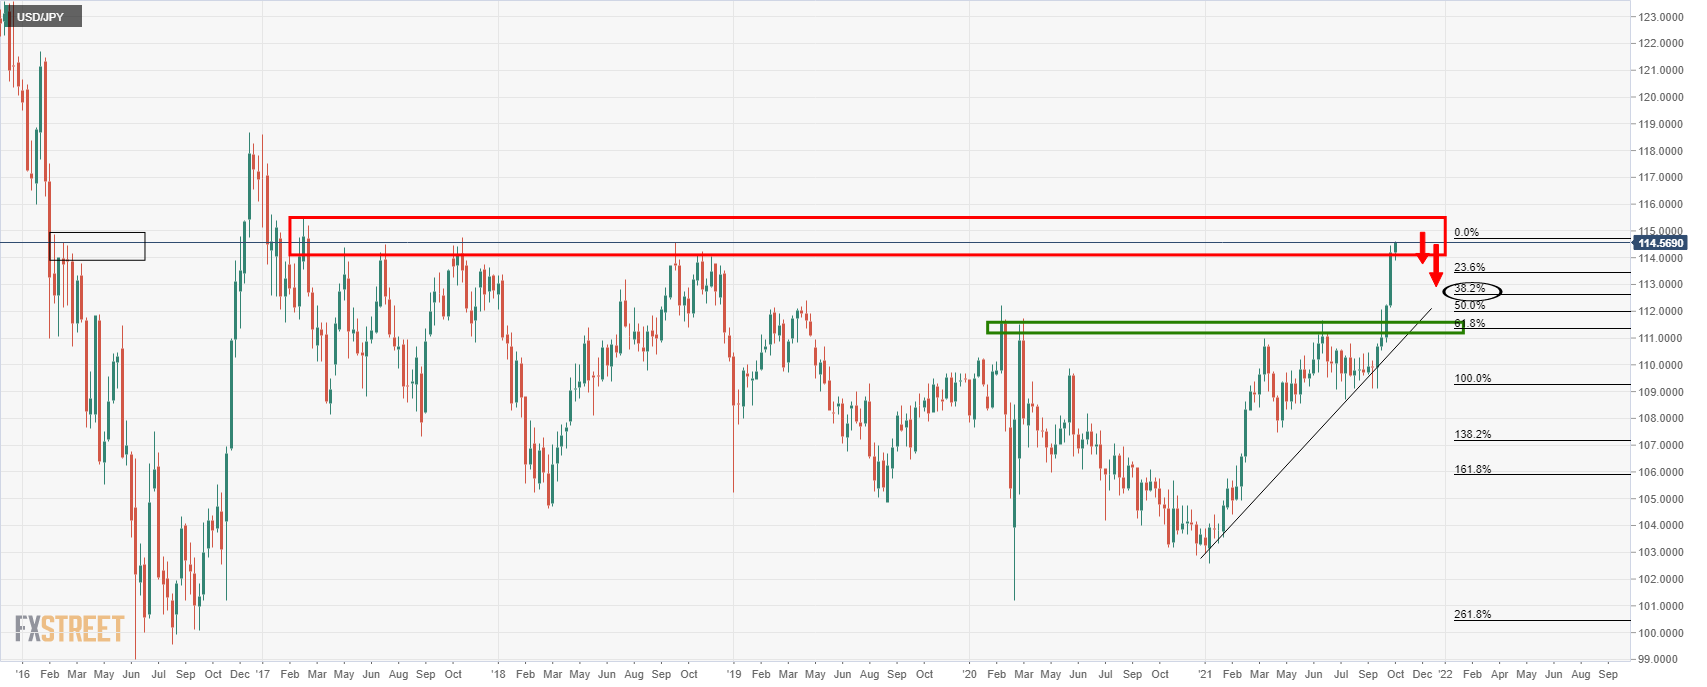
The price has broken into fresh territory mid-week, the highest in four years. However, it is moving in on a resistance zone as illustrated above which likely means we will see a correction in due course.
Monthly chart
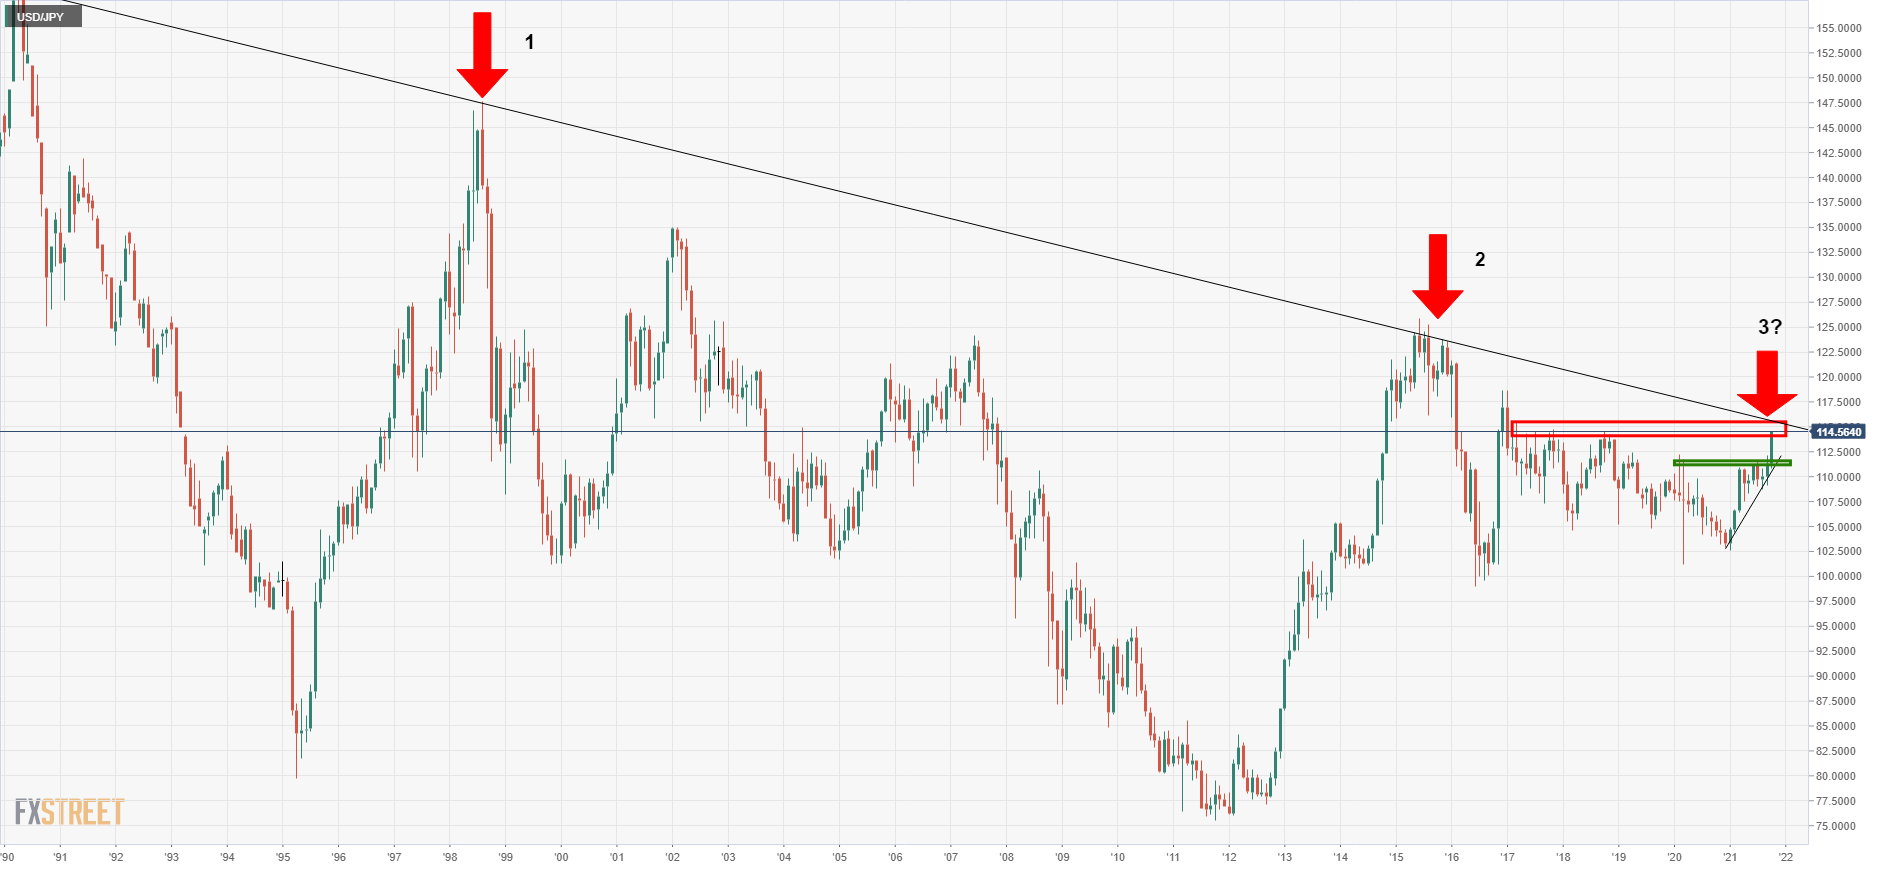
USD/JPY will be expected to struggle as it approaches the post-1990 downtrend which provides huge resistance. If the price can't punch through 115, it will be expected to falter.
- DXY keeps the bounce off 200-EMA inside weekly falling trend channel.
- 50-EMA, channel’s resistance line and previous support from early September challenge bulls.
US Dollar Index (DXY) holds onto recovery moves from the key moving average around 93.83, up 0.06% intraday, during Wednesday’s Asian session.
Although the RSI line backs the rebound, a convergence of 50-EMA, upper line of the short-term descending trend channel and support-turned-resistance from September 03, around the 94.00 threshold, will be a tough nut to crack for the DXY bulls.
In a case where the US Dollar Index crosses the 94.00 hurdle, the monthly ascending trend line near 94.60, will be in focus.
Meanwhile, pullback moves may aim for a 200-EMA level of 93.58 before targeting the support line of the stated channel, close to 93.40 by the press time.
Should the DXY bears defy the channel formation with a downside break of 93.40, the late September lows near the 93.00 mark may return to the charts.
Overall, US Dollar Index (DXY) remains bullish but the 94.00 level will be a tough nut to crack for the optimists.
DXY: Four-hour chart
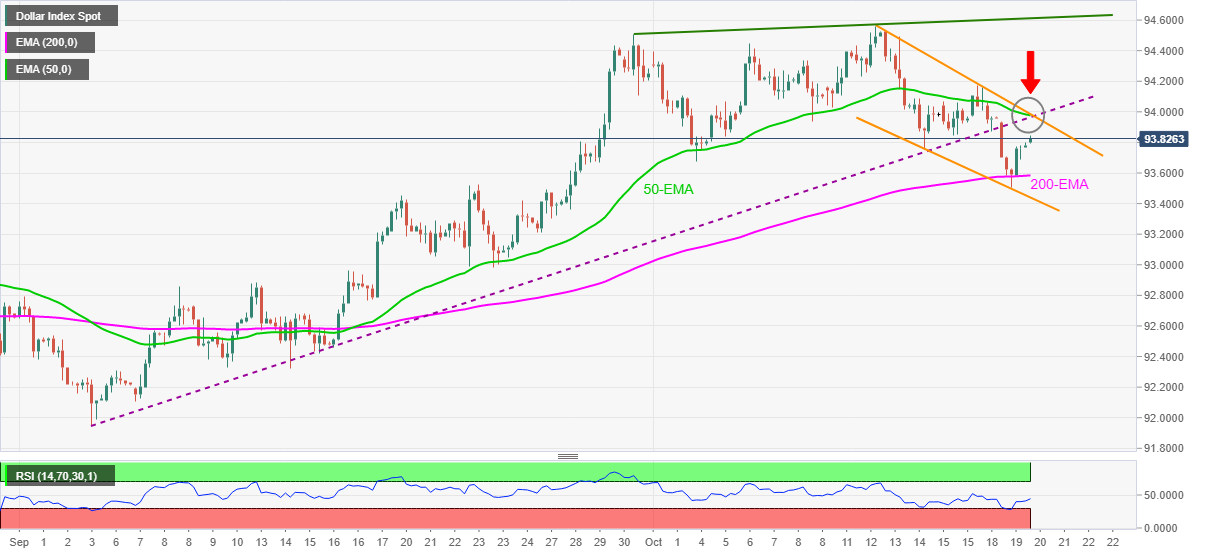
Trend: Further upside expected
| Time | Country | Event | Period | Previous value | Forecast |
|---|---|---|---|---|---|
| 06:00 (GMT) | Germany | Producer Price Index (YoY) | September | 12% | 12.7% |
| 06:00 (GMT) | Germany | Producer Price Index (MoM) | September | 1.5% | 1% |
| 06:00 (GMT) | United Kingdom | Producer Price Index - Output (MoM) | September | 0.7% | 0.5% |
| 06:00 (GMT) | United Kingdom | Producer Price Index - Input (MoM) | September | 0.4% | 1% |
| 06:00 (GMT) | United Kingdom | Producer Price Index - Input (YoY) | September | 11% | 11.6% |
| 06:00 (GMT) | United Kingdom | Producer Price Index - Output (YoY) | September | 5.9% | 6.8% |
| 06:00 (GMT) | United Kingdom | Retail Price Index, m/m | September | 0.6% | 0.2% |
| 06:00 (GMT) | United Kingdom | HICP ex EFAT, Y/Y | September | 3.1% | |
| 06:00 (GMT) | United Kingdom | Retail prices, Y/Y | September | 4.8% | 4.7% |
| 06:00 (GMT) | United Kingdom | HICP, m/m | September | 0.7% | 0.4% |
| 06:00 (GMT) | United Kingdom | HICP, Y/Y | September | 3.2% | 3.2% |
| 08:00 (GMT) | Eurozone | Current account, unadjusted, bln | August | 30.2 | |
| 09:00 (GMT) | Eurozone | Harmonized CPI ex EFAT, Y/Y | September | 1.6% | 1.9% |
| 09:00 (GMT) | Eurozone | Harmonized CPI | September | 0.4% | 0.5% |
| 09:00 (GMT) | Eurozone | Harmonized CPI, Y/Y | September | 3% | 3.4% |
| 12:30 (GMT) | Canada | Bank of Canada Consumer Price Index Core, y/y | September | 3.5% | |
| 12:30 (GMT) | Canada | Consumer Price Index m / m | September | 0.2% | 0.1% |
| 12:30 (GMT) | Canada | Consumer price index, y/y | September | 4.1% | 4.3% |
| 14:30 (GMT) | U.S. | Crude Oil Inventories | October | 6.088 | 2.233 |
| 18:00 (GMT) | U.S. | Fed's Beige Book |
| Pare | Closed | Change, % |
|---|---|---|
| AUDUSD | 0.74702 | 0.81 |
| EURJPY | 132.966 | 0.21 |
| EURUSD | 1.16305 | 0.19 |
| GBPJPY | 157.702 | 0.51 |
| GBPUSD | 1.37905 | 0.47 |
| NZDUSD | 0.71471 | 0.95 |
| USDCAD | 1.23584 | -0.09 |
| USDCHF | 0.92263 | -0.12 |
| USDJPY | 114.345 | 0.04 |
“The Federal Reserve will wait until 2023 before raising interest rates,” per the October 12-18 Reuters poll economists. The survey results also mention “persistently higher inflation over the coming year” as a greater risk for the US economy.
Key quotes
Forty of 67 economists said the fed funds rate would rise from its current level of 0-0.25% in 2023 or later, with most clustering around the first quarter of that year. The remaining 27 economists expect a rate hike by the end of next year.
Twenty-nine of the 37 economists who responded said the risk for the timing of the Fed's first interest rate hike was that it could come earlier than they expected.
Twenty-two of the 40 economists who responded to an additional question said the greater worry for the U.S. economy over the coming year was persistently higher inflation, and 30% of them said it was a bigger-than-expected slowdown in growth.
On average, the economy was expected to grow 4.0% next year, 2.5% in 2023 and 2.2% in 2024. That compared with previous forecasts of 4.2% for 2022 and 2.3% for 2023. The September poll did not ask for forecasts for 2024.
Read: EUR/USD Price Analysis: An inverse head-and-shoulder targets 1.1750 before resuming the down trend
- AUD/JPY extends the previous session’s upside on Wednesday.
- RBA minutes, easing coronavirus restrictions and higher commodity prices keep aussie in demand.
- The Japanese yen remains on the backfoot against majors on dovish BOJ.
AUD/JPY continues to gain on Wednesday in the early Asian session. The cross-currency pair is rising since the beginning of the October series. As of writing, the AUD/JPY is trading at 85.59, up 0.15% for the day.
Investors digested the Reserve Bank of Australia’s (RBA) latest monetary policy meeting minutes. RBA retreated its stance of no interest rate hikes before 2024 but the central bank affirmed that the economy is expected to return to the recovery path in December, and could reach pre-pandemic growth levels in mid-22.
In addition to that, the higher commodity prices also supported the upside rally in the Australian dollar. Furthermore, New South Wales, Australia’s most populated state removed mask mandates and has allowed larger groups indoors and outdoors, as the full vaccination rate reached 80%. The market ignores the Westpac Leading Index, which dropped 0.02 in September on yearly basis.
On the other hand, the Japanese yen lost its momentum amid an improved risk appetite among investors. It is worth noting that S&P 500 Futures is trading at 4,514, up 0.08% for the day. A Bank of Japan (BOJ) survey showed that Japanese households’ expectations for the year-ahead rose in the three months to September, and the economic outlook also worsened.
Meantime, Japan recorded a trade deficit of 622.80 Ұ billion in September.
As for now, the market dynamics continue to influence the pair's performance in the short term.
AUD/JPY additional levels
- WTI remains firmer around seven-year top refreshed on Monday, picking up bids of late.
- API inventories couldn’t derail upside momentum amid risk-on mood, softer USD.
- China woes, EIA stockpiles data will be eyed for fresh impulse.
WTI holds onto the recent gains near $82.40, up 0.05% intraday, during a quiet Asian session on Wednesday. The oil benchmark cheered the US dollar weakness and upbeat sentiment to ward off the bearish inventory levels published by industry sources the previous day. The latest moves, however, await the official stockpile data for further direction.
Global market sentiment improved on Tuesday after the downbeat US housing number questioned the Fed’s tapering plans. Also positive for the risk appetite were receding fears of the coronavirus in the Asia-Pacific region.
However, downside risks to the Asian economic growth, as cited by the International Monetary Fund (IMF), challenged the bulls. On the same line were comments from Fed Governor Christopher Waller. “If inflation keeps rising at its current pace in coming months rather than subsiding as expected, Federal Reserve policymakers may need to adopt ‘a more aggressive policy response’ next year,” said the Fed policymaker per Reuters.
Amid these plays, the US Dollar Index (DXY) dropped to a three-week low before consolidating losses around 93.77 at the latest while the Wall Street benchmarks to poke record tops. Further, the US 10-year Treasury yields gained 5.7 basis points (bps) to rise to the highest levels since late May by the end of Tuesday’s North American session.
Elsewhere, the American Petroleum Institute (API) Weekly Crude Oil Stock rose past 2.233M forecast to 3.294M for the period ended on October 15. It’s worth noting that the previous readout was 5.213M.
Above all, fears of oil stock outage and improvements in demand, due to the global transition from the pandemic-led activity restrictions, may help the black gold to refresh multi-month tops.
Moving on, the official weekly oil inventory data from the Energy Information Administration (EIA), expected 2.233M versus 6.088M prior, will direct short-term oil prices. Also important are the risk catalysts including China's growth fears, Fed tapering concerns and geopolitical woes.
Technical analysis
Although late 2012 lows near $84.10 challenge the WTI bulls, the commodity sellers are less likely to take the risk until the quote stays above July’s high of $76.40.


© 2000-2026. Sva prava zaštićena.
Sajt je vlasništvo kompanije Teletrade D.J. LLC 2351 LLC 2022 (Euro House, Richmond Hill Road, Kingstown, VC0100, St. Vincent and the Grenadines).
Svi podaci koji se nalaze na sajtu ne predstavljaju osnovu za donošenje investicionih odluka, već su informativnog karaktera.
The company does not serve or provide services to customers who are residents of the US, Canada, Iran, The Democratic People's Republic of Korea, Yemen and FATF blacklisted countries.
Izvršenje trgovinskih operacija sa finansijskim instrumentima upotrebom marginalne trgovine pruža velike mogućnosti i omogućava investitorima ostvarivanje visokih prihoda. Međutim, takav vid trgovine povezan je sa potencijalno visokim nivoom rizika od gubitka sredstava. Проведение торговых операций на финанcовых рынках c маржинальными финанcовыми инcтрументами открывает широкие возможноcти, и позволяет инвеcторам, готовым пойти на риcк, получать выcокую прибыль, но при этом неcет в cебе потенциально выcокий уровень риcка получения убытков. Iz tog razloga je pre započinjanja trgovine potrebno odlučiti o izboru odgovarajuće investicione strategije, uzimajući u obzir raspoložive resurse.
Upotreba informacija: U slučaju potpunog ili delimičnog preuzimanja i daljeg korišćenja materijala koji se nalazi na sajtu, potrebno je navesti link odgovarajuće stranice na sajtu kompanije TeleTrade-a kao izvora informacija. Upotreba materijala na internetu mora biti praćena hiper linkom do web stranice teletrade.org. Automatski uvoz materijala i informacija sa stranice je zabranjen.
Ako imate bilo kakvih pitanja, obratite nam se pr@teletrade.global.
транcфери